
Abstract
This article provides a literature review of finite element simulation studies for metallic powder bed additive manufacturing processes. The various approaches in the numerical modeling of the processes and the selection of materials properties are presented in detail. Simulation results are categorized according to three major findings’ groups (i.e. temperature field, residual stresses and melt pool characteristics). Moreover, the means used for the experimental validation of the simulation findings are described. Looking deeper into the studies reviewed, a number of future directions are identified in the context of transforming simulation into a powerful tool for the industrial application of additive manufacturing. Smart modeling approaches should be developed, materials and their properties should be further characterized and standardized, commercial packages specialized in additive manufacturing simulation have to be developed and simulation needs to become part of the modern digital production chains. Finally, the reviewed studies are organized in a table and characterized according to the process and material studied, the modeling methodology and the experimental validation method used in each of them. The key findings of the reviewed studies are also summarized.
Introduction
The term additive manufacturing (AM) broadly describes manufacturing of parts by adding material in layers. Key advantages of AM, as opposed to the conventional subtractive technologies for metals processing, have led to an increasing attention by several core manufacturing industries, such as aerospace, automotive, medical and consumer goods. 1 A large number of different AM processes for fabricating metallic parts, utilizing different combinations of stock material form, material delivery and heat source have been developed over the years. In the powder-based processes, metallic powder is spread on the bed before scanned by the beam or being fed directly to the heat source affected region. 2 The powder bed processes can be further classified based on whether the stock material gets fully melted, partially melted or a polymer binder is used for consolidation.2–4 Over the previous decades, a significant number of different processes, covering all of the aforementioned categories, have been developed. A classification schematic listing all those processes is provided in Figure 1, where the types of processes discussed in this article are highlighted with orange color. Despite the numerous powder bed processes, the most commercialized among them are the selective laser melting (SLM), electron beam melting (EBM) and selective laser sintering (SLS).
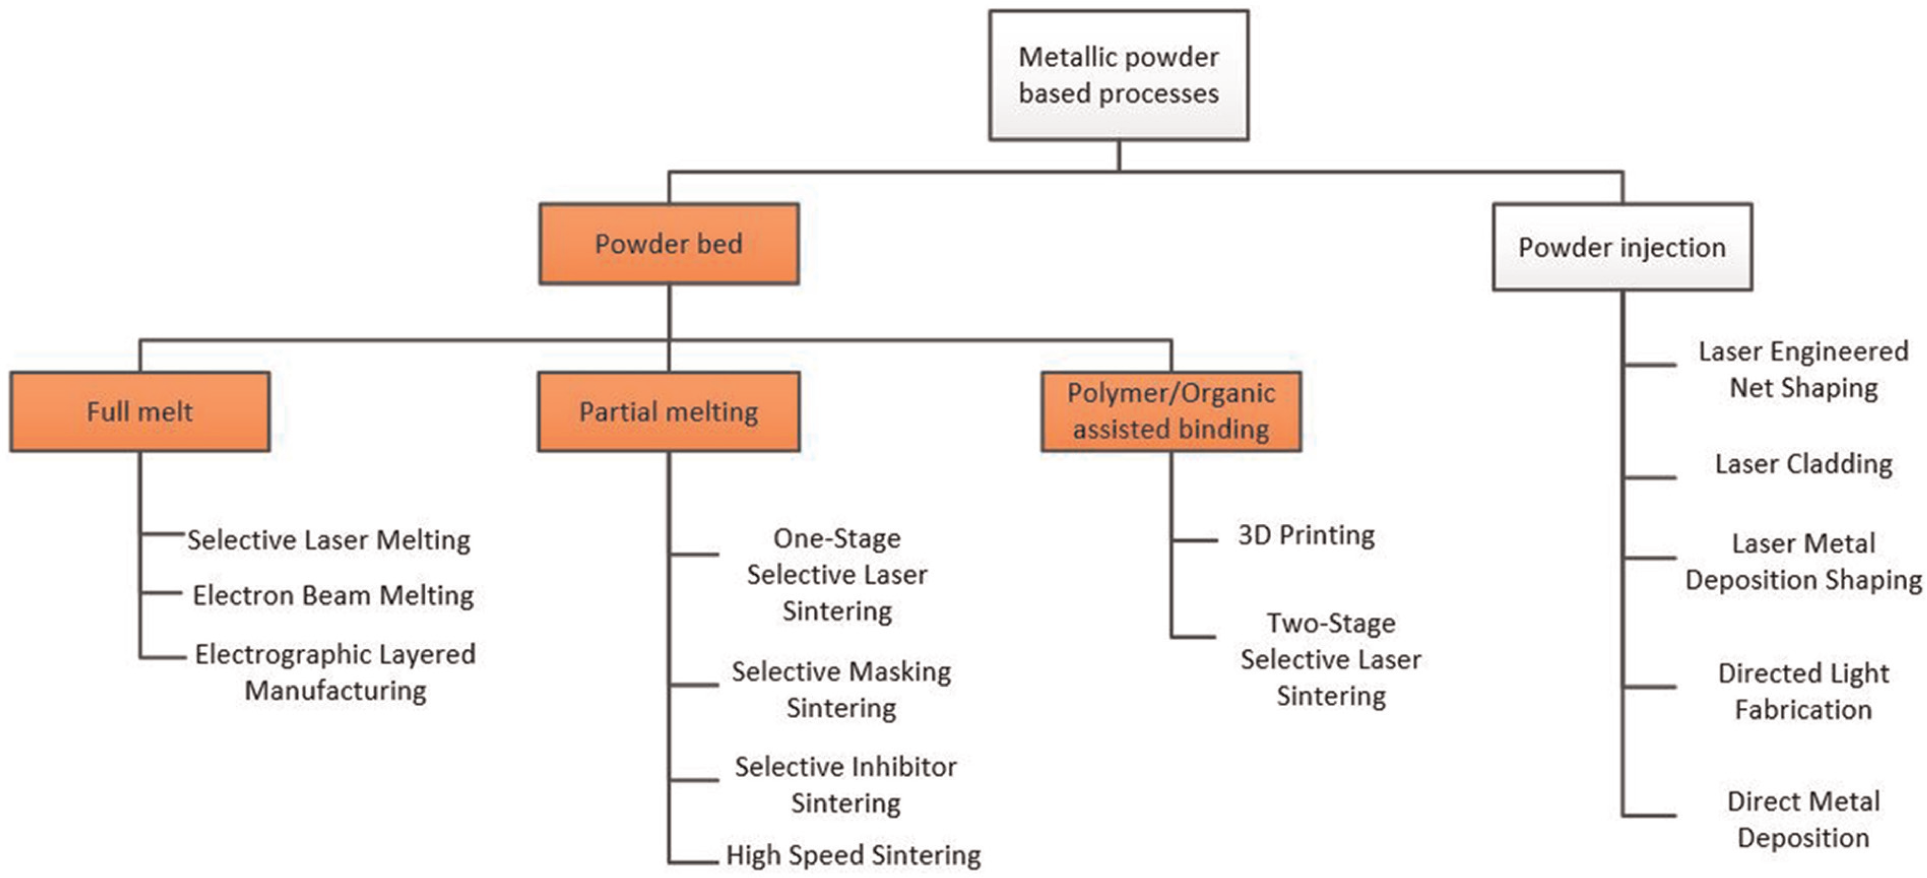
Classification of metallic powder additive manufacturing processes.
Despite the freedom in design, the ability to build parts composed of multiple materials and the almost zero computer-aided design (CAD)-to-part time that AM can offer, there are still serious obstacles toward its wider acceptance and establishment into the modern industrial practice. AM processes involve a high level of complexity and the physical mechanisms acting during the process are not yet well understood. 5 Thus, the parts produced using AM processes are often not fulfilling the mechanical performance requirements set by manufacturers or exhibit difficulty to predict distortion behavior. 6 This fact, along with long lead times, 7 can be considered as the main reason preventing the total transition to AM when it comes to the production of metallic parts. Poor mechanical performance can be attributed to the remaining porosity and the presence of thermally induced residual stresses and distortion in the finished parts. 8 Porosity is generated by instabilities during material consolidation. 9 That phenomenon, which is commonly referred in the literature as “balling,” 9 does not allow a full surface contact between melted material particles, leading to parts with lower density than the respective solid material and therefore decreased mechanical strength. 10 On the other hand, residual stresses and distortion are generated by the thermo-mechanical nature of the process itself and the thermal gradients created when building the part. 11 Residual stresses and distortion affect significantly the mechanical properties and cause dimensional inaccuracies to the final part. An overview of the current issues in the AM industrial practice is illustrated in the diagram of Figure 2.
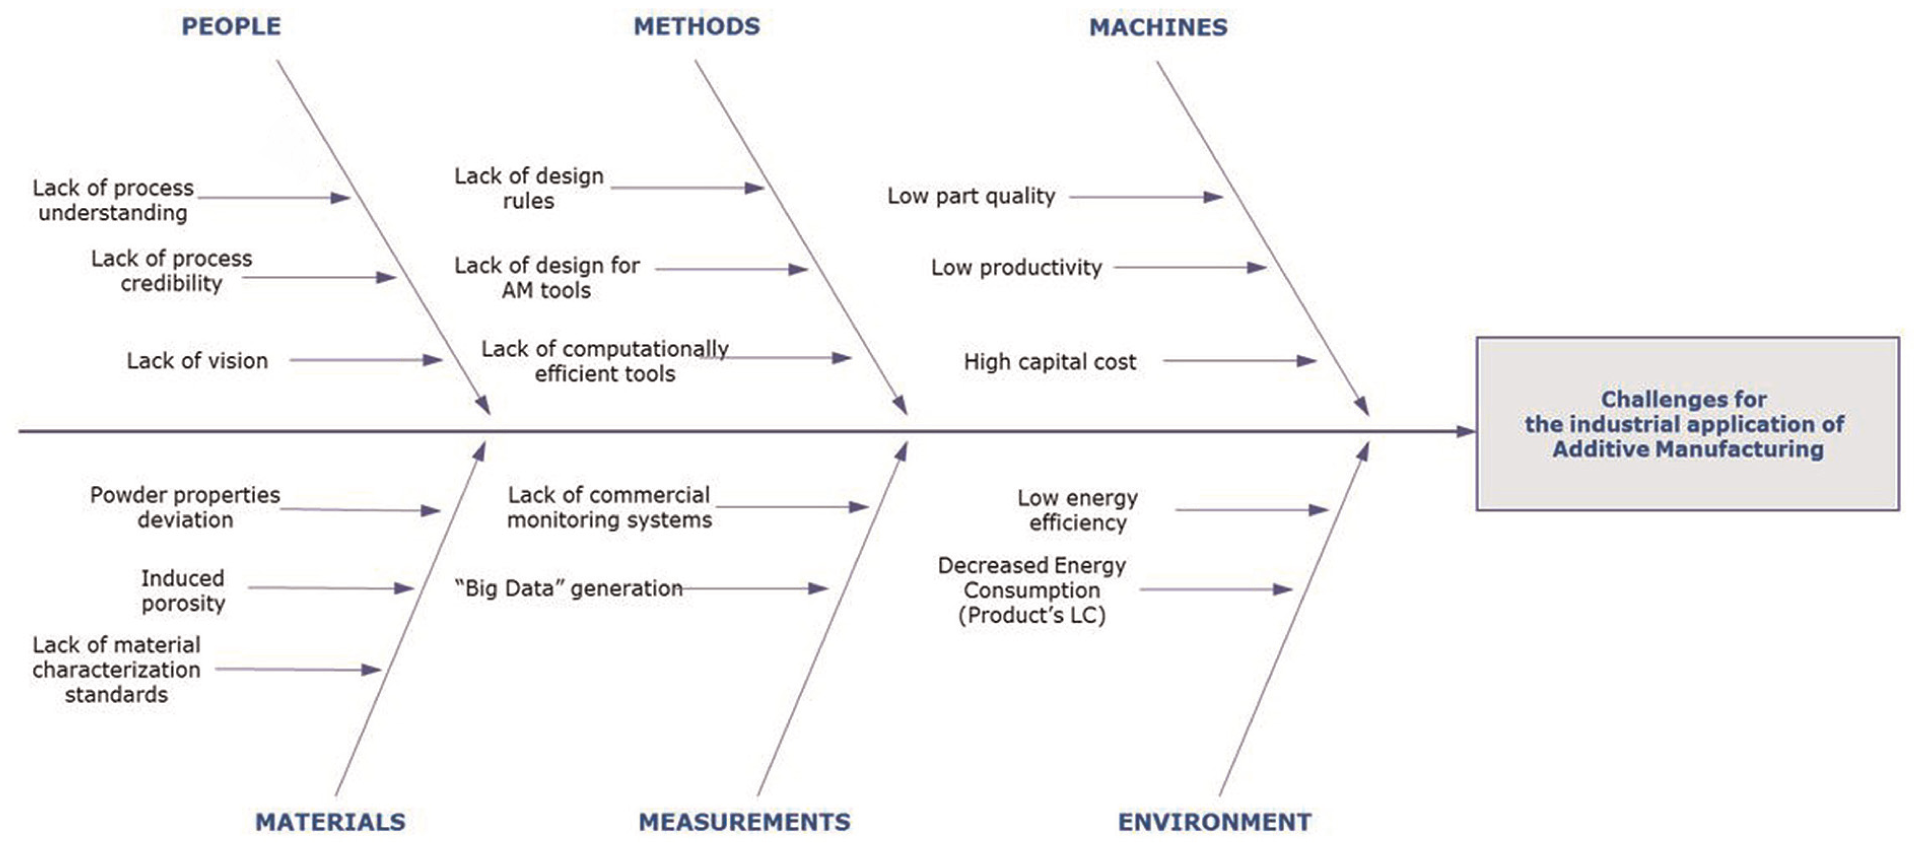
Challenges in additive manufacturing industrial application.
Numerical methods can be classified into mesh-based methods and mesh-free methods. 12 The finite element method (FEM) belongs to the first class and was originally introduced by Turner et al. 13 In the FEM, a continuum of matter (domain) is discretized into a finite number of elements forming a mesh, thus reducing the problem to that of a finite number of unknowns. 14 Each finite element possesses simpler geometry and therefore, it is easier to analyze than the actual structure. 15 The FEM has proven to be an essential tool for solving boundary, initial and eigenvalue problems in almost every engineering discipline. 14 The FEM has also proved to be very popular in the study of the physical phenomena during AM processes and their parametric optimization, as it is a resource efficient methodology, 16 which can save a large number of physical experiments from being conducted. 17 Thus, FEM has eventually become the most common technique for predicting the porosity, the residual stresses and the distortion of parts produced by AM processes. Other numerical methods used include the Lattice Boltzmann method (LBM)5,18–20 and the finite volume method (FVM),21,22 in studies that take into account the fluid dynamics of the melt pool. The ultimate goal of studies in this field is adjusting the process parameters for achieving the desired mechanical integrity and reducing the number of faulty parts, toward minimizing manufacturing costs. The literature studies in the field of modeling and simulation of other types of manufacturing processes already exist.12,23–25 In the field of simulating AM processes, the only existing review article is dealing with thermal analysis methods in SLS and SLM. 26 The aim of this article is to provide an overview of the finite element numerical modeling and simulation of the AM processes utilizing a metallic powder bed.
The structure of this article is organized as follows. Section “Numerical modeling” describes how modeling for simulation is performed. Details about mathematical modeling, meshing, simulation techniques, heat source models and temperature-dependent material properties implementation into the model are provided. Section “Simulation results” presents the simulation results of the reviewed studies. The results are categorized by subject into three groups: (1) temperature history, (2) residual stresses and distortion and (3) melt pool characteristics. The means of experimental verification of the simulation results are explained in section “Experimental validation” and the relevant applications are reported. In section “Challenges,” the current challenges in the use of finite element analysis (FEA) in AM process simulation are listed and already implemented, or potential solutions are presented. Finally, this study is summarized and a number of concluding remarks are given in section “Conclusion.”
Numerical modeling
Thermo-mechanical analysis workflow
The typical workflow followed for simulating the temperature field and approximating residual stresses and distortion using the FEM is presented in Figure 3. The inputs defined by the user during the pre-processing stage are the part geometry, the mesh, the initial and boundary conditions, the applied loads and the material properties. In the processing stage, the partial differential equation governing the system is discretized into equations for each element and then all the equations are assembled into a global equation. The solution of the equation can be used in the post-processing stage in order to visualize the temperature field on the part geometry. In order to approximate residual stresses and distortions, a mechanical analysis is performed, following a similar workflow. The temperature field obtained by the thermal analysis is now applied as a load. The thermo-mechanical analysis can be coupled or uncoupled. In coupled analysis, the heat generation caused by friction or in our case by plastic deformation of the material is considered in the calculation of the temperature field. In order to take this effect into account, the thermal and mechanical analyses are performed simultaneously. On the other hand, uncoupled analysis is performed sequentially and the interactions between temperature and stress fields are not considered. The latter method is the one used in most cases, as it can save computational time despite the loss in accuracy. For reaching the solution of the FEA, either explicit or implicit methods can be used. If
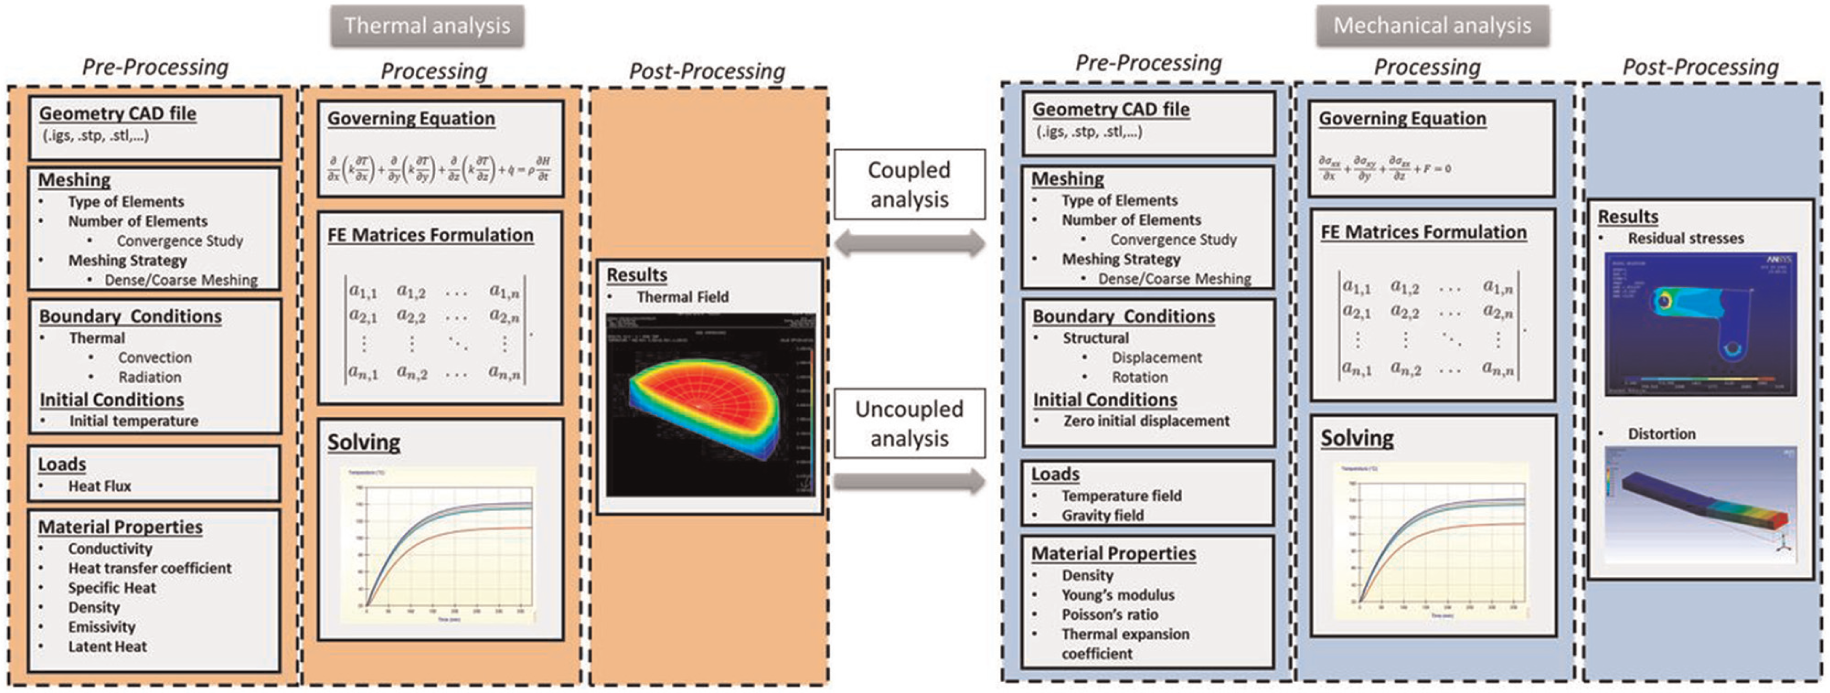
Finite element analysis workflow.
An implicit method would require the solution of an equation involving both the current and the later state of the system in order to find
Explicit methods can exhibit numerical instability if the value of the time step
Heat transfer mechanisms
In additive processes, the part is created by consolidating material in specific regions according to the part geometry. To achieve consolidation, heat is added to the system by irradiation using a heat source. The beam is inactive when traveling and no geometry exists in the underlying region, offering time for cooling. Heat escapes the system to the surroundings by convection and radiation from the free surfaces. Specifically, for a powder bed process, the heat transfer mechanisms acting during the process are illustrated in Figure 4.
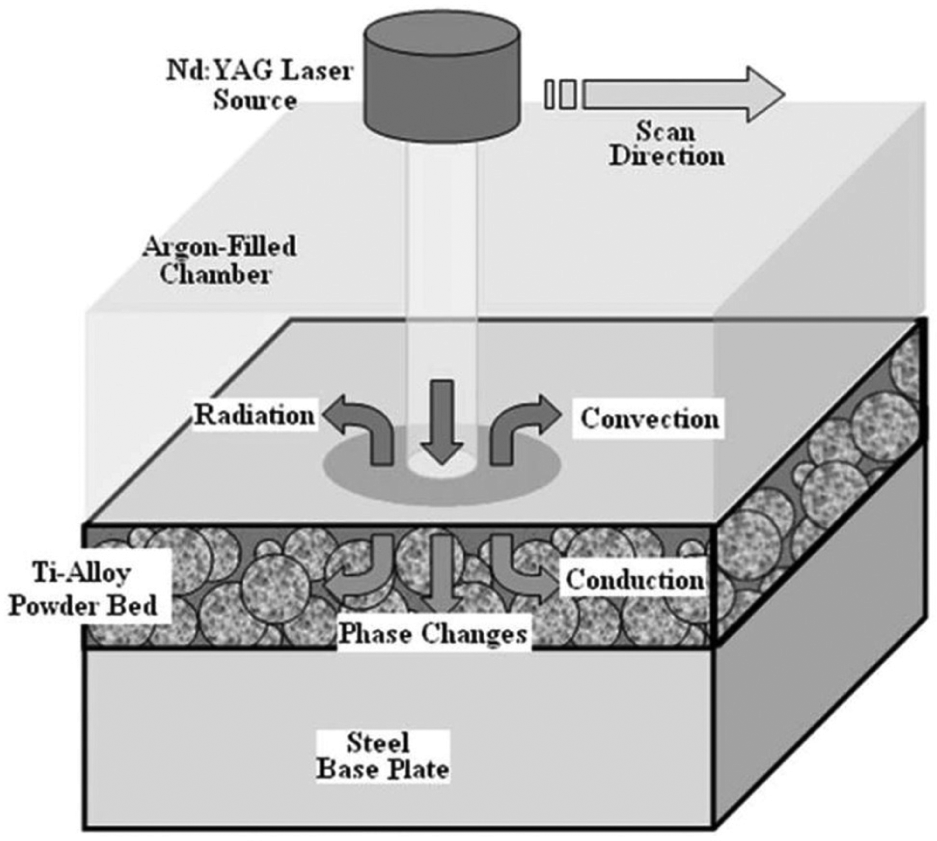
Physical mechanisms during additive processes. 31
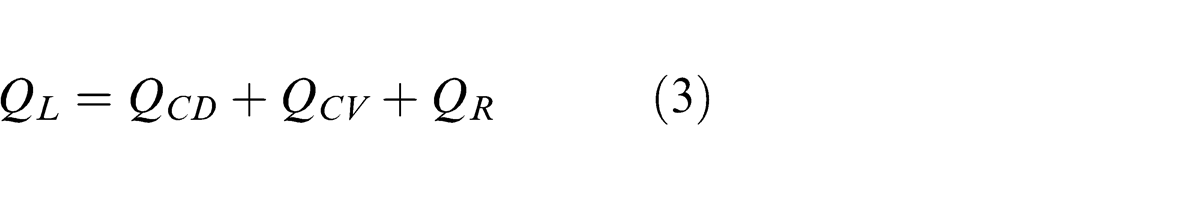
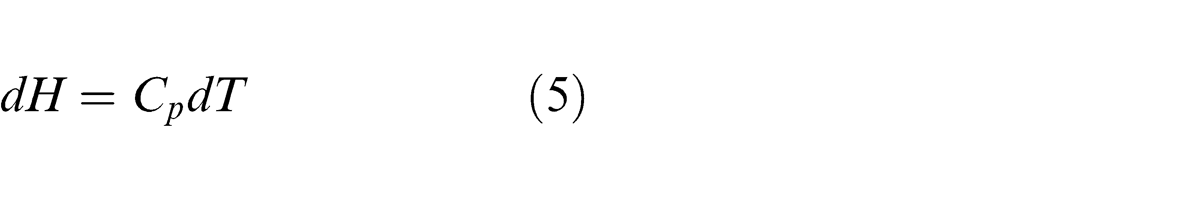
The general energy balance equation in a closed system with respect to the first law of thermodynamics can be expressed as 31
where
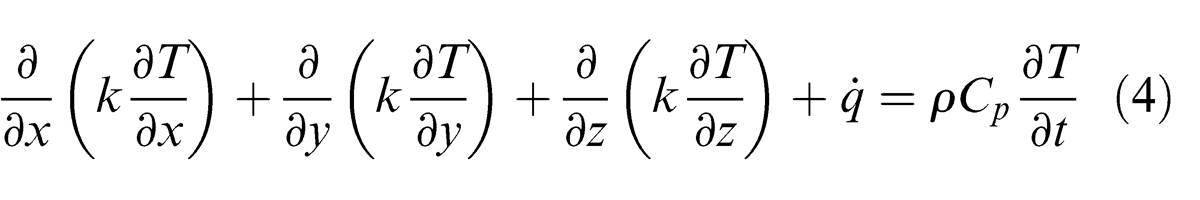
where
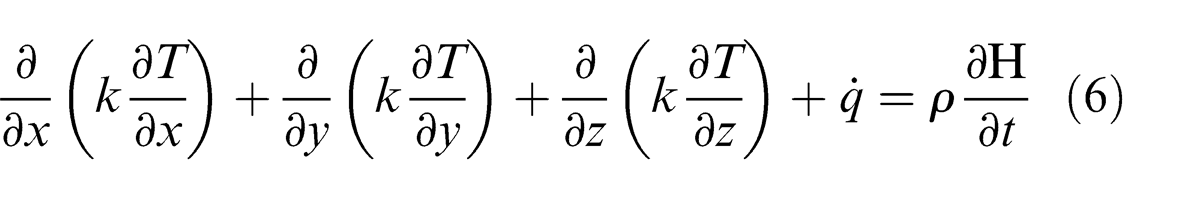
In order to capture the solid–liquid transformations, the above equation can be modified so that the enthalpy change is taken into account. The enthalpy change
and the heat conduction equation is transformed to
The initial conditions can be expressed as 32
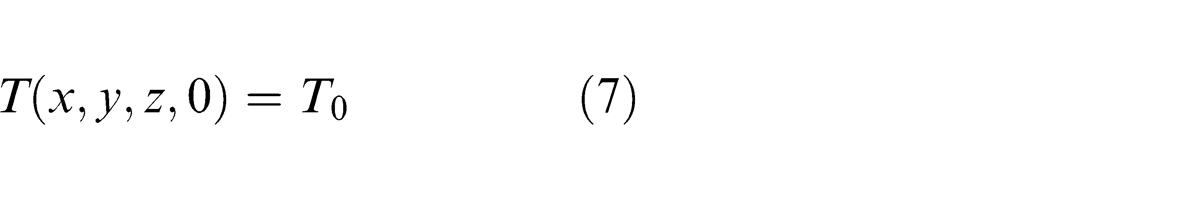
supposing that the initial temperature of the powder is equal to the ambient temperature
In the general case, where the heat supplied by the beam is modeled as a heat flux and heat is lost from the system by convection and radiation, the boundary condition for the free surfaces of the part is 33
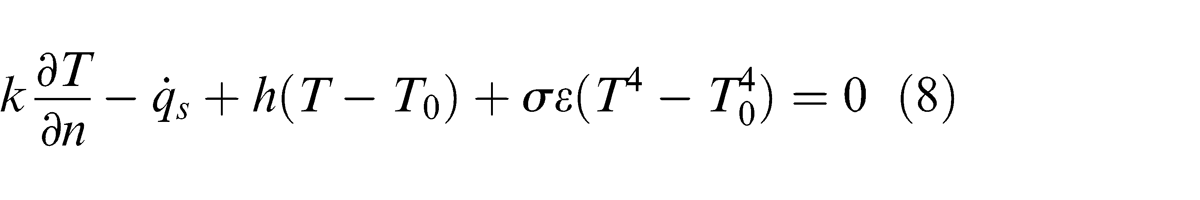
where
Modeling assumptions
The process simulation can be three-dimensional (3D)34,35 or include only two dimensions,36–39 so that the computational time is reduced. Two-dimensional (2D) modeling can be used when melting of a single layer is simulated, but is inadequate when multiple layers are processed. Radiation losses from the free surfaces are neglected in a number of studies, 31 while they are taken into account in other studies.37,38,40–42 For simplification reasons, the heat loss from the bottom of the substrate can be omitted. 43 Those simplifications regarding heat transfer phenomena can reduce the accuracy of the analysis. However, loss of accuracy occurs only to a limited extent as the main heat transfer mechanism is conduction through the powder bed and solidified regions. Gravity effects can be taken into account by applying a force load to the elements. 44 Gravity modeling can capture node displacements as those occurring when fabricating overhang structures. The effect of phase changes is included in the model by defining the latent heat required for phase change at the melting point.45–47 The phase changes are also modifying the material properties. 48 The powder particles can be modeled explicitly 49 or represented by a continuum body with adjusted properties,48,50,51 which is isotropic and homogenous.41,42 Modeling explicitly the powder particles can offer increased accuracy and microscopic insight, but has serious effects in the computational effort required. Especially, for the simulation of real case studies, this approach would cause the increase of finite elements to a number that is unacceptable for a feasible computational time. Therefore, the second approach is followed by the vast majority of the published studies. Moreover, fluid dynamic phenomena and convection in the melt pool are usually neglected, since in most studies the size of the melt pool is tiny compared to the entire part.40,52 In order to reduce the demands for computational power, a number of researchers have not modeled the exact heat source path, replacing the scanning vectors of each layer with scanning areas.48,53 In extreme cases, applying the energy input simultaneously to a whole layer can substitute the scanning vectors. 54 Programming complexity can be reduced in this way, as well.
Meshing
The quality of a FEA is strongly affected by the characteristics of the underlying mesh, with a poor mesh potentially leading to unstable and/or inaccurate numerical computation. 55 Furthermore, the mesh quality has a remarkable impact on the computational efficiency of the simulation and the time required for the analysis.56,57 A popular technique among AM simulation studies is using mesh density which varies across different regions of the model. Certain regions, particularly those close to the heat source, exhibit steep temperature gradients and an accurate analysis would require a more dense mesh in those areas. 58 For that reason, a local refinement technique is employed in order to update the mesh density in each load step, according to the needs stated above. In several studies, fine meshing is used for the region directly heated by the beam and a close surrounding area, while the mesh coarsens as moving away from the beam spot.17,34,35,44,45,49 An example of a mesh created using this technique is presented in Figure 5. Other studies utilize a uniform mesh for the whole model.36,50,52,59–62 In the two previous cases, the mesh thickness is usually equal to the layer thickness. 37 The solid substrate can be meshed with larger element size than the overlying layers in order to reduce simulation time,40,43,51,63,64 as shown in Figure 6. The already solidified layers can also be meshed with a coarse mesh. 48
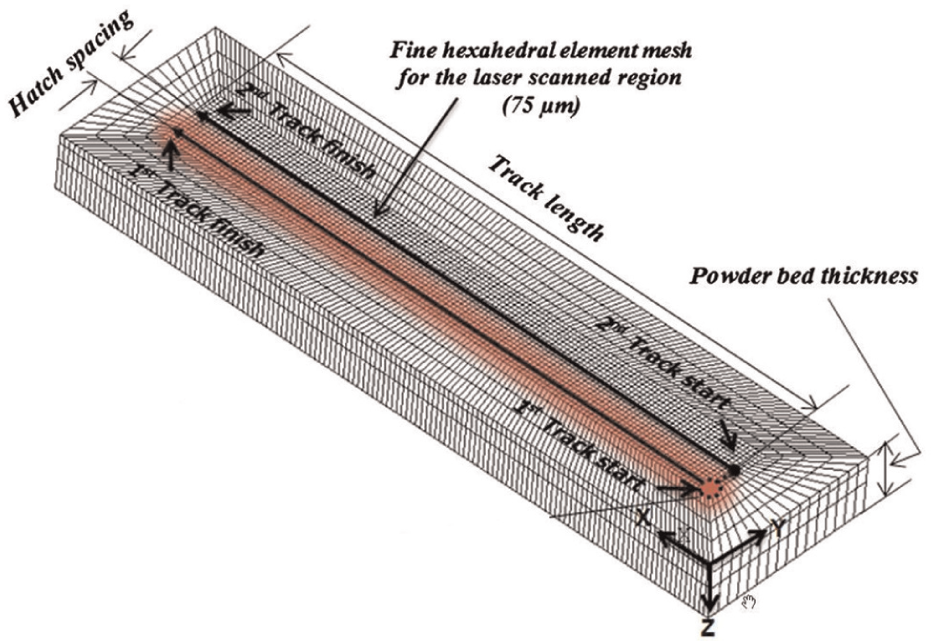
Locally refined mesh. 45
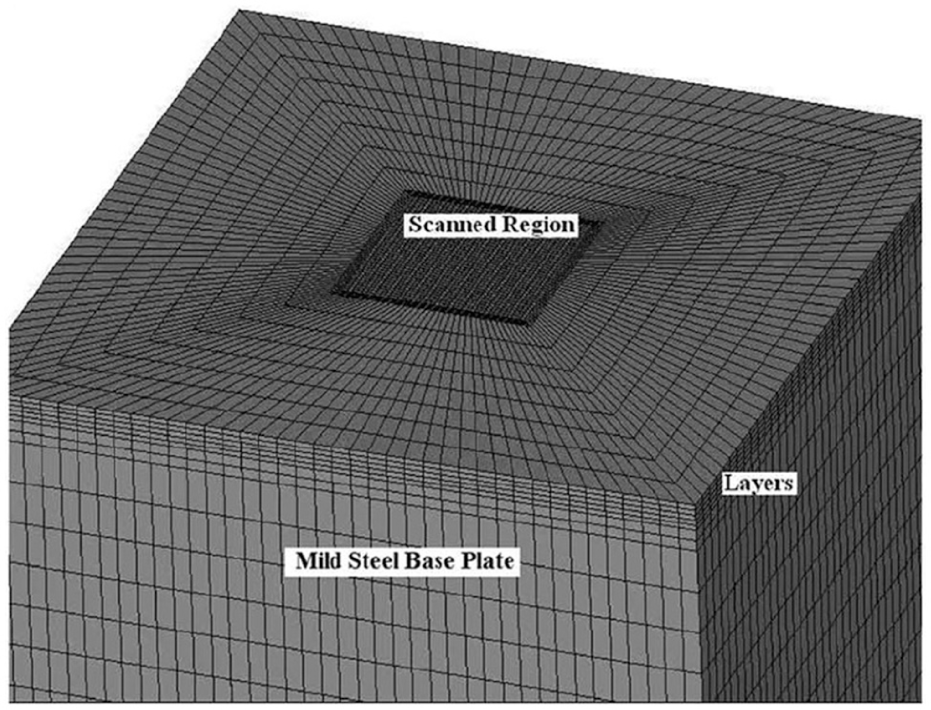
Coarse mesh used at the substrate. 31
Element birth and death
The material in powder or liquid form does not contribute to the overall stiffness of the model. In order to reach accurate results when predicting the residual stresses and distortion, this fact has to be taken into account. In order to simulate the transition of the material from powder to liquid and finally to solid, a number of studies use a method known as “element birth and death,”31,63–66 as defined in the ANSYS finite element software. 67 The elements are deactivated until solidification. This means that they are visually present in the model without adding to the overall stiffness of the matrix,31,68 as their actual stiffness has been multiplied by a severe reduction factor. 67 After solidification, the elements are activated, obtaining back their actual stiffness. A control loop determines when an element is activated according to whether its temperature after a load step has surpassed or not the melting point. 47 In other studies, the elements of every single layer are added simultaneously.62,69 From a programming point of view, controlling the state of the elements and locally refining the mesh in each load step increase the level of difficulty in the preparation of the analysis.
Heat source models
The impact of the heat source in the powder bed can be modeled as a heat flux load or as a temperature load. In the vast majority of studies where a heat flux load is used, the heat source follows a Gaussian intensity distribution. An example of a Gaussian intensity distribution is presented in Figure 7. The intensity
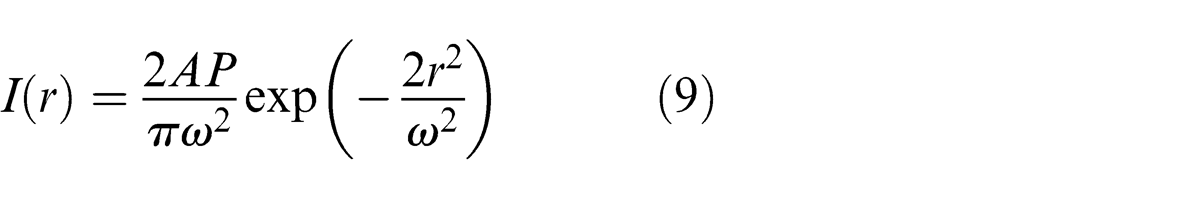
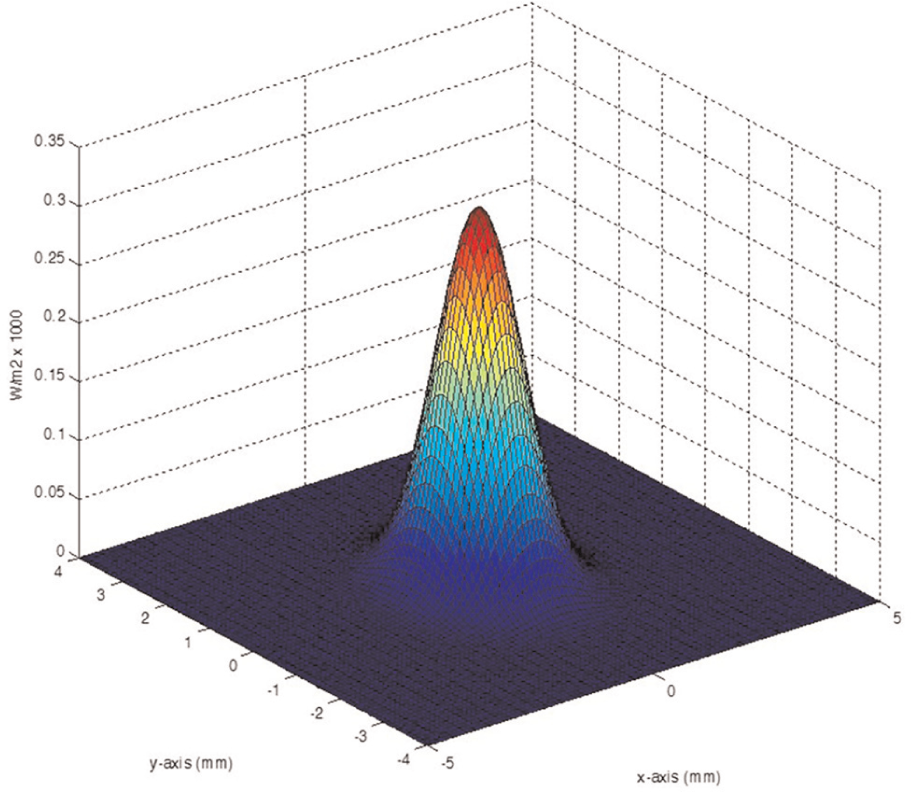
Gaussian heat source.
where
Heat flux loading that does not follow a Gaussian distribution has been implemented in a number of studies. Van Belle et al. 37 applied the heat flux created by the laser beam on the surface of a single element, which is of equal size with the beam diameter. They are claiming that due to the very small size of the finite elements, this will have minor effect to the simulation results. Contuzzi et al. 35 did not consider a Gaussian power density distribution but a constant power density instead, modeling the laser beam so that it irradiates five elements in a cross layout. A constant energy input applied to five elements in a cross layout was also used by Matsumoto et al., 36 as shown in Figure 8. As stated previously, another way of modeling the heat source is applying a temperature load to certain elements. 48 Fixed temperature loading is used by Ma and Bin 52 for a laser beam size of 2 × 2 mm. The temperature is set at 1740 K, which is slightly higher than the melting temperature of the material (nickel).
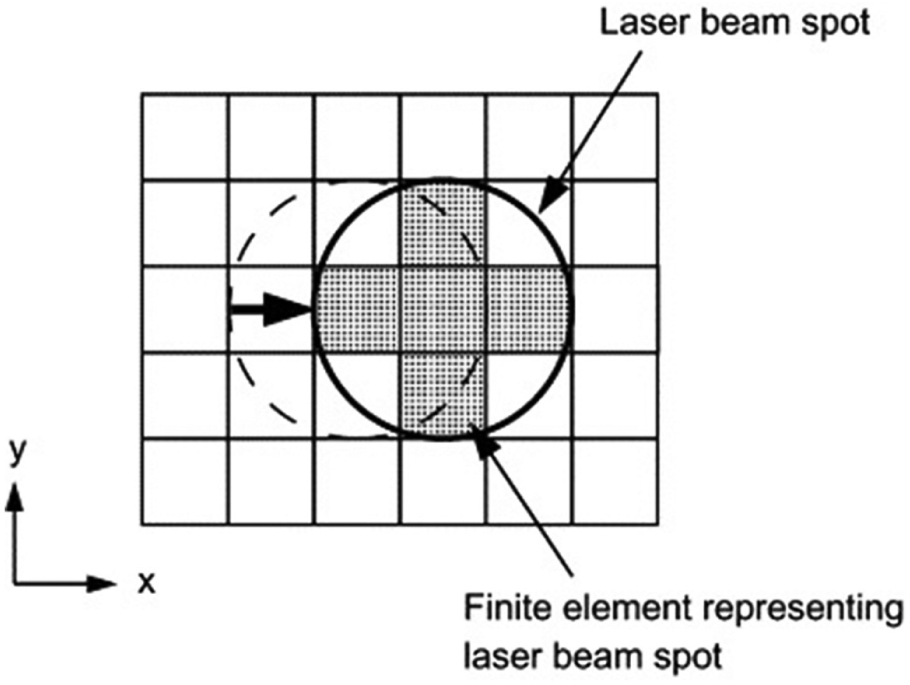
Laser beam modeling by Matsumoto et al. 36
Temperature-dependent material properties
Detailed definition of material properties is the basis for performing accurate simulation of AM processes. Due to the thermal character of the process, the material properties should be stated with relation to the temperature and also the transition of the material from powder to liquid and finally to solid. The properties that affect significantly the process evolution and their dependence on temperature is of high interest are the density, the thermal conductivity and the specific heat capacity. Other material properties, such as the Young modulus,37,44,52 the tangent modulus, 52 the yield strength44,52,59 and the thermal expansion coefficient,37,45,52 can also be considered as temperature dependent. Those properties are used when a mechanical analysis is performed, either coupled or uncoupled with the thermal analysis. Thus, their temperature dependency affects the residual stresses and distortion results.
Density
Density as a physical quantity describes the mass per unit volume of a substance. As a temperature-dependent property, material density changes during the process and at most times the density of the final part is higher than the powder bed density.
34
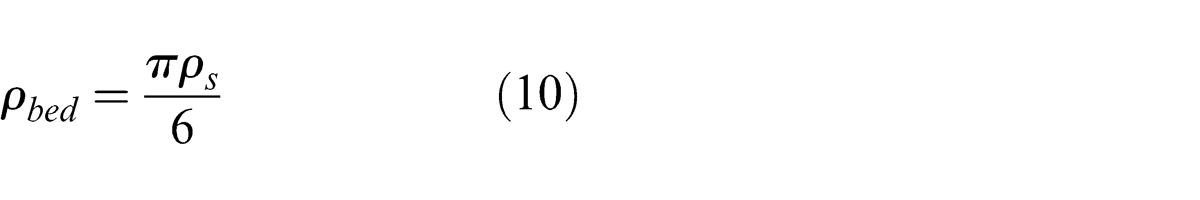
However, in a number of studies, the density has been considered to be constant, in order to reduce the complexity of the analysis.34,41,49,51,52,59–62,69 Other studies consider two different densities for the powder and the solid state.35–37,42,44,70 In those studies, the powder density can vary from 40% to 60% of the solid density, depending on which assumption for the powder packing is followed. For example, Antony et al.
50
and Patil and Yadava
46
calculated the powder density on the bed,
For a more detailed analysis, the density is changing with temperature.31,71,72 The relation of density with temperature can be linear, as in the study of Yin et al., 42 where a linear increase of density with temperature has been assumed. In a few SLS studies, along with temperature, the effects of sintering are accounted, through applying sintering laws, for determining the density. 39
Thermal conductivity
The thermal conductivity of a material determines the rate at which heat transfers through the material. Thermal conductivity is a temperature-dependent material property. In addition, the thermal conductivity of powder is different than the solid material, as the contact area among adjacent particles is smaller. 73 It has been proved that the effective thermal conductivity of powders is a function of multiple factors, such as particle size and shape, solid volume fraction, thermal conductivity of the solid and the thermal conductivity of the gaseous media. 74 Several studies consider constant thermal conductivities, both for the powder and the solid state, in order to reduce the complexity of the model.35–37,50,54,75 However, numerous studies consider a temperature-dependent thermal conductivity, in order to reach more realistic results. The thermal conductivity of the solid material has been defined experimentally at certain temperature points. The conductivity for the intermediate temperature points is calculated with linear interpolation. 41 The powder’s effective thermal conductivity is calculated in relation to the solid thermal conductivity according to theoretical models, which take into account the porosity and the thermal conductivity of the surrounding gas.22,31,32,39,40,51,63,69,71,72,76 Some models take into account only the porosity without considering the surrounding gas. 45 In SLS, the models can also include the sintering potential,17,34 the effect of the sintering necks 47 and the initial sintering temperature 42 as parameters. In some cases, a constant conductivity is assumed for the powder and a temperature-dependent conductivity for the solidified material.44,46 Finally, a zero thermal conductivity for powders can be assumed as well. In a study published by Wang et al., 77 this approach did not have a noticeable effect on the simulation results, as the inter-particle heat transfer was so weak at high scanning speeds that could be disregarded.
Specific heat
The amount of the energy needed for a certain temperature rise can be found using the specific heat capacity of the material, which is a temperature-dependent property as well. As in the case of the thermal conductivity, several studies use pre-defined values for the heat capacity and the value for any given temperature point is calculated by linear interpolation or extrapolation.34,41–47,49,51,52,59–62,64,69,73,78 The specific heat capacity of powder beds can be found taking into account the powder bulk density or for powder mixtures applying the law of Kopp–Neumann. 63 Other studies consider constant specific heat. In some cases, the material while in powder form has different specific heat capacity than the material in solid form,37,71 while in other studies the same value is assumed for both states.19,35,36,70 A different approach is calculating the evolution of specific heat capacity during the process, according to the current temperature.39,40,50 In studies where a melt pool stability analysis is performed, the specific heat capacity can be defined for the solid and the liquid phase as well.50,75
Simulation results
Temperature field
The temperature field history of the part during the process can provide useful input for determining the distribution of the thermal stresses and predicting the residual stresses and distortion. 31 The temperature at every scanned region of the part undergoes similar thermal cycles,26,31,44,45,66 except the edges.31,44 This phenomenon is presented in the diagram of Figure 9, where the temperature profiles of a number of consecutive spots have been recorded. Van Belle et al., 37 when explaining the cyclic temperature history, state that each element reaches peak temperature values when it is scanned itself and also when neighboring elements are scanned. The laser scanning of additional layers also leads to secondary peaks in the temperature of the underlying layers. 31 Roberts et al. 31 simulated the temperature field during SLM. Their findings indicate that the upper layers reach higher temperatures than the bottom layer which is in contact with the base plate. The lower conductivity of the bottom layer, if compared with the steel base plate, shields to some extent the upper layers. They also observed that as the number of layers increased, the temperature of the bottom layer experienced a slight but steady rise, which can cause the generation of residual stresses after completion of the process and during cooling. Thus, determining the number of layers should be done in accordance with the rest of the process parameters and not only considering dimensional accuracy requirements. Despite the time for cooling that powder recoating offers, a small but incremental rise of temperature was also observed in the rest of the part and the base plate. A great temperature gradient is observed from the surface of the powder bed to the substrate. 41 Li and Gu 51 pointed out that the temperature gradient decreases as the distance from the top of the melt pool in the Z-axis increases. The reason for that is the higher conductivity that the solidified material in the previous layers has, if compared with the molten material. According to Kolossov et al., 34 the temperature difference between the top and bottom of the part is so high (i.e. 2513 °C) that a 3D model is necessary for obtaining accurate results. In their 3D model, a higher maximum temperature was observed as the laser beam moved from the center of the first layer to the center of the second layer. In SLS, the temperature gradient under the beam spot is greater than that in the already sintered areas, according to Ren et al. 63 In a semi-scanned layer, the residual heat in the powder-half is higher than that of the solid-half. 65 Liu et al. 49 developed a 3D finite element model, which takes into account powder arrangements as shown in Figure 10, in order to study SLS. They came to the conclusion that the temperature field of laser sintering is intermittent in the micro scale, because of the discretely distributed particles, and that the temperature distribution is remarkably inhomogeneous with the maximum temperature to be observed in the top layer. This approach offers enhanced accuracy. However, it would not be recommended for real parts, as modeling in the micro-scale, would mean an enormous number of elements and a huge computation cost. A number of studies point out that the cooling rate of overhang structures is relatively smaller than normal geometries, as they exhibit inferior heat removal due to the insulating behavior of the unconsolidated powder below them.48,78 Overhang structures should be given extra attention, as they may also require a support in order to avoid collapsing. Papadakis et al. 79 reported that when using lattice structures to support parts during fabrication, a densely meshed support leads to higher temperature gradients between the scanned region and the substrate. On the other hand, wide-meshed supports can lead to increased building platform temperatures and therefore smaller gradients.
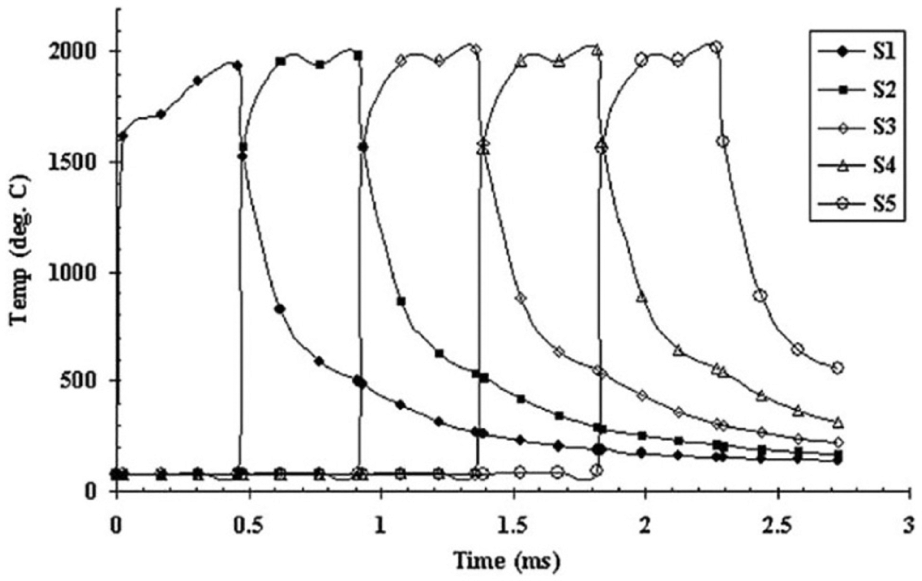
Temperature profiles of consecutive spots. 31
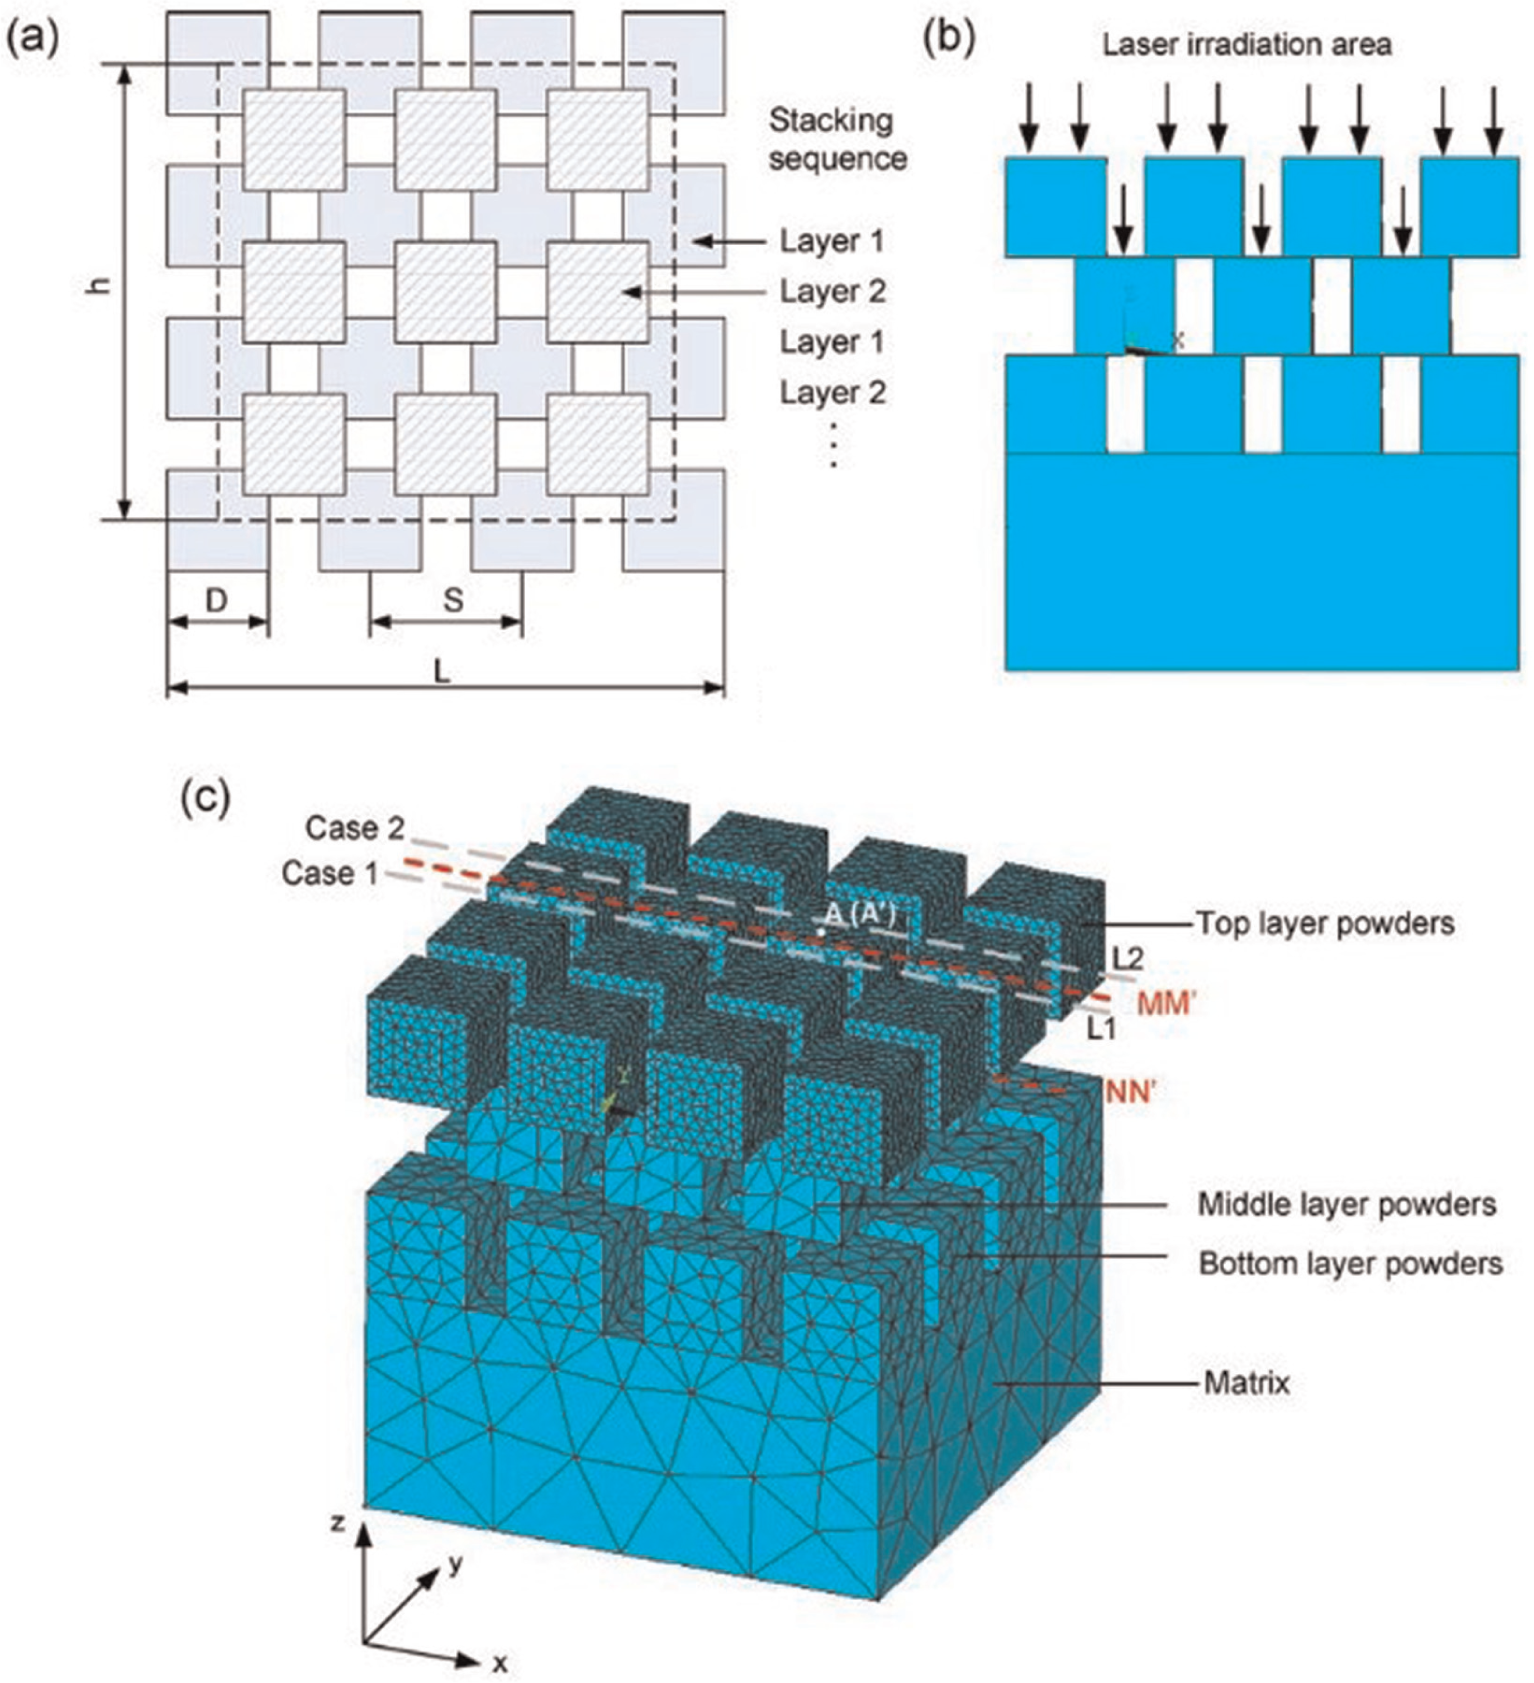
(a) Powder stacking strategy, (b) laser irradiation region and (c) meshing of a simulation model considering powder arrangements. 49
The effect of the process parameters to the temperature field characteristics has drawn the attention of a significant number of researchers. In several studies, it has been reported that the maximum temperature of the part is increasing with the laser power32,40,42,50 and decreasing with the scanning speed.32,40,42,64 The dependence of temperature and of the time that material at a certain point remains liquid, for an SLM process, with the scan speed and the laser power is shown in Figures 11 and 12 respectively. As reported by Li and Gu 51 the cooling rate of the molten pool increased slightly when the power of the laser in the SLM process doubled from 150 to 300 W. A significant rise of the cooling rate was observed when the scanning speed increased from 100 to 400 mm/s. In addition, the maximum temperature gradient increased significantly when doubling the laser power while it slightly decreased when increasing the scanning speed. Higher spot radius causes lower maximum temperature,42,47 due to lower intensity if the power remains constant. According to Shen and Chou, 47 an increased beam diameter in EBM can lead to a lower cooling rate due to the smaller temperature gradients. The cooling rate of a layer was found to be higher when the layer is scanned over a solid substrate instead of being scanned on loose powder bed. 45 The effect of preheating to the temperature history has also been studied. Zhang et al. 40 observed that a preheating temperature of 200 °C, when melting composite W-Ni-Fe powder, can lead to an increased maximum temperature by 6 °C, allowing for less energy input by the laser beam. The temperature field is remarkably sensitive to changes in the scanning pattern. Ma and Bin 52 developed a 3D finite element model to investigate the effect of different scanning patterns in the evolution of temperature, distortion and thermal stresses during SLS. More specifically, they compared the “S” and the fractal scanning pattern, as shown in Figure 13(a) and (b), respectively. Their findings indicate that the fractal pattern leads to much more symmetrical temperature field if compared to the “S” pattern. Increasing scan interval (i.e. the distance the laser beam moves after each time step) also causes the part temperature to decrease, as reported by Patil and Yadava 46 However, a very high scan interval can lead to insufficient energy density input and inadequate melting of the material between the two scan lines. 32
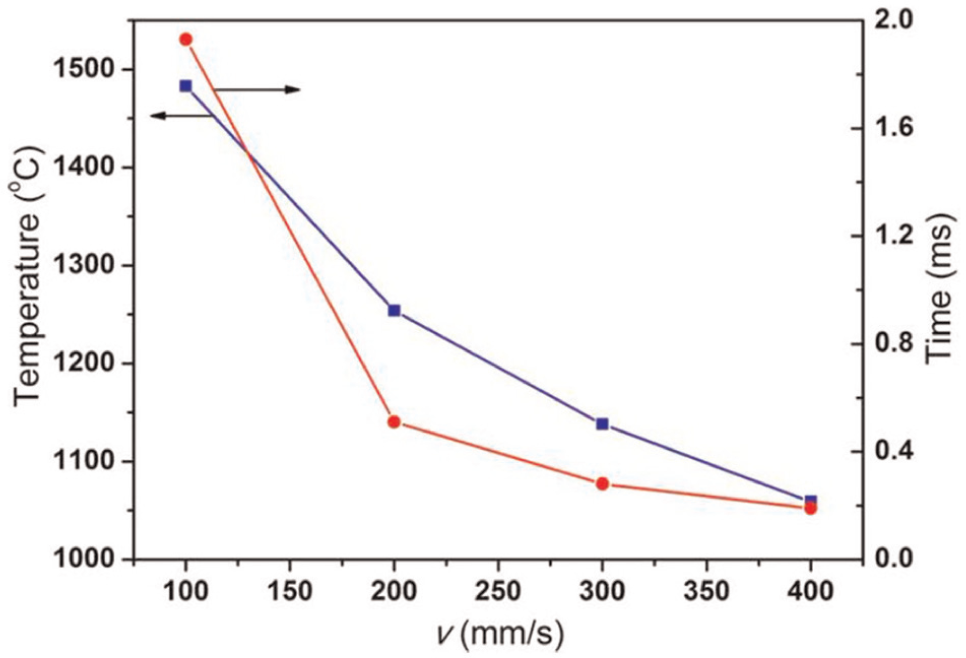
Temperature versus scanning speed. 51
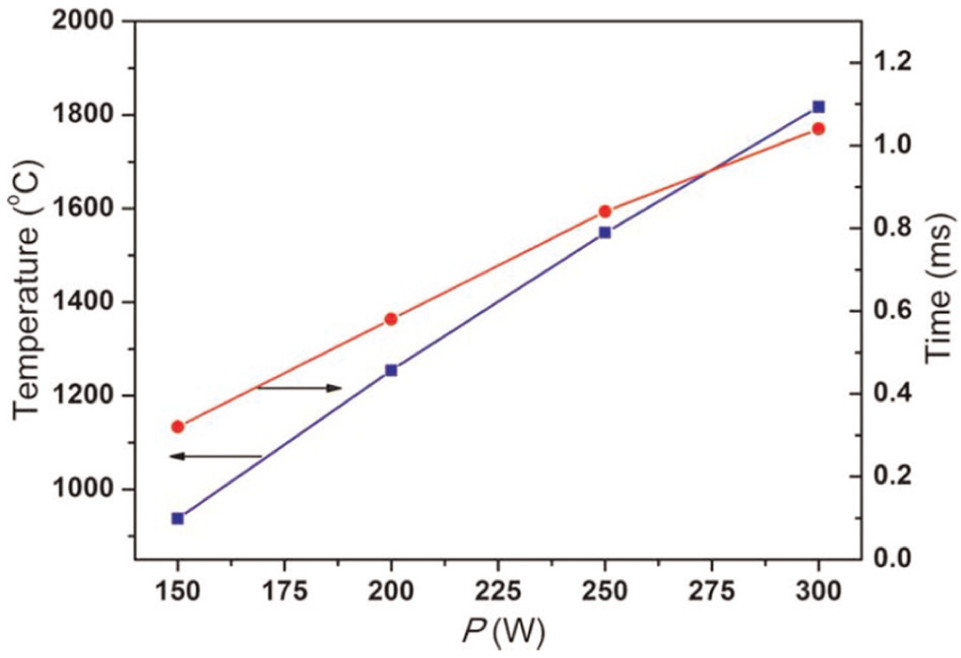
Temperature versus laser power. 51
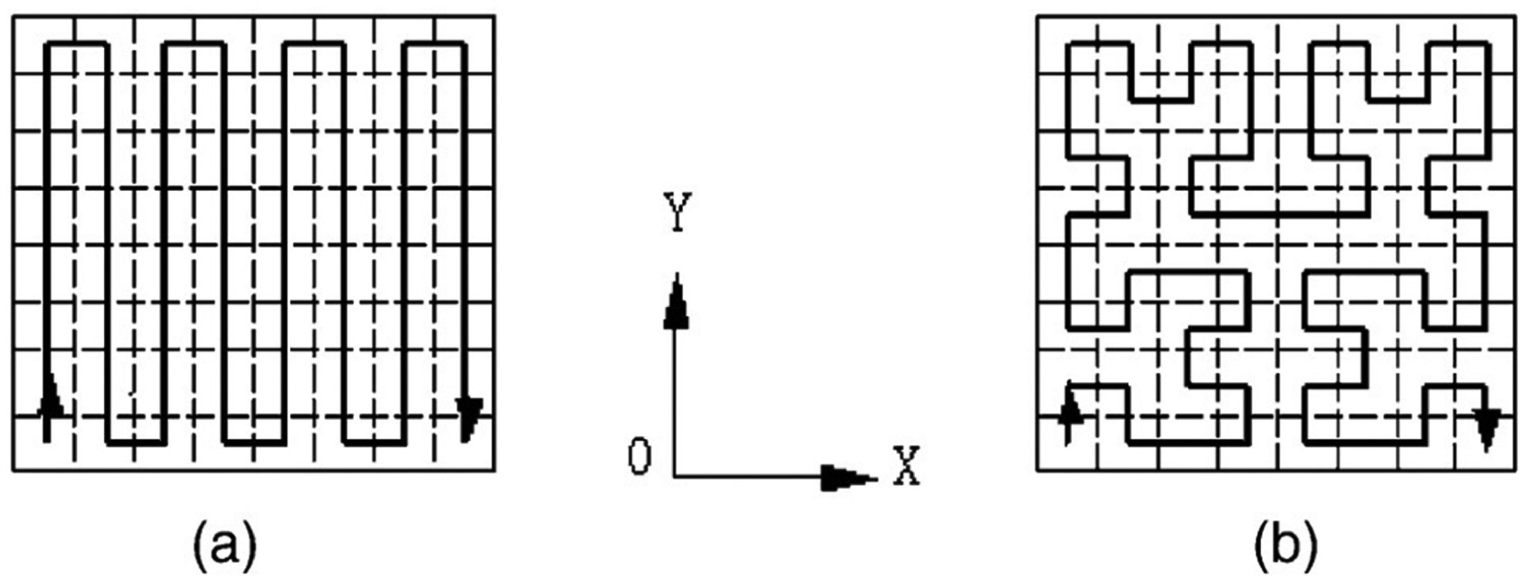
(a) The “S” scanning pattern and (b) the fractal scanning pattern. 80
Residual stresses and distortion
Thermal stresses are created when part or all of the volume of a body is not free to expand or contract in response to temperature changes. 81 In order to numerically predict the residual stresses and distortion in parts manufactured by AM processes, a mechanical simulation, is performed using as thermal loading the temperature distribution history recorded in the thermal analysis. Warping and loss of edge tolerance are the effects of distortion from a part quality perspective. 44 The largest residual stresses are observed at the top layer and the interface between the part and the substrate.37,53,54 Filleting the transition from the substrate to the actual part can prevent stress concentration in this region. 68 While high tensile stresses were reported by Hodge et al. 78 at the top layer, the bottom layer was dominated by high compressive stresses. In the x-direction, the part initially encounters compressive stresses which are gradually turning to tensile stresses after beam scanning and when cooling occurs. 44 In SLS, according to Jiang et al., 44 distortion in the vertical direction is mainly caused by shrinkage due to the sintering of porous powders. However, in the horizontal direction, the distortion is mostly caused by the thermal loading. Generally, in SLS, major distortion of the part appears during the laser scanning process, with the effect of the residual thermal stresses on distortion being rather small if compared with that of the transient thermal stresses. 52 Dai and Shaw 59 state that in AM processes, the transient thermal stresses are those causing the distortion, while the residual thermal stresses have little and basically opposite effect to that of the transient ones. The effect of residual stresses appears when, as described by Papadakis et al., 79 detaching the part from the building platform. That causes a relaxation of the residual stresses and a subsequent development of deformations. According to Hussein et al., 45 high temperatures lead to a decreasing elastic modulus which causes stress reduction. Therefore, high thermal stresses appearing in the already solidified regions tend to reduce as moving closer to the melt pool. In addition, when scanning neighboring tracks, the previously scanned tracks are reheated, due to track overlap, and the residual stresses are thus released. Thin-walled structures exhibit high residual stresses after SLM processing, according to Neugebauer et al. 54 It is indicative that in the blades of an impeller, which are thin-walled structures, the stresses were found to be the highest over the whole part.
The effect of process parameters on residual stresses and distortion has been given great attention. Preheating has been found to lead to larger longitudinal compressive stresses divisions at the lower side of the part, which is connected to the supports, and also to larger deformations of the part in the negative z-direction. 79 Preheating was found to lead to higher tensile stresses by Krol et al. 16 High scanning speeds are reported to lead to distortion due to sudden drop of temperature versus time. 50 In SLS, according to Wang et al., 77 lower distortion in the final part can be accomplished with lower laser power. As described previously, scanning patterns have a significant effect on the temperature distribution history and therefore on the generation of residual stresses and distortion. The effect of two SLS scanning patterns in residual stresses and distortion was investigated by Ma and Bin 52 The two scanning patterns used were the “S” pattern and the fractal pattern as depicted in Figure 13. The results showed that the fractal pattern can offer smaller distortion due to more symmetrical temperature field compared to the “S” pattern. Matsumoto et al. 36 observed that when the neighboring track begins to solidify high tensile stresses appear between the solidified tracks at the side end of the solid part. This may lead to cracking of the layer. They also report that the amount of deflection caused by SLM increases as the laser track length increases and thus shortening the path may be used to prevent distortion. Cantilever beams are experiencing larger distortion when being built in the lengthwise direction than in the orthogonal direction, according to Neugebauer et al. 66
Melt pool characteristics
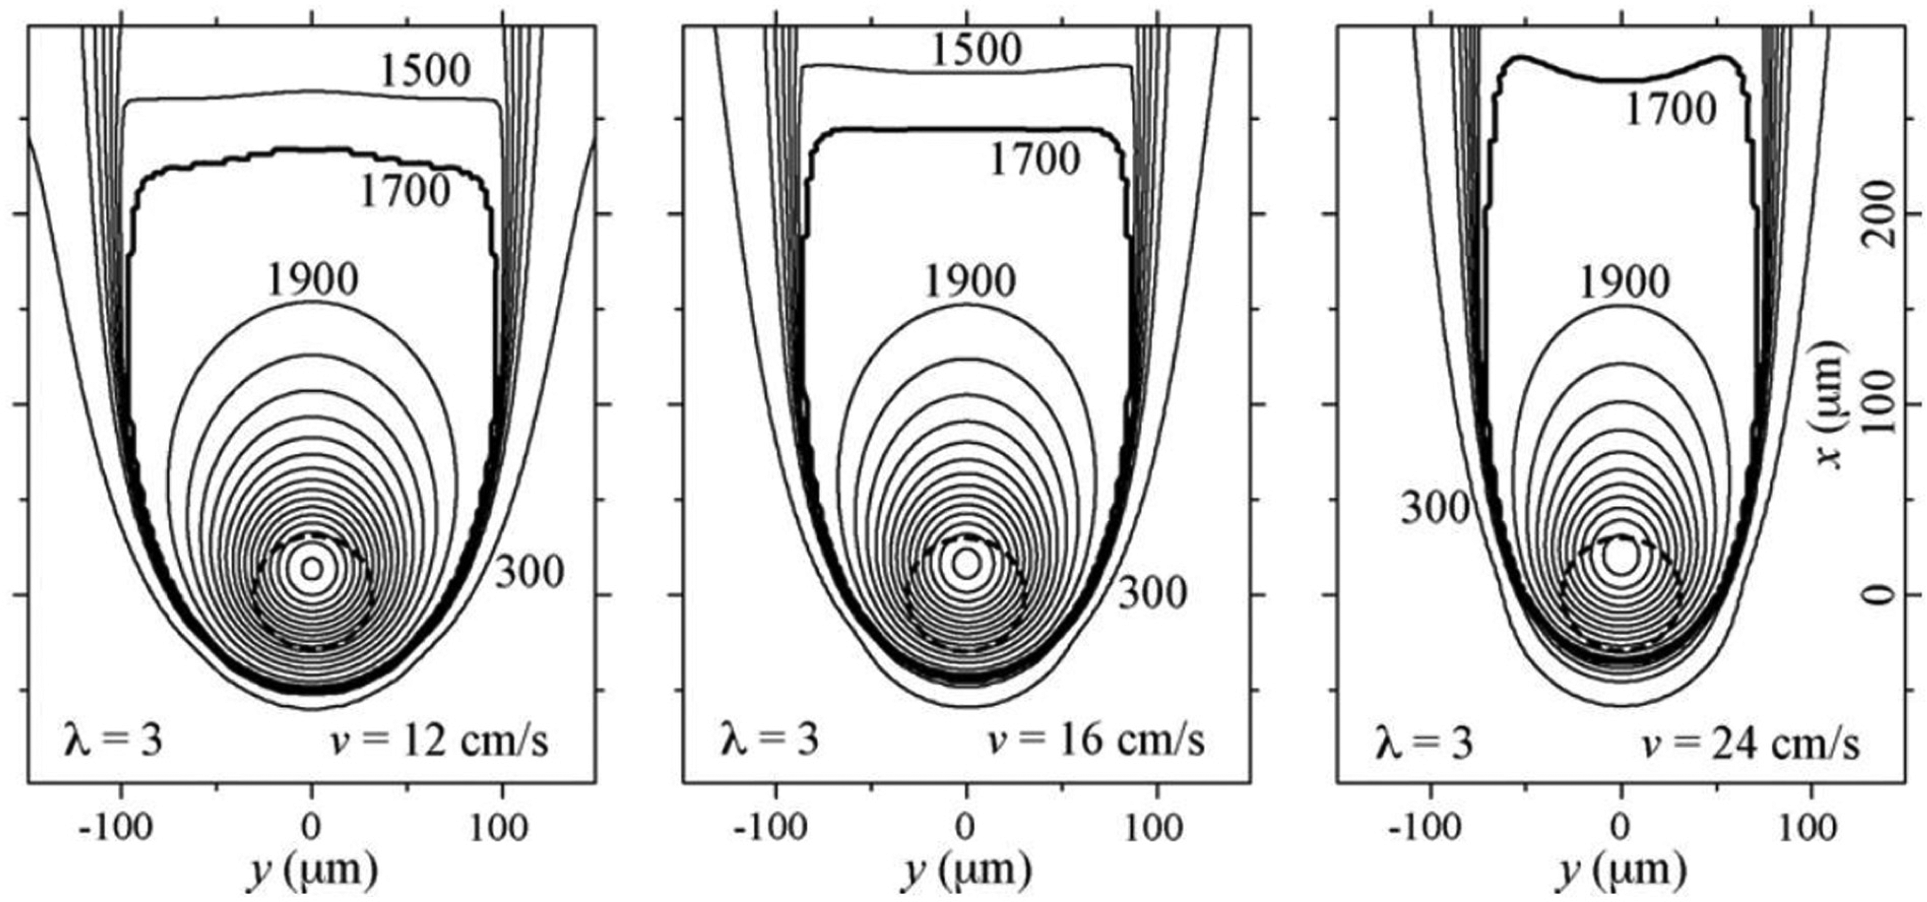
Melt pool dimensions are important for ensuring that a strong bonding between powder particles will be achieved. Bonding of the particles significantly affects the porosity and therefore the part quality. In addition, melt pool width and length should be thoroughly considered in the way they affect the already fabricated areas. Remelting of such areas may cause dimensional inaccuracies and loss of surface quality. The point with the highest temperature in the melt pool is named as “center of the melt pool.” It has been observed by various researchers that this point is not located at the center of the beam spot, as it is normally expected. It has been reported that the center of the melt pool is slightly displaced backward from the laser scanning direction.42,46,75 This displacement can increase as the beam power increases. 51 According to Yin et al., 42 the melt pool displacement can be attributed to the heat accumulation in the previously scanned area. This phenomenon is graphically presented in Figures 14 and 15. The melt pool with the surrounding area is eventually, as the beam scanning progresses, taking the shape of a comet tail as shown in Figures 14 and 16. The accumulated heat along with the higher conductivity of the melt zone leads to steeper thermal gradients in front of the melt pool.26,40,45 As a result, the isotherm curves that occur at the front end of the melt pool are denser than those at the back end, as reported by Zhang et al. 40 This can be easily observed in Figure 14. This phenomenon is claimed to be more intense, according to Li and Gu, 51 at lower scanning speeds.
Displacement of the melt pool center with respect to the laser beam. 75
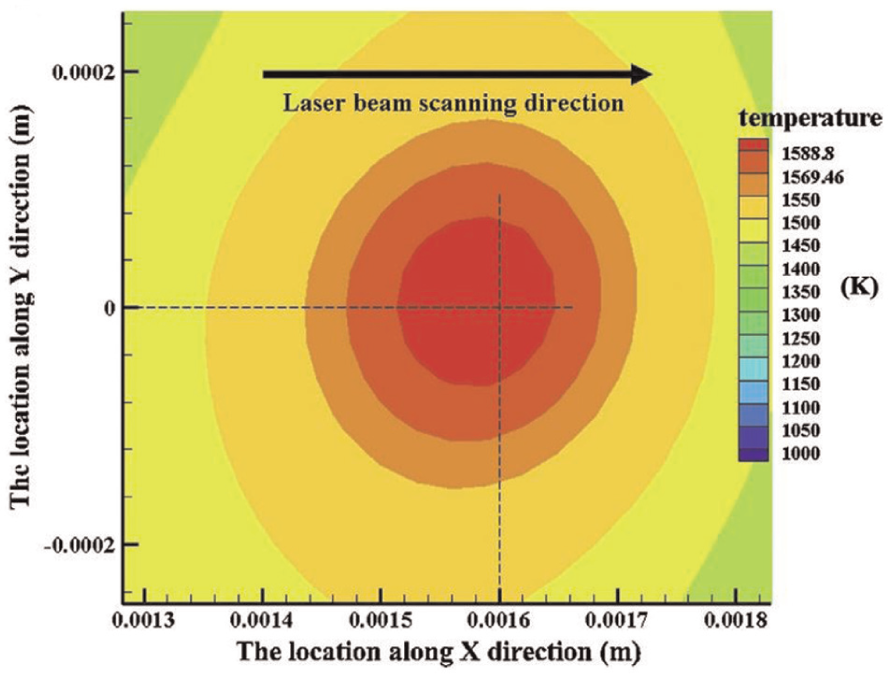
Center of the melt pool slightly displaced backward the scanning direction. 22
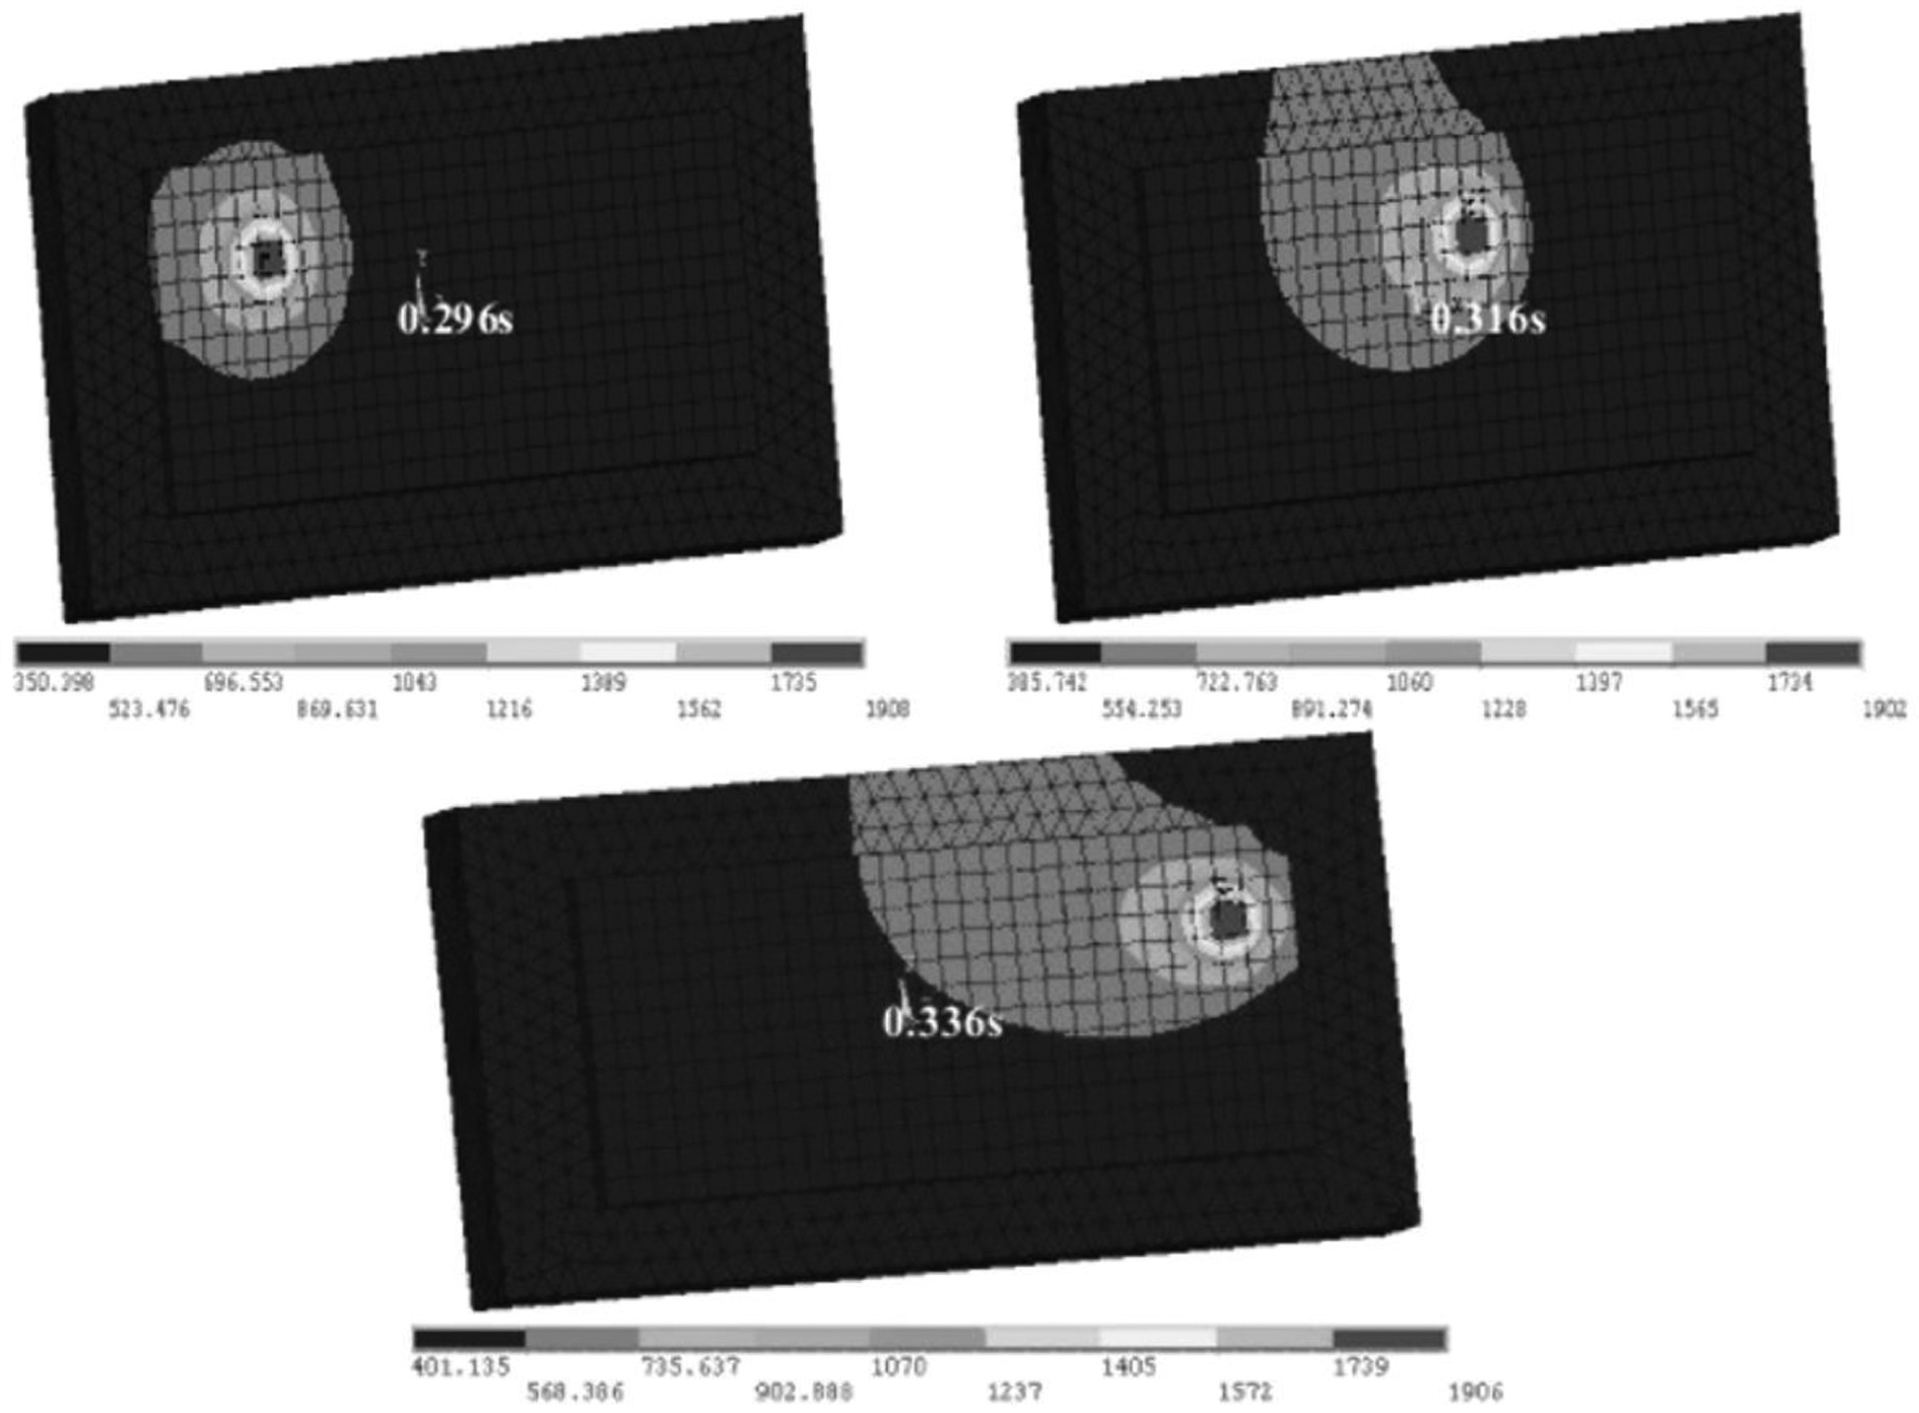
Melt pool shape evolution. 32
Several studies investigate how the melt pool characteristics are influenced by the process parameters. The length of the melt pool increases when the scanning speed increases.45,49,64,75 Hussein et al. 45 attribute this phenomenon to the lack of time for cooling of the molten regions. On the other hand, the melt pool width decreases with scanning speed and so does the depth,32,42,43,45,75,76 as the interaction of the beam with the material becomes shorter. A melt pool depth greater than the powder layer thickness is essential for proper bonding between powder particles and the subsequent quality of the part. 39 The increase of the beam power causes the melt pool width and length to increase.32,42,49,50 The depth of the melt pool also increases with beam power. 43 Generally, a larger melt pool is produced when increasing the power of the heat source. 51 The effect of power variation on the melt pool size is shown in Figure 17. The increase of the laser beam diameter, in SLS, causes the melt pool length and width to decrease.42,50 However, the decrease rate of the two values is not the same, with the width to be decreasing more rapidly, according to Yin et al. 42 The increase of the initial powder porosity leads to increased depth of the melt pool but decreased length. 47 The width does not seem to be affected. A longer, wider and deeper melt pool was observed by Shen and Chou, 47 when they represented the top layer as powder instead of solid material. The higher thermal resistance of the powder is causing this effect. Caution should be taken at the control of the melt pool temperature and depth. Whereas a deeper melt pool ensures proper bonding, the layer thickness should be adjusted properly in order to prevent over-melting of the top layer. 72 A lower melt pool length-to-width is achieved with decreased scanning speed, as reported by Zäh and Lutzmann. 71 At higher speeds, the length-to-width ratio varies significantly with the applied beam power and decreases when increasing the power. During their study, Zäh and Lutzmann 71 reached the conclusion that in order to prevent Plateau–Rayleigh instabilities, which are the root of “balling,” the length-to-width ratio should be kept under 2.1. Childs et al. 72 report that “balling” during single track SLM was observed when the length-to-width ratio exceeded a value in the range of 2.8–3.3. This range is close to a ratio of value π, which causes the Plateau–Rayleigh instability.
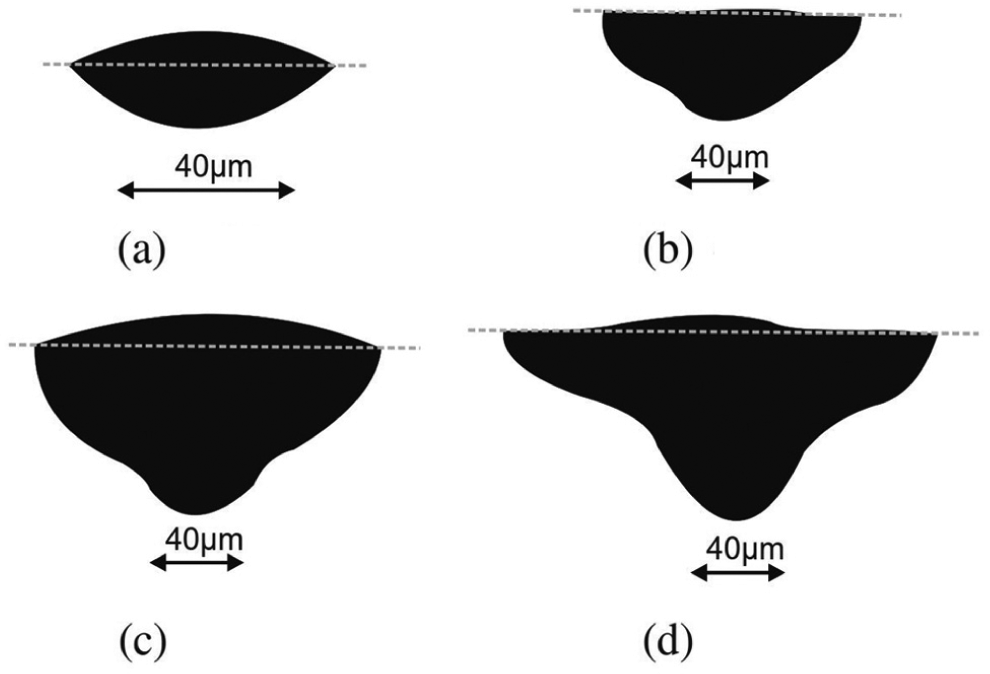
Melt pool dimensions change with beam power: 82 (a) 20 W (b) 40 W (c) 60 W and (d) 80 W.
Experimental validation
Some level of abstraction is used when developing process simulation models in order the computational time required to be realistic and feasible. 83 Thus, validation of the simulation model, through comparison with experimental results, is recommended. 16
The temperature history of a part during fabrication can be experimentally recorded using conventional measurement instruments such as thermographic cameras46,48,66 or thermocouples. 71 While thermocouples are measuring temperature only at the spots where installed, thermal cameras can provide a temperature distribution imaging, giving therefore more insight in the temperature field evolution. Raytheon™ infrared cameras have been used by Kolossov et al. 34 and Roberts et al. 31 to measure the temperature during SLM. In the case of Kolossov et al., 34 the camera was equipped with a spectral band pass filter with transmission between 3 and 5 µm and was calibrated using a pyrometer. The size of the image was approximately 2.8 × 2.8 mm2, having a resolution of 256 × 256 pixels. The frame rate was set at 10 frames per second (fps). Zäh and Lutzmann 71 utilized a thermocouple to measure the temperature evolution during EBM. In order not to interrupt the process sequence, the measuring device is attached to the build chamber from the reverse side of the platform. In fact, the temperature is measured slightly below, about 300 µm, the surface layer. A system combining an infrared thermometer and a thermocouple, as presented in Figure 18, was employed by Bai et al. 38 to measure temperature during SLS of polymer-coated molybdenum powder. The thermometer is used to measure the temperature of the powder surface, while the thermocouple is used for measurement of the inside temperature. Neugebauer et al., 66 for temperature field validation, used a novel temperature sensor, which is developed by Köhler et al. 84 and combines ratio pyrometry with 2D-resolved measurement.
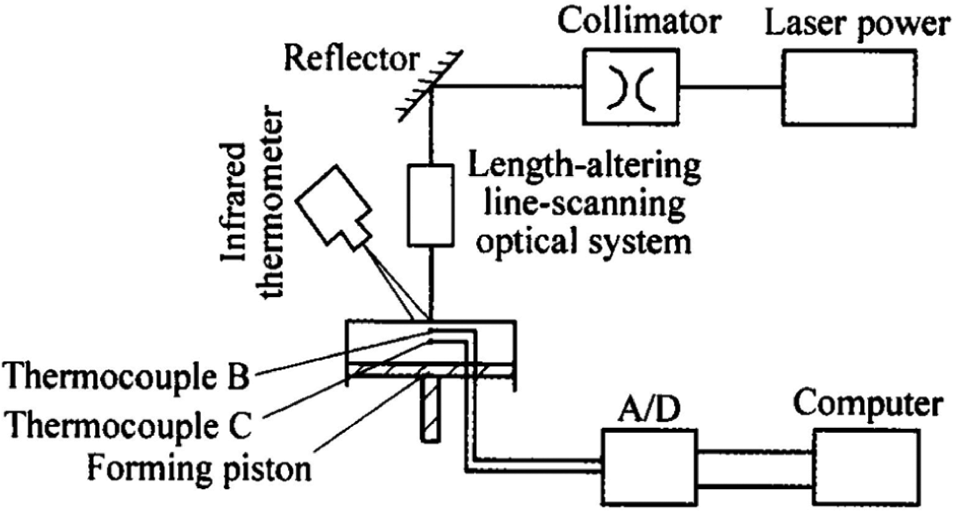
Infrared thermometer-thermocouple combined temperature measurement system. 38
For the experimental measurement of residual stresses, neutron diffraction is one of the most advantageous non-destructive methods so far. 85 Papadakis et al. 79 used neutron diffractometry to validate the residual stresses obtained by the numerical model. Eight measuring points along the same horizontal path on the cantilever beam were defined, while the experimental and numerical results were found to be in good accordance. Krol et al. 16 applied FEA in order to optimize support structures for AM parts. The STRESS-SPEC materials science diffractometer, which was developed by Hofmann et al., 86 was employed for the validation of numerical results. Zaeh and Branner 53 also utilized the STRESS-SPEC materials science diffractometer in order to measure residual stresses of SLM fabricated cantilevers.
In order to validate numerical results regarding melt pool dimensions, porosity, surface roughness and other microstructural characteristics, microscopy is employed. 75 Microscopy methods include optical microscopy (OM) and scanning electron microscopy (SEM). The cross-sections under investigation are first grinded and polished according to metallographic standard procedures. 51 Contuzzi et al. 35 used OM in order to calibrate and validate a numerical model for the SLM process. Measurements of width and depth of a single solidified track showed good agreement with the simulation results. Numerical results for a single track width and height produced with SLM were also compared with experimental results by Antony et al. 50 using SEM. Whereas width measurements were found to be in good agreement with the simulation results, it is reported that the simulated track height cannot capture height deviations occurring as the layer undergoes thermal shrinkage and densification. Good agreement between simulation and experimental results was also reported by Li et al., 32 when studying the effect of scanning speed into track width. The melt pool dimensions and the presence of “balling” were experimentally recorded by Childs et al. 72 using photography and video recording at a rate of 25 frames per second. The effect of processing parameters in the microstructure of SLM W-Ni-Fe parts was experimentally investigated by means of SEM in a study published by Zhang et al. 40 The simulation findings indicated that high temperature and longer irradiation time by the beam are required for the proper melting and solidification of tungsten, which is also validated by the experimental results. Song et al. 41 simulated SLM in order to obtain those process parameters that would minimize porosity in the fabrication of Ti6Al4V parts. The process parameters found by FEA were in good agreement with the experimentally found optimal parameters. Observing the porosity of the fabricated parts was performed using OM. Numerically found porosity of SLS parts was also validated against SEM observations by Liu et al. 49 Bonding between subsequent layers, which significantly affects porosity, was experimentally investigated by Li and Gu. 51 Experimental observations were conducted using a PMG3 optical microscope manufactured by Olympus and a Quanta 200 scanning electron microscope manufactured by FEI.
Challenges
FEA can prove a powerful numerical tool, which can be used to predict the mechanical performance of parts produced by AM and adjust the process parameters accordingly. As it can save money and time, if compared with conducting physical experiments, industrial practice can be benefited from the use of FEA in the product and process development phases. However, a significant number of obstacles appear when it comes to the full exploitation of FEA by industry for the purpose of optimizing AM processes.
Due to the transient nature of the analysis, computational costs remain quite high. From an industrial perspective, this prevents the application of FEA for on-line process optimization. Therefore, emphasis should be given to smart approaches that reduce modeling complexity without sacrificing accuracy. The simplest and most popular approach is applying a coarser mesh as moving away from the heat source, lowering the total number of elements. Another strategy employed in order to reduce computational effort is replacing the moving heat source with a heat flux applied simultaneously to the whole area of each deposition layer. 54 Less time steps are then required for reaching a solution. A large amount of computational time can be saved if using a steady-state analysis instead of a transient one, practically reducing the number of time steps to one. This approach was followed by Ding et al.,87,88 who achieved the steady-state transformation by attaching an Eulerian reference frame at the heat source, when simulating the wire and arc additive layer manufacturing (WAALM) process. According to the researchers, additional time can be saved, as using an Eulerian frame does not require as dense mesh as the typical transient approach does. The total thermo-mechanical analysis time saved was almost 80% of the transient analysis time.
Simulation, in general, has an inductive character, meaning that it should allow researchers to draw conclusions beyond the nature of the specific problem studied. At this point, AM simulation lacks transferability of results. This lack can be attributed to the great diversity in the modeling of the material properties and the assumptions followed and also to the limited understanding of the physics of the process.89,90 Regarding materials characterization and standardization, most of the advancements are coming from official sources. ASTM International 91 has created a committee devoted to AM, namely the F42, who have published a number of material specifications for AM. NIST, the National Institute of Standards and Technology, 92 has also began an initiative since 2013 for the characterization of AM materials. As far as it concerns the understanding of the physical mechanisms acting during the process, the studies utilizing the FEM, as those studied in this article, can only give a macroscopic insight and are mostly aimed at drawing quick but safe conclusions. Deeper understanding can be gained by studies that are modeling the material at the powder particle level and consider the effects of fluid flow at the melt pool and the gas–liquid–solid interactions. The LBM19,93 and the FVM 82 are methods commonly used in this type of studies, while other numerical methods such as the Monte Carlo-based ray tracing method 94 are more rarely used.
Commercial FEA tools, specialized to AM modeling and simulation, exist only at a limited extend regarding their capabilities. This weakens the position of FEA as a tool for the global industry. The reason is that highly qualified personnel is required in order to address the challenges of modeling an AM process and incorporate techniques such as “element birth and death” and “moving heat source” into the existing general-purpose FEA packages. The industrial needs for specialized software can be observed if looking at the welding simulation current situation. Welding, as a process with long tradition in the manufacturing domain and a vast number of different applications, can be simulated by dedicated welding simulation tools, such as the NX Weld Assistant 95 developed by Siemens PLM Software. The area of design for AM, including topology optimization, layer generation and STL file conversion has been covered by commercial solutions developed in the last years by well-established companies, such as Altair. 96 On the other hand, commercialization of simulation for AM processes is still at an immature stage. However, it must be mentioned that efforts being done for the integration of design and FEA modules provide a promising vision of the future. 97
In a more and more computer-enabled world, AM is the last step in a digital production chain. This is probably the main driver for its rising popularity. An holistic approach to all the stages from design to manufacturing is the current trend. CAD, computer-aided manufacturing (CAM) and computer-aided process planning (CAPP) are becoming integrated98–100 with special applications in AM.101,102 In this direction, it is essential that simulation of the process becomes part of this chain. Adjusting the process parameters based on design features and requirements or considering design modifications due to machinery limitations would be therefore possible, saving significant amounts of faulty parts. Taking into account the high computational demands and the extended geographical span of the modern manufacturing networks, deploying such an approach into a cloud-based architecture, as the one presented by Ari and Muhtaroglu, 103 using advanced algorithms for parallel processing as those proposed by Bangerth et al. 97 and Paszyński et al. 104 and exploiting the capabilities of knowledge management 105 can be the key factors for a successful implementation.
Conclusion
The latest studies in the finite element simulation of metallic powder bed additive processes are reviewed in this article. Those studies are summarized in Table 1 and are characterized according to the process and material studied, the modeling methodology and the experimental validation method used. In addition, the scope of each study is reported.
Summary of reviewed publications.

FEA: finite element analysis; SLS: selective laser sintering; SLM: selective laser melting; EBM: electron beam melting; SEM: scanning electron microscopy; OM: optical microscopy.
The following remarks can be concluded from the table mentioned above:
The majority of the simulation studies are focused on the SLM process, with the EBM given the least attention.
Steel is the material used in most of the studies.
Regarding the scope of the studies, the temperature field is what most studies target at. Melt pool characteristics seem to be given the least attention by researchers. However, other methods, such as the FVM, are more favorable in the study of the melt pool than FEM.
There are not many new experiments reported. A great number of researchers use previously published experiments in order to validate their simulation models.
Based on the above, strengthening the role of simulation in AM process optimization would require greater attention to be given in the development of models for processes other than SLM and models that consider materials for special applications, such as Inconel alloys. Furthermore, a solid experimental base should be created, in order to be used as a reference point for future simulation studies.
Regarding the simulation results of the studies reviewed in this article, conclusions can be drawn as follows. The fabricated part undergoes similar temperature cycles at every scanned region, except its edges. However, the upper layers tend to reach higher temperatures than the bottom layer which is in contact with the base plate. The bottom layer itself experiences a slight temperature increase as more layers are added, with this fact implying the need for cautious consideration of the slicing strategy and the total number of layers. The major temperature gradients, developed during the process, are those in the z-axis between the top layer and the substrate. As a result, 3D models should be preferred to 2D ones for obtaining accurate results. Process parameters have a significant impact in the temperature history of the part. The maximum temperature in the part has been observed to increase with the laser power and decrease with the scanning speed. The same observations were also made for the maximum temperature gradient. The maximum temperature was also found to increase when lowering the spot diameter of the heat source and when preheating the process chamber. Residual stresses and distortion play a significant role in the structural integrity and the quality of the fabricated part. High tensile stresses are observed at the top layer and high compressive stresses at the interface between the part and the substrate. Thin-walled structures are exhibiting high residual stresses. In SLS, residual stresses have a little effect on distortion, which is mainly caused by transient thermal stresses during processing. Distortion can be prevented by applying lower scanning speeds, lower power at the heat source and suitable scanning strategies that utilize shorter paths. The melt pool dimensions and shape are strongly influencing the bonding between the scanned region and the already solidified regions. The center of the melt pool is displaced backward the scanning direction, while its shape is taking the form of a comet tail as the process evolves. Steeper thermal gradients are observed at the front of the melt pool than in the back. The melt pool length increases with the scanning speed and the beam power and decreases with the beam diameter and the initial powder porosity. The melt pool width and depth have been found to decrease with the scanning speed and the beam diameter, while they increase with the beam power. Generally, the melt pool dimensions depend on the interaction time with the beam and the rate of energy input. The length-to-width ratio, which is critical for the development of Plateau–Rayleigh instabilities and the subsequent propagation of the “balling” effect, has been observed to increase with the scanning speed and decrease with the beam power. As described in this study, process parameters have a significant impact on the quality of the final part in terms of residual stresses, distortion and porosity. However, determining the process parameters can also be influenced by other factors such as productivity, energy consumption and manufacturing costs. Thus, the selection of the optimal process parameters should be dealt as a multi-dimensional problem.
The FEM has proven valuable in the simulation of AM for metallic parts. By understanding the nature of the process and predicting the effect of process parameters into the mechanical characteristics of the final part, the process can be adjusted and optimized in order to produce right first time parts at greater rates. Scrap rates and faulty parts can thus be reduced leading to more eco-friendly and cost-effective production. However, there are still issues that need to be addressed. Long computational times do not allow for on-line process optimization based on FEA. In addition, transferability of simulation results to different case studies is limited. A common ground in material properties modeling is hard to be found between different researchers of the field. Furthermore, specialized software for AM simulation is limited only to product design solutions, with the area of process simulation being at its very first stages of development. Finally, the total shift of manufacturing to a web and cloud-enabled paradigm is fueling the integration of FEA tools with other digital manufacturing tools in order to serve the needs of today’s global manufacturing networks.
Footnotes
Appendix 1
Declaration of conflicting interests
The authors declare that there is no conflict of interest.
Funding
This research received no specific grant from any funding agency in the public, commercial or not-for-profit sectors.