
Abstract
Edge effect is unavoidable in polishing process when the polishing pad passes by the workpiece edge, which influences the entire form accuracy of free-form surfaces of optical components in computer-controlled polishing, or even reduces their effective aperture. This article focuses on a theoretical and experimental investigation into the material removal influenced by edge effect for polishing along a certain path. The contact pressure distribution models for polishing the workpiece edge are summarized and modified into four representative models: linear model, skin model, linear skin model and divided skin model, which are adopted to calculate the theoretical material removal profiles orthogonal to the straight or curved polishing path, in this article. So, the material removal models are built in the process of polishing along tool path instead of polishing on a single point. And experiments are carried out to choose the most suitable contact pressure distribution model according to the comparison of experimental profiles and the different theoretical profiles. Experimental results reveal the influences of edge effect on material removal and a modified parameter is introduced into the theoretical material removal profile for the curved path to coincide with the experimental profile better. In addition, some qualitative analyses about how to reduce the edge effect are also given in this article.
Introduction
Polishing is usually applied for fabrication of precise aspheric and non-geometric optical lens and molds and essential to the quality and duration of the part surfaces. The final finishing of most aspheric optical lens and molds can be realized by computer-controlled polishing. 1 In recent years, there have been a lot of literatures about the computer-controlled polishing system,2–5 the modeling of material removal process,6–9 the material removal mechanism,10,11 the planning of polishing path12–15 and the process control of surface roughness. 16
The modeling of material removal rate in the polishing process is usually based on Preston equation, which demonstrates that the material removal is proportional to the sliding velocity, contact pressure and dwell time. 17 Based on Preston equation, some scholars establish the material removal model by assuming that the contact pressure distribution is Gaussian,8,18 and some scholars regard the contact as Hertzian contact when modeling the material removal and discover that the material removal is influenced by the curvature radius of surface and rotational speed.10,19 The above-mentioned material removal models can only be applied to the process of polishing on a single point. But the polishing tool is usually moving along polishing paths at a certain feed rate. So, it makes more sense that the material removal model suitable for a single point polishing is extended to the material removal model along the polishing path considering the effect of feed rate.
When the polishing pad passes by the workpiece edge with constant normal polishing force, the edge collapse would appear because the contact pressure increases due to the decrease in contact area. This phenomenon may increase surface error and lead to adverse impact on processing efficiency, consistency of surface error and effective aperture of optical components, which influences the resolution and focusing capability of optical system. In order to realize deterministic material removal along the planned path when the workpiece edge is polished, it is necessary to reduce or avoid the influence of edge effect on the workpiece surface. There have been some papers about the edge effect in polishing. Wagner and Shannon 20 assume the pressure distribution is linear when establishing the material removal model in the regions of workpiece edge. But if the polishing pad center is near the workpiece border, the linear pressure distribution may not be maintained because the minimum pressure would be negative. Luna-Aguilar et al. 21 discuss two different pressure models in the case that a square tool polishes a glass edge along straight lines. One is a binomial distribution pressure model, with which the negative pressure can be avoided, but pressures at the glass border may be infinite. The other is a skin distribution pressure model. For this model, the pressure in the skin zone is divided into a binomial distribution pressure part and a constant pressure part, which is significantly higher than that in the other region where the pressure is constant. Cordero-Davila et al. 22 adopt the skin pressure distribution model to investigate the edge effect when using a circular pad to polish a circular workpiece. Compared with Luna-Aguilar’s assumption, the pressure in the skin zone is constant. Han et al. 23 divide the contact area into a constant pressure region and a linear pressure region, and give an expression between the width of constant pressure region and that of linear pressure region. The correctness of this model is verified by polishing experiments. But all the above-mentioned material removal models influenced by edge effect are only built under a certain kind of contact pressure distribution for polishing on a single point. Also the influence of polishing path is not considered in those papers. In this article, some different theoretical material removal models influenced by the edge effect are built by adopting those pressure distribution models and some modified pressure distribution models for polishing along tool path and are also compared with corresponding experimental material removal models to choose the most suitable pressure distribution model. In addition, the analysis about edge effect for straight and curved paths is also conducted in this article.
In section “Modeling of material removal influenced by edge effect,” the material removal profiles adopting the various contact pressure distribution models are presented for straight and curved paths. The theoretical material removal profiles are compared with the experimental profiles to determine the suitable contact pressure distribution model in section “Simulation and polishing experiments for edge effect.” And some qualitative analyses about how to reduce the influence of edge effect are given in section “Discussion about reducing edge effect.” Some findings are summarized in the concluding section.
Modeling of material removal influenced by edge effect
Figure 1 shows the schematic diagram of polishing at the edge of free-form surface. Point P is an arbitrary point on the tool path. Frame oxyz is a Cartesian coordinate frame centered at P and fixed to the part surface. And y-axis is tangent to the tool path and z-axis is normal to the surface at P, while the plane oxy is a tangent plane at P. When the polishing pad is pressed against the workpiece, a contact area in a certain shape is formed. And the material removal is caused in the contact region when the rotating polishing pad moves along a planned path as illustrated in Figure 2. As shown in Figure 2, points o and H are the center point of contact region and an arbitrary point on the x-axis with an infinitesimal area dxdy, respectively.
The schematic diagram of polishing at the edge of free-form surface.
Contact region of polishing along a path.
Contact pressure distribution
Some contact pressure distribution models are presented in previous works.20–23 The force equation in conjunction with the torque equation for static equilibrium is used to determine the pressure model. The force and torque equilibrium equations are given as follows

where f 0 is an external force applied on the workpiece including the gravitational force, P(x, y) is the pressure distribution and A is the contact area between polishing pad and workpiece.
Linear model
Wagner and Shannon 20 give the linear pressure distribution model as shown in Figure 3.
Linear pressure distribution model.
The linear pressure distribution can be expressed by

where P 0 is the pressure at the internal edge of the tool, P 1 is the pressure at the workpiece border, b is the radius of the tool and d is the outside distance from workpiece border to tool border.
The following equation is obtained by substituting equation (2) into equation (1)
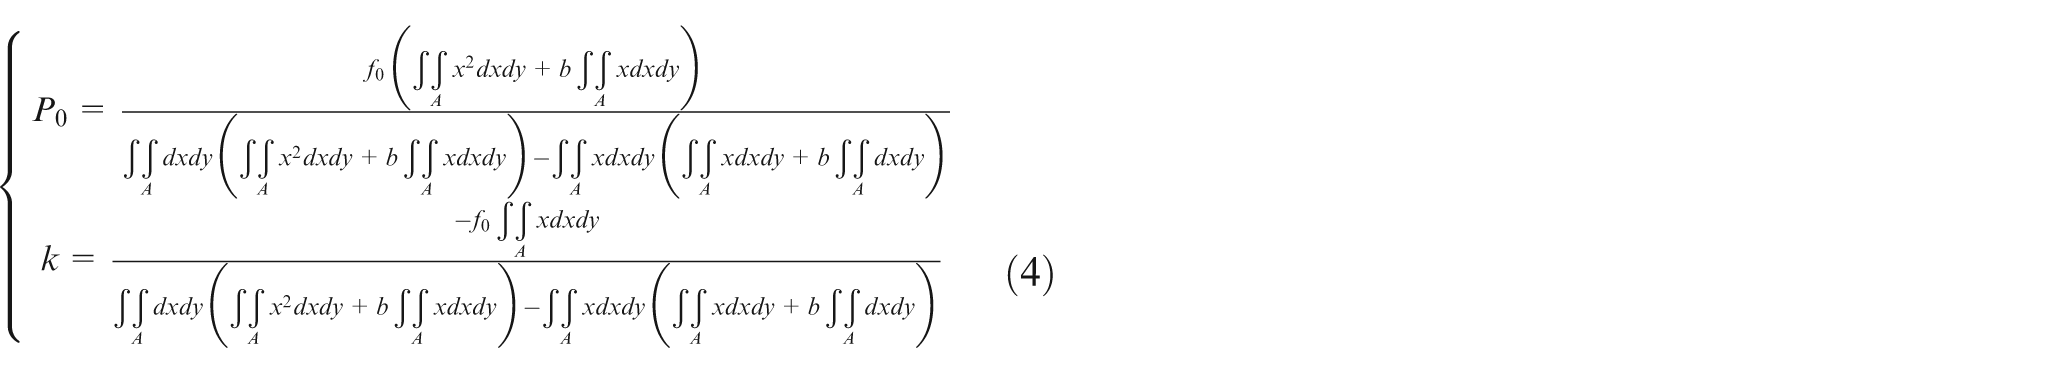
Equation (3) can be solved for P 0 and k as
Skin model
Some researchers divide the contact area A into two zones B and C as shown in Figure 4 and each of them has a constant pressure. The pressure in region B is P 0 and the pressure in region C is P 0 + ΔP as shown in Figure 5. 22 The zone C is named as skin zone.
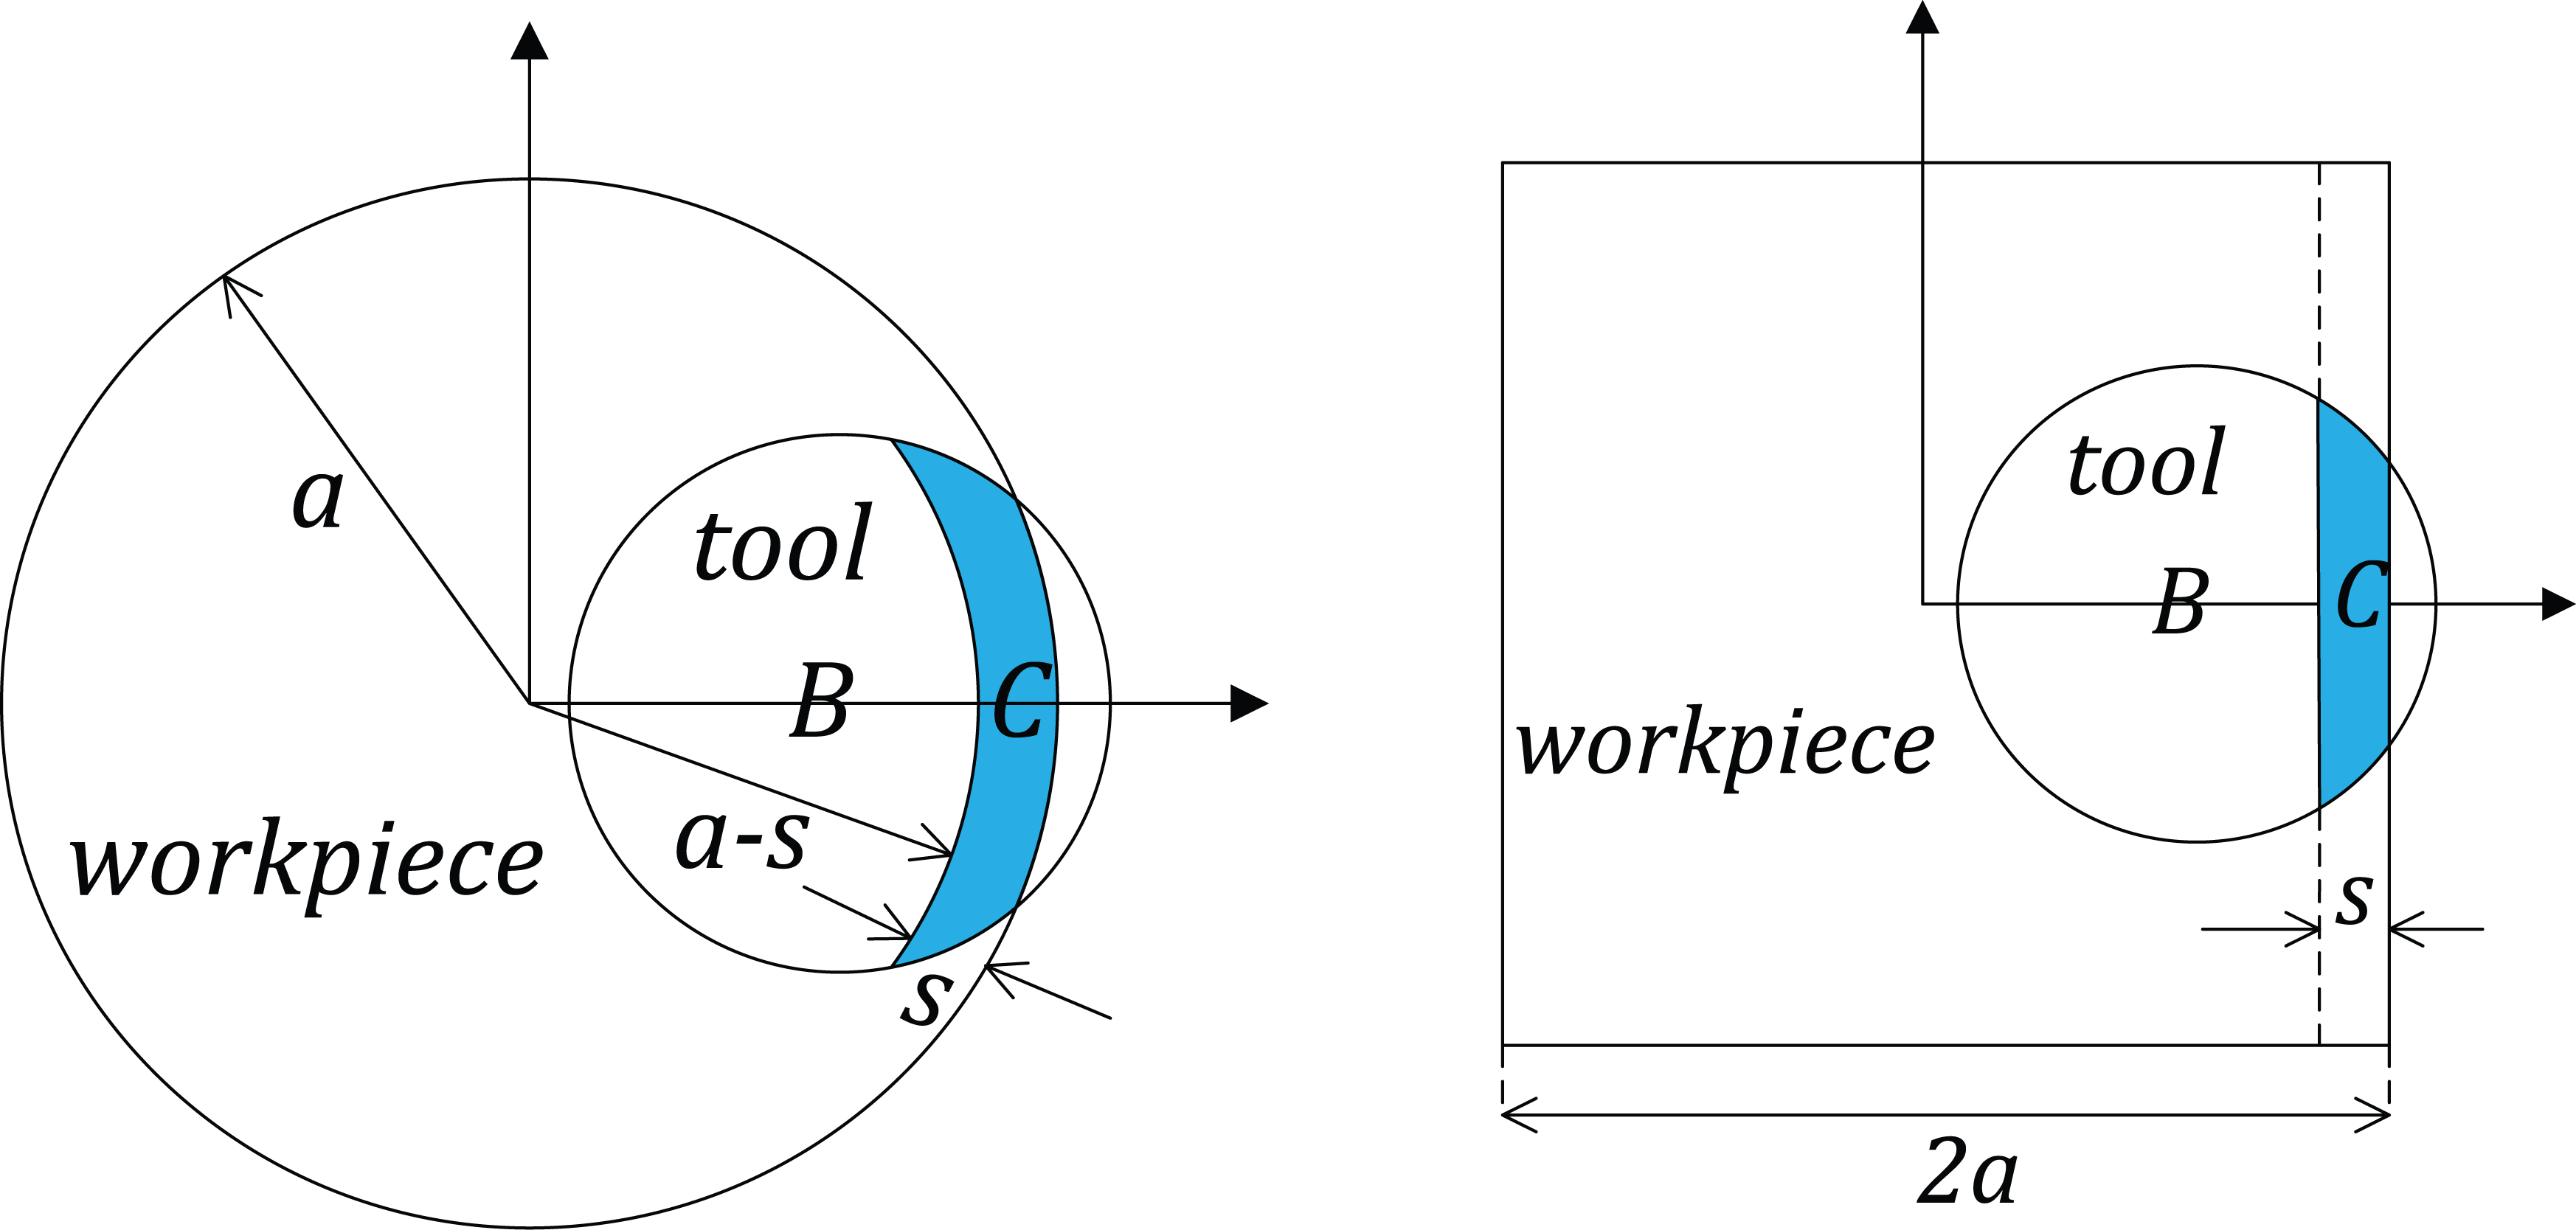
Divided contact area.
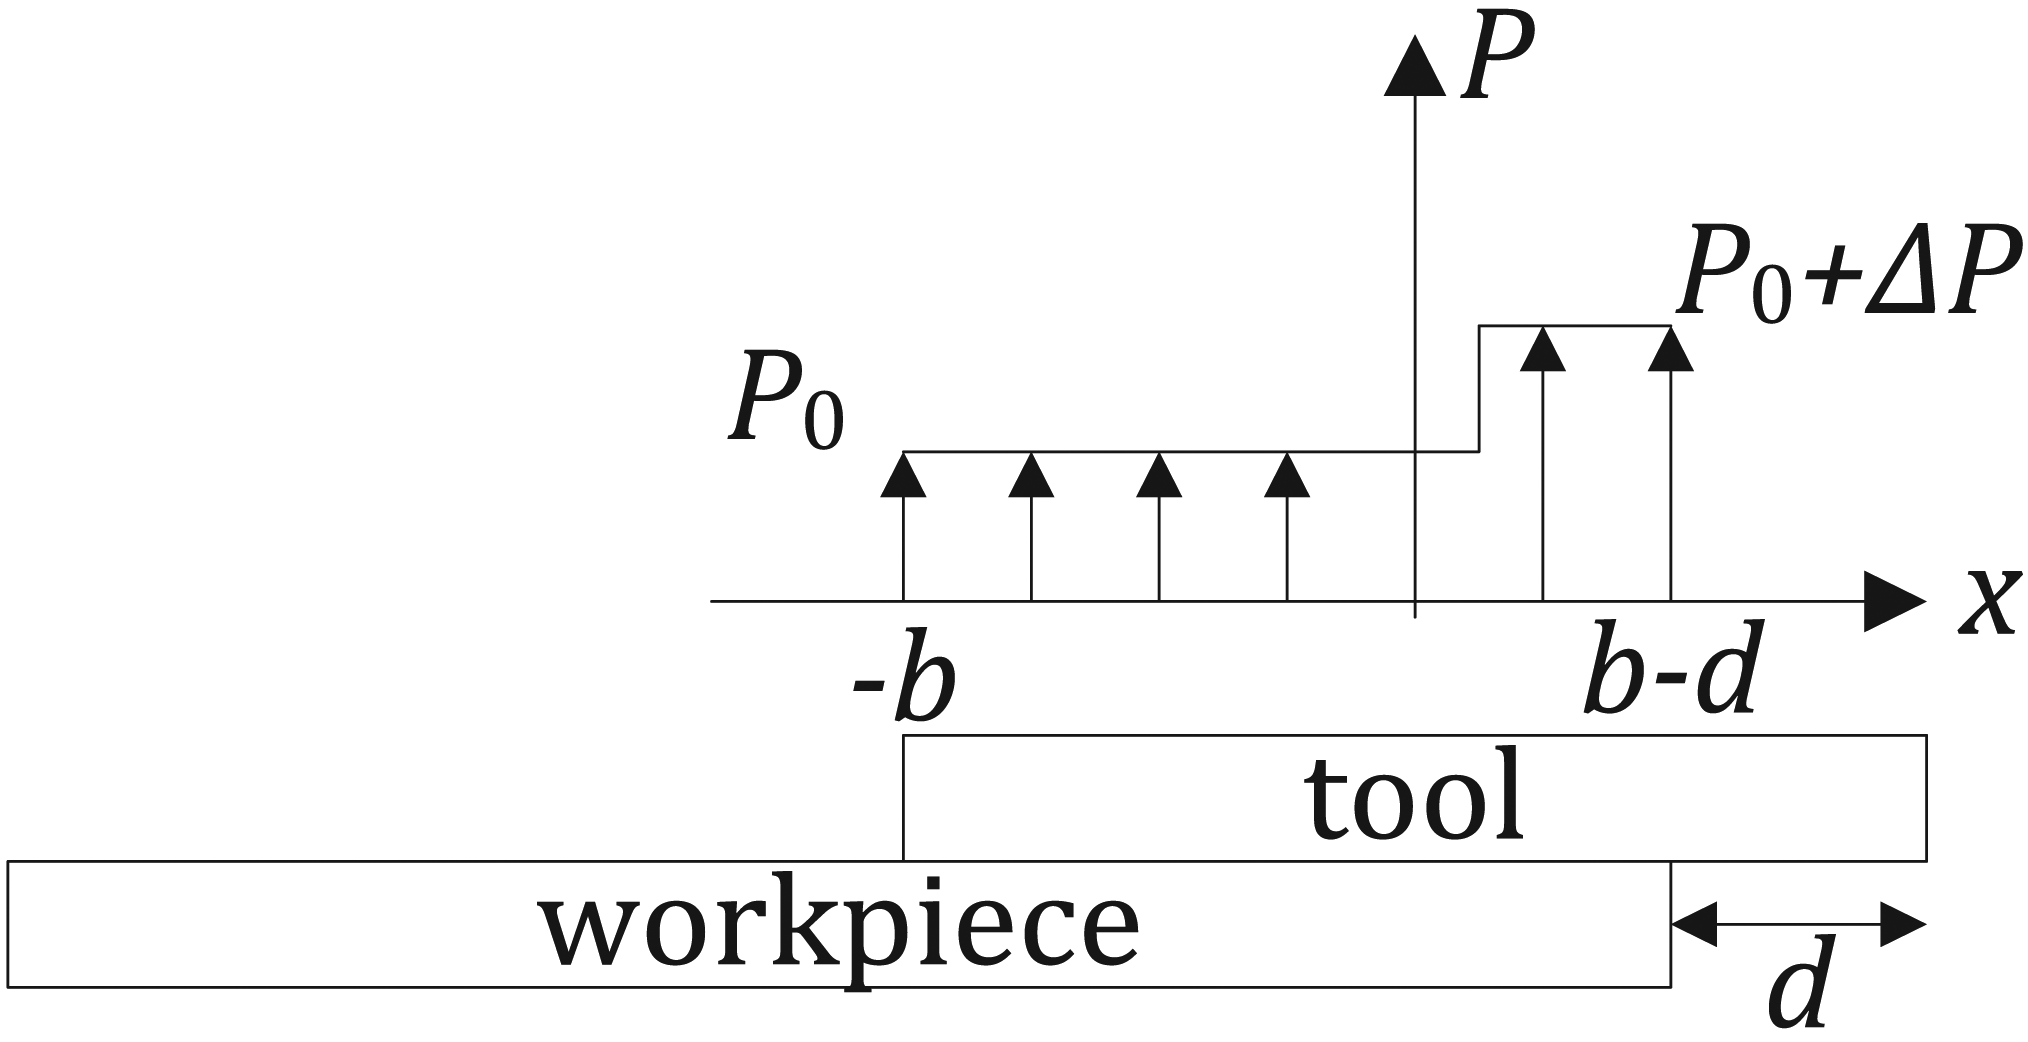
Skin pressure distribution model.
The skin pressure distribution model can be expressed as

The skin width s, the outside distance d and the radius of the polishing pad b have to satisfy the relational expression by

Substituting equation (5) into equation (1) yields
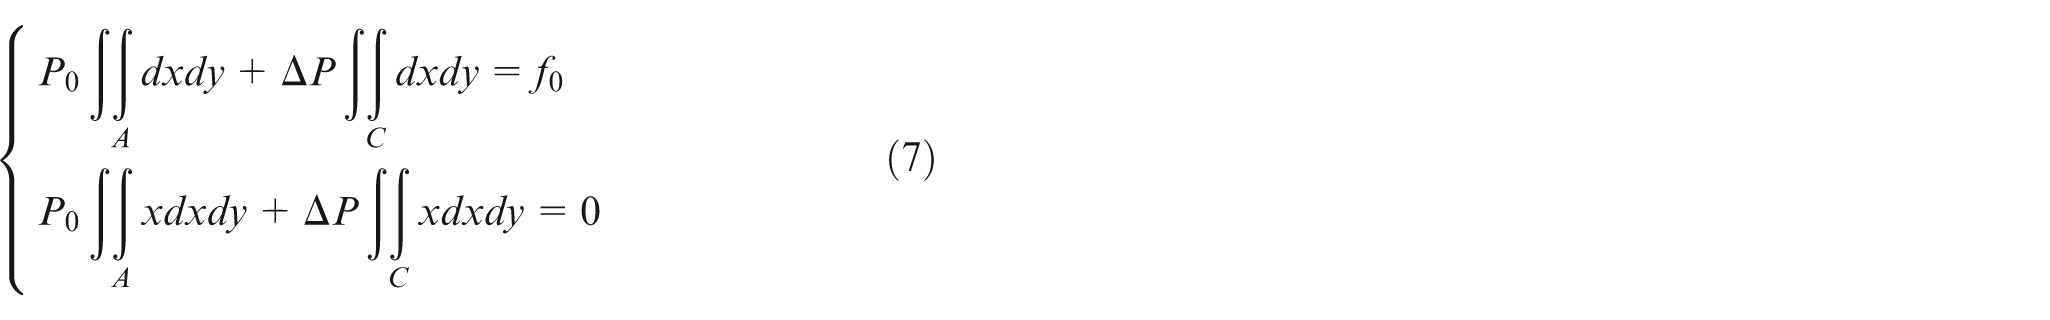
Equation (7) can be solved for P 0 and ΔP as
Linear skin model
In this article, a linear skin model is presented as shown in Figure 6. The contact area A is also divided into two areas B and C as mentioned in subsection “Skin model.” But the difference lies in that the pressure in skin zone C varies linearly with the distance to the center of polishing tool.
Linear skin pressure distribution model.
And the linear skin pressure distribution model can be expressed as
where M = b − d − s.
Substituting equation (9) into equation (1) gives
Equation (10) can be solved for P 0 and k as
Divided skin model
This article also presents a divided skin model for contact pressure as shown in Figure 7, in which the contact area A is divided into two areas B and C as skin model and linear skin model. But the skin region C is divided into two regions C 1 and C 2. The widths of region C 1 and region C 2 are a 1 and a 2, respectively. The pressure in region C 1 varies with the outside distance and the pressure in region C 2 is a constant value P 1.
Divided skin pressure distribution model.
And the distribution model can be expressed as
with
Substituting equations (12) and (13) into equation (1) yields
Equation (14) can be solved for P 0 and ΔP as
Relative sliding velocity
Relative sliding velocity between the polishing pad and the workpiece is one of the process parameters, which affect the material removal. The relative sliding velocity for polishing along a straight path and a curved path is discussed and derived, respectively, in this article.
Relative sliding velocity for polishing along a straight path
Figure 8 illustrates the relative sliding velocity within the contact region for polishing along a straight path. The shaded part represents the non-contact region of the polishing pad extending outside of workpiece. Rp represents the radius of contact area. The outside distance d remains unchanged in the polishing process. The feed direction of the polishing pad is parallel to the y-direction.
Relative sliding velocity for polishing along a straight path.
For an arbitrary point M (x, y) on the contact area, the feed rate is va and the velocity vm due to the rotation of polishing pad can be given by

where ωp is the angular speed of the rotational polishing pad.
The relative sliding velocity vs at point M is the resultant of va and vm and is expressed as
with

Relative sliding velocity for polishing along a curved path
Figure 9 shows the relative sliding velocity within the contact region for polishing along a curved path. The curvature center of the curved path is indicated by point O. The radius of curvature of the curved path is R. The shaded part represents the non-contact region of the polishing pad extending outside of workpiece. The outside distance d remains unchanged in the polishing process.
Relative sliding velocity for polishing along a curved path.
For the convenience of analysis, the coordinate transformation is carried out for the arbitrary point M (x, y) from the Cartesian coordinates in the frame xoy to the polar coordinates in the frame XOY

In this case, the relative sliding velocity at M (x, y) is similar with the research by Fan et al., 24 which can be expressed by
with

where va is the feed rate of the polishing pad along the curved path, vm is the rotational velocity of the polishing pad and δ is the included angle between va and vm. ωp indicates the angular speed of the rotational polishing pad and ωq indicates the angular speed of the polishing pad moving along the curved path.
Material removal profile
According to the previous works,25–28 the material removal profile orthogonal to the tool path at o as illustrated in Figure 2 can be obtained by integrating the material removal index along the straight path indicated by line L 1 L 2 in Figure 8 or along the curved path indicated by arc L 1 L 2 in Figure 9, that is

or

And the material removal index wh /l can be expressed by

where kabr is a dimensionless wear constant, Hv is the hardness of the workpiece, P is the normal pressure at H, vs is the relative sliding velocity between the polishing pad and H, and va is the feed rate. θ 1 and θ 2 are the polar angles corresponding to point L 1 and point L 2 in the polar coordinate system, respectively.
Material removal profile orthogonal to the straight path
As shown in Figure 8, y 1 and y 2 in equation (22) can be obtained by
By substituting equations (2), (17) and (25) into equation (22), the material removal profile adopting linear pressure distribution model can be calculated as
By substituting equations (5), (17) and (25) into equation (22), the material removal profile using skin pressure distribution model can be calculated by
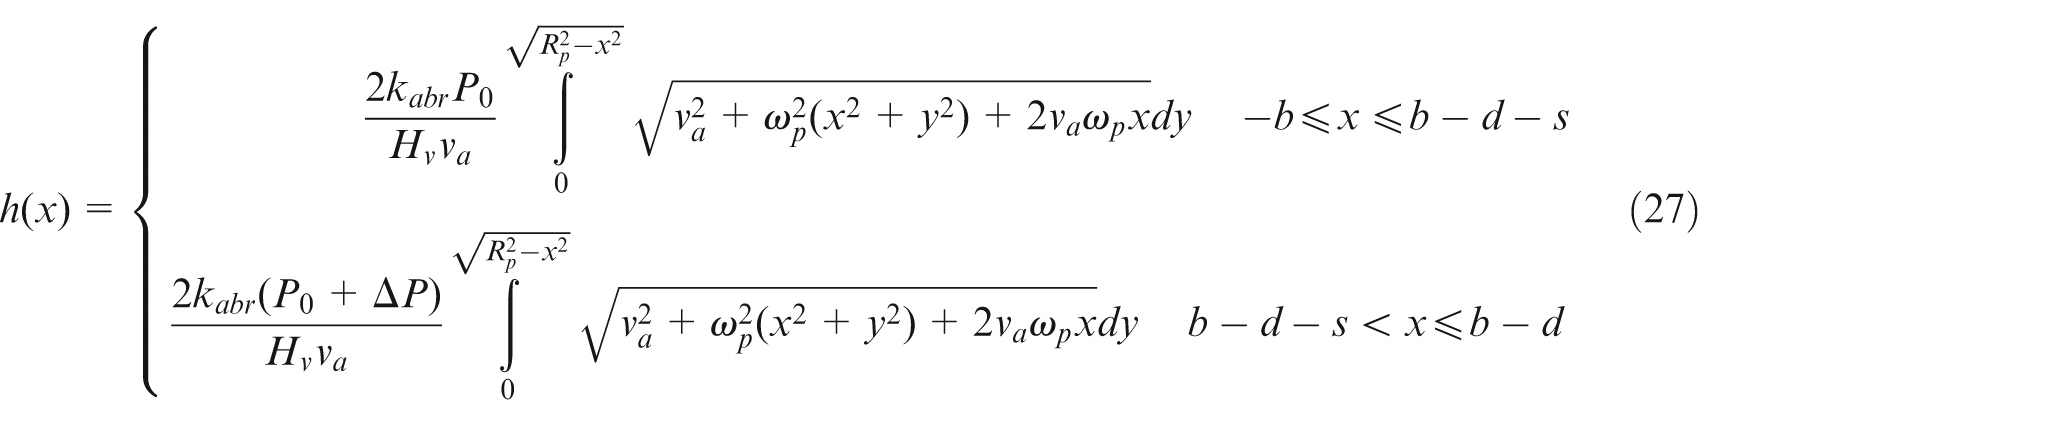
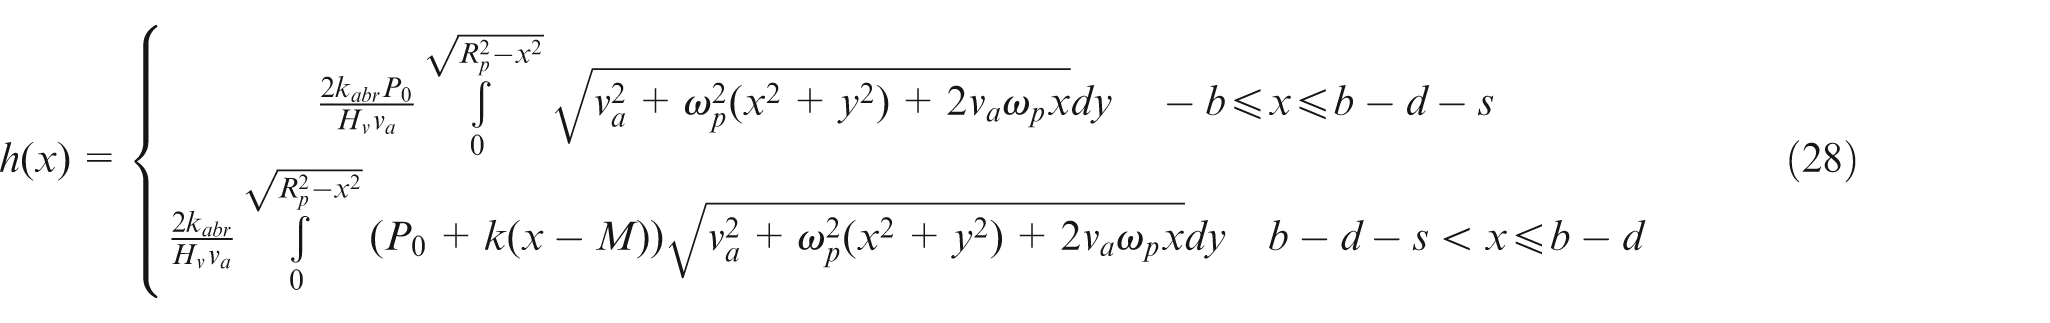
By substituting equations (9), (17) and (25) into equation (22), the material removal profile adopting linear skin pressure distribution model can be expressed as
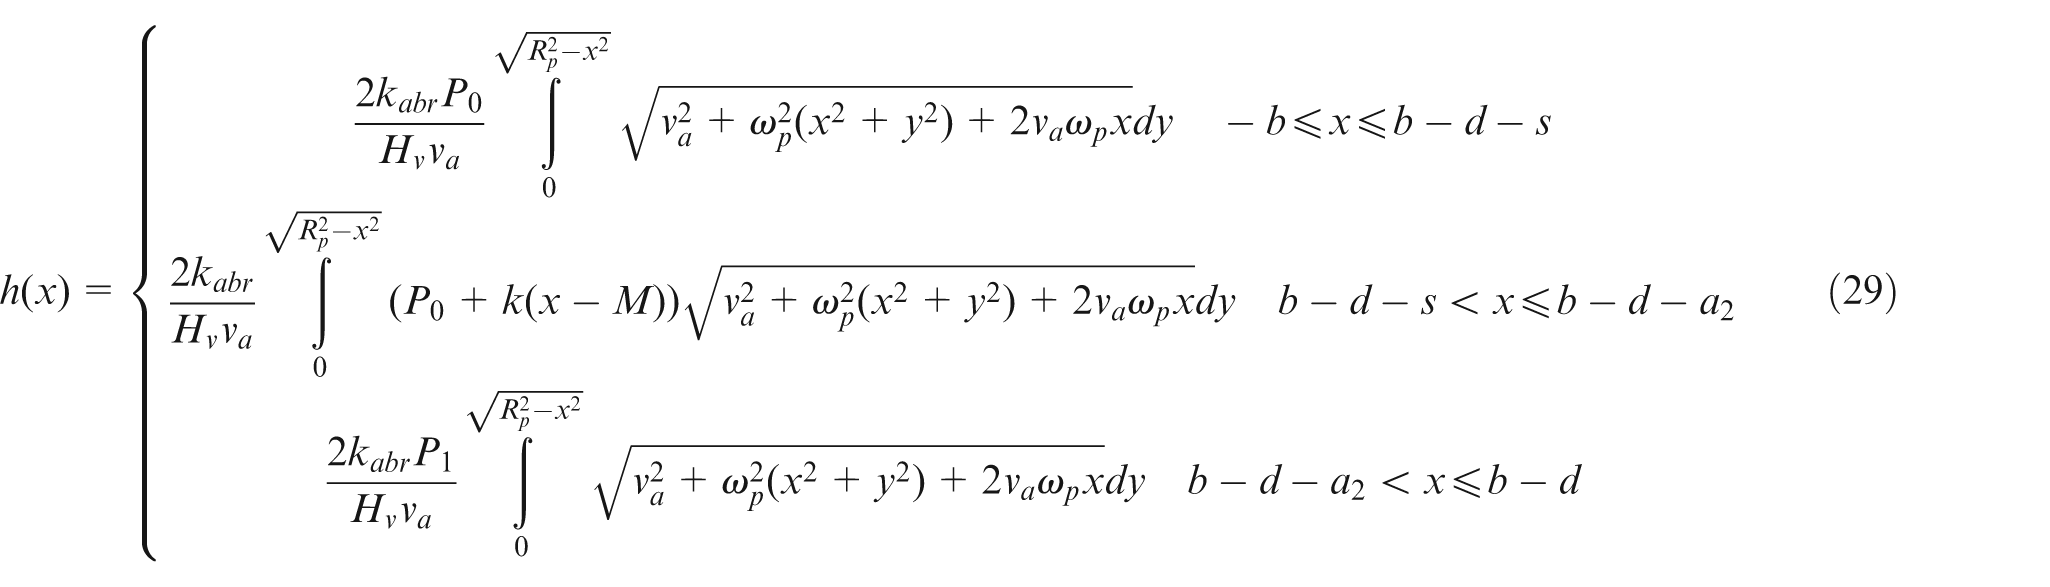
By substituting equations (12), (17) and (25) into equation (22), the material removal profile using divided skin pressure distribution model can be expressed by
Material removal profile orthogonal to the curved path
As shown in Figure 9, the circular contact region can be described in the frame xoy as

Substituting equation (19) into equation (30) yields

Then

And there is only one solution of

with the bounding values ρmin = R − Rp and ρmax = R + Rp − s.
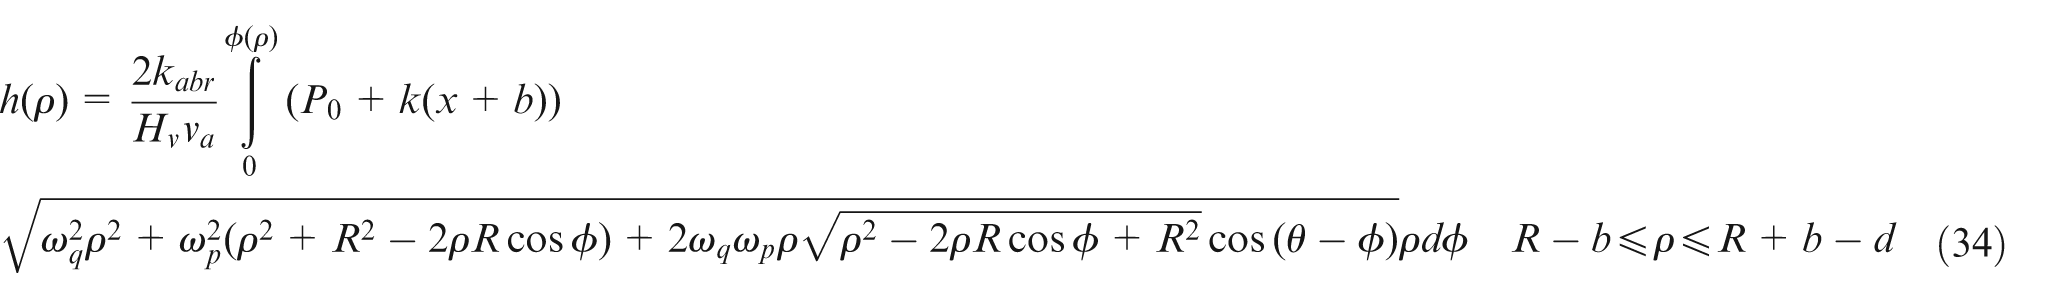
By substituting equations (2), (20) and (33) into equation (23), the material removal profile adopting linear pressure distribution model can be calculated as
By substituting equations (5), (20) and (33) into equation (23), the material removal profile using skin pressure distribution model can be calculated by
By substituting equations (9), (20) and (33) into equation (23), the material removal profile adopting linear skin pressure distribution model can be expressed as
By substituting equations (12), (20) and (33) into equation (23), the material removal profile using divided skin pressure distribution model can be expressed by
Simulation and polishing experiments for edge effect
In order to choose the suitable contact pressure distribution for modeling of material removal when the edge effect is considered, a series of polishing experiments are carried out with a force-controlled polishing tool which is mounted on a five-axes polishing machine consisting of three translation axes (X-axis, Y-axis and Z-axis) and two rotational axes (B-axis and C-axis) as shown in Figure 10. The workpiece is fixed on a rotational table. A piezoelectric force sensor (Interface, LW1238) with the accuracy of ±1% and the maximum range of 100 N is mounted on the end of polishing spindle with adjustable speed from 0 to 4000 r/min to control the normal polishing force. And the measured force signal passes to the computer through the amplifier and data acquisition card that can also do help to the filter of the high-frequency noise. According to some debugging experiments, this set-up makes the polishing tool move along a straight path or curved path with a varied polishing force from 8 to 20 N at a given feed rate. The workpiece material is aluminum with Vickers-hardness of 60 MPa. The polishing pad is made of polyurethane and a polishing cloth (TROJAN, USA) is sticked to the polishing pad. The radius of the polyurethane pad is 5 mm. The diamond abrasives are used with the mean diameter of 1 μm. Form Talysurf PGI 810 (Taylor-Hobson Ltd., UK) is used to measure the material removal profile by moving its stylus along a line perpendicular to the polishing path. And the measurements are carried out under the waviness mode with the sampling length of 0.8 mm to filter out the high-frequency noise of the measured profiles, which are presented from Figures 11–16.
Photos of polishing machine and polishing tool: (a) polishing machine with five axes and (b) force-controlled polishing tool.
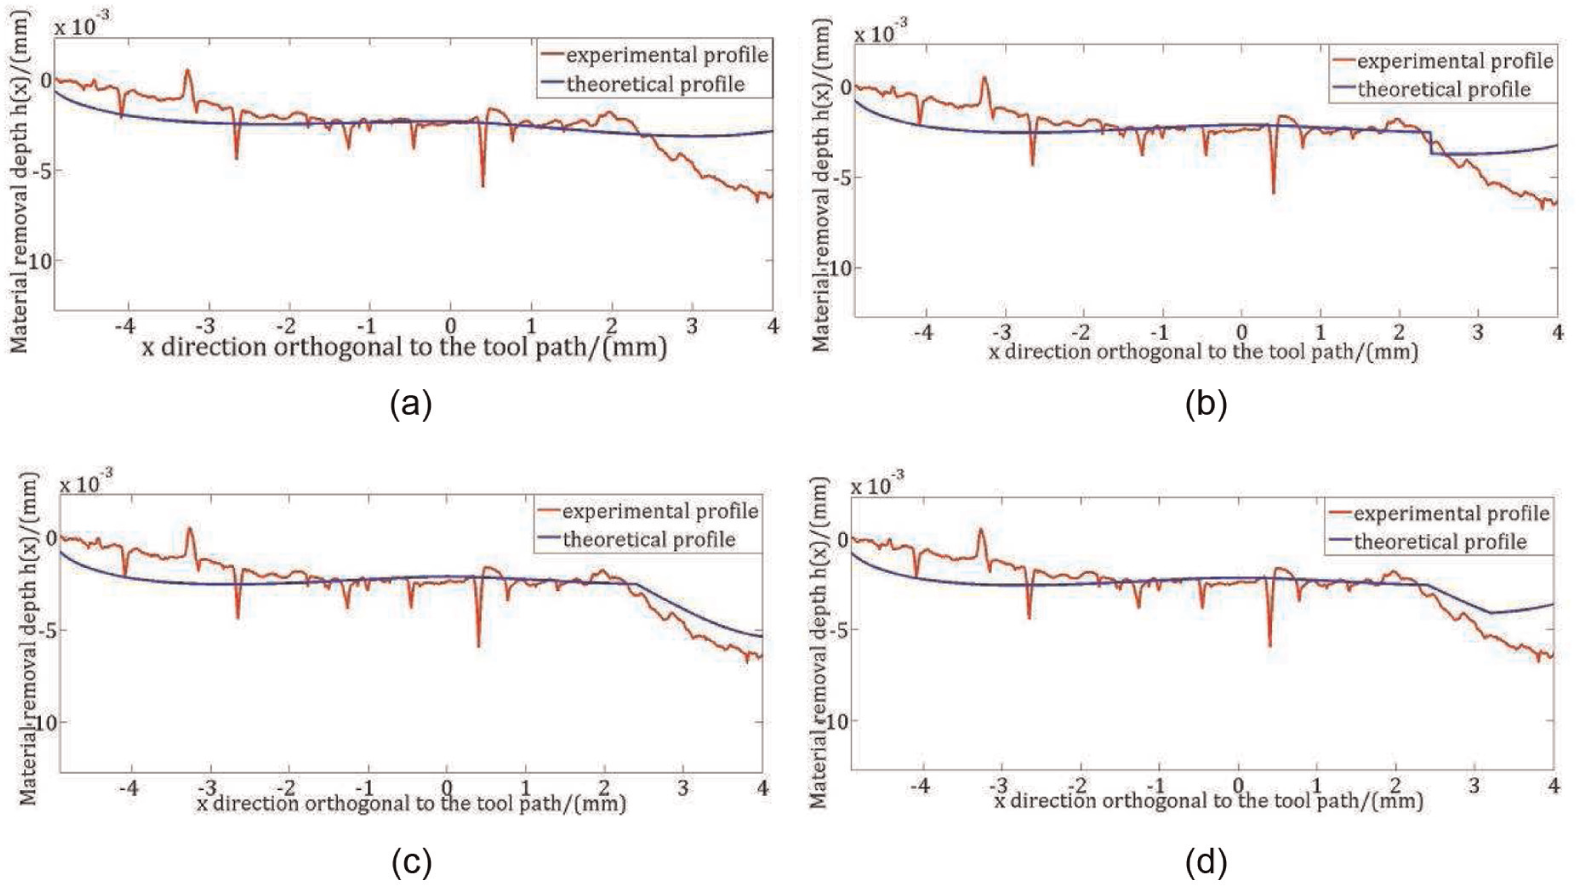
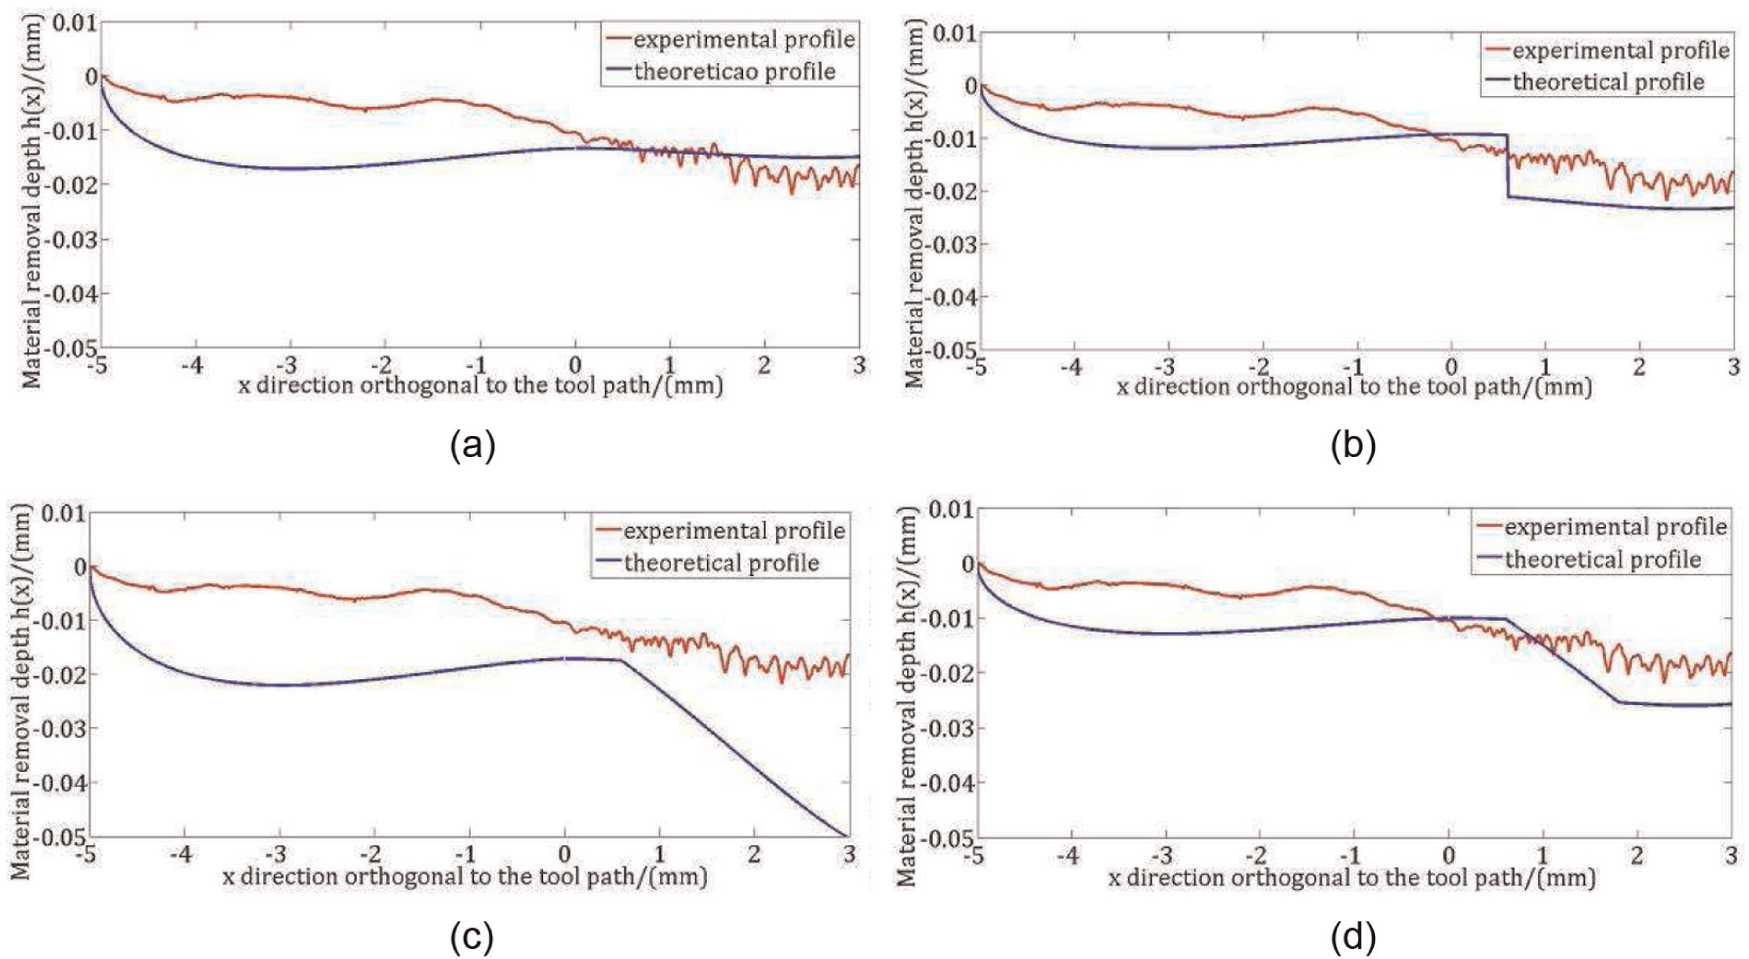
Comparison of experimental profile with different theoretical profiles of polishing along straight path for d = 1 mm: (a) linear model, (b) skin model, (c) linear skin model and (d) divided skin model.
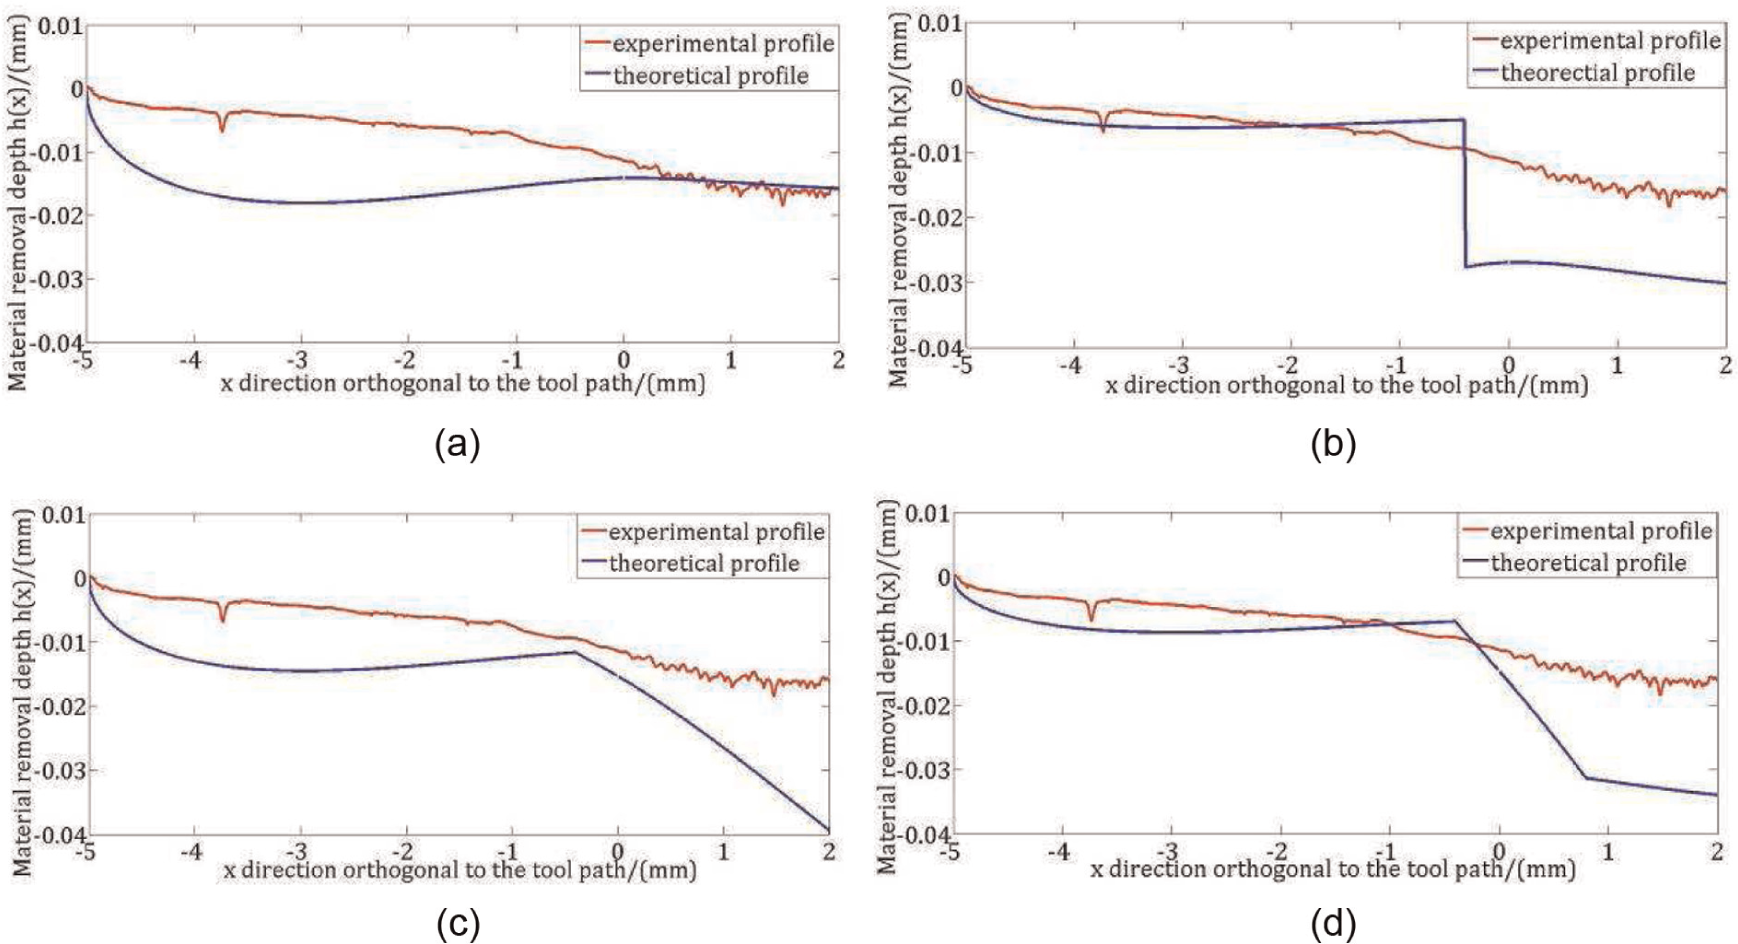
Comparison of experimental profile with different theoretical profiles of polishing along straight path for d = 2 mm: (a) linear model, (b) skin model, (c) linear skin model and (d) divided skin model.
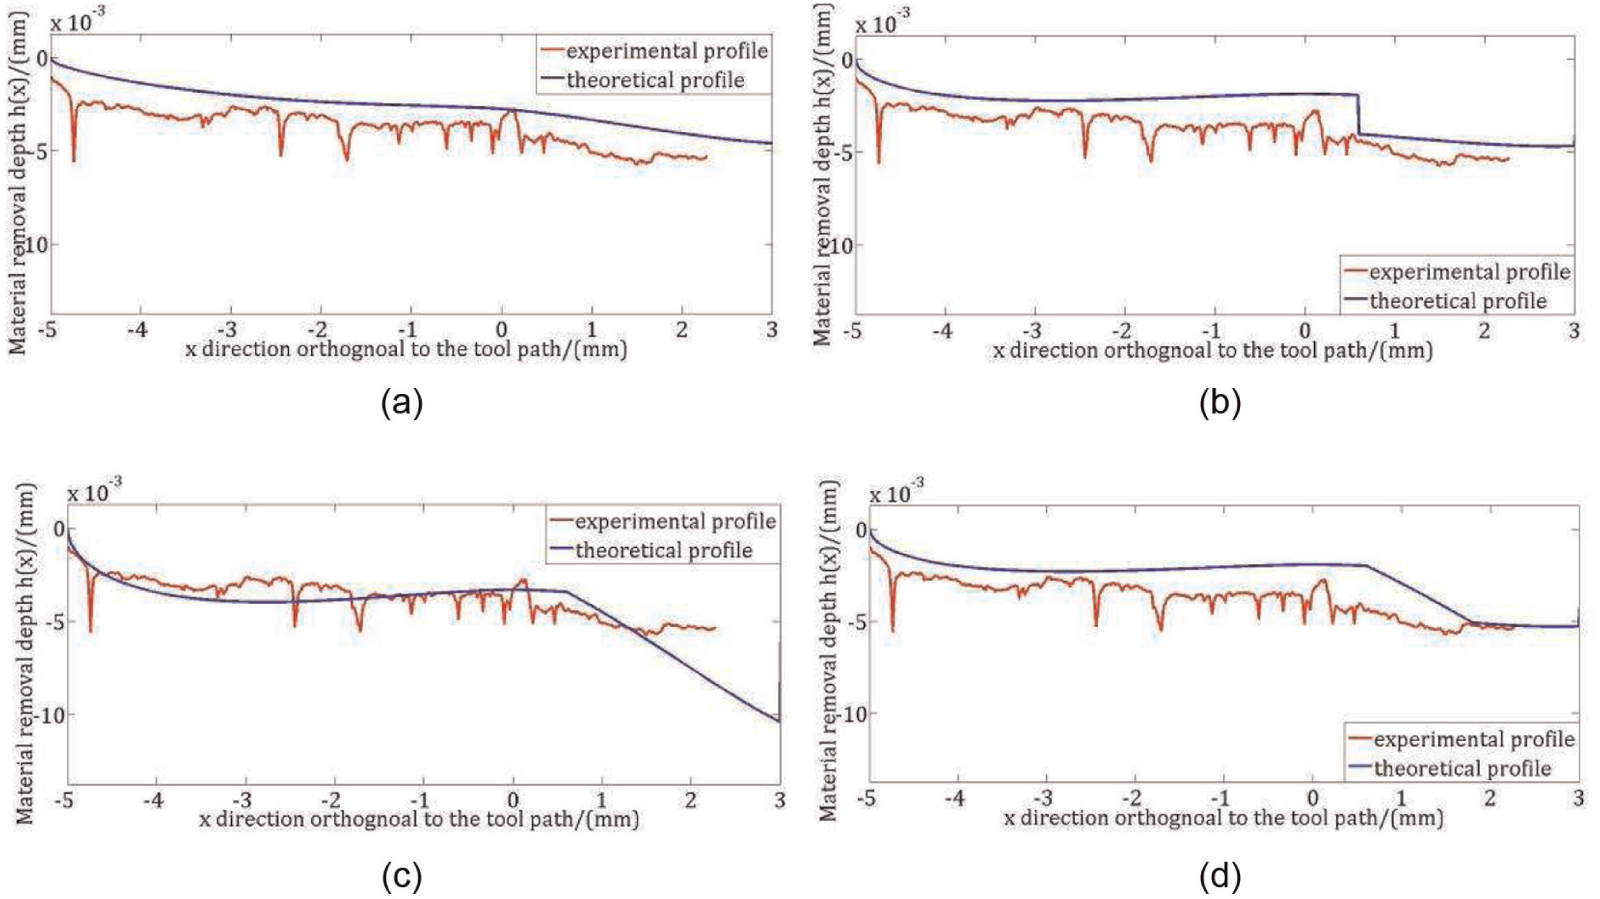
Comparison of experimental profile with different theoretical profiles of polishing along straight path for d = 3 mm: (a) linear model, (b) skin model, (c) linear skin model and (d) divided skin model.
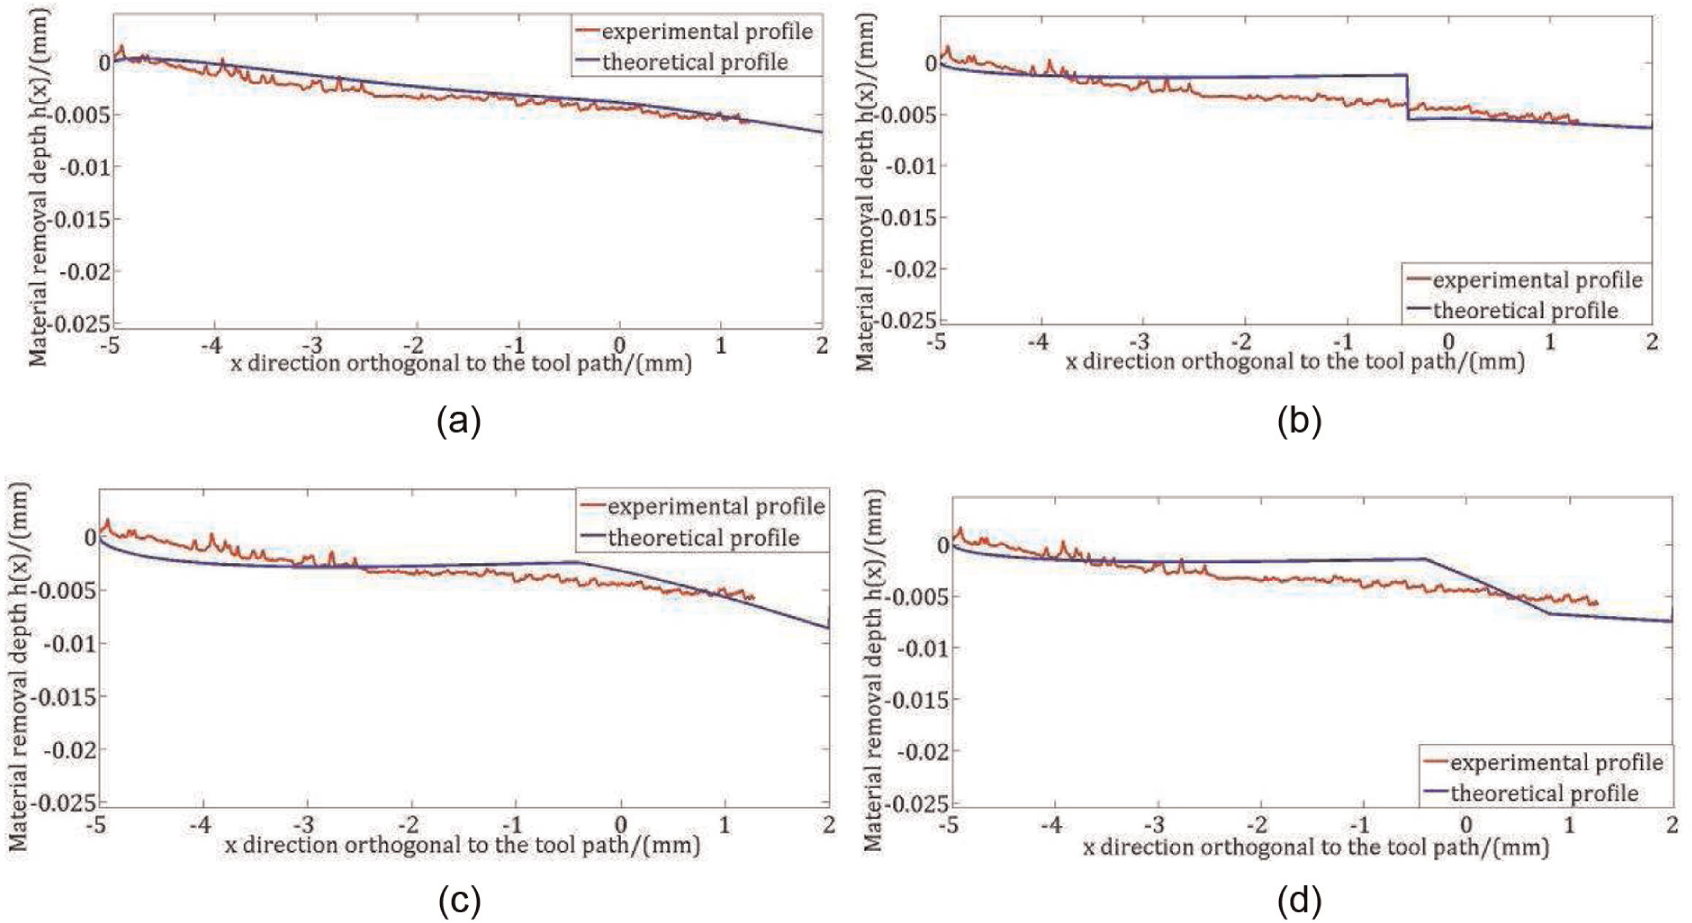
Comparison of experimental profile with different theoretical profiles of polishing along curved path for d = 1 mm: (a) linear model, (b) skin model, (c) linear skin model and (d) divided skin model.
Comparison of experimental profile with different theoretical profiles of polishing along curved path for d = 2 mm: (a) linear model, (b) skin model, (c) linear skin model and (d) divided skin model.
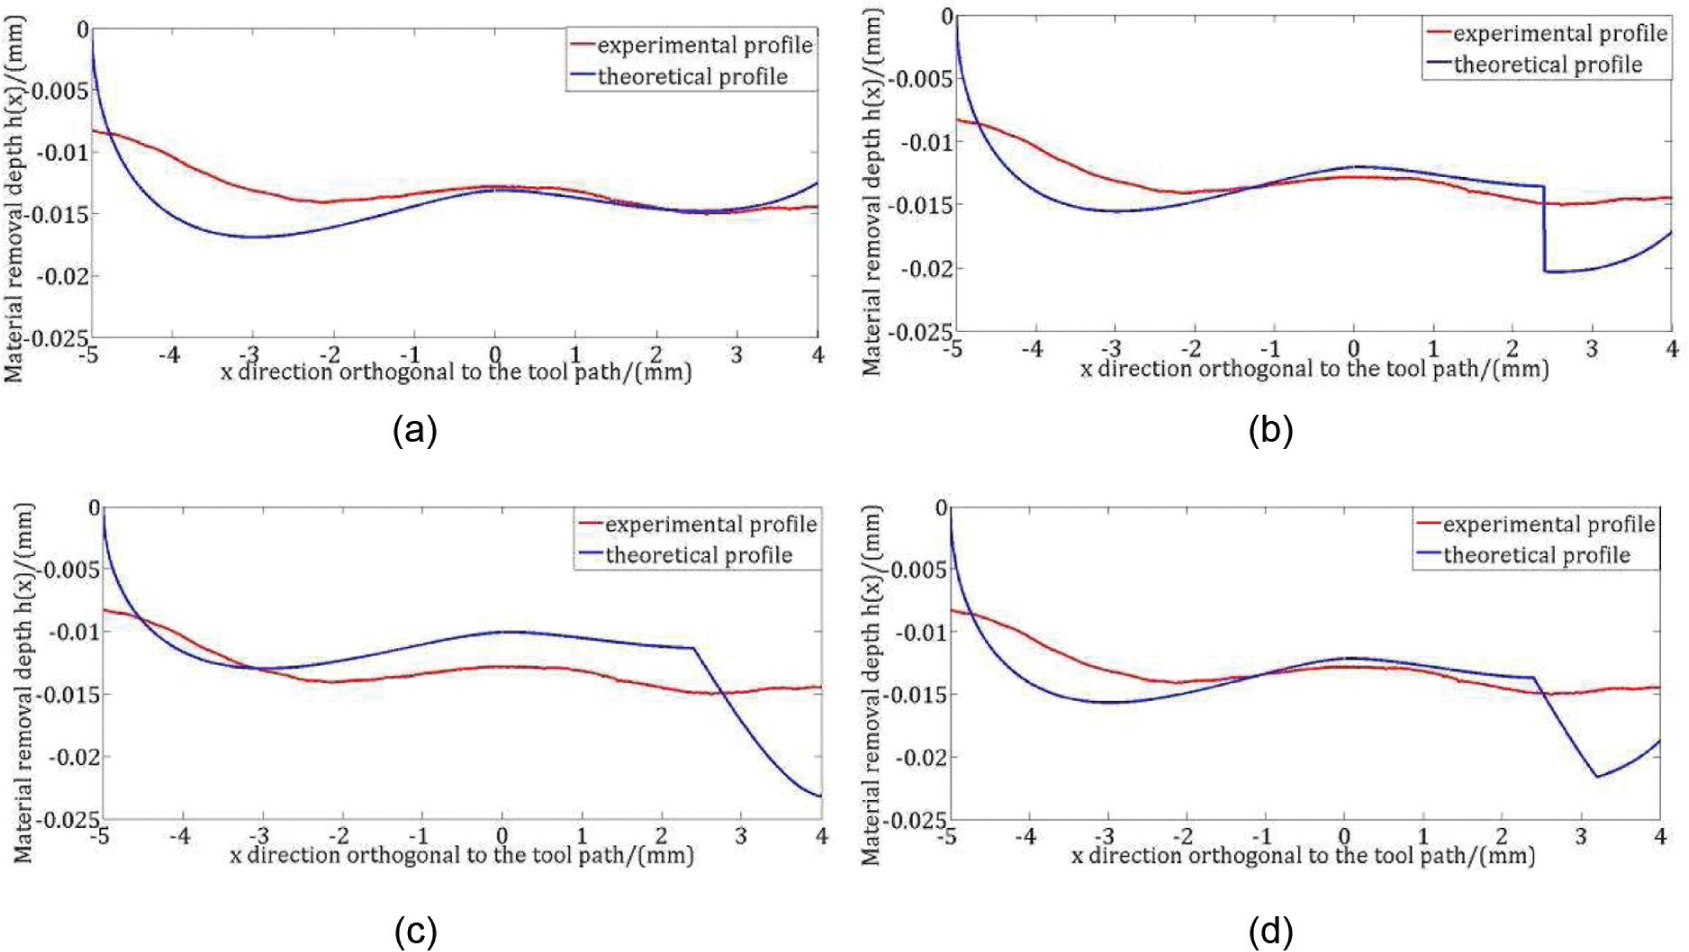
Comparison of experimental profile with different theoretical profiles of polishing along curved path for d = 3 mm: (a) linear model, (b) skin model, (c) linear skin model and (d) divided skin model.
Polishing experiments along straight path
Experiments of polishing the workpiece edge along a straight path as shown in Figure 8 are conducted for three cases of the outside distance d = 1 mm, 2 mm and 3 mm with the polishing parameters of f 0 = 10 N, ωp = 1000 r/min, va = 0.005 mm/s and b = 5 mm. The workpieces with the side length (a) of 25 mm are processed into cube blocks. The experimental material removal profiles for different outside distance d are shown in Figures 11–13. The simulated material removal profiles adopting different contact pressure distributions of linear model, skin model, linear skin model and divided skin model are also shown in Figures 11–13, respectively.
From Figures 11 and 12, it is found that for d = 1 and 2 mm, the theoretical profile using the linear skin pressure distribution model is in good agreement with the experiment profile. However, for d = 3 mm which is greater than b/2, half of the radius of the polyurethane pad, the theoretical profile adopting the linear pressure distribution model is in good agreement with the experiment profile as shown in Figure 13.
Polishing experiments along curved path
Experiments of polishing the workpiece edge along a curved path as shown in Figure 9 are conducted for three cases of the outside distance d = 1, 2 and 3 mm with the polishing parameters of f 0 = 10 N, ωp = 1000 r/min, ωq = 0.002 rad/s and b = 5 mm. The workpieces with the radius (a) of 25 mm are processed into cylindrical blocks. The material removal profiles obtained experimentally for different outside distance d are shown from Figures 14–16 together with the corresponding theoretical profiles adopting different contact pressure distributions of linear model, skin model, linear skin model and divided skin model.
From Figures 14–16, the theoretical profiles adopting the four different pressure distribution models are not in good agreement with the experimental profiles. But the theoretical profile adopting linear pressure distribution model is closer to the experimental profile.
So, in this article, for polishing the workpiece edge along a curved path, a modified parameter k is introduced to the theoretical removal model adopting linear pressure distribution, that is, k is introduced to equation (34). k has a linear relationship with the outside distance as given by k = 1 − b/(2d). The comparison between the modified theoretical removal profiles with the experimental profiles is shown in Figure 17. From Figure 17, it is obvious that the modified theoretical profiles are in better agreement with the experimental profiles than those in Figures 14–16.
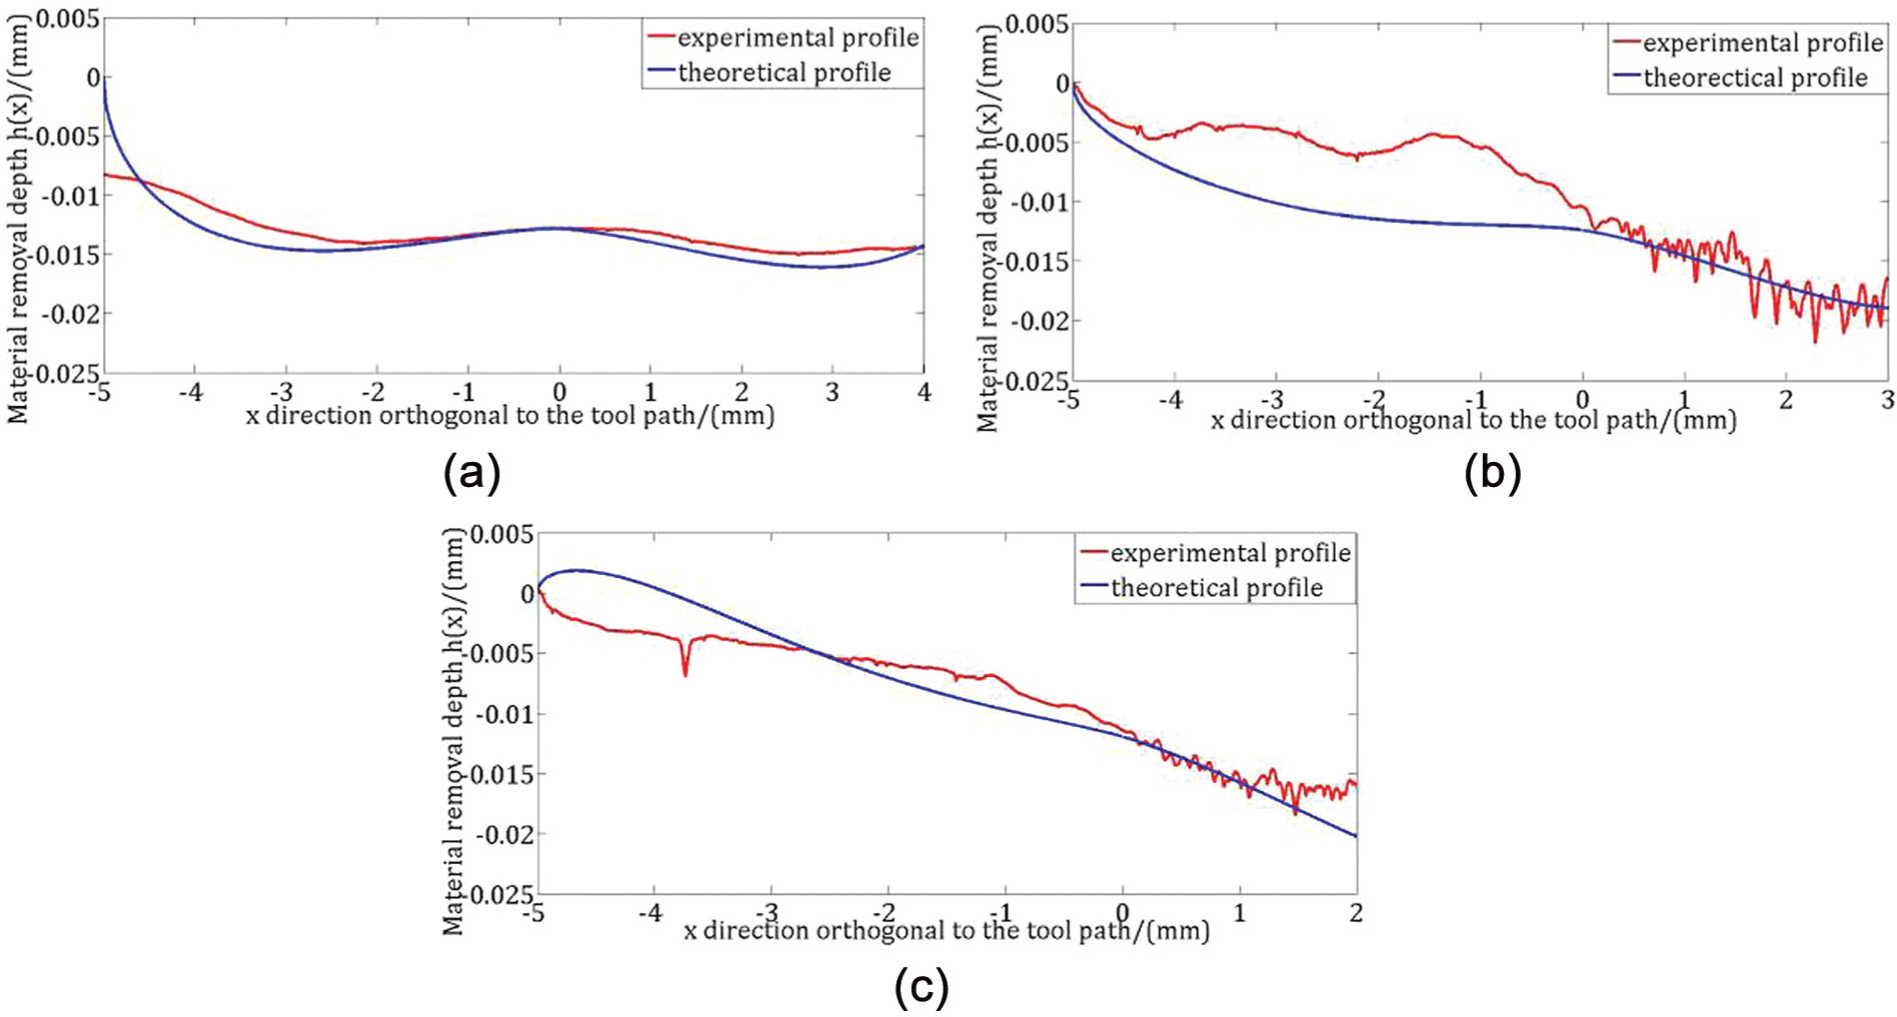
Comparison of modified theoretical profile adopting linear model with experimental profile: (a) d = 1 mm, (b) d = 2 mm and (c) d = 3 mm.
Discussion about reducing edge effect
The experimental results indicate that edge effect is apparent with the increase in outside distance d. And the material removal profile has relationship with the normal polishing force and the relative sliding velocity.24–28 Figure 18(a) shows the influence of ratio d/b on material removal profile for a straight path simulated by the linear skin pressure distribution model when d is less than b/2 and simulated by the linear pressure distribution model when d is greater than b/2. Figure 18(b) shows the influence of ratio d/b on material removal profile for a curved path simulated by the modified theoretical removal model adopting linear pressure distribution. Other parameters are set to be constant, that is, f 0 = 10 N, ωp = 1000 r/min, ωq = 0.002 rad/s, va = 0.005 mm/s, b = 5 mm and a = 25 mm. As shown in Figure 18, when the ratio is greater than 1: 6.25, the edge effect is obvious along straight path and along curved path.
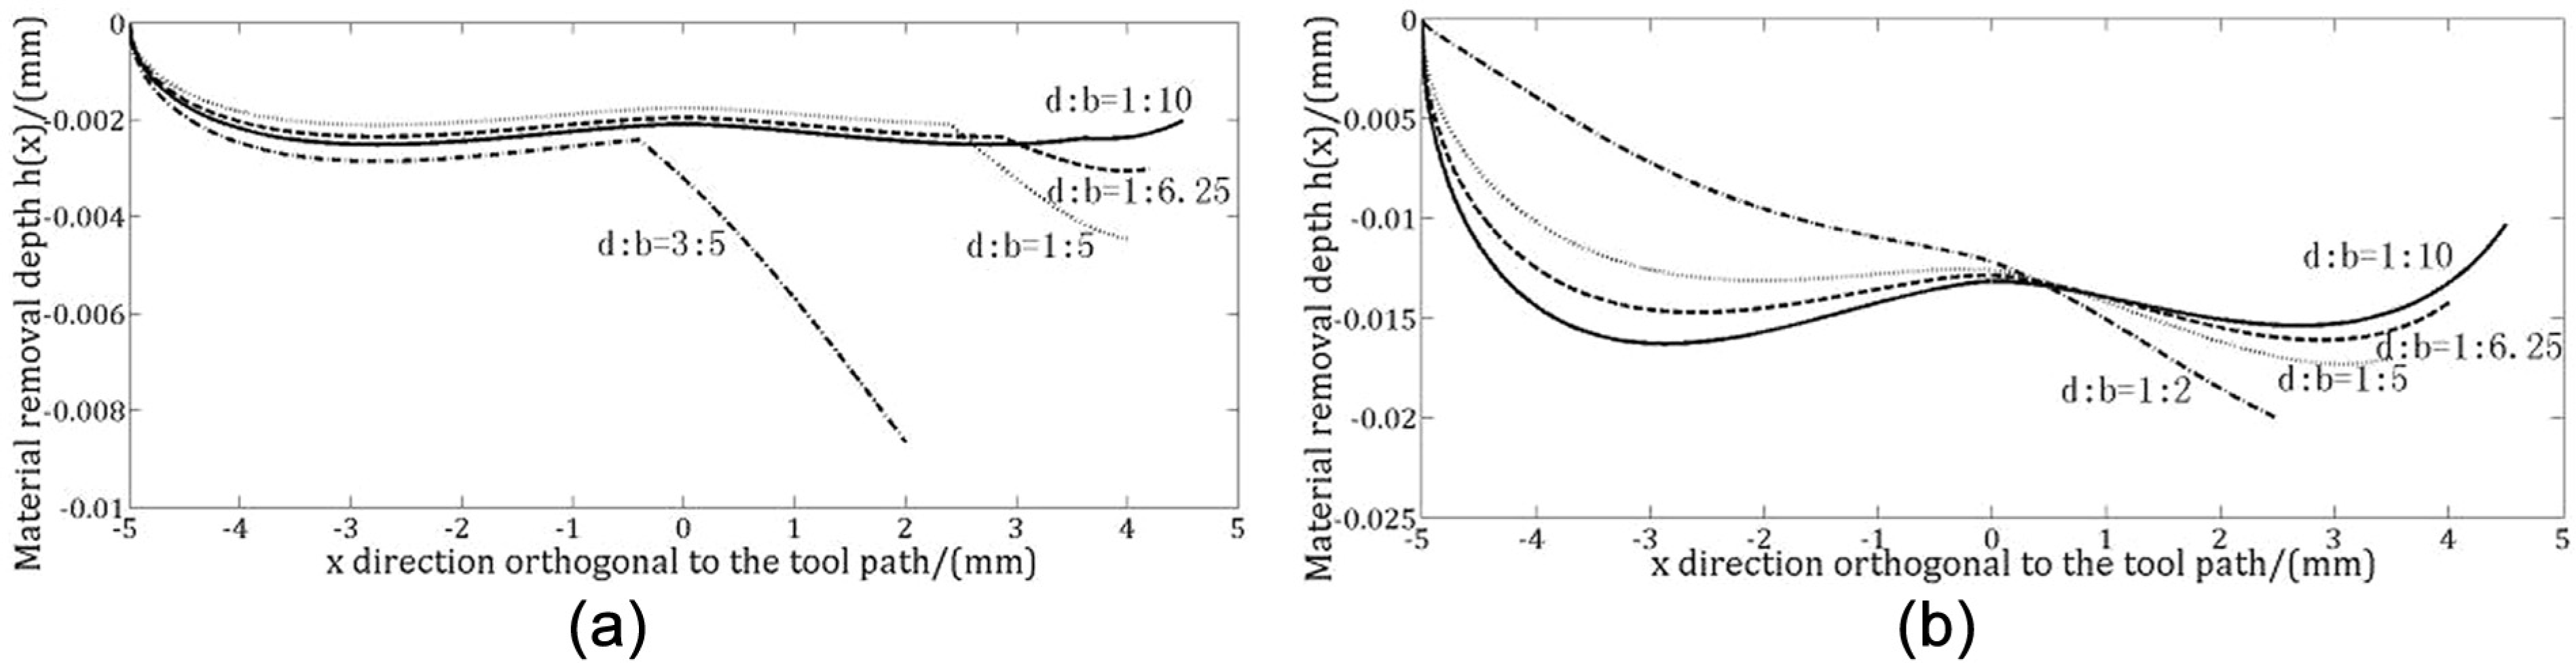
Simulated removal profiles for different ratios d/b: (a) straight path and (b) curved path.
Figures 19 and 20 show the influences of normal polishing force and feed rate on the material removal profile simulated by adopting the above-mentioned suitable pressure distribution along a given path, respectively. The material removal depth at the workpiece edge increases with the increase in normal polishing force and decreases with the increase in feed rate.
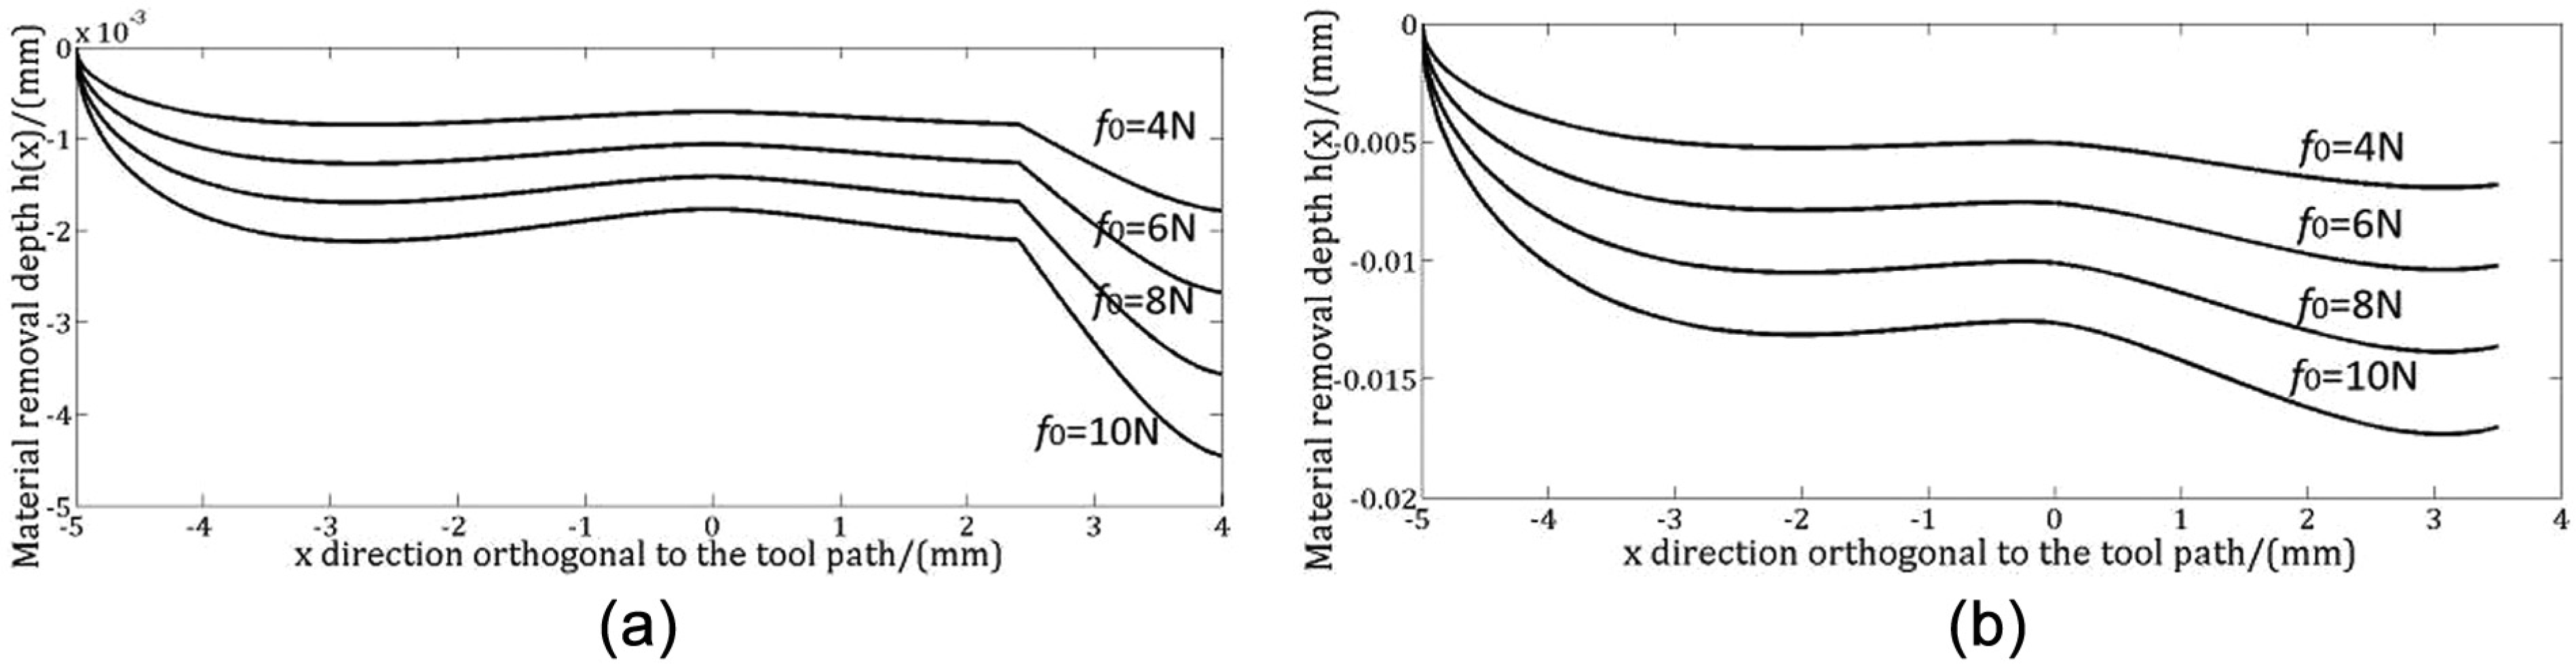
Simulated removal profiles for various polishing force: (a) straight path (va = 0.005 mm/s, d = 1 mm, b = 5 mm) and (b) curved path (ωq = 0.002 rad/s, d = 1.5 mm, b = 5 mm).
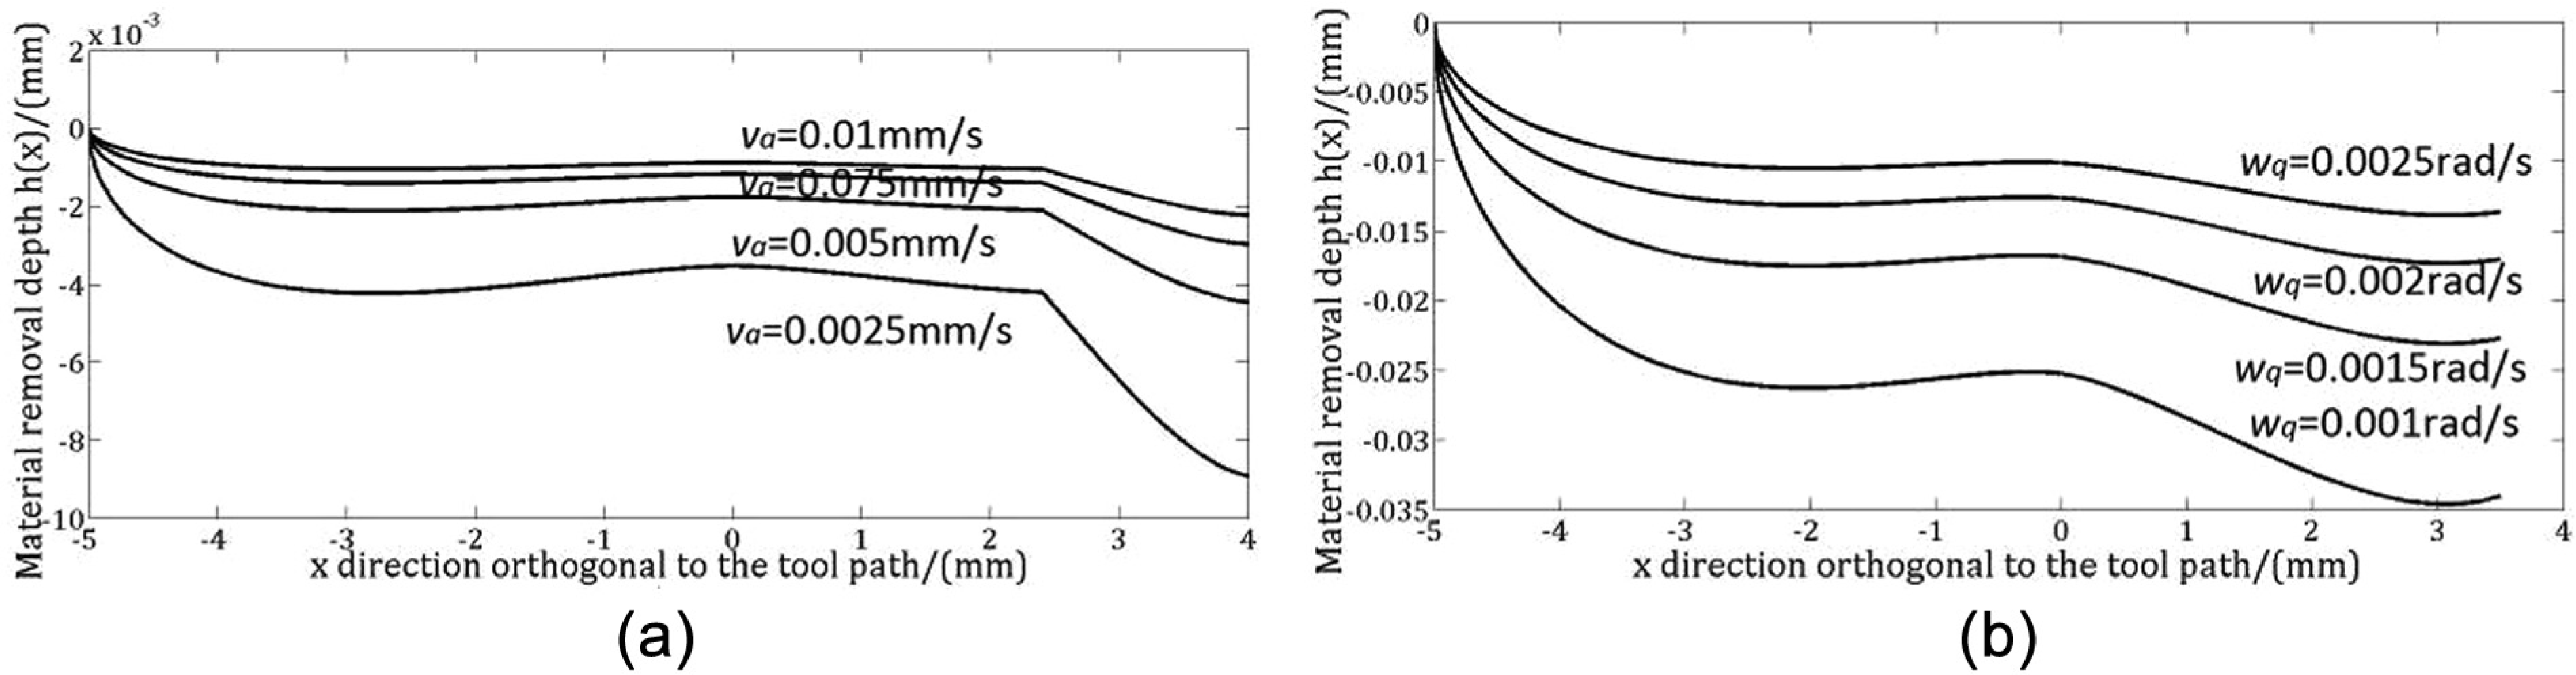
Simulated removal profiles for various feed rate: (a) straight path (f 0 = 10 N, d = 1 mm, b = 5 mm) and (b) curved path (f 0 = 10 N, d = 1.5 mm, b = 5 mm).
From Figures 18–20, when the polishing pad passes by the workpiece edge, the influence of edge effect may be reduced by decreasing the normal polishing force or increasing the feed rate, and meanwhile, limiting the outside distance to a small value relative to the size of polishing pad.
Conclusion
This article presents a theoretical and experimental investigation into the material removal influenced by edge effect. The contact pressure distribution near the boundary is analyzed for polishing the workpiece edge. The material removal profiles considering the edge effect are modeled by adopting four different contact pressure distributions including two models proposed in this article along straight path and curved path. The polishing experiments are carried out to determine the suitable contact pressure distribution model for predicting material removal. Experimental results show that the material removal profile along straight path can be predicted by the linear skin pressure distribution model when the outside distance is less than b/2 and that predicted by the linear pressure distribution when the outside distance is greater than b/2. And the material removal profile along curved path can be predicted with the linear pressure distribution by introducing a modified parameter k. Based on the simulation result, the influence of edge effect on material removal that can be able to accurately established due to the above analysis may be reduced by increasing the feed rate, decreasing the normal polishing force and decreasing the ratio d/b.
Footnotes
Declaration of conflicting interests
The author(s) declared no potential conflicts of interest with respect to the research, authorship, and/or publication of this article.
Funding
The author(s) disclosed receipt of the following financial support for the research, authorship, and/or publication of this article: This work is supported by the National Key Basic Research and Development Program (973 program) of China (Grant No. 2011CB706702).