
Abstract
In this article, the condition diagnosis and form error prediction models for lens injection moulding process are developed based on a response surface method by using features extracted from in-process cavity pressure signals. In the lens injection moulding experiments, cavity pressure signals are captured by pressure sensors embedded in a lens mould, and form errors of manufactured lenses are measured afterwards. Then, three features such as filling point, maximum pressure and inflection point pressure are identified from the measured cavity pressure profile, and they are used to formulate the response surface functions for each injection moulding condition. In addition, the response surface functions for the lens form error with the input variables of the above-mentioned three features are also formulated. It is reported that the overall average accuracies for the lens injection moulding condition diagnosis and form error estimation are better than 97% and 80%, respectively, in the actual industrial site.
Keywords
Introduction
An injection moulding process, which can produce many components in a single process by using moulds with multiple cavities, has been widely used for producing precision components with complex features in various industry fields. 1 In particular, due to high productivity and enhanced accuracy, the precision optical component such as a microplastic lens in a smart phone has been fabricated with an injection moulding process. 2 Since these optical components require high dimensional accuracy, it is of much necessity to conduct the quality improvement of injection moulded parts by monitoring and control of major injection moulding parameters significantly influencing their accuracy. In general, monitoring and control of an injection modelling process in the current industrial site have been carried out by well-trained workers having much experience and knowledge. Therefore, the systematic and reliable practice could not be continuously possible.
In this context, much research has been done on the monitoring and diagnosis of injection moulding processes. Coates and Speight 3 discussed the steps towards process control of the complex, multivariable injection moulding process. In their study, the melt and hydraulic pressures in the primary injection stage were considered, and they were correlated with product weight and dimension for meaningful statistical process control for injection moulding. Kwong and Smith 4 proposed the blackboard-based expert system with a case-based reasoning approach to properly design injection moulding process involving the selection of the injection moulding machine, mould design, production scheduling, cost estimation and determination of injection moulding parameters. The prediction of processing parameters for injection moulding has been developed by Yarlagadda 5 by using a hybrid neural network. Two process parameters such as injection time and injection pressure were predicted by using the error back-propagation algorithm and the Levenberg–Marquardt approximation algorithm, and the accuracy has been tested for a few engineering components.
Ribeiro 6 considered support vector machines (SVM) to monitor in-process data as a means of indicating injection moulded plastic part quality in an industrial environment and to be able to quickly respond to unexpected process disturbances. A fuzzy neural network (FNN)-based flash prediction system of injection moulding processes was proposed by Zhu and Chen 7 to accurately predict flash with major processing parameters such as injection speed, melt temperature and holding pressure and vibration signal data during the mould closing and injection-filling stages. Zeaiter et al. proposed the multivariate regression model for monitoring quality of an injection moulding components using cavity sensor. They showed that the regression model based on cavity pressure sensor data could be successfully used to monitor the final part quality such as weight and dimensions in plastic injection moulding. 8
In the case of the injection moulding of plastic optical lenses, Lu and Khim 9 conducted a statistical experimental study to investigate the effects of various process parameters, including injection speed, holding pressure and mould temperature on the lens contour errors. Tsai et al. 10 investigated the effects of process parameter on the quality characteristics such as light transmission, surface waviness and surface finish through empirical and theoretical analysis. They found that the melt temperature was the most significant parameter to affect surface waviness and that light transmission and surface finish of lenses were little affected by injection moulding process parameters.
As mentioned above, there were a few researches on the monitoring of process parameters and the prediction of part quality in the case of the injection moulding process of plastic optical lenses. However, they considered process parameters indicated by the injection moulding machine, which might not represent the actual injection moulding condition in mould cavities. Therefore, in this article, the cavity pressure sensors are built in the lens mould, and the measured in-process cavity pressure signals and extracted features are used for developing the injection moulding condition diagnosis algorithm based on a regression method. In addition, form errors of injection moulded lenses are predicted by formulating regression functions based on the extracted features with reasonable accuracy.
Lens injection moulding experiments
The injection moulding machine (SE30DUZ) manufactured by Sumitomo was used for lens injection moulding experiments. The polymer material of lenses was OKP4HT which was produced by Osaka Gas Chemicals. Figure 1 shows the photo of the injection moulding machine which was installed in the industrial site.
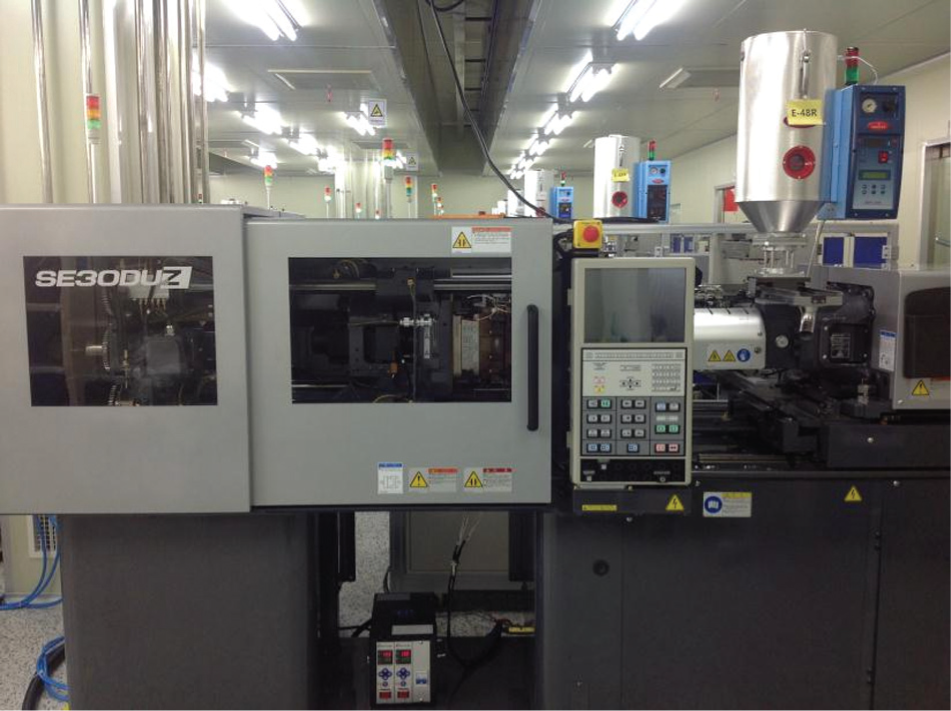
Photo of the injection moulding machine (SE30DUZ).
The cavity pressure sensors (9130B) made by Kistler were built into the lens mould to capture in-process cavity pressure signals during the experiments. The lens mould was the H-type one having 16 cavities for producing lens with a 5 megapixel resolution. For signal processing, the amplifier of Kistler’s CoMo injection was also used. Figure 2 shows the photo of the lens mould in which the pressure sensors were embedded at all cavities.
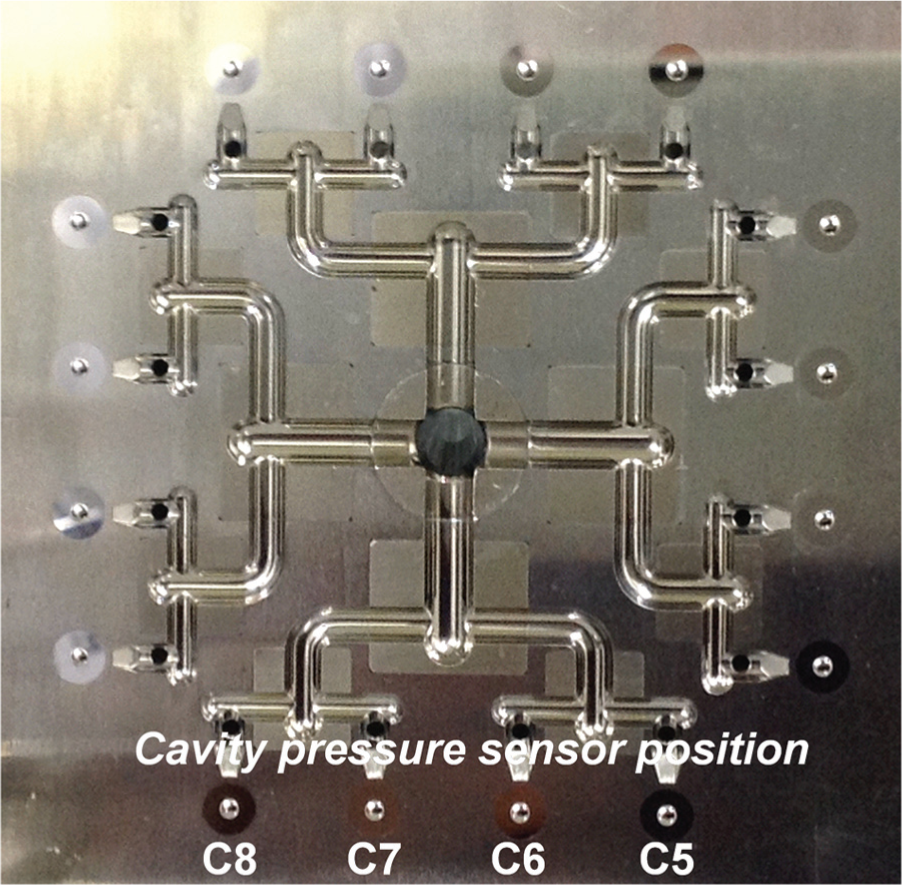
Photo of the lens mould in which the cavity pressure sensors were built.
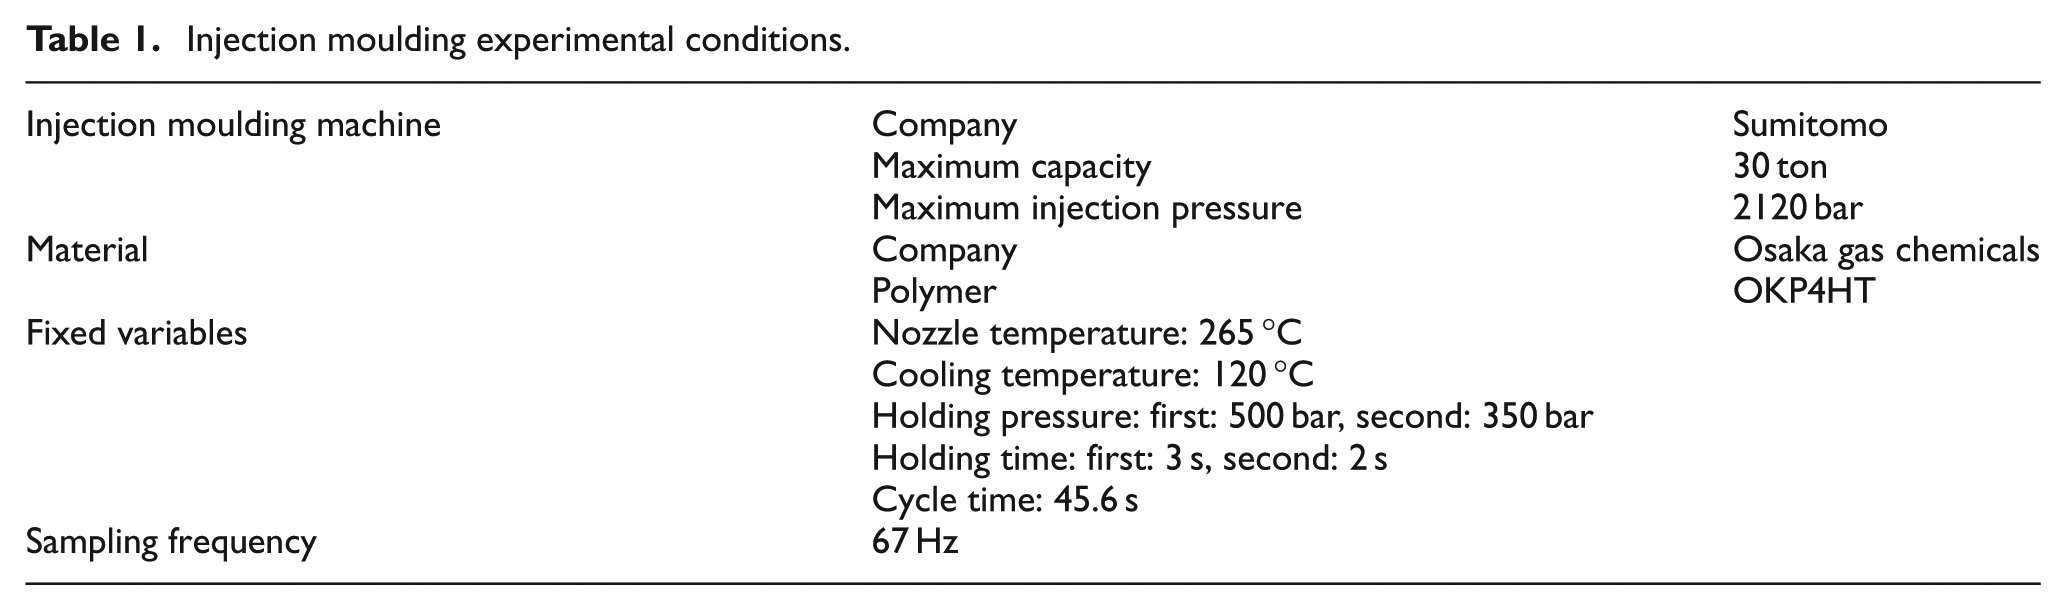
The conditions of the injection moulding experiments are summarized in Table 1. The variables of nozzle pressure, cooling temperature, holding pressure, holding time and cycle time were considered as fixed ones, and their numerical values are given in Table 1. The sampling frequency for the measurement of cavity pressures was set to be 67 Hz. These numerical values were set based on the industrial practices.
Injection moulding experimental conditions.
The design of injection moulding experiments is given in Table 2. As can be seen in Table 2, the switch-over point and injection velocity were selected as control variables in the experiments, and their three levels were considered, respectively. In the case of a switch-over point, its numerical value of 3.6 mm was set to be standard, and 4.1 mm and 3.1 mm were chosen to be a premature switch-over point and a late one, respectively. On the other hand, in the case of an injection velocity, 15 mm/s was the standard value, and 20 mm/s and 10 mm/s were considered for high and low ones, respectively. Therefore, total five experimental cases were sorted out, and each case represents five different injection moulding conditions, which are considered in this research. In each experimental case, 20 shots were conducted, and thus, total 100 shots were carried out for all five experimental cases. In Figure 3, the photo of the moulded lenses is given. As can be seen in Figure 3, four injection moulded lenses, denoted by C5, C6, C7 and C8, are designated, and they were under analysis in this research.
Experimental design of lens injection moulding.
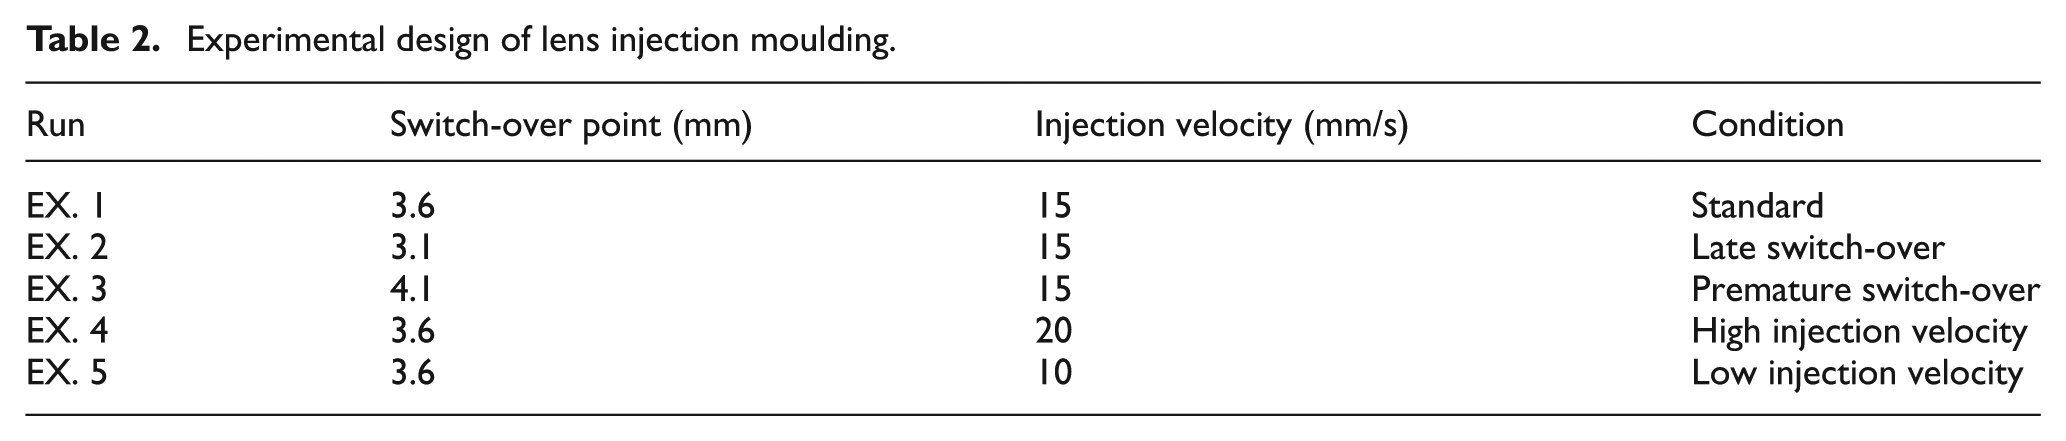
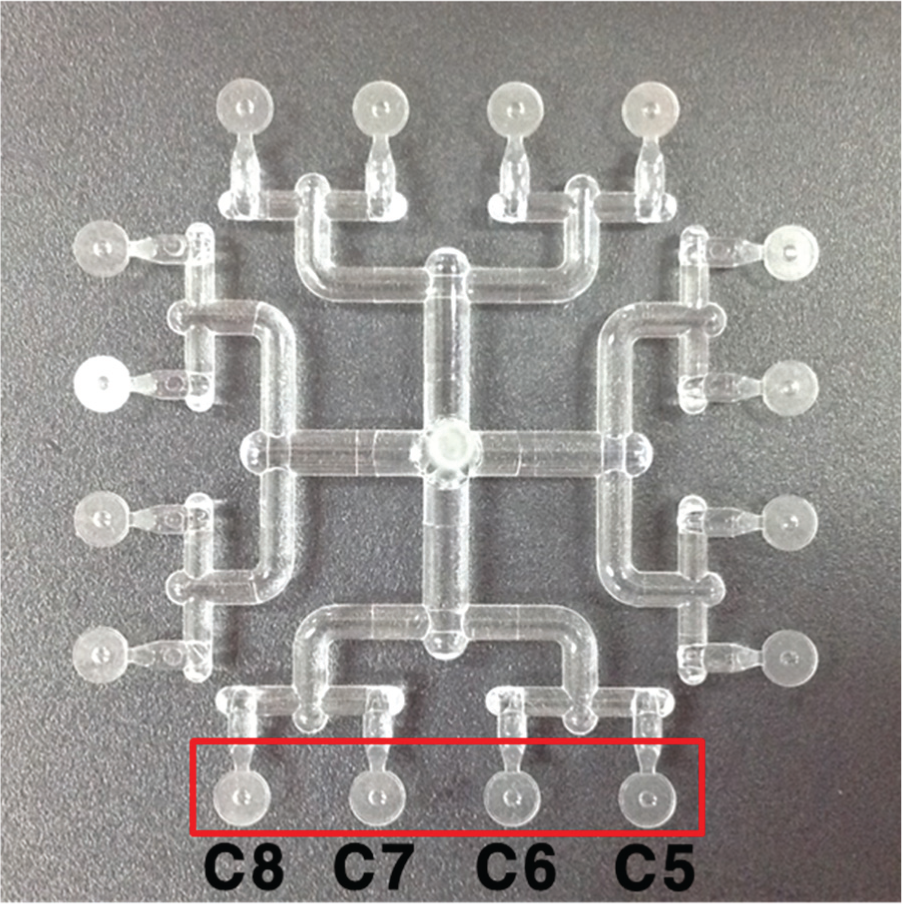
Photo of produced lenses from the mould with 16 cavities for 5–megapixel resolution camera module and the selected lenses for further analysis which corresponds to the cavities of C5, C6, C7 and C8.
The representative profiles of measured cavity pressures for all five experimental cases are given in Figure 4, and they were captured at the cavity of C5. As can be seen in Figure 4, they are somewhat different from one another according to the experimental conditions. In the case of late switch-over (EX. 2), the maximum pressure increased significantly, which can be much larger than that in the standard case (EX. 1). On the other hand, the maximum pressure in the case of premature switch-over (EX. 3) was smaller than that in the standard case.
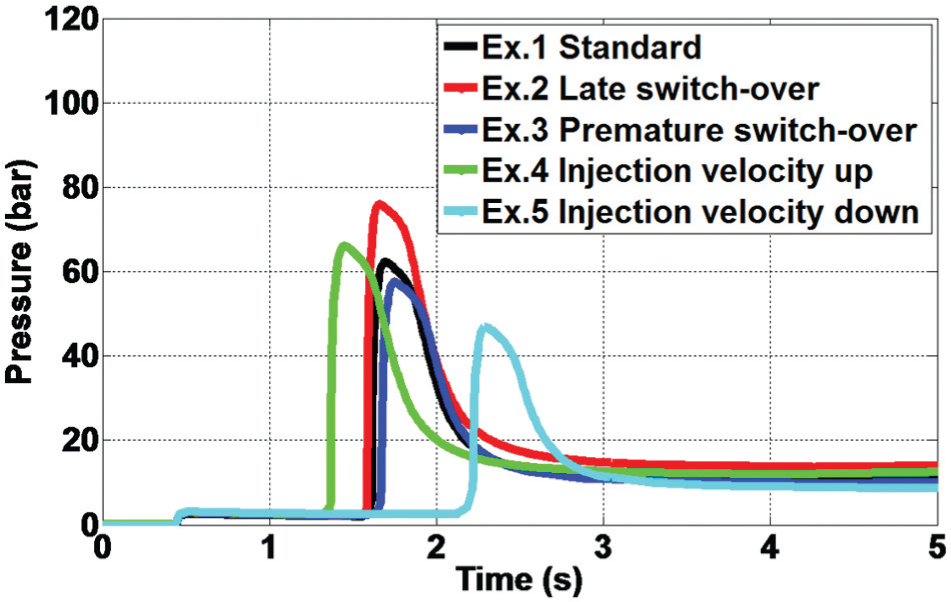
Profiles of measured cavity pressure signals at the cavity of C5 in all five experimental cases.
Meanwhile, in the case of high injection velocity (EX. 4), the cavity pressure started to increase much earlier than the standard case. In addition, in the case of low injection velocity (EX. 5), the pressure started to increase much later. When observing their maximum pressures, the maximum pressure in EX. 4 was similar to that in the standard case. On the other hand, the maximum pressure in EX. 5 was the smallest among all experimental cases and the holding pressures in all experimental cases were similar to one another.
Feature extraction and injection moulding condition diagnosis
Features extracted from the profile of measured cavity pressure signal were the filling point, maximum pressure and inflection point pressure, and they were used for identifying injection moulding conditions. In Figure 5, those extracted features are schematically demonstrated in the measured cavity pressure profile. Among those features, the filling point is usually affected by the change of an injection velocity, and both maximum pressure and inflection point pressure are influenced by the change of a switch-over point.
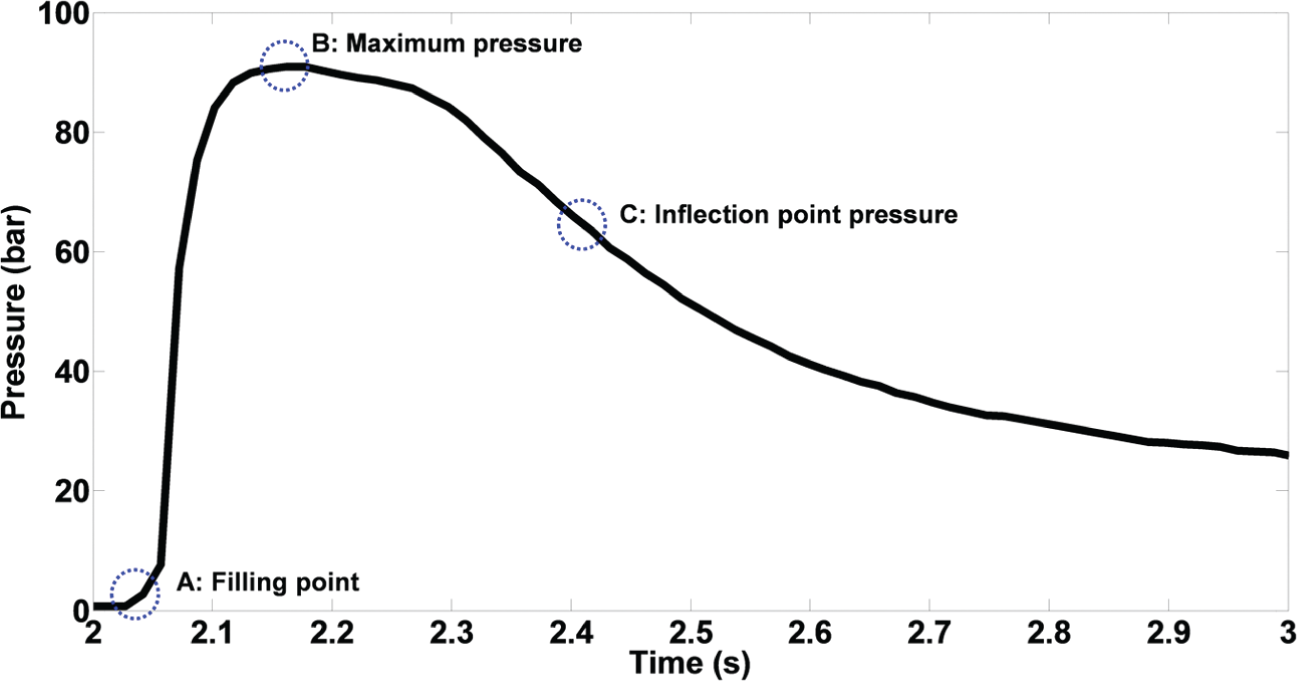
Three features extracted from the profile of measured cavity pressure signal.
In order to establish the condition diagnosis model of lens injection moulding process, a response surface methodology (RSM) was applied. Since the number of shots per each experimental case was not sufficiently large, a neural network approach might not be appropriate. Therefore, the regression function determining each injection moulding experimental case was formulated by using an RSM. Among 20 measured cavity pressure data for each experimental case, 14 data were used for formulating the regression model, and remaining six data were used for validation. The formulated regression function is given in the following equation
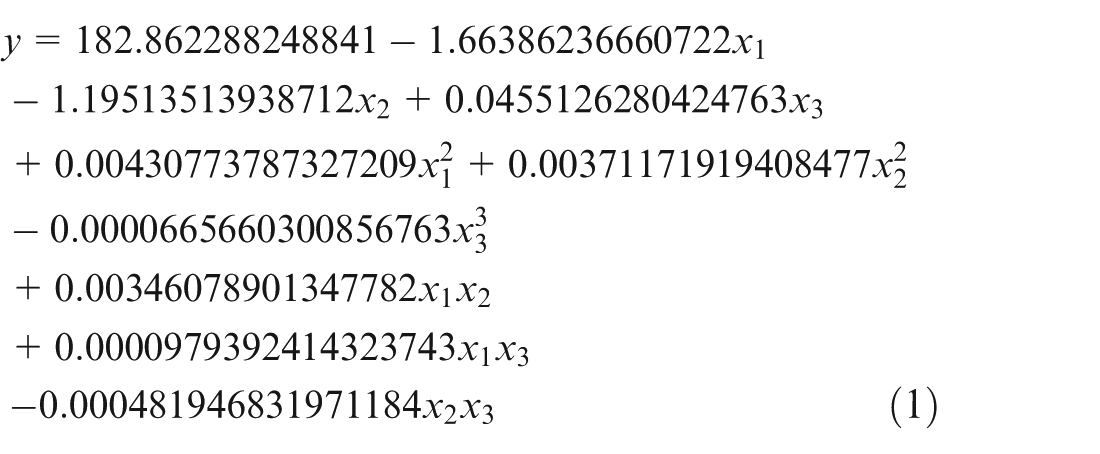
In equation (1), x1, x2 and x3 represent the filling point, maximum pressure and inflection point pressure, respectively. The outputs of the regression function given in equation (1) were the injection moulding conditions such as (1) standard, (2) late switch-over, (3) premature switch-over, (4) high injection velocity and (5) low injection velocity.
The injection moulding condition diagnosis results are shown in Figure 6. As can be seen in Figure 6, the average overall condition diagnosis rate was 97%. In more detail, in the cases of EX. 1, EX. 2, EX. 4 and EX. 5, their injection moulding diagnosis rates were 100%, since the profiles of their measured cavity pressures were obviously different one another. However, in the case of EX. 3, its cavity pressure profiles were similar to those of EX. 1, and there would be some chances to be mistakenly diagnosed as EX. 1. Thus, the injection moulding condition diagnosis rate in the case of EX. 3 was 83%.
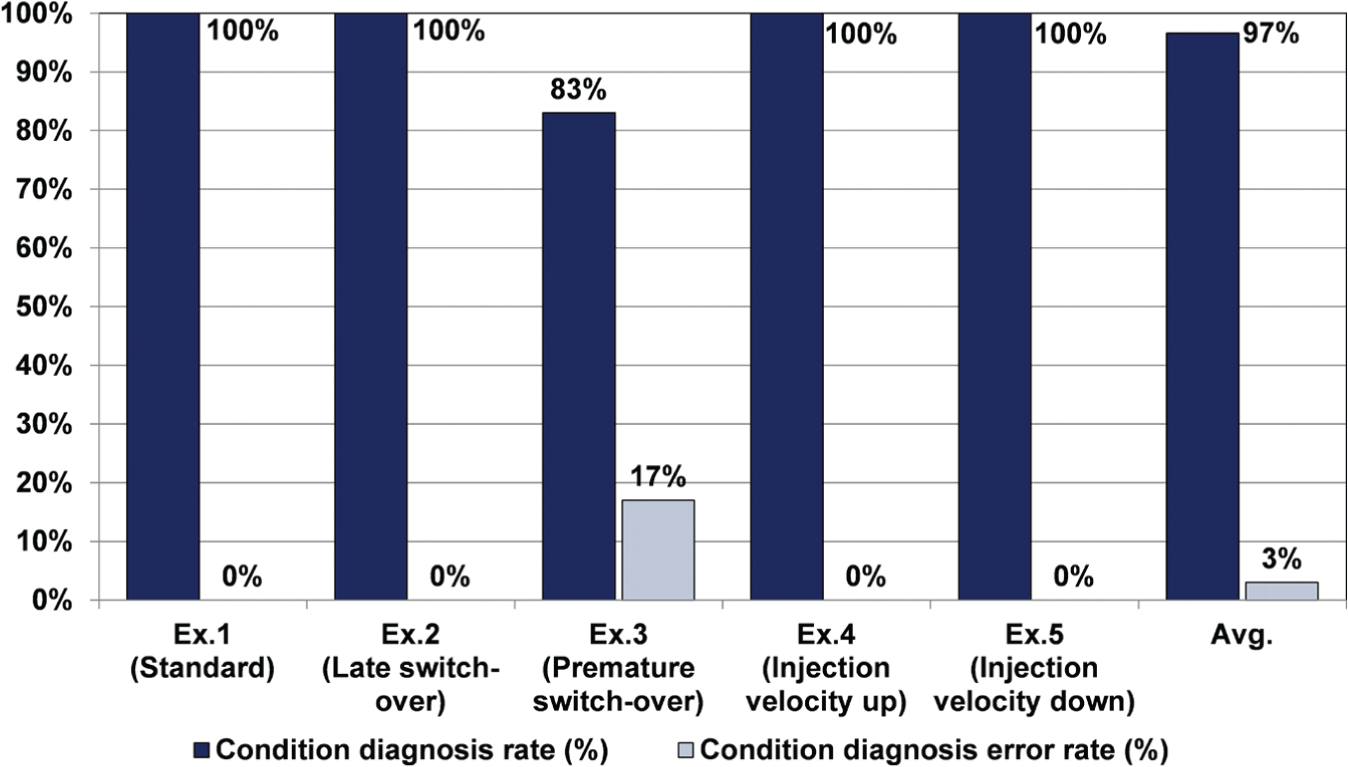
Injection moulding condition diagnosis results.
Lens form error analysis and prediction
Among various factors determining quality of an injection moulded lens such as thickness, form error, birefringence, and so on, a lens form error has been generally considered to be most significant in the industrial site. When measuring a form error, surface roughness values of two surfaces of the lens were considered. As can be seen in Figure 7(a), two (2) surfaces – S1 and S2 – were defined and their average surface roughness values were taken as lens form errors. For each surface, two (2) surface roughness values along the lines of 0°–180° and 90°–270°, which are shown in Figure 8(b), were measured and averaged. The lens form errors at the surfaces of S1 and S2 were measured by the Form Talysurf PGI 840 manufactured by Taylor Hobson Ltd whose photo is given in Figure 8.
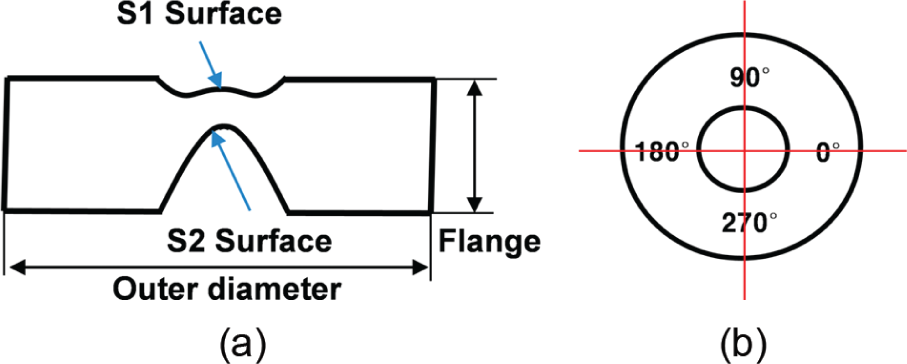
Schematics of (a) side view and (b) top view of the injection moulded lens.
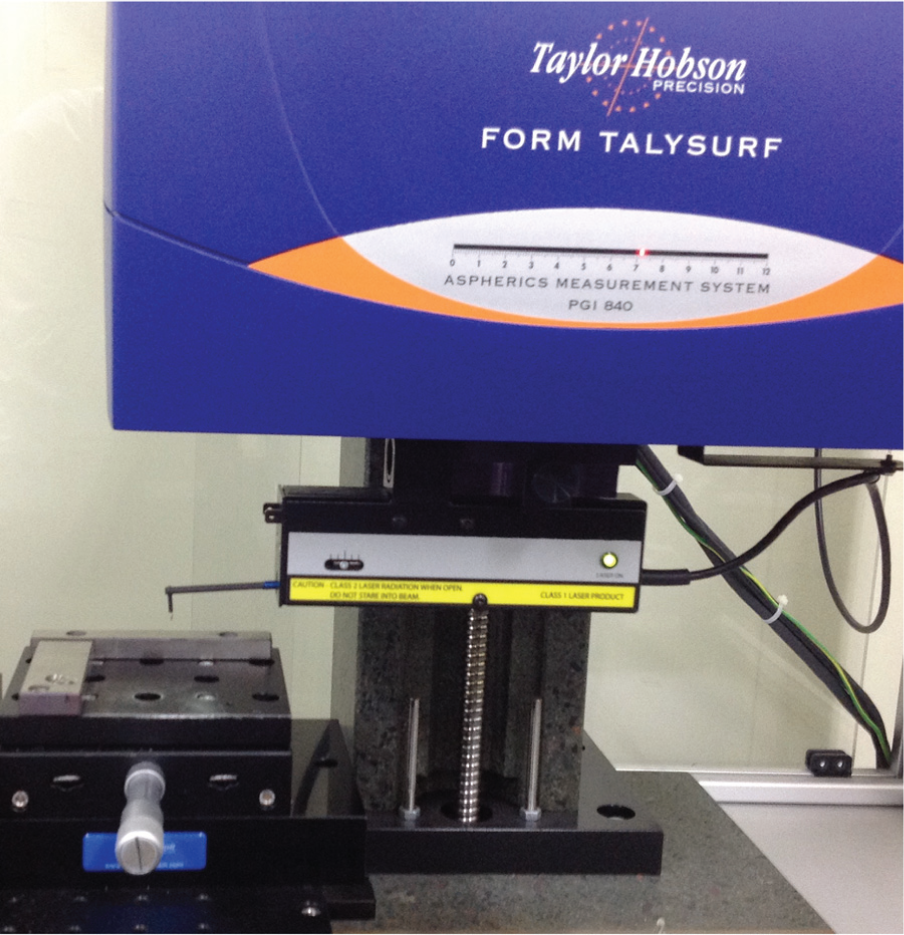
Photo of lens form error measurement equipment – Form Talysurf PGI 840.
Based on the above-mentioned definition and measuring procedure, the form errors of the lenses of C5, C6, C7 and C8, which are denoted in Figure 3, were obtained at the 10th shot. Table 3 summarizes the numerical values of extracted features – filling point, maximum pressure and inflection point pressure – and the obtained lens form errors of the surfaces of S1 and S2.
Extracted feature values and measured lens form errors for each experimental case.
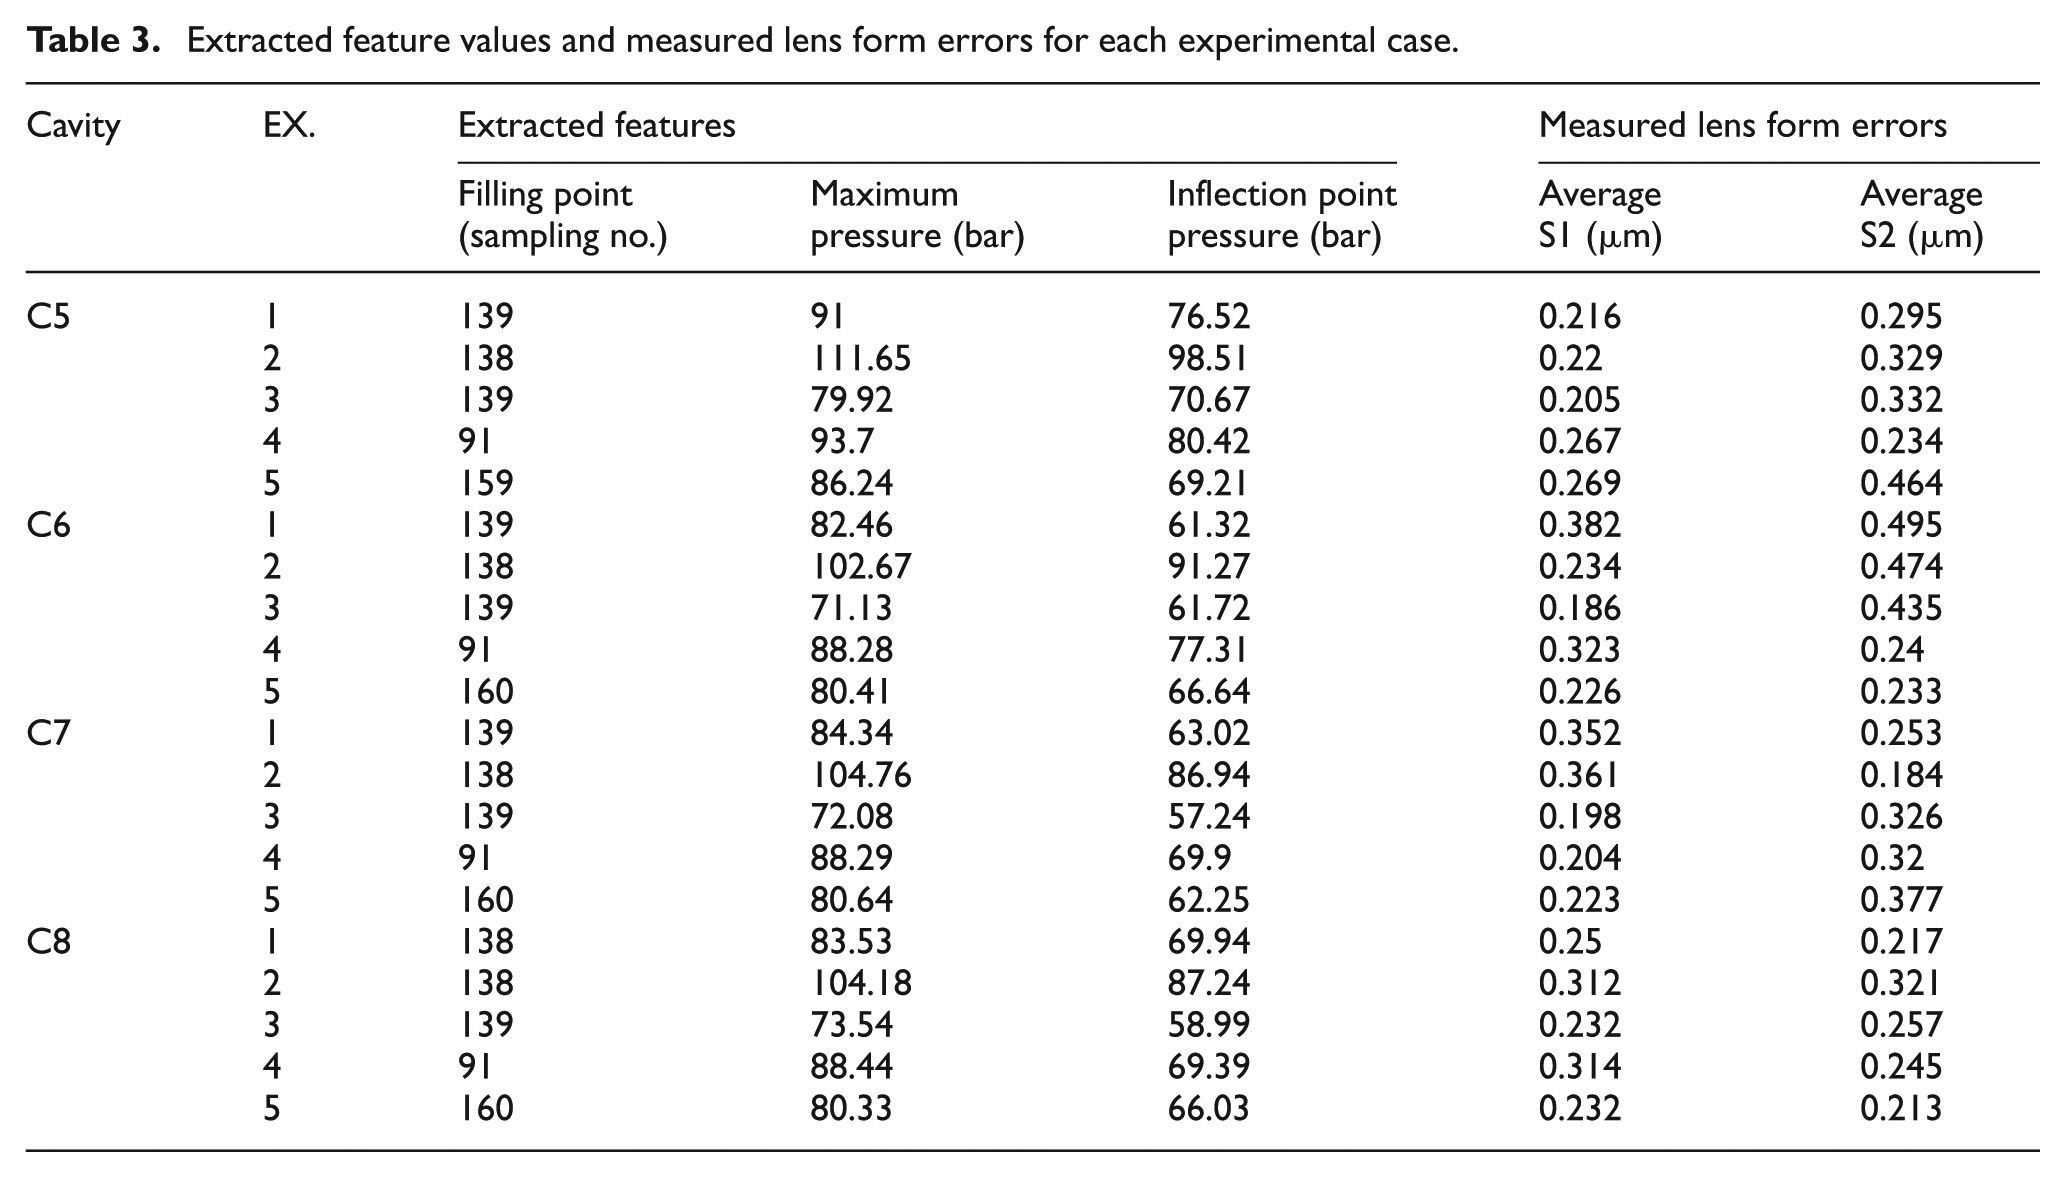
As can be seen in Table 3, the extracted features and measured lens form errors for all 5 experimental cases were obtained at each cavity. Therefore, total 20 data sets were prepared for the analysis. The regression functions to estimate the lens form errors were based on an RSM by considering the extracted features as input variables. The equations (2) and (3) represent the formulated regression functions of the lens form errors for the surfaces of S1 and S2, which is denoted by LFES1 and LFES2, respectively. Similar to the equation (1), x1, x2 and x3 represent the filling point, maximum pressure, and inflection point pressure, respectively, in the equations (2) and (3)
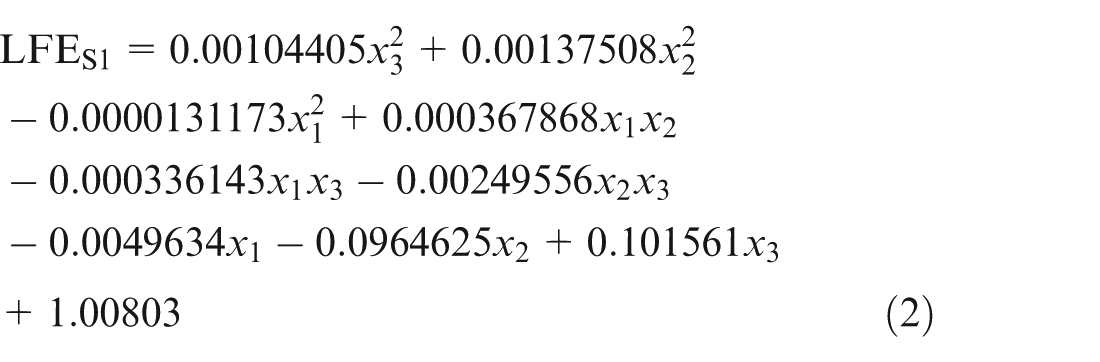
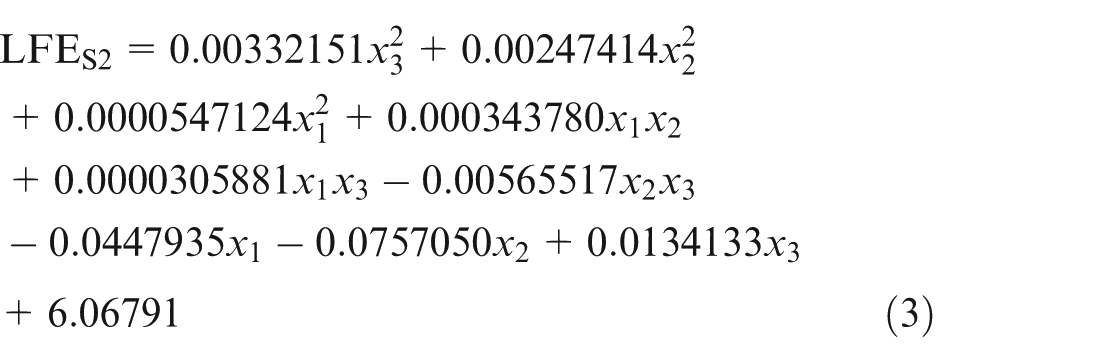
The measured and estimated lens form errors for each experimental case are graphically shown in Figures 9 and 10. In the case of LFES1, the average difference rate between estimated and measured lens form errors was about 6%, and the formulated regression function could be used for accurately estimating the lens form errors to a degree. On the other hand, in the case of LFES2, the average difference rate was more than 20%, and thus, the regression function might not be applicable for estimating the lens form errors. In this latter case, the signals such as a cavity temperature and internal sensor signals of the injection moulding machine could be additionally considered to increase the accuracy of the regression function. Otherwise, additional features such as holding pressure and V/P pressure could also be extracted to build the regression function.
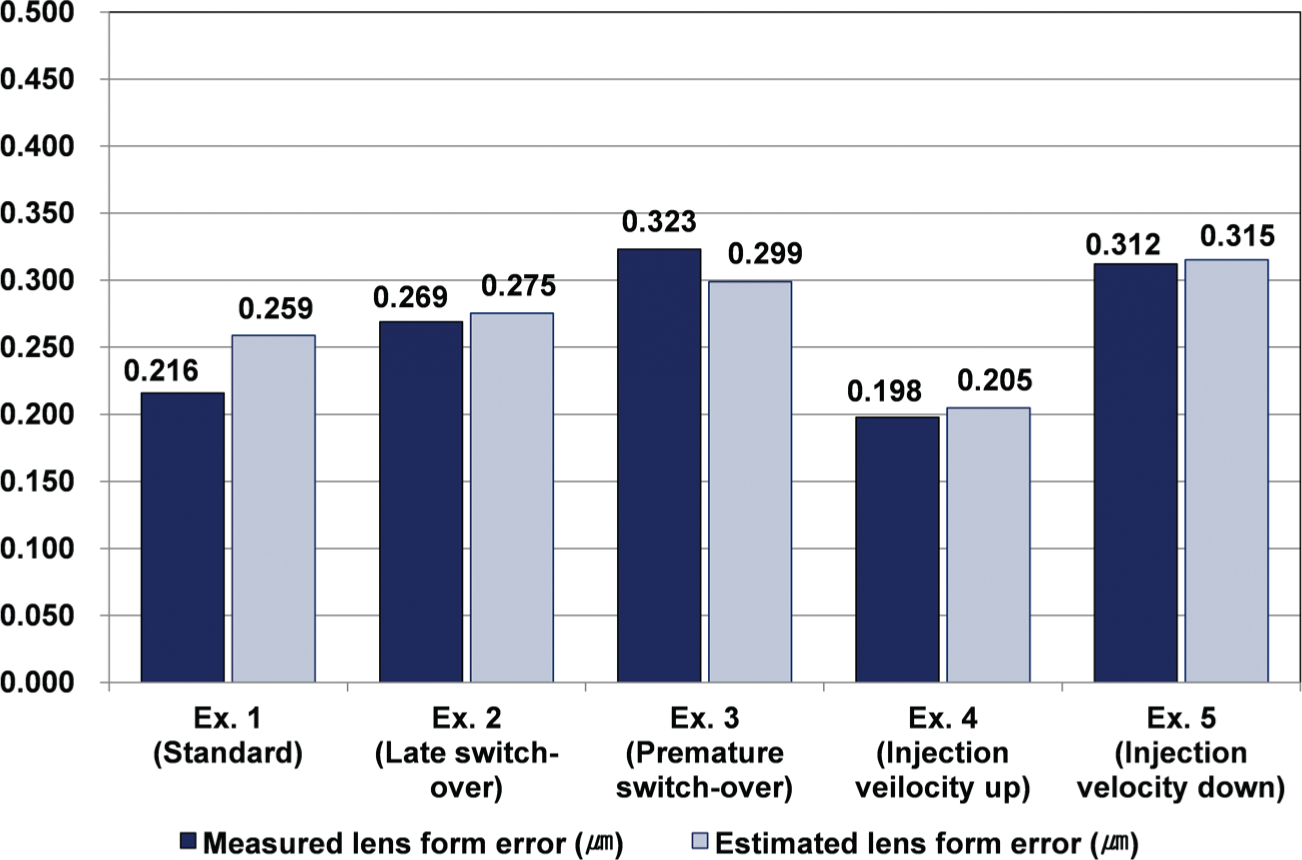
Measured and estimated lens form errors for surface S1 (LFES1).
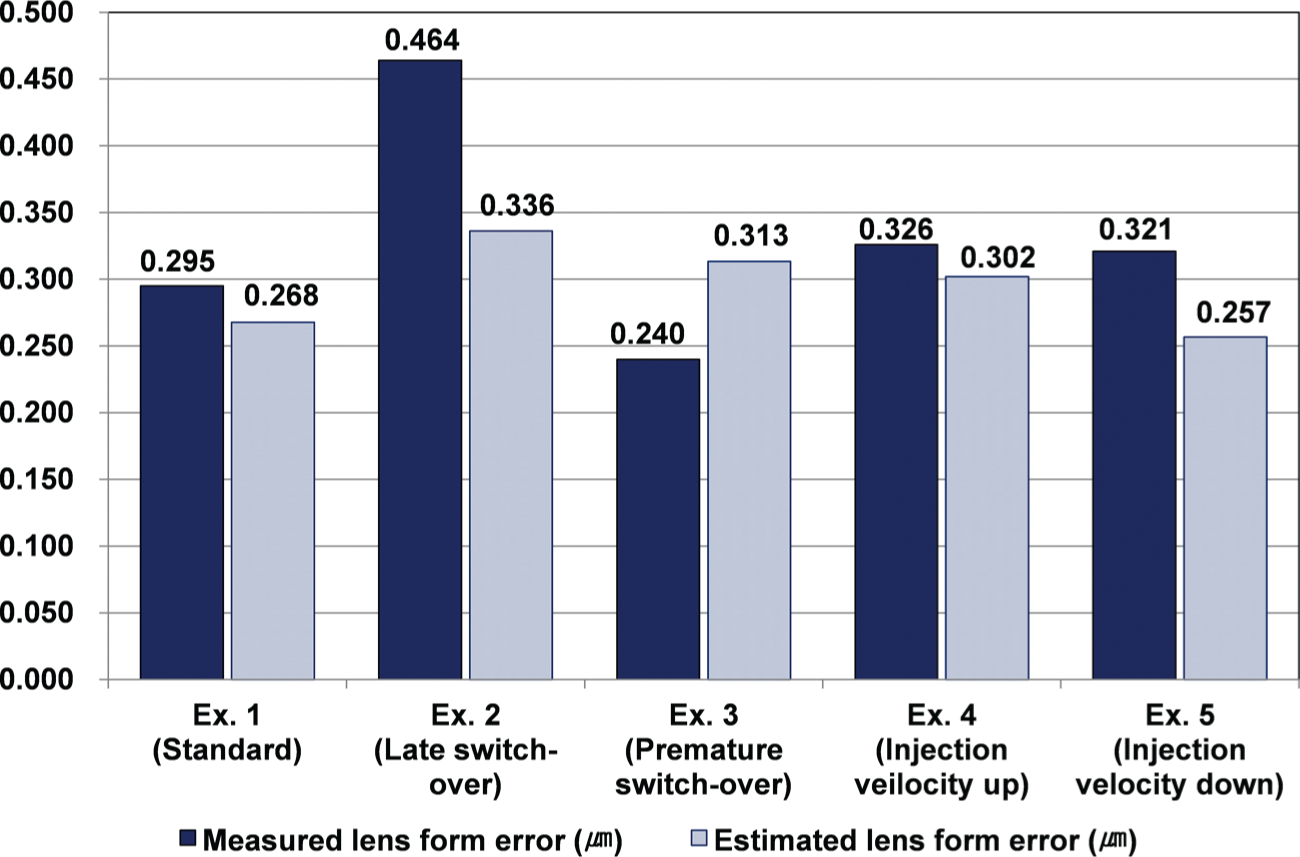
Measured and estimated lens form errors for surface S2 (LFES2).
Conclusion and future work
In this article, the condition diagnosis and form error prediction algorithm for the lens injection moulding process in the industrial site was proposed. In the lens injection moulding experiments, the mould in which the cavity pressure sensors were built was used, and the in-process cavity pressure signals were monitored and processed to extract three critical features such as filling point, maximum pressure and inflection point pressure. Then, the lens injection moulding condition diagnosis model was developed based on an RSM by using those features. In addition, the response surface functions of the lens form errors were formulated by using the extracted features.
The experimental results demonstrated that the overall average accuracies of the lens injection moulding condition diagnosis and form error estimation were about 97% and 80%, respectively, in the actual industrial site. These results imply that the proposed algorithm could be reasonably applied to the lens injection moulding process. More specifically, the lens injection moulding condition diagnosis algorithm is readily applicable with its high accuracy. On the other hand, in the case of the lens form error estimation algorithm, additional features including holding pressure and V/P pressure and signal such as cavity temperature may be necessary for enhancing accuracy.
Footnotes
Declaration of conflicting interests
The authors declare that there is no conflict of interest.
Funding
This work was supported by the Industrial Strategic Technology Development Program, 10040952, Development of BIS (built-in sensor)-based Injection Moulding System with Rapid Response Ability and Autonomous Intelligence funded by the Ministry of Trade, Industry & Energy (MI, Korea).