
Abstract
This article discusses the development of lens form error prediction models using in-process cavity pressure and temperature signals based on a k-fold cross-validation method. In a series of lens injection moulding experiments, the built-in-sensor mould is used, the in-process cavity pressure and temperature signals are captured and the lens form errors are measured. Then, three features including maximum pressure, holding pressure and maximum temperature are identified from the measured cavity pressure and temperature profiles, and the lens form error prediction models are formulated based on a response surface methodology. In particular, the k-fold cross-validation approach is adopted in order to improve the prediction accuracy. It is demonstrated that the lens form error prediction models can be practically used for diagnosing the quality of injection-moulded lenses in an industrial site.
Keywords
Introduction
Due to high productivity and enhanced accuracy, an injection moulding process has been widely used for producing precision optical components. In particular, microplastic lenses for a mobile phone have been mainly manufactured by an injection moulding process. 1 They usually require high-dimensional accuracy, and thus their quality management has been of much significance by monitoring and controlling major injection moulding parameters affecting the accuracy.
Monitoring of a lens injection moulding process has been traditionally carried out by well-trained workers, and thus its systematic and reliable practice in an industrial site could hardly be possible. In this context, much research on monitoring and diagnosis of the lens injection moulding process has been conducted. The blackboard-based expert system with a case-based reasoning framework was proposed by Kwong and Smith 2 to obtain the optimal injection moulding conditions. Zhang 3 proposed an in-process poka-yoke system to monitor injection moulding flash when using a mixed plastic resin by employing an accelerometer and collecting vibration signals. In this study, the featured injection moulding vibration signals were identified through data analyses, and they were then used as input variables through logistic modelling to predict flash in the injection moulding process. Ribeiro 4 introduced a support vector machine (SVM) algorithm to indicate injection-moulded part quality by monitoring in-process data. An online product quality–monitoring system has been presented by Gao et al., 5 and they measured four parameters – melt pressure, temperature, velocity and viscosity – within the injection mould cavity to be correlated with the part quality – thickness and width. They introduced a support vector regression (SVR) model to relate the multivariate sensor outputs to the part dimensions and validated the model via the part thickness measurement. Zhu and Chen 6 used a fuzzy neural network (FNN) algorithm to accurately predict the part flash based on injection speed, melt temperature and holding pressure and vibration amplitude during mould-closing and injection-filling stages. Zhao et al. 7 proposed a non-destructive online method for monitoring an injection moulding process. They developed a feed-forward neural network model to predict cavity pressure with the inputs of mould temperature, injection hydro-cylinder pressure and ultrasonic reflection coefficient. It also demonstrated that the online measured cavity pressure agreed well with the predicted one. Zeaiter et al. 8 used a multivariate regression algorithm to monitor an injection-moulded part quality using a cavity pressure sensor. In their study, the weight and dimension of an injection-moulded plastic part were successfully monitored based on the developed model.
Regarding a precision injection moulding process of plastic optical lenses, the effects of various parameters including injection speed, holding pressure and mould temperature on the lens contour error were investigated by Lu and Khim. 9 Tsai et al. 10 conducted the empirical and theoretical analyses to study the effects of process parameters on the optical lens quality such as light transmission, surface waviness and surface finish. Tsai and Lan 11 also studied the correlation between runner pressure and cavity pressure in different runner positions and determined a runner position where the runner pressure can represent the cavity pressure. In view of this, the runner pressure could be used as a key process parameter to monitor and control form accuracy (contour precision).
Meanwhile, Nam et al. 12 have been conducting research on the lens injection moulding process diagnosis and quality prediction using in-process signals from the built-in-sensor (BIS) mould. Their recent research covered the development of lens injection moulding condition diagnosis and lens form error prediction algorithm based on a response surface methodology (RSM) using the extracted features from in-process cavity pressure signals which were measured from the BIS mould.
In this article, the lens form error prediction models are developed using cavity temperature as well as cavity pressure, which are collected by the BIS mould during an injection moulding process. An RSM is applied to formulate the models based on the features – maximum pressure, holding pressure and maximum temperature – extracted from cavity pressure and temperature signals. Then, a k-fold validation approach is applied in order to improve the prediction accuracy. The predicted lens form errors are compared with measured ones, and the practical applicability of the lens form error prediction model is investigated.
Lens injection moulding experiments and feature extraction
Experimental design
The injection moulding machine (SE30DUZ) manufactured by Sumitomo was used for lens injection moulding experiments, which is shown in Figure 1. A lens material used in the experiments was EP-5000, which was a product of Mitsubishi Gas Chemical. In addition, the radial-type mould having 12 cavities with 8 megapixel resolution has been used for the experiments. The cavity pressure sensor (9130B; Kistler) and cavity temperature sensor (K-type thermocouple) were built into the lens mould to collect in-process signals. The photos of the mould and injection-moulded lens are shown in Figure 2.
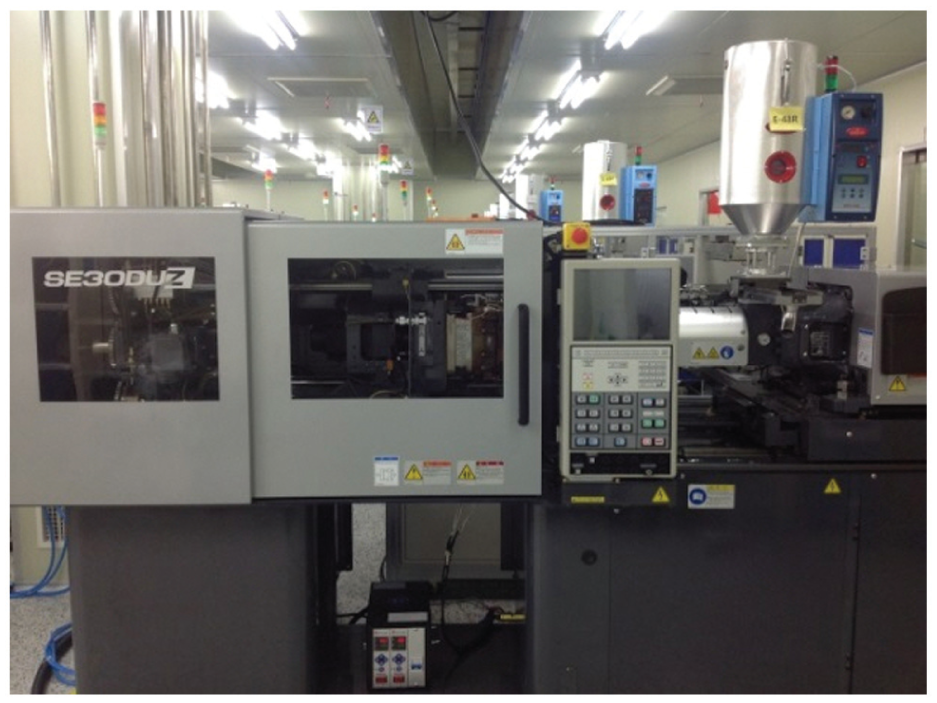
Photo of the lens injection moulding machine (SE30DUZ; Sumitomo Co.).
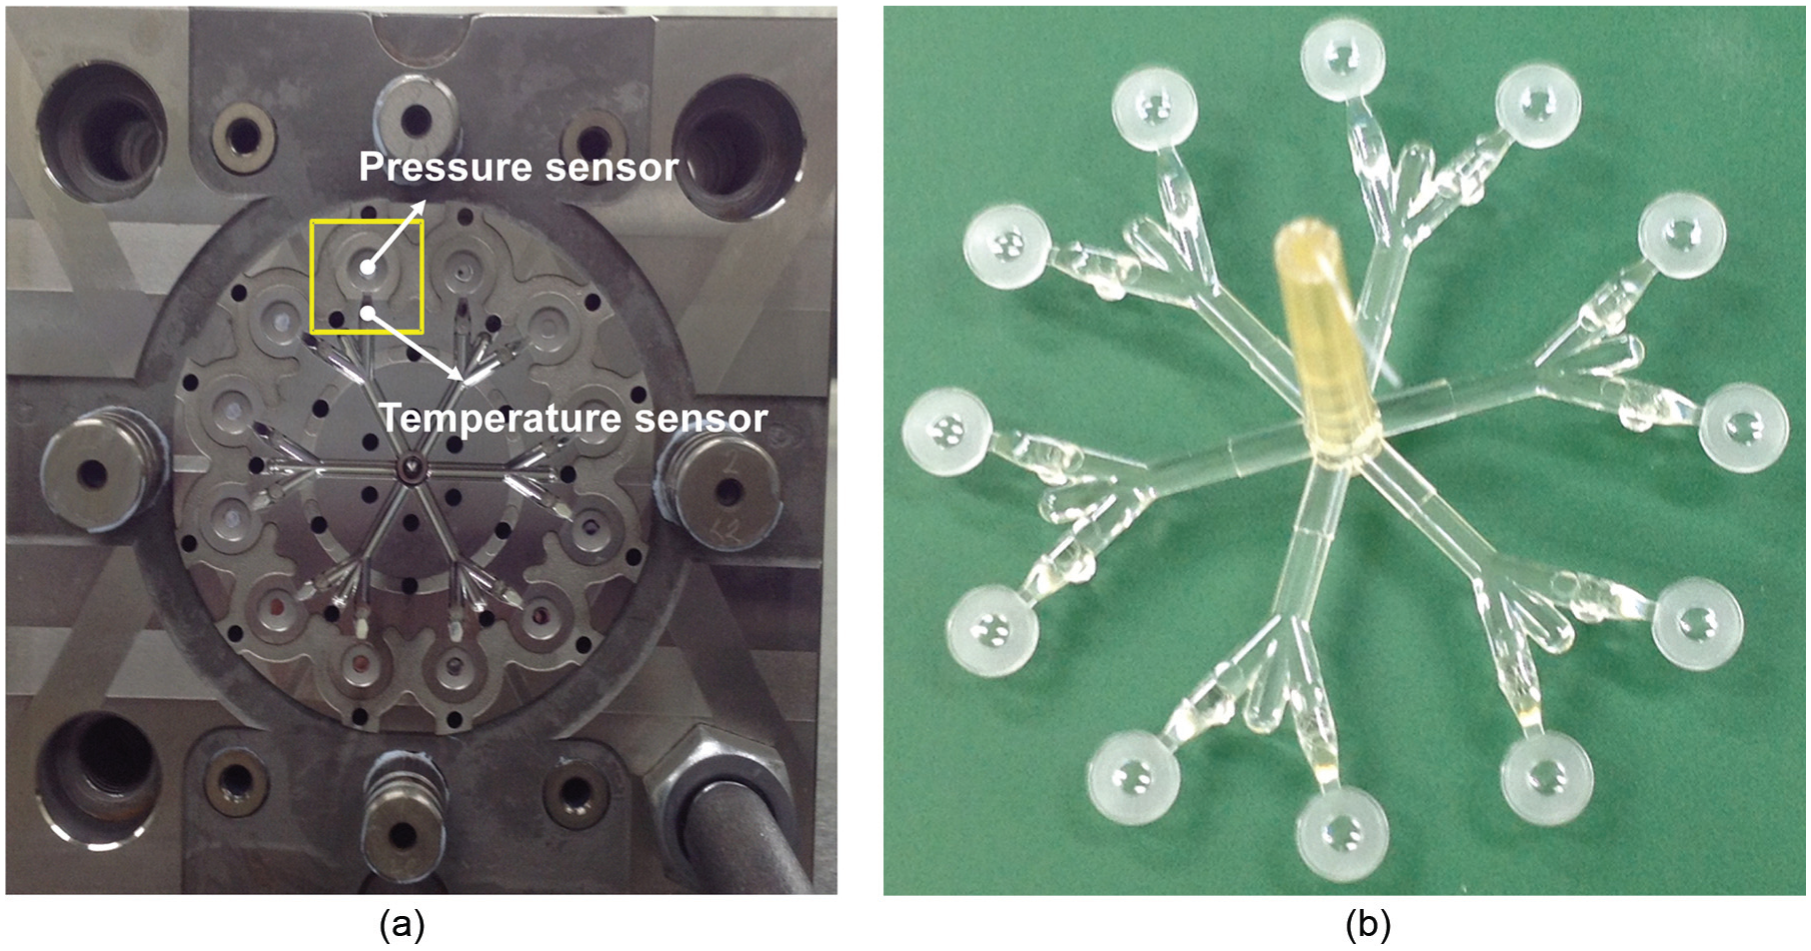
The photos of (a) the radial-type lens mould with built-in-sensors and (b) the injection-moulded lens.
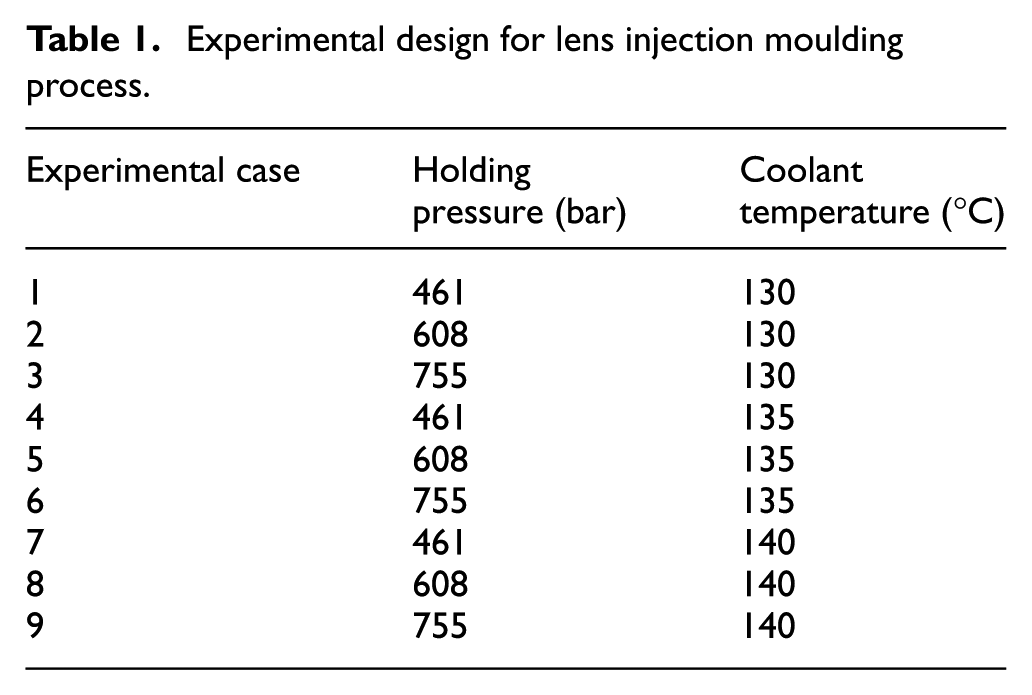
Lens injection moulding experiments were designed based on a design-of-experiment (DOE) approach. In the experimental design, the holding pressure and coolant temperature were process parameters. Three levels of each parameter were considered, and then total nine experimental cases were sorted out. In addition, the nozzle temperature, holding time and cycle time were set to fixed variables, and their numerical values were 255 °C, 4 s and 34.7 s, respectively. The results of the injection moulding experimental design are given in Table 1. In each experimental case, 20 lens injection moulding shots were conducted, and thus total 180 shots were carried out.
Experimental design for lens injection moulding process.
Experimental results and feature extraction
The representative profiles of measured cavity pressures and temperatures in all nine experimental cases are given in Figure 3. As can be seen in Figure 3(a), the measured cavity pressures increased according to increase in the setting holding pressure under same setting coolant temperatures of 130 °C and 135 °C, respectively, in the experimental cases from 1 to 6. However, the measured cavity pressure did not sufficiently increase, although the setting holding pressure reached the maximum (755 bar) in the experimental case 9. In this case, the high coolant temperature could lower a viscosity of melting plastic material, and it might not be able to withstand such large holding pressure. Therefore, the measured cavity pressure could be considerably dropped, as can be seen in Figure 3(a).
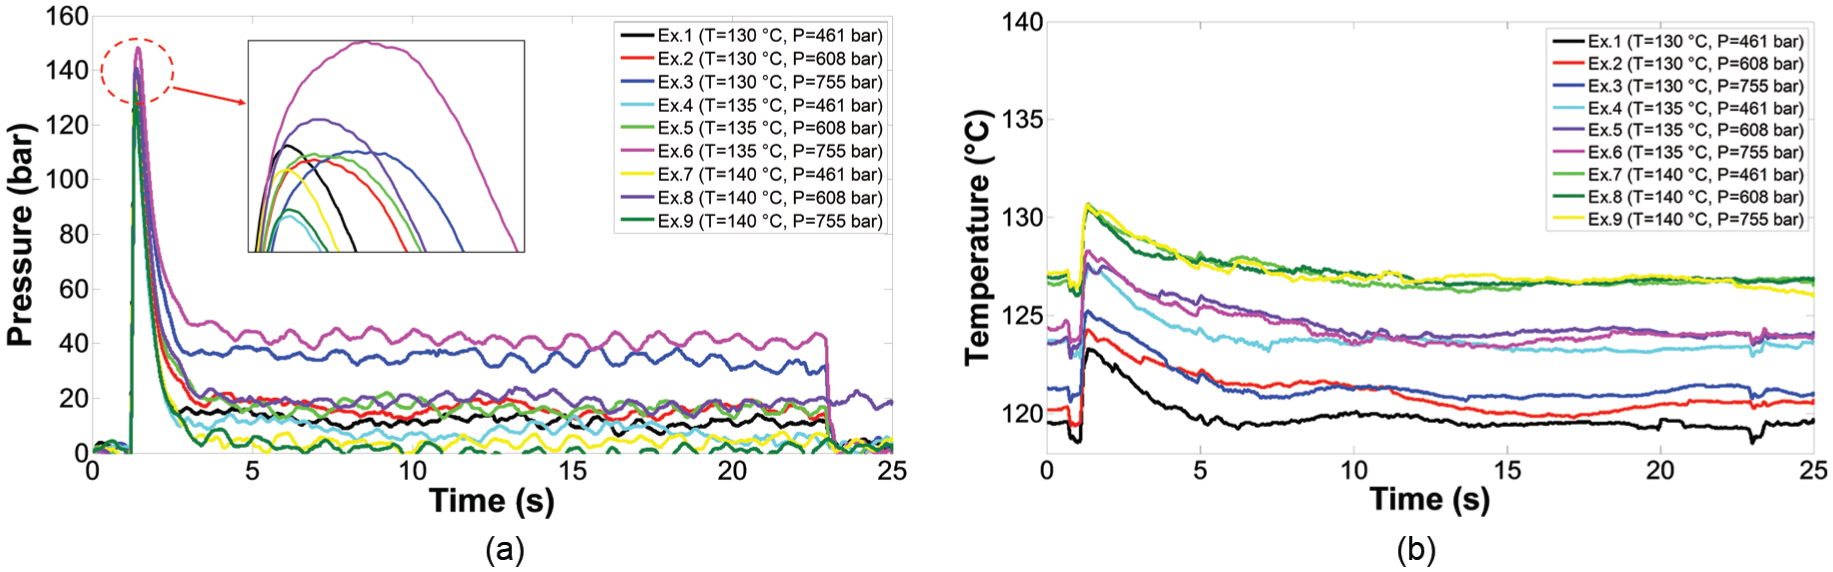
The representative-measured (a) cavity pressure and (b) cavity temperature profiles for each experimental case.
In Figure 3(b), the representative-measured temperature profiles are given, and those captured in the experimental cases having the same setting coolant temperature were similar to each other. Thus, three groups could be identified according to the shapes and magnitudes of the measured temperature profiles, as can be seen in Figure 3(b).
There are three stages during a lens injection moulding process such as injection stage, compression stage and holding pressure stage. Melted plastic material fills the cavity during the injection stage, and the filled plastic material is compressed in the compression stage. Finally, in the holding pressure stage, the plastic material which is being solidified is under constant pressure in the cavity. It has been generally believed that the form of a moulded lens could be primarily influenced during the injection stage and that its dimensions could mostly be controlled by holding pressure. 13 In addition, the temperature of melted plastic material has been of much significance to affect a lens quality, too.
Therefore, three features were extracted such as the maximum pressure, holding pressure and maximum temperature from the measured cavity pressure and temperature profiles given in Figure 3. As can be seen in Figure 4(a), the maximum pressure and holding pressure corresponding to the points A and B were identified from the measured cavity pressure profile. In addition, as can be seen in Figure 4(b), the point C in the measured temperature profile denotes the maximum temperature.
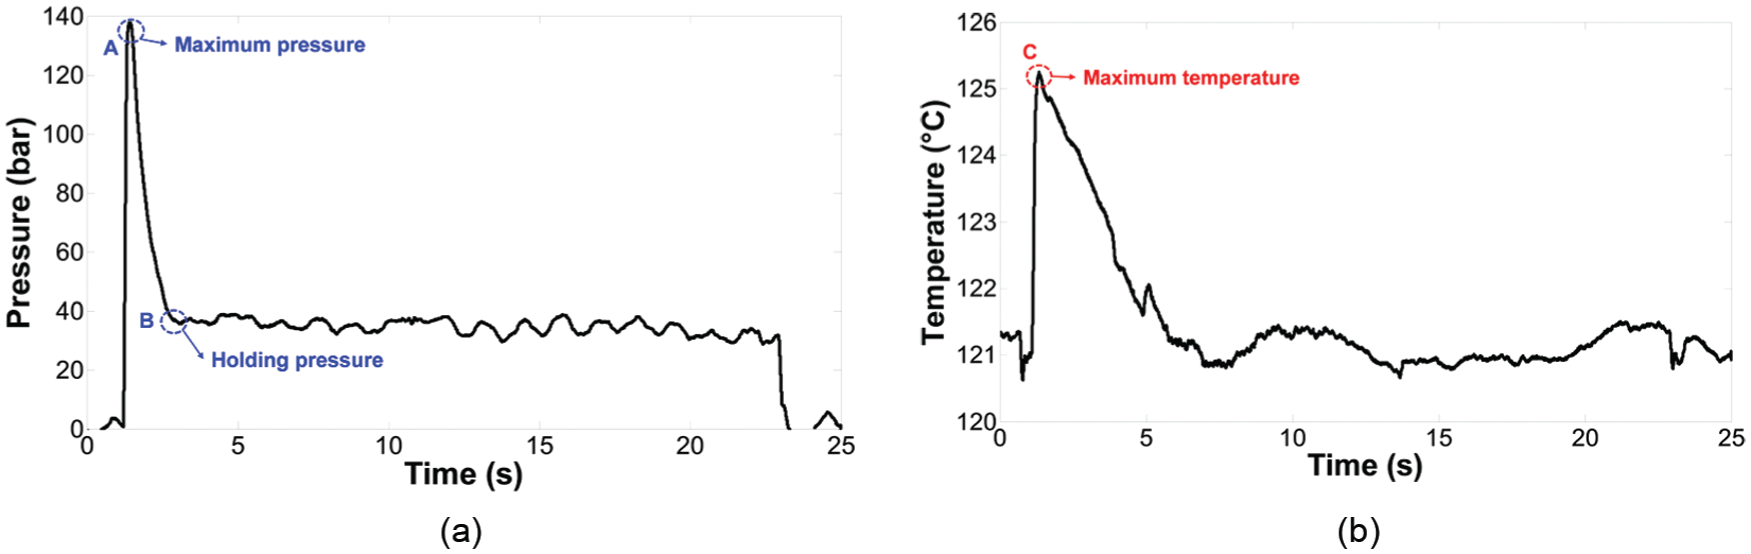
Features of (a) maximum pressure and holding pressure extracted from the measured cavity pressure profile and (b) maximum temperature extracted from the measured temperature profile.
Lens form error measurement and prediction
Lens form error measurement results
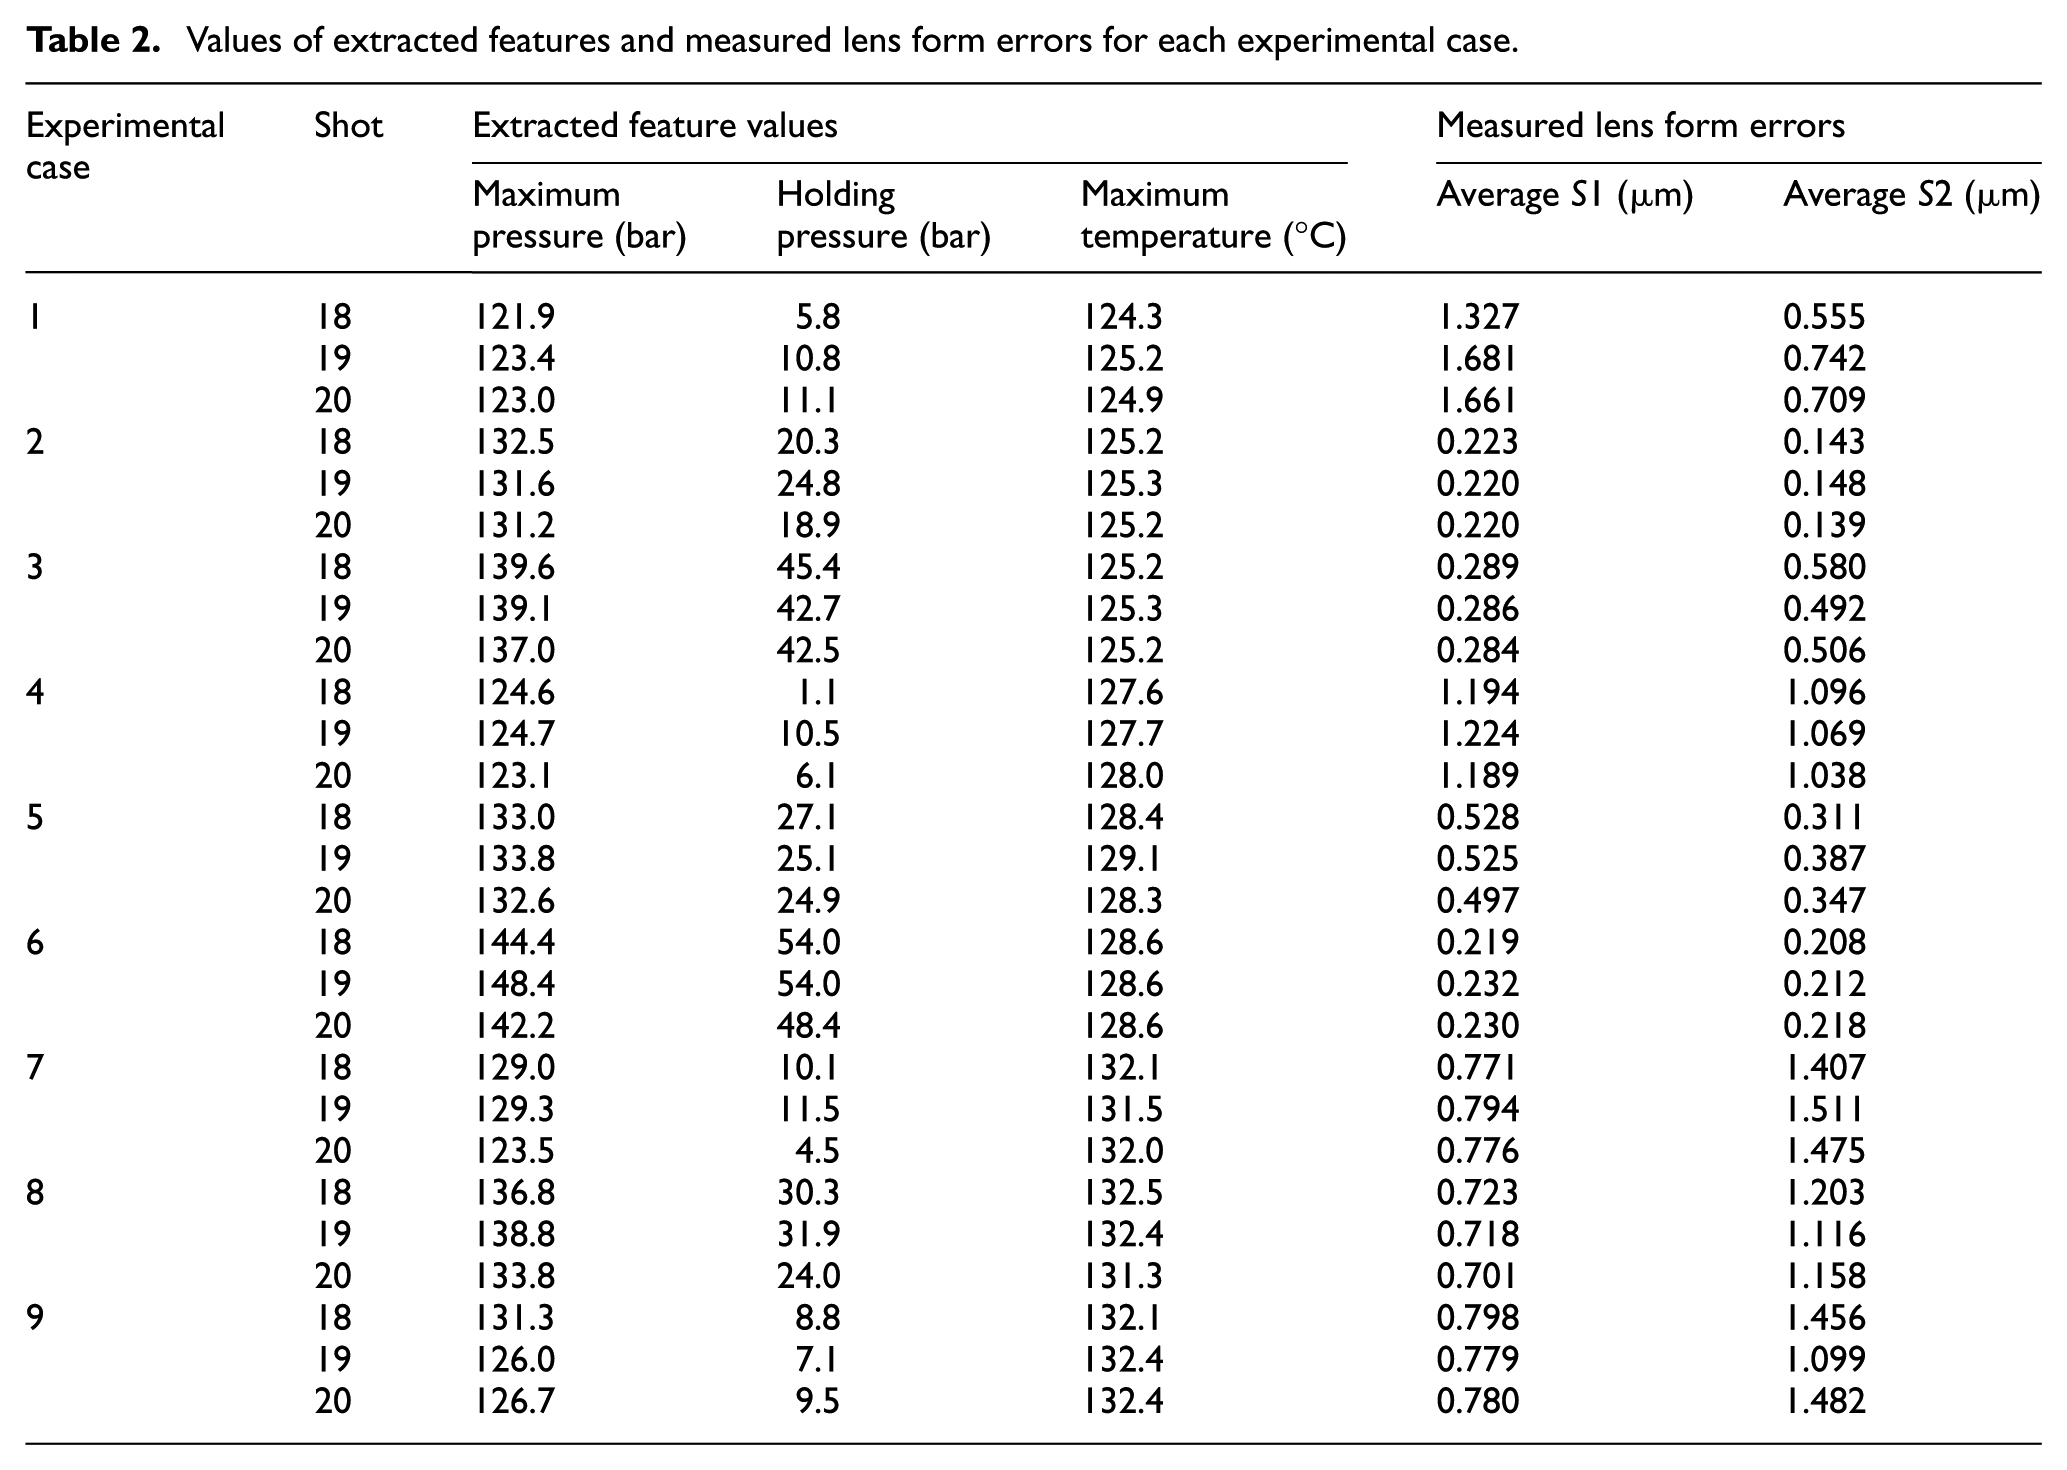
A lens form error has been of much importance for determining quality of injection-moulded lenses among various indices in the industrial site. According to the definition and measuring procedure of the lens form error in the authors’ previous research, the form errors of the injection-moulded lenses were measured in all nine experimental cases, which are given in Table 2. 12 The measuring equipment was the Form Talysurf PGI 840 from Taylor Hobson Ltd. Two surface roughness values for each surface –S1 and S2 – along its two perpendicular directions were measured, and their average values were considered as the form errors. As can be seen in Table 2, three sets of the lens form errors, which were obtained from the cavity 1 at the 18th, 19th and 20th shots, are obtained with the extracted feature values in each experimental case.
Values of extracted features and measured lens form errors for each experimental case.
Lens form error prediction using k-fold cross validation
The lens form error prediction models were established by considering the three feature variables – maximum pressure, holding pressure and maximum temperature – as the input parameters and the measured lens form errors as the output responses, respectively. A k-fold cross-validation approach was adopted to enhance the accuracy of the lens form error prediction models.
A k-fold cross validation is a statistical method for validating a predictive model. In this approach, original data are randomly partitioned into k sub-data sets having equal size. Of the k sub-data sets, a single subset is kept as the validation data for testing the model, and the remaining k−1 sub-data sets are used for training the model. 14
As can be seen in Table 2, the 27 lens form error data for each surface were prepared in all nine experimental cases. Those 27 data were divided into three sub-data sets according to the shot numbers. Then, of those three sub-data sets, two sub-data sets were used for training the lens form error prediction model, and the remaining sub-data set was used for validating the model in a cyclic manner, as schematically illustrated in Figure 5. For instance, the lens form error sub-data sets measured from the 19th and 20th shots were used for training the model, and that from the 18th shot was used for testing in the case 1. The mathematical formulation of the lens form error prediction model was based on an RSM.
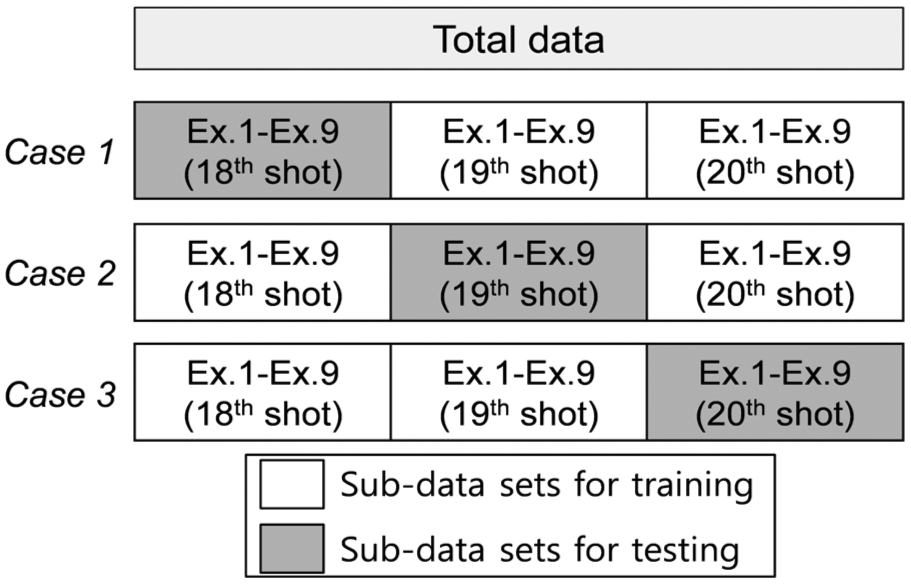
Schematic diagram of the usage of data sets to establish the lens form error prediction model with a k-fold cross validation.
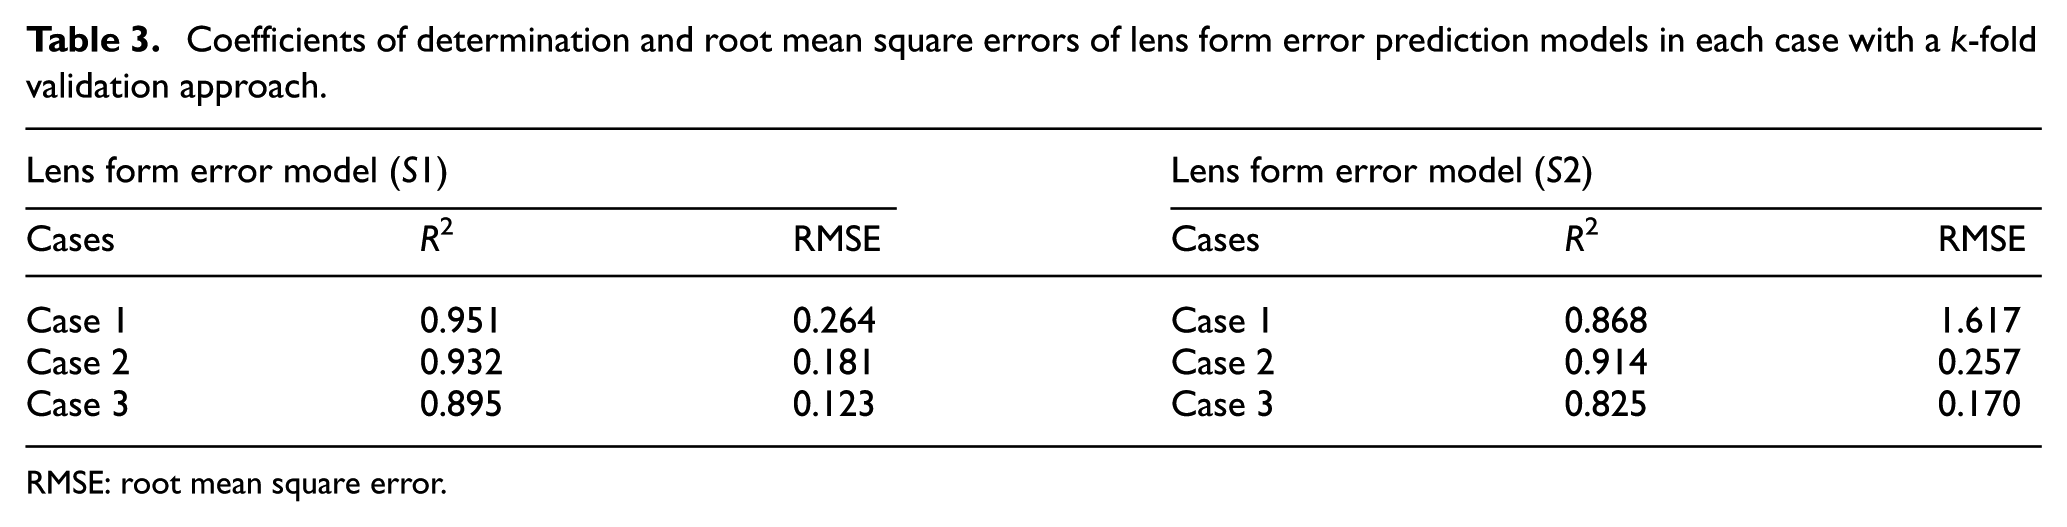
In Table 3, the coefficient of determination (R2) and root mean square error (RMSE) in each k-fold validation case are given. As can be seen in the table, the R2 and RMSE of the lens form errors in the cases 1, 2 and 3 are 0.951, 0.264 and 0.932, 0.181 and 0.895, 0.123, respectively. In addition, regarding S2, the R2 and RMSE in the cases 1, 2 and 3 are 0.868, 1.617 and 0.914, 0.257 and 0.825, 0.170, respectively. Therefore, the best lens form error prediction models for both the surfaces of S1 and S2 could be obtained with training the sub-data sets of lens form errors from the 18th and 19th shots, and thus the minimum RMSEs could be obtained with testing the sub-data sets from the 20th shot in the k-fold cross-validation approach.
Coefficients of determination and root mean square errors of lens form error prediction models in each case with a k-fold validation approach.
RMSE: root mean square error.
These results implied that there would be optimal sets of data for training and testing the models to improve the prediction accuracy of lens form errors. In other words, a k-fold validation approach could allow to effectively find the optimal combination of data sets.
The regression functions – denoted by LFES1 and LFES2– in the cases producing the best average prediction accuracies of lens form errors are given in equations (1) and (2) for the surfaces of S1 and S2, respectively. In each equation, x1, x2 and x3 represent the maximum pressure, maximum temperature and holding pressure, respectively. The measured and predicted lens form errors at the surface of S1 and S2 are given in Figure 6
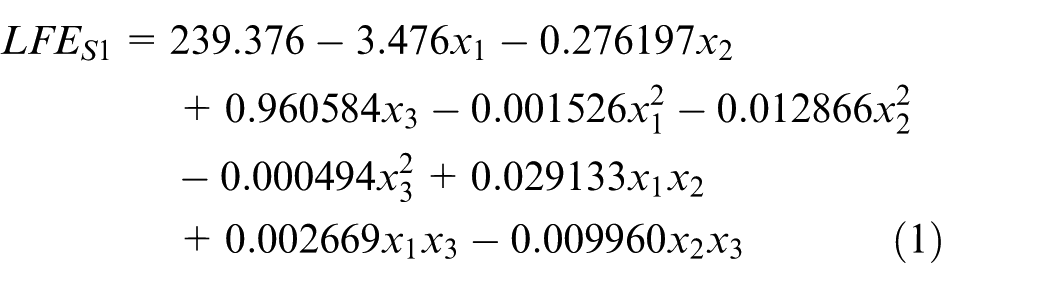
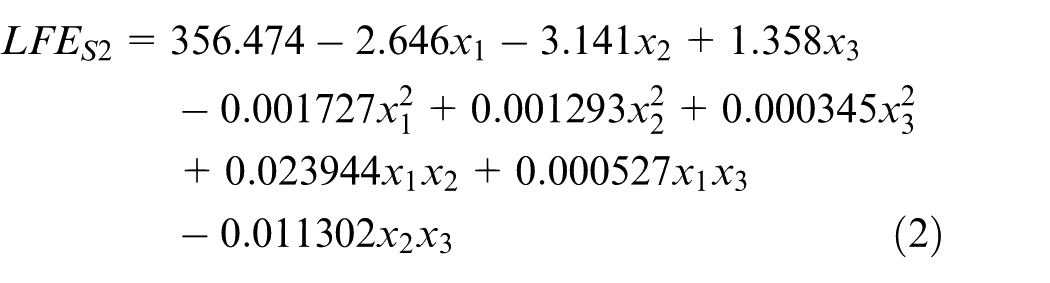
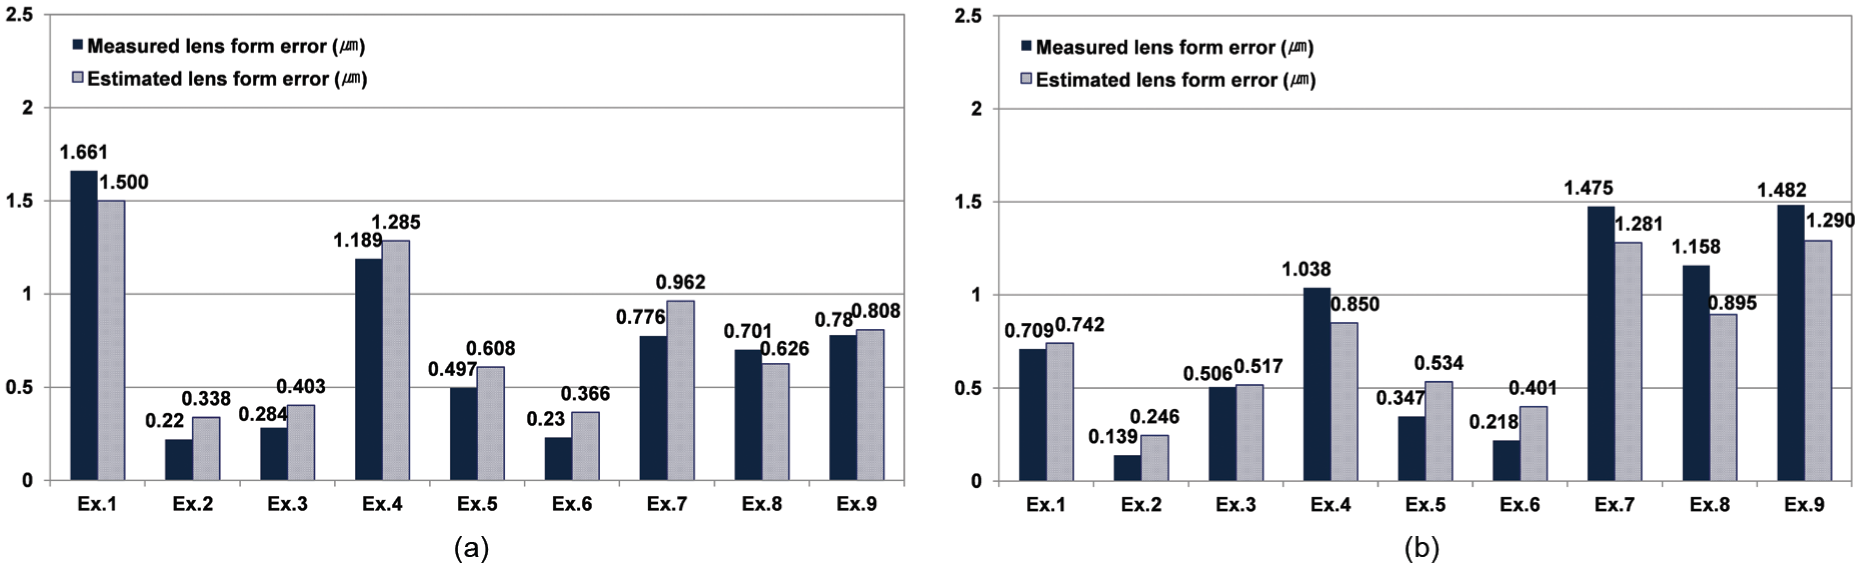
Measured and predicted lens form errors for (a) the surface S1 (LFES1) and (b) the surface S2 (LFES2).
In an industrial site, the above-obtained lens form error prediction models can be used to predict faulty lenses during the injection moulding process. If the lens form error value is larger than 0.6 µm, the lens is classified as a defective one. Therefore, as can be known from Figure 6, the best lens form error prediction models for S1 and S2 could determine either good or faulty lenses for all experimental cases in the industrial site.
Conclusion and future work
This article discussed the development of an injection-moulded lens form error prediction algorithm based on a k-fold cross-validation approach. The BIS mould was used for the lens injection moulding process, and the in-process cavity pressure and temperature signals were captured. From the measured cavity pressure and temperature profiles, three features including the maximum pressure, holding pressure and maximum temperature were extracted. Meanwhile, the lens form errors were obtained by measuring average surface roughness values. When formulating the lens form error prediction models, an RSM was applied by taking the three features as input and the lens form errors as output.
A k-fold cross-validation approach was introduced to improve the prediction accuracy. In the k-fold cross-validation approach, three data sets were prepared, and two data sets were trained and a remaining data set was tested in a cyclic manner. The lens form error prediction models for the surfaces of S1 and S2 with the least RMSE could be chosen as the final ones. The finally selected models’ RMSEs for S1 and S2 were 0.123 and 0.170, respectively. The R2 values of those models were 0.895 and 0.825, respectively, which indicated the models’ good reliability to predict the lens form errors.
In the industrial site, the obtained lens form error prediction models could be practically used for predicting either good or faulty lenses. The prediction results also confirmed the models’ reliability to sort out the faulty lenses.
Footnotes
Declaration of conflicting interests
The author(s) declared no potential conflicts of interest with respect to the research, authorship and/or publication of this article.
Funding
The author(s) disclosed receipt of the following financial support for the research, authorship, and/or publication of this article: This work was supported by both the Industrial Strategic Technology Development Program (10040952) funded by the Ministry of Trade, Industry & Energy (MI, Korea) and the Industry-Academia Cooperation R&D Program (C0297173) funded by the Small and Medium Business Administration (SMBA, Korea).