
Abstract
A sequentially coupled thermo-mechanical finite element model is used to simulate the friction stir welding process. Fracture mechanical models for the middle tension specimen and the eccentrically loaded single-edge crack tension specimen are established. Utilizing the residual stress intensity factor obtained by the fracture mechanical models, the crack-closure model and superposition method are adopted to predict the fatigue crack growth rates of the two specimens. The results indicate that the effect of the residual stress on the fatigue crack growth rate becomes obvious as the stress ratio decreases. Considering the residual stress, the fatigue life of the welded plate exhibits a dramatic decrease for the middle tension specimen, but a remarkable increase for the eccentrically loaded single-edge crack tension specimen. The fatigue life of the middle tension specimen is almost insensitive to the rotational speed, but that of the eccentrically loaded single-edge crack tension specimen increases with the increase in the rotational speed.
Introduction
Friction stir welding (FSW) technology has a wide application in aerospace, automobile and shipping industries due to its excellent properties, such as high strength, low distortion and reduced occurrence of defects.1–3 Compared with the conventional riveting technique, the cost and weight of the integral structures can be reduced. 4 However, it is notable that the weld-induced residual stress may have an obvious effect on the damage tolerance 5 and the service life.6,7 Hence, a lot of work has been done to study the influence of the residual stress on the fatigue crack growth rate (FCGR) of the welded structures.8–14
Bussu and Irving
8
studied the surface crack tension specimen and the compact tension specimen using experimental method. The results indicate that the FCGR in the welded plate strongly depends on the location and orientation with respect to the weld line, and the crack growth behavior in the weld zone is generally dominated by the residual stress. Ma et al.9,10 studied the effect of the plate size on the FCGR in friction stir welded specimen by both experimental and numerical methods. The superposition method and the crack-closure model are usually adopted to predict the FCGR in weld-induced residual stress field.
11
For these two methods, the calculation of residual stress intensity factor (
Although scholars have achieved numerous useful conclusions, not much work has been carried out to study the influence of the residual stress on the fatigue life of the friction stir welded AA 2024-T3 joint and the effect of the rotational speed on the fatigue life of the welded plate. In this work, a sequentially coupled thermo-mechanical model is used for FSW simulation with different rotational speeds. The obtained residual stress is rebalanced in the fracture mechanical model to calculate
Model descriptions
Sequentially coupled thermo-mechanical model
The governing equation of the transient heat transfer analysis can be written as15–17
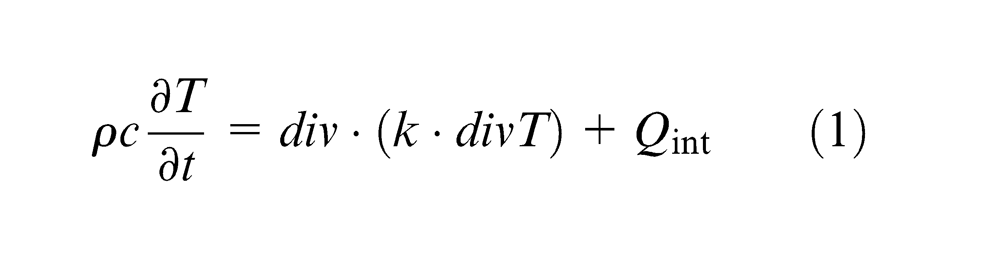
where
The frictional heat between the welding tool and the plates is considered as a moving surface heat source and a moving body heat source 18
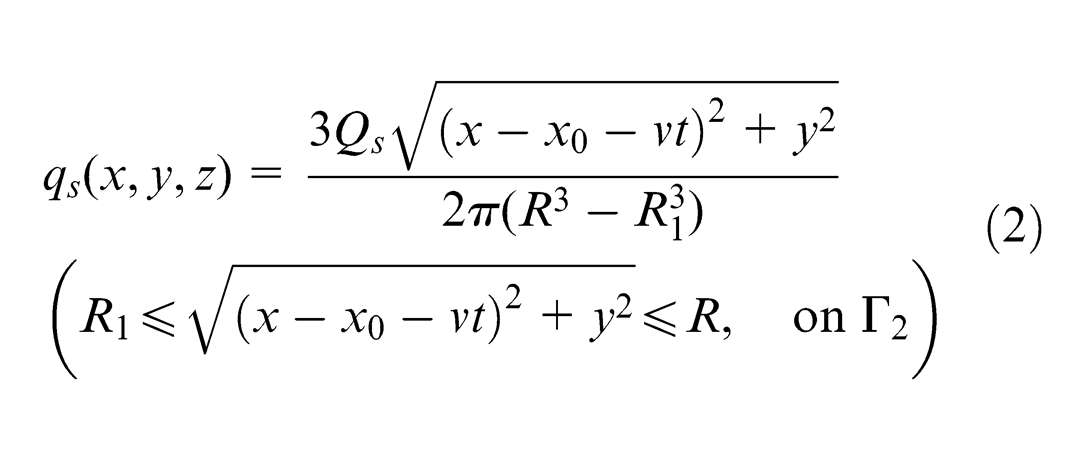
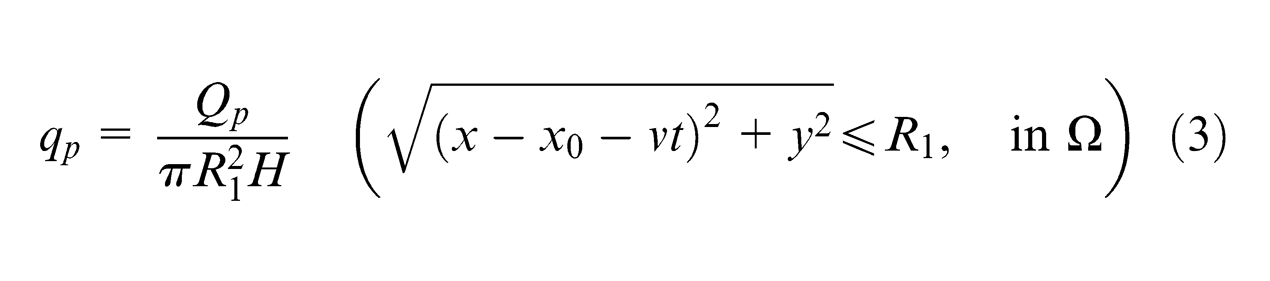
where
In the thermo-mechanical analysis, the fixtures are treated as rigid constraints in the welding and the subsequent cooling processes, as shown in Figure 1. When the plate is cooled down to the ambient temperature, the rigid constraints are released. Then, point A is constrained in all the three directions and point B is fixed in the transverse and thickness directions.
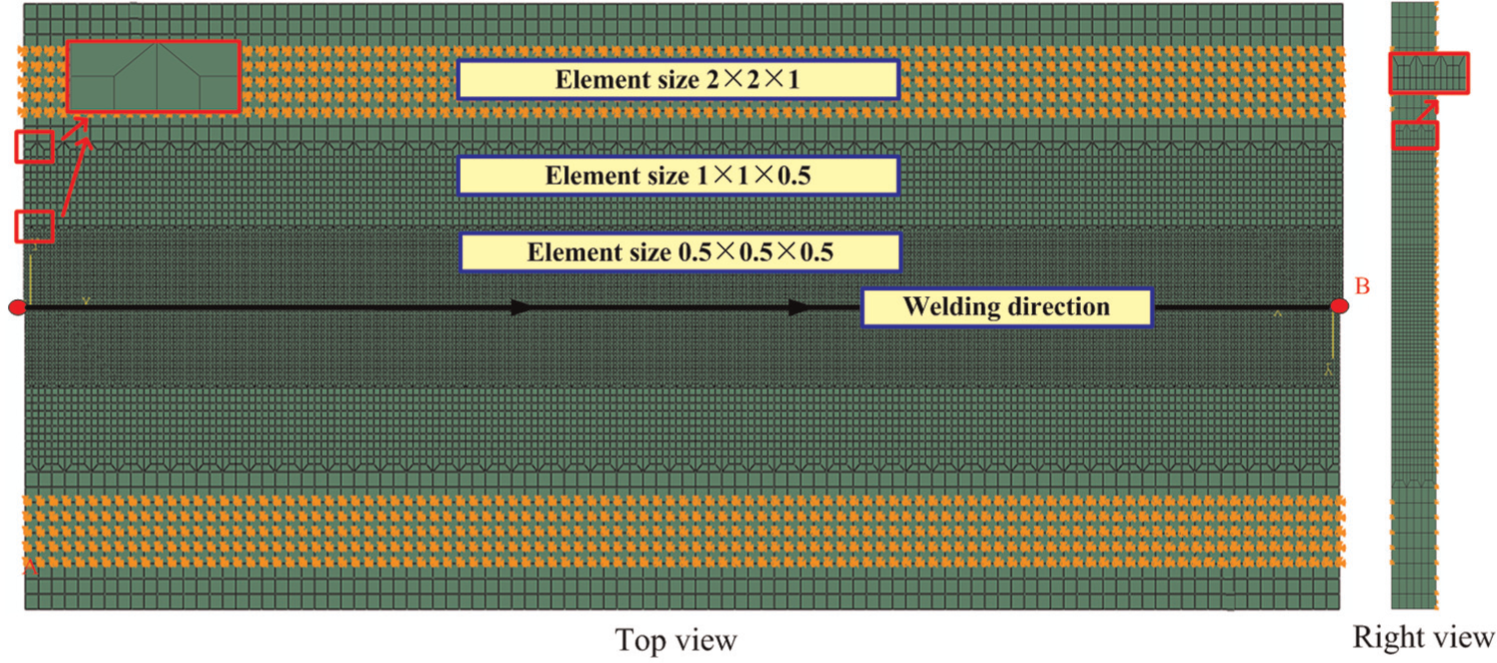
Meshing condition and constraints for the thermo-mechanical analysis.
The plate size is 200 × 80 × 6 mm, as illustrated in Figure 1. The transverse speed is 2 mm/s. The rotating speeds are 300, 650 and 1000 r/min, respectively. The eight-node linear brick element is used for the heat transfer analysis and the subsequent thermo-mechanical analysis. The finite element model consists of 286,179 nodes and 270,000 elements. The smallest element size is 0.5 × 0.5 × 0.5 mm.
The Johnson–cook (J-C) material model 20 is adopted to describe the mechanical behavior of Al 2024-T351. The J-C model incorporates strain rate, temperature and strain hardening effects,21–23 which can be written as
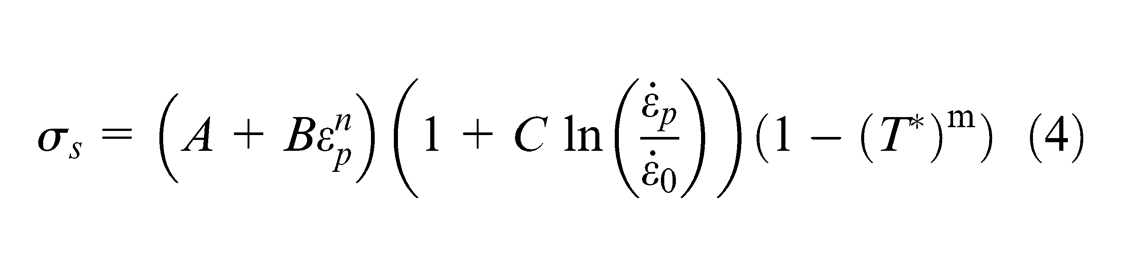
where A, B, C, n and m are material constants;
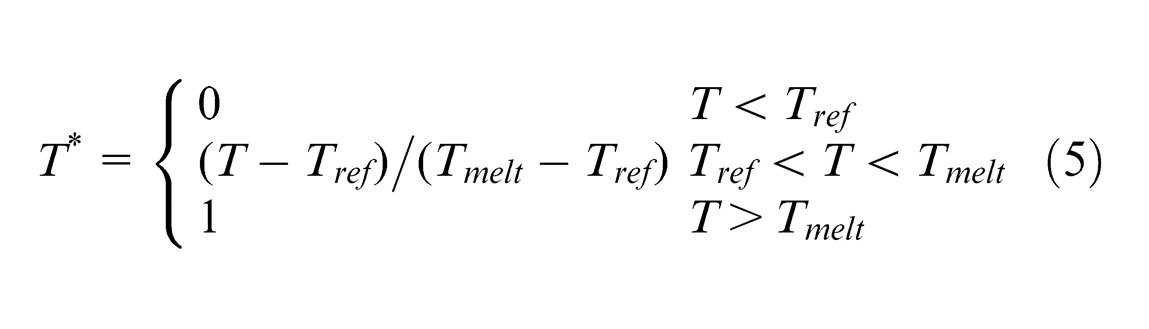
where
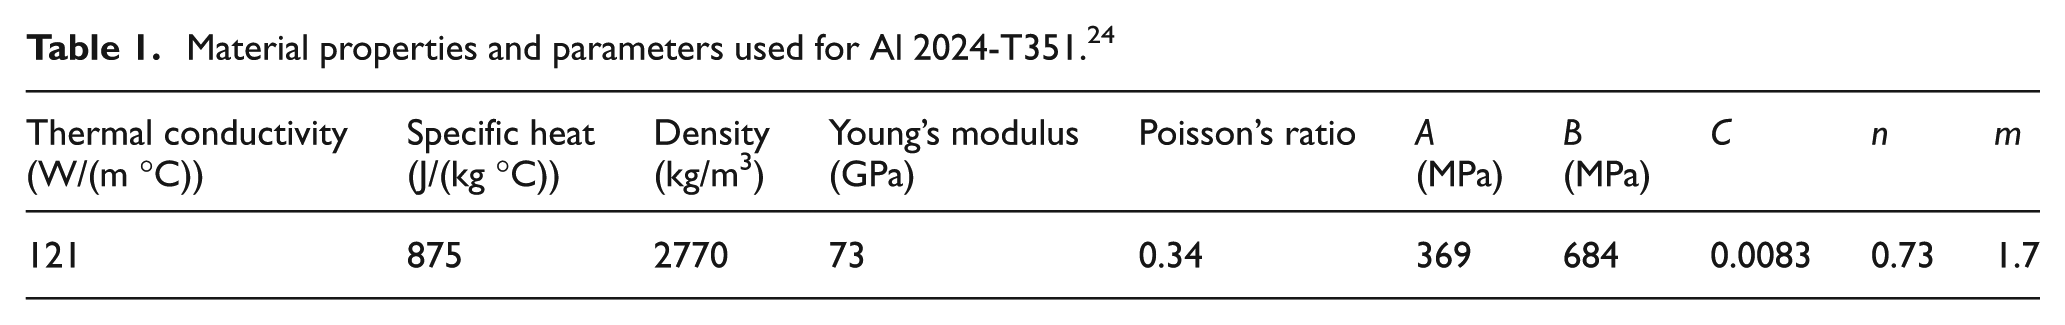
Material properties and parameters used for Al 2024-T351. 24
Fracture mechanical model
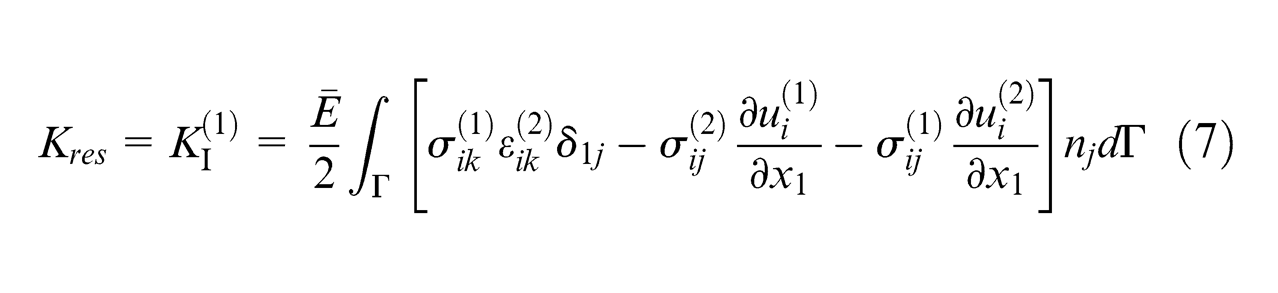
In this work, two-dimensional (2D) fracture mechanical models for the middle tension (M(T)) specimen and the eccentrically loaded single-edge crack tension (ESE(T)) specimen are established based on linear elastic fracture mechanics, as shown in Figure 2. Due to symmetry, only the half parts of the M(T) and ESE(T) specimens are modeled. The residual stress obtained from the sequentially coupled thermo-mechanical model is incorporated into the fracture mechanical model using the ABAQUS subroutine called SIGINI. The
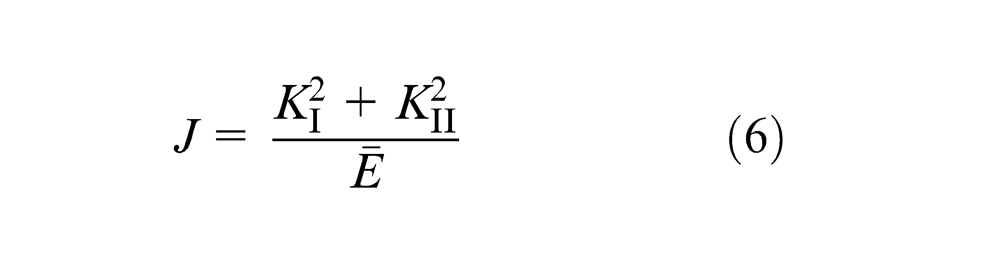
where
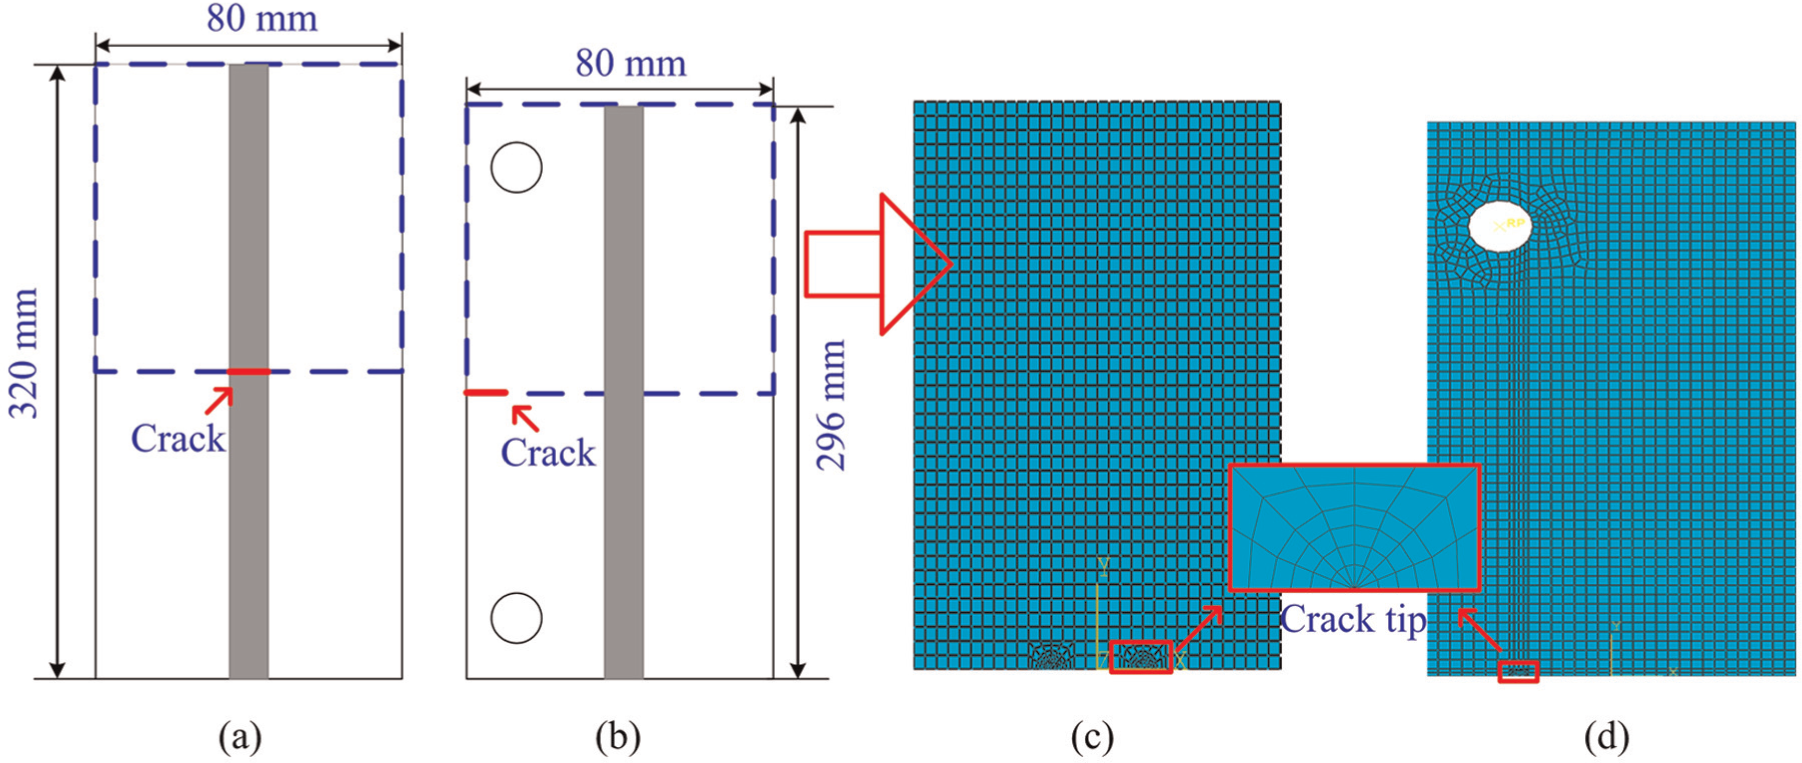
Fracture mechanical model for the (a) M(T) and (b) ESE(T) specimen.
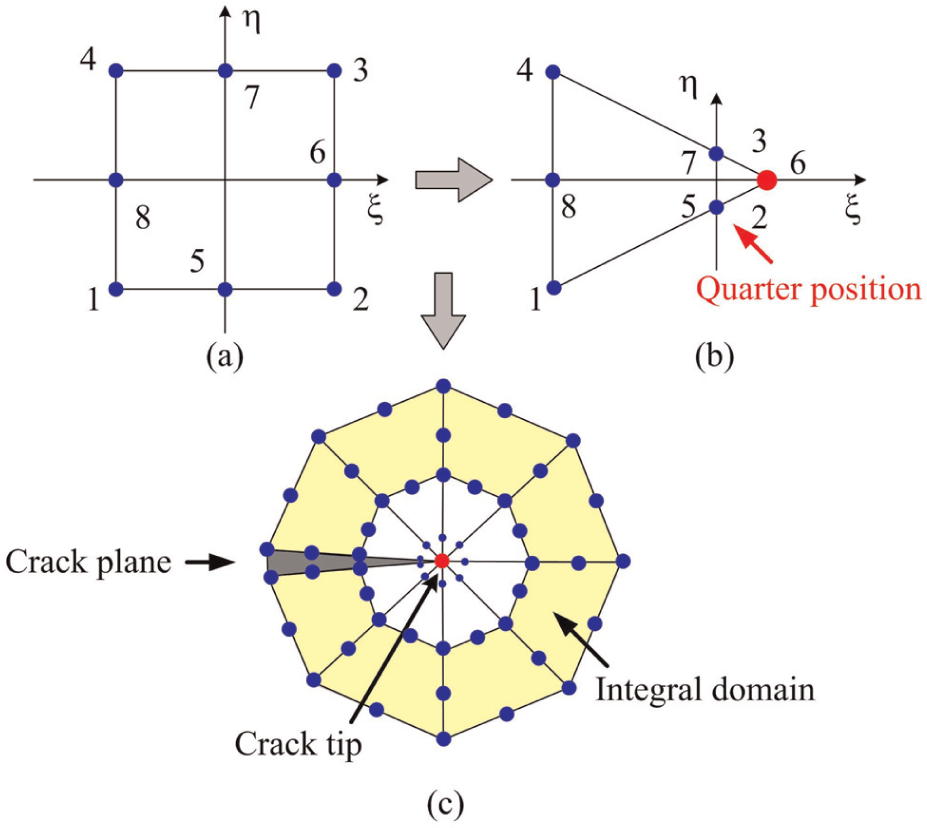
Element condition at the crack tip: (a) isoparametric element, (b) collapsed element and (c) element around crack tip.
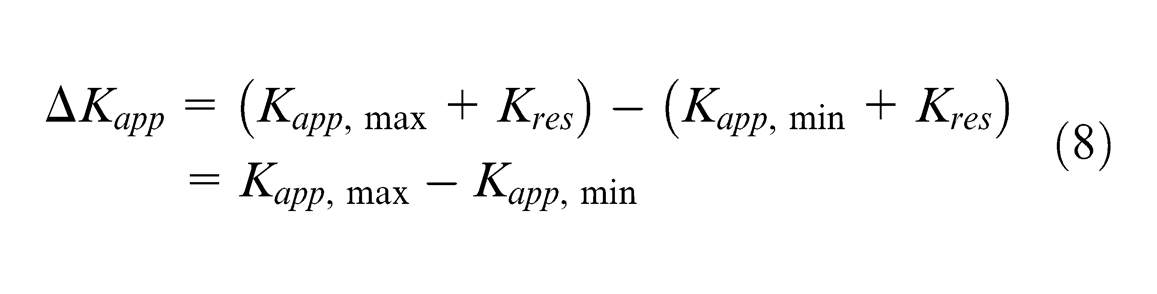
Here, two states are considered: State 1 (
The applied load range is 45 MPa for M(T) specimen and 8 kN for ESE(T) specimen performed at R = 0.1, 0.3 and 0.5.
FCGR prediction
The superposition approach and the crack-closure model
28
are adopted to predict the FCGR of the M(T) specimen and the ESE(T) specimen, respectively. The flowchart of the two methods is given in Figure 4. As
and
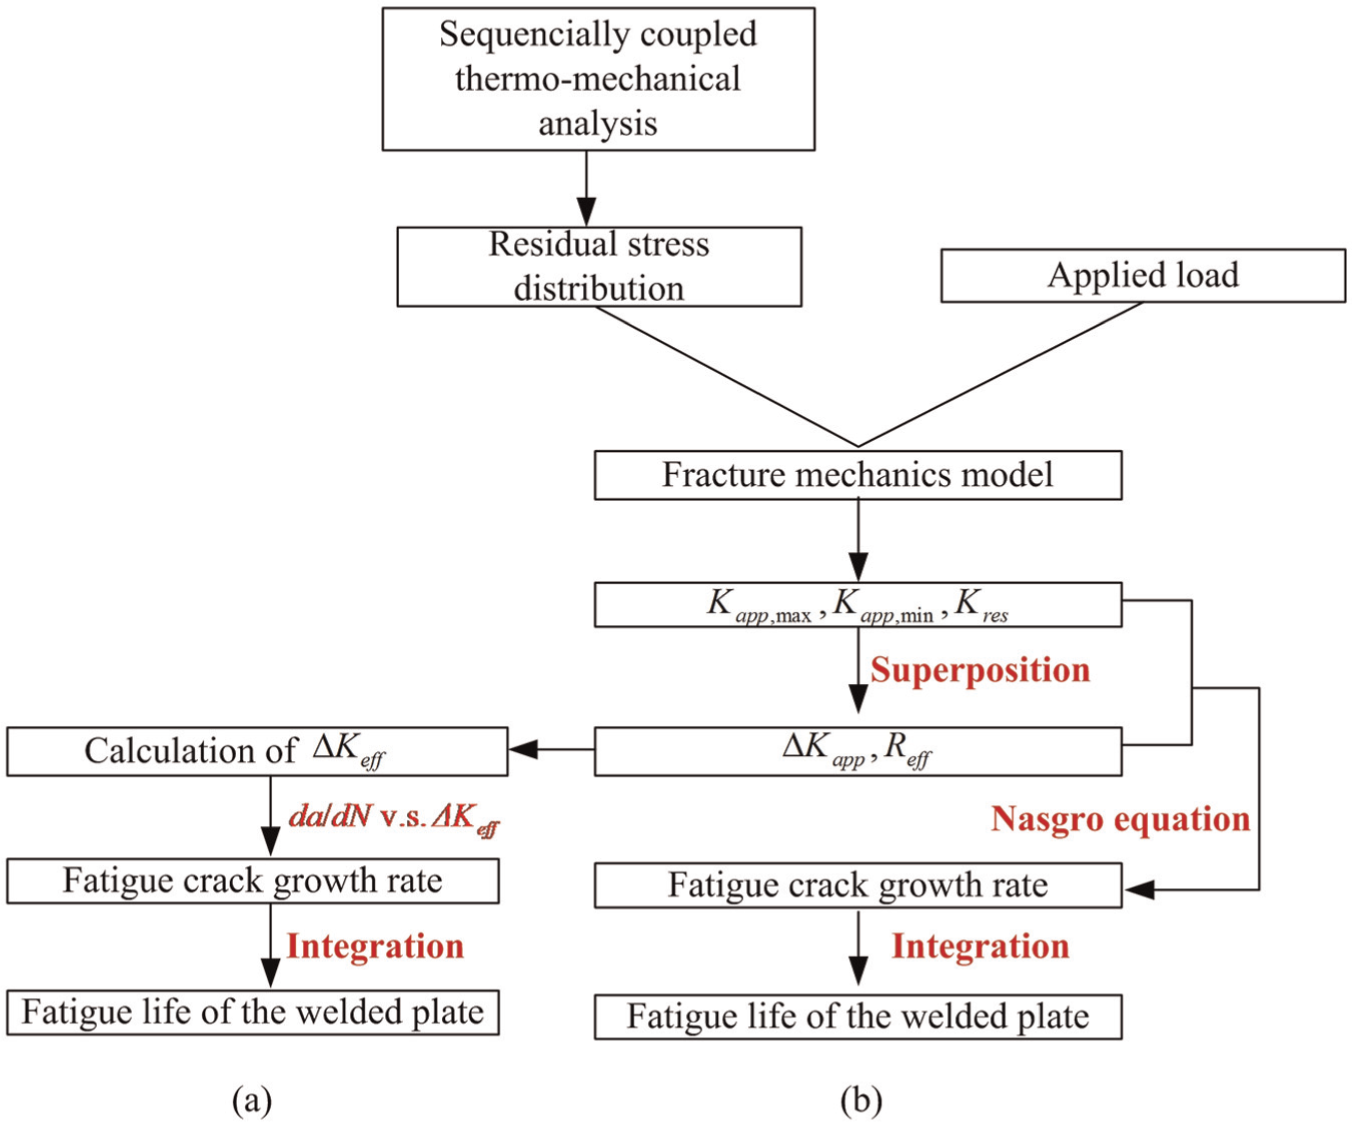
Flowchart of (a) crack-closure model and (b) superposition approach.
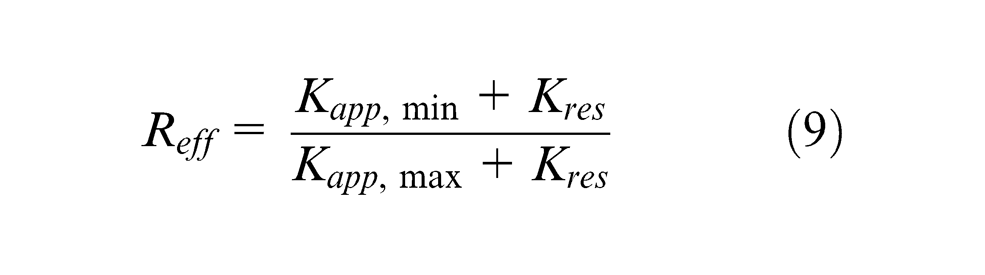
The stress ratio can be written as
The effect of residual stress on
For superposition approach, the NASGRO equation is written as 14
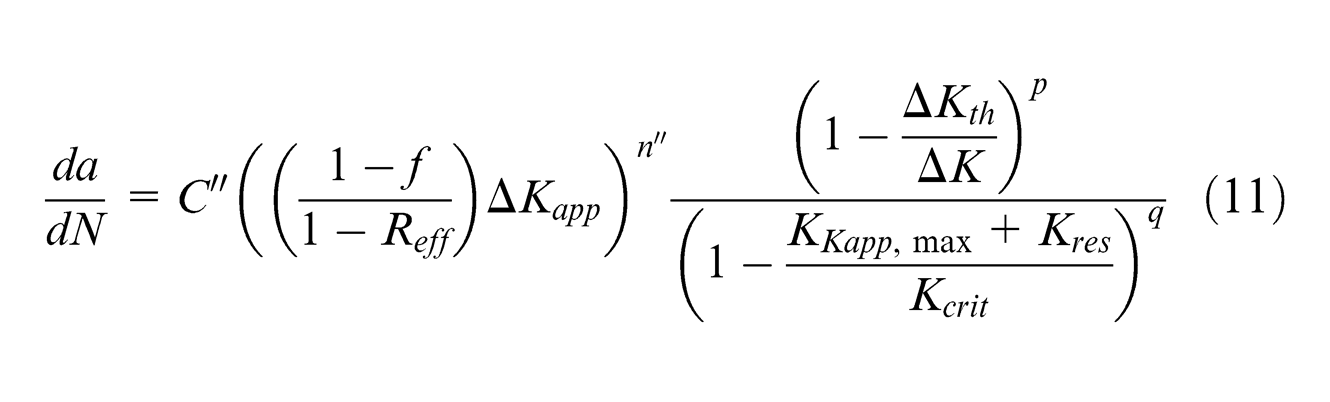
where
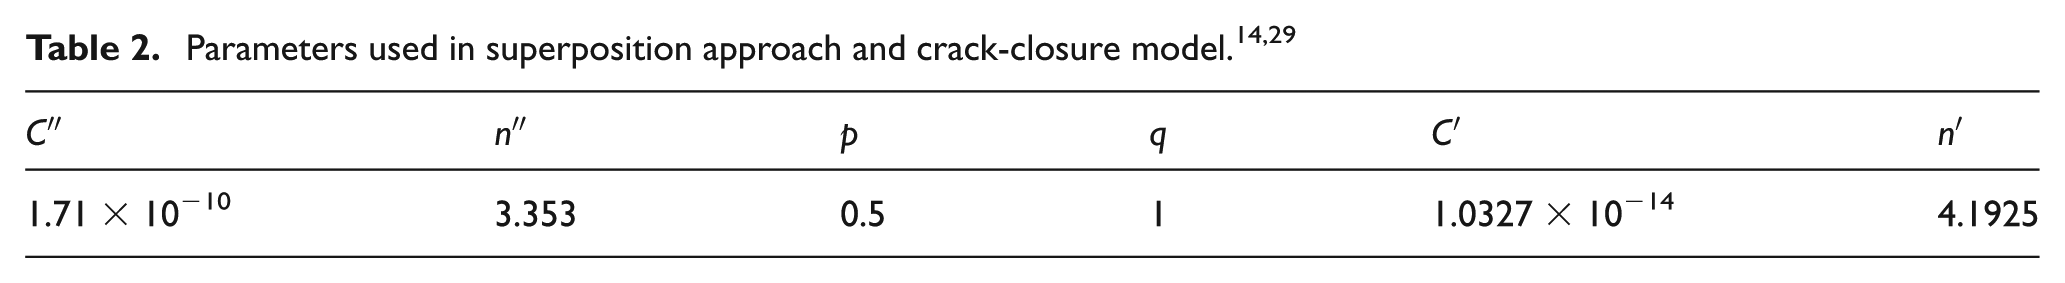
For crack-closure model, the equations introduced by Newman
30
can be used to calculate the ratio of the opening stress (
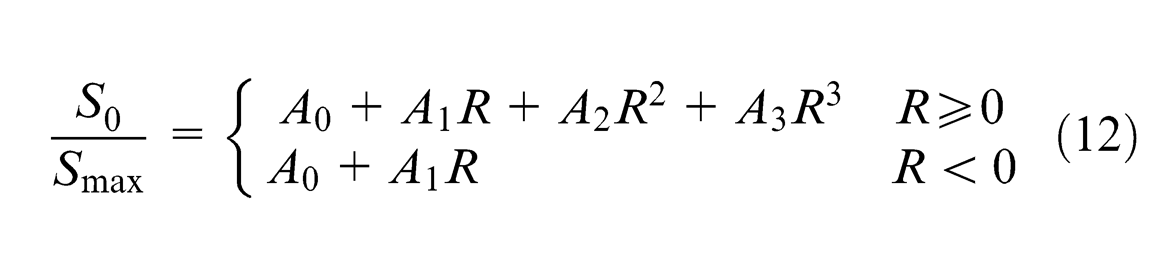
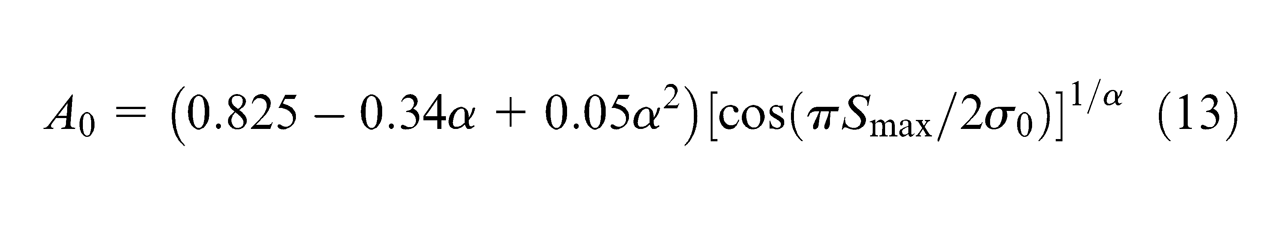
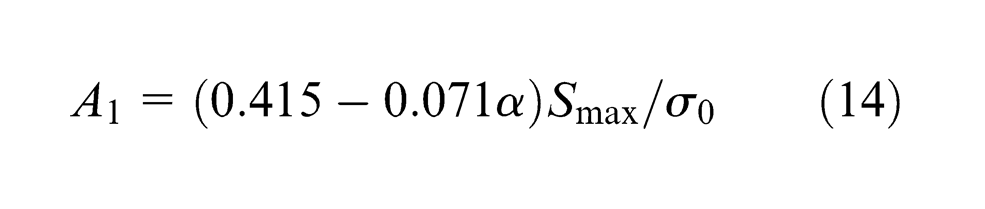
The coefficients used in equation (12) can be written as 30
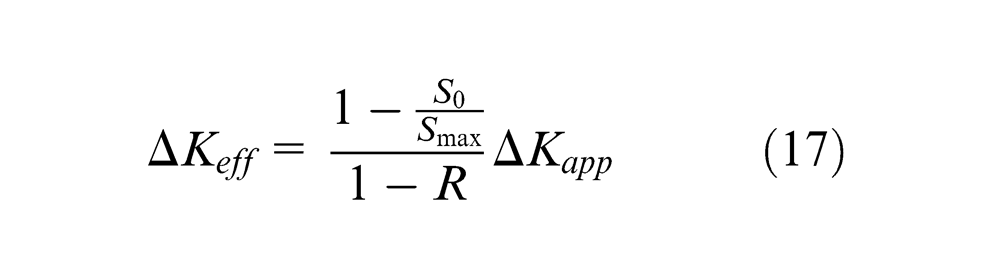
The effective stress intensity factor range (
The FCGR can be calculated by
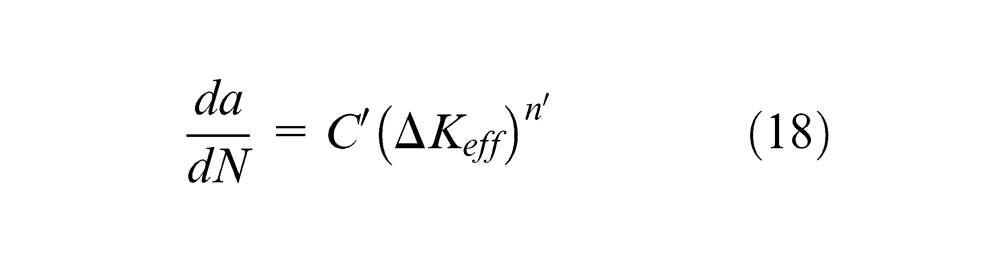
where
Model verification
Experimental data from the literature4,14,31 are employed to verify the model used in this work. The M(T) specimen is illustrated in Figure 5. Longitudinal residual stress is rebalanced in the fracture mechanical model in order to calculate
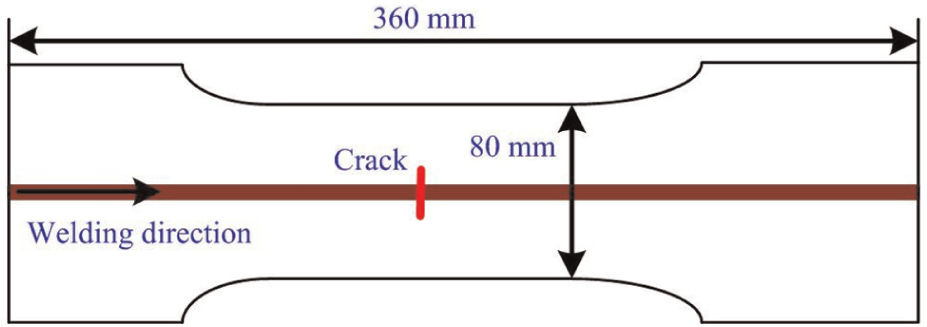
Sketch of the middle crack specimen.
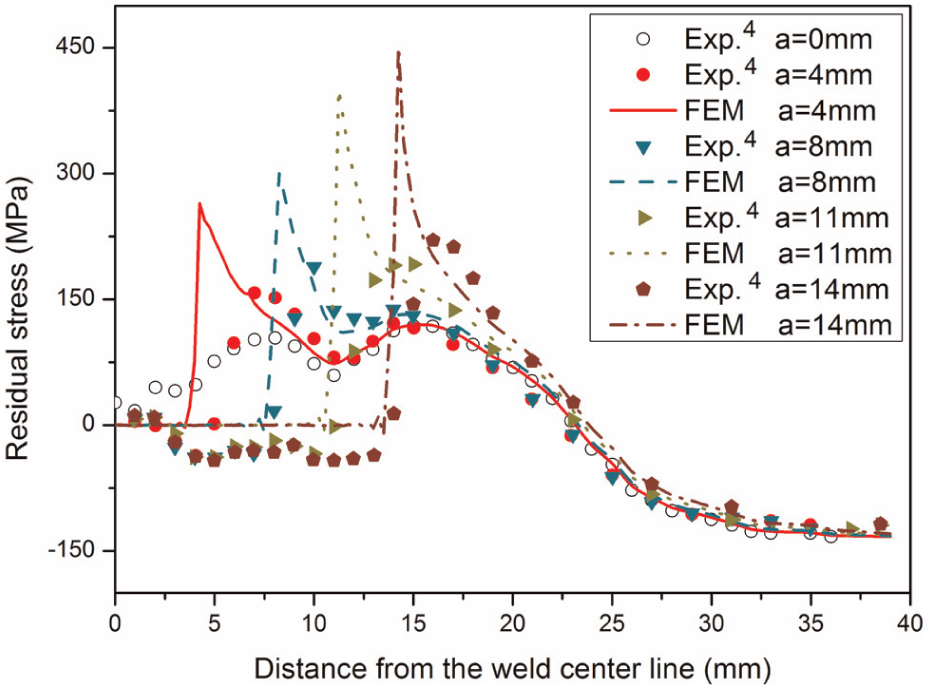
Residual stress redistribution at different crack lengths.
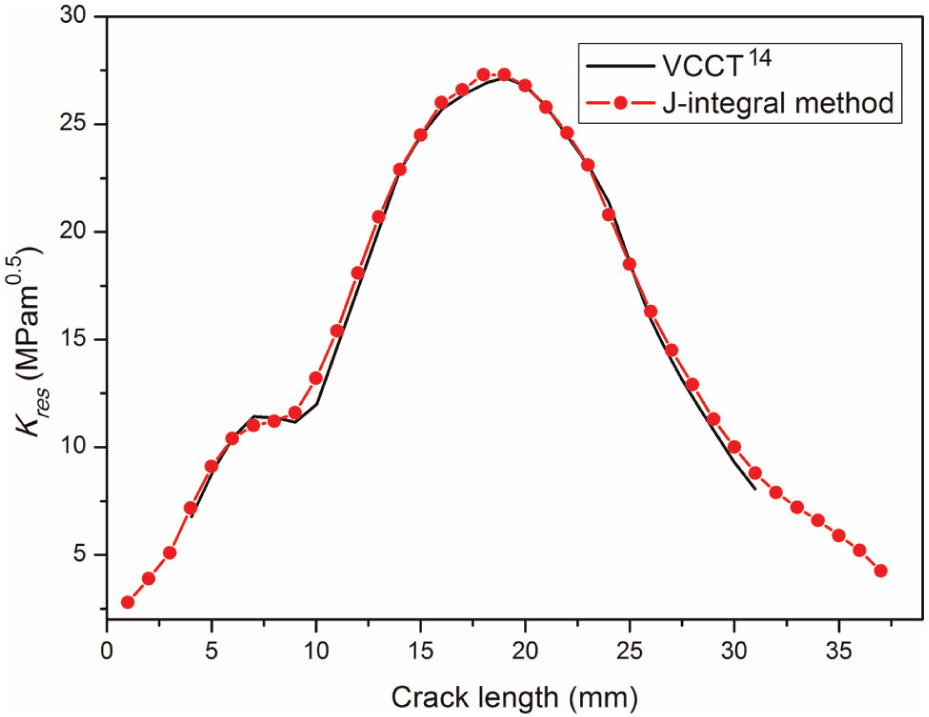
Comparison of the predicted J-integral result with the VCCT result.
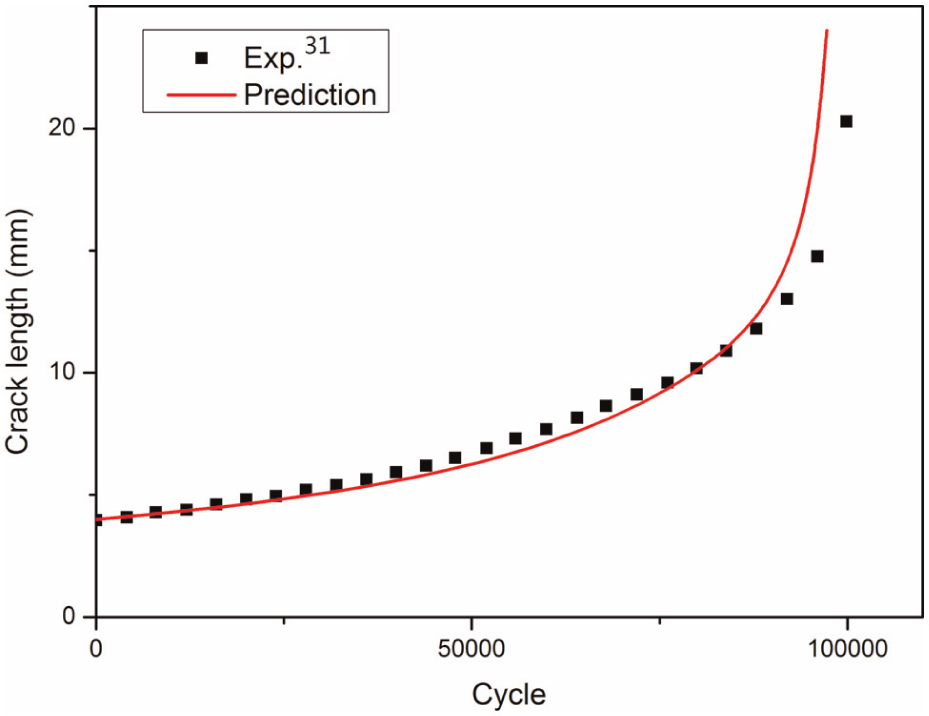
The FCGR is obtained using the superposition method. The validation of the predicted FCGR with the experimental data 31 is shown in Figure 8. Moreover, the fatigue life can be obtained with integral of the FCGR, as illustrated in Figure 9. The predicted results agree well with the experimental data. 31
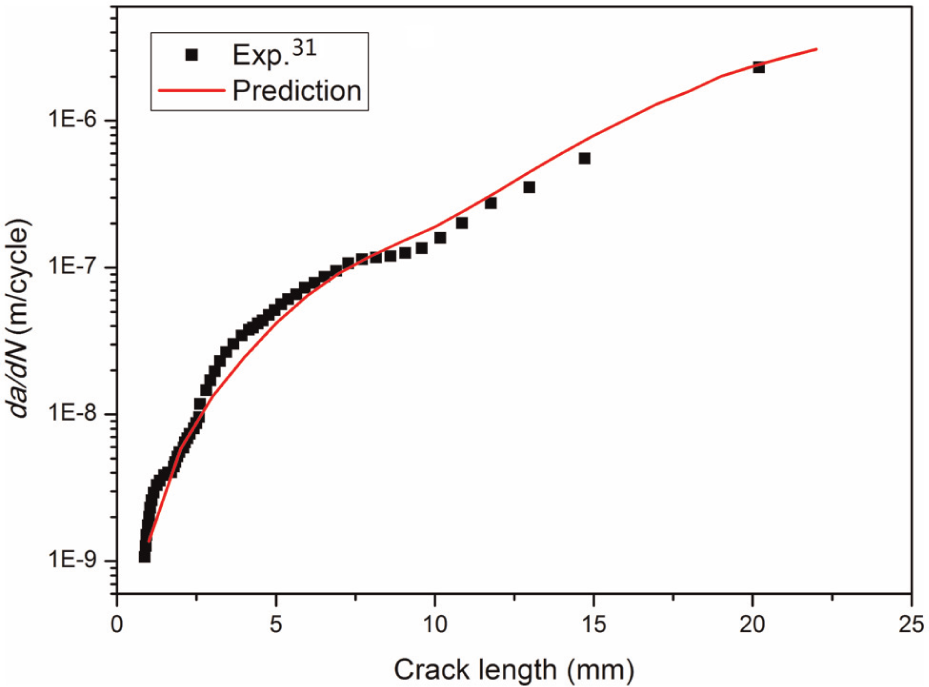
FCGR validation with the experimental data.
Fatigue life validation with the experimental data.
Results and discussions
Weld-induced residual stress
In the published literature,18,32,33 the predicted longitudinal residual stresses in the weld zone are slightly higher than the experimental data. The reason is that the material properties in the weld zone are set to be identical to the base material. Actually, according to the experiments,34–38 it can be found that the yield strength of the material in the weld zone can be reduced to 38%–75% compared with the base material. By trial-and-error tests, the predicted results agree well with the experimental data 39 when the yield strength of the material in the weld zone is reduced to 56%, as shown in Figure 10. Hence, in this work, 56% yield strength of base material is chosen for the yield strength of the material in the weld zone.
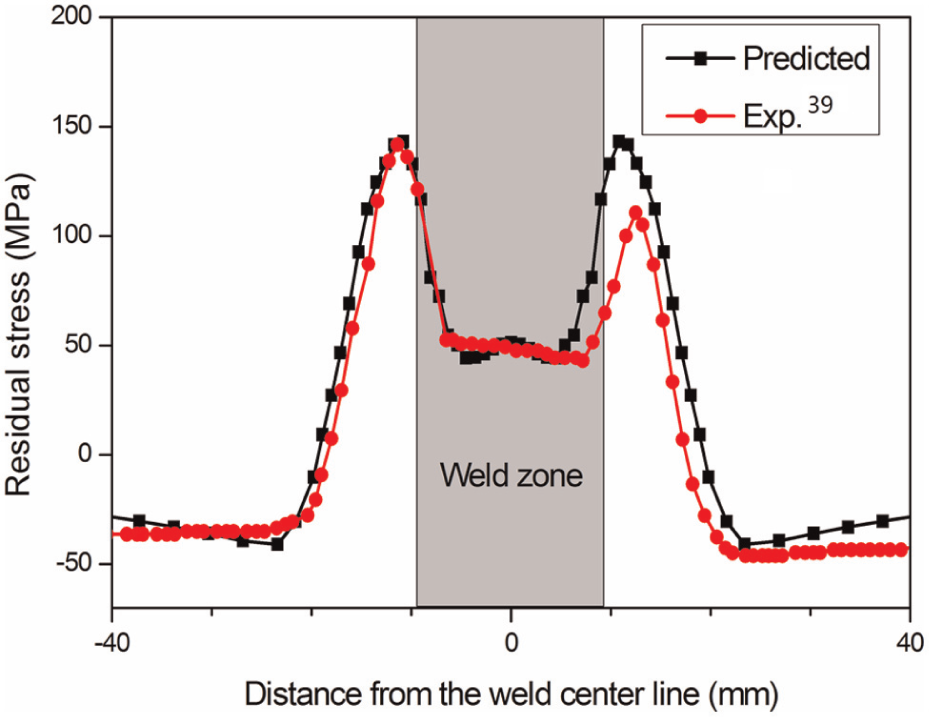
Comparison of the predicted residual stress to the experimental data.
From Figure 11, it can be seen that the maximum Mises stress is only 131.8 MPa at 300 r/min, which is far less than the yield strength of the base material. The longitudinal residual stress in the transverse section is selected for the calculation of the
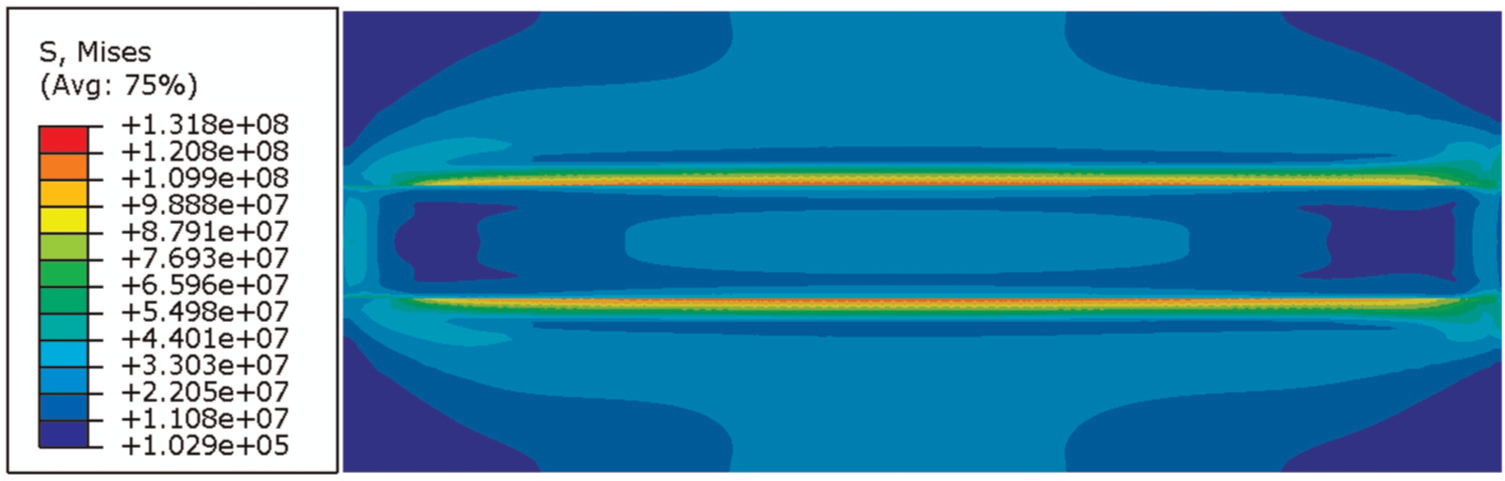
Residual stress distribution of FSW, 300 r/min.
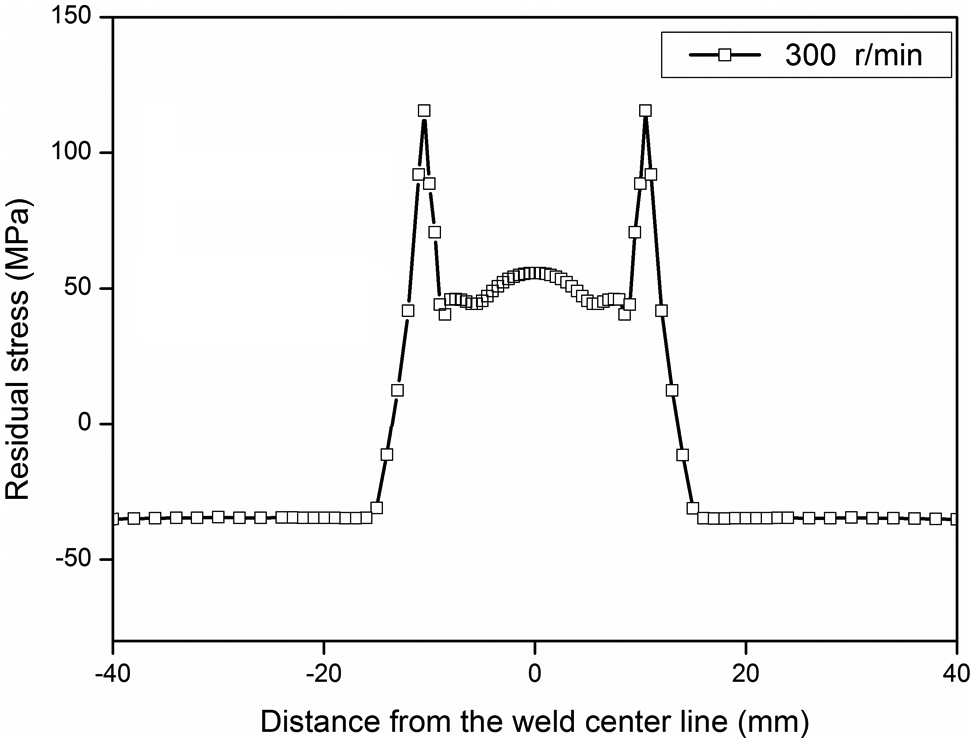
Longitudinal residual stress profile of FSW.
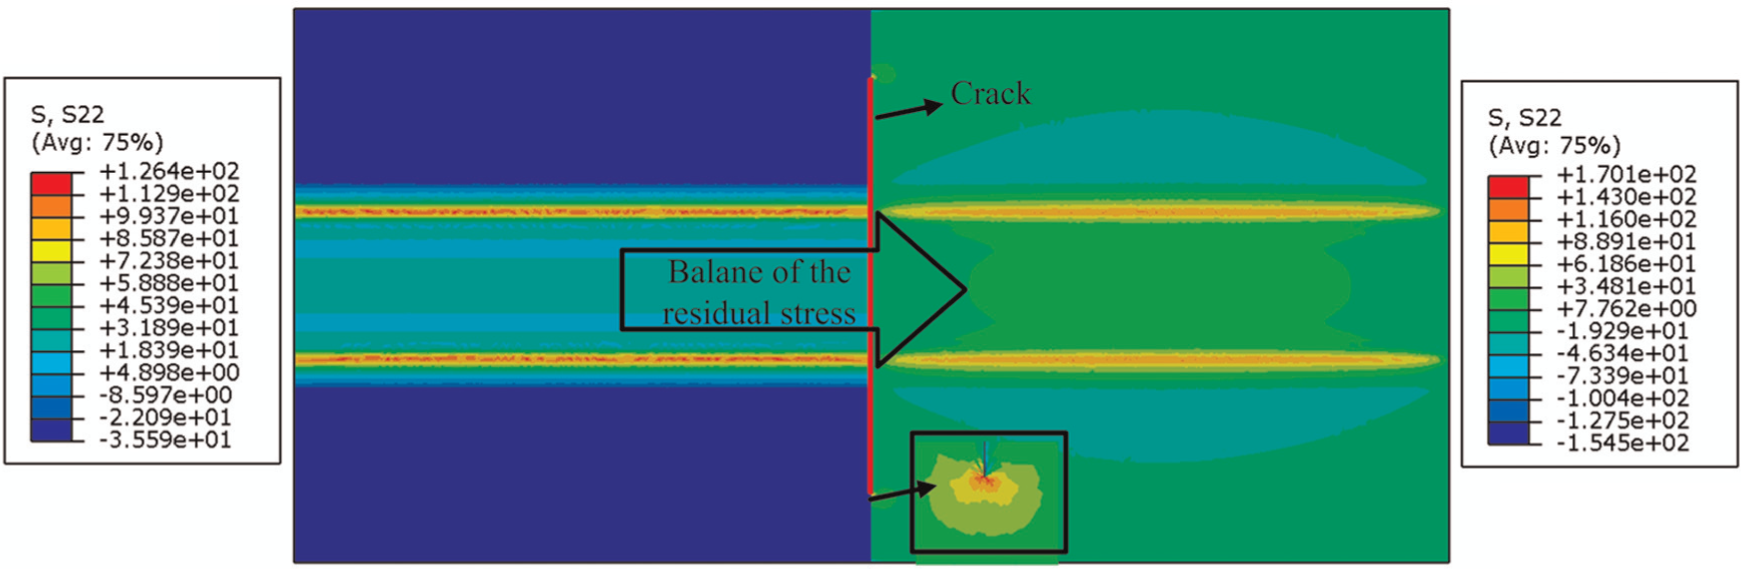
Balance of residual stress for M(T) specimen, 300 r/min.
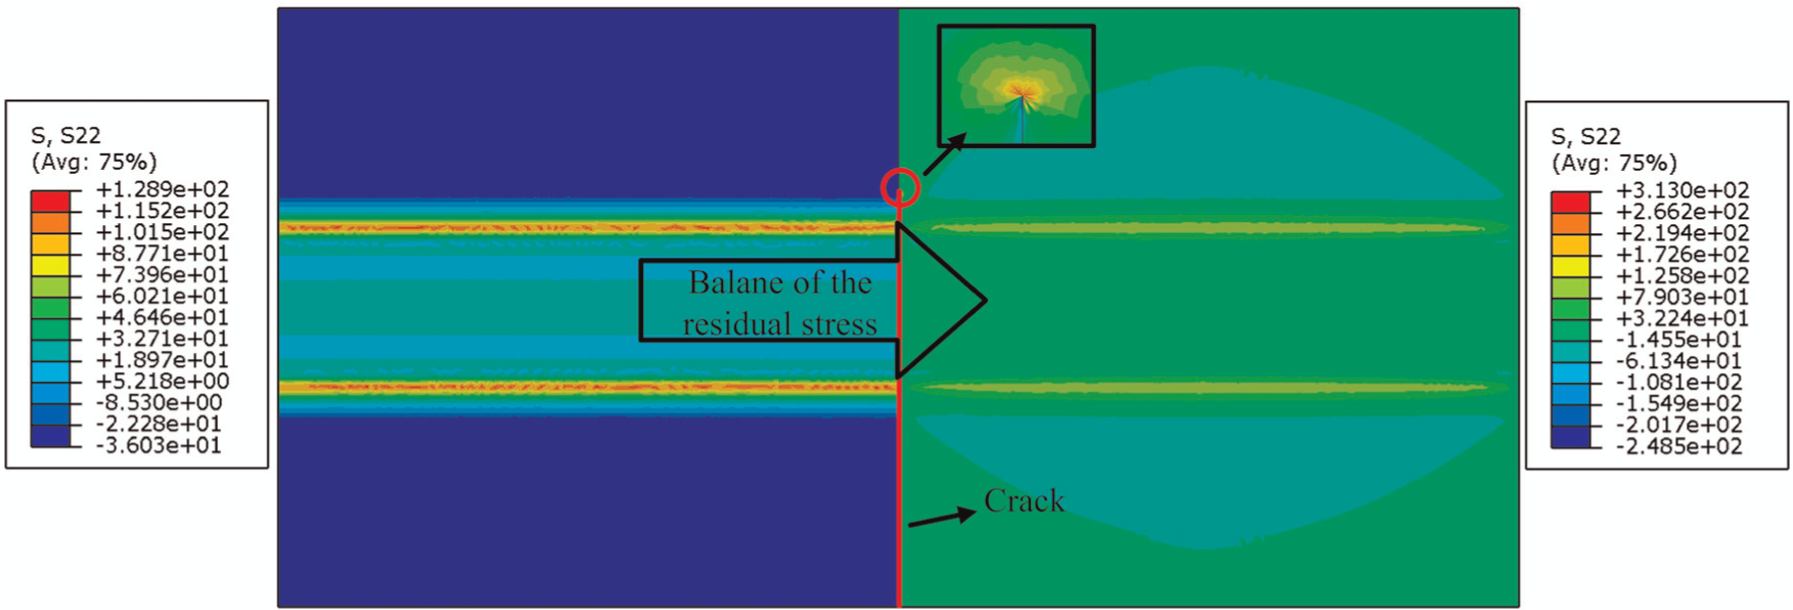
Balance of residual stress for ESE(T) specimen, 300 r/min.
Residual stress intensity factor at 300 r/min
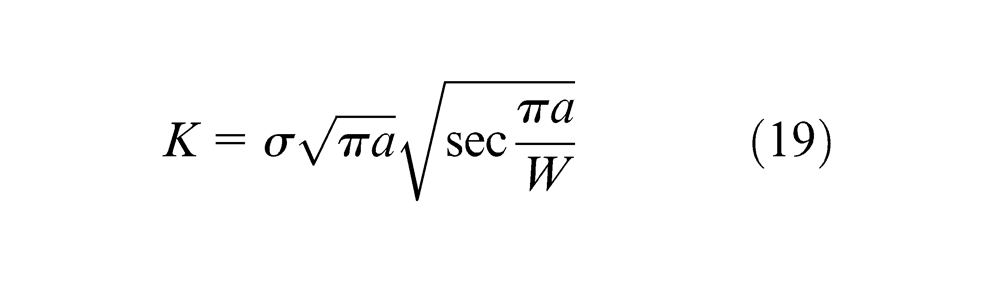
The stress intensity factor from the applied load can be calculated using the empirical equation. For M(T) specimen 40
where W is the width of the specimen. For ESE(T) specimen 41
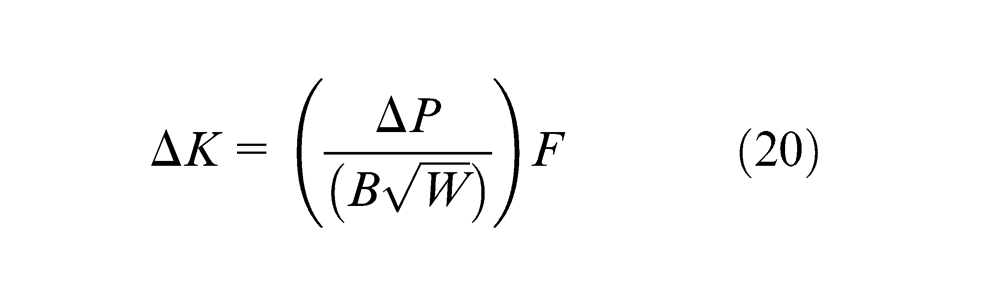
and
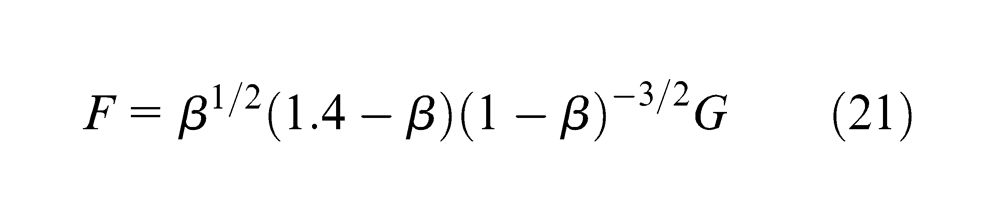
where
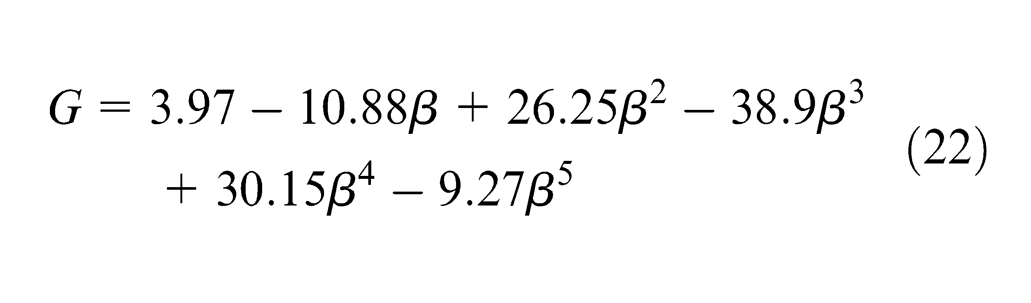
for 0 <β < 1,
As shown in Figures 15 and 16, the predicted results from the fracture mechanical models agree well with the results calculated by the empirical equations, which further indicate the validity of the fracture mechanical models used in this work.
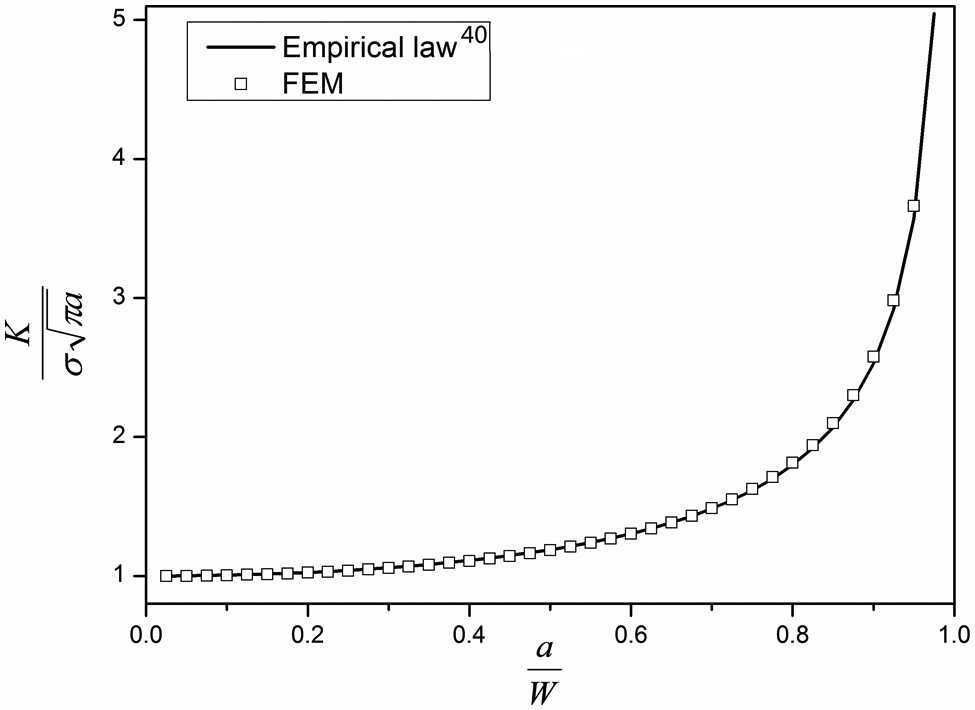
Comparison of the FEM result with the empirical result, M(T) specimen.
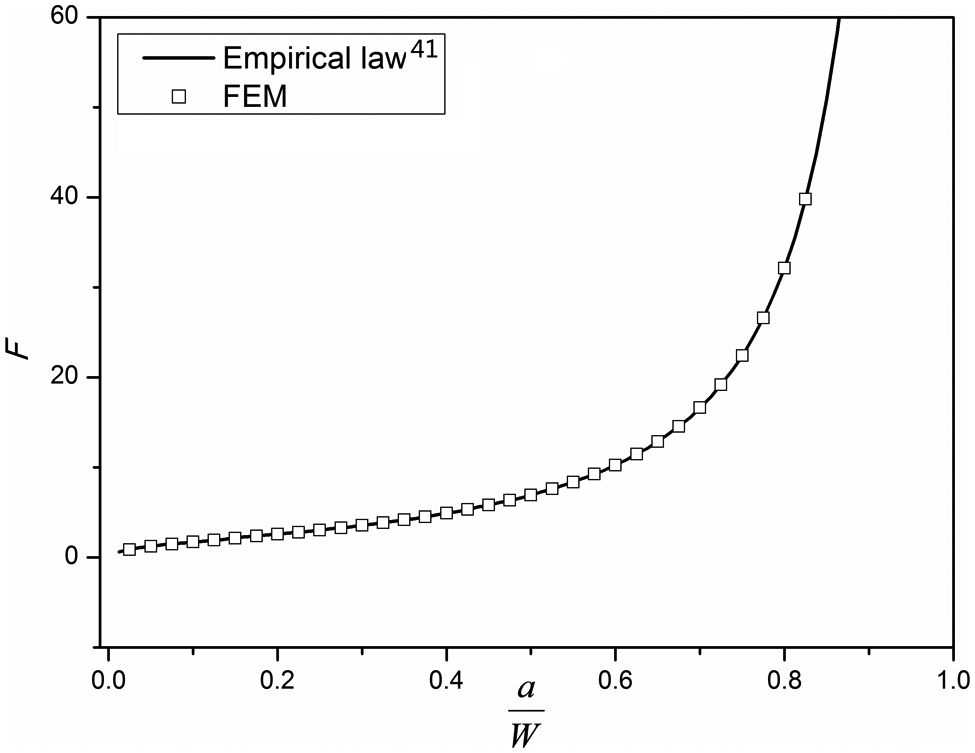
Comparison of the FEM result with the empirical result, ESE(T) specimen.
The stress distributions around the crack tip after the rebalance of the residual stress are given in Figures 17 and 18. For the M(T) specimen, the initial crack locates in the tensile residual stress field. The stress around the crack tip is always tensile stress, which increases as the crack propagates to the edge of the weld zone. This is the reason that the
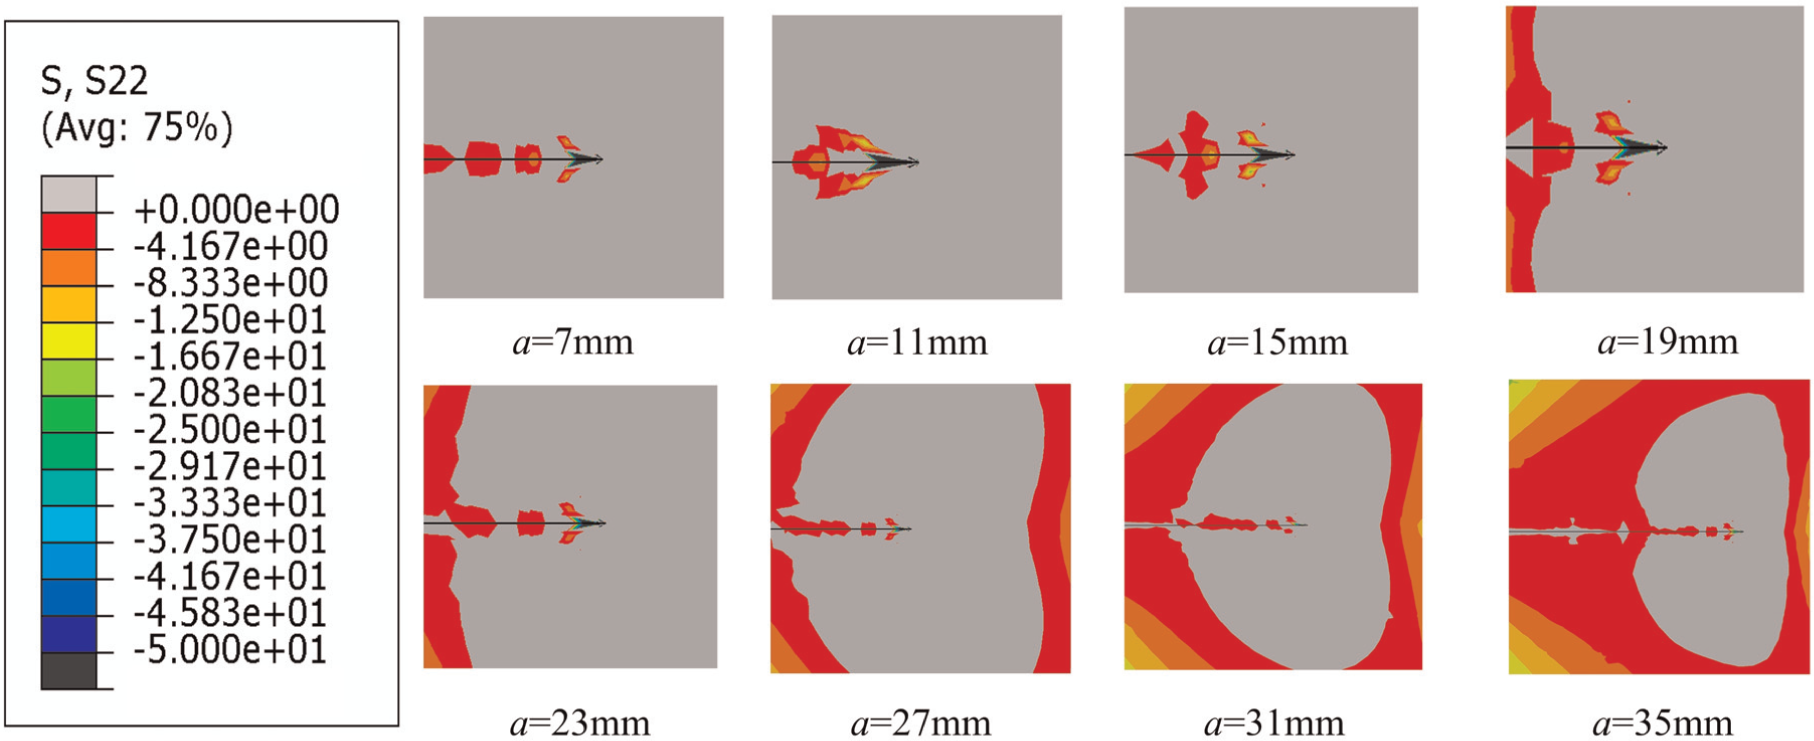
Stress distribution around the crack tip at different crack lengths, M(T).
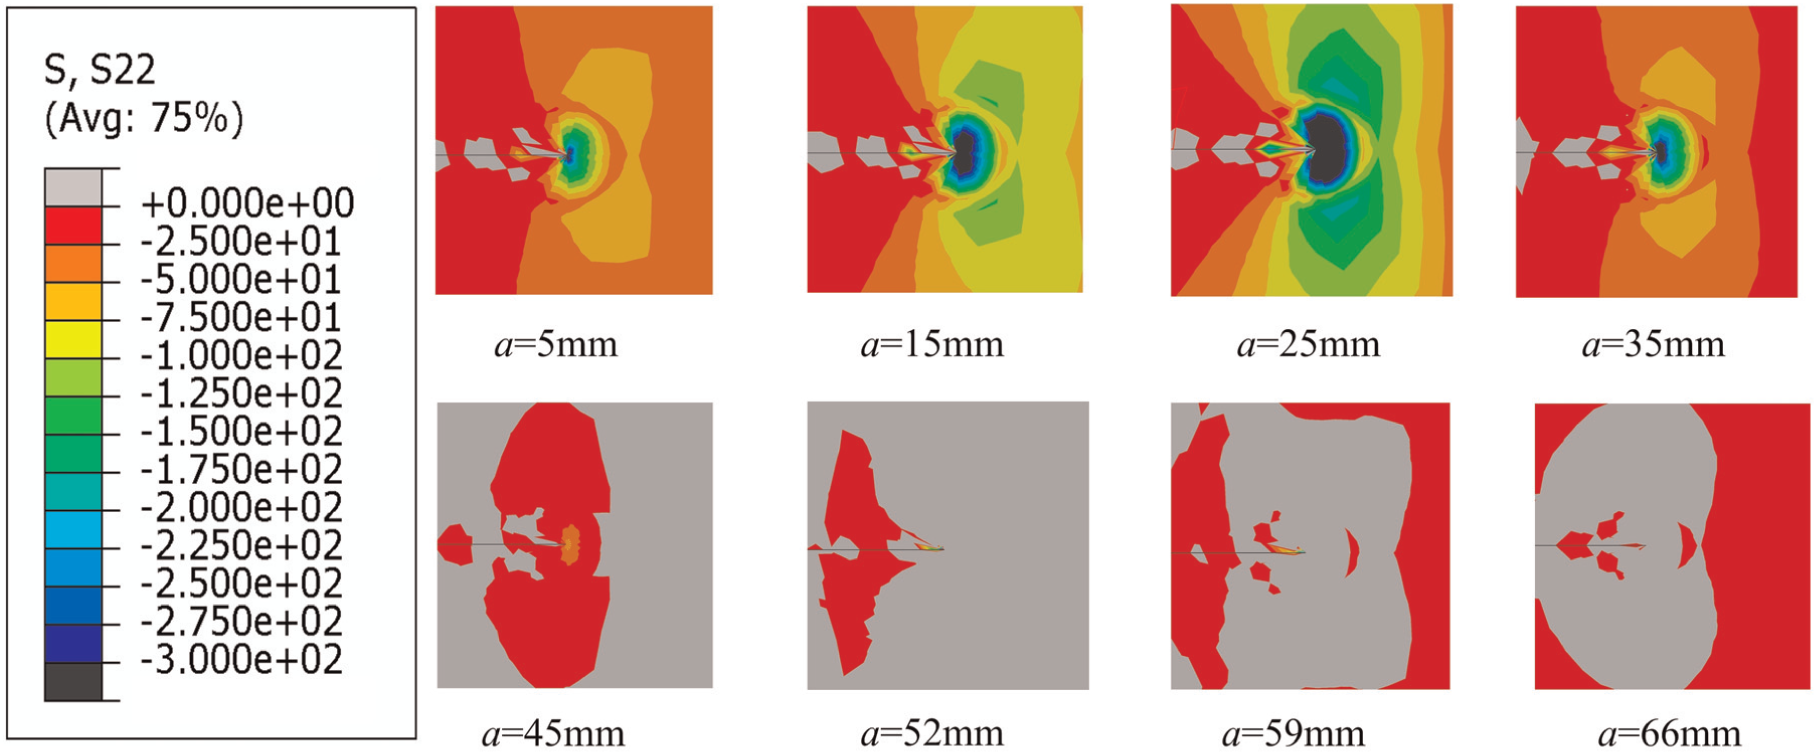
Stress distribution around the crack tip at different crack lengths, ESE(T).
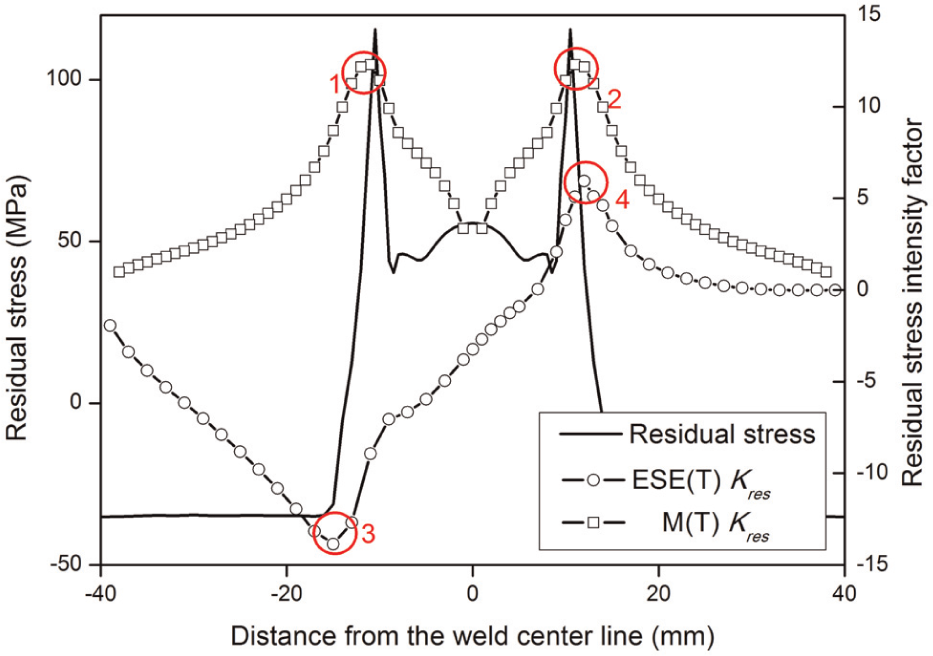
Kres and the residual stress profiles, 300 r/min.
For ESE(T) specimen, the initial crack locates in the compressive residual stress field, and compressive stress can be observed around the crack tip after the rebalance of the residual stress, as shown in Figure 18. This is the reason that the
Effect of residual stress on the fatigue life of the welded specimen at 300 r/min
The residual stress has a significant effect on the
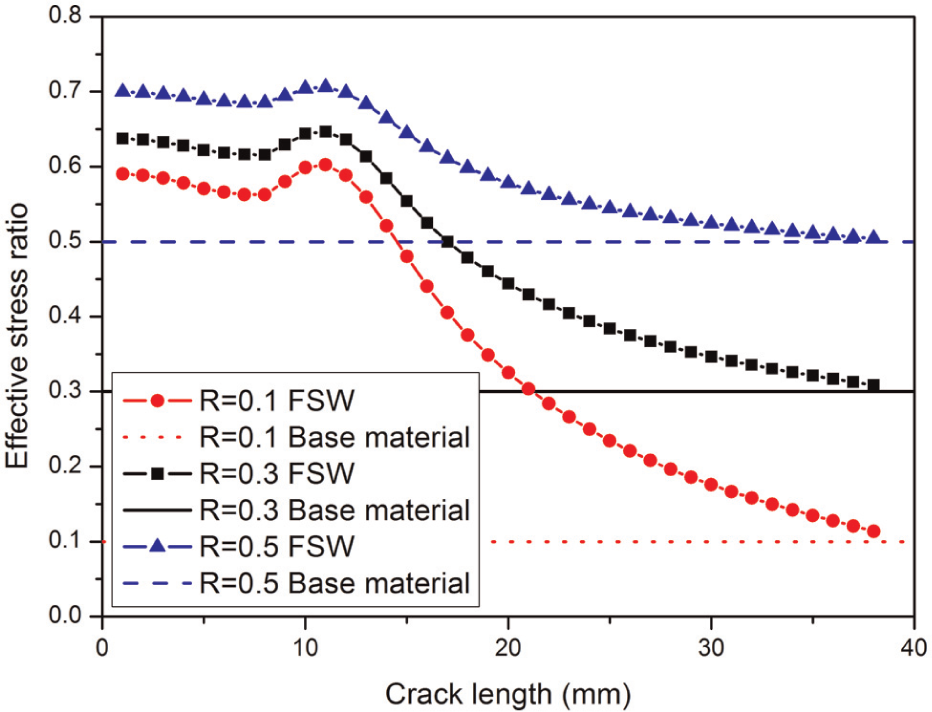
Effect of residual stress on Reff, M(T) specimen.
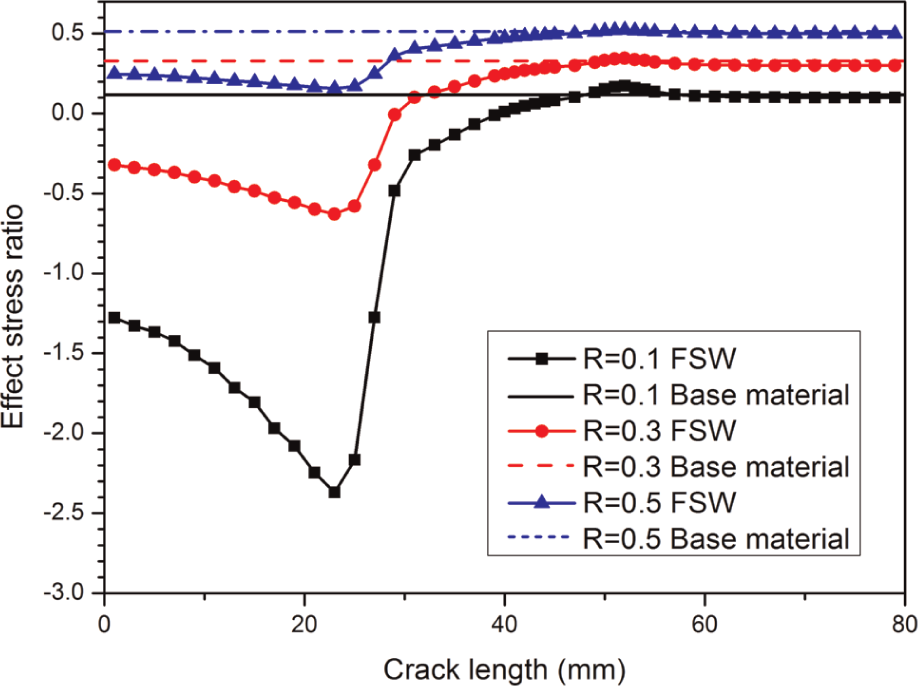
Effect of residual stress on Reff, ESE(T) specimen.
The FCGRs at R = 0.1, 0.3 and 0.5 are given in Figures 22 and 23. When the initial location of the crack is in the tensile residual stress field, the FCGR can be increased, as shown in Figure 22. The FCGR of the welded plate can reach 2.4 times higher than the FCGR of the base material at a = 11 mm, R = 0.3. After the rebalance of the residual stress in the fracture model, the stress around the crack tip is tensile stress. Tensile stress can increase the FCGR.8,42 Hence, the FCGR of the welded plate can be increased, even though the crack propagates from the tensile residual stress field into the compressive residual stress field for M(T) specimen. From Figure 23, it can be found that the FCGR can be obviously decreased when the initial location of the crack is in the compressive residual stress field. The stress around the crack tip is compressive stress as the crack length is less than 45 mm. Compressive stress can decrease the FCGR.8,42 Therefore, the FCGR of the welded plate can be decreased, even though the crack propagates from the compressive residual stress field into the tensile residual stress field. When the crack length is more than 52 mm, the stress around the crack tip is tensile stress, and the FCGR of the welded plate can be increased compared with that of the base material, as shown in Figure 23. At a = 23 mm and R = 0.3, the FCGR in the welded plate can be only 5% of the FCGR in the base material. From Figures 22 and 23, it can be found that the effect of residual stress on the FCGR decreases with the increase in the stress ratio.
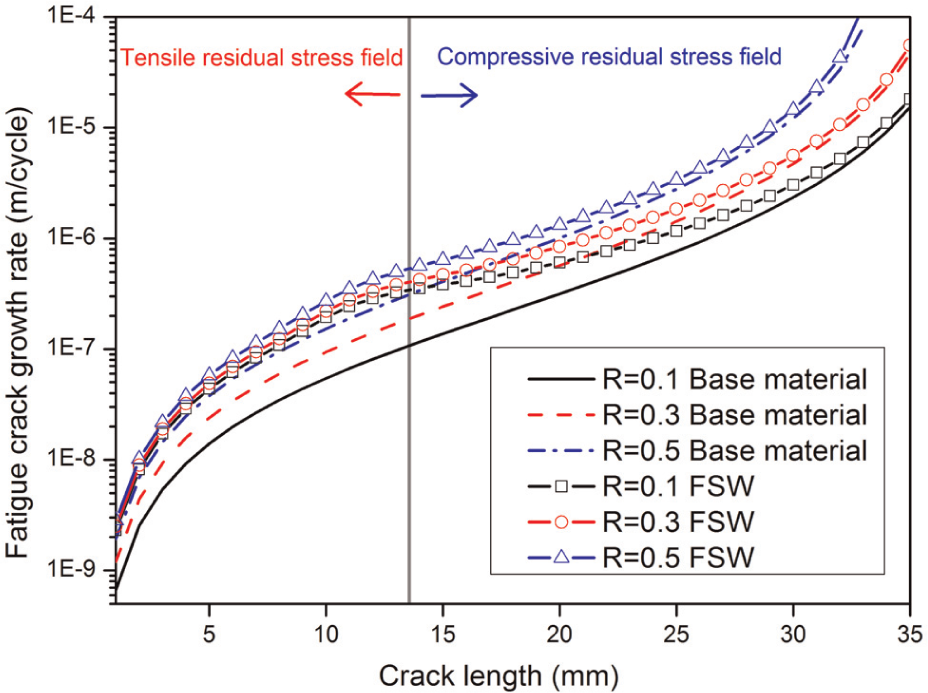
Predicted FCGR at different stress ratios, M(T) specimen.
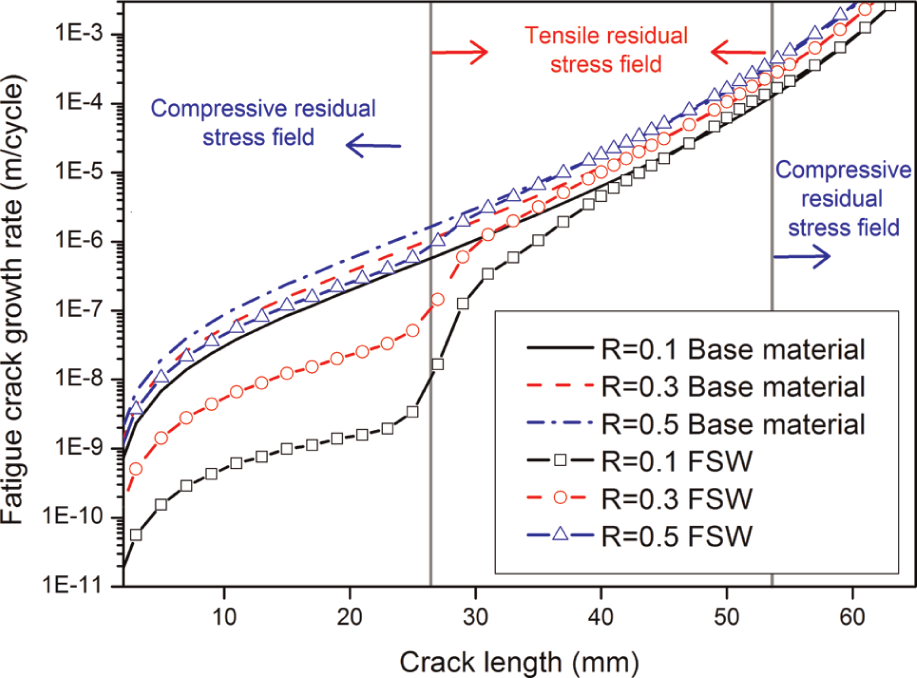
Predicted FCGR at different stress ratios, ESE(T) specimen.
The function
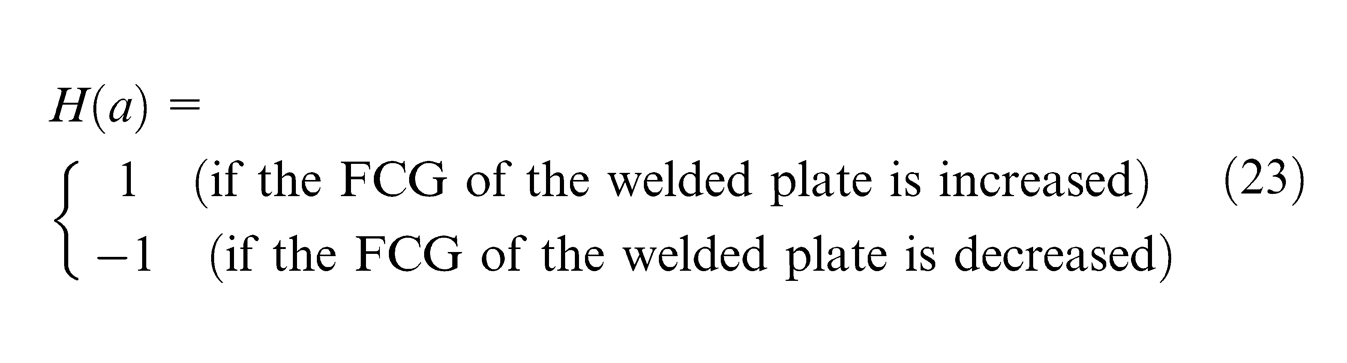
From Figure 24, it can be seen that the residual stress intensity factor can directly reflect the influence of residual stress on the FCGR of the welded plate, and the FCGR can be increased by positive residual stress intensity factor and decreased by negative residual stress intensity factor.
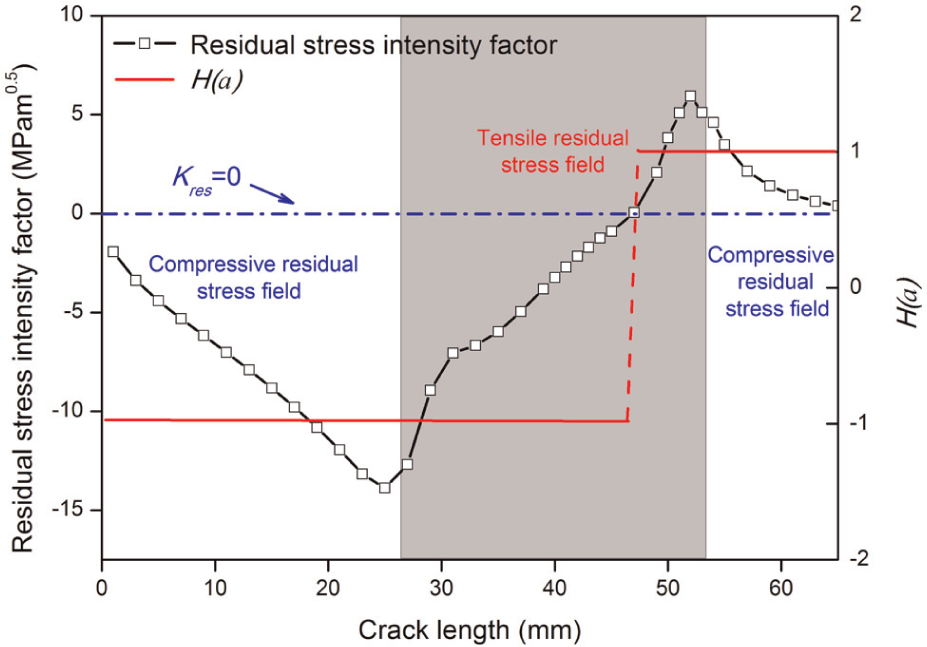
Residual stress intensity factor and H(a) distribution, ESE(T).
The fatigue life can be obviously decreased for M(T) specimen, as shown in Figure 25. As a = 1 mm, the fatigue life of the welded plate can be decreased by 51% compared with the base material. However, the fatigue life can be increased for ESE(T) specimen, as shown in Figure 26. As a = 1 mm, the fatigue life of the welded plate can reach 8.8 times higher than the fatigue life of the base material.
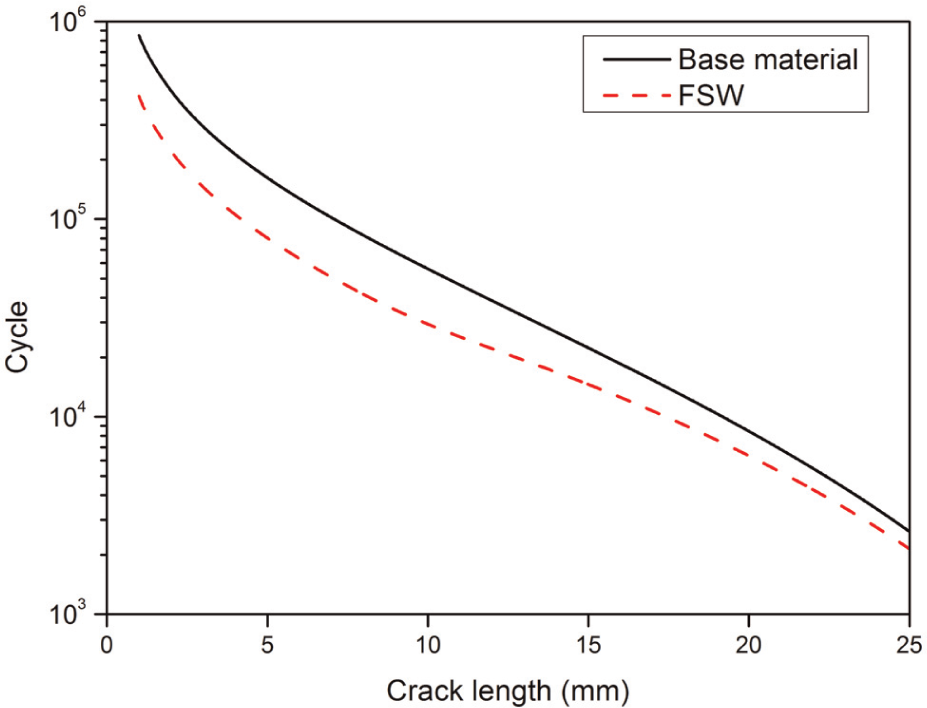
Fatigue life of the M(T) specimen with different crack lengths, R = 0.3.
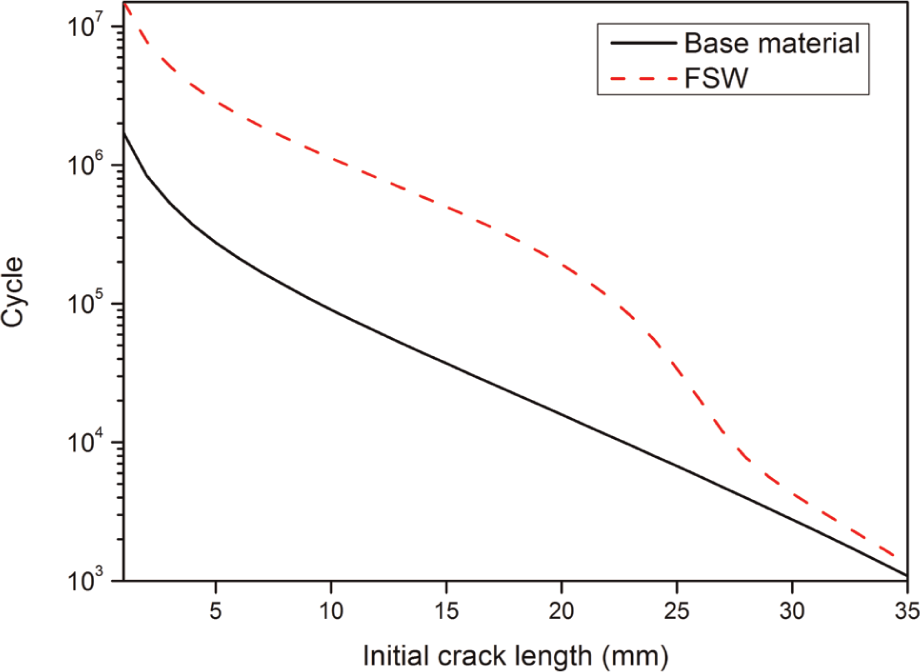
Fatigue life of the ESE(T) specimen with different crack lengths, R = 0.3.
Effect of the rotational speed on the fatigue life of the welded plate
The maximum residual stress is increased by increasing the rotational speed, as shown in Figure 27. This phenomenon has been observed in the published literature. 43 The tensile residual stress field becomes wider with the increase in the rotational speed.
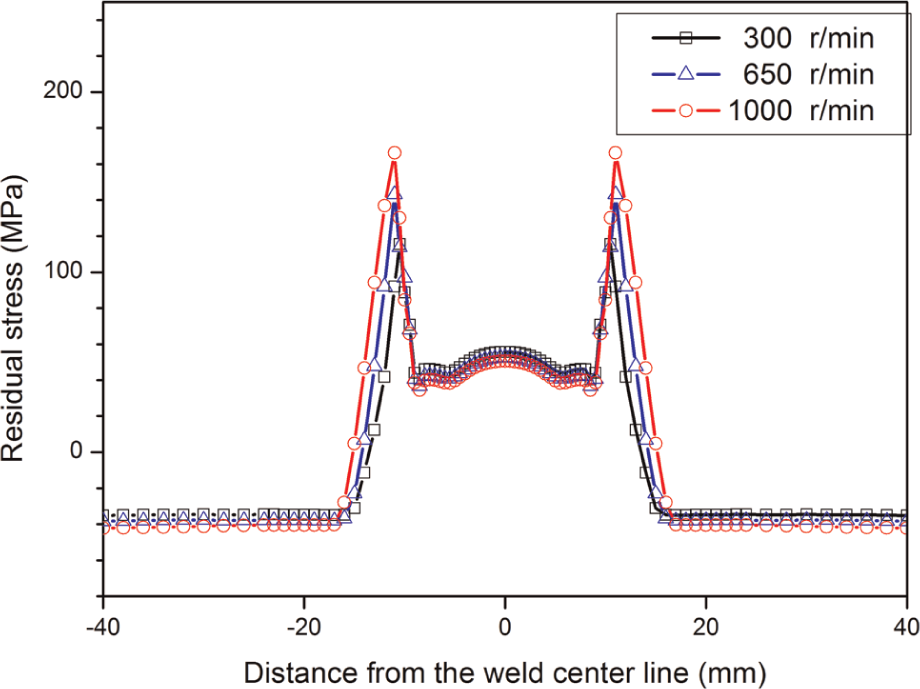
Longitudinal residual stress profiles at different rotational speeds.
The tensile stress around the crack tip can be decreased by increasing the rotational speed when the crack length is 7 mm, as shown in Figure 28. Hence, the FCGR of the welded plate can be decreased by increasing the rotational speed. When the crack is 1 mm, the fatigue lives at 650 and 1000 r/min are increased by 2.1% and 3.9%, respectively, compared with the fatigue life at 300 r/min, 418,414 cycles. The influence of the rotational speed on the fatigue life of the M(T) specimen is very small, as shown in Figure 29. When the crack length is 11 mm, the fatigue lives at 650 and 1000 r/min are decreased by 7.4% and 14.3%, respectively.
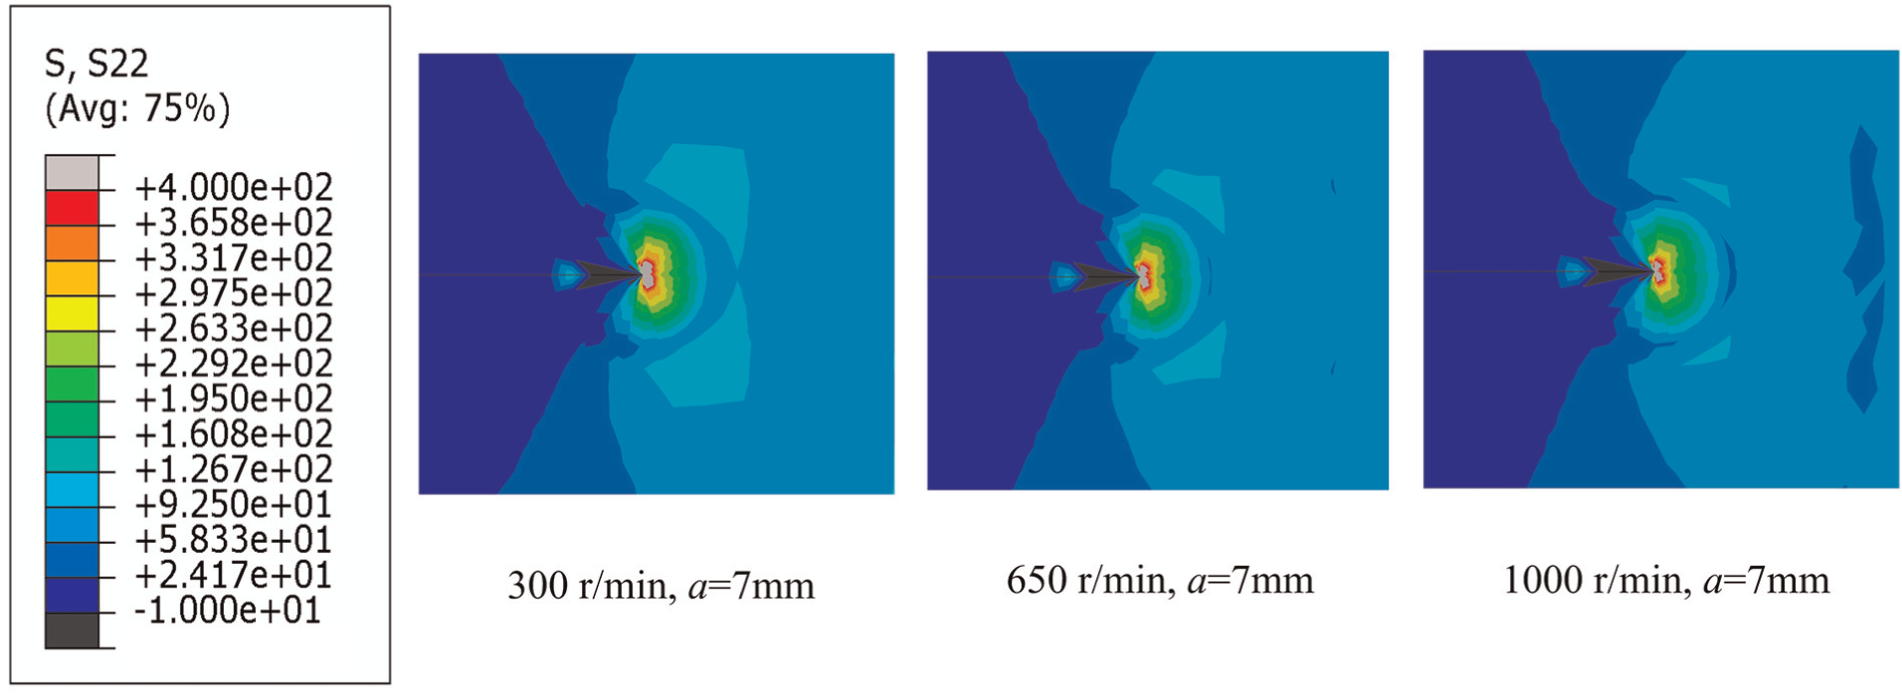
Stress distribution around the crack tip with different rotational speeds, M(T).
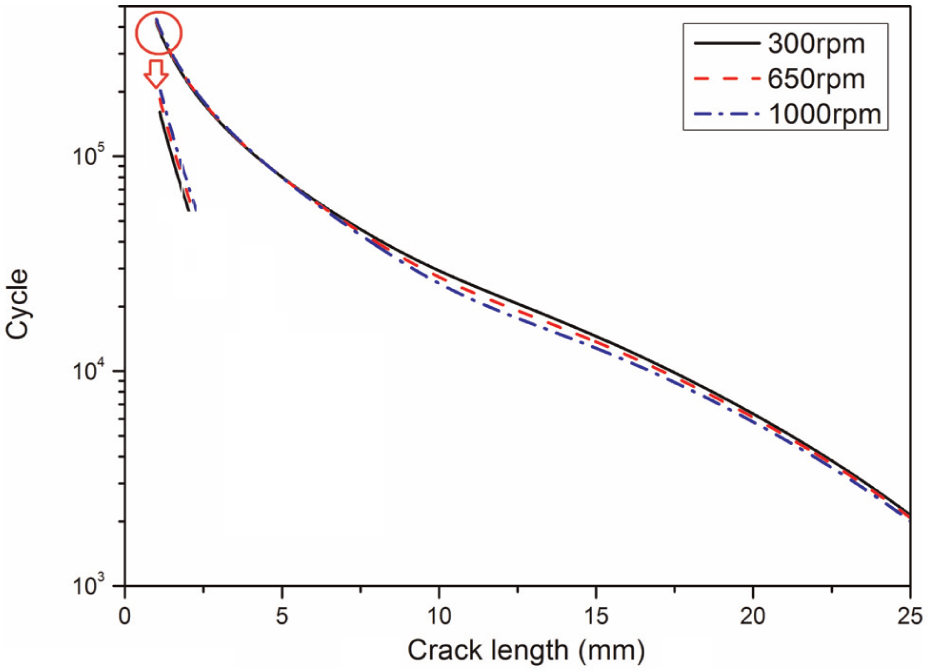
Influence of rotational speed on the fatigue life of M(T) specimen, R = 0.3.
After the rebalance of the residual stress in the fracture mechanical model, the compressive stress around the crack tip is increased with the increase in the rotational speed when the crack length is 5 mm, as shown in Figure 30. Thus, the FCGR is decreased considering the residual stress when the rotational speed is increased. The fatigue life of the welded plate can be increased by increasing the rotating speed, as shown in Figure 31. The fatigue lives at 300, 650 and 1000 r/min are 499,481, 963,425 and 2,355,755 cycles, respectively, at a = 15 mm.
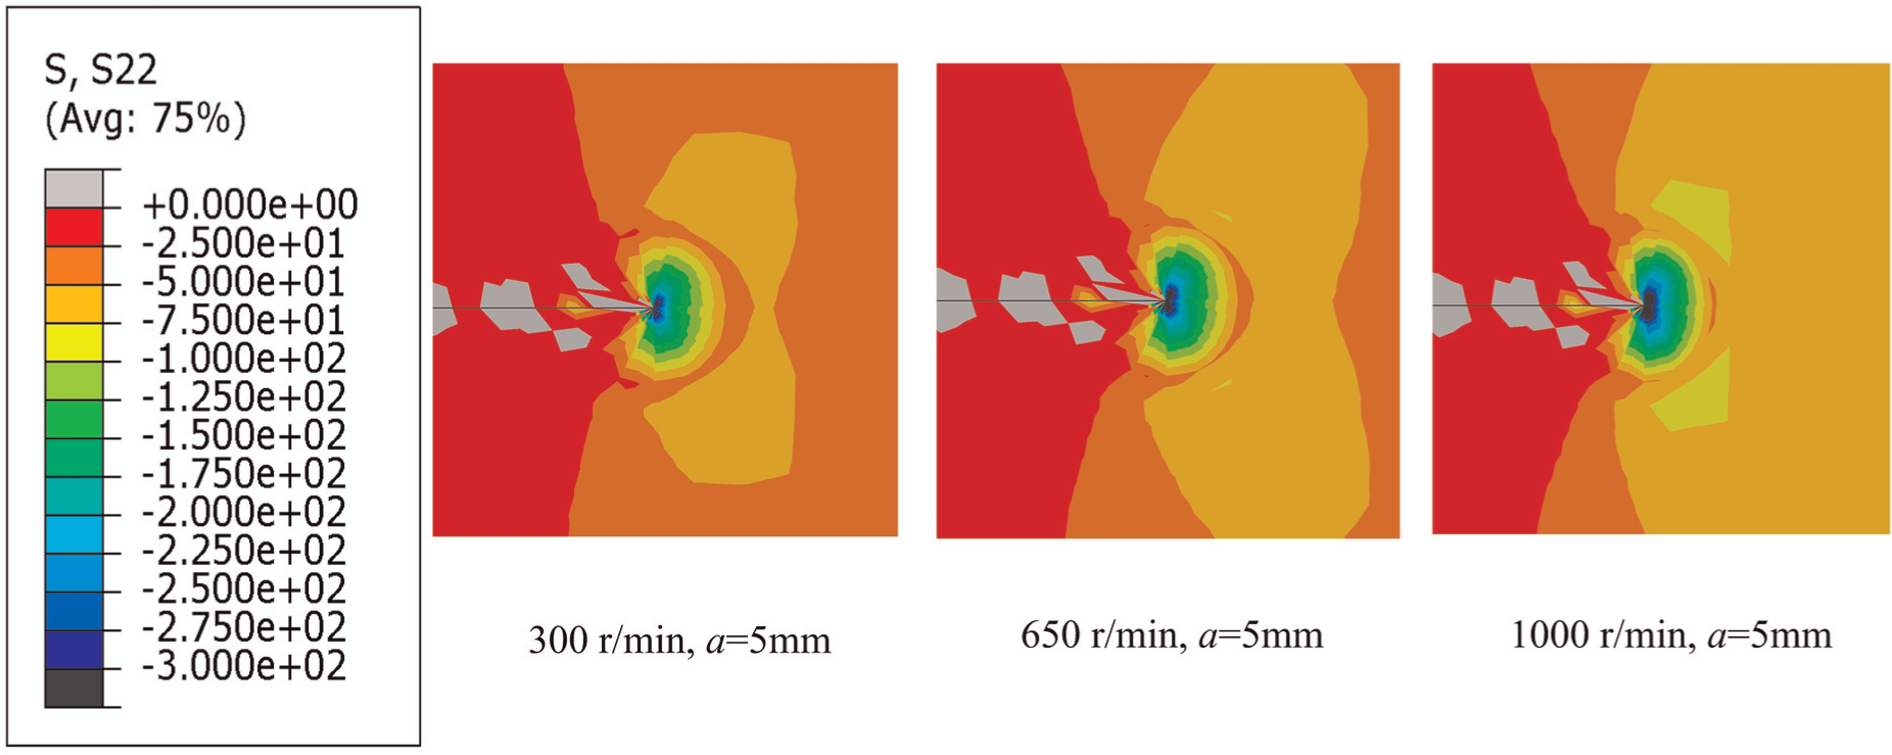
Stress distribution around the crack tip with different rotational speeds, ESE(T).
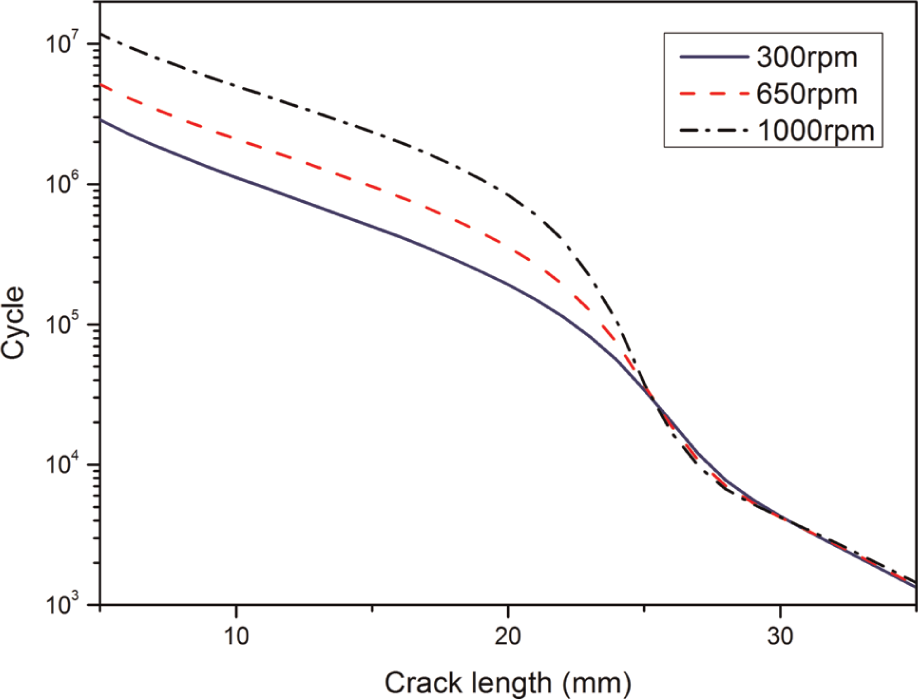
Influence of rotational speed on the fatigue life of ESE(T) specimen, R = 0.3.
Conclusion
The following conclusions are drawn:
By comparing the experimental data, the proposed sequentially coupled thermo-mechanical model for FSW is validated.
The effect of the residual stress on the fatigue life of the welded plate depends on the initial crack location. For M(T) specimen, the initial crack locates in the tensile residual stress field and the stress around the crack tip is tensile after the rebalance of the residual stress in the fracture mechanical model so that the fatigue life can be decreased compared to the base material. For ESE(T) specimen, the initial crack locates in the compressive residual stress field and the stress around the crack tip is compressive so that the fatigue life can be increased.
The influence of the rotational speed on the fatigue life is more obvious for ESE(T) specimen than M(T) specimen. With the increase in the rotational speed, the compressive residual stress away from the weld zone increases. Hence, the fatigue life of the ESE(T) specimen can be increased when the rotational speed is increased.
The residual stress distribution is different to the residual stress intensity factor distribution for ESE(T) and is similar with the residual stress intensity factor distribution for M(T) specimen.
Footnotes
Appendix 1
Declaration of conflicting interests
The authors declare that there is no conflict of interest.
Funding
This work was supported by Program for New Century Excellent Talents in University, the Fundamental Research Funds for the Central Universities, the National Natural Science Foundation of China (nos 11172057 and 11232003), the National Key Basic Research Special Foundation of China (2011CB013401) and the National High Technology Research and Development Program of China (2012AA050901).