
Abstract
High-pressure liquid jet incremental forming, a new die-less forming process, utilizes liquid as a flexible tool to deform the sheet metal. In this article, an oil was used as the forming liquid. Theoretical analysis and numerical simulation were conducted to obtain the influence of jet nozzle geometry on the jetting pressure and velocity, and then, the best conic angle of the nozzle was proven to be 13°. Through analyzing the simulation results, it is found that the preferable jetting distance is between 15 and 30 mm and the dynamic pressure distribution approximately obeys a Gaussian distribution on the cross section of the oil jet. Aluminum sheets with a thickness of 0.3 mm were used in the local bulging experiment and simulation to investigate the process parameters of high-pressure oil jet forming. High-pressure liquid jet incremental forming is one of several high-speed forming methods. To obtain the precise simulation results, the dynamic effect of jetting pressure was studied by using Abaqus/Explicit. The results show that using loading time 0.02 s in the simulation is suitable for the simulation of the dynamic effect caused by the high-pressure oil jet. By comparing the deformation of the sheet under different oil pressures, it can be found that the deformation of the aluminum sheet becomes severe as the oil pressure increases, and the proper oil pressure is 15 MPa for the 0.3-mm-thick LF21 aluminum sheet. To investigate the influence of jetting path on the surface quality of the sheet metal parts, the forming processes of the 0.3-mm-thick LF21 aluminum sheets, with different path intervals, were simulated. The simulation results show that a better forming quality of the workpiece can be obtained when the jetting path interval is 4 mm.
Introduction
With the development of aerospace and automobile industries, more complicated sheet metal parts are needed. To satisfy the needs of small-batch manufacture and low manufacture cost, some flexible forming processes were developed for sheet metal parts, such as multi-point forming, rubber pad forming, sheet hydro-forming and incremental sheet metal forming (ISMF). The conventional forming process ISMF plays an important role in the sheet metal forming domain. Many sheet metals with complicated shapes can be formed by ISMF with the support of die. Jackson and colleagues1,2 studied the mechanics of incremental sheet forming, and they also conducted an investigation into the forming of sandwich panels using an incremental sheet forming process. Kopac and Kampus 3 presented an ISMF process controlled by computer numerical control (CNC) milling machine tool together with computer-aided design (CAD)/computer-aided manufacturing (CAM) Mastercam system and a smooth forming tool. However, for the conventional ISMF, the forming forces can influence the stiffness of the equipment. Also, the significant heat-affected zones and scratches on the workpiece surface may occur. In recent years, a new manufacturing technology, use of a high-pressure liquid jetting, has been adopted in a wide range of industries. Water jet technology is used for cleaning parts, cutting and punching various materials. Besides, several types of high-pressure water jet mills have been developed to crush materials.4,5
High-pressure water jets have been used for forming sheet metals. A pioneering work was done by Iseki, 6 who put forward a new way of combining a high-speed water jet with sheet metal successive bulging technology to fabricate the shallow shell parts. Based on the results, Jurisevic et al. 7 conducted a similar study, in which a standard abrasive water jet (AWJ) cutting machine was modified to perform a water jet incremental sheet metal forming (WJISMF). A process of shaping fully formed beer and beverage cans with a rotating high-pressure water jet was described by Emmens, 8 who studied the effects of various machine and material parameters on the forming results. Jurisevic et al. 9 introduced the laminated supporting tools used for WJISMF, and the influence of the water jet trajectory on the forming results was investigated in his study. In addition, Chizari et al. 10 conducted an investigation on water jet forming of thin wall tubes using a slug of water and a continuous water jet. Sajn et al. 11 presented a technological window for WJISMF. In his research, a finite element analysis (FEA) model was established to simulate the impact of a water jet on the rigid surface and obtain the pressure distribution on the surface.
However, the working parameters of the jetting nozzle and the jetting path of high-pressure liquid jet incremental forming (HPLJIF) have not been investigated. In this article, the best working parameters of the nozzle for the 0.3-mm-thick LF21 aluminum sheet were studied by using FE simulation and experiments. To obtain the precise simulation results, the dynamic effect of workpiece forming was studied by using Abaqus/Explicit. And then, the jetting path interval was investigated.
Simulation of oil jet inside and outside the nozzle
Establishing the model
In this article, a two-dimensional (2D) axisymmetric two-phase flow model (Figure 1) was established by using the commercial fluid dynamics software Fluent. The calculation boundary conditions are set as shown in Figure 1. Edge AB is taken as the entrance of high-pressure oil. Edge BC lies on the axis of symmetry. Edges CD, DE and EF are air boundaries.
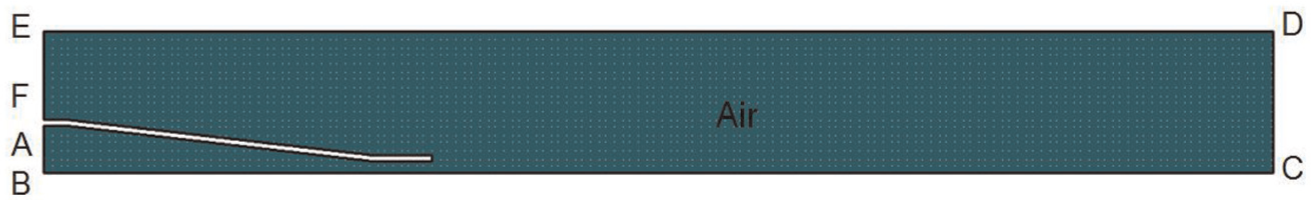
Computational model of the nozzle.
Results’ analysis of the numerical simulation
To determine the geometric parameters of the conical nozzle, simulations were carried out at one set of process parameters. In the simulations, the conic angles of the nozzle were 10°, 13°, 30° and 45°; the oil inlet pressures were 8, 10, 12, 15 and 20 MPa; the length–diameter ratio was 2.5 and the nozzle diameter was 2 mm.
Influence of conic angle on the jet flow field
Figure 2 illustrates the static pressure and velocity distributions of the flow field when the conic angle of the nozzle is 13°. It is observed that the maximum pressure occurs inside the nozzle. As the oil jet is exposed to the air, the static pressure of the oil jet will reduce to 0. At the nozzle exit, the velocity of the oil jet reaches its peak.
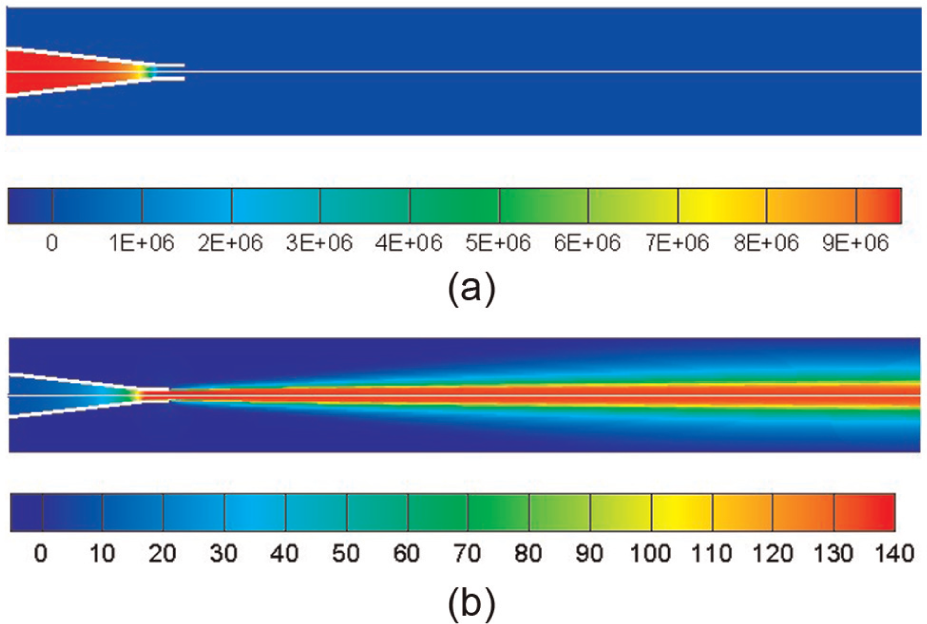
The simulation results of the flow field for the conic angle 13°: (a) static pressure distribution (unit: Pa) and (b) velocity distribution (unit: m/s).
The dynamic pressure distributions at the jetting distance of 50 mm are presented in Figure 3(a). The maximum pressure on the cross section reaches 9.22, 9.1, 7.97 and 7.46 MPa with the conic angle being 10°, 13°, 30° and 45°, respectively. It indicates that the dynamic pressure on the cross section increases as the conic angle of the nozzle reduces. On a certain cross section, the dynamic pressure maintains at the maximum within a radius of 0.5 mm. When the radius is larger than 0.5 mm, the dynamic pressure will rapidly reduce until it drops to 0.
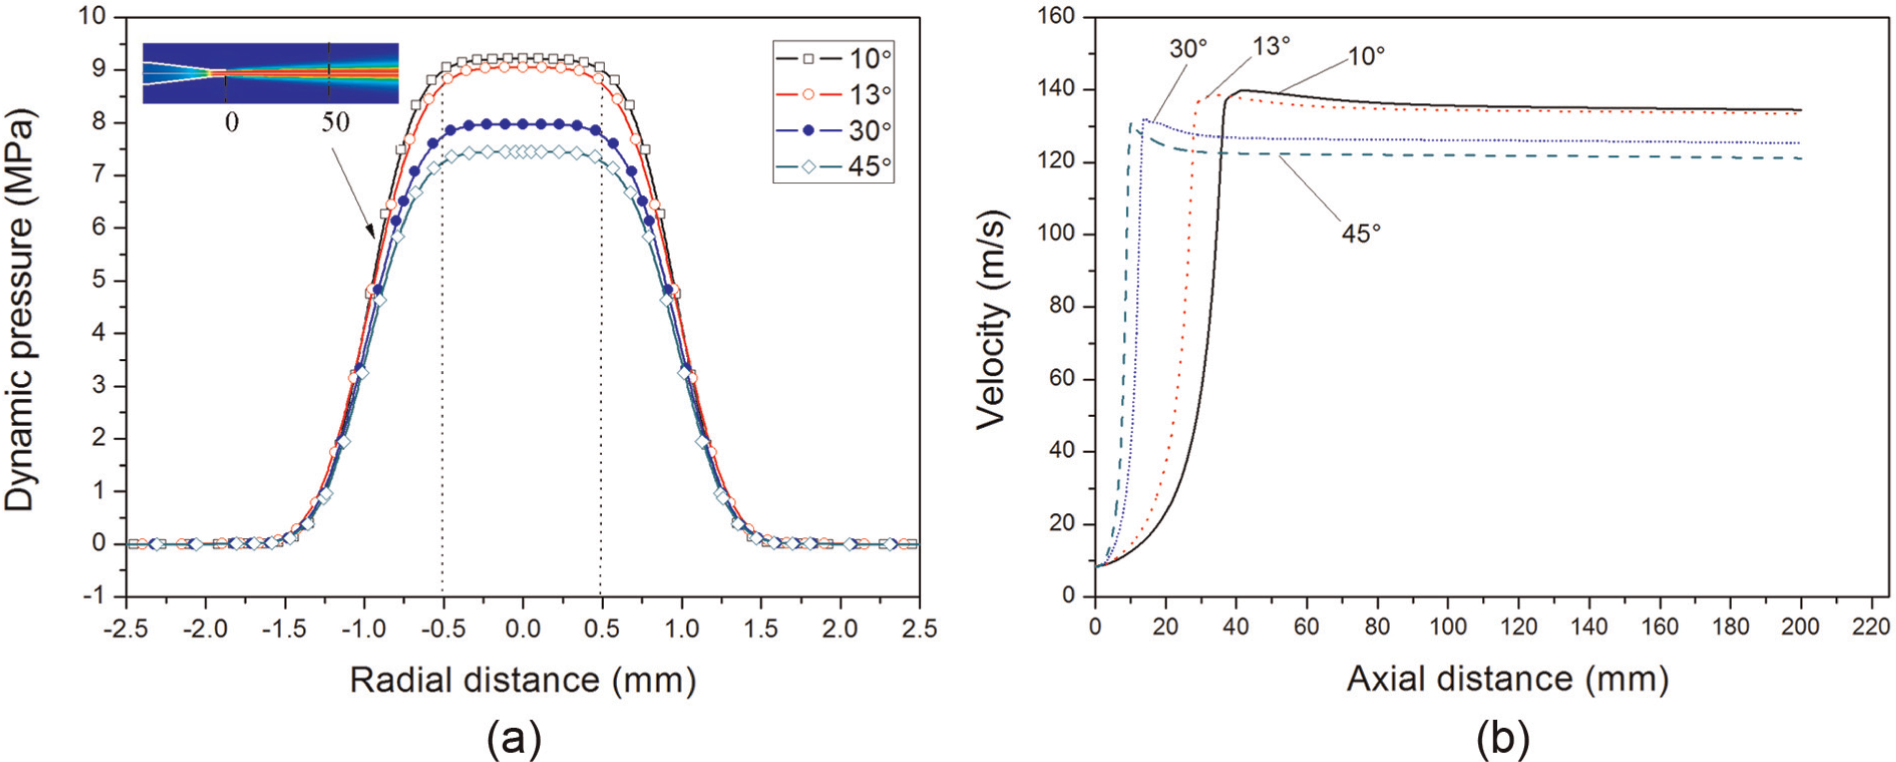
Effects of conic angles on the dynamic pressure and velocity distribution: (a) pressure distribution on the jet section and (b) velocity distribution along the oil jet centerline.
The velocity distributions along the jet centerline are plotted as shown in Figure 3(b). It can be seen that the maximum velocity of the oil jet reaches up to 139.8, 138.7, 132 and 130.7 m/s with the conic angle being 10°, 13°, 30°and 45°, respectively. With the distance from the nozzle increasing, the velocity slowly decreases due to the spreading of the oil jet. At a certain jetting distance, the axial velocity decreases as the conic angle increases. However, when the conic angle is less than 13°, both the axial velocity and dynamic pressure distribution have no large change. According to the fluid mechanics, the decrease in the conic angle of the nozzle will result in a large loss of the fluid pressure. Therefore, for the purpose of forming the sheet metals, the suitable value of the conic angle of the nozzle is 13°.
Figure 4 illustrates the dynamic pressure distributions under different oil pressures, with the jetting distance being 15 mm. It can be seen that the dynamic pressure is kept at the maximum within a radius of 0.63 mm and it increases with the increase in oil pressure. When the radius is greater than 0.63 mm, the dynamic pressure will rapidly decrease until it drops to 0. In addition, the greater the pressure, the faster the pressure drops.
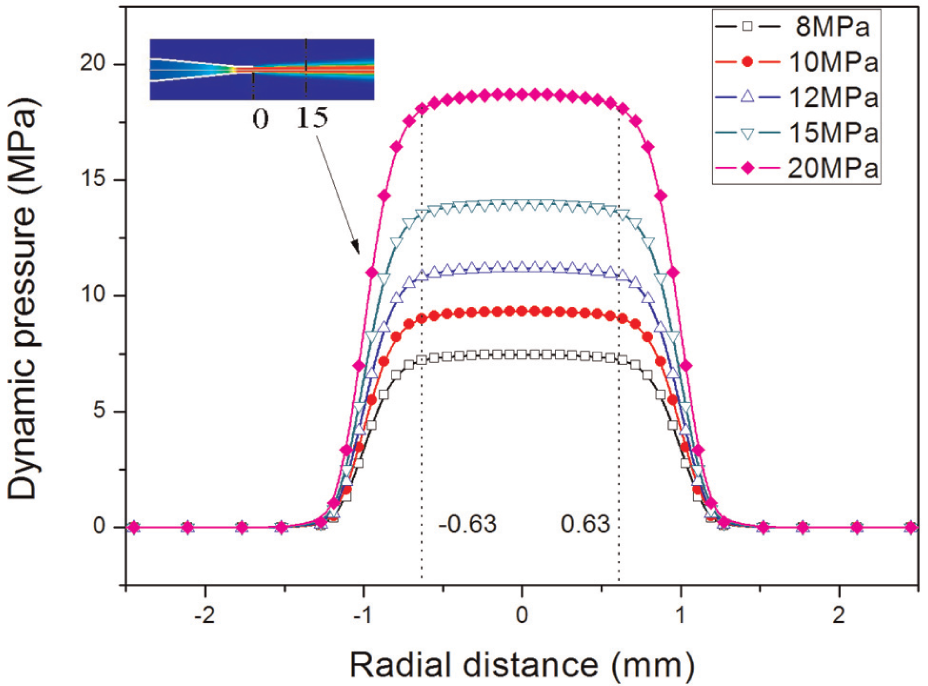
The dynamic pressure distributions under different oil pressures with the jetting distance being 15 mm.
Dynamic pressure distribution comparisons on different cross sections
The range of dynamic pressure distribution on a certain jetting distance determines the force per area on the sheet metal. Therefore, the dynamic pressures on jet cross sections at five jetting distances (15, 30, 60, 90 and 120 mm) are measured in the simulation. Figure 5 shows that the maximum pressure of the jet flow is 9.335, 9.157, 9.029, 8.965 and 8.87 MPa when the distance is 15, 30, 60, 90 and 120 mm, respectively. Along the jet flow direction, the dynamic pressure distribution experiences outstanding changes with the jetting distance increasing. It can be seen that the dynamic pressure has a fixed value of 3.5 MPa despite changing the jetting distance when the radius is 1 mm. In addition, it is observed that the range, within which the dynamic pressure maintains at the maximum, decreases with an increase in the jetting distance. The range of pressure distribution broadens with the increase in the jetting distance due to the radial diffusion of the oil jet. It can also be seen that the dynamic pressures maintain at the maximum and the pressure curves keep flat within a radius of 0.63 mm when the jetting distance is between 15 and 30 mm. The dynamic pressure in this jetting distance range can produce evenly distributed hitting force on the workpiece surface, thus deforming the sheet metal uniformly. Therefore, a jetting distance between 15 and 30 mm is the preferable jetting distance.
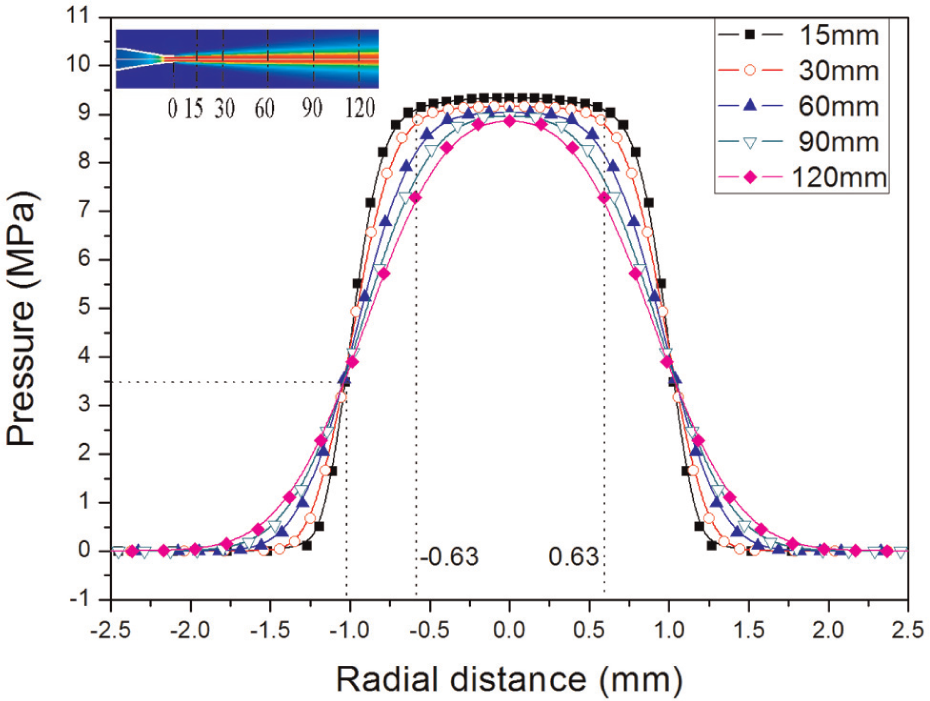
The dynamic pressure distribution on different jetting cross sections (13°).
Material property
In this article, an LF21 aluminum sheet with a thickness of 0.3 mm was used as the workpiece of the experiment. To measure the precise mechanical parameters of the thin blank, a digital speckle test method was used to detect the tensile process. Figure 6 illustrates the equipment for speckle tensile testing. The digital speckle test method, combining photography measurement technology and digital image correlation techniques, can collect specimen images in real time and then calculate strain data by using the software system. The stress–strain curve obtained from the tensile experiment is presented in Figure 7.
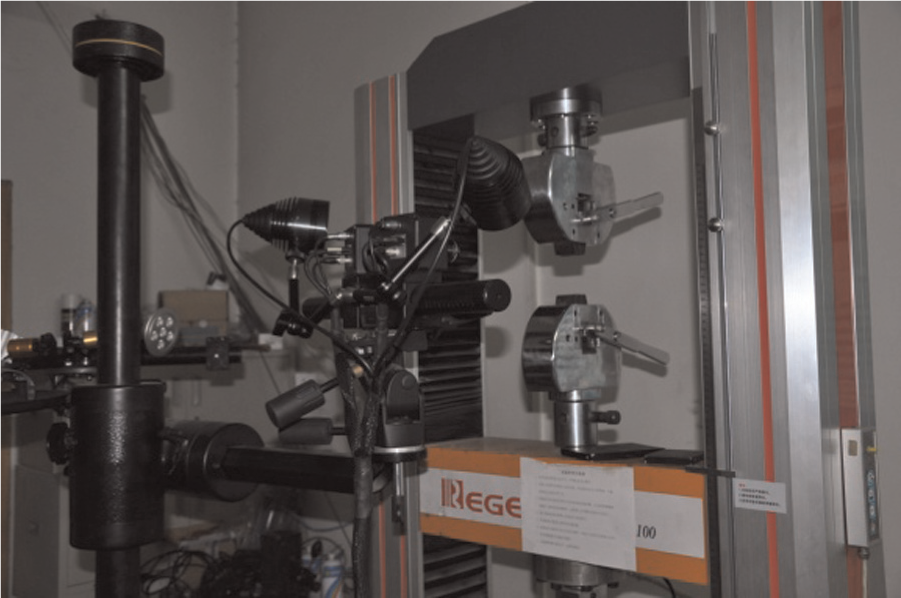
The equipment of speckle tensile testing.
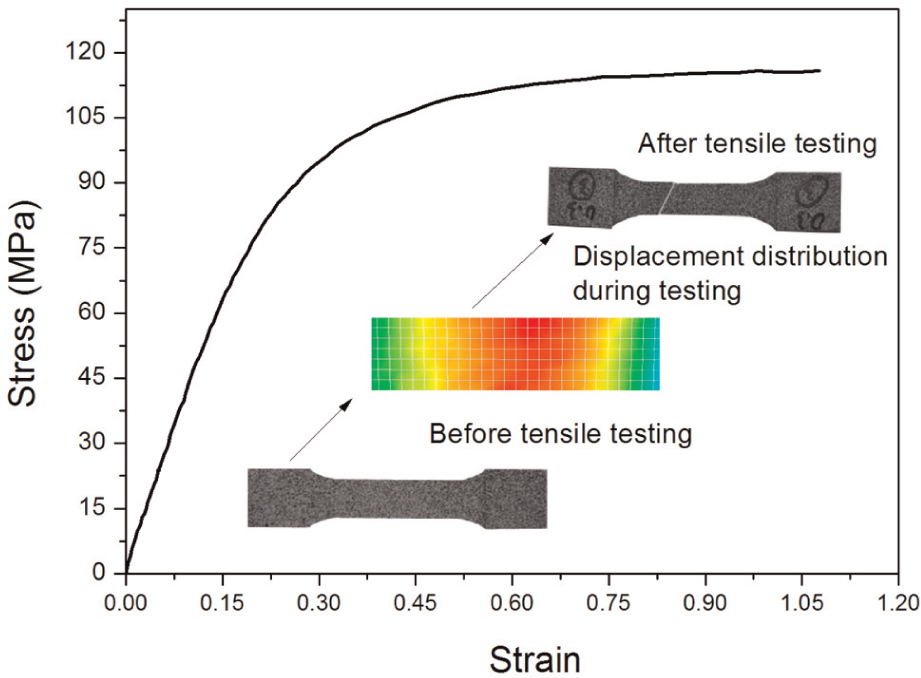
Stress–strain curve of the 0.3-mm-thick LF21 aluminum sheet.
Experiment of local bulging
An experimental device for local bulging of the aluminum sheet has been designed and built. The working principle of the experimental device is presented in Figure 8.
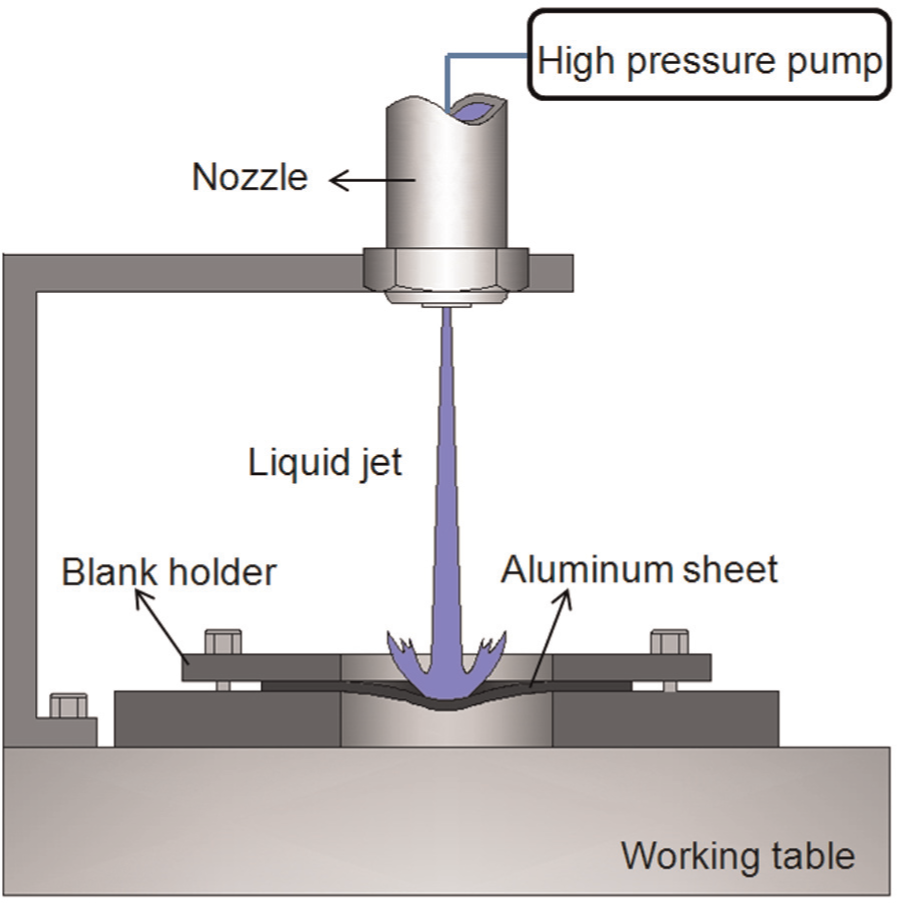
The working principle of the experimental device.
The analysis of experimental results
The experiments were carried out with different process parameters. In the experiment, the oil pressures were 8, 10, 15 and 20 MPa and the nozzle diameter was 2 mm. The aluminum sheets formed under different oil pressures are presented in Figure 9. The cross-sectional shapes of the formed aluminum sheets under different oil pressures are plotted in Figure 10. It can be seen that the height of local bulging reaches 0.3, 0.46, 0.76 and 1.65 mm when the oil pressure is 8, 10, 15 and 20 MPa, respectively. From Figure 9, it can also be seen that the deformation of the aluminum sheet is severe when the oil pressure is 20 MPa, and the deformation of the aluminum sheet is smooth when the oil pressure is 15 MPa. In ISMF, the smooth and flat deformation in a single path will make the feature between two loading paths gentle without local undulation. Therefore, for the 0.3-mm-thick LF21 aluminum sheet, the proper oil pressure is 15 MPa.
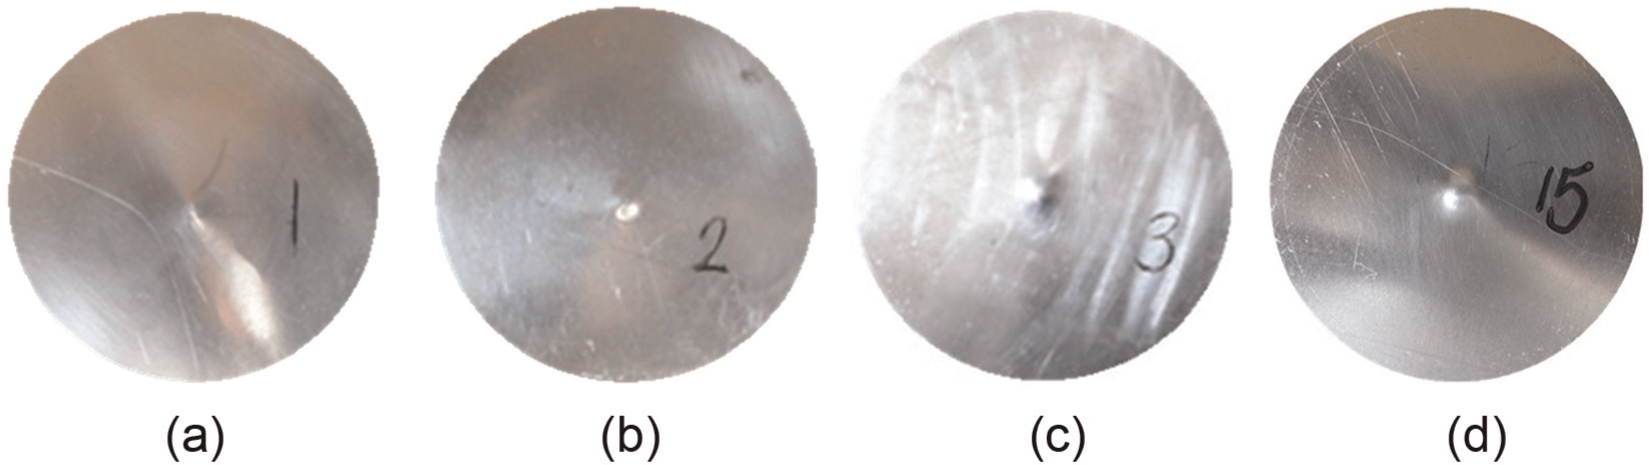
Deformed aluminum sheet with 0.3 mm thickness under different oil pressures: (a) P = 8 MPa, (b) P = 10 MPa, (c) P = 15 MPa and (d) P = 20 MPa (d = 15 mm).
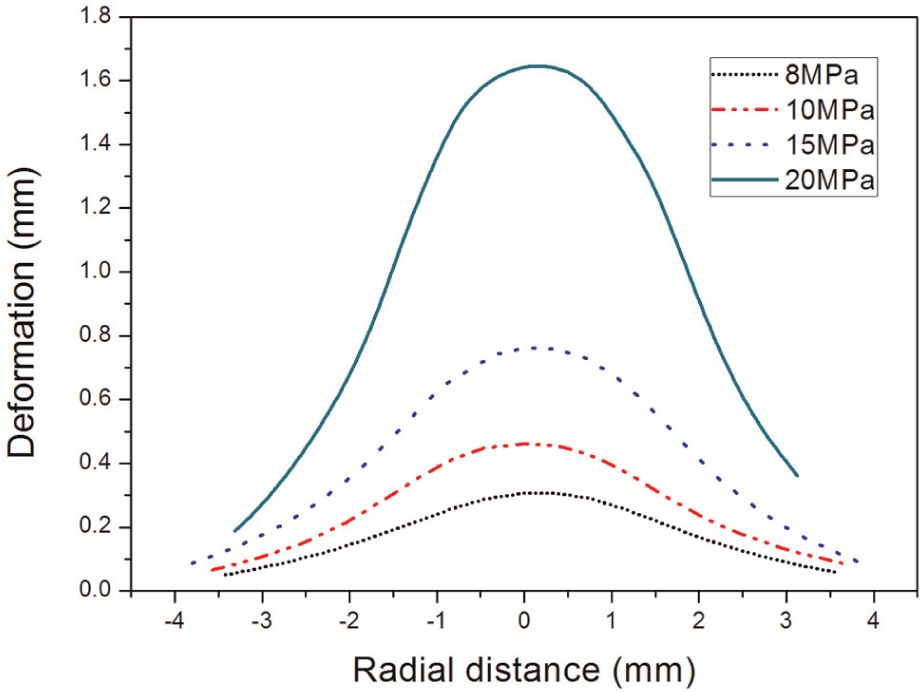
The deformation of aluminum sheets under different oil pressures (15 mm).
The numerical simulation of local bulging
The establishment of a finite element method model
Curve fitting was conducted on the dynamic pressure data of the jet cross section measured in the simulation. By analyzing these data, it was found that the dynamic pressure distribution was quite close to a Gaussian distribution. So, the pressure obeying the Gaussian distribution was imposed on the sheet metal to simulate the pressure provided by the oil jet. The pressure equation was concluded as equation (1). The Gaussian parameters of the pressure equation under different oil pressures are listed in Table 1 (at a jetting distance of 15 mm).
The Gaussian parameters of pressure equation.
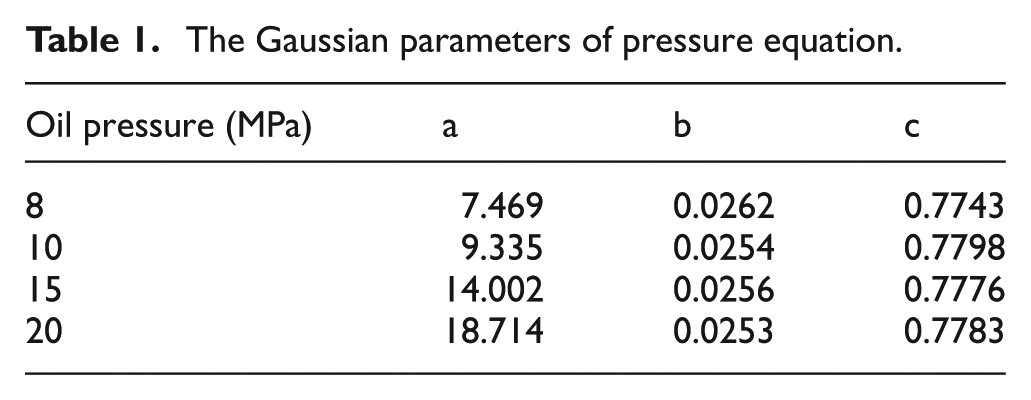
Pressure distribution equation
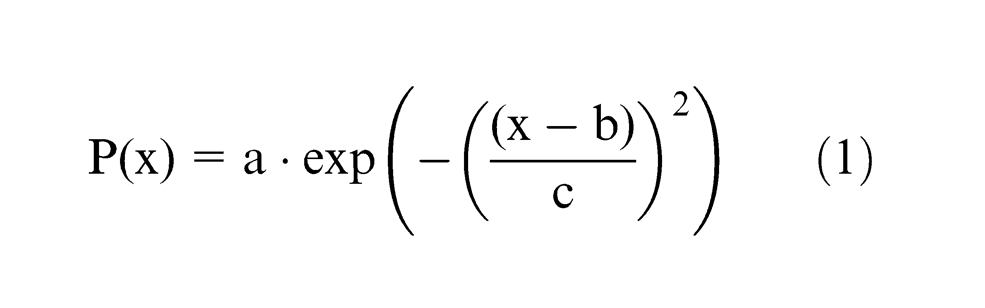
where x is the radial distance from the centerline of the oil jet and a, b and c are the Gaussian parameters of the pressure equation.
An axisymmetric model for local bulging of the aluminum sheet was established in the FEA software Abaqus/Explicit, in which the CAX4R element was used. The fixed constraint was applied to the edge of the aluminum sheet, and the pressure obeying a Gaussian distribution was imposed on the central area of the aluminum sheet (see Figure 11).
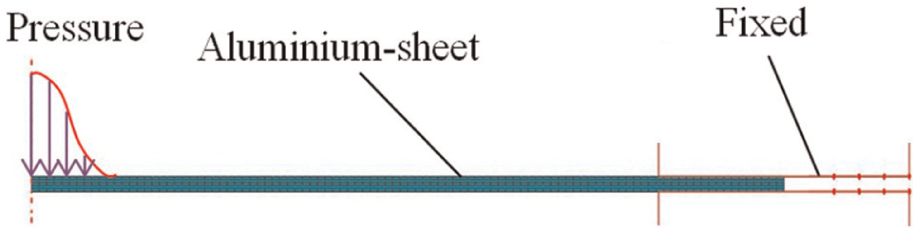
FEA model of local bulging of the aluminum sheet.
The dynamic effects of HPLJIF
In HPLJIF, high-speed fluid generated by a high-pressure pump is used to act on a workpiece. The deformation of the workpiece is often completed within 10 ms or less. During this process, the deformation velocity of the workpiece is raised up to dozens of meters per second followed by subsequent deceleration. Therefore, the dynamic effect of jetting pressure must be taken into consideration during HPLJIF simulation. To investigate the dynamic effect of jetting pressure, the forming process of the aluminum sheet is simulated with different loading times ranging from 0.001 to 1 s. The central displacement of the aluminum sheet varies with different loading times (see Figure 12). It can be seen that the central deformations before and after springback tend to a stable value when the loading time is more than 0.1 s, which indicates that the dynamic effect is no longer significant at this moment. When the loading time is less than 0.1 s, the deformations before and after springback both decrease with the increase in loading time. When the jetting distance is 15 mm, the inlet pressure is 15 MPa and the loading time is 0.02 s, the value of the height of the local bulging of the aluminum sheet obtained in simulation reaches to 0.703 mm, which approximately accords with that obtained in the experiment (see Figure 10). Therefore, we assume that using loading time 0.02 s in the simulation is suitable for the simulation of the dynamic effect caused by the high-pressure oil jet.
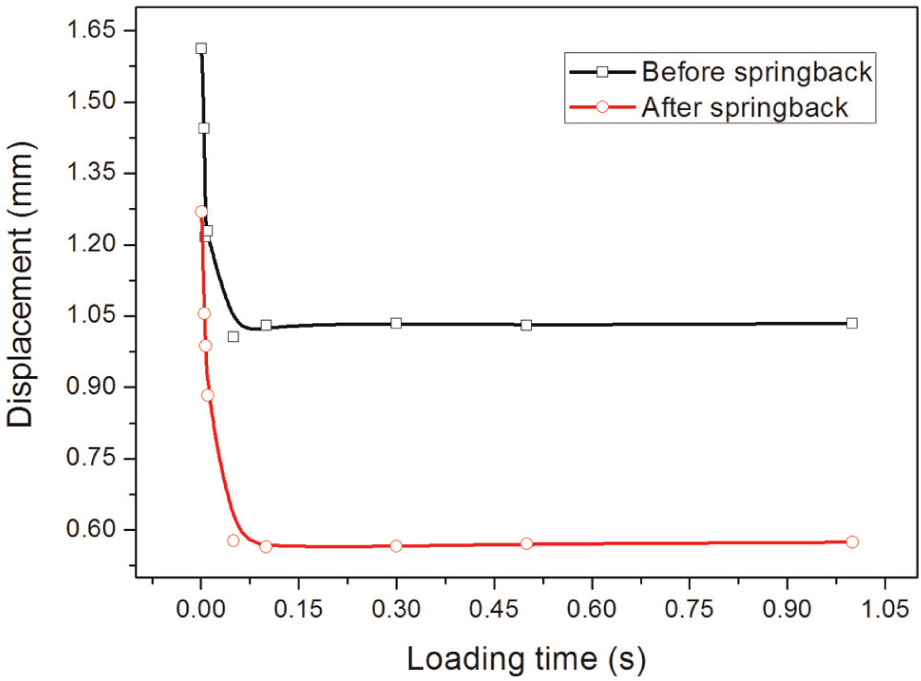
The central displacement of the sheet changing with loading time before and after springback.
The analysis of simulation results
Simulation results of local bulging after springback are given in Figure 13, in which the cross-sectional shapes of the aluminum sheets are plotted. It can be seen that the central deformations of the aluminum sheet reach 0.285, 0.424, 0.706 and 1.503 mm for oil pressures of 8, 10, 15 and 20 MPa. Compared with the experimental results, the value from the simulation is slightly less than the value from the experiment. The percentage difference between the simulation results and experimental measurement value is 5%, 7.8%, 7.1% and 8.9% when the oil pressure is 8, 10, 15 and 20 MPa, respectively.
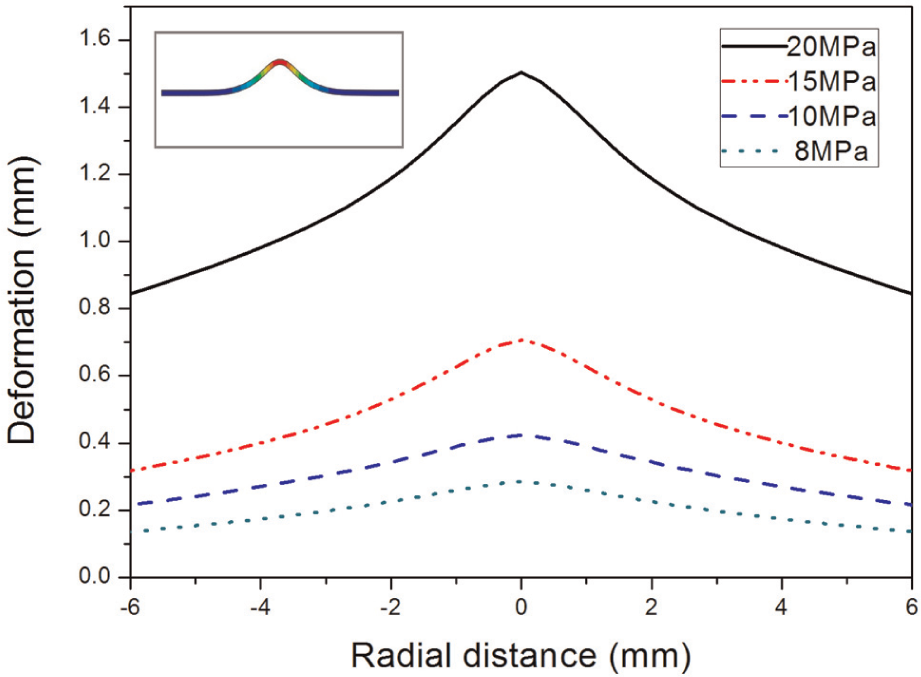
Deformation of aluminum sheet under different oil pressures.
The cross-sectional profiles of the formed aluminum sheet obtained in the simulation and experiment are plotted in Figure 14. (The oil pressure is 15 MPa, and the jetting distance is 15 mm.) When the radius of the sheet is larger than 1.2 mm, the deformation in simulation is larger than that in the experiment. The difference may be induced by the pressure distribution because the pressure applied in the finite element method (FEM) model is constant, while the pressure generated by the oil jet will change with the deformation of the aluminum sheet. Despite using a simplified load in the simulation, the results from the simulation correctly predict the deformation rule of the aluminum sheet.
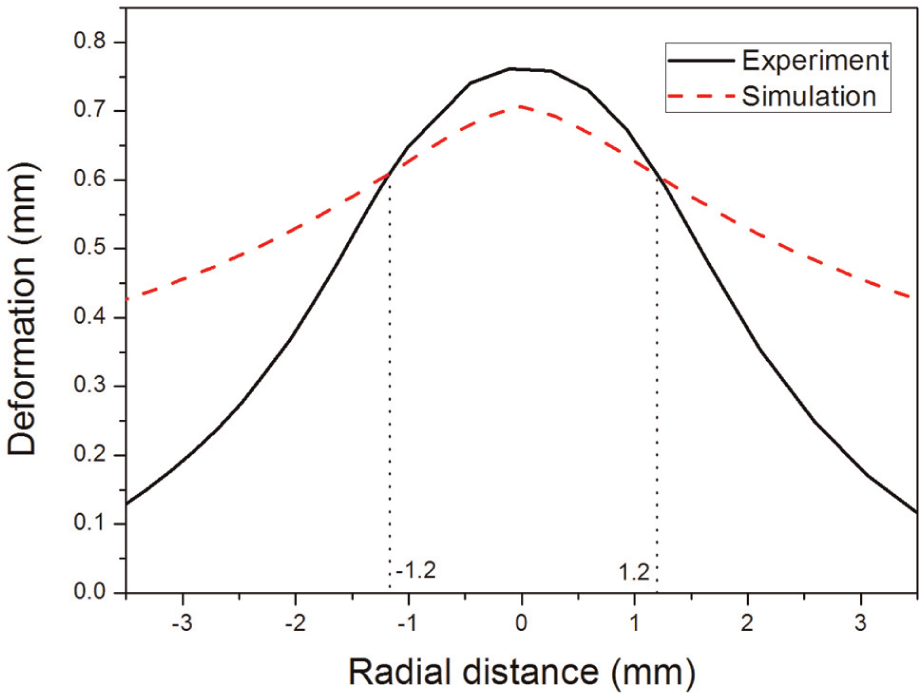
The comparison of simulation result and experiment result.
Study of jetting path interval
In conventional incremental forming, the forming of sheet metal parts was achieved by controlling the path of rigid punch, while in HPLJIF the sheet metal is formed by controlling the pressure and action range of the liquid. ISMF using spherical forming tool has been investigated deeply. Azaouzi and Lebaal 12 conducted a tool path optimization for single-point incremental sheet forming using the response surface method. Lu et al. 13 put forward a feature-based tool path generation approach for the incremental sheet forming process. However, the influence of fluid jetting path on the surface quality of the sheet metal parts has not been reported in the field of HPLJIF. To investigate the influence of jetting path on the surface quality of the sheet metal parts, we simulated the forming process of a 0.3-mm-thick LF21 aluminum sheet. Its three-dimensional (3D) analysis model is shown in Figure 15(a). Considering the calculation efficiency, we simplified the model to a 2D plane strain model that is illustrated in Figure 15(b). The fitting dynamic pressure was imposed on the corresponding region of the aluminum sheet in different time steps when the oil pressure was 15 MPa and the jetting distance was 15 mm. “L” represents the interval between two loading areas. “r” stands for half of the length of the loading area and the radius of the fluid jet (see Figure 15(b)). According to the range of the dynamic pressure distribution, the length of the loading area was set to 1 mm. Then, the forming process of the aluminum sheet was simulated in Abaqus/Explicit to investigate the interval between the two loading paths.
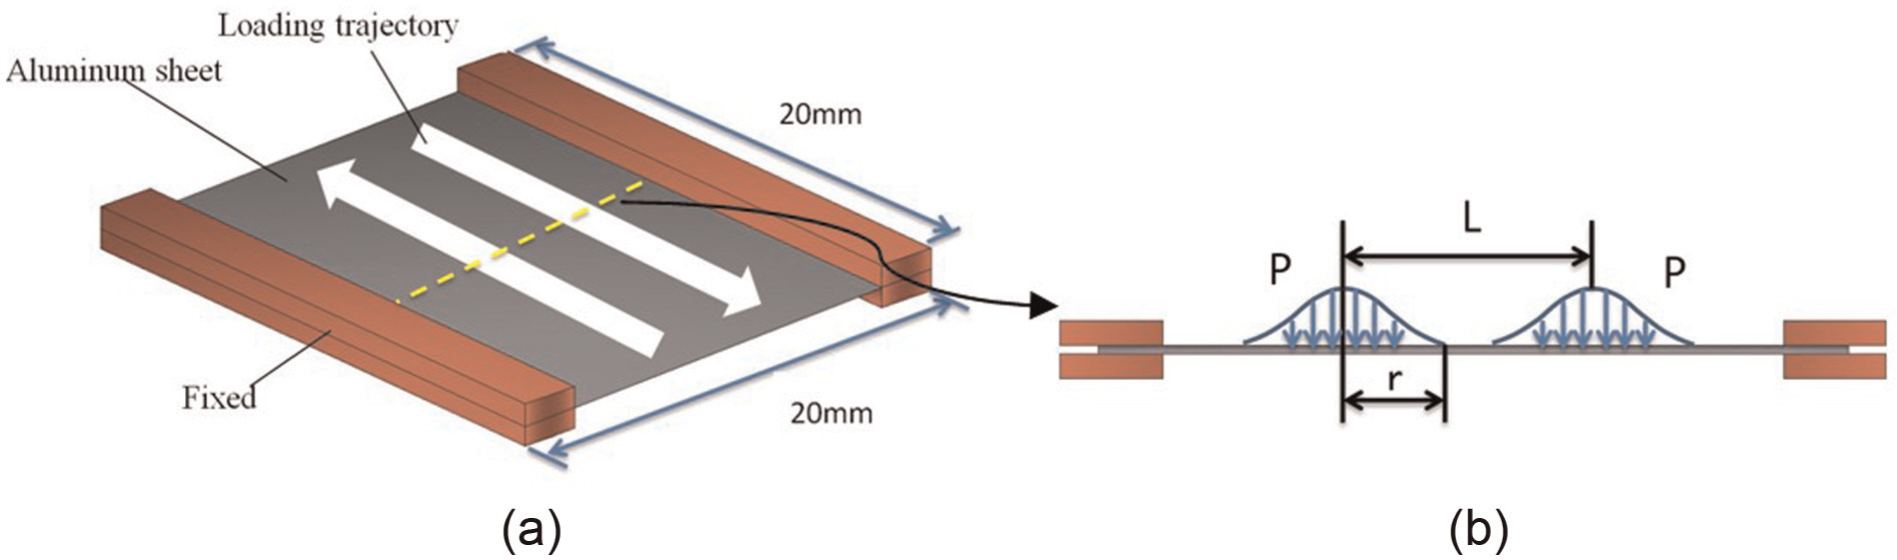
The loading trajectory of the aluminum sheet: (a) three-dimensional model and (b) two-dimensional model.
Simulation result
Figure 16 illustrates the displacement field of the aluminum sheet under different forming intervals of paths. When L = 3.5 mm, the displacements of the first loading region are less than those of the second loading region and the bottom of the formed aluminum sheet is slightly tilted. The deformation of the first region affects that of the second region, which causes a greater deformation of the second region. When L = 4 mm, the bottom of the formed aluminum sheet is approximately flat. When L = 4.5 mm, the displacements of the two loading regions are nearly the same; however, the deformation between the two regions is smaller and a concave region is formed, which leads to the bottom of the sheet being rough. When L is increased to 5.3 mm, the concave region becomes more salient and the bottom of the sheet becomes more rough.
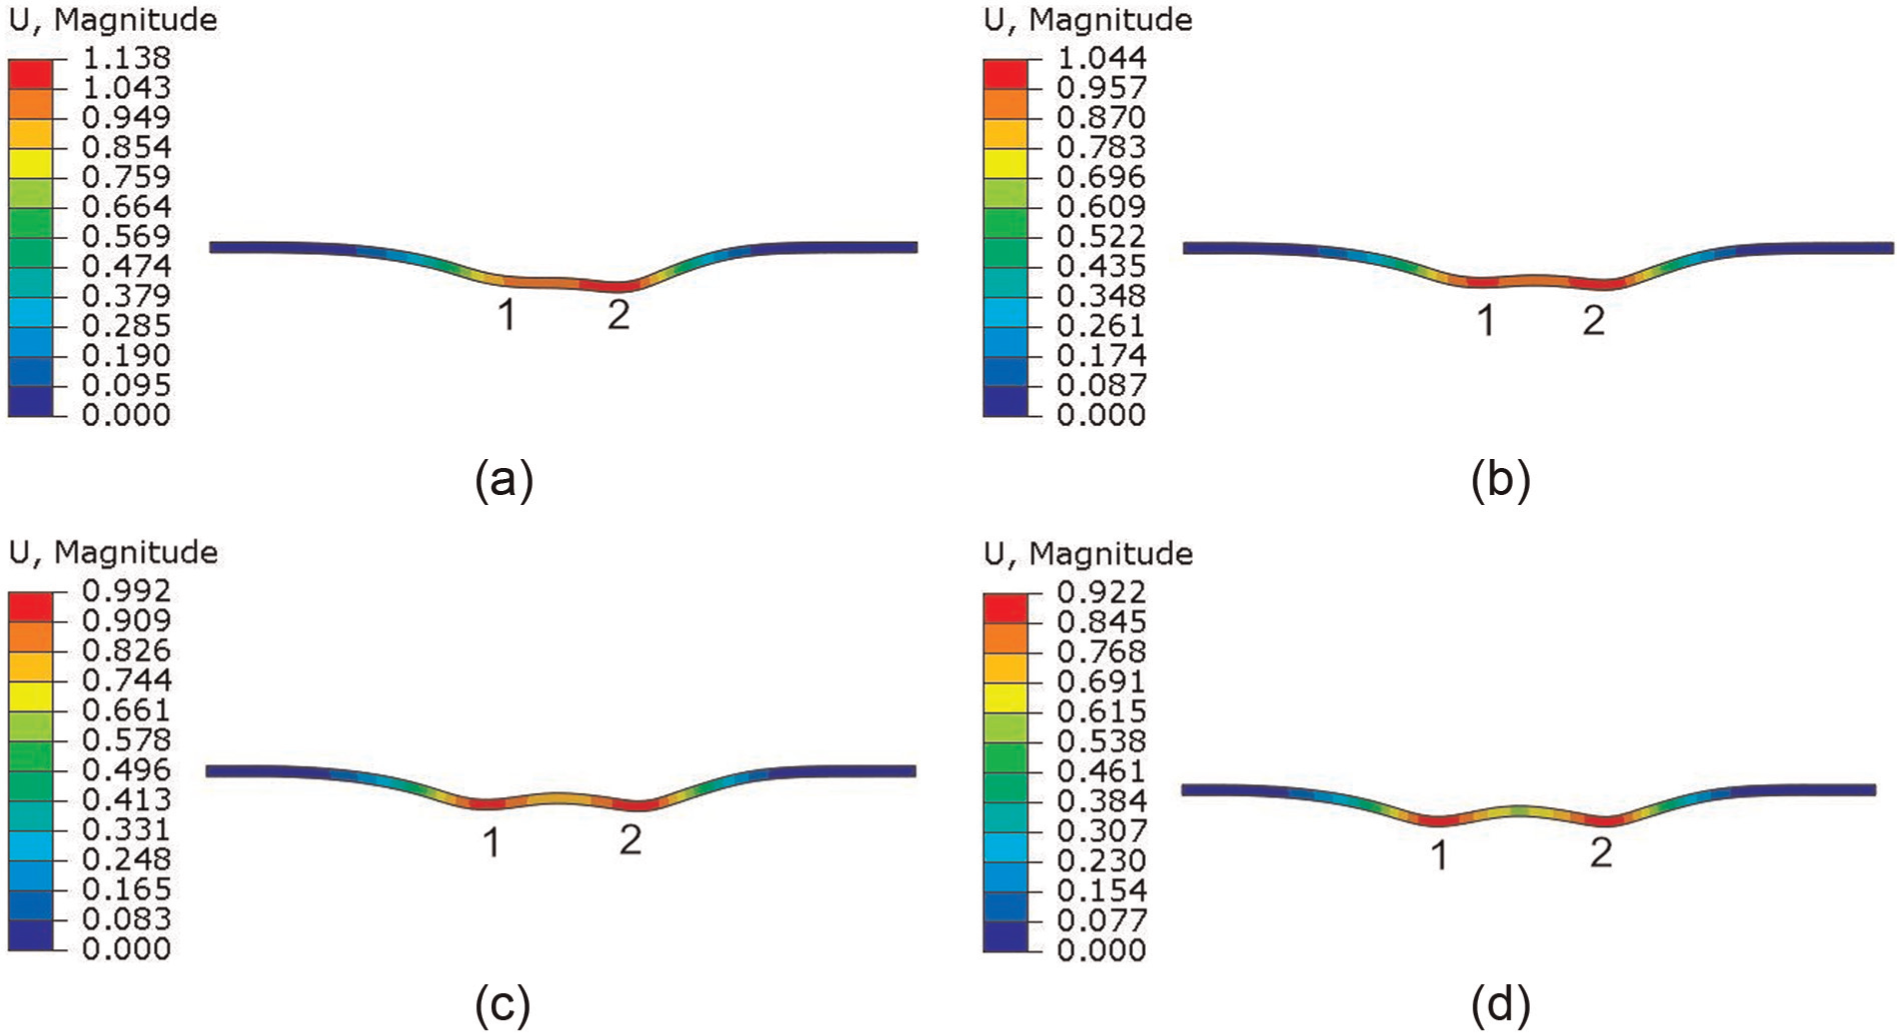
The displacement field of the aluminum sheet under different forming intervals (unit: mm): (a) L = 3.5 mm, (b) L = 4 mm, (c) L = 4.5 mm and (d) L = 5.3 mm.
Forming processes are often characterized by nondimensional numbers. The nondimensional number in HPLJIF is defined as the jetting path interval (L) over the radius of the fluid jet (r). Figure 17 plots the fluctuation of the bottom of the aluminum sheet changing with L/r. In this figure, the value of “S” is the difference between the maximum and minimum displacements of the bottom of the aluminum sheet; it represents the degree of roughness. When L/r = 4, “S” has the minimum value of 0.131 mm. Therefore, we assume that 4 mm is the optimal value of the jetting path interval.
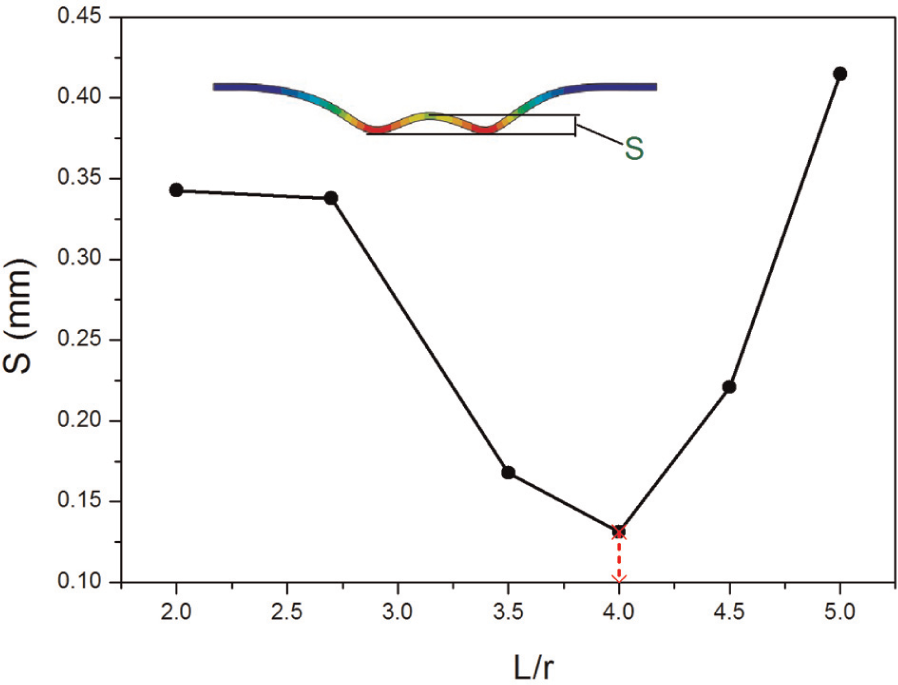
The fluctuation of the bottom of the aluminum sheet changing with L/r.
To verify the validity of the plane strain model, a 3D FE model of the aluminum sheet is established. In the model, user subroutine “vdload” is used to apply loads on the surface of the aluminum sheet in Abaqus/Explicit. Figure 18 shows the equivalent displacement distribution of the aluminum sheet. When L = 4 mm, the maximum displacement of the bottom is 0.8262 mm and the minimum displacement is 0.6706 mm. The value of “S” is 0.1556 mm, which is close to the results of the simulation using the plane strain model. When L = 8 mm, the displacements of the two loading regions are nearly the same; however, the deformation between the two regions is smaller and a concave region is formed, which shows good accordance with the results of the simulation using plane strain model.
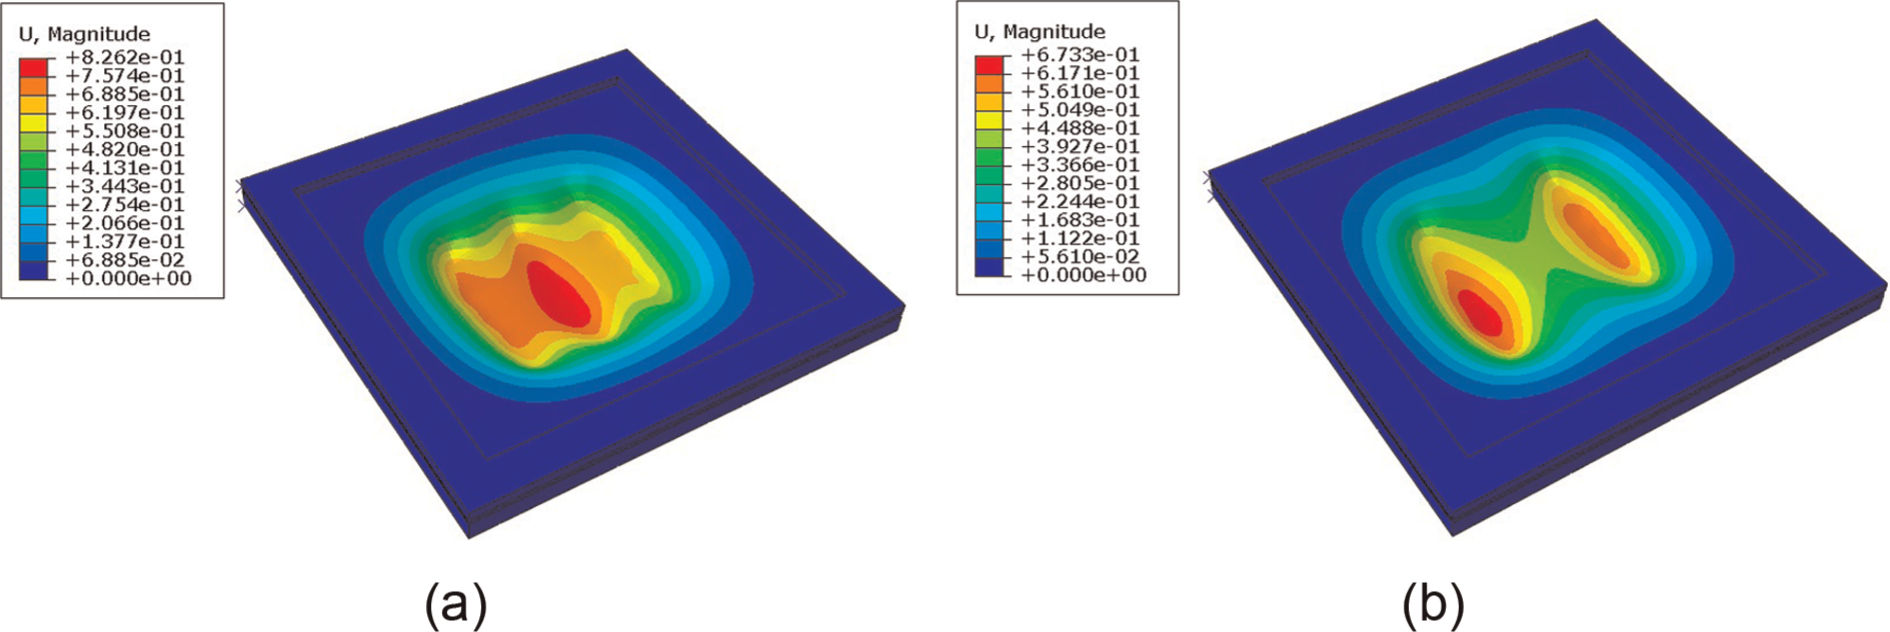
The equivalent displacement distribution of the aluminum sheet (unit: mm): (a) L = 4 mm and (b) L = 8 mm.
Therefore, it can be concluded that the jetting path interval has great influence on the forming quality of the sheet metal parts. The control of HPLJIF is complex and many factors, such as the forming pressure and jetting distance, have great influence on the forming quality.
Conclusion
The flow field simulation of an oil jet is done by using Fluent software. From the angles trialled, the best conic angle of the nozzle is 13°. The dynamic pressure distribution on the cross section of the oil jet is in good accordance with the Gaussian distribution, and the static pressure will reduce to 0 since the oil jet is exposed to the air. The range of dynamic pressure distribution broadens with the increase in the distance from the nozzle due to the radial diffusion of the oil jet. The dynamic pressures maintain at the maximum and the pressure curves keep flat within a radius of 0.63 mm when the jetting distance is between 15 and 30 mm. The results show that a distance between 15 and 30 mm is the preferable choice.
The dynamic effect of jetting pressure was studied by using Abaqus/Explicit. The results show that using loading time 0.02 s in the simulation is suitable for the simulation of the dynamic effect caused by the high-pressure oil jet. Oil jet local bulging of the aluminum sheet is simulated. The results show that the deformation of the aluminum sheet increases as the oil pressure increases. Then, the forming experiment of aluminum sheet is conducted. Simulation results show good accordance with the experimental results. It can be concluded that for the 0.3-mm-thick LF21 aluminum sheet, the proper oil pressure is 15 MPa.
The forming process of a 0.3-mm-thick LF21 aluminum sheet is simulated with different path intervals. The results show that a better forming quality of the workpiece can be obtained when the jetting path interval is 4 mm.
Footnotes
Declaration of conflicting interests
The authors declare that there is no conflict of interest.
Funding
This work was supported by the National Natural Science Foundation of China (Grant No. 50975222 and 51375369).