
Abstract
Three grades of titanium alloy Ti (grade 2), Ti-6Al-4V (grade 5) and Ti-5Al-2.5Sn (grade 6) were machined using electric discharge machining after deep and shallow cryogenic treatment. The peak current was observed to be the most significant factor followed by electrode material and pulse-on time. Subsequently, a mathematical model for predicting material removal rate of titanium alloys was developed using dimensional analysis based on the significant process parameters affecting material removal rate and the thermal–physical properties of the titanium alloy. The predicted results obtained from the mathematical model were validated by comparing with the experimental results and were found to be in good agreement with each other. Incremental increase in material removal rate was observed after deep cryogenic treatment due to increase in thermal and electrical conductivity of the material. The model showed that the thermal properties of the material such as thermal conductivity, specific heat and boiling point of materials affect the erosion process in electric discharge machining. Microstructure analysis was carried out using scanning electron microscope, energy-dispersive X-ray spectrometer and X-ray diffraction for selected samples. The migration of different elements and formation of compounds on the machined surface was investigated using energy-dispersive X-ray spectrometer and X-ray diffraction analysis.
Keywords
Introduction
Titanium and its alloys are lightweight, heat and corrosion resistant and their mechanical strength is similar to steel, making it a widely employed material for manufacturing of different parts. The machining of titanium and its alloys with conventional machining processes is very difficult because of their high toughness and low thermal conductivity. Thus, electric discharge machining (EDM) is a cost-effective machining process, which is used for machining of titanium and its alloys.1,2 During EDM, the material is removed through a series of electric sparks between the tool (electrode) and the workpiece because of generation of very high temperature (8000 °C–12,000 °C) at the spark zone resulting in melting and vaporization of material.
Many researchers have studied EDM of titanium and its alloys. Chen et al. 3 reported higher material removal rate (MRR) with low tool wear rate (TWR) during machining of Ti-6Al-4V with water as dielectric instead of kerosene. A combination of EDM with ultrasonic machining (USM) was successfully used to improve the machining characteristics of Ti-6Al-4V and reduce the recast layer thickness.1,4 Hascalik and Caydas 5 used EDM process with electrochemical grinding to investigate the effect on surface integrity of Ti-6Al-4V alloy with different electrode materials. A film of titanium oxide (TiO) was observed at low voltage, which hinders the current flow. In another study, Hascalik and Caydas 6 investigated the effect of different electrode materials on surface integrity during machining of Ti-6Al-4V. Fonda et al. 7 studied thermal and electric properties of Ti-6Al-4V and reported that energy during EDM needs to be controlled to prevent rapid heat generation. Pradhan and Bhattacharyya 8 reported the polarity effect in micro-machining of Ti 64 titanium alloy. Kibria et al. 9 investigated the effect of boron carbide powder mixed with kerosene and deionized water during micro-EDM of Ti-6Al-4V. Chow et al. 10 studied the effect of SiC and Al powder mixed with kerosene oil during micro-slit machining of Ti-6Al-4V titanium alloy. Significant increase in MRR was observed with addition of SiC and Al powder in kerosene. Chow et al. 11 also studied the effect of SiC powder mixed with water to investigate their effect on machining of Ti-6Al-4V at different polarities. Yan et al. 12 investigated the effect of urea mixed with distilled water on machining characteristics of pure titanium.
From the literature review, it can be concluded that although several studies have reported about machining of titanium with EDM, the effect of cryogenic treatment of titanium has not been explored. Also, the effect of manganese (Mn) and tungsten (W) powder mixed with EDM oil has not been reported. The aim of this study is to investigate the effect of cryogenic treatment of titanium and its alloys with Mn and W powder mixed in dielectric fluid during EDM. A mathematical model using Buckingham’s π theorem to predict MRR has been developed using the thermal–physical properties of the workpiece material. Subsequently, the predicted and the experimental results have been compared followed by microstructure analysis using scanning electron microscope (SEM) and energy-dispersive X-ray spectrometer (EDX) for all trials.
Methodology and experimental setup
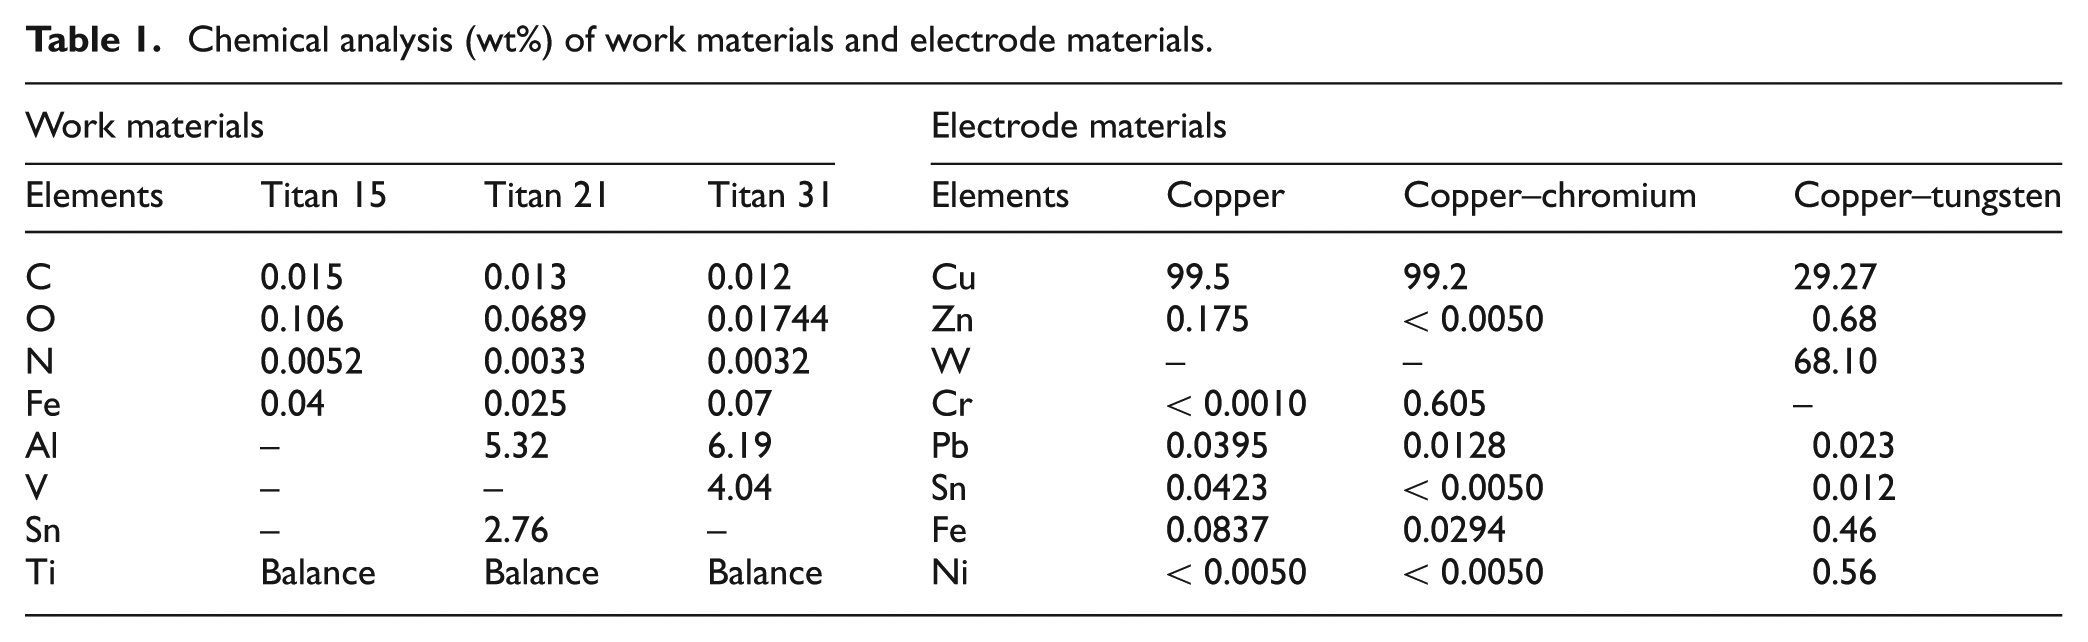
The experiments were conducted on a die sinking EDM machine, Model OSCAR MAX S 645, as shown in Figure 1(a). Although kerosene is widely used as dielectric with die sinking machines, at high discharge temperatures, the carbon elements penetrate the electrode surface affecting the normal discharge. This also creates problem in the removal of debris from the inter electrode gap resulting in lower MRR. 13 Thus, for this study, FERROLAC 3M EDM oil was used. Mn and W powders were mixed with EDM oil to investigate their effect on MRR. Figure 1(b) shows the setup for powder-mixed EDM. Three different grades of titanium, namely, Ti (American Society for Testing and Materials (ASTM) grade 2), Ti-6Al-4V (ASTM grade 5) and Ti-5Al-2.5Sn (ASTM grade 6), were used as workpiece materials and were machined with copper, copper–chromium and copper–tungsten electrodes. The composition of the workpiece and electrode material is given in Table 1. Cylindrical electrodes of 18 mm diameter and 40 mm length were used for machining. Each part was machined to a depth of 1.0 mm. MRR and metallurgical analysis were completed after each experiment.
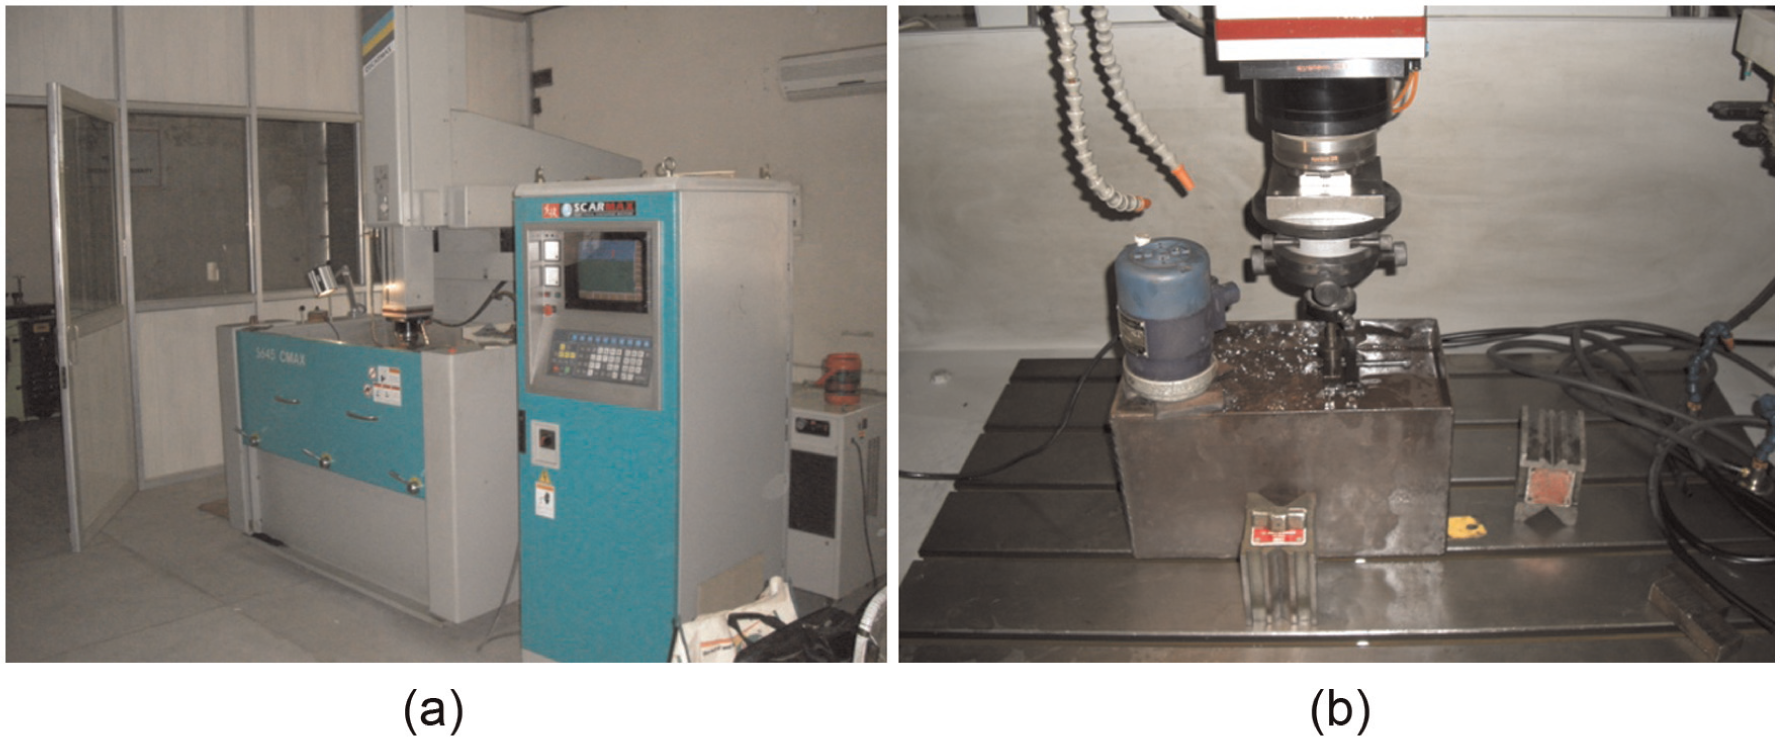
(a) Pictorial view of EDM machine and (b) setup for PMEDM process.
Chemical analysis (wt%) of work materials and electrode materials.
Cryogenic treatment
The workpieces were cryogenically treated to improve their properties. During cryogenic treatment, parts were cooled down from room temperature to ultra sub-low temperature. The parts were held at this temperature for a longtime and then raised to room temperature to improve their wear resistance and dimensional stability. 14 Two types of cryogenic treatment, shallow cryogenic treatment (SCT) and deep cryogenic treatment (DCT), were carried out on the three titanium alloys as well as tool materials. During SCT, the tool and workpiece materials were cooled to −110 °C using a cooling rate of 1 °C/min and then held at this temperature for 6 h. Thereafter, the parts were tempered at 150 °C with a heating rate of 1 °C/min for 2 h so as to relieve the stresses. During DCT, the temperature was reduced to −184 °C at a cooling rate of 1 °C/min. The parts were kept in the cryo processor container for 24 h and the temperature was raised to room temperature slowly again at a rate of 1 °C/min. The parts were tempered at a temperature of 150 °C with a heating rate of 1 °C/min to relieve stresses, soaked for 2 h and were then brought back to room temperature. The cycle for cryogenic treatment of titanium alloy work materials and copper-based tool materials is shown in Figure 2.
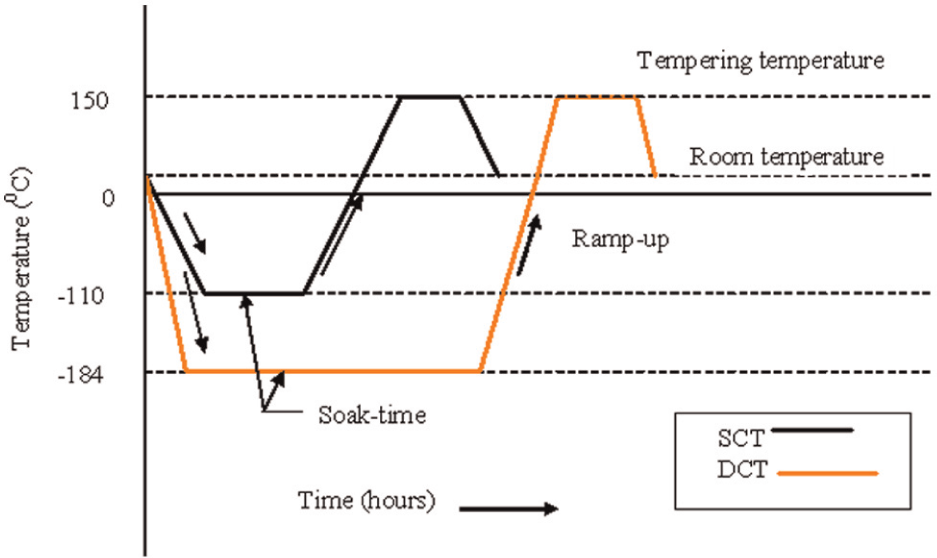
Cycle for cryogenic treatment of titanium alloys and copper-based tool.
Experimental design
Eight machine and process parameters that are likely to affect MRR and also cause metallurgical changes on the machined surface were identified using a pilot study and the reported results in the literature. Of the eight factors, one factor, pulse-off time, was varied at two levels, and the remaining factors were varied at three levels. A mixed level Taguchi array L18 (21× 37) was used to design the trial conditions. The eight factors and their respective levels are given in Table 2. The assignment of factors to various columns of L18 array was completed using Minitab and linear graphs. The parts were machined as per the 18 trial conditions in a completely randomized manner. Three repetitions for each trial were conducted and MRR was calculated. The repetitions were converted to signal-to-noise (S/N) ratios for each trial condition using “larger the better” condition. The MRR obtained after each trial and calculated S/N ratios (as per L18 orthogonal array) are given in Table 3.
Input parameters and their levels.
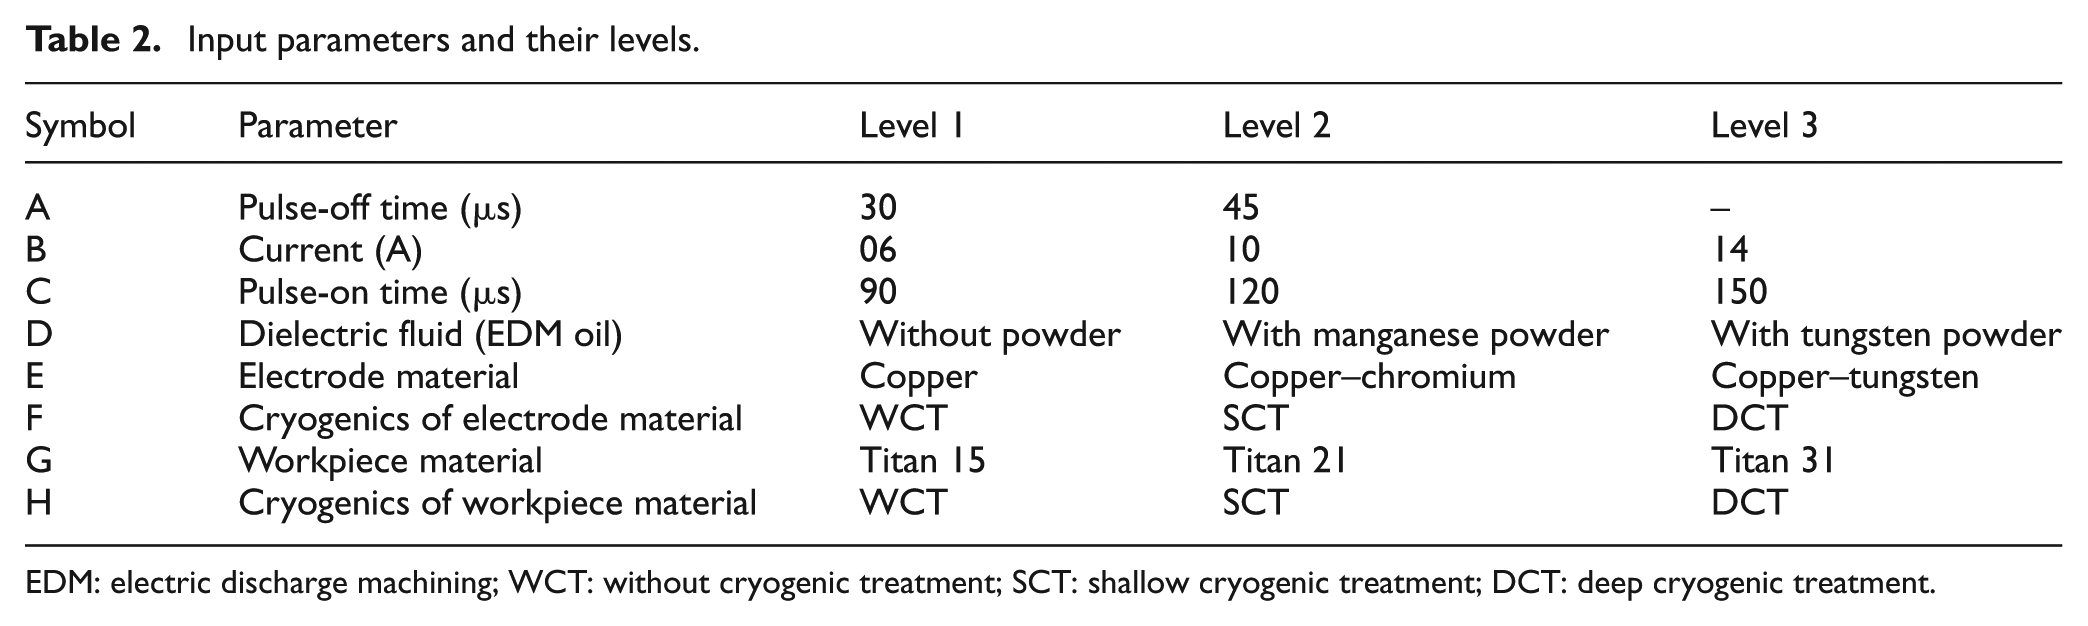
EDM: electric discharge machining; WCT: without cryogenic treatment; SCT: shallow cryogenic treatment; DCT: deep cryogenic treatment.
L18 orthogonal array, MRR after each trial.
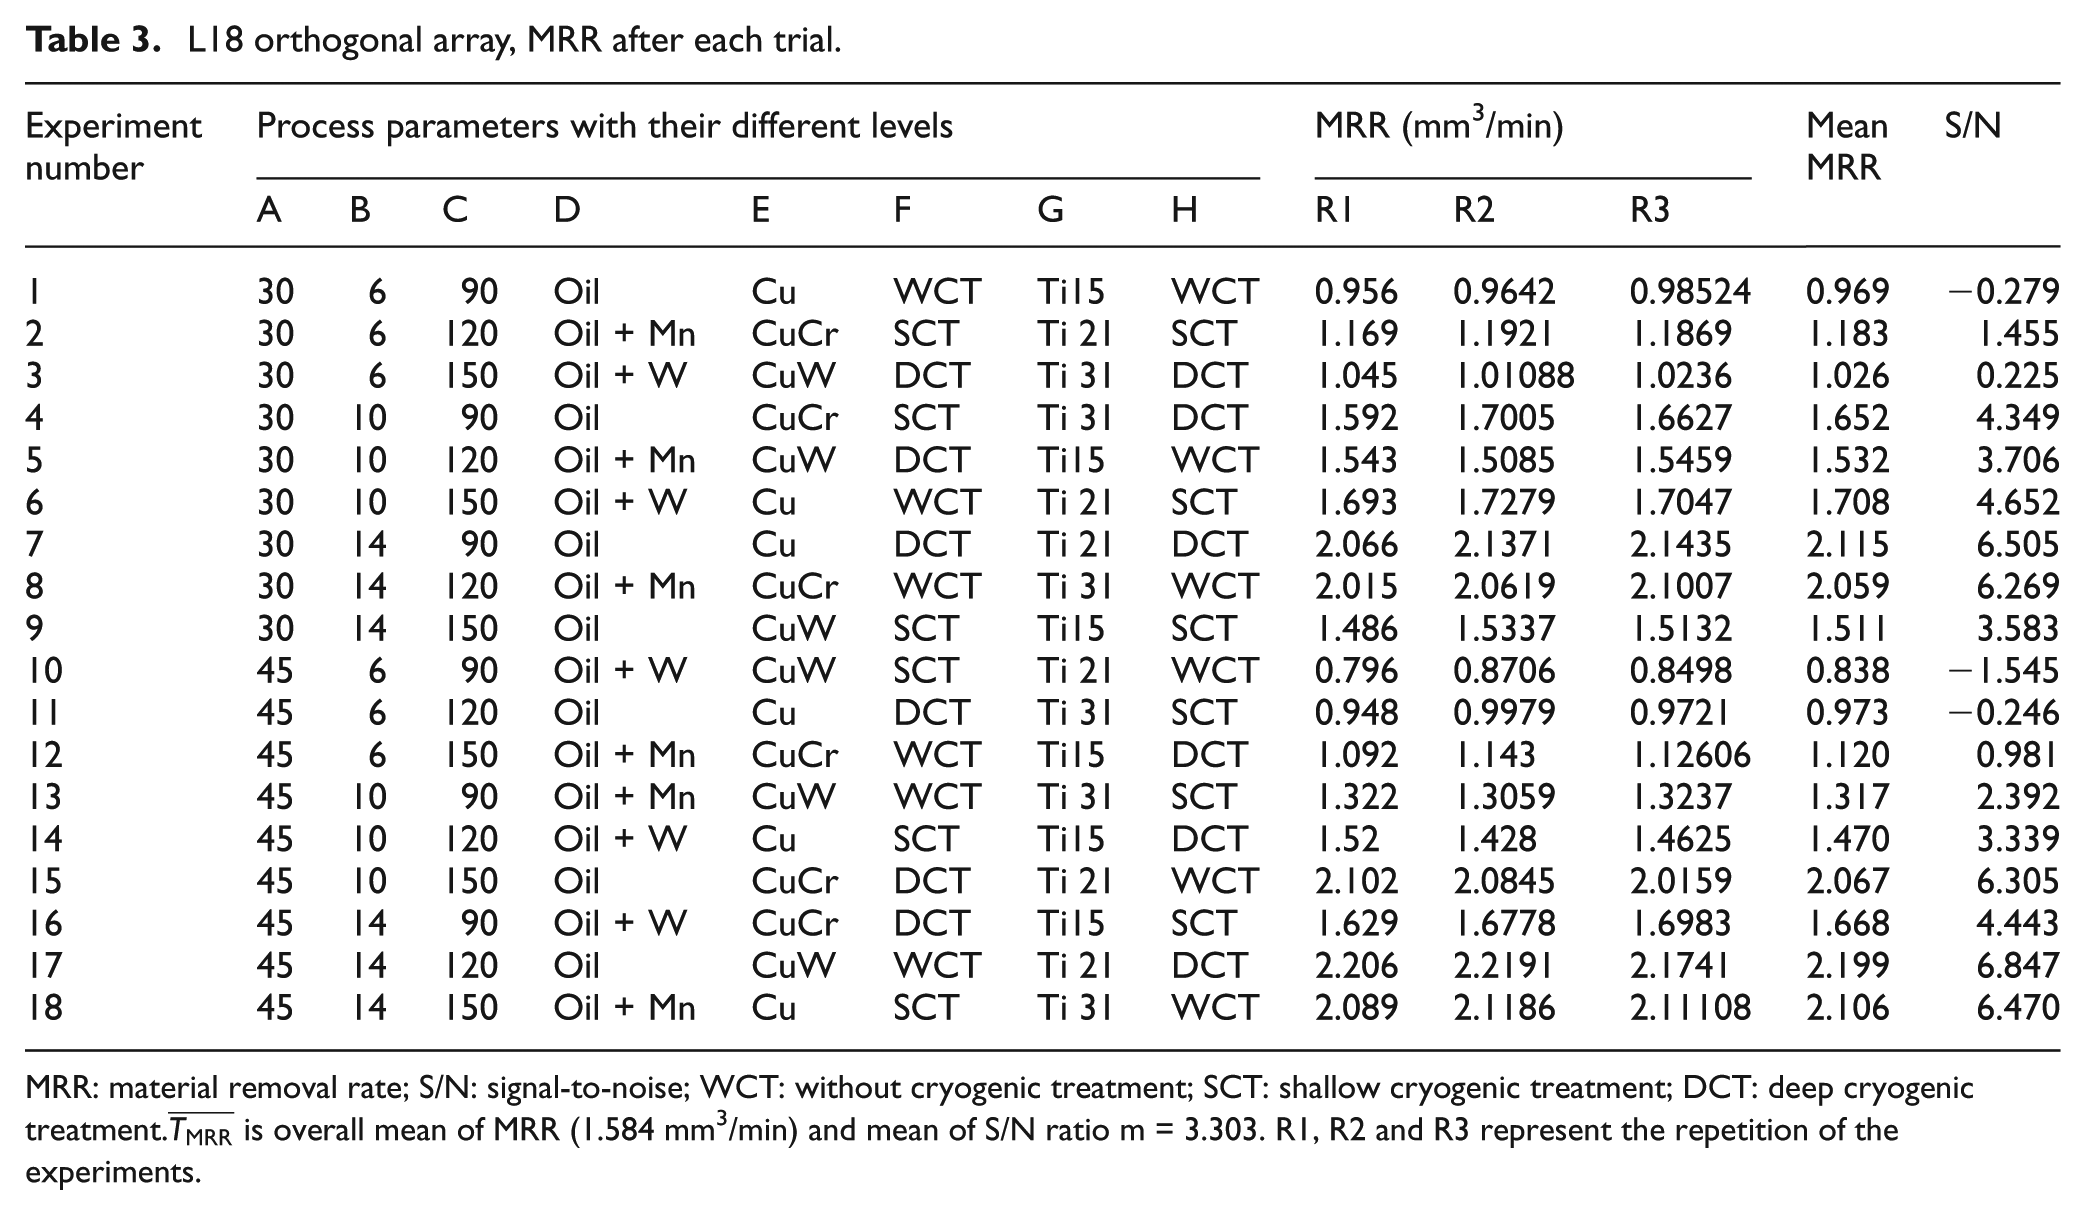
MRR: material removal rate; S/N: signal-to-noise; WCT: without cryogenic treatment; SCT: shallow cryogenic treatment; DCT: deep cryogenic treatment.
MRR
MRR is the loss of volume from the workpiece surface per unit machining time. The weight of workpiece before and after machining was taken by an electronic digital weighing machine. The machining time was measured using stop watch. The weight difference was then converted into volumetric loss (mm3/min), as shown in equation (1)
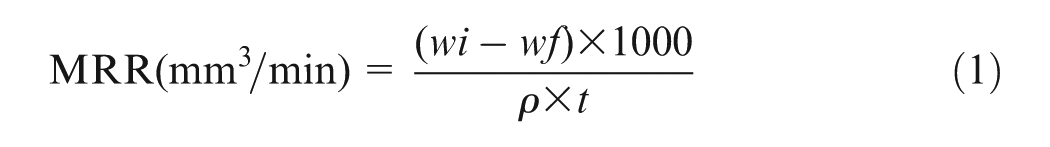
where wi is initial weight of workpiece (g), wf is final weight of workpiece (g), ρ is density of workpiece (g/cm3) and t is machining time (min).
Analysis of results
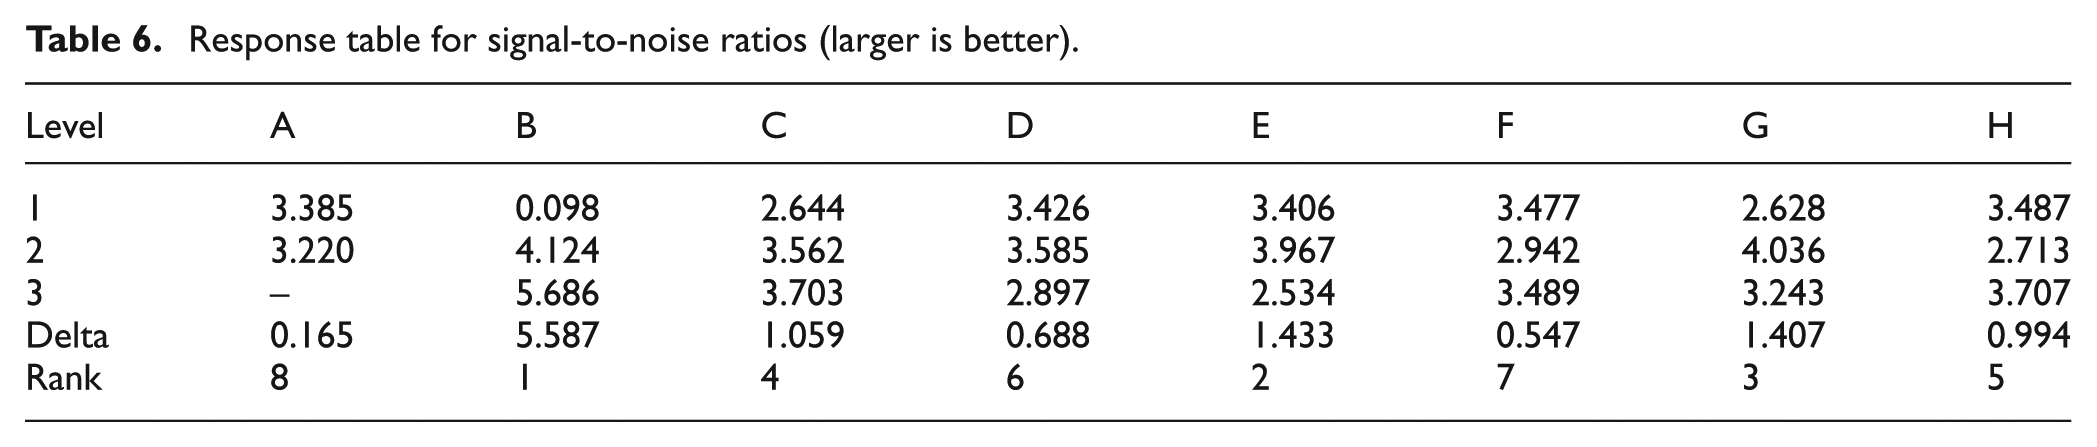
From the experimental data, the average values of MRR (raw data) and corresponding S/N ratios for all factors at each level were calculated and are tabulated in Table 4. The first half of the table shows the raw data values for MRR and the second half shows the S/N ratios at each level of the factors varied during experimentation. The data were analyzed using analysis of variance (ANOVA) and are summarized in Table 5. The F-value and percent contribution (PC) represent the factor effects of input parameters. The results were plotted to analyze the variation trend of MRR with change in each factor level. Since MRR is a “larger the better” response, the peak for each plot represents the optimal condition at which that parameter should be set. The plots for each factor are depicted in Figure 3(a)–(h) The peak current was observed to be the most significant factor with a PC of 81%. Increase in current increases the available electric discharge energy in EDM, which results in a deeper crater to be formed during each spark leading to an increase in MRR. Two other factors, namely, electrode material and pulse-on time, in that order also affect the MRR, although their impact is lower than that of the peak current. The other factors had smaller effect on MRR as can be seen from the plots in Figure 3. Although the effect of cryogenic treatment is smaller, a lower MRR is realized using cryogenic treatment because of higher wear resistance of the material. The plot in Figure 3(d) shows the effect of addition of powder to the dielectric on the MRR. The plot shows that the addition of either tungsten or manganese to the dielectric fluid did not significantly alter the MRR in comparison to results obtained without mixing of powder to the dielectric. Response values, delta values and ranking of all the factors for S/N ratio for MRR as a larger the better characteristic are tabulated in Table 6.
Average values by factor levels of S/N data and raw data for material removal rate (mm3/min).
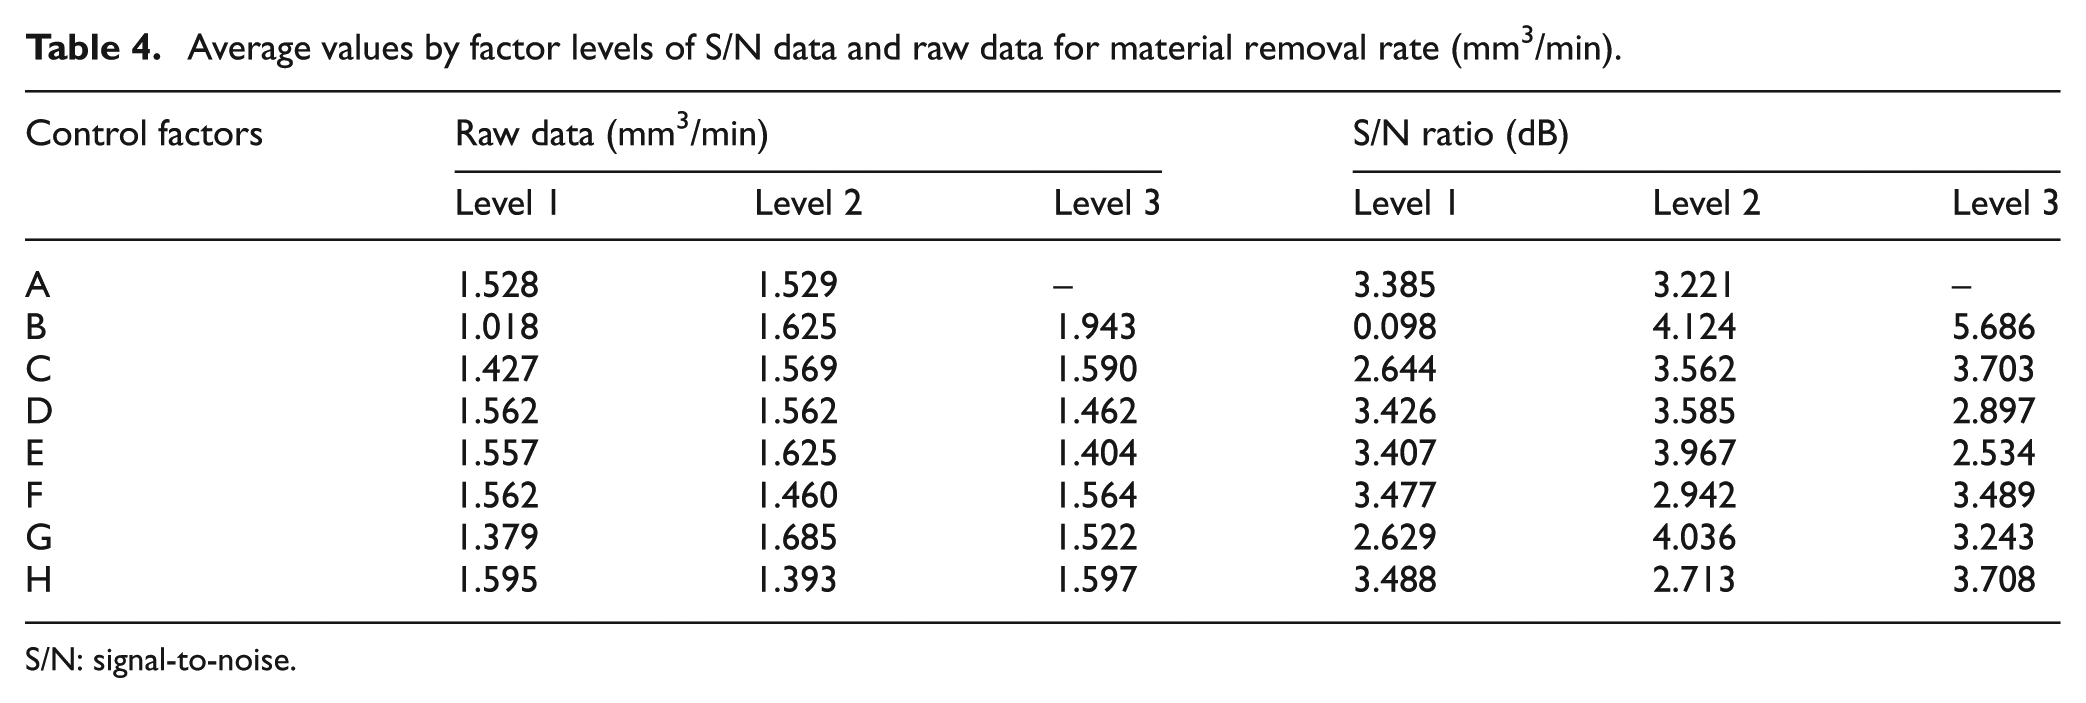
S/N: signal-to-noise.
ANOVA for material removal rate (S/N data).
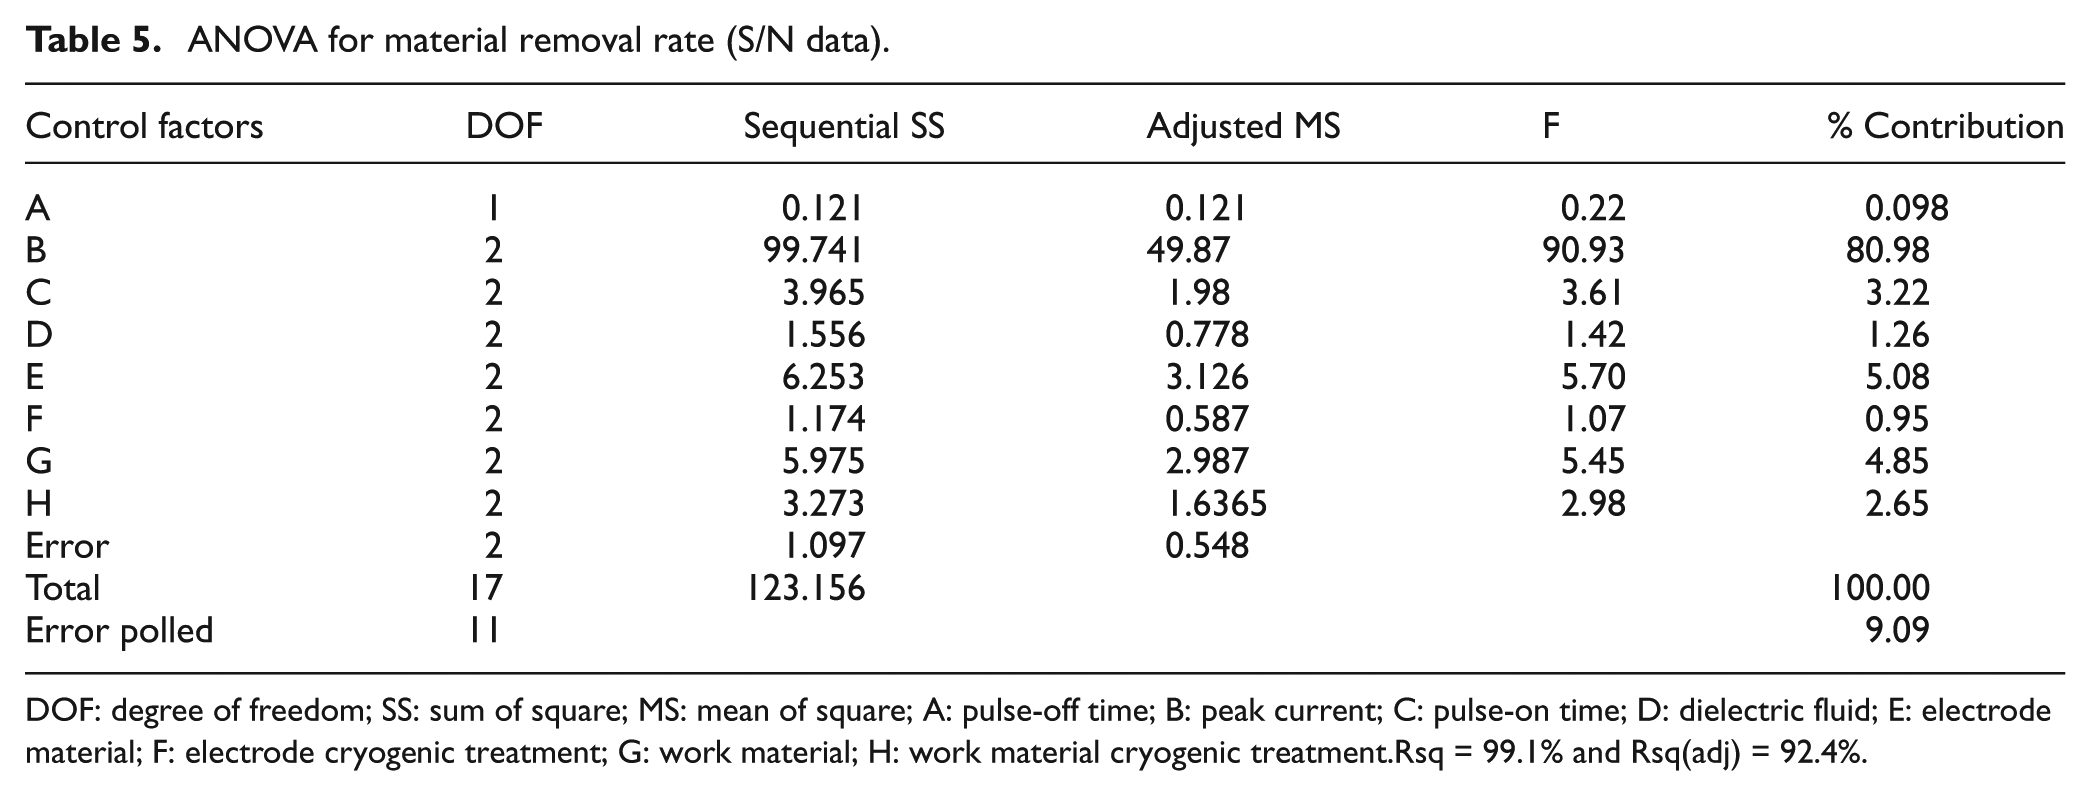
DOF: degree of freedom; SS: sum of square; MS: mean of square; A: pulse-off time; B: peak current; C: pulse-on time; D: dielectric fluid; E: electrode material; F: electrode cryogenic treatment; G: work material; H: work material cryogenic treatment. Rsq = 99.1% and Rsq(adj) = 92.4%.
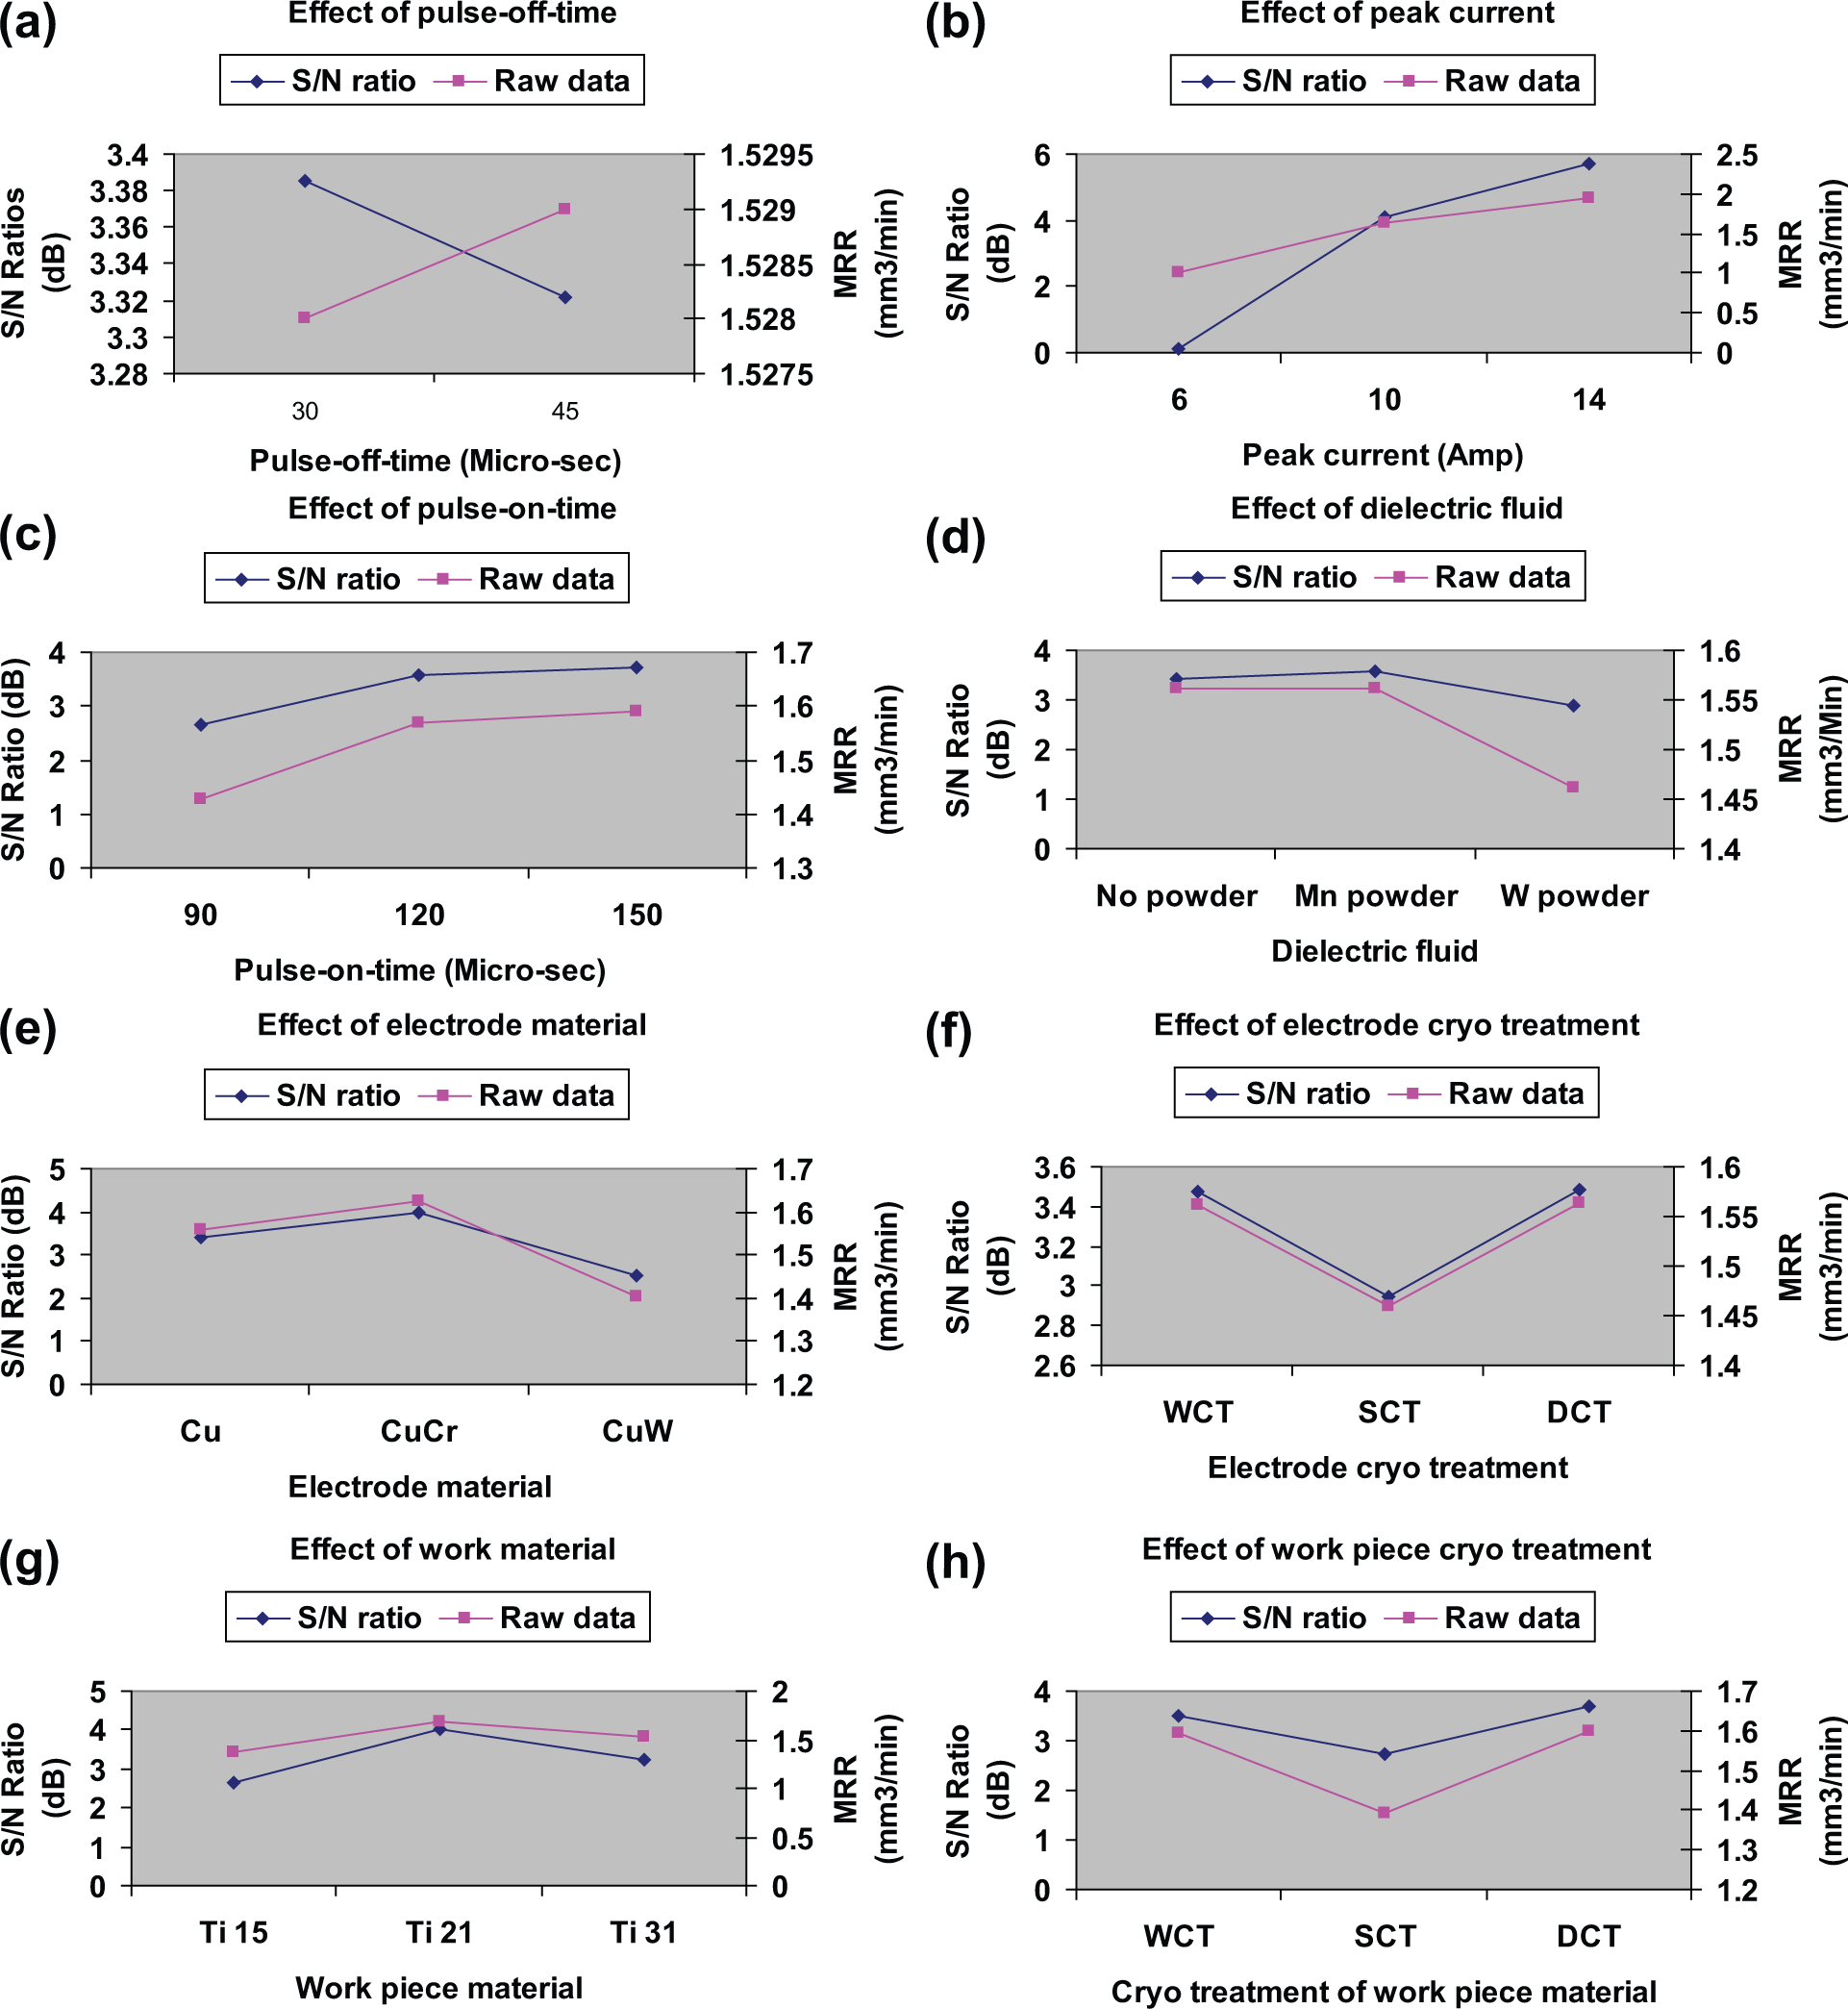
Effect of process parameters on MRR: (a) effect of pulse-off time on MRR; (b) effect of the peak current on MRR; (c) effect of pulse-on time on MRR; (d) effect of dielectric fluid, with manganese and tungsten powder on MRR; (e) effect of different electrode materials on MRR; (f) effect of cryogenic treatment of electrode material on MRR; (g) effect of different titanium alloy work materials on MRR and (h) effect of cryogenic treatment of titanium alloys on MRR.
Response table for signal-to-noise ratios (larger is better).
Based on these results, it can be concluded that MRR can be maximized using lowest level of pulse-off time (30 µs), highest level of current (14 A) and pulse-on time (150 µs), with manganese powder mixed with oil and machined with copper–chromium electrode. It can be observed from the ANOVA results that cryogenic treatment of electrode material has less than 1% contribution in affecting MRR because of the wear resistance imparted to the workpiece due to material transfer from powder, electrode or the dielectric. Deeper cryogenic treatment made larger impact in increasing the MRR as it increases the electrical conductivity, thereby improving the thermal conductivity of the material. This improves the heat dissipation capacity of material, thus lowering the work material temperature leading to higher MRR. 15 The computed values of Rsq and Rsq(adj) were 99.1% and 92.4%, respectively.
Identification of optimal conditions
Taguchi’s additive model was used to predict the MRR if the factors are set at their optimal levels. The peak of the plots for each factor represented the optimum condition for those factors. From the plots, it was observed that the first level of pulse-off time (A1), the third level of the peak current (B3) and pulse-on time (C3) would give the largest MRR. Furthermore, the second level of dielectric fluid (D2), the second level of electrode material (E2), the third level of electrode material cryo-treatment (F3), the second level of workpiece material (G2) and the third level of workpiece material cryo-treatment (H3) represent the highest values for MRR. Hence, the optimum condition of input process parameters is A1B3C3D2E2F3G2H3. The theoretical value of ηopt (MRR) under the optimum condition for the factors is given by the following model equation (2)
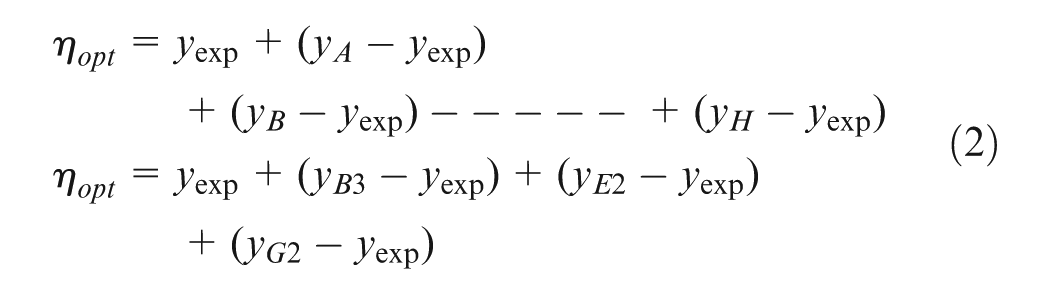
where yexp is the overall mean of MRR for the entire orthogonal array and yA, yB, yC, yD, yE, yF, yG and yH are the mean values for each factor. YPredicted is the expected theoretical value for the output characteristic based on significant parameters (peak current, electrode and workpiece material) and was calculated to be

The corresponding values of MRR are given by the following equation
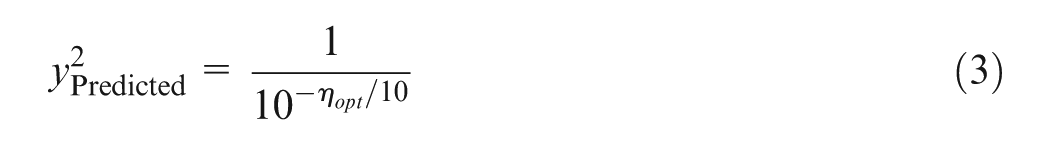
or, ypredicted = 2.26 mm3/min.
The predicted value for response has been calculated using Taguchi’s additive model on the significant parameters. Since this combination of input process, parameters did not exist in the orthogonal array; hence, confirmation experiments were conducted using this combination. The average value of MRR obtained at this setting of (A1B3C3D2E2F3G2H3) the experiment was 2.325 mm3/min, which is very close to theoretical value predicted by Taguchi’s additive model.
Modeling for predicting MRR
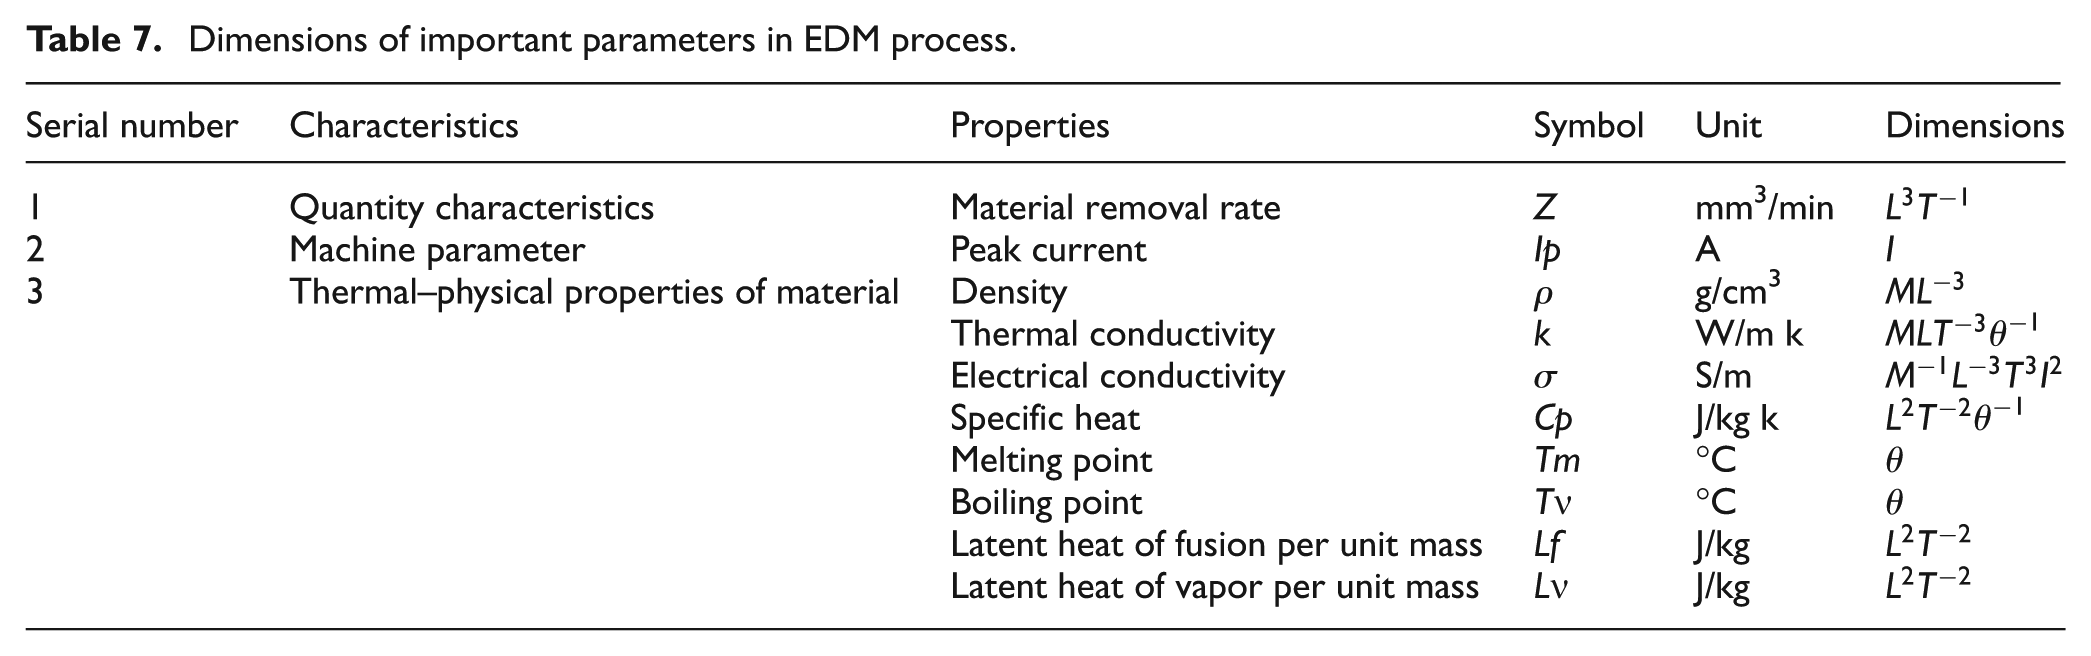
The results obtained after the experimental analysis were utilized to develop a mathematical model using different parametric combinations. Buckingham’s π theorem, which is a dimensional analysis, was used to study the relationship between the MRR and the machining parameters. Subsequently, the predicted MRR using the mathematical model was compared with the experiment results to validate the model. Dimensional analysis is a method by which information can be explored about a phenomenon by a dimensionally correct equation among certain variables. 16 Jeswani 17 applied dimensional analysis technique to develop mathematical model on tool wear response in EDM process. Yahya and Manning 18 formulated the mathematical equation using dimensional analysis on MRR. Patil and Brahmankar 16 used this technique on metal matrix composites in wire EDM to develop semi-empirical model for MRR based on thermal–physical properties of workpiece with machine parameters pulse-on time and average gap voltage. Based on the experiment results and reported work in the literature, thermal–physical properties of work material were used for modeling the MRR. The basic fundamental dimensions for development of model are mass (M), length (L), time (T), temperature (θ) and current (I). Table 7 illustrates the dimensions of the selected parameters for constructing the model. Table 8 provides the model parameter values in the form of their fundamental dimensions. Applying dimensional analysis, the MRR, Z can be given by equation (4)

Dimensions of important parameters in EDM process.
Model parameter values in the form of their fundamental dimensions.
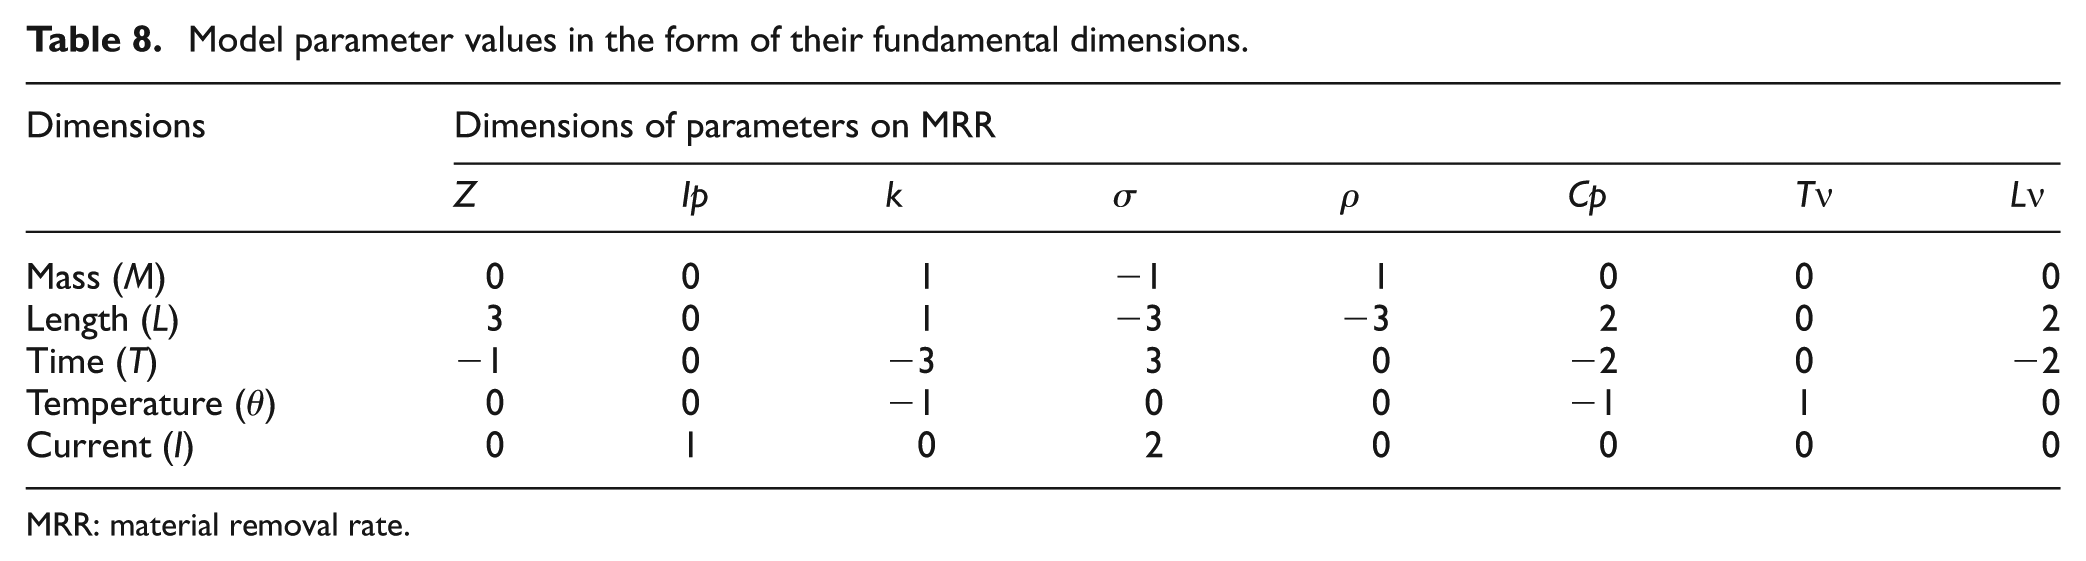
MRR: material removal rate.
The total number of variables, n = 8 and the fundamental dimensions are m = 5. Hence, the dimensionless groups that can be formed are n − m = 3 and are given by π1, π2 and π3.
This can be written as given by equation (5)

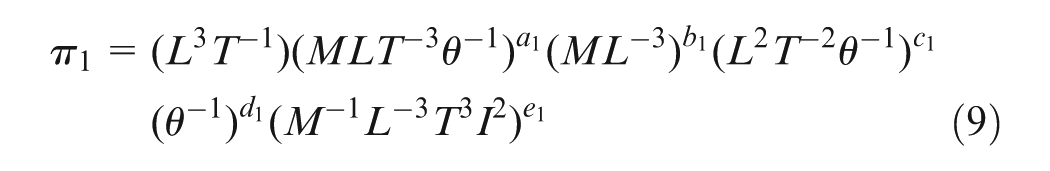
Taking Z, Ip and Lv as the quantities that directly go in three dimensionless groups π1, π2 and π3, respectively, the three dimensionless groups are then given by equations (6)–(8)


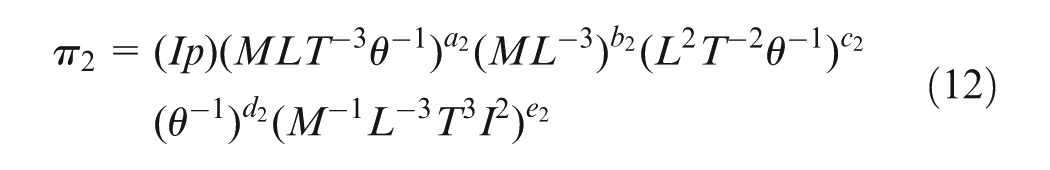
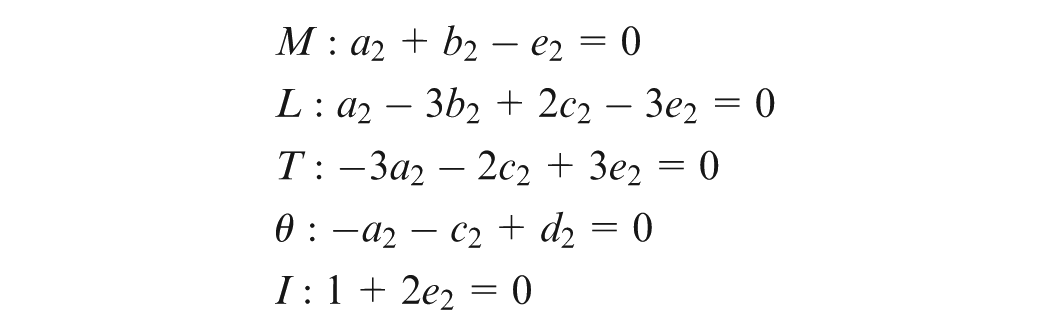
Substituting the dimensions for each quantity and equating to 0 and solving for π1

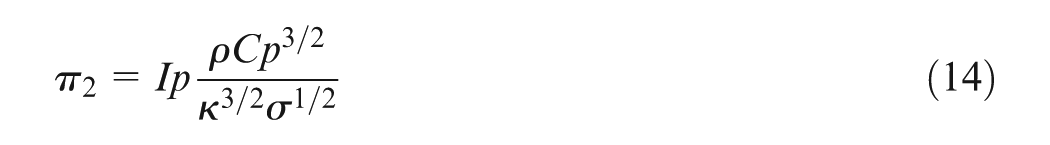
Solving the above,

Similarly
Here
Solving the above,

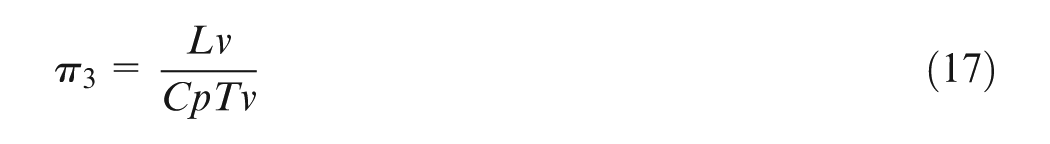
Similarly, solving for π3
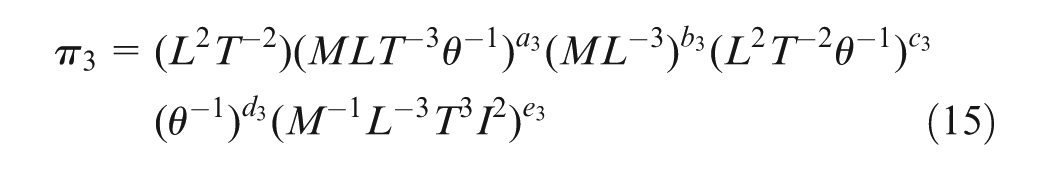
Here
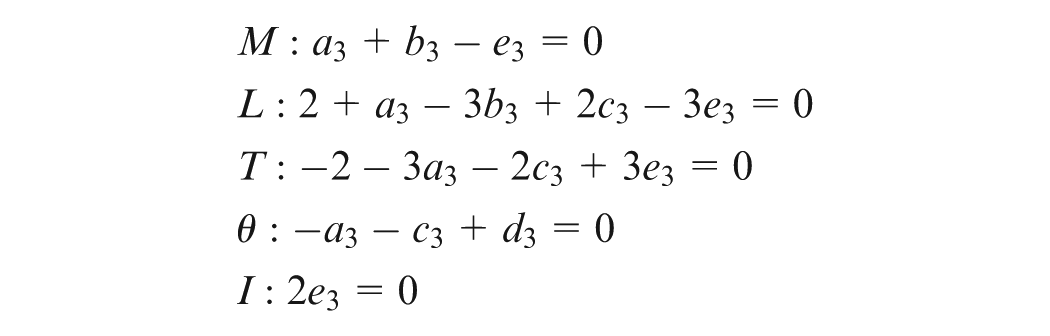
After solving,

The final relationship can be assumed to be of the form

Assuming i = 1, j = 2 and k = 3.
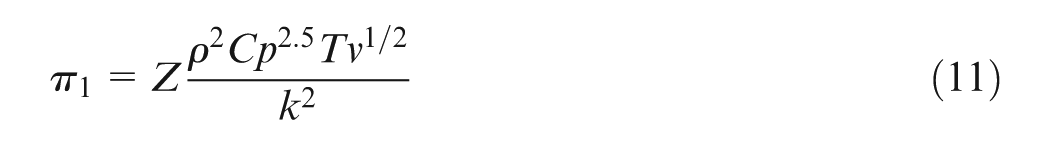
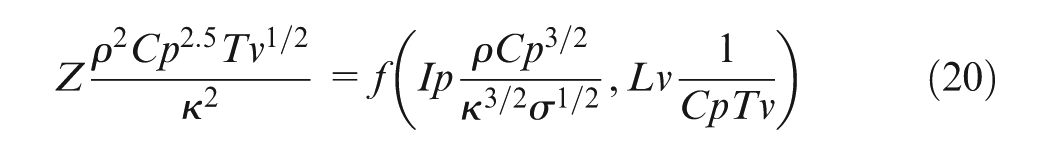
Then the final functional relationship of dimensionless parameters is written as

or
The experimental results show that MRR (Z) is largely affected by current. The MRR can be calculated by keeping all parameters constant and varying peak current. Therefore, the peak current has been taken as the representative for the development of mathematical equation for MRR. Hence, the equation for MRR can be written as follows
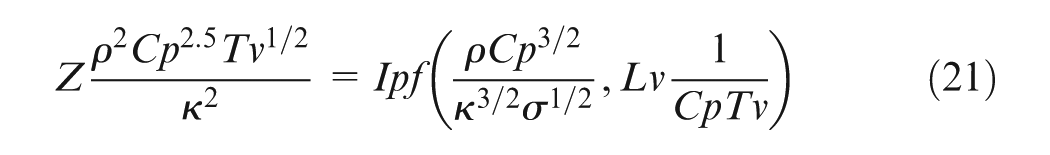
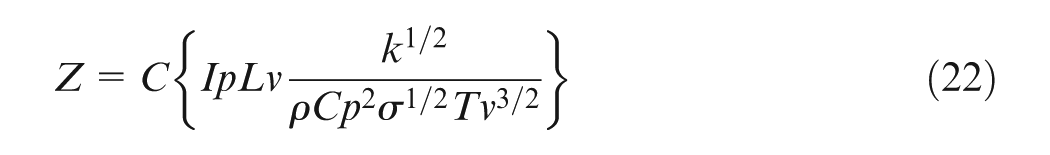
Here, C represents constant of proportionality
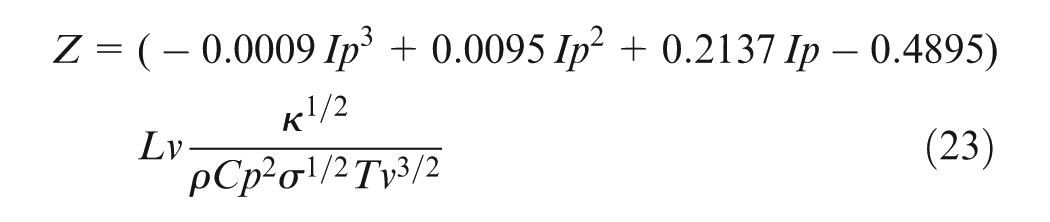
For validating the results, experiments were performed on titanium alloys (Ti-6Al-4V); Titan 31, ASTM Grade 5 by varying peak current and keeping all other parameters constant. The MRR was plotted against peak current and is shown in Figure 4. A third-degree polynomial equation was observed to be the best-fit curve, with coefficient of correlation equal to 0.9837. Thus, the polynomial equation for MRR for this case is given by equation (23)
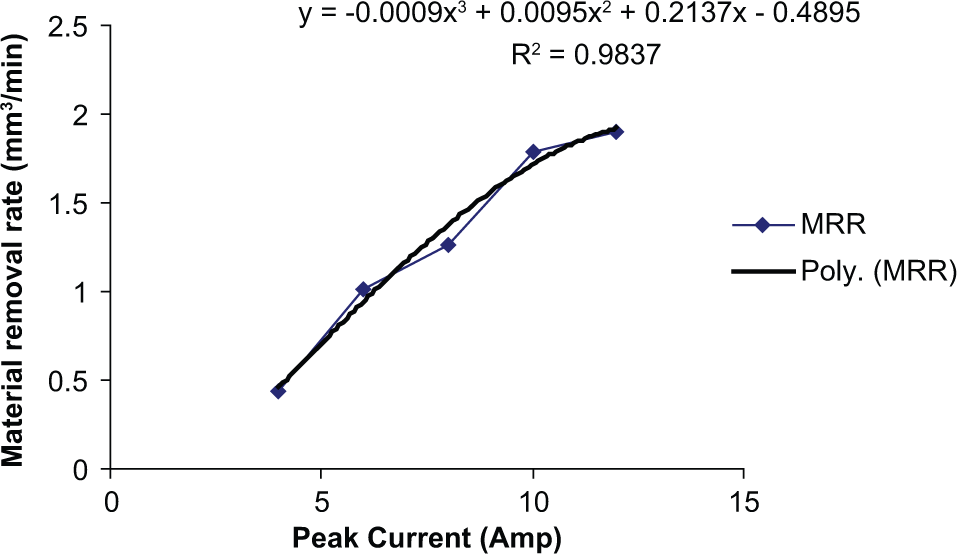
Material removal rate versus the peak current for titanium alloys (Ti-6Al-4V).
Subsequently, a comparison between the experimental results and the predicted results for MRR was made. The percentage variation in the predicted value can be calculated by equation (24)
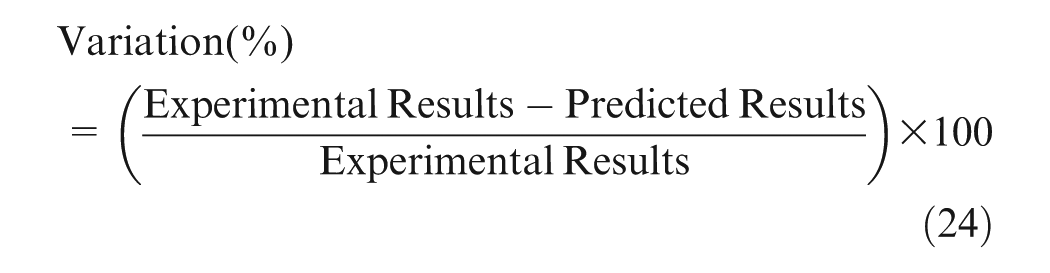
Here, for validating the mathematical model, three confirmation experiments were performed on Ti-6Al-4V titanium alloy workpiece with copper electrode machined with the peak current set at 6, 10 and 12 A, respectively. The other parameters such as pulse-off time (60 µs), pulse-on time (150 µs), EDM oil without powder, no cryogenic treatment of workpieces and tool material were kept constant. From the results obtained, the percentage variation between experimental and the predicted results at the peak current of 6, 19 and 12 A was observed as 2.92%, 0.37% and 4.21%, respectively. Hence, there is a good agreement between experimental and the predicted results for MRR.
Microstructure analysis
The parts after each of the 18 trials were analyzed by studying the microstructure of the machined surface using SEM (make JEOL, model JSM-6610LV; Tokyo, Japan) integrated with an EDX. The samples were cleaned with acetone solution and then etched with Kroll’s reagent (5 mL hydrofluoric acid, 10 mL nitric acid and 85 mL distilled water) before the analysis. The samples were again cleaned with acetone solution with soft brush.
SEM analysis
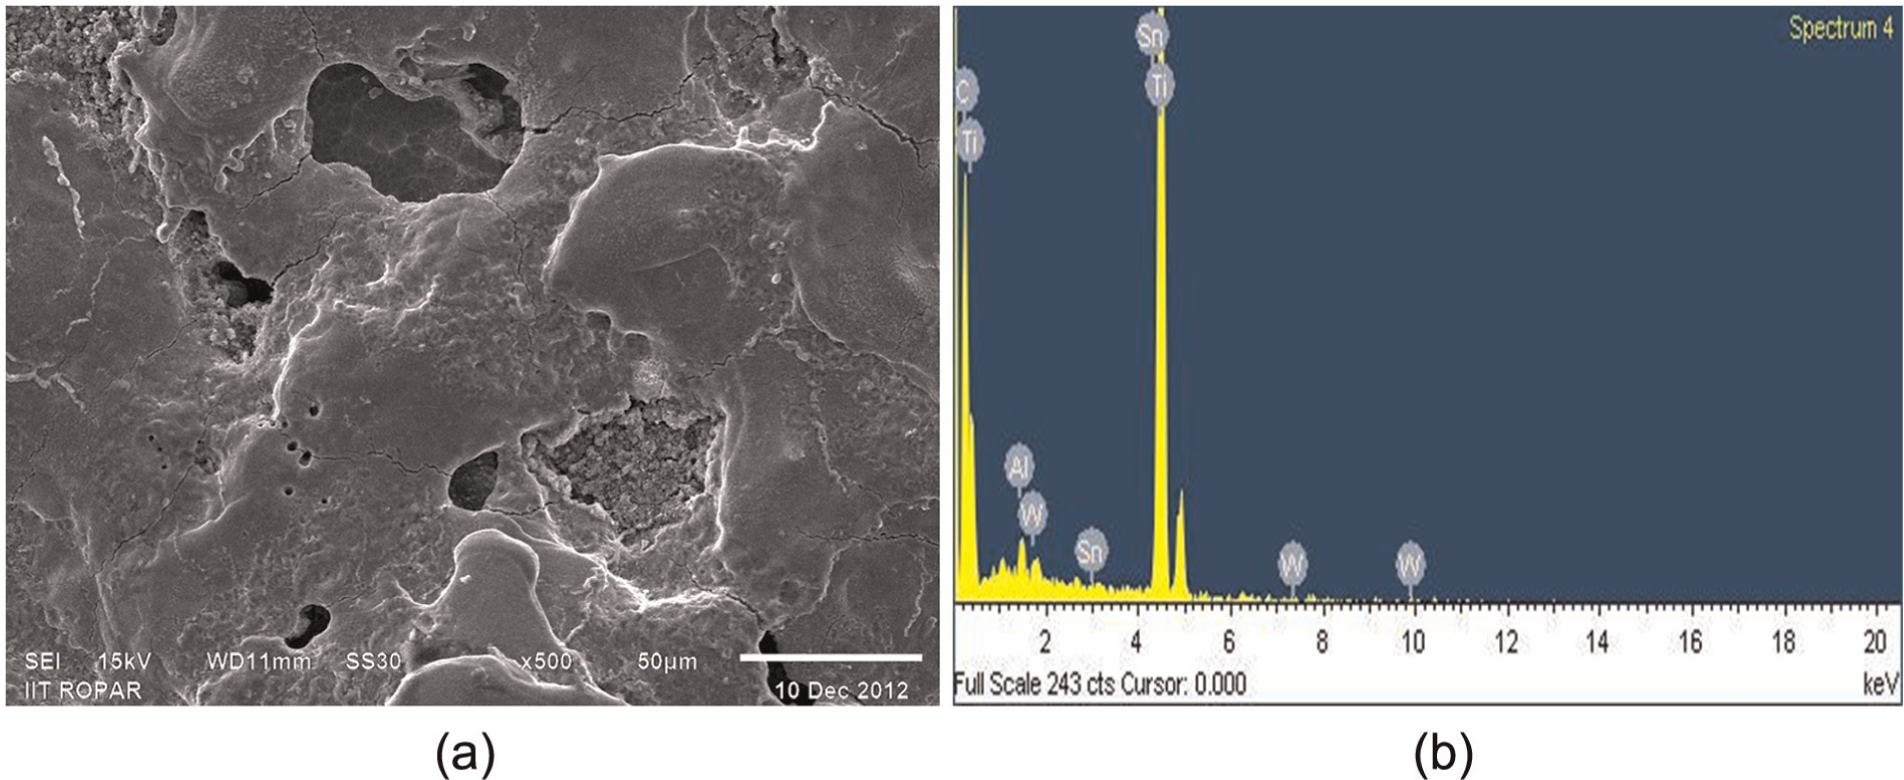
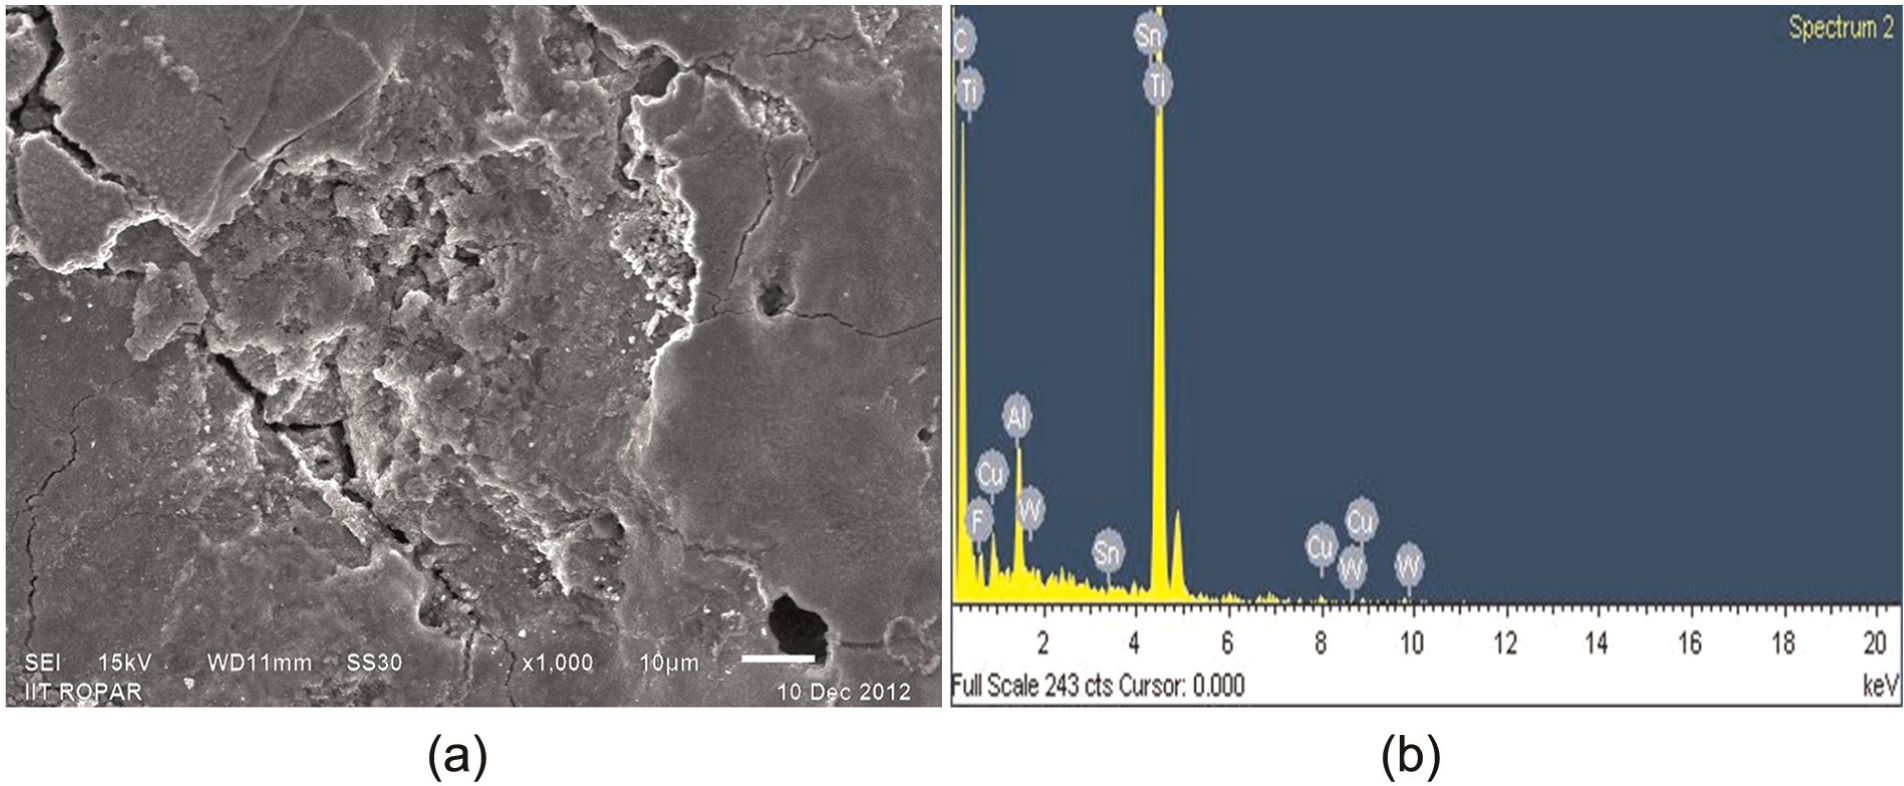
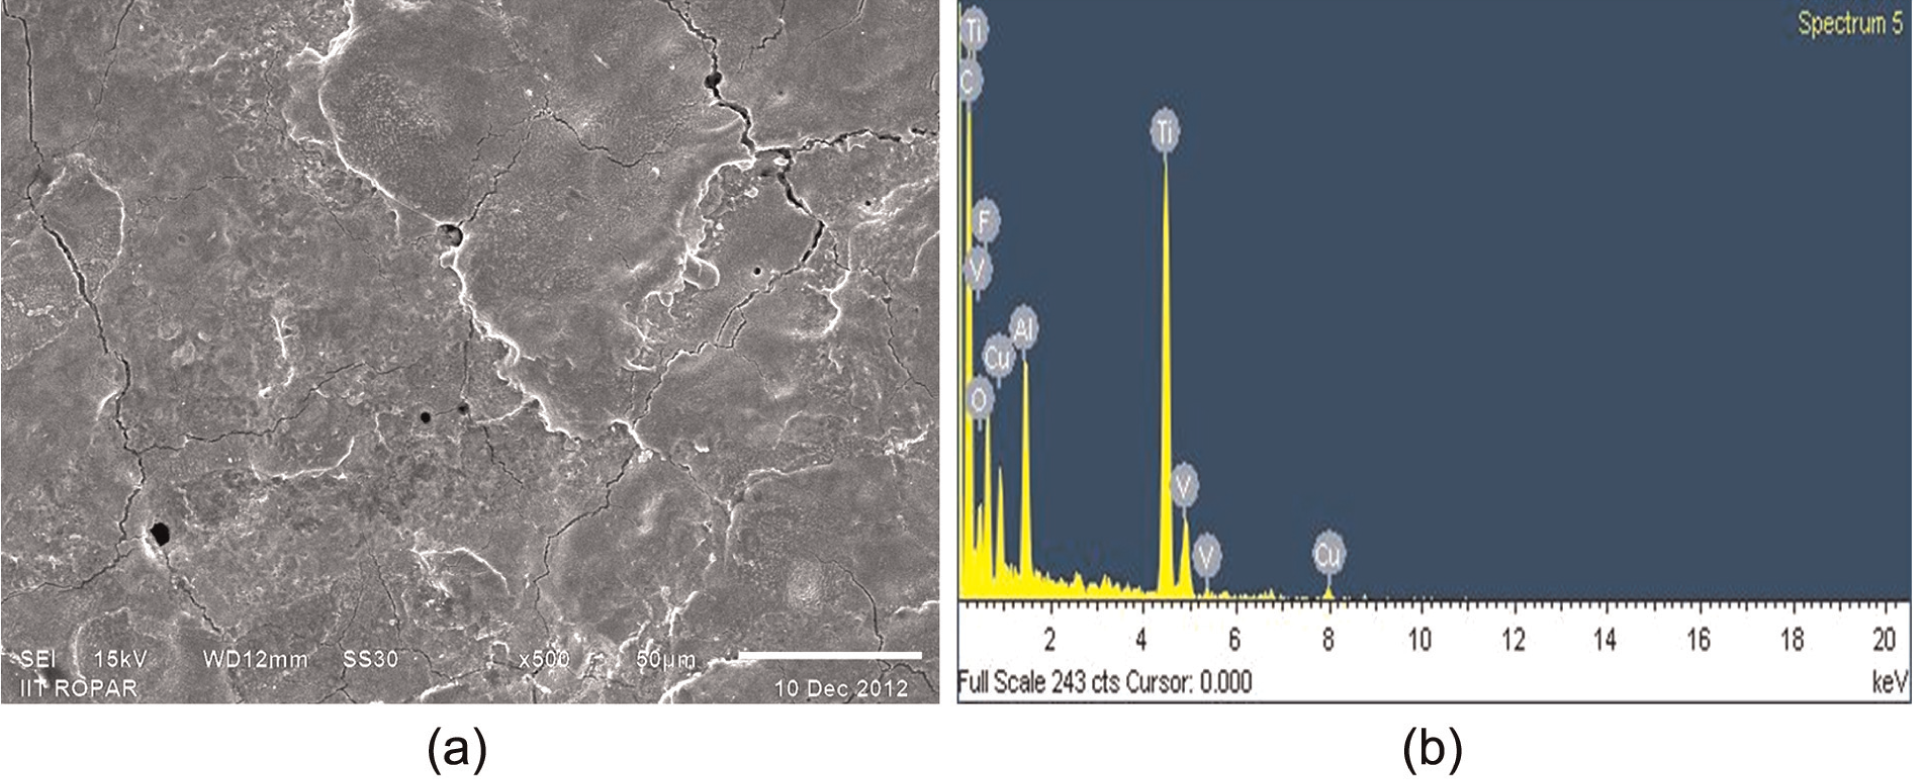
Three SEM micrographs for each of the three materials were prepared and are presented in Figures 5(a), 6(a), 7(a), 8(a), 9(a), 10(a), 11(a), 12(a) and 13(a). Figures 5(a), 6(a) and 7(a) show the SEM micrographs of titanium (Ti) for trials 1, 5 and 9, respectively; Figures 8(a), 9(a) and 10(a) for titanium alloy (Ti-5Al-2.5Sn) for trials 10, 6 and 17, respectively; and Figures 11(a), 12(a) and 13(a) for titanium alloy (Ti-6Al-4V) for trials 11, 4 and 8, respectively. The corresponding EDX spectrum is provided in Figures 5(b), 6(b), 7(b), 8(b), 9(b), 10(b), 11(b), 12(b) and 13(b). From the micrographs, it can be seen that the process produces irregular surface texture and also defects such as globules of debris, pin holes, spherical particles with craters of varying sizes and micro-cracks. Thus, the machined surface generally has an uneven surface profile. The peak current was observed to be the most significant factor, which increases the available discharge energy causing deeper craters, which result in large quantity of molten and floating metal suspended in the inter electrode gap resulting in deep and overlapping craters. The SEM images are in agreement with the results reported by Hascalik and Caydas.5,6Figures 5(a), 8(a) and 11(a) show the SEM pictures of the three Ti alloys used in the study machined at current of 6 A. Due to the low discharge energy, small craters with low depth, micro-cracks and micro-pores were noted on the surface. Figures 6(a), 9(a) and 12(a) show the SEM pictures of the three materials machined using 10 A current. It was observed that some part of the molten material produced by the discharge was carried out by the dielectric fluid and the remaining molten metal resolidified to form lumps of debris. Figures 7(a), 10(a) and 13(a) of three different grades of titanium alloys show the machined surface when machined at high current of 14 A. The frequent cracking of dielectric fluid occurred causing more melt expulsions and more residual stresses due to high heat energy. These developed stresses resulted in wider and deeper surface cracks and had a higher MRR and poorer finish. A few spherical-shaped particles were observed on the surface due to surface tension of molten material. During EDM at high peak current and low pulse-off time, debris in the spark gap increased leading to abnormal arcing. The abnormal arcing decreased the discharge rate, thus lowering the MRR and also reduced the dielectric strength resulting in poor machining efficiency.
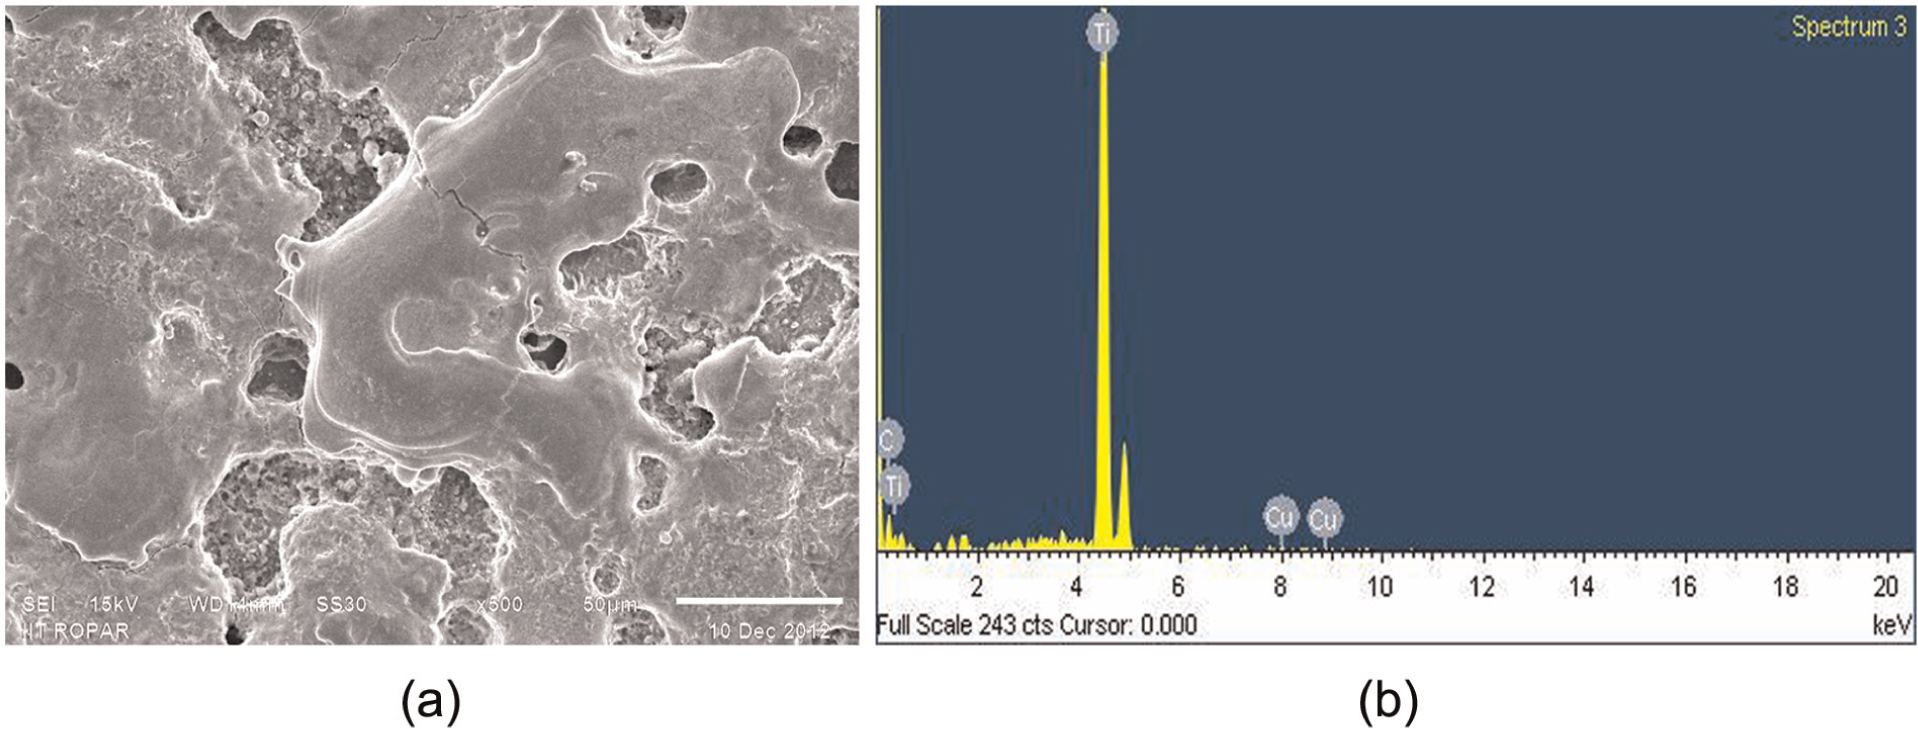
(a) SEM micrograph and (b) EDX spectrum of WCT Ti alloy machined with current of 6 A, pulse-on time of 90 µs, pulse-off time of 30 µs and WCT Cu electrode in EDM oil dielectric for Experiment 1.
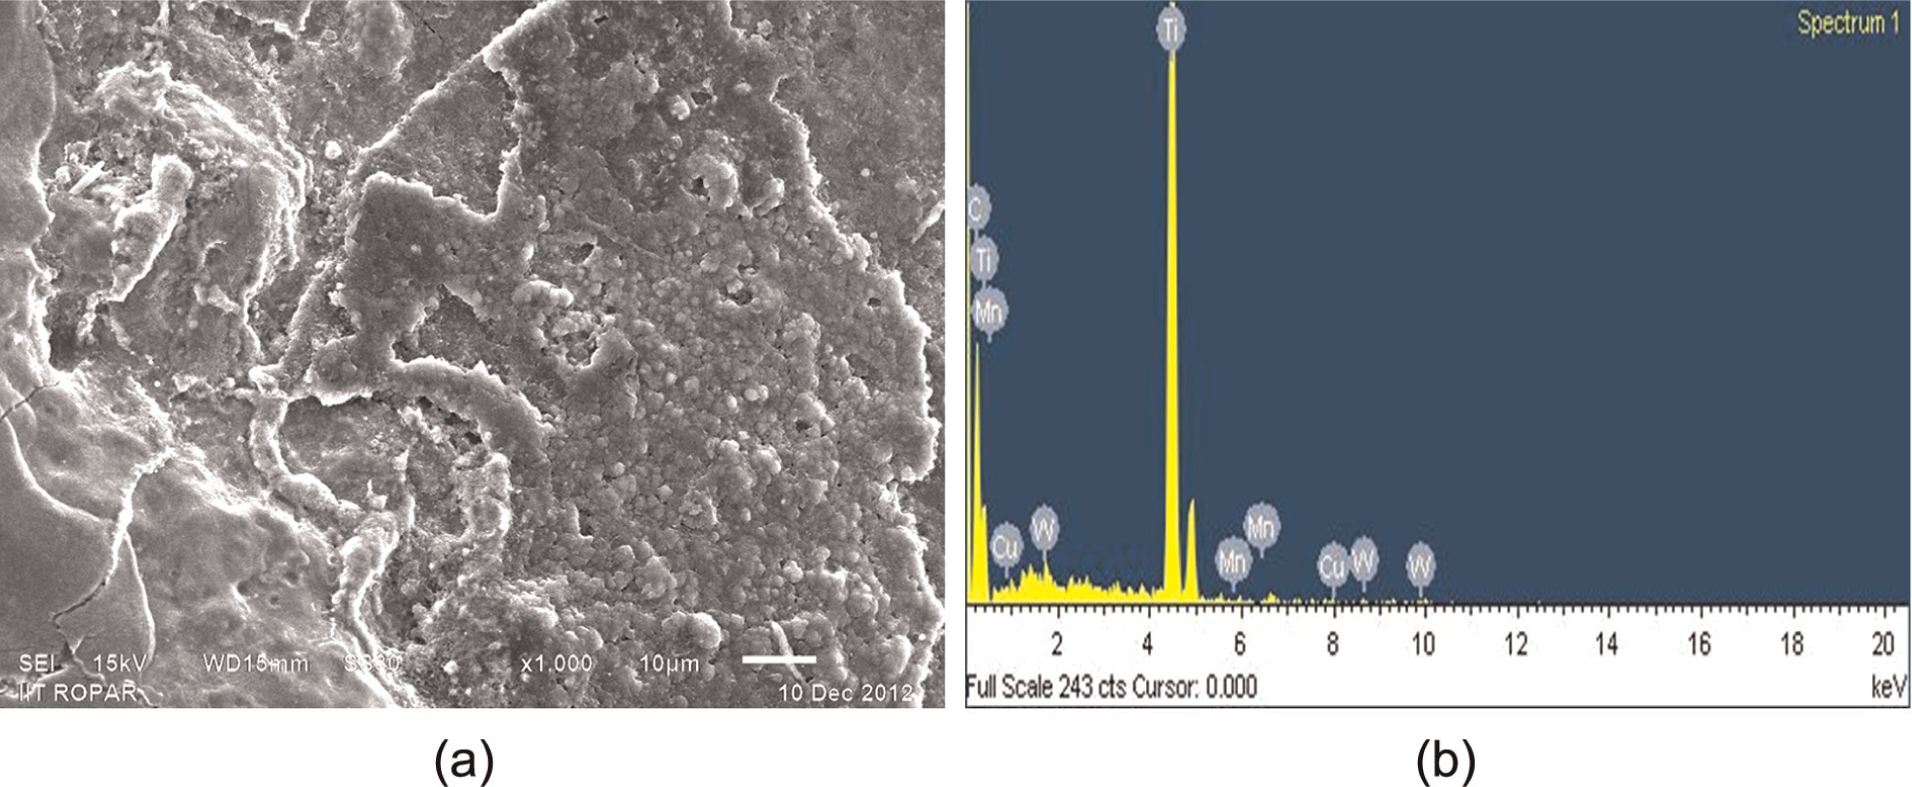
(a) SEM micrograph and (b) EDX spectrum of WCT Ti alloy machined with current of 10 A, pulse-on time of 120 µs, pulse-off time of 30 µs and DCT CuW electrode in Mn powder-mixed dielectric for Experiment 5.
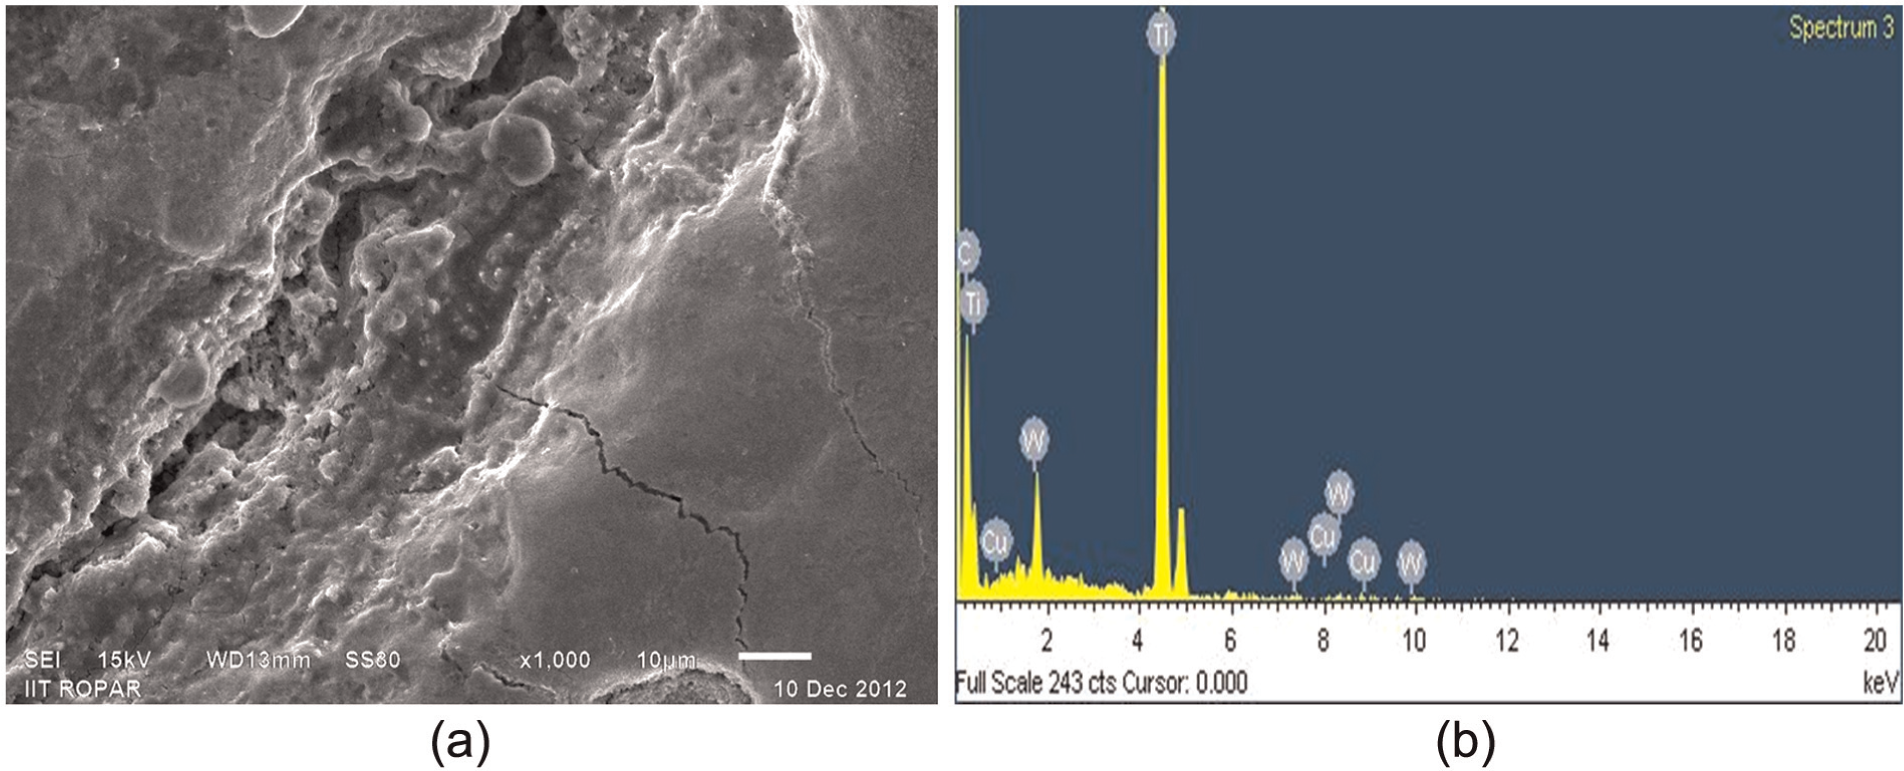
(a) SEM micrograph and (b) EDX spectrum of SCT Ti alloy machined with current of 14 A, pulse-on time of 150 µs, pulse-off time of 30 µs and SCT CuW electrode in EDM oil dielectric for Experiment 9.
(a) SEM micrograph and (b) EDX spectrum of WCT Ti-5Al-2.5Sn alloy machined with current of 6 A, pulse-on time of 90 µs, pulse-off time of 45 µs and SCT CuW electrode in W powder-mixed dielectric for Experiment 10.
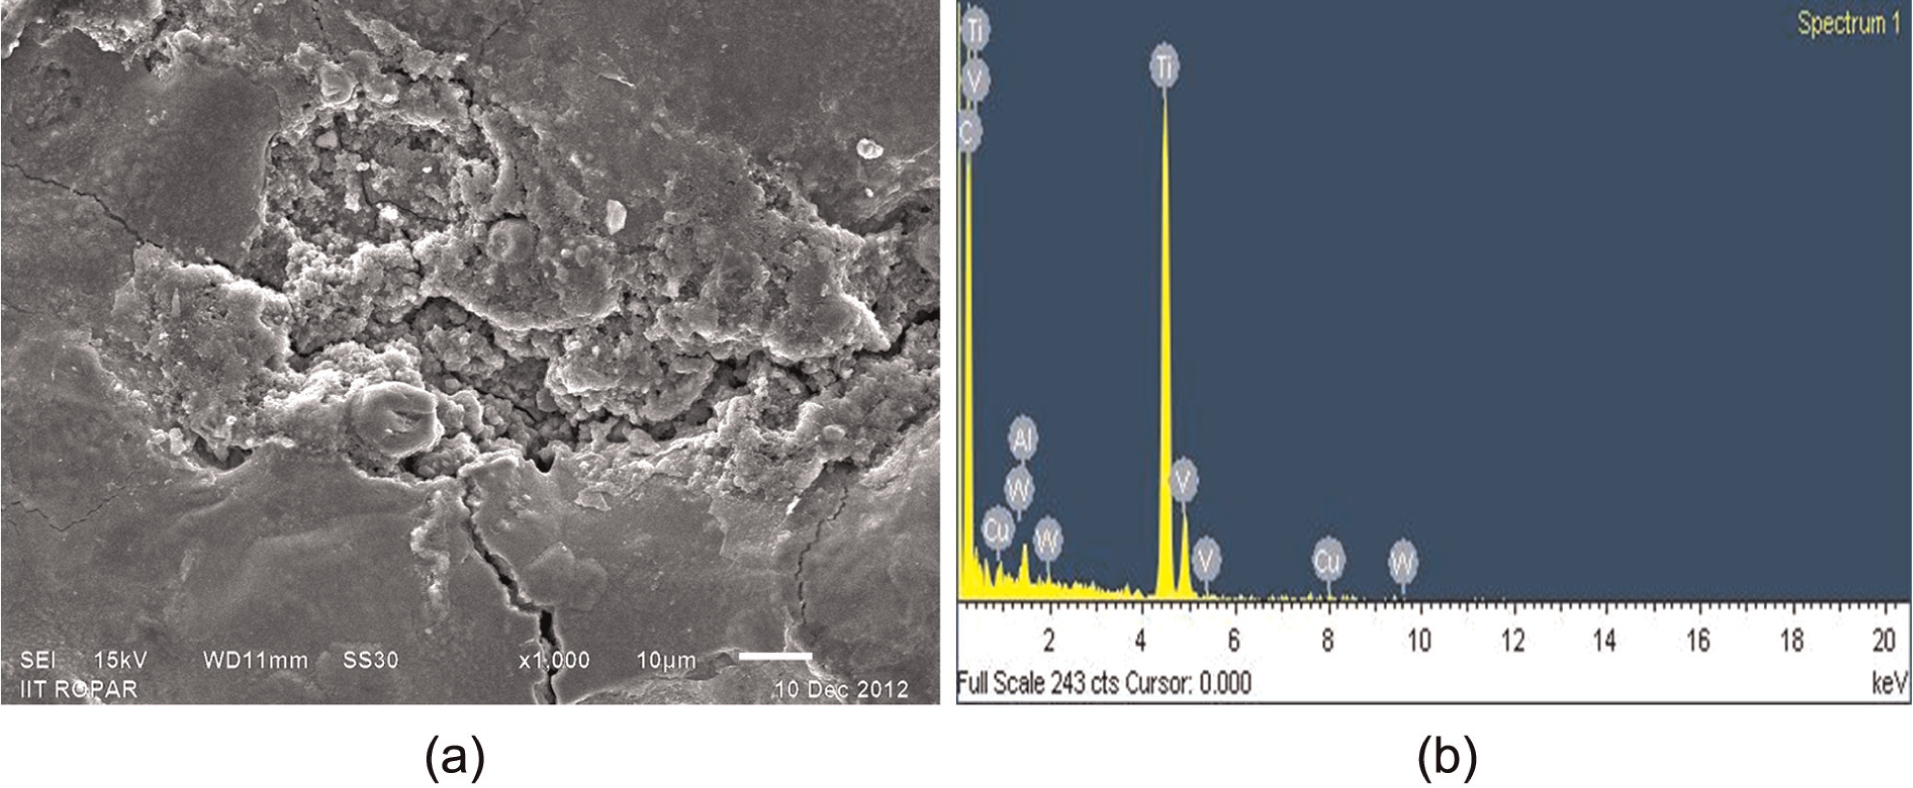
(a) SEM micrograph and (b) EDX spectrum of SCT Ti-5Al-2.5Sn alloy machined with current of 10 A, pulse-on time of 150 µs, pulse-off time of 30 µs and WCT Cu electrode in W powder-mixed dielectric for Experiment 6.
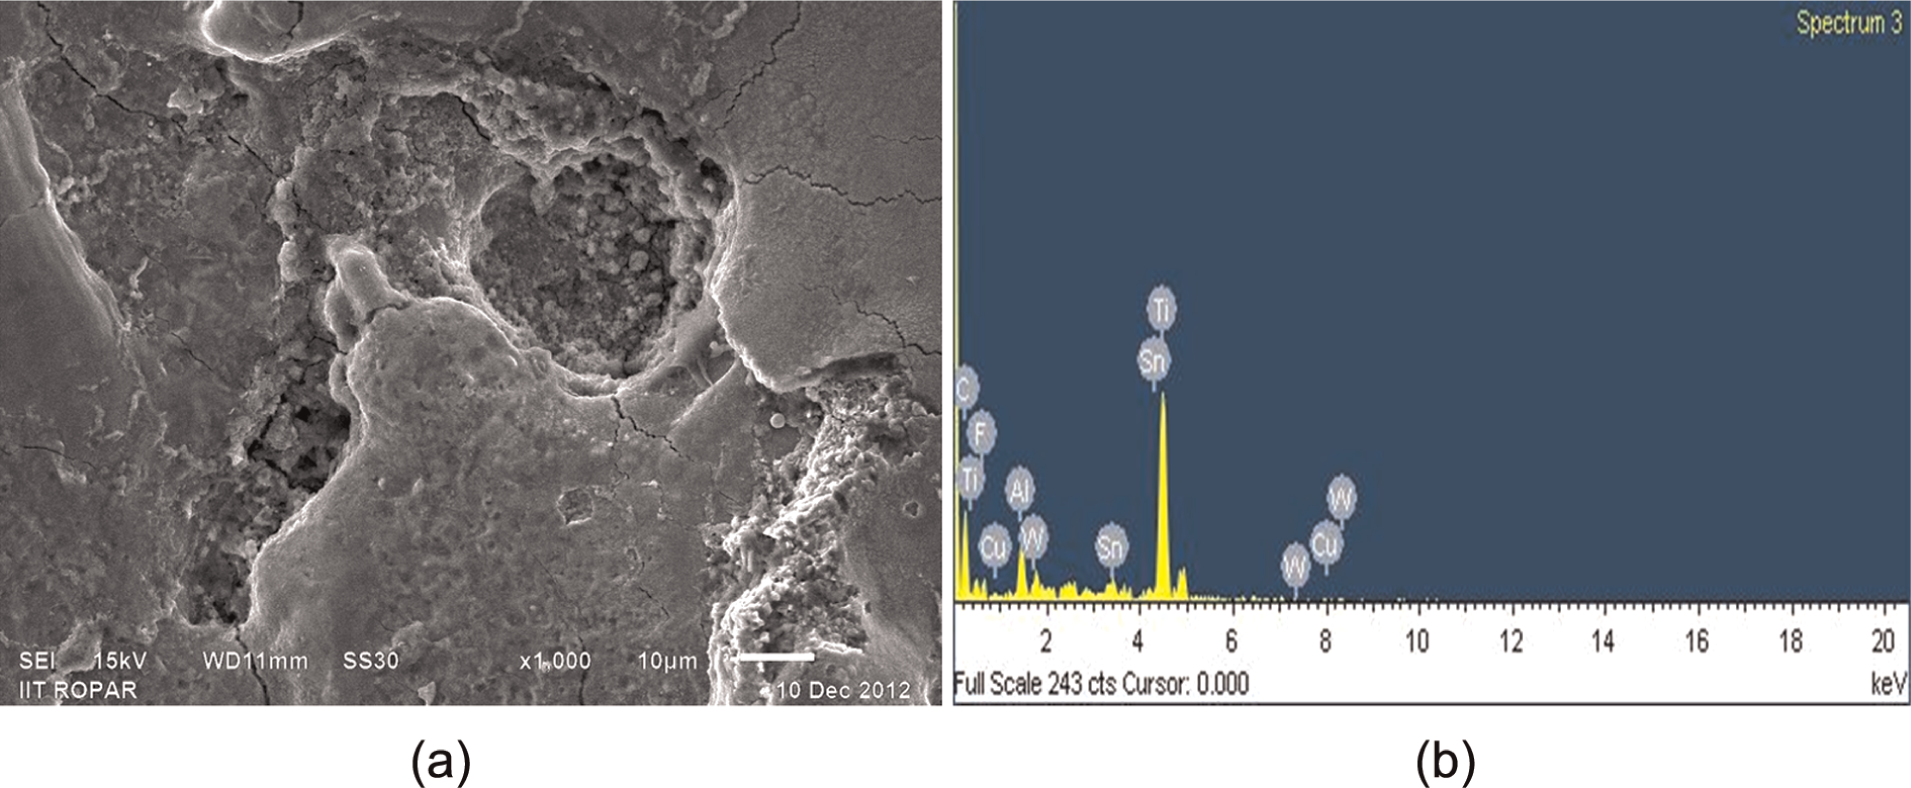
(a) SEM micrograph and (b) EDX spectrum of DCT Ti-5Al-2.5Sn alloy machined with current of 14 A, pulse-on time of 120 µs, pulse-off time of 45 µs and WCT CuW electrode in EDM oil dielectric for Experiment 17.
(a) SEM micrograph and (b) EDX spectrum of SCT Ti-6Al-4V alloy machined with current of 6 A, pulse-on time of 120 µs, pulse-off time of 45 µs and DCT Cu electrode in EDM oil dielectric for Experiment 11.
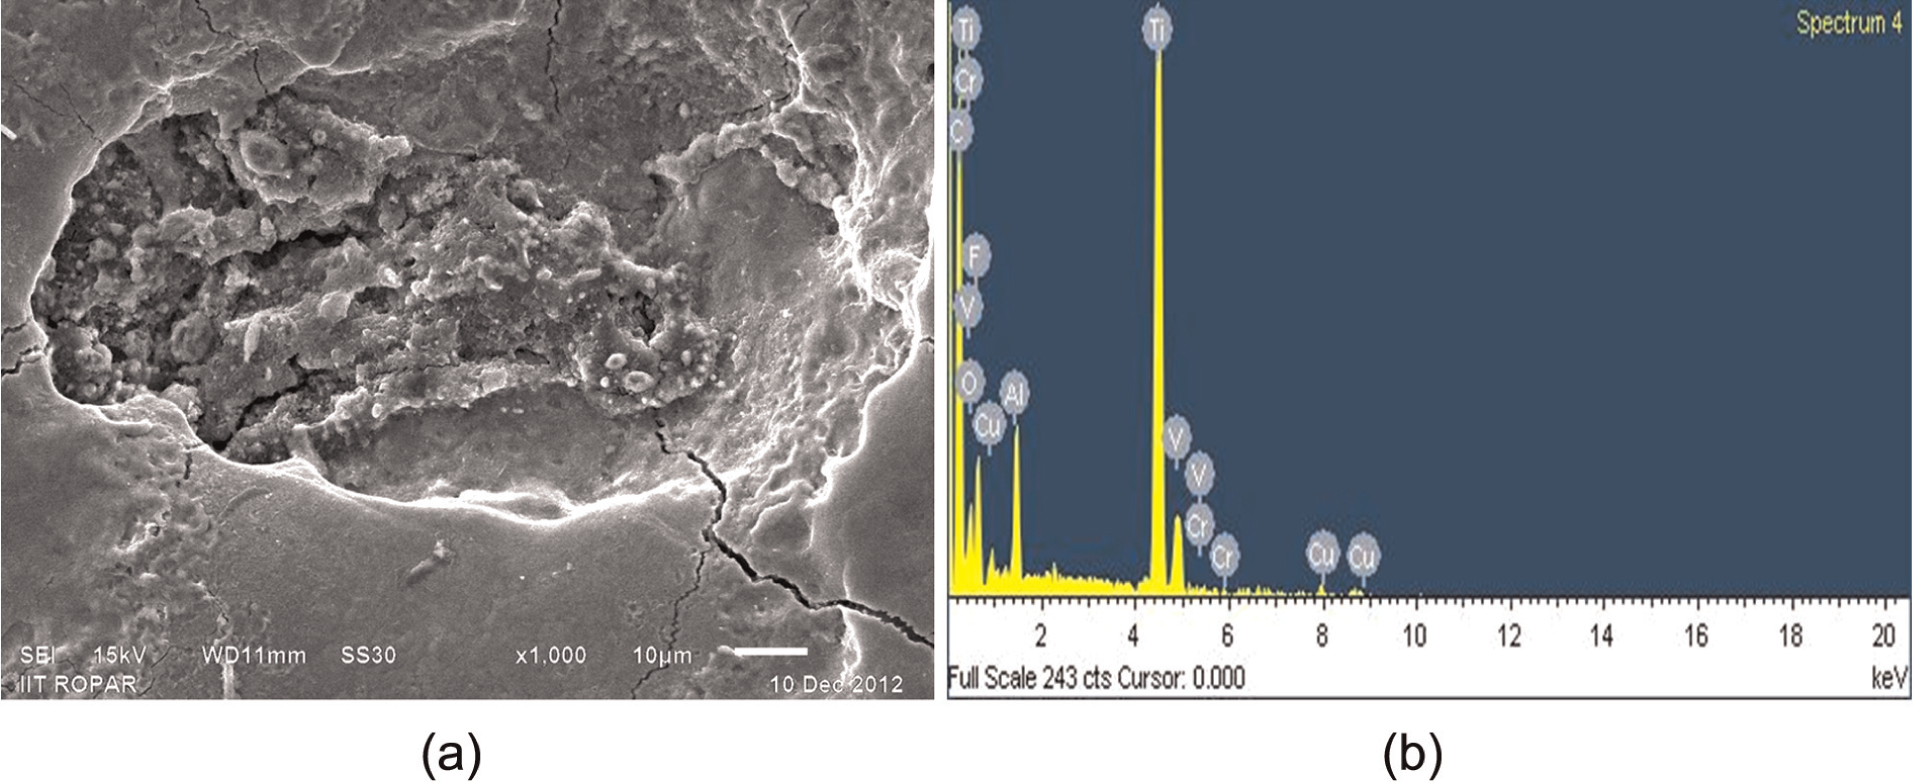
(a) SEM micrograph and (b) EDX spectrum of DCT Ti-6Al-4V alloy machined with current of 10 A, pulse-on time of 90 µs, pulse-off time of 30 µs and SCT CuCr electrode in EDM oil dielectric for Experiment 4.
(a) SEM micrograph and (b) EDX spectrum of WCT Ti-6Al-4V alloy machined with current of 14 A, pulse-on time of 120 µs, pulse-off time of 30 µs and WCT CuCr electrode in W powder-mixed dielectric for Experiment 8.
EDX analysis
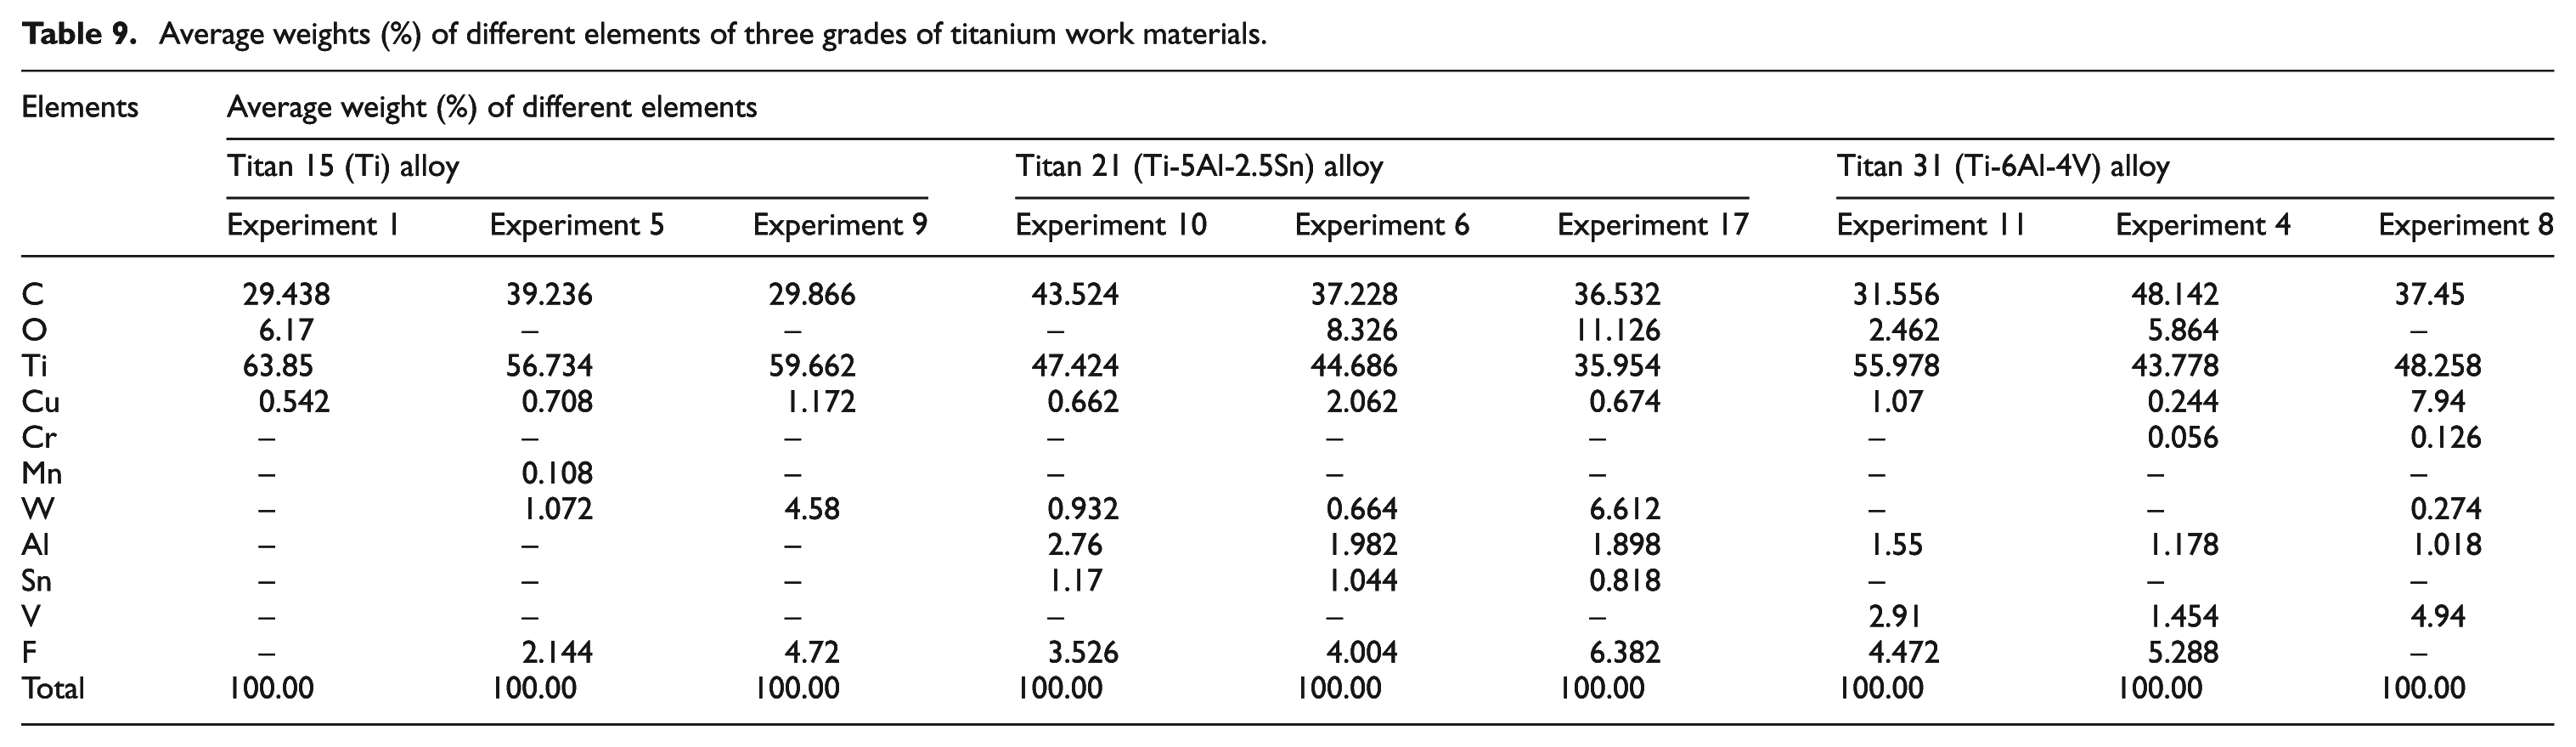
In addition to the SEM analysis, the compositions of the machined surface were analyzed by EDX to recognize the elemental chemical composition of the EDMed surface. An EDX spectrum shows the peaks corresponding to the energy levels for which most X-rays had been received. 19 The EDX results of the selected samples are presented in Figures 5(b), 6(b), 7(b), 8(b), 9(b), 10(b), 11(b), 12(b) and 13(b) for the three grades of titanium alloys. As expected, the principal elements in chemical composition of machined surface were titanium (Ti), aluminum (Al), vanadium (V) and tin (Sn), which are the constituents of Titan 15, Titan 21 and Titan 31 alloys. The EDX analysis showed residuals of copper (Cu), chromium (Cr) and tungsten (W) on the machined samples. This may be due to material migration during machining, melting, evaporation and resolidification from the electrode, dielectric fluid or the powder. At high temperature, the dielectric decomposes and carbon is deposited on the machined surface. This observation is in agreement with other studies reported in the literature.2,3,6 Furthermore, the carbon may also stick to the bottom surface of the tool, thus lowering the discharge efficiency. Moreover, manganese and tungsten powder mixed with the dielectric were also observed on the machined surface. Table 9 shows the weight % of different elements of parent metal as well as elements transferred from the electrode and/or powder-mixed dielectric fluid. From Table 9 and EDX analysis, it was observed that titanium base material had the maximum weight % followed by migrated carbon from the dielectric fluid. The highest peak observed for the base metal titanium was 63.85 % as seen from the EDX plots shown in Figures 5(b), 6(b), 7(b), 8(b), 9(b), 10(b), 11(b), 12(b) and 13(b). Furthermore, migration of elements such as copper, tungsten and chromium from the electrode materials was also observed in the EDX spectra.
Average weights (%) of different elements of three grades of titanium work materials.
X-ray diffraction analysis
Titanium is a chemical reactive element and is oxidized during EDM process forming different chemical compounds of titanium oxides. Also, due to the migration of carbon from the dielectric fluid, another major chemical compound titanium carbide (TiC) was also formed during the process. To determine the chemical composition and phases on the machined surface exactly, the X-ray diffraction (XRD) analysis was completed. Figure 14 shows the XRD pattern of the Ti-5Al-2.5Sn alloy machined at current of 10 A and pulse-on time of 150 µs with Cu electrode in W powder-mixed dielectric (Trial 6). Figure 15 shows the formation of compounds such as TiC and Zn2Ti4C. As carbon is transferred from the dielectric fluid, it interacts with titanium and forms the hard titanium carbide (TiC), which was precipitated on surface. The titanium carbide compounds were observed at different 2θ positions. Since the melting and the boiling points of TiC compounds are very high, the time for melting, boiling and evaporation of materials increases and thus requires higher discharge energy for machining, thus lowering the machining efficiency.5,6 Zinc was transferred from the copper electrode and formed zinc titanium carbide Zn2Ti4C. Some other compounds such as aluminum titanium carbide (Al2Ti4C2), germanium titanium carbide (Ge2Ti4C2), copper titanium oxide (CuTiO3), rutile (TiO2), potassium titanium oxide fluoride (K3TiOF5), iron titanium oxide (FeTiO), sodium iron titanium oxide (NaFeTiO4), tin titanium carbide (SnTi2C) and tin titanium tungsten oxide (Sn2TiWO7) were also formed.
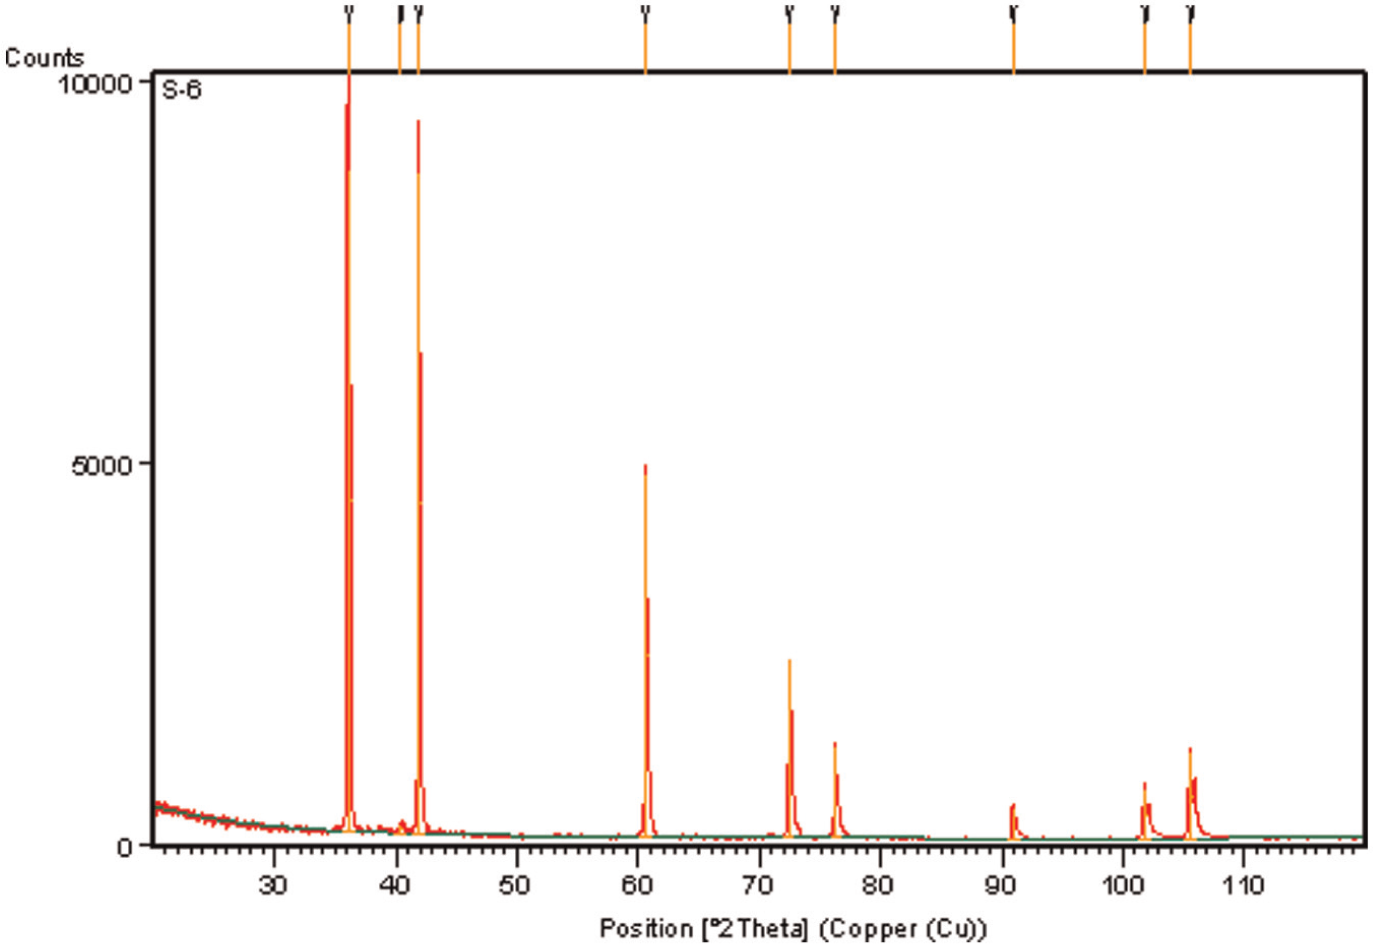
XRD pattern of SCT Ti-5Al-2.5Sn alloy machined with current of 10 A, pulse-on time of 150 µs, pulse-off time of 30 µs and WCT Cu electrode in W powder-mixed dielectric for Experiment 6.
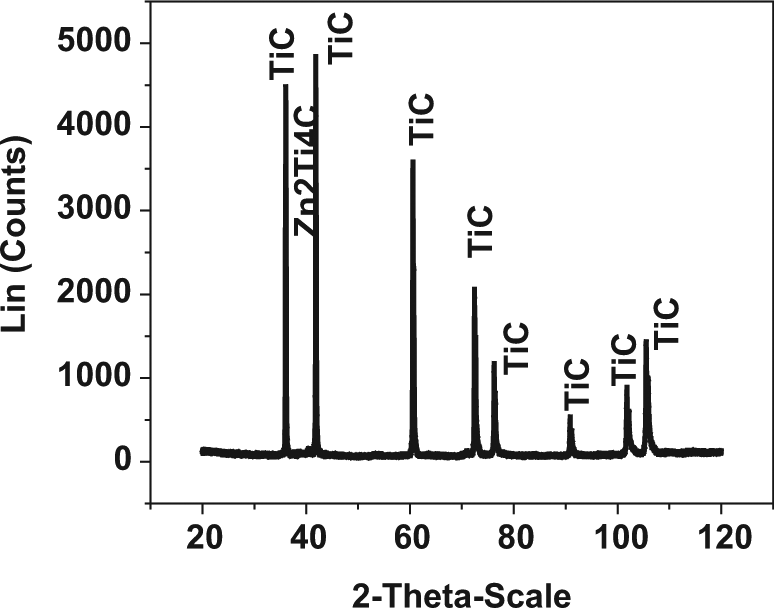
Chemical compound formation in XRD pattern of SCT Ti-5Al-2.5Sn alloy machined with current of 10 A, pulse-on time of 150 µs, pulse-off time of 30 µs and WCT Cu electrode in W powder-mixed dielectric for Experiment 6.
Conclusion
This study was undertaken to study the machining of titanium alloys with EDM and establish a mathematical model considering the significant machine parameters and the thermal–physical properties of work materials on MRR. The peak current was the most dominant factor affecting MRR. Addition of Mn and W powder in dielectric had little effect on MRR. A marginal increase in MRR was noted after DCT, which may be due to increase in thermal and electrical conductivities. A mathematical model was developed for predicting MRR using dimensional analysis in terms of electrical parameters (peak current) and thermal–physical properties of titanium alloys. A third-degree polynomial equation was found to be the best-fit curve after experimental validation with a high coefficient of correlation. The model showed that the thermal properties of the material such as thermal conductivity, specific heat and boiling point of materials affect the erosion process in EDM. The developed mathematical model shows good agreement when compared to the observed experimental results. The SEM micrographs show that it is clear that surface defects such as micro-pores, micro-cracks, holes and spherical globules debris increased with increase in current. Migration of the different elements was noted on the machined surface as confirmed by EDX analysis. Carbon was transferred from the dielectric after its decomposition. Furthermore, formation of different chemical compounds such as titanium carbide was observed during XRD analysis.
Footnotes
Declaration of conflicting interests
The authors declare that there is no conflict of interest.
Funding
This research received no specific grant from any funding agency in the public, commercial or not-for-profit sectors.