
Abstract
In this research, geometric parameters were given in dimensionless form by the Π- Buckingham dimensional analysis method in the dimensionless group for deep drawing of a round cup. To find the best group of dimensionless parameters and the fittest dimensionless relational model, three scales of the cup are evaluated numerically by a commercial finite element software and stepwise regression modeling. After analyzing all effective geometric parameters, a fittest relational model among dimensionless parameters is found. In addition, the results of the new dimensionless model were compared with the simulation process and experimental tests. From the results, it is inferred that the geometric qualities of a large scale can be predicted with a small scale by the proposed dimensionless model. Comparing the results of the dimensionless model with experimental tests shows that the proposed dimensionless model has fine precision in the determination of geometrical parameters and drawing force estimation. Moreover, to evaluate the accuracy of the proposed dimensionless model, the predicted value of the model has been compared by the experimental results. It is shown that the dimensionless ratios of geometrical parameters can significantly affect the estimation of the drawing force by the proposed dimensionless model, but based on similarity law, because of the constant value of these dimensionless parameters in different scales, they could not be used for dimensionless analysis separately. It is also inferred that because of the effect of contact area on the coefficient of friction, which is changed by scale changing, the only dimensionless parameter that can significantly change the drawing force is the coefficient of friction. Finally, it is shown that the dimensionless geometrical parameter and the coefficient friction should be combined for dimensionless analysis.
Keywords
Introduction
Expensive manufacturing costs for the required equipment in the manufacturing processes and the time-consuming simulation process by finite element method (FEM) analysis, and also a dependency of these processes on empirical work, lead to complications of these processes resulting in their performance being affected, which is highly critical in large scale in terms of time and costs. Also, it is important to select the proper process parameters to achieve sound parts when the process changes from small to large scale. Although many studies have been done through dimensional analysis, quite a few of them contain the metal forming and articles involving both dimensional analysis and sheet metal forming especially predicting suitable geometrical parameters in different dimensional scales.1–6 Also, it should be noted that even though the scale changing for generalization of experimental results is not a new challenge and has been extensively used in fluid and dynamic applications, so far no attention has been paid to use it in metal forming.7–9
Dimensional analysis plays an important role in evaluating the process on different scales. Although this method depends on the complexity of the problem, its simplicity, where there is no need for understanding of the fundamental process model, general dimensionless process model diagnosis and process trend prediction in different scales are the most important advantages of this method. 10 In this case, Navarrete et al., 11 demonstrated that the prediction of the required force for an open die forging can be presented with less than a 15% error rate by applying dimensional analysis and Π- Buckingham theorem. Although the evaluation performed by dimensional analysis was very helpful in predicting force, the friction coefficient and the complexity of the geometry could limit the process of extracting information. Pawelski 12 reported one of the few explanations of metal forming dimensional analysis. In this research, Π- Buckingham theorem was used to define the effect of lubricants on cold rolling. Jamadar and Vakharia 13 developed a new methodology based on dimensional analysis to measure the localized faults in the improvement of the computational efficiency in the nonlinear dynamic analysis for the rolling contact bearing. A good agreement between proposed theoretical models obtained by dimensional analysis with experimental data was precisely shown by the validity of the theoretical model. Finally, it was mentioned that the dimensional analysis tool can strongly provide great help for investigating the actual industrial scale by the laboratory studies. Ajiboye et al. 14 investigated the determination of the friction role in cold forging. They used dimensional analysis to detect friction effects and Π-Buckingham theorem for predicting its value. They found that changes in friction trend can be strongly predicted by a linear model obtained from dimensional analysis.
The present study focused on the dimensionless analysis of the deep drawing process of round cups. The purpose of this study is to evaluate the sound quality of the process in its large original size by small scale laboratory samples. For this reason, the similarity law and the theory of Π-Buckingham were used as key theories that are widely used in dimensional fields. The geometric dimensional groups of the deep drawing process of round cups are assessed on different scales. Then, the best dimensionless models to predict the drawing force, as the main and complex process parameters, at the moment of tearing is determined by taking into consideration the effective geometric parameters. Also, the accuracy of the dimensionless models was investigated using experimental results; the prediction of the drawing force was presented. Finally, the precision of the proposed dimensionless models and the dimensionless analysis were also investigated using the generalization technique.
Π-Buckingham theory
A relation between a set of physical variables can be stated as a set of independent dimensionless groups with a relationship that includes appropriate variables. The number of dimensionless groups contains the number of variables “n,” minus the number of dimensions “m.” These dimensionless groups are often referred to as π groups. The Π-Buckingham theory explains that if there are “n” dimensional variables in a problem, the dimensions or quantities that are related in a homogeneous condition can be described quietly by m dimensions. So, the relationship between the n quantities can always be described in terms of precisely (n-m) dimensional and independent π terms.15,16 In other words, if any variable Q1 depends on the independent variables Q2, Q3, Q4 …Q n ; the functional relationship can be written as Q1 = f (Q2, Q3, Q4 …Q n ). Q1 can be converted to a different functional relationship f1 (Q2, Q3, Q4 …Q n ) = W, where W is a dimensionless constant. 17 A dimensionless relation can be obtained in the following equation (1) according to the Π-Buckingham theorem

These repeated m variables that do not form a dimensionless parameter on their own, are selected from the variables that contain all the m basic quantities. Therefore, different π terms can be found as equation (2)
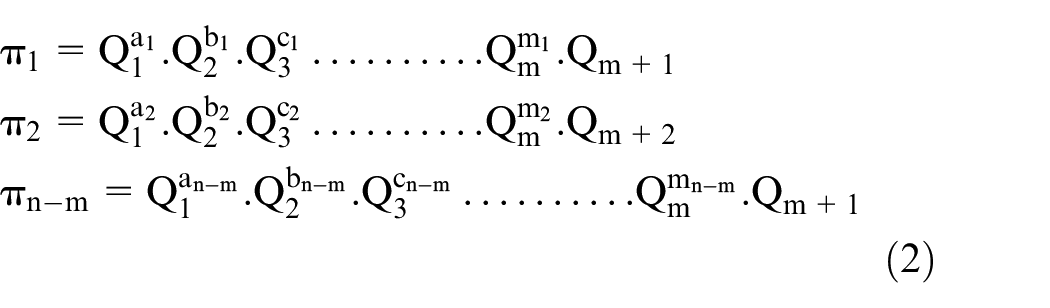
As in the above relations, each of them is dimensionless and the exponents a, b, c, d… m, are defined by the dimensions homogeneity. Finally, as shown in equation (3), the general relation for the phenomenon can be obtained by specifying any of the terms as a function of the others 18
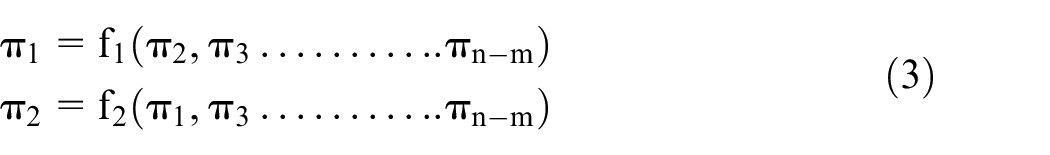
A matrix of dimensional analysis is used to define the exponents for determining the dimensionless model. In this method, only length L, mass M and time T as fundamental dimensions are considered. The relation for dependent variable Q1, which depends on variables {Q2, Q3, and Q4 … Q n }, is considered as equation (4)

The dimension vector for each Qi can be defined by Pi in equation (5)
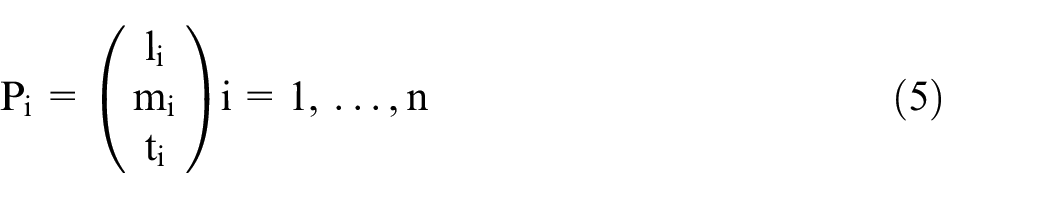
And the dimension matrix is
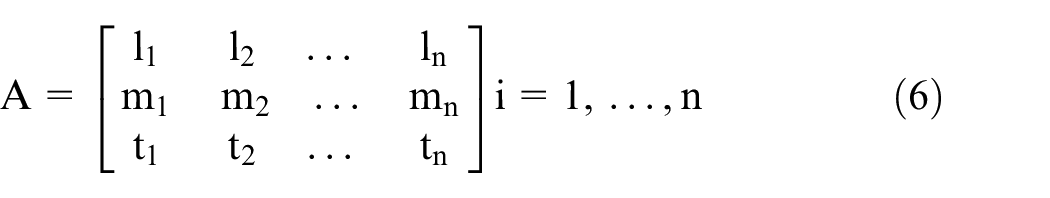
From the above relations, it can be concluded for Q = f (Q1, Q2, Q3 … Q n ) that the number of dimensionless quantities can be derived by equation (7)

In other words, for k linearly independent solution, rank (A) = n-k and AZ = 0 which is denoted by Z1, Z2 … Zk. If a j column vector of a is supposed to be the dimension vector of Q, and

As it was mentioned before, the relation Q = f (Q1, Q2, Q3 … Q n ) can be simplified by equation (9)

So, equation (10) can be considered for Q

For every dimensionless quantity πi
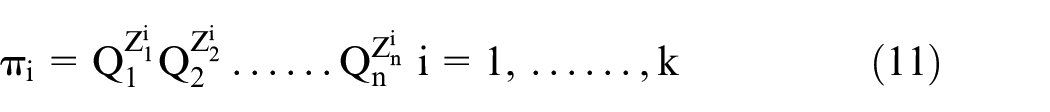
So, determining the exponent yi by equation (8) can lead to
Extracting dimensional parameters
Π-Buckingham theory is based on the dimensionless groups so that dimensionless groups can be created after determining the effective independent parameters on the response variable, considering the similarity law and the principle of dimensional homogeneity. To achieve comparable results during scale changing, all process parameters that can affect the final process quality including geometrical parameters such as blank and punch dimensions, punch and die edge radius, drawing depth, sheet thickness, and the gap between punch and die. Other parameters such as process temperature, material properties and load rate must be regarded as constant.4,18 According to the similarity law, the same material with the same mechanical and thermal properties should be considered for the small and large scales. On the other hand, all parameters affecting the failure or damage of the material should be considered the same in order to investigate tearing in the original sample. 19
In order to find the dimensionless groups, all variables affecting the response variable should be determined. After determining the number of repetitive numbers, the number of dimensionless groups should be determined from equation (13)

where n is the number of variables, k is the maximum number of allowable variables and P is the number of the dimensionless group. Finally, the relationship between the drawing force and the effective parameters can be determined in equation (14)

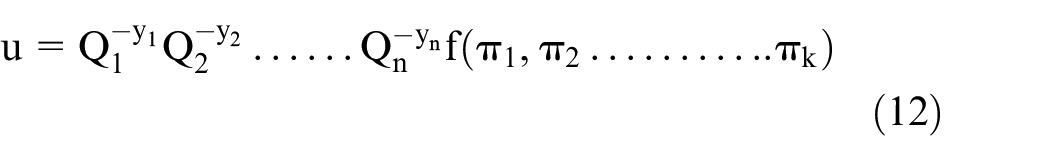
where D is blank diameter, d is punch diameter, t is the sheet thickness, r is the punch edge radius, R is the die edge radius, U is the tensile strength of sample material and µ is friction coefficient. The total number of independent and dependent variables is n = 8 which are presented in Table 1. The number with respect to the main dimension k = 3, which consists of five dimensionless groups. However, given that the determinant of the dimensional matrix must be zero and that the current dimensional matrix with three primary dimensions cannot be zero, two primary dimensions must be used to determine the number of the dimensionless group. 4 As a result, six dimensionless groups were determined.
Dimensional Matrix for deep drawing process of the round cup.
Since the friction coefficient is generally a dimensionless factor, then one of the dimensionless groups can be friction coefficient, which is presented in equation (15)

The calculation steps to describe the indexes that determine the first dimensionless number have been defined in equation (16) to simplify the understanding of the method used

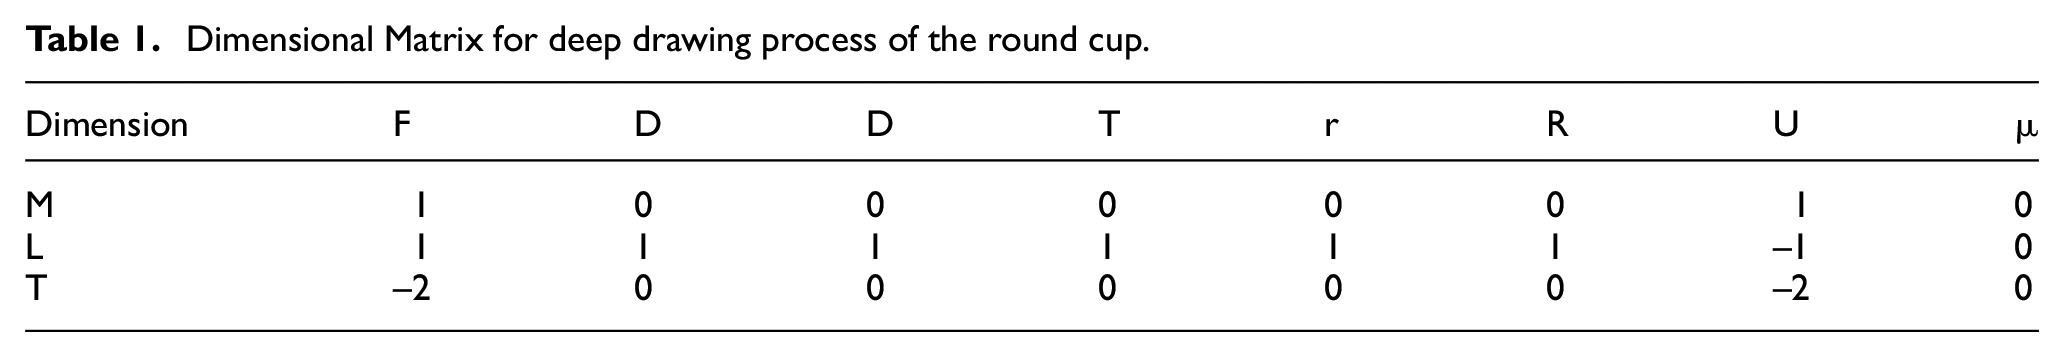
According to this relationship, the input and output variables are written in the first step. In the second step, the relation π1 is shown in equation (17) in terms of the main dimensions
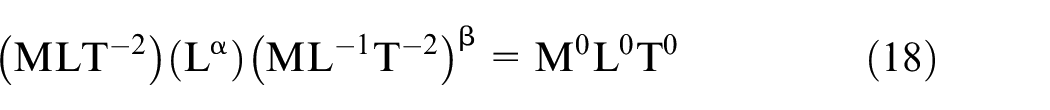
In the third step, in view of the dimensionless number, the homogeneity is shown in equation (18)
In accordance with the equation (19), in the next step, the equation of dimensional equality is written as

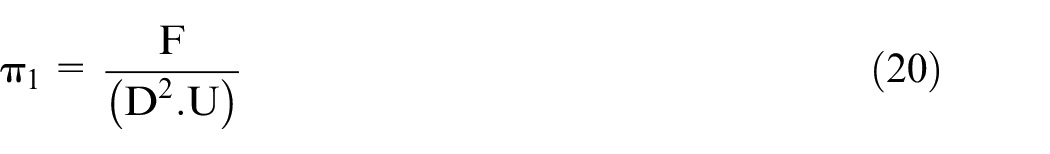
Finally, dimensionless number π1 which contains drawing force is obtained by equation (20).
The dimensionless groups obtained by Π-Buckingham theory are shown in Table 2.
All the possible dimensionless groups for deep drawing of the round cup.
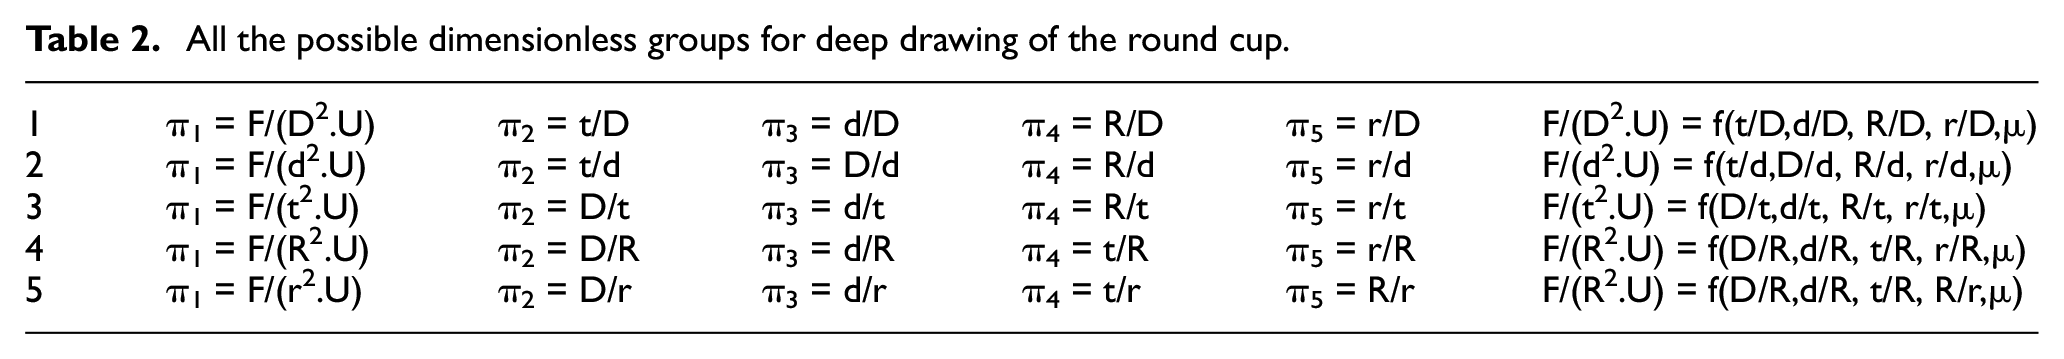
In this regard, only dimensionless number π1 includes output variable F which can be presented as equation (21).

Simulation
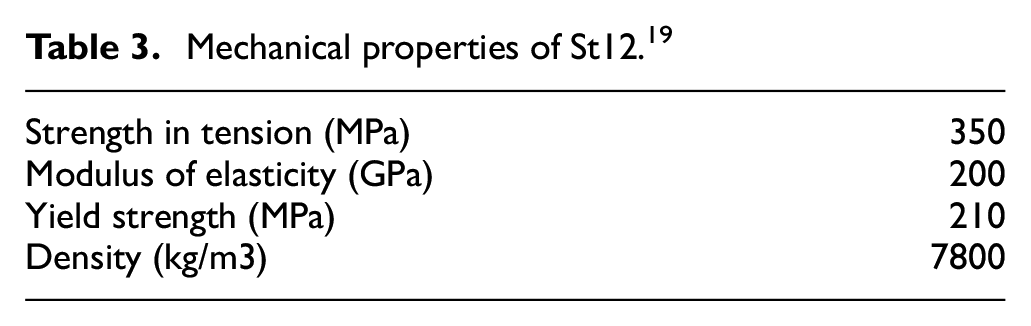
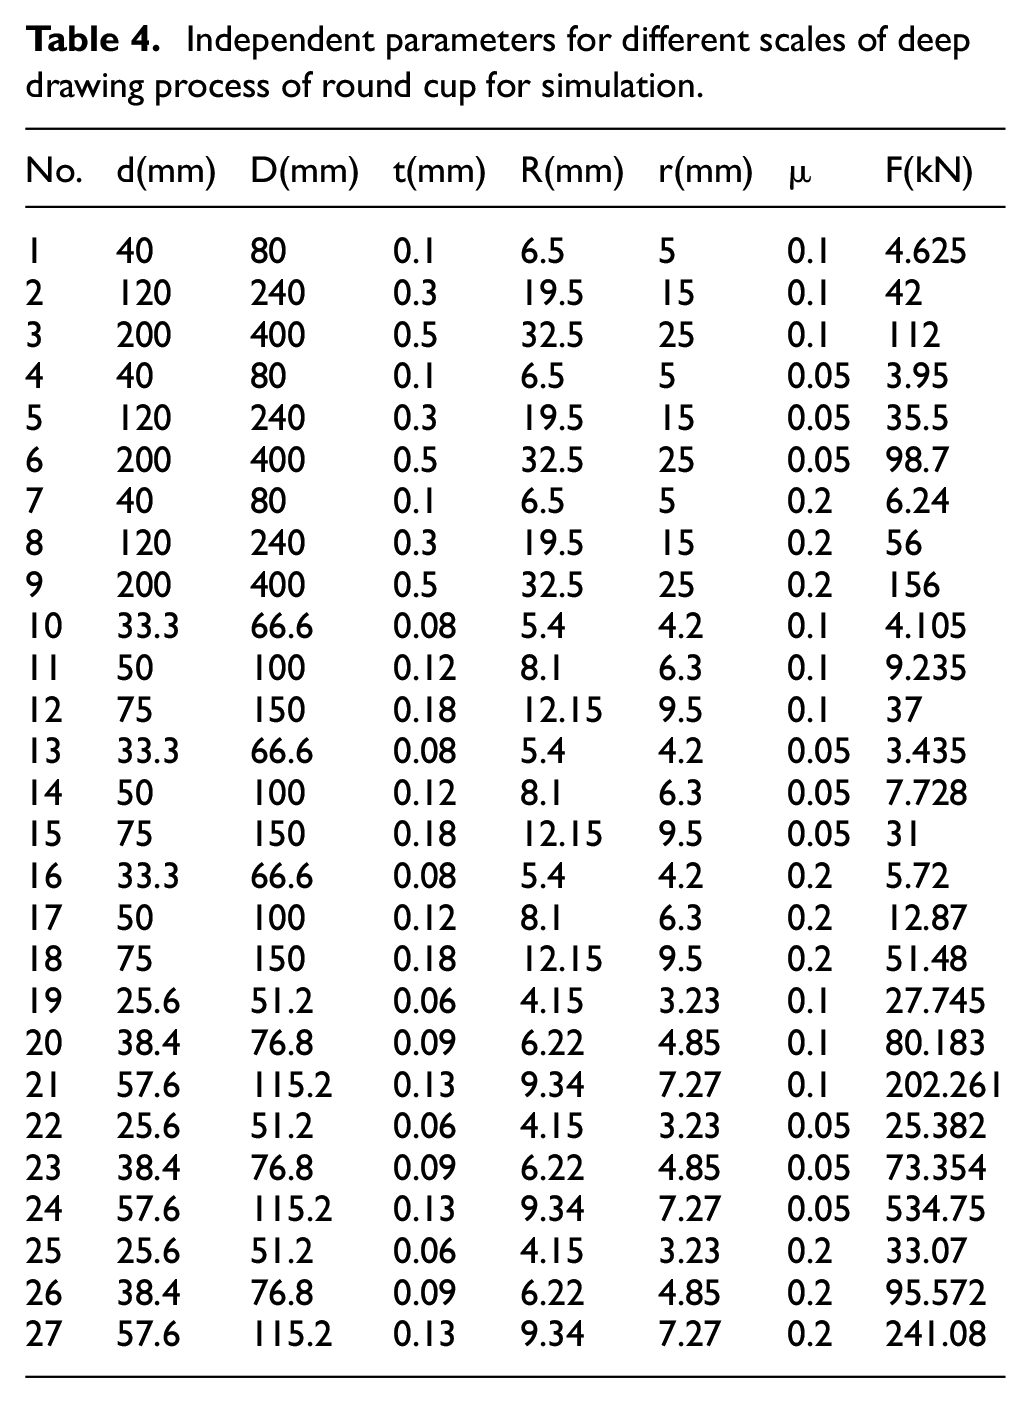
In this section, in order to determine the drawing force at tear moment, the deep drawing process for St12 carbon steel plate with the standard number DIN 1.0374 was simulated by a 3D model in ABAQUS commercial software. Table 3 shows the properties of St12 sheet metal. 19 The finite element model based on an explicit solving method was considered one-quarter of the model in order to reduce the computational cost. A deformable shell model with a four-node shell element was considered for sheet and an analytical rigid shell was defined for other components. By applying boundary conditions, the matrix and blank holder movement were limited and the edge of the sheet was considered to be completely constant. Also, 40%, 38% and 34% reduction in thickness was considered as a tear criterion for 2 mm, 1 mm, and 0.5 mm initial thickness, respectively. Input parameters and drawing force at the tearing moment are presented in Table 4.
Mechanical properties of St12. 19
Independent parameters for different scales of deep drawing process of round cup for simulation.
Experimental setup
The experimental tests were carried out on a 25-ton capacity hydraulic press, which is shown in Figure 1(a). The material used for experiments is St12 stainless steel with the standard number DIN 1.0374, which is applicable in various industries. The compositions (wt %) of this sheet metal were S (<0.04), N (<0.007), P (<0.04), Mn (0.4), and C (<0.1). 19 In the deep drawing mold, in order to save costs and machining time, die and blank holder were manufactured as inserted parts. In order to measure the drawing force, a 33-ton capacity load cell manufactured by CELLTEC company was used which was fixed on the press ram by a fixture. The indicator with 0.00005 external resolution manufactured by SEWHA company was used to display the load. The load cell and indicator are shown in Figure 1(d) and (e), respectively. The linear potentiometer with a 0.5% error manufactured by OPKON company was used to measure the height of the drawn cup, which is shown in Figure 1(b). All setup for load cell and linear potentiometer is shown in Figure 1(a). In order to determine the effective friction coefficient, thickness distribution of drawn sheet was used, which was measured by precision digital thickness gauge with 1µm resolution and 5µm measurement precision manufactured by GMAG Company, which is shown in Figure 2.
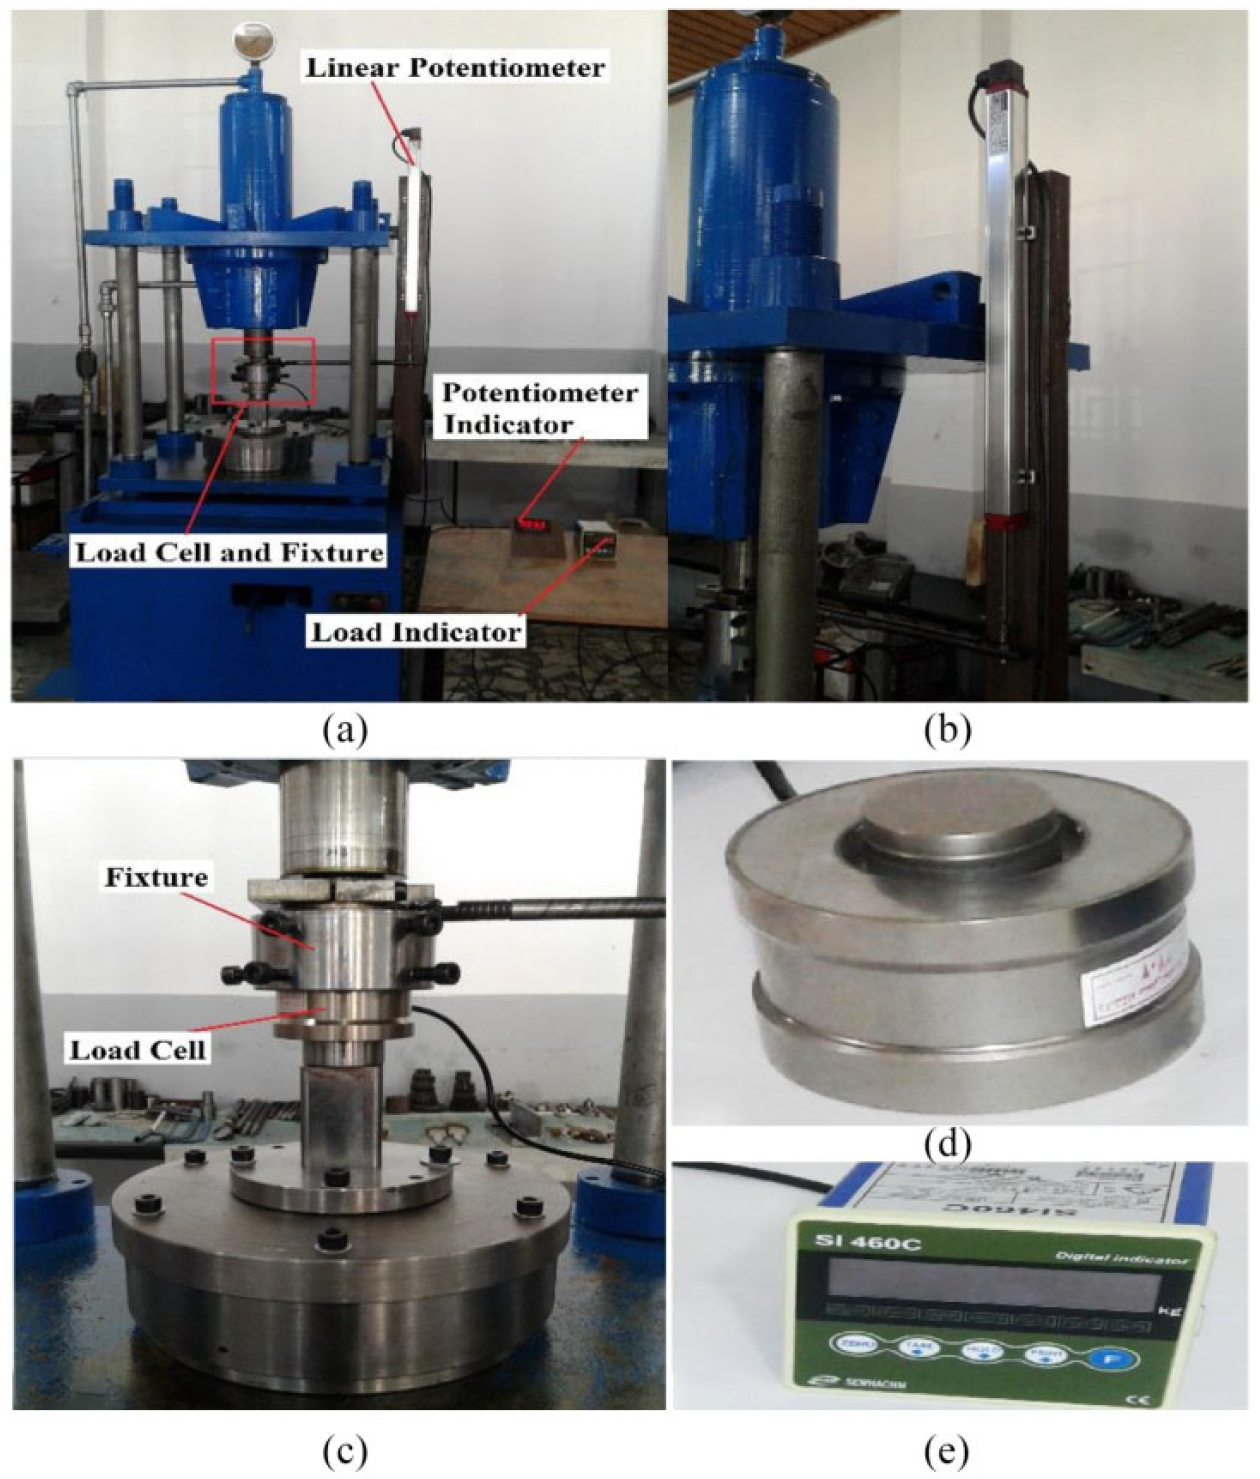
(a) All the devices for experimental setup, (b) Linear potentiometer, (c) Drawing unit, (d) 33-ton capacity Load cell and (e) Indicator for load cell.
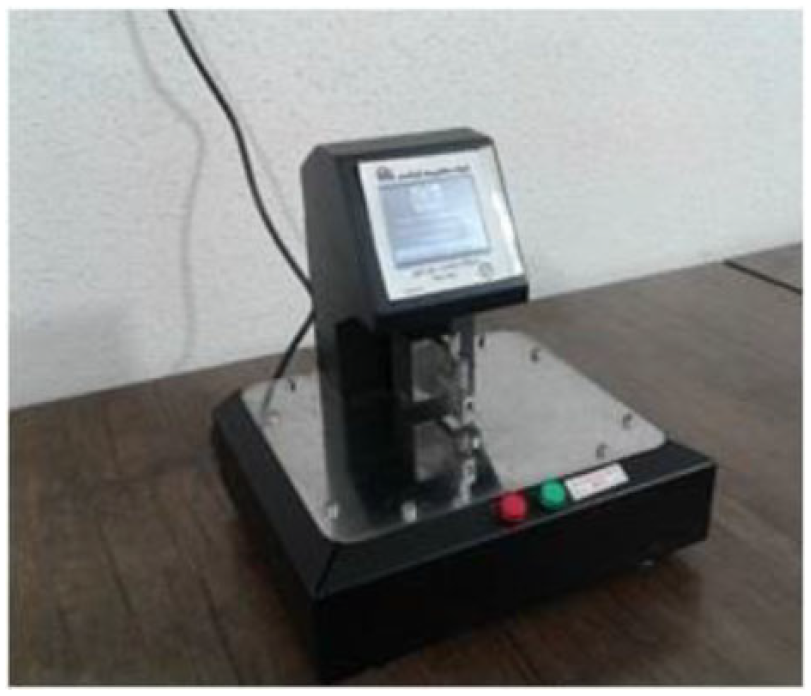
Precision digital thickness device for measuring the thickness of the formed cup.
Experimental design
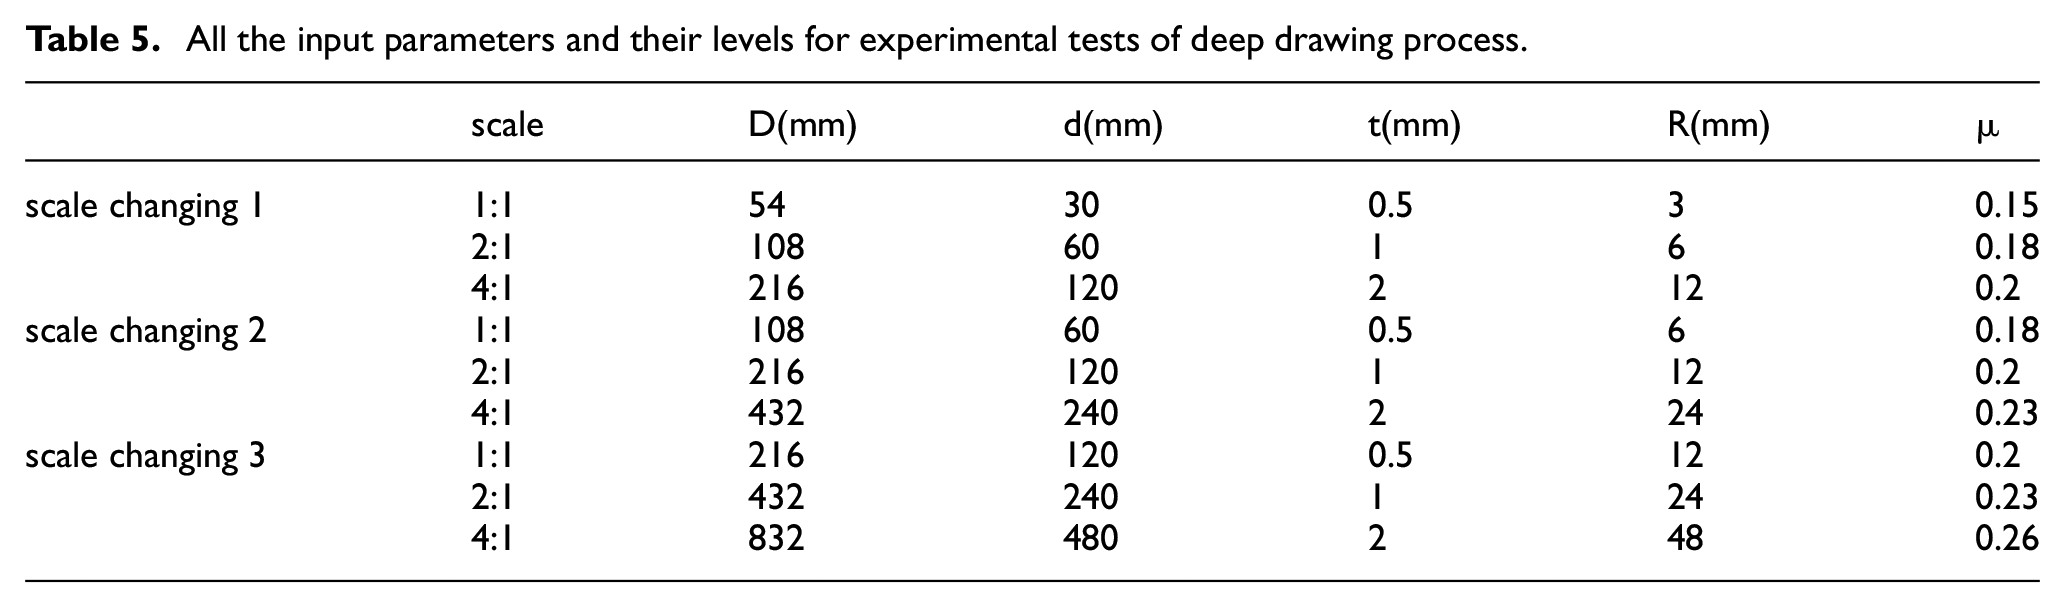
All the effective geometrical parameters are shown in Table 5. The levels of these three scales were selected according to our laboratory experiences. To ensure the precision of results, each experiment was measured three times and the mean value for the output was considered. The friction coefficient in experimental tests was determined by comparing thickness distribution in experimental tests with simulation. For this purpose, the thickness distribution for all three scales of formed round cups was determined by the precision digital thickness measuring, which is shown in Figure 2. This process is performed for different scales by measuring in eight locations regarding their distance to the center of the sheet which is shown in Figure 3. Also, the experimental test was simulated by the same value of parameters used in the experimental condition. The coefficient of friction was changed somehow to allow the thickness distribution for the experimental and simulation graphs to be the same. Finally, a comparison of the results of thickness distributions for simulation and experimental results leads to determine the coefficient of friction for different scales of round cups. The thickness distributions were shown in Figure 4.
All the input parameters and their levels for experimental tests of deep drawing process.
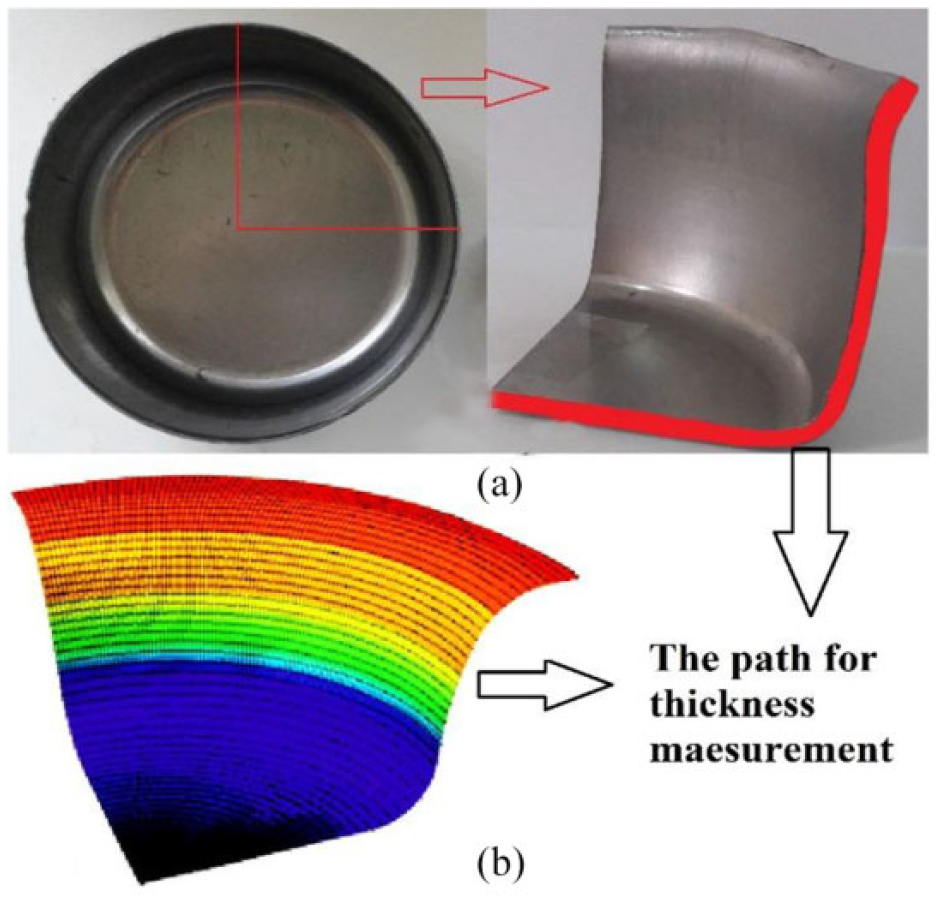
Location of measuring points for (a) experimental test and (b) simulation process.
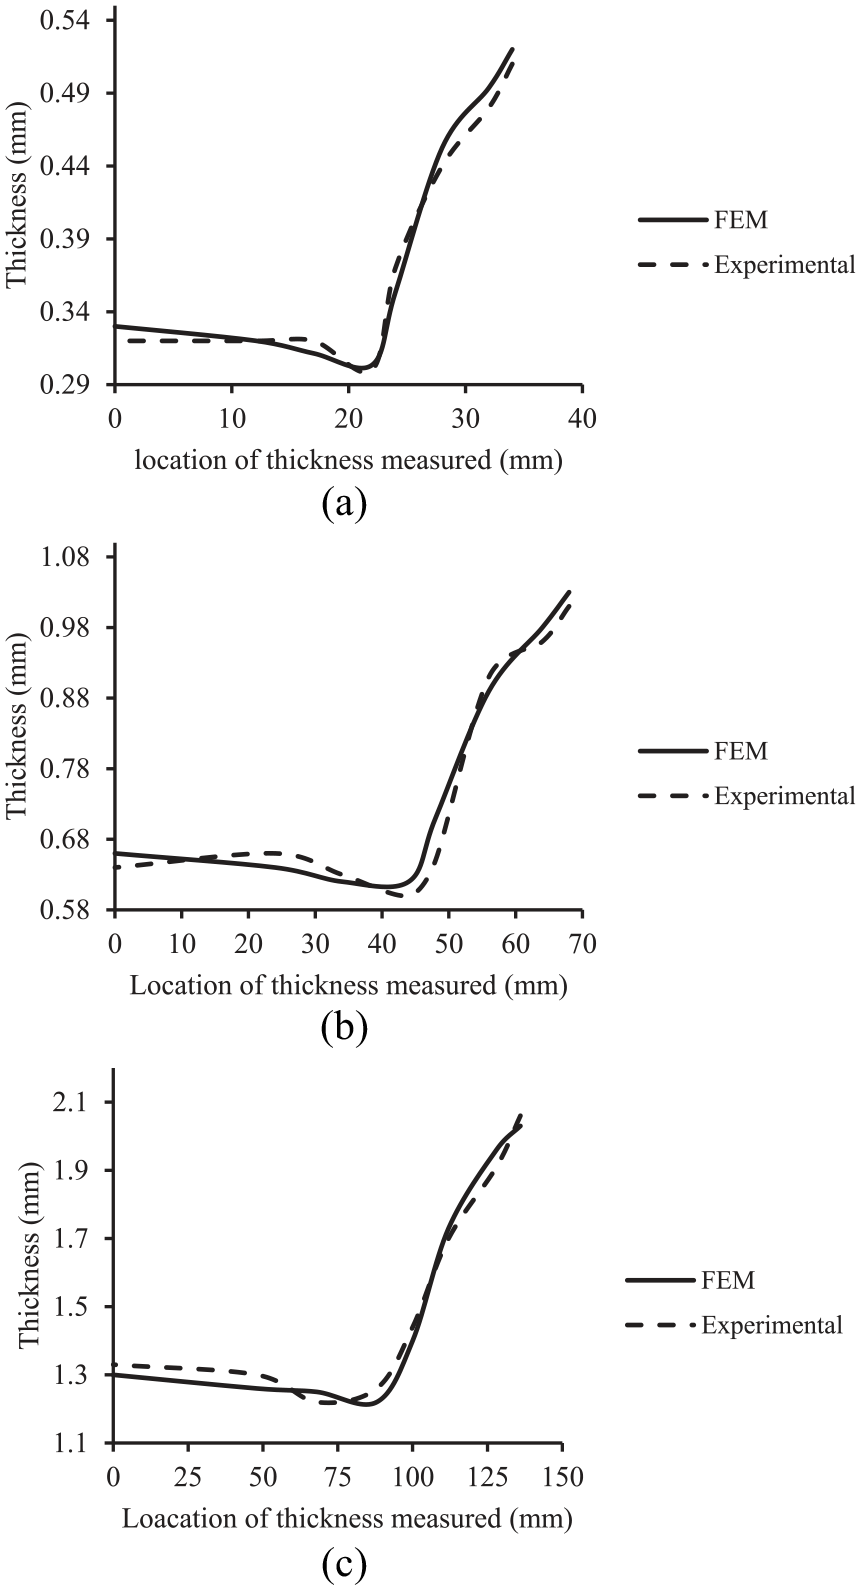
Thickness distribution in experimental and simulation cases for determining the coefficient of friction (a) scale 1:1 (b) scale 2:1 (c) scale 4:1.
Dimensionless model
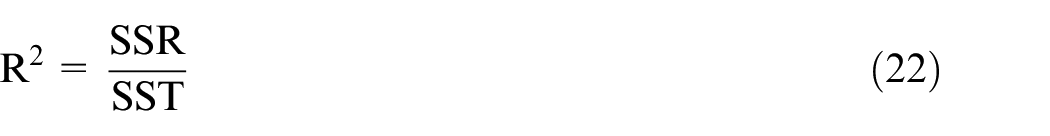
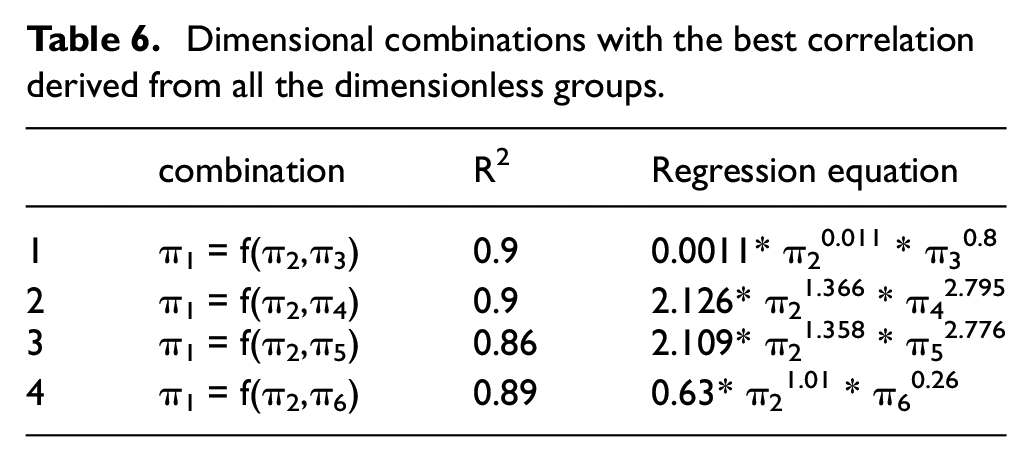
All possible dimensionless combinations have been analyzed using developed SPSS statistical software by regression modeling. For this propose, every double combination in each dimensionless group has been evaluated by analysis of variance (ANOVA). Dimensionless combinations, considering the correlation coefficients R2, are given in Table 6. Correlation coefficient is obtained by dividing the regression sum of squares (SSR) into the total sum of squares (SST) according to equation (22). Considering R2, it was determined that combination 1 has a higher correlation coefficient than others.
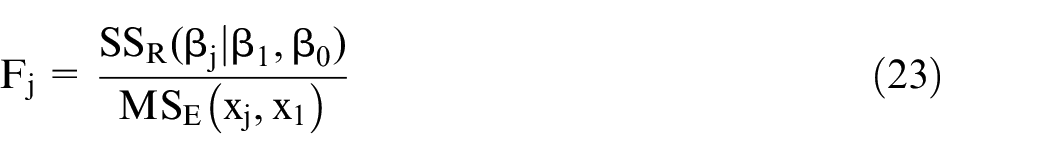
However, it should be noted that despite the high correlation coefficient for combinations 1 and 2, the friction coefficient as an important parameter for predicting drawing force which is considered as dimensionless parameter π6 has not any role in predicting drawing force. For this reason, to specify a precision and significant model by considering effective dimensionless parameters, the stepwise regression method was used. This method evaluates all the parameters, but unlike the general regression modeling methods, there is no interference in the model by insignificant factors. In other words, the participation of the factor in the final model is ignored if there is no significant influence by that parameter. The criterion for adding or removing a variable at any step is usually expressed in terms of a partial F-test. In this test fin is defined as the value of the F-random variable for adding a variable to the model, and fout is defined as the value of the F-random variable for removing a variable from the model which it must be fin≥ fout. Stepwise regression begins by forming a one-variable model using the x1 regressed variable that has the highest correlation with the response variable Y. In the second step, the remaining K − 1 candidate variables are examined, using partial F-statistic factor which is shown in equation (23) and it provided that fj≥ fin
Dimensional combinations with the best correlation derived from all the dimensionless groups.
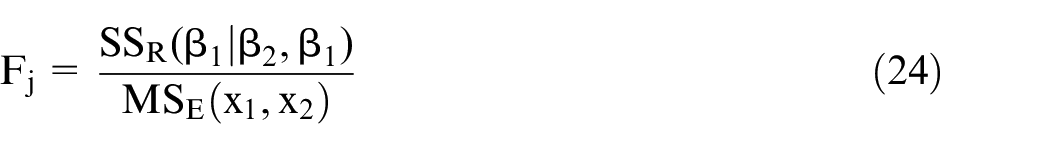
In Eq MSE (xj, x1) denotes the mean square for error for the model containing both x1 and xj. Suppose that this procedure indicates that x2 should be added to the model. Now the stepwise regression algorithm determines whether the variable x1 added at the first step should be removed. This is done by calculating the F-statistic based on equation (23) which is shown in equation (24)
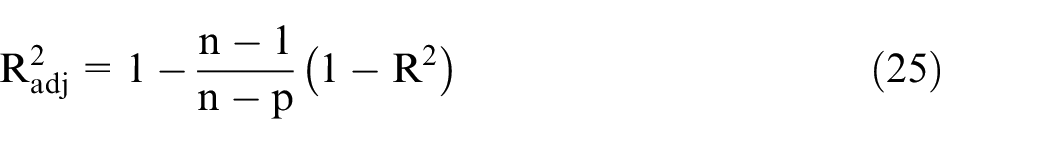
If the calculated value f1 < fout, the variable x1 is removed; otherwise it is retained, and it would be attempted to add a regressor to the model containing both x1 and x2. In general, at each step the set of remaining candidate regressors is examined, and the regressor with the largest partial F-statistic is entered, provided that the observed value of f exceeds fin. Then the partial F-statistic for each regressor in the model is calculated, and the regressor with the smallest observed value of F is deleted if the observed f < fout. The procedure continues until no other regressors can be added to or removed from the model. The schematic of the stepwise regression process is presented in Figure 5. At long last, in the wake of examining every one of the dimensionless factors in several steps, the best fitted model is extracted, which is composed of effective parameters. The correlation coefficient of the acquired model is more trustworthy which is given in ANOVA Table 7. When the value of R2 is close to 1, it indicates that there is a strong relationship between input and output variables. In analyzing the regression model, it should be noted that the R2 coefficient increases by adding additional variables or higher levels to the model. Therefore, models with greater R2 may be weak in predicting or estimating outputs for new inputs, despite good fit for existing data. Therefore, the adjusted correlation coefficient R2adj shown in equation (25), which can prevent the inclusion of unnecessary factors, can provide an accurate analysis in the regression model. In equation (25), n is the number of experiments and p is the number of factors. When the values of R2 and R2adj are very different, it means that additional variables have been added to the model. In addition to the residuals and correlation coefficient, another parameter that is used to measure the suitability of the regression model is the parameter P-value. If P < α indicates the appropriateness of the regression model, which α is a confidence level and is usually considered to be between 5% and 10%. This means that an error of α% is allowed in the experiment 20
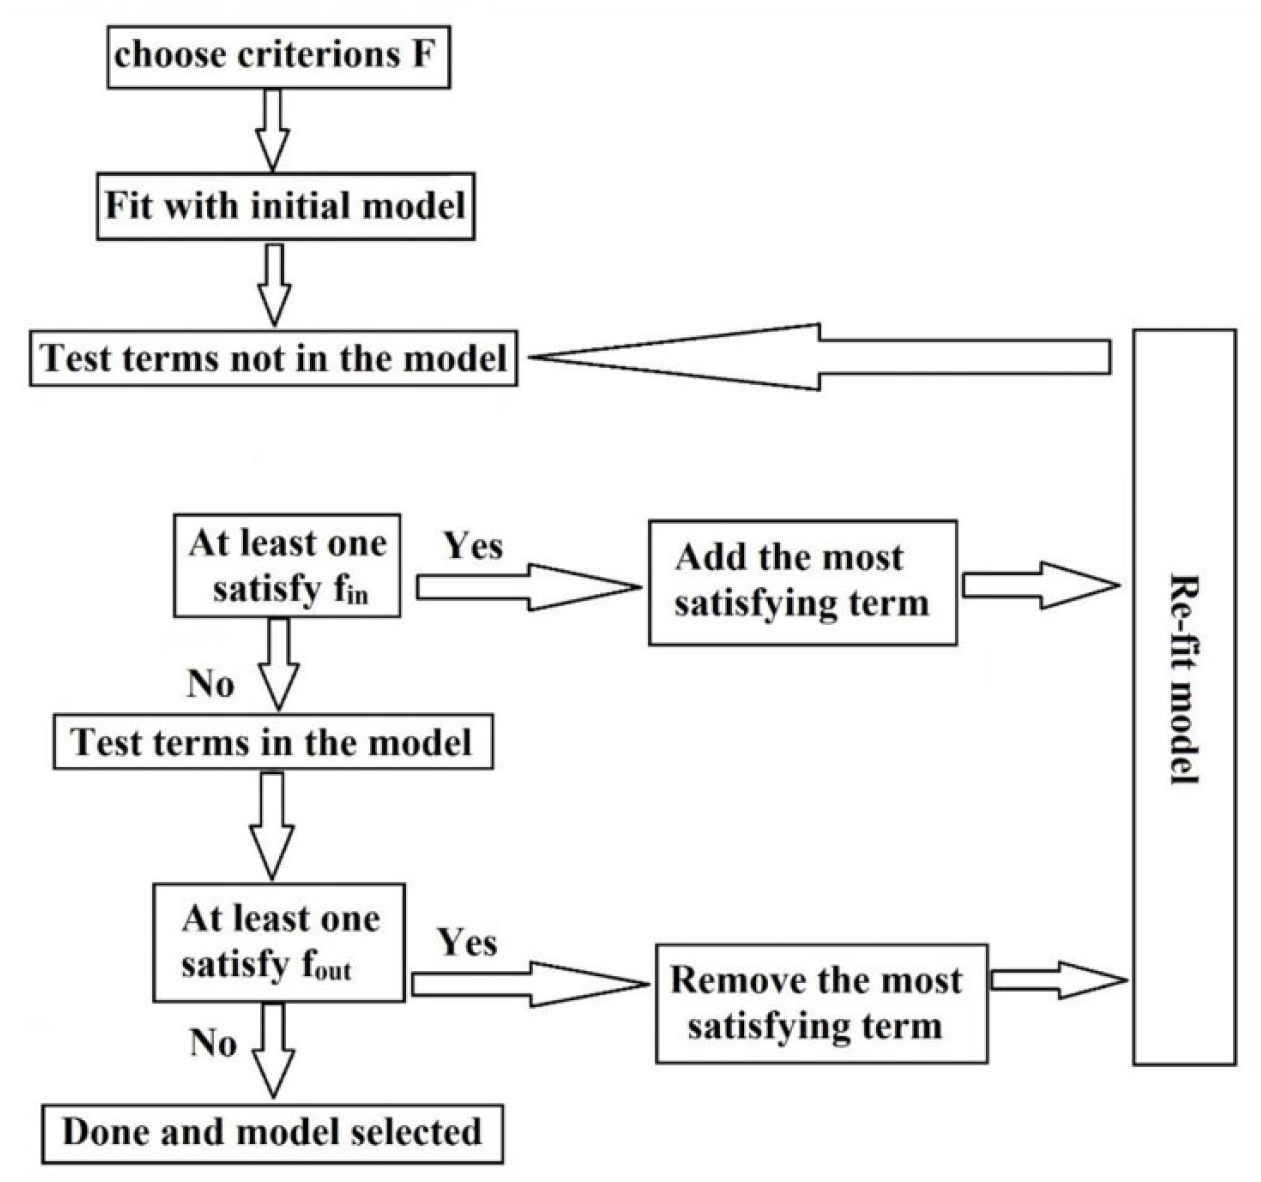
Schematic of the stepwise regression method.
ANOVA results for the dimensionless model derived by stepwise regression.
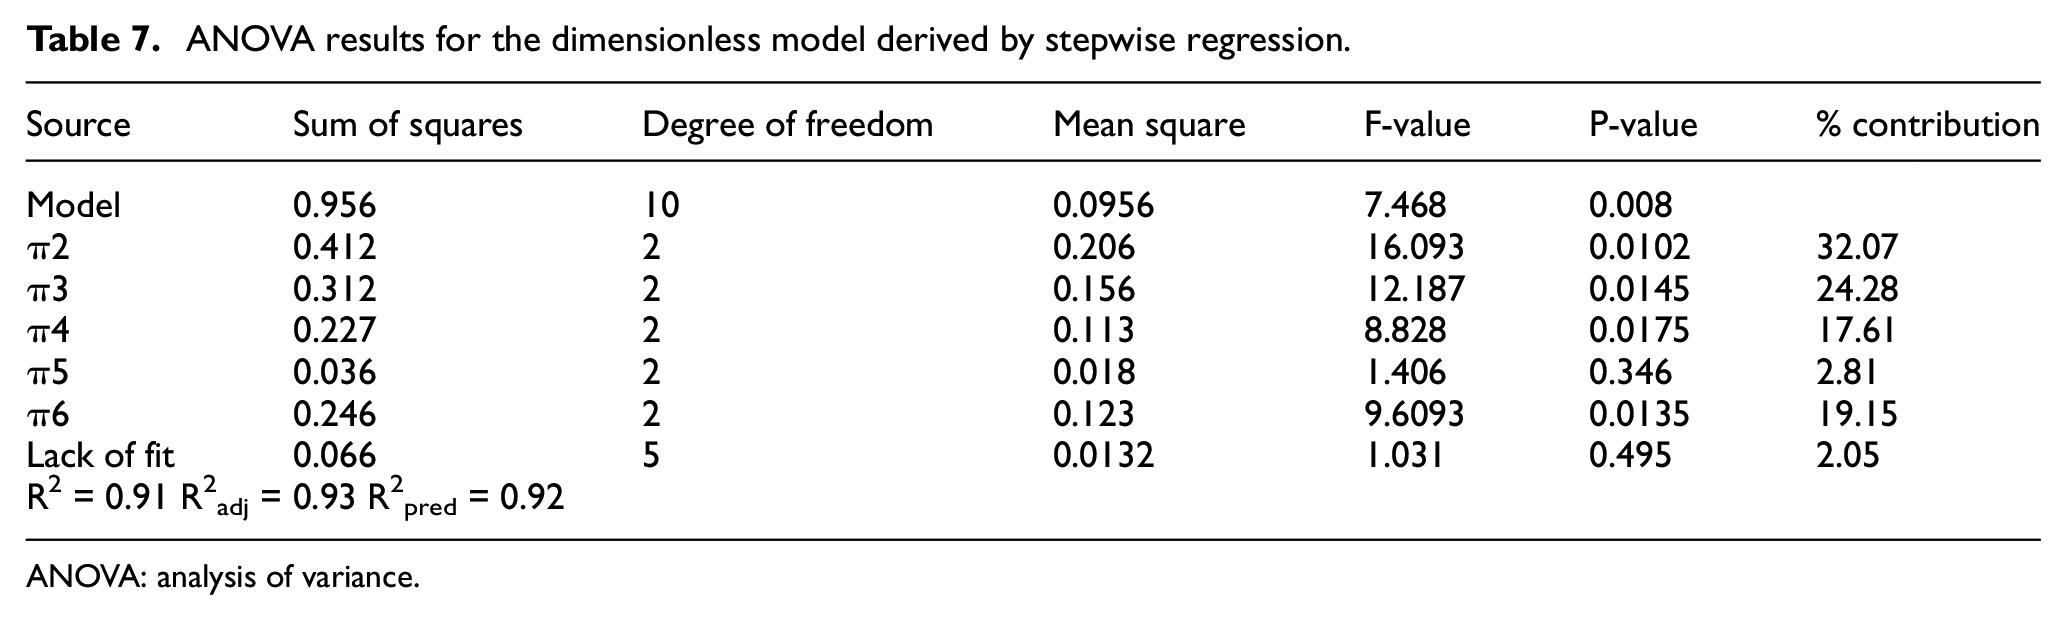
ANOVA: analysis of variance.
The correlation coefficient of the obtained model with stepwise regression is more reliable which is given in ANOVA Table 7. Consequently, as shown in equation (26), dimensionless numbers π2, π3,π4,π6 from group 1 remained in the regression model. The associatedP-value of less than 0.05 for the model (i.e. α = 0.05 or 95% confidence level) indicates that the model terms are statistically significant. It can be seen in equation (26) that dimensionless number π4 has been eliminated from the final model because of its insignificant P-value (P-value > 0.05). Also it is inferred from ANOVA table that dimensionless number π2 is the most significant factor that affects the dimensionless response π1 which contains tearing force. Another factor in Table 6 is the contribution percent that is resulted from F-value. Larger values of contribution indicate that changing in the corresponding parameter will have a large impact on the response variable. 15 In other words, more contribution to an input parameter leads to more effectiveness for the response factor. It can be seen from Table 7 that dimensionless parameter π2 that specifies the ratio of t/D is the most contributed and dimensionless parameter π5 that calculates the r/D that has the lowest contribution to the response factor π1, which contains drawing force

Confirmation run
According to Table 5, in order to verify the developed model, nine confirmation experiments were performed and the results of the experimental tests were compared with the proposed dimensionless model. The input parameters have been selected different from those in simulation to carefully evaluate the proposed dimensionless model. It is inferred from Figure 6 that the developed dimensionless model with an 8.8% mean error has good precision in the prediction of drawing force in deep drawing of round cups. The round drawn cups are shown in Figure 7 for three scales.
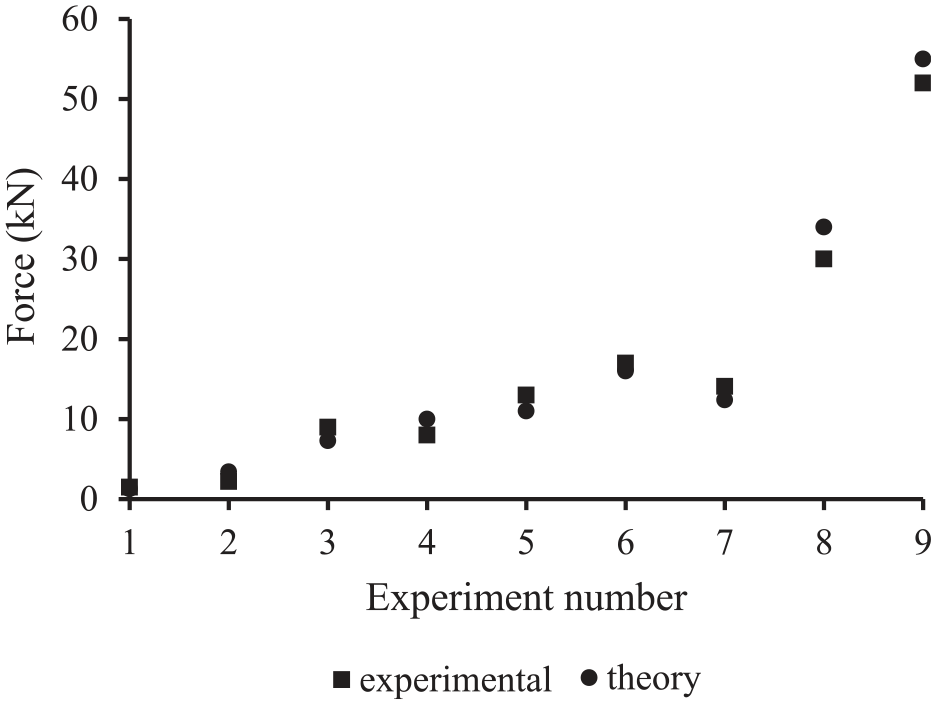
Drawing forces obtained from the experimental results and the proposed dimensionless relation.
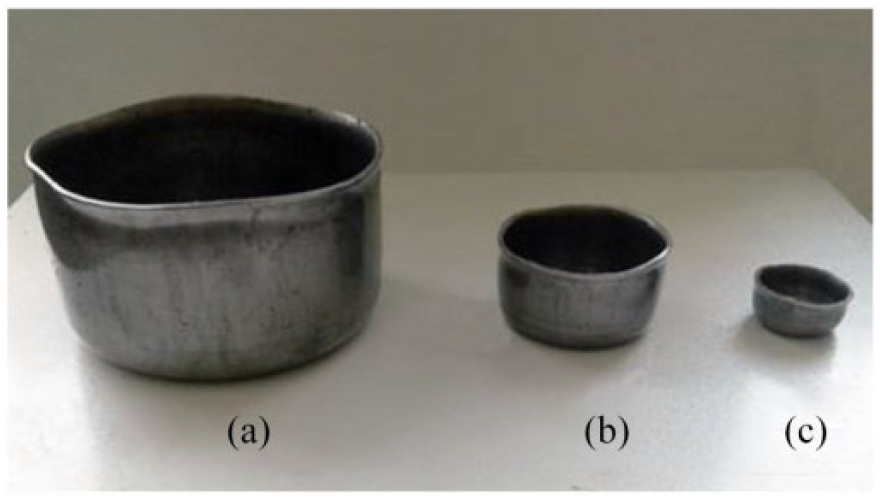
The cross-sections for three scales of formed round cups (a) scale 4:1 (b) scale 2:1 (c) scale 1:1.
Analysis of dimensionless parameters
As indicated by acquired outcomes, comparison of experimental results with Π-Buckingham theory, demonstrated that the proposed dimensionless models have high precision to estimate drawing force at tearing moment without simulation and experimental tests. According to ANOVA results, the π2 dimensionless parameter, which indicates proportion t/D, can be utilized as effective dimensionless parameters to evaluate drawing force from small to large scale which is appeared in Figure 8.
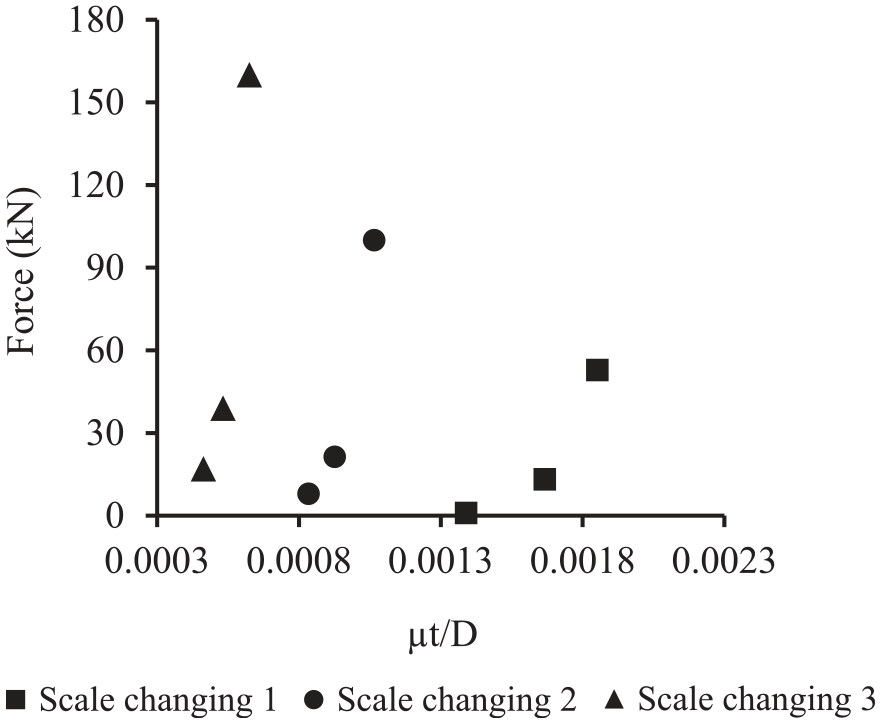
Effect of dimensionless parameter t/D on drawing force for different scales.
As shown in Figure 8, changing in drawing force in different scales requires changing in geometric proportions to produce the sound part. For example, when the drawing force for a sound part in scale 1:1 is measured, according to the similarity law, if the blank thickness for the next scale is doubled, the blank diameter, is changed similarly for maintaining the proportion of t/D. On the other hand, because of the high effect of friction coefficient on drawing force, it can be considered for determining the appropriate geometric parameters. It is shown in Figure 8 that when the dimensionless number μt/D increases, the drawings force increases. This effect can be explained only by the changing coefficient of friction. Since the dimensionless ratio t/D is similar for different scales, changing in the drawing force is influenced only by the coefficient of friction. Since the coefficient of friction in dry contact condition is affected by the contact area and normal stress, changing the small scale to a large scale leads to the coefficient friction increasing. Therefore, since the coefficient of friction between die and sheet has an important effect on drawing force, increasing it leads to increasing in drawing force for larger scales. Therefore, it is inferred from Figure 8 that for all the scale changing which is defined in Table 5, increasing μt/D leads to increasing in the drawing force. According to Table 5, it should be noted that scale changing contains the geometrical parameters, which is changed based on the similarity law.
According to similitude, in order to produce sound cups in different scales, scale changing that is lead to drawing force changing, requires changing in geometric ratios. For example, when the force for a sound part of scale 1:1 is 9.8 kN, if the thickness of the next scale changes from 1 to 2 mm, according to the similarity law, to maintain the ratio of thickness to the sheet diameter and to ensure that the sheet is properly drawn, the diameter of the blank should increase by 2 times. As shown in Figure 9, changing blank diameter from 108 to 150 mm, 60 to 83 mm for punch diameter, and 1 to 1.4 mm for sheet thickness, leads to about 29 kN drawing force which it concludes that it is well estimated based on proposed dimensionless model in comparison with 33 kN resulted by additional experimental tests, which is designed in new scale by the new geometrical parameters like 150 mm for blank diameter, 83 for punch diameter and 1.4 mm for sheet thickness. So, it can be expressed that for the same material in larger scales, the value of geometric parameters and drawing force can be estimated with good accuracy by smaller geometry based on proposed dimensionless model. It should be noted that the dimensionless parameters π2 and π3 that contain geometrical parameters like sheet thickness, punch diameter and blank diameter are considered as more effective input variables for the experimental tests the results of which was shown by ANOVA in Table 7. Therefore, these geometrical parameters are selected as the input variables for Figure 9.
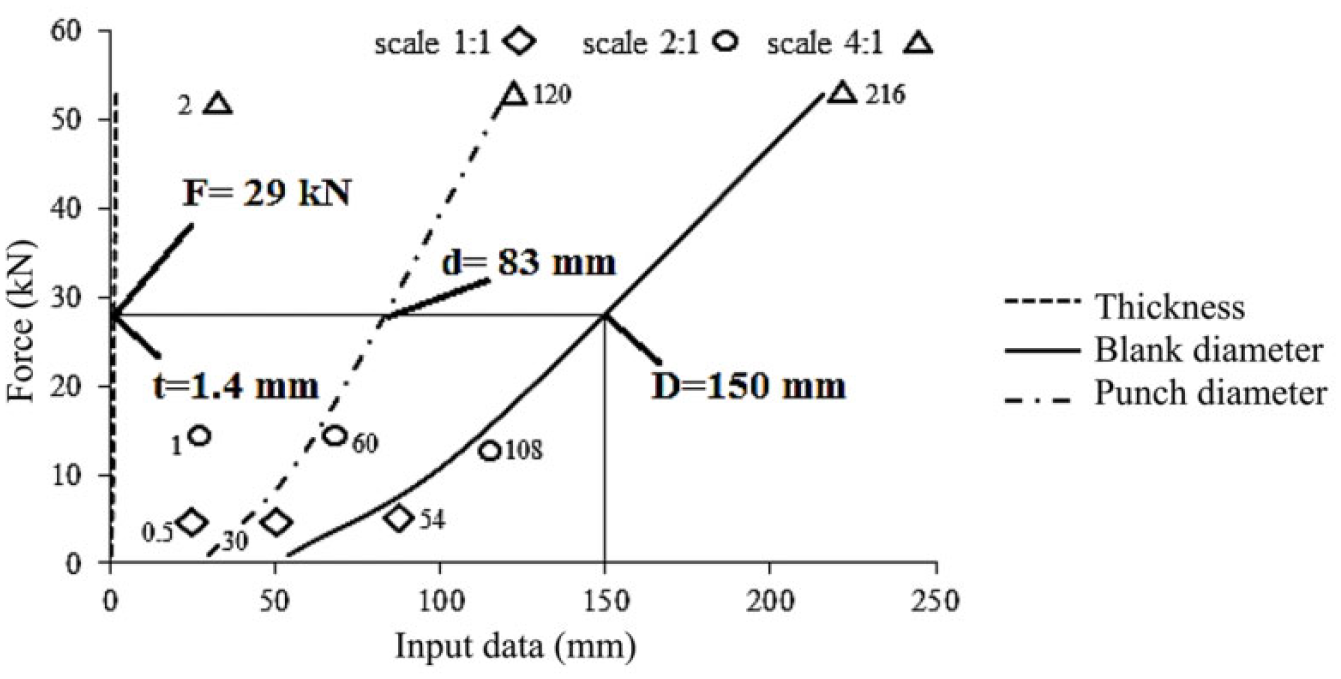
Determination of drawing force by the geometrical parameters in different scales based on the dimensionless parameters used in the proposed dimensionless model.
Generalization
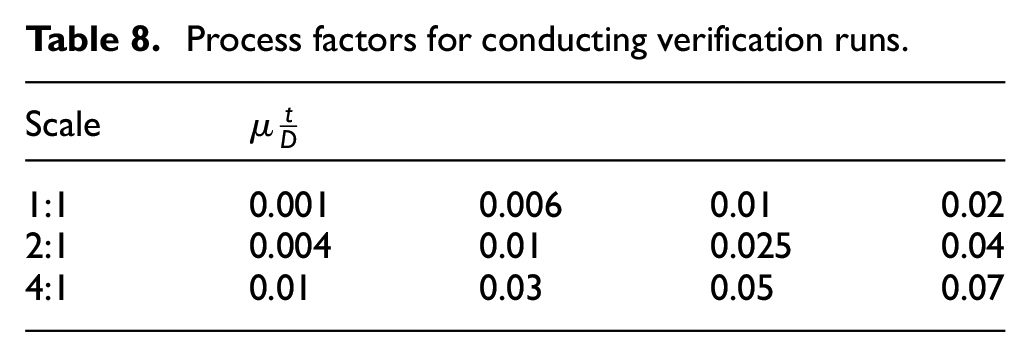
In order to investigate the generalizations of proposed dimensionless analysis and dimensionless models, the parameter t/D was considered for generalizing by simulation. The values of these parameters were selected out of the range of experimental design which is appeared in Table 8. The predicted values for verification in all three scales are precisely along with the trend of graphs as shown in Figure 10. Likewise, as indicated by the confirmation, it is possible to generalize the analysis with good precision in each scale, to estimate drawing force and appropriate geometric parameters.
Process factors for conducting verification runs.
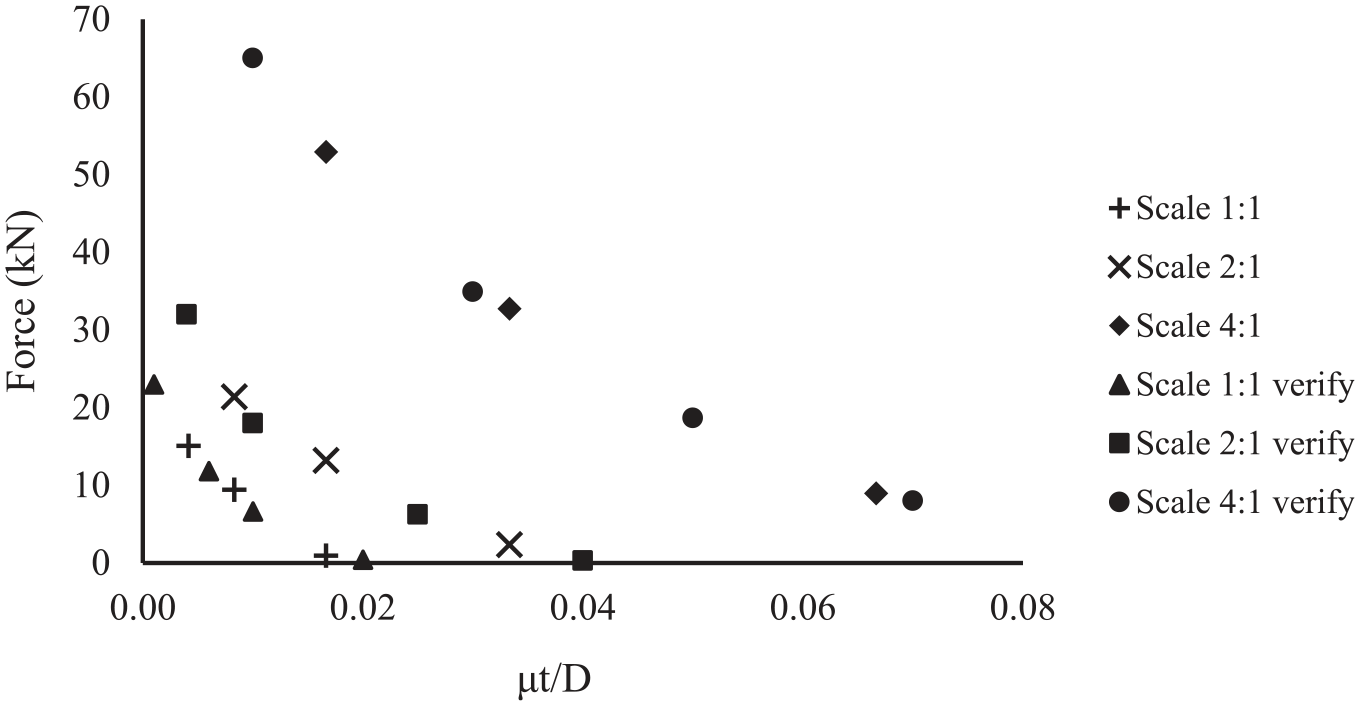
Generalization of the proposed dimensionless model by simulation.
Conclusion
The current investigation mainly involves a dimensionless analysis based on Π-Buckingham theory which is developed by simulation and experimental design for deep drawing of the round cup. The empirical models were derived by stepwise regression to predict drawing force and evaluation of dimensionless factor in different geometrical scales. To derive these models, some input and output data used for simulation. Derived empirical models were evaluated by experimental data. Finally, in order to show the ability of proposed models to predict drawing force, generalization by FEM simulation and some out of scope data were done. From the research study the following conclusions can be counted herein:
It has been shown by Π-Buckingham theory that diverse dimensionless groups, in which every one of them contains various dimensionless parameters, can be utilized for predicting deep drawing force.
The correlation coefficient of dimensionless models for each group which was obtained by simulation showed that there is no adequate confidence for all the specified dimensionless on drawing force prediction.
It was determined that dimensionless parameters with more than 90% correlation coefficient can be valid for predicting drawing force. The results of ANOVA and the validation experiments confirm that the proposed dimensionless model shows good accuracy with an average error of less than 9% in predicting drawing force for round cups.
By the ANOVA results, the dimensionless parameters t/D, d/D, R/D and friction coefficients are majorly significant. It was also shown that dimensionless ratio t/D is the most dominant dimensionless parameter for estimating the drawing force.
The results of the dimensionless analysis and proposed dimensionless models have excellent capability for generalizing which was verified by simulation. Therefore, it can be said that geometric values in larger scales can be estimated with good precision by smaller scales for the same material.
Finally, it is worth to mention that the dimensional analysis tool applied in the present study has given a general outline of drawing force estimation for correlating the laboratory studies on the actual industrial scale.
Footnotes
Declaration of conflicting interests
The author(s) declared no potential conflicts of interest with respect to the research, authorship, and/or publication of this article.
Funding
The author(s) received no financial support for the research, authorship, and/or publication of this article.