
Abstract
An experimental study to understand the characteristics related to chatter occurrence in micro-milling operations is presented. Accelerometers are used to measure the vibration signals in the machining process. The acceleration signals are then analysed in the time domain and the frequency domain. Along with the onset of chatter, it is found that there is a characteristic shift of the dominant frequency components in addition to the change of vibration amplitude. A modulation of the spindle frequency around the chatter frequency is also found to be present in the vibration signal. A dimensionless chatter indicator based on revolution root-mean-square values is designed and used to evaluate the stability of the micro-milling process. It is shown that the proposed indicator provides a simple, but effective way to detect chatter onset.
Introduction
There is an increasing demand for the manufacturing of miniaturized devices or components for use in medical, aerospace, automotive, electronic, and communications industries. Advanced machining techniques are required in order to achieve the tolerances and feature sizes at the micro and nano scales. Mechanical micro-machining, typically within 1000 µm in the dimension of part geometrical features, is a flexible way of producing high-precision three-dimensional (3D) micro-parts at high processing rates on a broad range of materials that non-traditional technologies, such as laser machining or electro-discharge machining, cannot achieve.1–3
However, micro-machining, especially micro-end-milling, may encounter problems in chatter vibration. Due to the decreasing stiffness of the tool with decreasing diameter size, small end-mills have a low resistance to forces and torques. The cutting edge ploughing or rubbing and the elastic deformations of the tool and workpiece can lead to the onset of vibrations and chatter.4–6 Chatter is the most detrimental for the surface quality and machine tool safety. The occurrence of chatter leads to poor surface finish and increased tool wear rate, and may even damage the cutting tool. Liu et al. 7 found that plastic and elastic deformations are the main challenges encountered in the micro-machining with thin wall features, and distortion or broken may take place easily if the process is not optimized and precisely controlled. Problems related to the process dynamics in micro-milling have also been reported by other researches.8,9 Vibration control has been regarded as one of the most demanding requirements for the high-end micro-milling machine tools by leading machine developers such as KERN. 10
Chatter in machining is attributed to the regeneration of the chip thickness during the cutting process.11,12 Due to the dynamic interaction between the tool and the workpiece, each tooth of the vibrating tool leaves behind a wavy surface, in which undulations can be generated when the following tooth is engaged in cutting. The structure and the cutting process are involved in a closed loop, and such a closed loop dynamic cutting system can become unstable under some cutting conditions when chatter occurs. 13 Dynamic instability in micro-milling operations is a well-acknowledged fact. In micro-milling operations, very high spindle speeds are needed. The dynamics of the spindle at a high rotational speed vary due to centrifugal and gyroscopic effects that affect chatter. 14 The key factors contributing to the process instability also include the size effects and the effective large negative rake angles, the existence of minimum chip thickness, and thus the significant ploughing and the elastic recovery of the workpiece. Since the uncut chip thickness is very small which is in the same scale as the cutting edge radius and the material grain size, side effects are significant that can result in a large negative rake angle and an increased specific energy required. When the uncut chip thickness is less than a minimum chip thickness, no chip can be formed and the work material is ploughed instead. Elastic recovery of the workpiece generates significant amount of friction and leads to increased process damping. 14 Contrary to macro machining cases, the feed rate will have an influence on chatter due to the elasticity of the workpiece. 11 Jun et al. 15 proposed a dynamic micro-end-milling cutting force model in which the micro-end-mill was modelled as a rotating Timoshenko beam to take into consideration the effects of rotary inertia and gyroscopic moments. Afazov et al. 16 presented a micro-milling chatter model, with some nonlinearities of the cutting forces considered. Nevertheless, due to the above-mentioned dynamics and cutting coefficients change during micro-milling operations, an accurate prediction of chatter stability is still very difficult.12,14 It is difficult to experimentally measure the tool tip dynamics using conventional impact hammer testing. 9 Shi et al. 17 reported that the chatter frequency in a micro-milling process, which is located in the resonance range of the system, could be near or relatively far away from the natural frequency, depending on the spindle speed. The chatter frequencies are strongly affected by the high process damping caused by the size effects, tool clamping conditions, shank length of micro-milling cutter, and so on. In addition to the optimization of the process parameters, online detection of the onset of chatter is very important to realize active chatter suppression and for automated manufacturing systems to attain high productivity and high-quality machining. It has been suggested that chatter, tool wear, monitoring, and work handling are the main issues that have not been sufficiently investigated in the micro scale. 11
This article presents an experimental study to understand the characteristics related to the chatter onset in micro-milling operations by analysing the vibration signals. A dimensionless chatter indicator based on the overall root-mean-square (RMS) value of the vibration acceleration for one cutter revolution (referred to as revolution RMS value) is proposed for online chatter detection. The experimental method, signal characteristics accompanying chatter onset, and the development of the chatter detection algorithm are introduced in the following sections.
Experimental method
A series of micro-milling experiments have been conducted to investigate the chatter onset and associated signal features. A 5-axis computer numerical control (CNC) machining centre, Deckel–Maho DMU-P60, was used in the tests. The cutting tools were carbide flat-end micro-milling cutters of 600 µm diameter with two flutes. The helix angle was 30°. The micro-mill was clamped in a baby chuck and attached to the spindle of the machining centre. The work material was American Iron and Steel Institute (AISI) 1040 carbon steel with a hardness of about 200 HV. It is one of the most commonly used materials in the design of mechanical products, and possesses relatively good machinability. The workpiece was prepared with a base and a rectangular block of length 60 mm, width 8 mm, and height 18 mm on the top. It was mounted on a Kistler MiniDyn 9256C2 dynamometer, and the dynamometer was clamped onto the work table of the machine tool. PCB accelerometers (model 352C65) were used in the experiments to measure the vibrations on the workpiece, as shown in Figure 1. Accelerometers are the most widely used vibration transducers. The 352C65 PCB accelerometer is a high-sensitivity, miniature (2 gm), ceramic shear ICP accelerometer. The sensitivity is 100 mV/g, with a frequency range (±5%) of 0.5 to 10,000 Hz. The resonant frequency ≥35 kHz. By mounting the two accelerometers on the workpiece along the x and y directions, respectively, the tool–workpiece vibration in the two directions can be detected by the accelerometers. The accelerometers were connected to a PCB 482C signal conditioner, and the measured vibration signals were acquired through a Prosig P8004 24-bit data acquisition system.
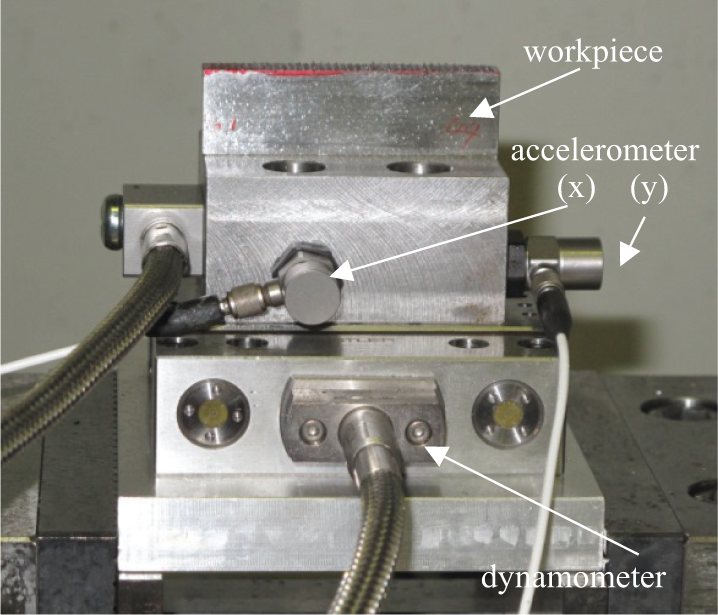
Setup of the workpiece and sensors.
A slot milling experiment was conducted. The feed rate settings were from 0.5 to 7 µm/tooth, which covered the most commonly used feed range in micro-milling. The spindle speeds used were from 10,000 to 16,000 r/min based on the spindle speed limit of the machine tool used. The axial depth of cut was fixed at 50 µm. The measured surface geometry of a cross-section of the machined slot is shown in Figure 2, which confirmed that the actual depth of cut was 50 µm. The tool feeding direction was horizontally towards the operator, which was denoted as x, and the direction horizontally to the right of the operator was set as y. The sampling frequency to acquire the acceleration and force signals was 10 kHz, which was chosen based on experience and was actually a trade-off between bandwidth and computational burden. The analysis presented in this article is mainly based on acceleration signals in x direction. Comparing with cutting force signals, vibration signals are more sensitive for chatter detection. The acceleration signals in y direction show similar trends.
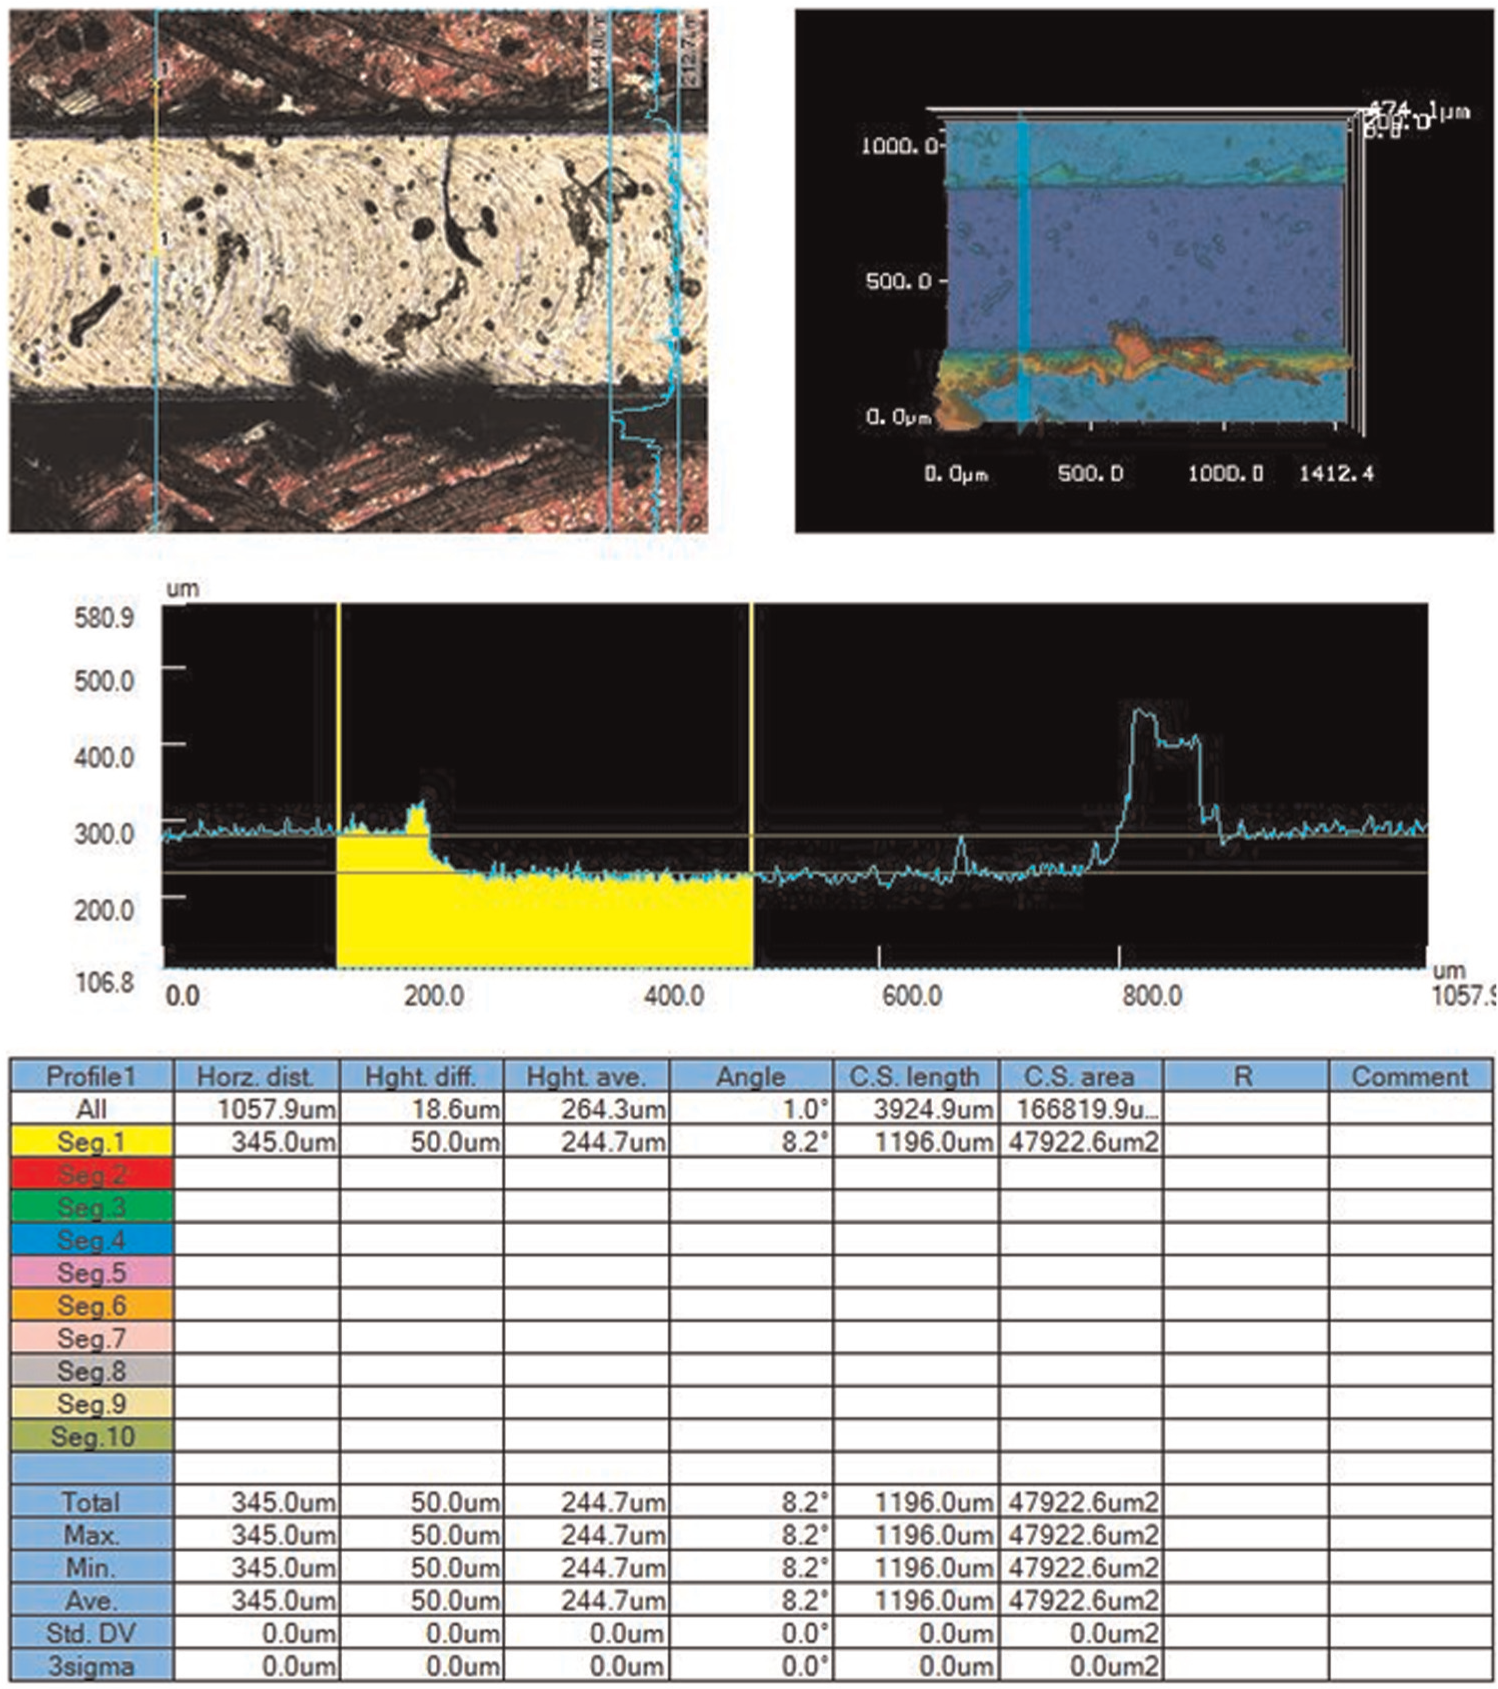
Measured surface geometry cross-sections of the machined slot.
Signal analysis
An overview of the time waveform of the recorded signals can reveal significant changes of the dynamic cutting process effectively. For the detection of chatter vibration, time waveform data prove to be reinforcing to spectrum. A recorded acceleration signal in the x direction for a stable cutting process without chatter is shown in Figure 3. The corresponding spindle speed was 14,000 r/min, and the feed was 2 µm/tooth. This plot clearly illustrates the starting and ending of the cutting, in which the arrow A at about 2.5 s indicates the starting of tool engagement in cutting, and the arrow B indicates the exit of the tool from cutting. The background vibration noise before and after cutting engagement was at a level of about 1 m/s2 in amplitude. A fast Fourier transform (FFT) of the background vibration showed the dominant frequency peaks near 233 and 467 Hz, as in Figure 4(a), which were actually induced by the spindle rotation at 14,000 r/min. The acceleration amplitudes increased to around 3 m/s2 during the cutting engagement. Figure 4(b) shows the FFT of the acceleration signal in this course. Comparing with Figure 4(a), the dominant frequency peaks were still the spindle frequency of about 233 Hz, and the tooth-passing frequency of about 467 Hz. But more frequency peaks appeared, mostly the harmonics of the spindle frequency and some components corresponding to structural resonance.
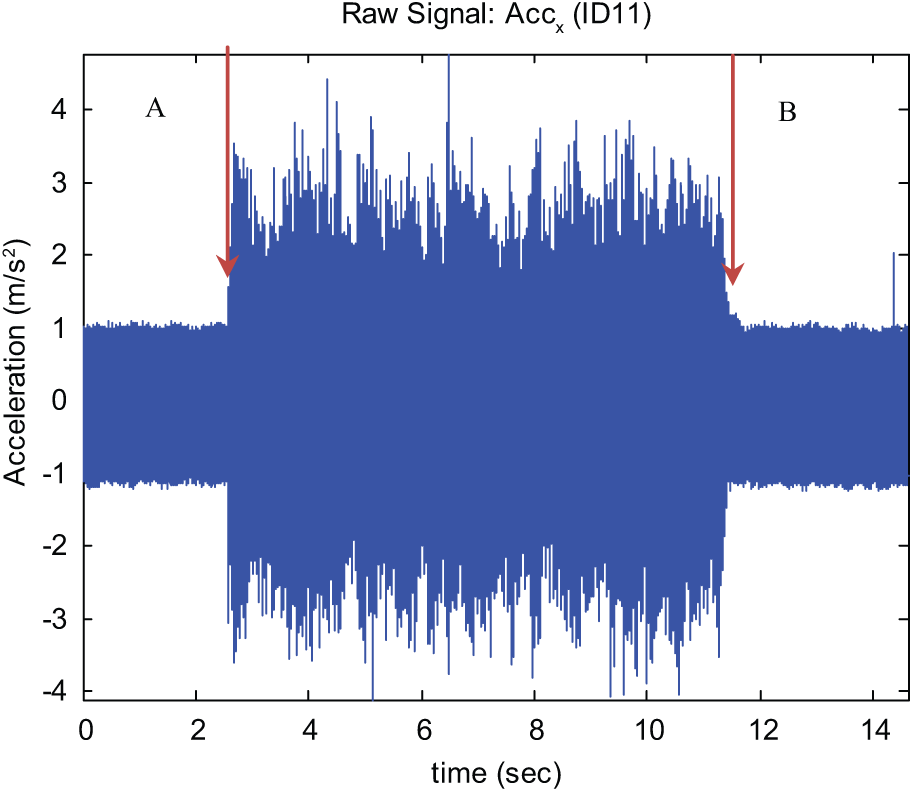
Acceleration signal in the x direction for a stable cutting process.
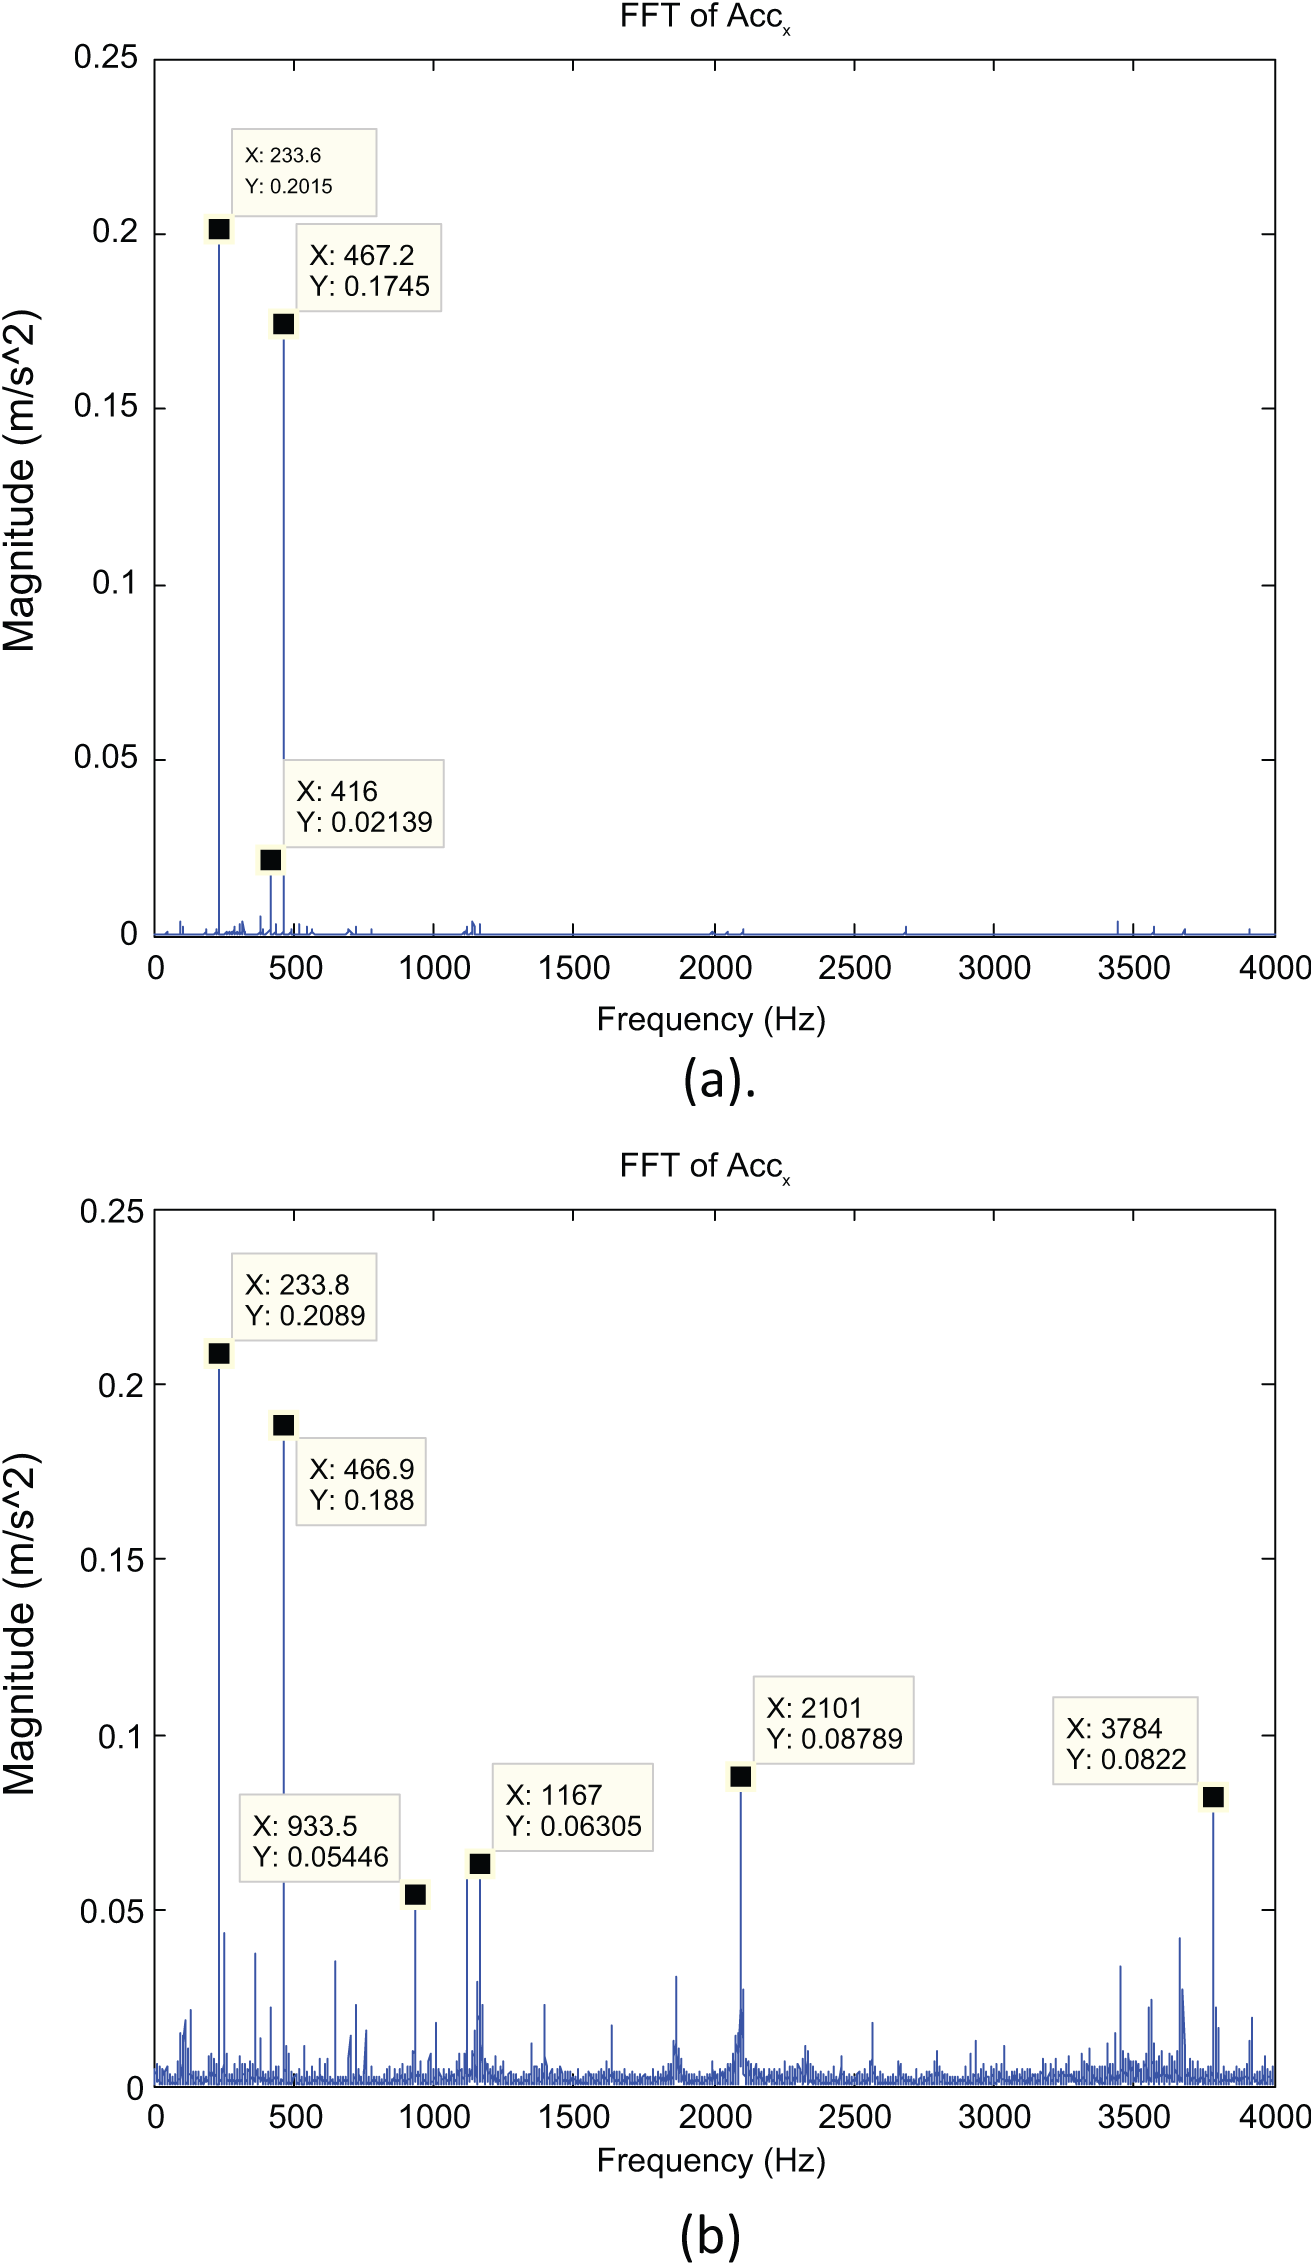
Frequency spectra of the acceleration signal as shown in Figure 3: (a) before cutting and (b) during cutting.
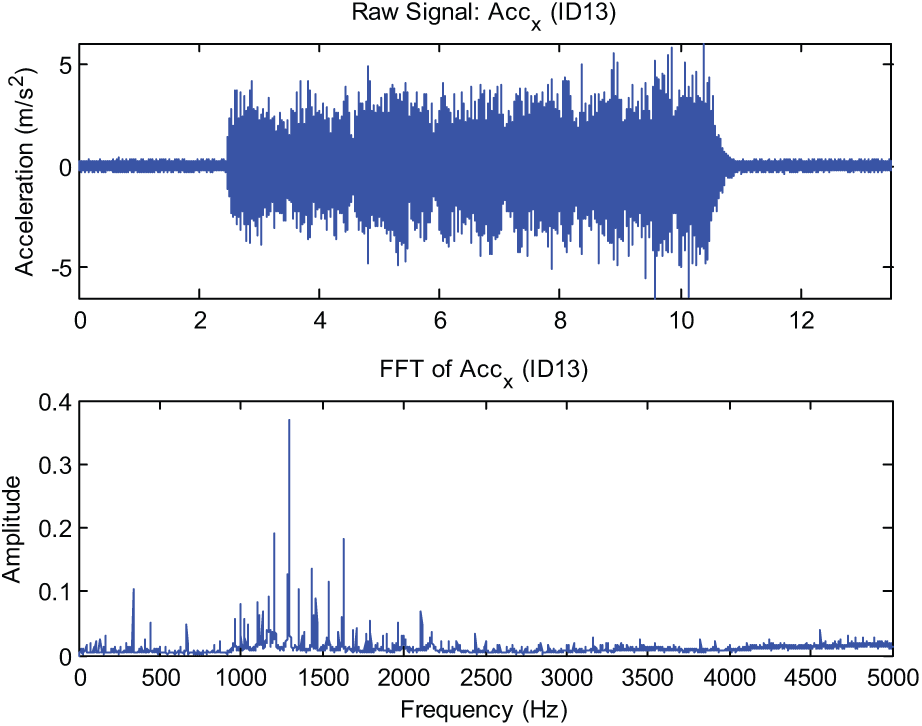
When chatter occurs, due to the significant increase of vibration level between tool and workpiece, it is reflected in the acceleration signals. There is an obvious augmentation of the amplitude, and a shift of the dominant frequency components away from the tooth-passing frequency. Figure 5 illustrates the time domain acceleration signal corresponding to a micro-milling process at the spindle speed of 14,000 r/min and feed of 1 µm/tooth, in which chatter occurred at about 12–13 s. It is clear that the self-excited vibration was violent. The vibration amplitude showed a significant increase of about 10 times higher. The frequency spectra of the acceleration before and after chatter occurrence are presented in Figure 6(a) and (b), respectively. The dominant frequency peaks before chatter onset, as shown in Figure 6(a), were at the spindle and tooth-passing frequencies. It was actually forced vibrations produced by a periodic cutting tooth engagement and spindle rotation. In Figure 6(b), when chatter occurred, the peaks at the spindle and tooth-passing frequencies were still there, where the magnitudes are roughly at the same level as before. However, it can be observed that the dominant frequency peaks are at 1093, 1327, and 1553 Hz. It shows a pattern of double sideband amplitude modulation. These frequencies are not harmonics of the spindle frequency or tooth-passing frequency. They are believed to be close to some resonant frequencies of the machine tool system related to the tool–workpiece interaction. As discussed in the literature review, direct measurement of the micro-end-mill dynamics is very difficult. Through impact testing, it was found that the first two modes of the tool–spindle system and the workpiece–fixture system are in the range of 900 to 2000 Hz. It is believed that frequency components in the range which are not harmonics of spindle frequency could be attributed to the structure resonance. It is interesting to note that the frequency spaces between the three dominant frequencies (1093, 1327, and 1553 Hz) are close to the spindle frequency of 233 Hz, which indicated strong modulation of the spindle rotation. Also, the high peaks indicated the associated high signal energy of the acceleration compared with the stable stage.
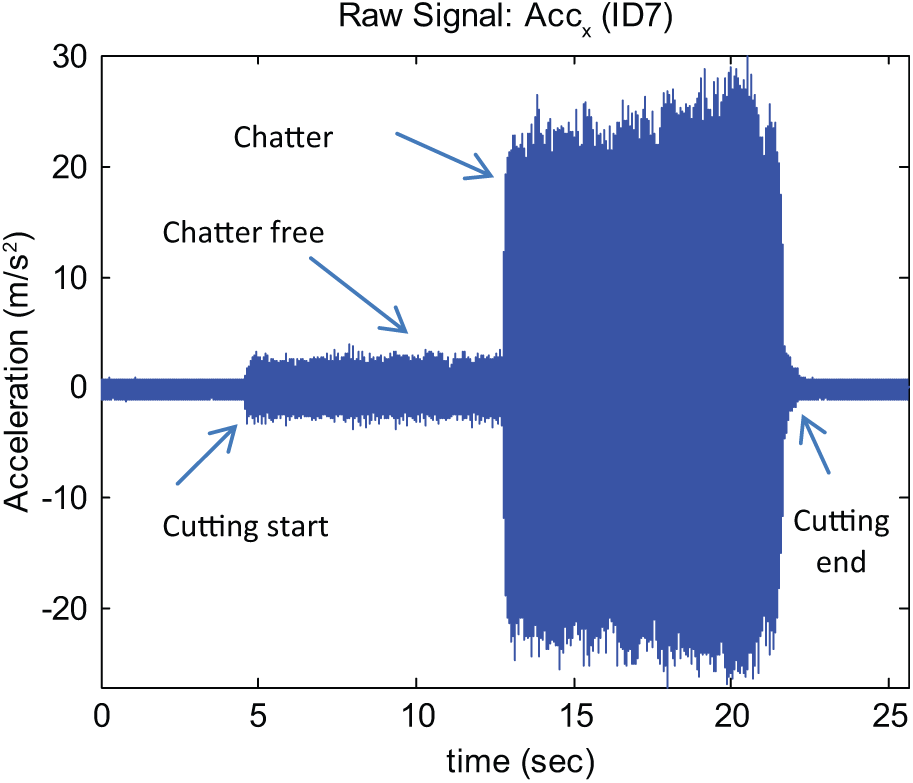
Acceleration signal with chatter occurrence.
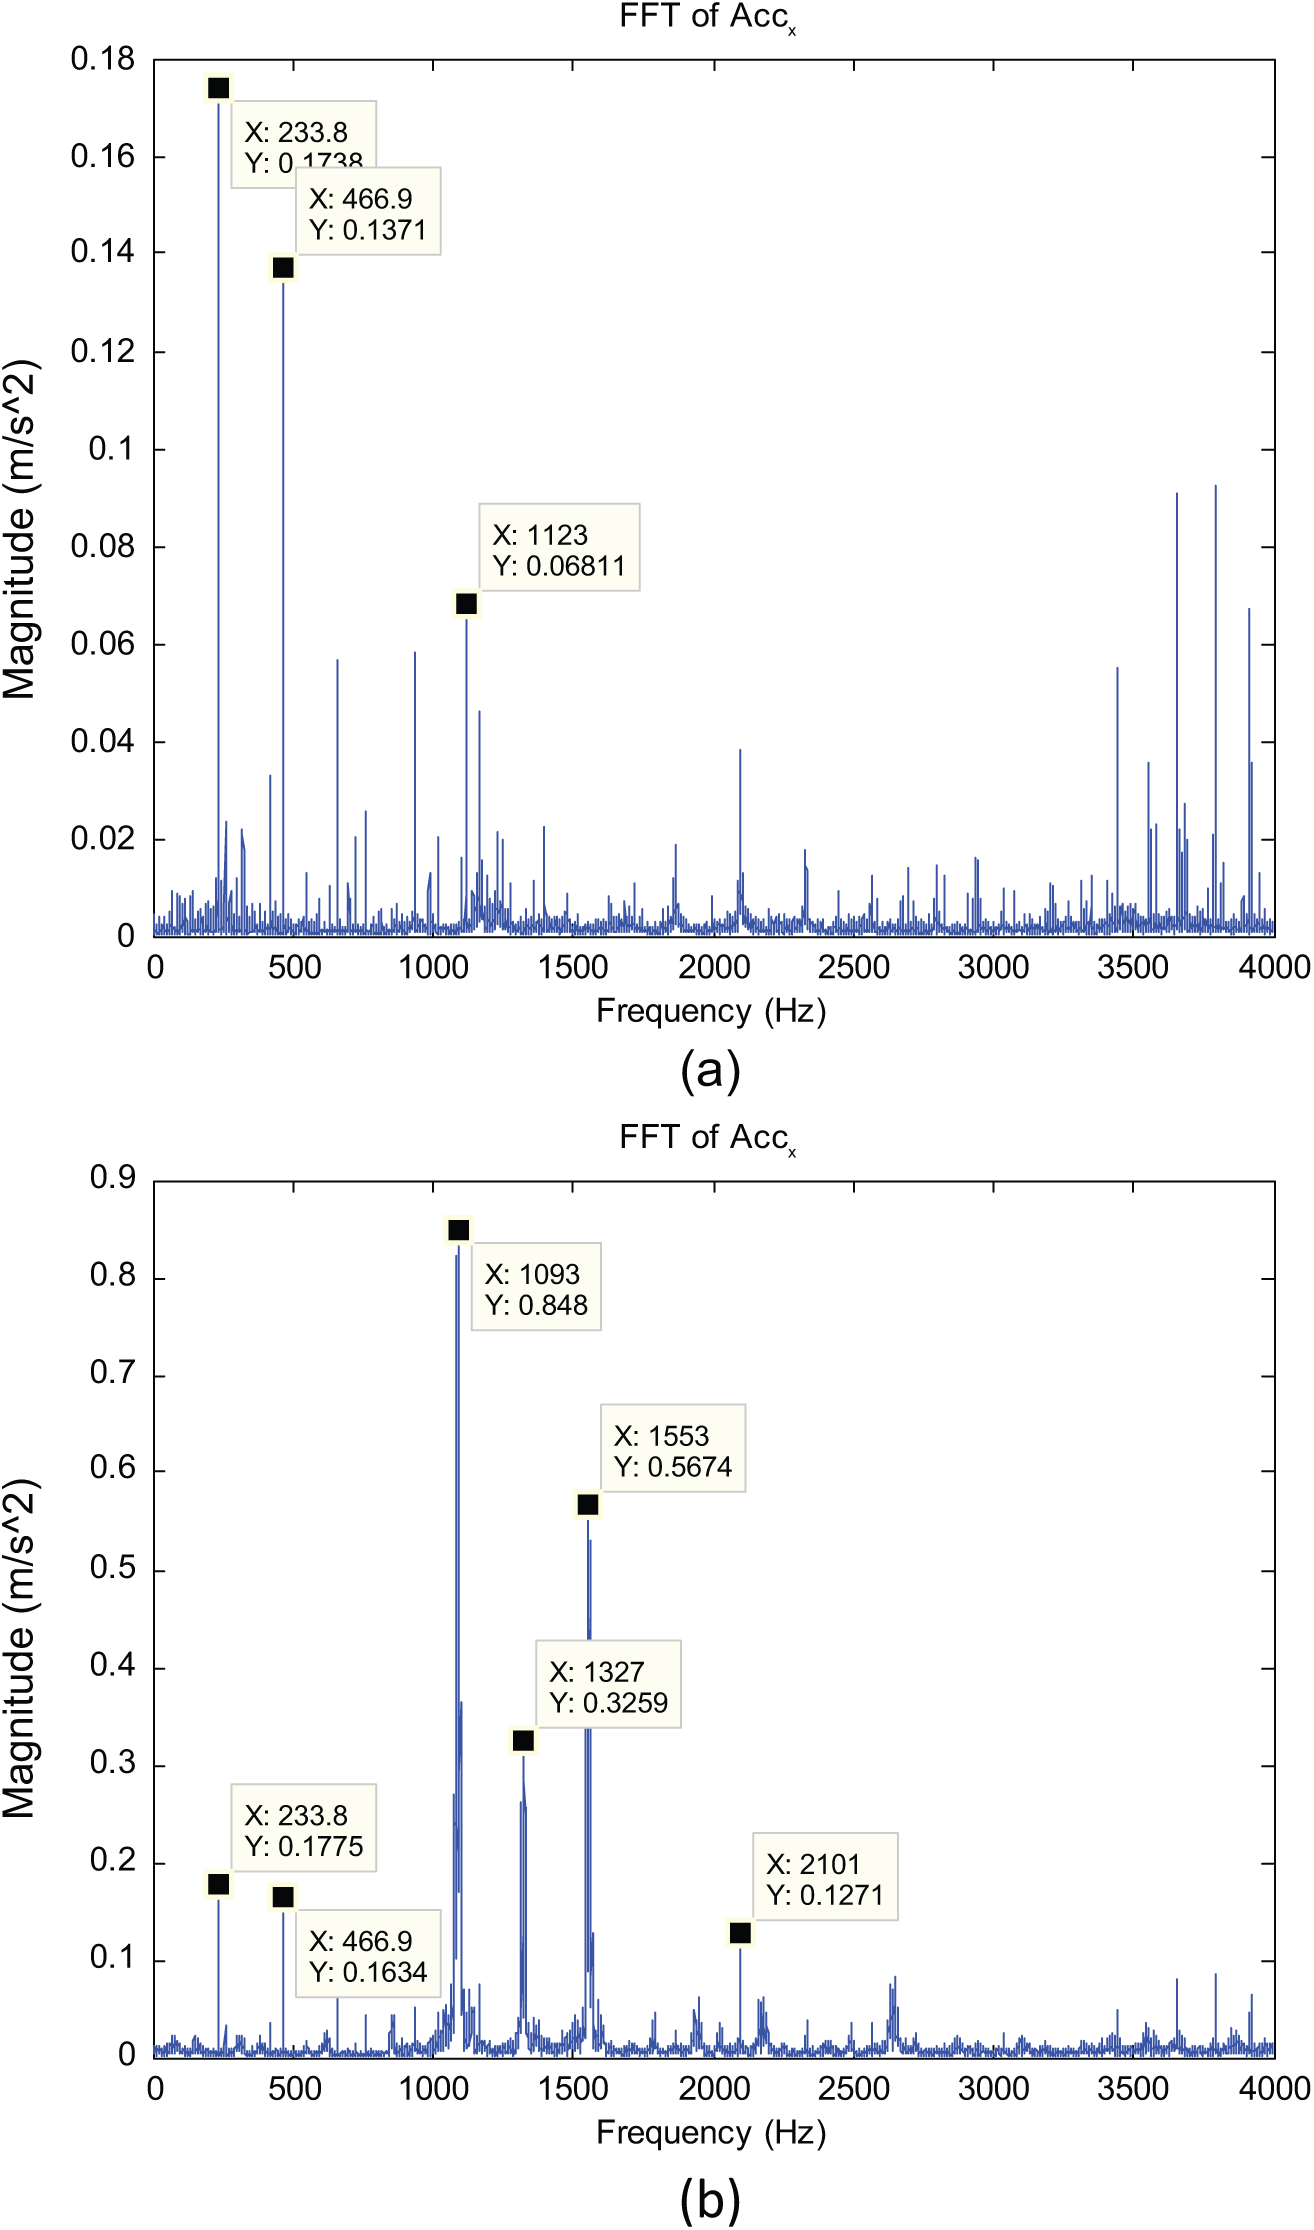
Frequency spectra of the acceleration signal as shown in Figure 5: (a) steady cutting stage and (b) when chatter occurred.
Modulation is a non-linear effect in which several signals interact with one another to produce new signals with frequencies not present in the original signals. The phenomenon of vibration modulation is caused by the fact that a high-frequency carrier vibration signal is varied by a low-frequency modulating vibration signal. As a result, the product of the modulating signal and the carrier signal could generate a modulating signal. In a micro-milling operation, when chatter occurs, which is believed to be caused by a self-excitation mechanism in the generation of wavy chip thickness during machining, a combination of the resonant frequencies of the workpiece/fixture and the spindle system will be excited and forms the carrier signal. The carrier frequency is generally higher than 1000 Hz. The modulating signal is the impact caused by the cutting engagement along with the tool rotation. Due to the existence of cutting tooth runout, tool/collet eccentricity and clearance, and the resultant high centrifugal force and uneven cutting, and so on, the frequency of the modulating signal is the spindle rotating frequency. Thus, the pattern of two sidebands and a carrier can be observed which is often called as double sideband amplitude modulation.
Figure 7 showed the acceleration signal with discontinuous chatter occurrence. The corresponding spindle speed was 16,000 r/min and the feed was 1 µm/tooth. In this case, chatter was fully developed at 7 s which can be clearly identified from the time domain waveform. Even before the fully developed chatter occurrence, there were already obvious variations of the acceleration amplitudes. It was not a region of fully chatter-free cutting, except for a small region in which chatter was developing. The frequency spectrum of the small or marginal region is shown in Figure 8(a). The spindle frequency (267 Hz) was still dominating, with obvious harmonics such as 1067 Hz (4X spindle), but the tooth-passing frequency was not significant. On the other side, substantial frequency peaks in the range of 1000–2000 Hz were observed, such as at 1098, 1365, and 1632 Hz, which also exhibited a clear modulation of the spindle frequency. It indicates the development of chatter before the fully onset. Under chatter onset, as shown in Figure 8(b), the dominant frequency components were at 989.6, 1257, and 1523 Hz, which was not the same location as in Figure 6(b). A clear modulation of the spindle frequency of 267 Hz was also observed. Meanwhile, the peak at the spindle frequency remained roughly at the same level.
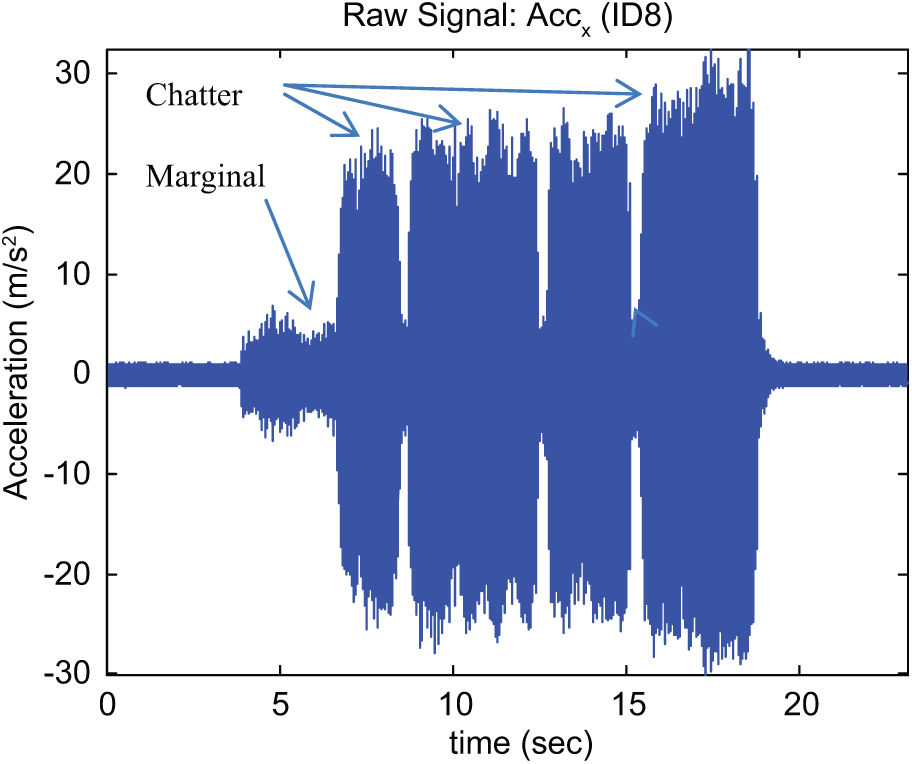
Acceleration signal with discontinuous chatter occurrence.
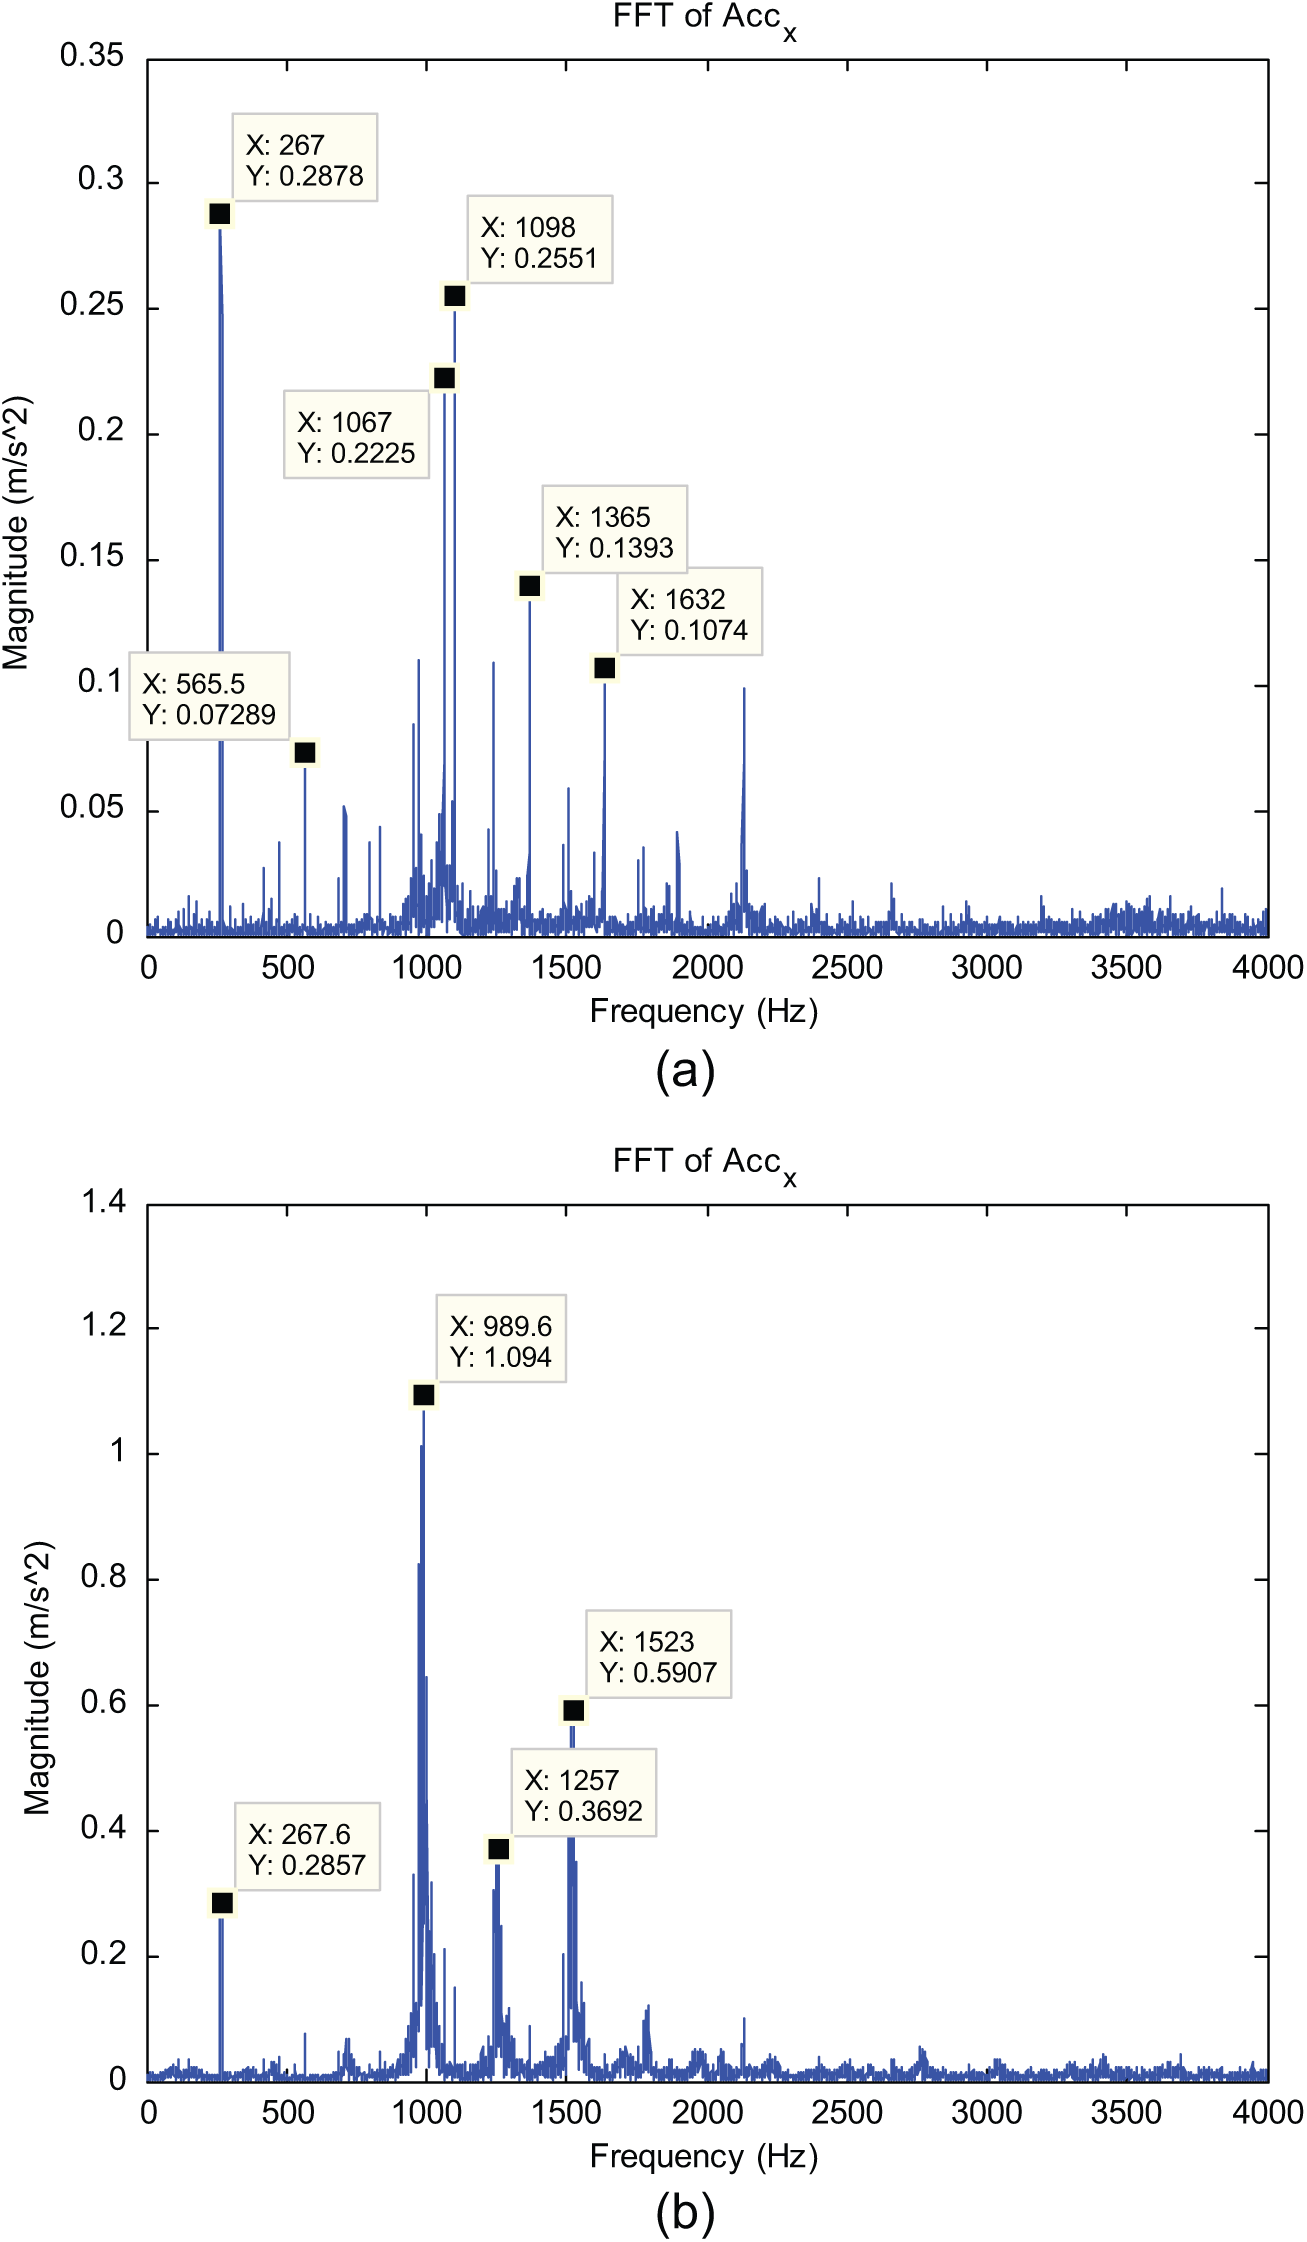
Frequency spectra of the acceleration signal as shown in Figure 7: (a) marginal region and (b) when chatter occurred.
The analysis reveals the vibration signal characteristics associated with chatter onset. There is a drastic increase of the vibration amplitude in the time domain, and the dominant frequency components are shifted from the spindle frequency, tooth-passing frequency and harmonics to chatter frequencies close to the resonant frequency related to the tool–workpiece dynamic system. A modulation of the spindle frequency around the chatter frequency is also seen. The wavelet packet transform (WPT) was also used to analyse the vibration signals with chatter onset. WPT is a generalization of wavelet decomposition that offers a richer signal analysis. It further decomposes the detailed information of the signal in the high-frequency region. Using the WPT, the time frequency composition of a signal can be determined, thus enables a good understanding of what is contained within the signal. 18 Figure 9 shows the wavelet packet decomposition of the acceleration signals with chatter onset under the cutting condition of 1 µm/tooth feed rate, 50 µm axial depth of cut, 14,000 r/min spindle speed in slot milling, which has also been analysed in Figures 5 and 6. The wavelet packet decomposition was conducted at level 3 using the DB4 wavelet and Shannon entropy. The chatter onset at about 13 s can be clearly identified in the WPT decomposition, especially in the packets of 8 and 10, where the significant increase of the vibration energy level in the frequency range of around 1000 to 2000 Hz was illustrated. Another case is shown in Figure 10 for the condition of 1 µm/tooth feed rate, 50 µm axial depth of cut, 16,000 r/min spindle speed in slot milling. It also demonstrates that WPT can be applied for the detection of chatter occurrence in micro-milling from the vibration signals. However, it should be noted that due to the constraints of the computational burden, the application of WPT for real-time chatter detection is still impractical. In view of this, a simple chatter indicator suitable for real-time chatter detection is proposed in the following section.
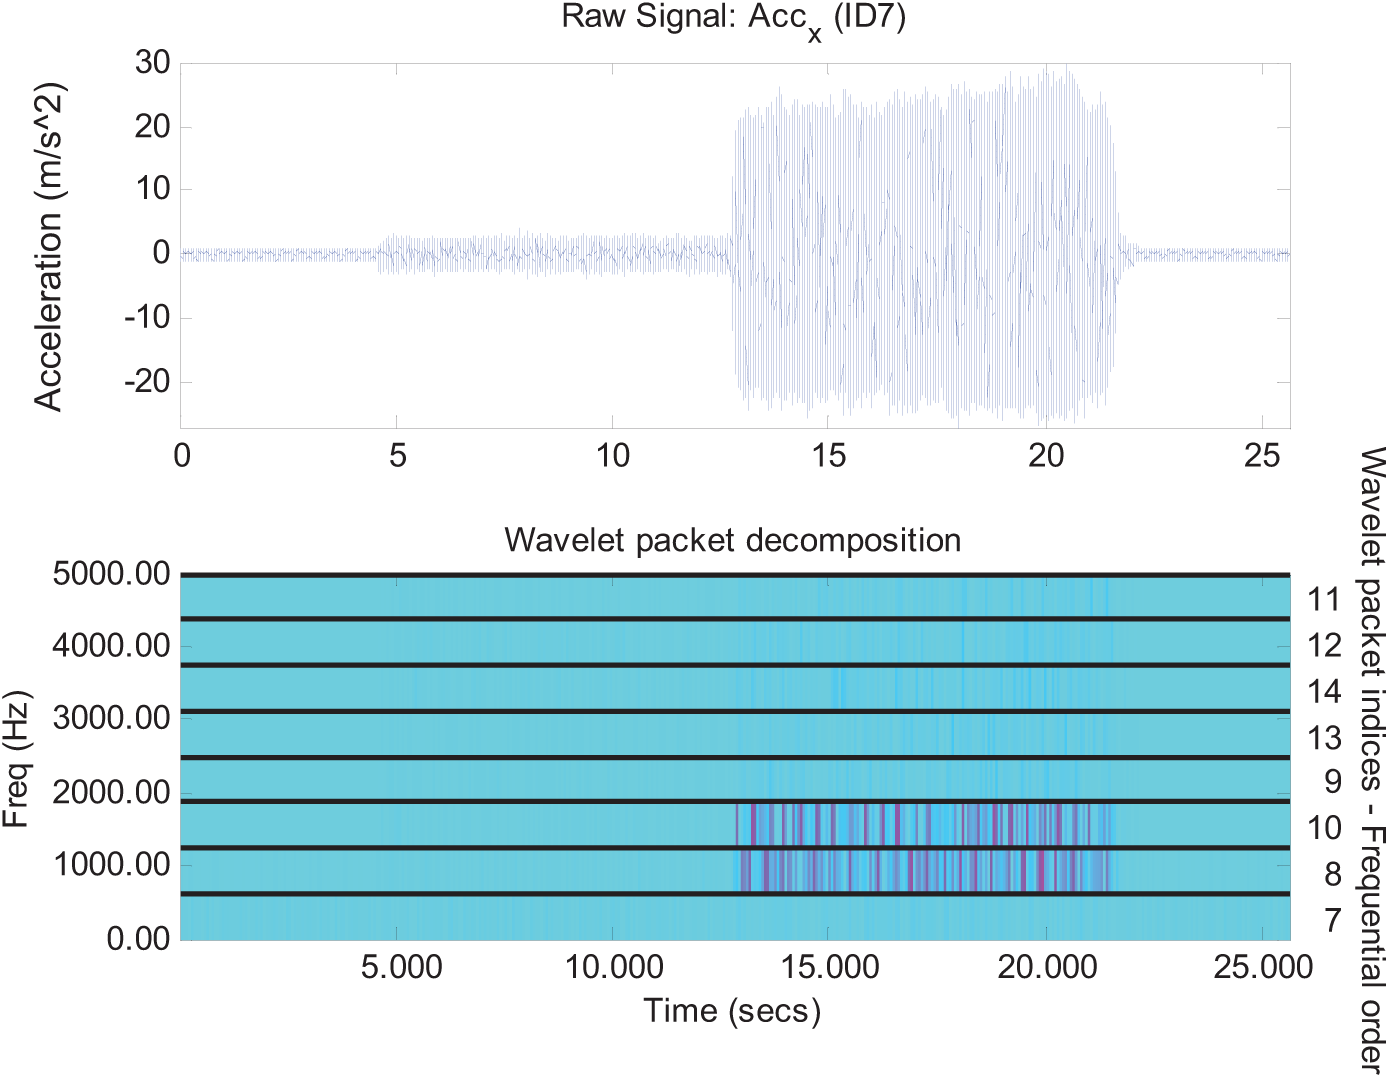
Wavelet packet decomposition of the acceleration signals with chatter occurrence.
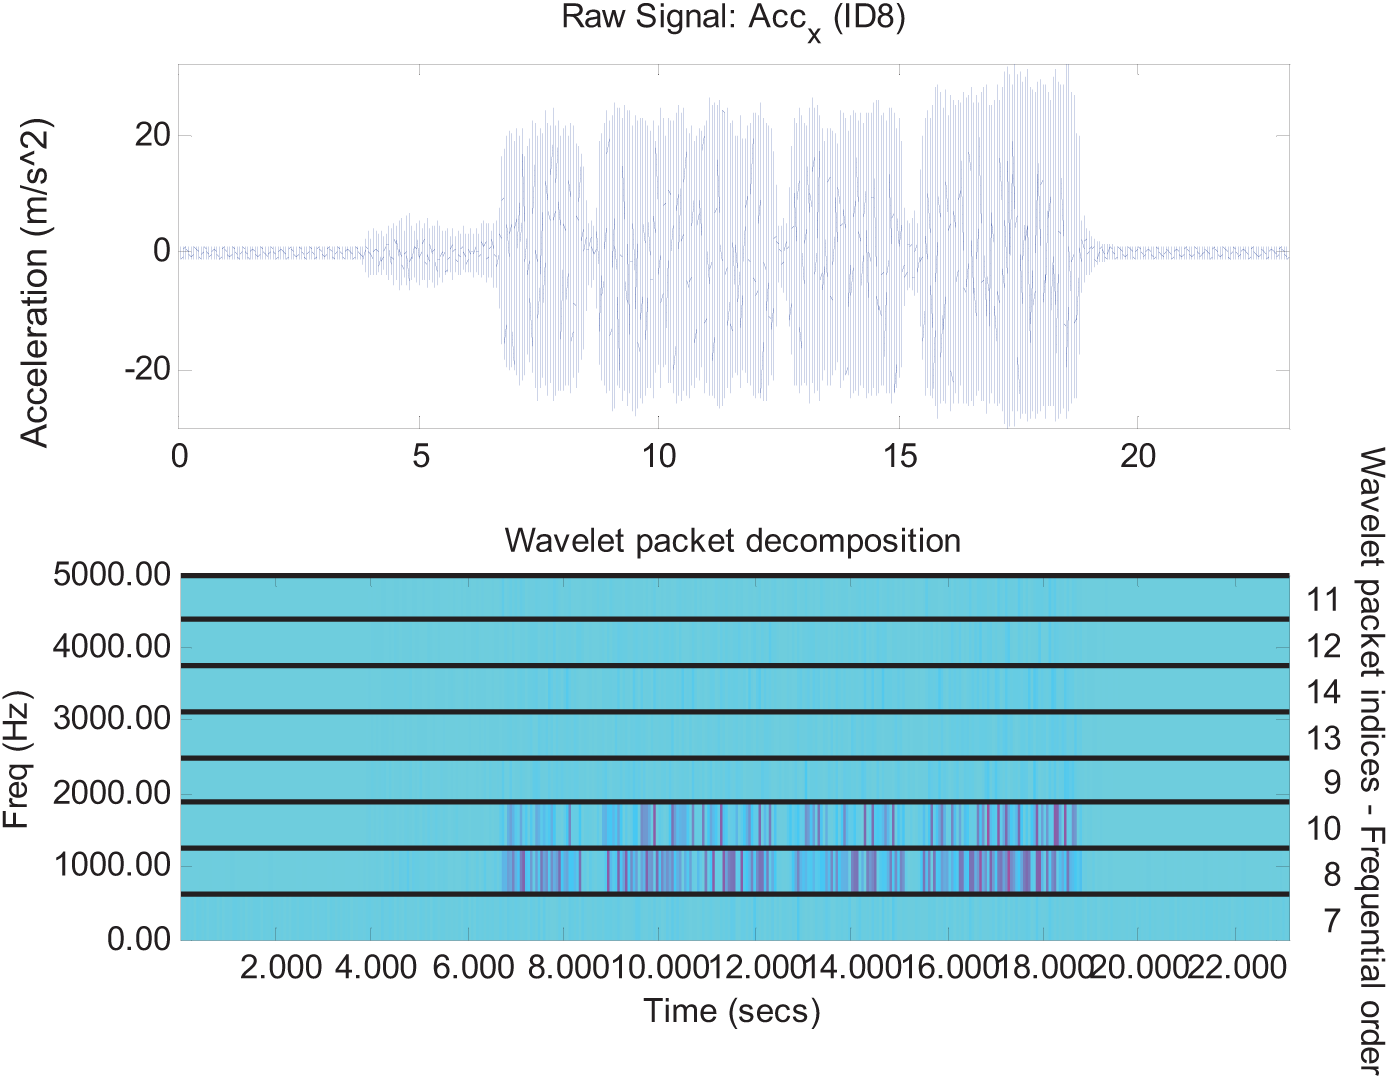
Wavelet packet decomposition of the acceleration signals with chatter occurrence.
An indicator for chatter onset detection
Under stable cutting conditions, the vibration should be stationary and is mainly excited by the periodic excitation of the tooth engagement in cutting. RMS value is frequently used to evaluate the vibration signals. It is an important measurement of the vibration level as it expresses the overall energy of a particular random vibration event. An evaluation of the overall RMS values under different cutting conditions for the 600 µm micro-mills is illustrated in Figures 11 and 12. Figure 11 shows the variation of RMS versus feed per tooth under different cutting speeds, while Figure 12 shows the trend of RMS versus the axial depth of cut. It is observed that distinctive high RMS values occurred for the feeds of 1 µm/tooth. For higher feed rate settings from 2 to 7 µm/tooth, the RMS values are relatively close and consistent. The high RMS values at low feed rate might be caused by the phenomena of minimum chip thickness and severe cutting edge effects when the undeformed chip thickness is very low. However, for another set of feed rate at 0.5 µm/tooth, the RMS values were not so high. In fact, the recorded vibration signals indicated the occurrence of chatter vibration for all the cutting conditions with the feed rate of 1 µm/tooth, which can be regarded as the main reason for the high RMS values. On the other side, the variation of RMS values does not show a clear trend along with the variation of the cutting speeds or depth of cut.
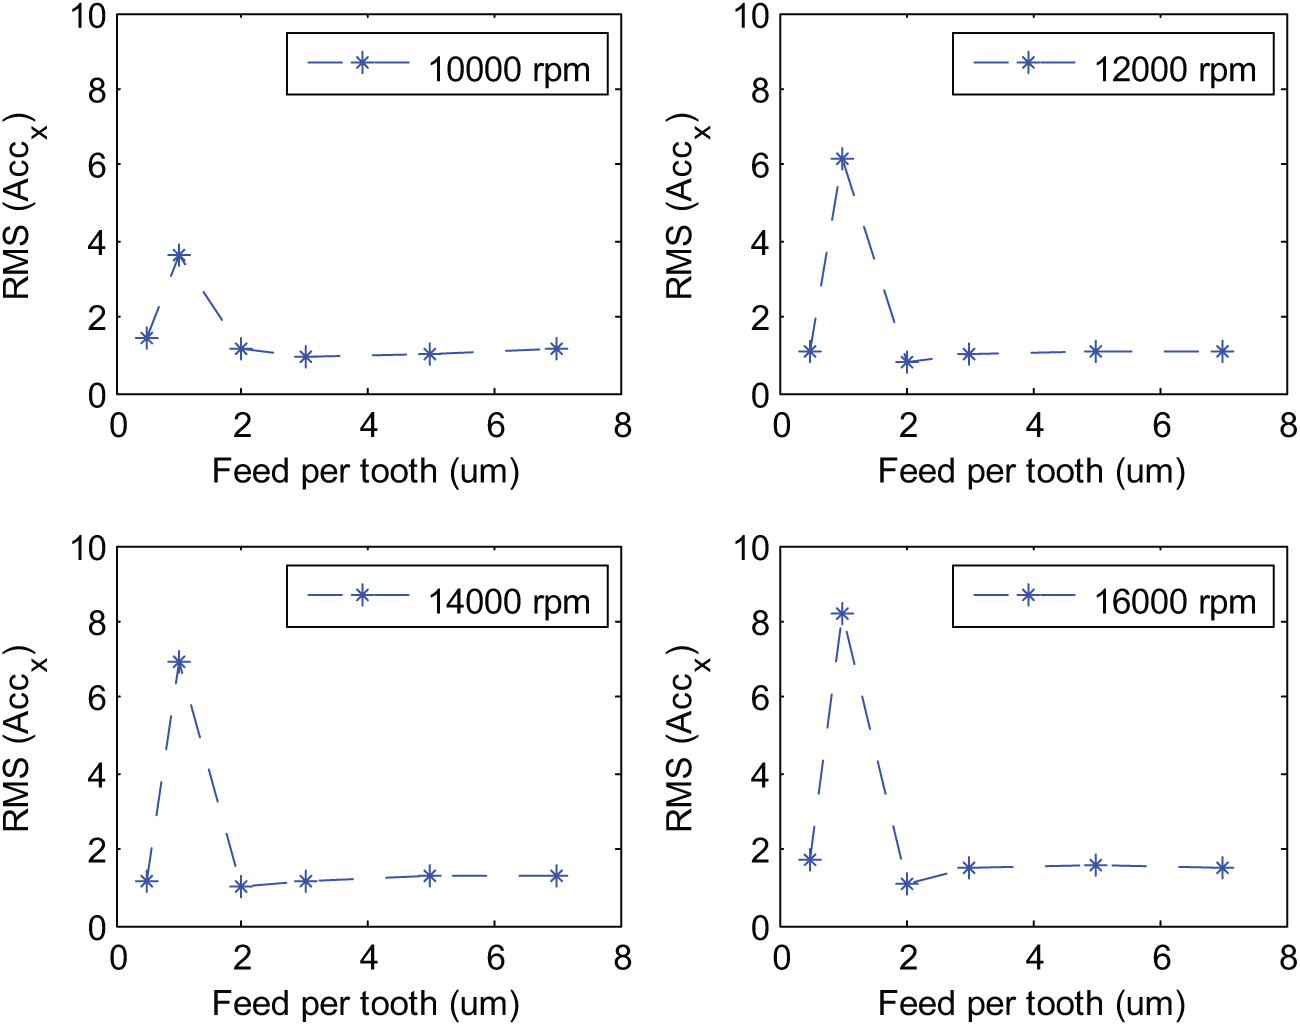
Variation of RMS (unit: m/s2) versus feed per tooth under different cutting speeds.
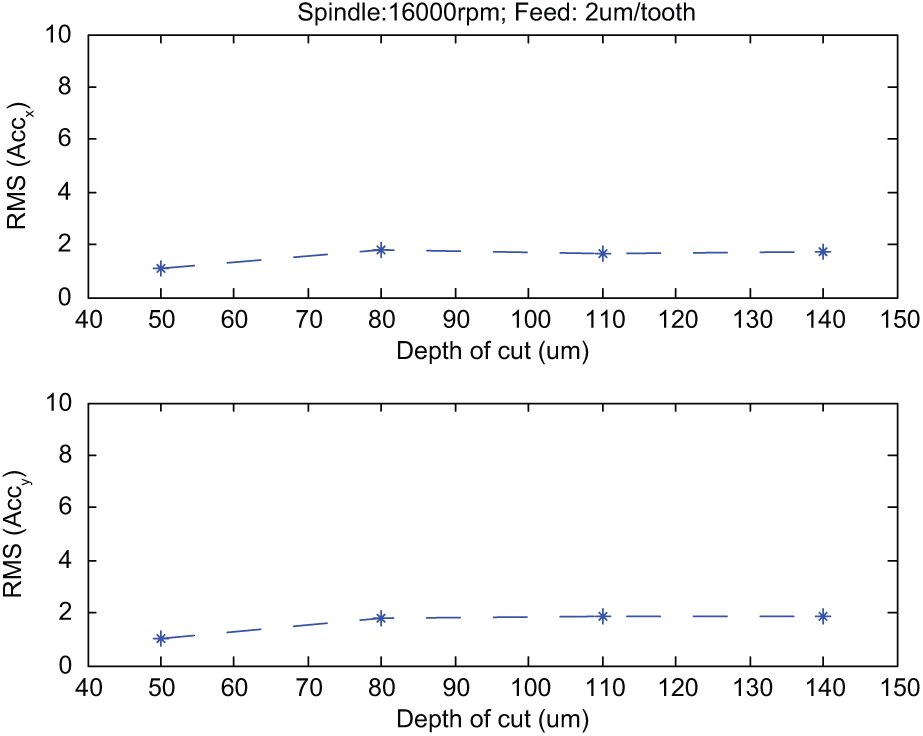
Variation of RMS (unit: m/s2) versus the axial depth of cut. Spindle speed 16,000 r/min.
While the overall RMS can be used to evaluate the vibration energy level for a stationary random vibration, it cannot reflect the transient feature in the dynamic micro-milling process, such as the onset of chatter vibration. For such a purpose, the RMS within each cutter revolution was calculated. Example for the variation of the revolution RMS versus the cutting time corresponding to a stable cutting is shown in Figure 13. In this plot, along with the cutting process, the RMS values also showed a stable status with the deviation in a limited range. Also, comparing between the vibration signals before the cutter entered the cutting and after the cutter exited the cutting, the RMS showed a clear increase when cutter was engaged in cutting which reflected the increased vibrational energy level due to the tool–workpiece interaction.
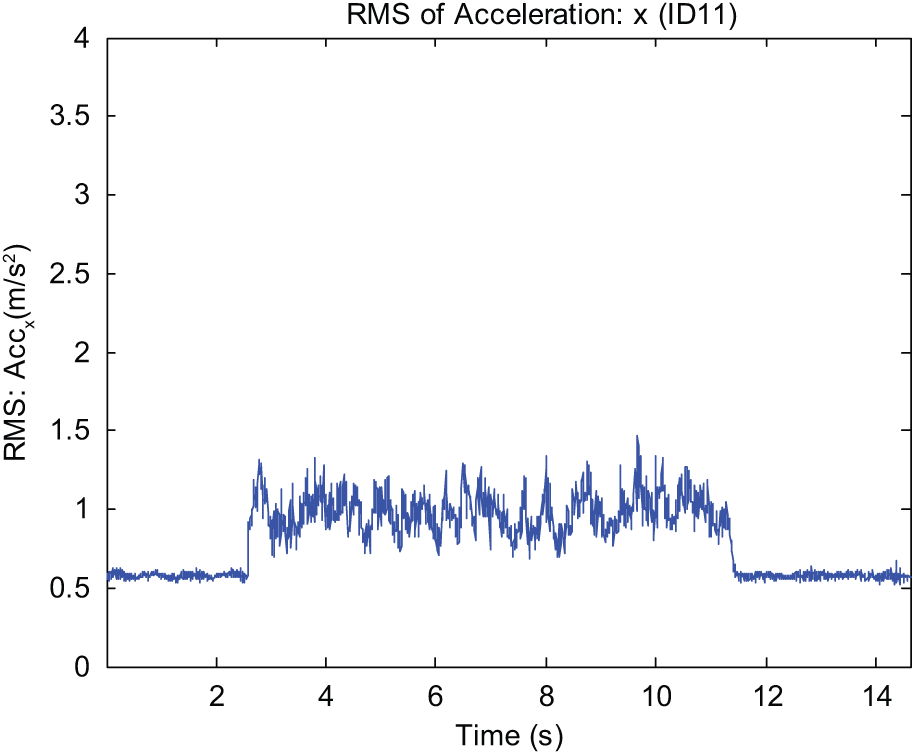
Variation of the revolution RMS versus the cutting time corresponding to a stable cutting.
Figures 14 and 15 show the revolution RMS versus the cutting time under two cutting conditions in which chatter occurred. In Figure 14, before chatter occurred, the RMS exhibited a stable trend. When chatter occurred, there was an abrupt and significant increase of the RMS to a level of about ten times higher. The high RMS level was maintained until the end of the cutting pass. In Figure 15, the outbreak of chatter was in an intermittent way. The variation of revolution RMS values reflected the intermittent chatter outbreak accurately.
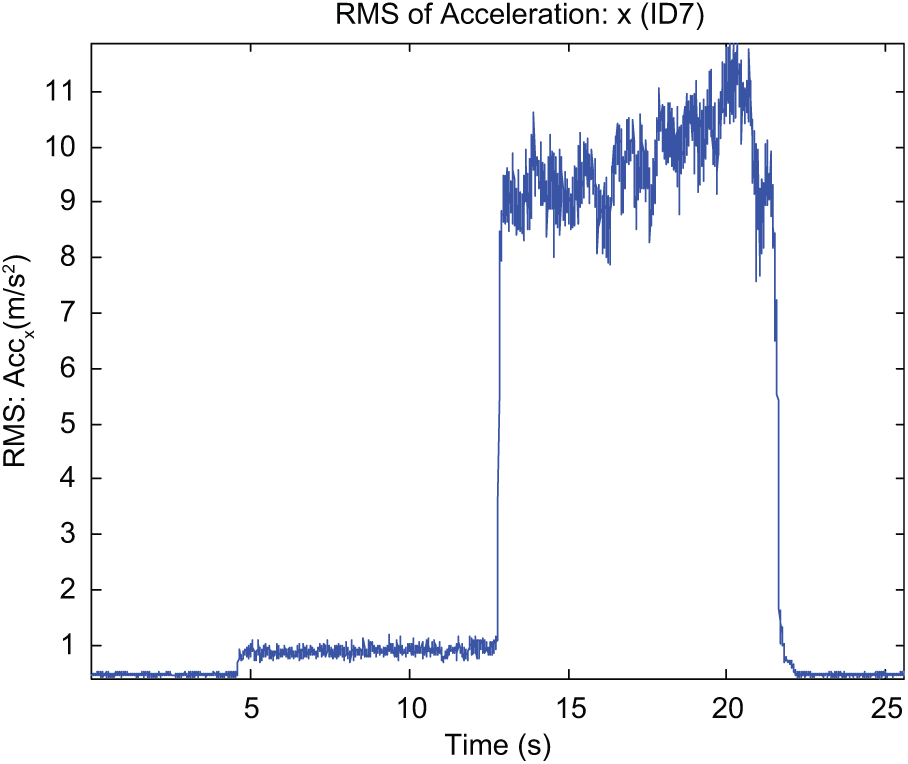
Variation of the revolution RMS versus the cutting time corresponding to an unstable cutting as in Figure 5. Cutting condition: feed 1 µm/tooth, axial depth of cut 50 µm, spindle speed 14000 r/min, slot milling.
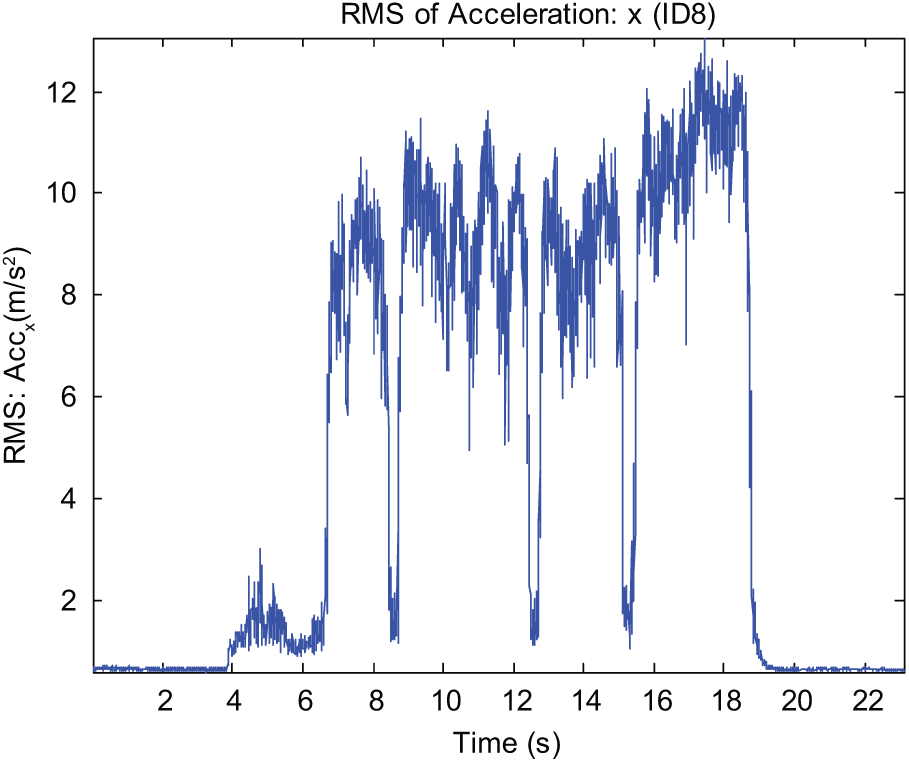
Variation of the revolution RMS versus the cutting time corresponding to an unstable cutting as in Figure 7. Cutting condition: feed 1 µm/tooth, axial depth of cut 50 µm, spindle speed 16,000 r/min, slot milling.
In view of its performance, the revolution RMS can be used for the detection of chatter occurrence. However, a problem for the direct application of the revolute RMS is the determination of an appropriate threshold value which is independent of the cutting parameters. To solve the problem, an RMS-based dimensionless chatter indicator was designed by the following calculation steps for a cutting pass. Detailed calculation of the indicator is as follows.
First, when the cutting process starts, the vibration signals xi, i = 1,2,3, …, are acquired by the data acquisition system using a sampling rate at fs (Hz). Assuming that the spindle speed is ns r/min, the number of sampled signals within one revolution is
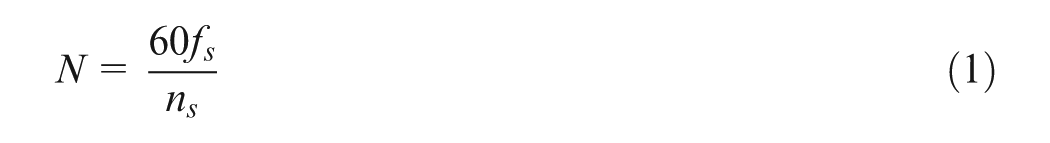
The RMS for each cutter revolution is calculated. For the jth cutter revolution, the RMS(j) value is
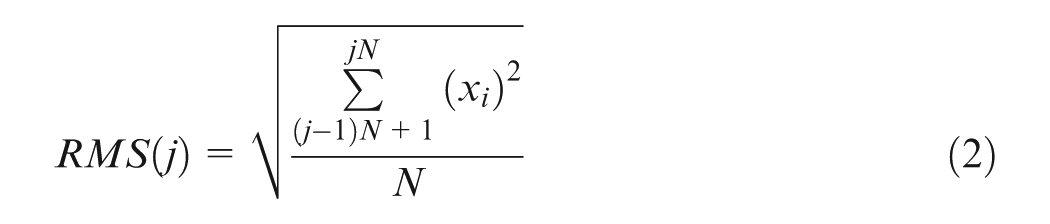
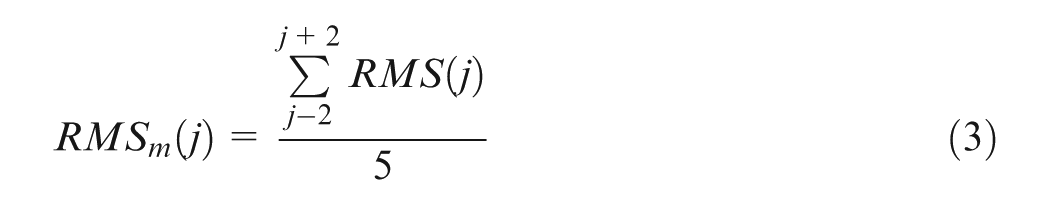
To eliminate the influence of noise, the RMS values are smoothed by passing through a moving average filter to average a number of RMS points. It filters out short-term fluctuations and highlights the trends of real vibration energy change. In this study, a total number of five successive revolutions was considered; thus, the moving average filter is given by
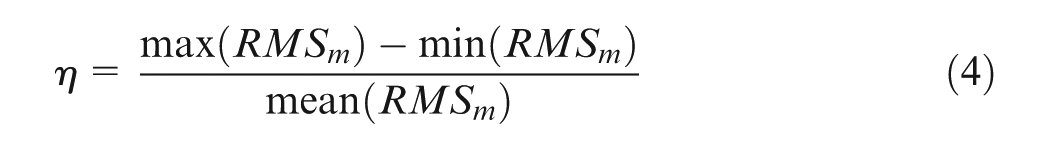
Along with the cutting process, a series of RMS values are obtained, the mean and the peak-to-peak (PTP) of these RMS values are taken. A ratio of the PTP over the mean RMS is used as the chatter indicator, which is expressed as
By comparing the indicator with a condition-independent threshold, the stability of the machining process can be determined.
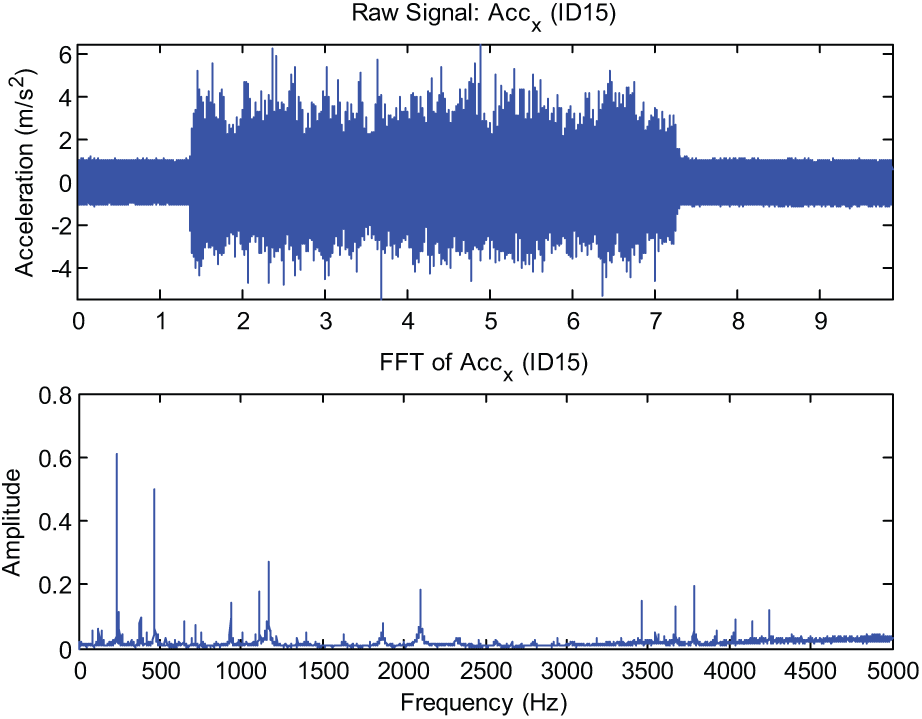
Figure 16 shows the calculated RMS-based chatter indicators versus feed per tooth under different cutting speeds by analysing the vibration signals from the experiments. By comparing the indicator values, it was found that the indicator can accurately reflect the process stability and chatter onset in micro-milling. An indicator value below 0.8 implies a stable cutting process. When the indicator is greater than 1.2, it signifies a chatter occurrence. The values between 0.8 and 1.2 indicate a marginal cutting condition in which the cutting is not stable but chatter is not well developed. This can be further illustrated by examining two cases. The first case was with the cutting parameters of 14,000 r/min spindle speed, 50 µm depth of cut, and 3 µm feed per tooth, using the 600 µm diameter cutter. The calculated chatter indicator was 0.52, which indicated a stable cutting process. The raw time domain acceleration signal and the corresponding frequency spectrum are shown in Figure 17. It is apparent that the dominant frequency components are on the spindle frequency and the tooth-passing frequency, which attests the nature of the stable cutting process. When the spindle speed was 10,000 r/min, while other parameters were unchanged, the calculated chatter indicator was 1.55, which indicates chatter occurrence. Figure 18 shows the time domain acceleration signal and the frequency spectrum. Although the vibration amplitude level of the time domain data looks quite similar to the aforementioned case shown in Figure 17, the core difference was revealed by the frequency spectrum, in which the dominant components were no longer the spindle and tooth-passing frequencies, but in the range of 1000 to 2000 Hz, with the highest peak at 1296 Hz. Thus, the cutting was in an unstable cutting condition.
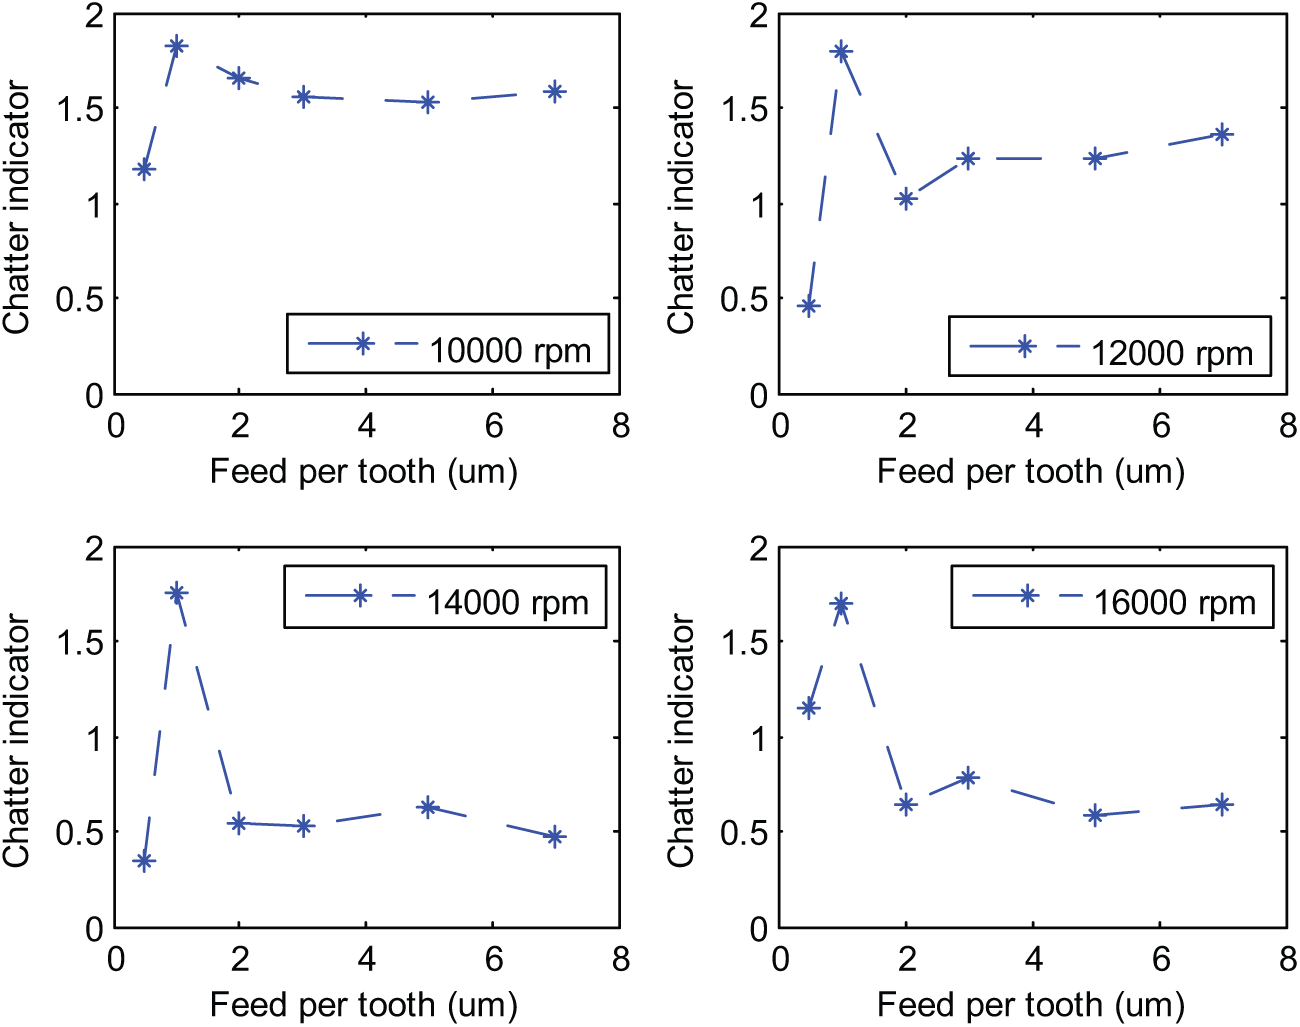
RMS-based chatter indicators versus the feed under different cutting speeds.
Acceleration signal and the frequency spectrum of a stable cutting process with a chatter indicator value 0.52.
Acceleration signal and the frequency spectrum of an unstable cutting process with a chatter indicator value 0.52.
It can be observed from Figure 16 that all the cuttings in the experiments with a feed of 1 µm/tooth were unstable, with chatter fully developed in most cases. It might be caused by the cutting edge effects and minimum chip thickness phenomenon in micro-milling. A higher feed rate should be selected to avoid the detrimental unstable cutting and to increase the material removal rate. Regarding the influence of the cutting speed, the worst cases happened under the spindle speed of 10,000 r/min. All the chatter indicators were near or above 1.2, denoting unstable cutting processes. The increase of the spindle speed in the range of 10,000 to 16,000 r/min resulted in decreased chatter indicators and, therefore, more stable cutting conditions.
It should be noted that micro-milling is actually a very complex dynamic process. There exists strong randomness for the chatter development and outbreak. Even under the same cutting condition, sometimes chatter occurs, sometimes not. There is still a lack of reliable models to predict chatter in micro-milling with acceptable accuracy. The proposed chatter indicator provides a simple, but effective way to evaluate the stability of micro-milling process based on an acceleration measurement. As the computational load for the proposed indicator is relatively light, the method can be implemented in real time for chatter onset detection and control with the current sampling frequency of 10 kHz, which will be explored in future work.
Conclusion
Despite the increasing research efforts on micro-machining technologies in recent years, the knowledge of chatter occurrence in micro-machining processes is still in severe dearth. The vibration signal characteristics associated with chatter onset have been investigated. Along with the chatter occurrence, there is a drastic increase of the vibration amplitude in the time domain, and also a characteristic shift of the dominant frequency components from the spindle frequency and tooth-passing frequency to other frequencies close to the resonant frequency related to the tool–workpiece dynamic system. A modulation of the spindle frequency around the chatter frequency is also present in the vibration signal. It has been shown that WPT can be used for the detection of chatter occurrence, although the computational burden can be a major constraint for real-time applications.
A dimensionless chatter indicator based on the revolution RMS values has been developed and used to evaluate the stability of the micro-milling process. Using a series of RMS values obtained during a micro-milling process, the chatter indicator has been calculated by taking the ratio of the PTP RMS to the mean RMS values. It has been shown that the proposed indicator provides a simple, but effective way to detect chatter onset for micro-milling. To avoid the detrimental unstable cutting condition and to increase the material removal rate, it is recommended that a higher feed per tooth should be used. An alternative would be to choose a chatter-free cutting speed based on stability lobes, but it is not within the scope of this article.
Footnotes
Declaration of conflicting interests
The authors declare that there is no conflict of interest.
Funding
This research received no specific grant from any funding agency in the public, commercial, or not-for-profit sectors.