
Abstract
Micro-end-milling is used for the fabrication of complex geometrical features with high precision on a wide variety of materials. One of the main challenges is related to chatter vibrations, which are detrimental to the productivity and overall quality of the manufactured parts. In this article, a novel chatter-detection method based on wavelet coherence functions is proposed to evaluate the stability of the micro-end-milling process. Then, the method is experimentally tested under different cutting conditions. The results show that the wavelet coherence functions of two orthogonal acceleration signals are sensitive enough and applicable for chatter detection. When chatter occurs, the two orthogonal acceleration signals are highly correlated at the chatter frequency, resulting in a sharp increase in the magnitude of the wavelet coherence functions to values approaching unity.
Introduction
The demand for micro-components is steadily increasing in many industries, such as aerospace, optics, medical, and electronics industries driven by miniaturization of devices and of their components. Micro-end-milling is suitable for the manufacture of micro-components due to its prominent capability of machining three-dimensional (3D) free-form micro-structures. 1 One of the challenges in micro-end milling is chatter, which is an unstable vibration that causes poor surface finish, severe tool wear, tool breakage, and harsh noise.2,3 As the diameter of the tool becomes smaller, the tool has a lower resistance to forces and torques. Consequently, chatter phenomena are more easily induced due to the reduced stiffness of the cutter. Tlusty and Polacek 4 were among the first to present their research results that focused on this phenomenon. Since then, chatter prediction using stability lobe diagrams (SLDs) has been extensively studied by many researchers including Altintas, 5 Afazov et al., 6 Park and Rahnama, 7 and others. However, due to the tight coupling and time-varying properties of the whole cutting system, it is still difficult to accurately predict the occurrence of chatter using SLDs. 2 Therefore, sensor-based chatter detection becomes essential for maintaining an efficient machining process and ensuring the safety of the machining system. 8
Stability monitoring is a fundamental requirement for diagnosis and control of the machining process. Sensor-based monitoring yields valuable information about the cutting process that can serve the dual purpose of process control and quality monitoring. 9 Several sensors can be used to recognize chatter, such as dynamometers,10–13 accelerometers,14–17 microphones,18–20 laser-displacement sensors, 21 eddy current displacement sensors,22,23 acoustic emission (AE) sensors, 24 and so on. However, as the size of the cutting tool decreases in micro-end-milling, despite the relatively low cutting speeds, very high spindle speeds are used in the machining process. As the bandwidth of the sensors used should be a few times higher than the tooth-passing frequency, cutting force–sensing systems in micro-end-milling operations can be easily excited by frequencies close to the natural frequency of the sensing system which strongly disturbs the signal. 25 Therefore, additional compensation techniques, for example, inverse transfer function matrix, accelerometer-based compensation, Kalman filtering, and so on, are needed to compensate the measured force signals. 26 An online chatter-detection method based on acoustic signals was proposed by Tsai et al. 27 Nevertheless, microphones are affected by other limitations such as directional considerations, low-frequency response, and environmental sensitivity. Compared with other sensors, accelerometers stand out for their performances advantages in bandwidth, installation, signal quality, and information usability.
In addition to sensing, signal processing and feature extraction are also very important for chatter detection. Common signal processing methods include time-domain, frequency-domain, and time–frequency domain analysis. 28 In the time domain, Huang et al. 11 analyzed chatter in macro-end milling of titanium alloys based on the cutting force. They found that the maximum value, the standard deviation of the cutting force, and the machined surface roughness obviously increased when chatter occurred. Schmitz 29 proposed a method for chatter recognition through statistical evaluations of the milling sound variance with a synchronously sampled signal. A signal can be transformed from the time domain to the frequency domain by using the fast Fourier transform (FFT). Polli et al. 30 analyzed the displacement, sound pressure, and force signals acquired from high-speed milling process using the FFT. The results have shown that the spectra of these signals are dominated by the chatter frequency for unstable cuts. Li et al. 14 studied chatter occurrence in micro-milling operations and proposed a dimensionless chatter indicator based on the analysis of the acceleration signal. Zaghbani et al. 31 used frequency descriptors to analyze stability in robotic high-speed machining of aluminum alloys. However, since the FFT conceals the time-domain information, it is blind to non-stationary transient information and ineffective for online detection of the onset of chatter. 28 Lamraoui et al. 32 proposed a cyclostationarity approach to monitor chatter. Angular power and kurtosis were used to analyze chatter phenomena. Further results showed that the Wigner Ville spectrum acquired from second-order cyclostationary signals was an efficient parameter for the early diagnosis of chatter in high-speed machining. However, it is both time-consuming and hard to interpret the result analyzed by the Wigner Ville spectrum. Later, Lamraoui et al. 8 proposed two indicators in the angular domain to monitor chatter in milling based on instantaneous angular speeds (IASs). The relevance of cutting forces for chatter monitoring was confirmed by data analysis. Then, the correlation between cutting forces and IAS of the spindle was verified. The indicator based on IAS is a promising method because it can be realized by using one rotational encoder. This doubtlessly reduces the cost of the manufacturing system. However, this method needs further work to verify that it can be used in cases with complex tool trajectories and tool overload cases.
Other algorithms were also introduced to detect chatter, such as neural networks 33 and fuzzy logic. 34 However, preliminary experiments for specific cases or different cutting conditions are always required to setup a database and train the system. 35 Since vibration signals are typically non-stationary signals, the time–frequency analysis method offers an alternative method to process the measured signals. The time–frequency analysis methods, such as the wavelet transform (WT), short-time Fourier transform (STFT), and Hilbert–Huang transform (HHT) can simultaneously provide both the frequency distribution and the associated time information. The STFT can obtain localized time–frequency information by introducing a sliding window function. However, STFT provides constant resolution for all frequencies because it adopts the same window for the whole signal. This implies that one would not be able to obtain good time and frequency resolutions at the same time. HHT, another important time–frequency analysis method, uses a time-adaptive empirical mode decomposition (EMD) method to decompose the signal into a set of intrinsic mode functions (IMFs), and Hilbert spectral analysis (HSA) to obtain the instantaneous frequency array. However, a serious shortcoming of EMD is the problem of mode mixing. To overcome this issue, a noise-assisted data analysis method, namely, ensemble empirical mode decomposition (EEMD), was developed by Wu and Huang 36 by adding noise to the investigated signal. Fu et al. 2 proposed an energy aggregation characteristic method based on the HHT for online chatter detection. The EEMD is used to decompose the measured vibration signal into a series of IMFs. Milling experiments proved that the proposed method was effective in protecting the workpiece from severe chatter damage. However, besides the shortcomings of EMD mentioned above, EMD faces other issues as well, such as the lack of a theoretical foundation, end effects, sifting stop criterion, extremum interpolation, and so on. 37 To meet the needs for adaptive time–frequency analysis in applied mathematics, physics and engineering, wavelet theory was developed in the late 1980s by Mallat, 38 and Daubechies. 39 Unlike the Fourier transform that spans the entire time period, WT can localize the time and frequency description of the signal and reveal the signal’s behavior in a certain time interval along with its corresponding frequency properties. This characteristic of WT makes it useful for uncovering different localized features associated with different machining states, 40 and suitable for adaptive time–frequency analysis. Moreover, the time–frequency resolution of WT depends on the frequency of the signal. At high frequencies, the wavelet reaches a high time resolution but a low frequency resolution, whereas at low frequencies, high frequency resolution and low time resolution is obtained. WT can be utilized to decompose the signal into a series of sub-signals and the original signal can be perfectly reconstructed using the wavelet coefficients. 2 Tangjitsitcharoen and colleagues41,42 proposed an in-process chatter-detection and surface roughness–prediction method during ball-end-milling process by utilizing the WT to monitor and decompose the dynamic cutting forces. Zhang et al. 28 presented an approach to detect milling chatter based on energy entropy of wavelet packet decomposition. The results showed that the energy entropy increased with the increase of chatter severity level. Khalili and Danesh 43 proposed a vision-based vibration-detection approach in turning process. Undecimated WT is used to decompose the workpiece surface image into sub-images, and the texture of the preferred sub-image is analyzed using gray-level co-occurrence matrix texture features. The experimental results verified the feasibility using the combination of undecimated wavelet decomposition and gray-level co-occurrence matrix texture features for vibration-level detection. Yao et al. 44 proposed a chatter identification method based on a wavelet and support vector machine. In their works, the WT is applied as amplification for the chatter premonition. Although chatter detection has been extensively studied as mentioned above, most of the methods involve complicated feature extraction steps which make the existing methods impractical for an industrial operator to analyze the detection results. Another problem is that it is still difficult using the existing methods to identify chatter before it is fully developed.
The wavelet cross spectrum and the associated wavelet coherence function based on WT reveal the localized similarities in both the time and frequency domains. The wavelet coherence function has been used for the extraction of feature similarities between two time series, in geophysics, 40 economics, 45 and medicine. 46 In this article, a novel chatter-detection method based on wavelet coherence functions is proposed to evaluate the stability of the micro-end-milling process. The method relies on the use of acquired orthogonal directional accelerations to directly calculate the wavelet coherence functions without complex feature extraction; thereby, providing an easy way to detect chatter. Furthermore, it will be shown that the proposed method can detect chatter in its early stages before it is fully developed. The study evolves through three stages. First, the method for chatter detection based on wavelet coherence is proposed. Second, the experimental setup, the design of experiments, the determination of resonant frequencies, and the measurements of accelerations during the micro-end-milling process are described. Finally, the experimental data are analyzed to verify the feasibility and sensitivity of the proposed chatter-detection method.
Chatter detection based on wavelet coherence functions
Although chatter manifests itself by high-amplitude oscillations of the workpiece, it should be noted that it is difficult to determine/define an absolute acceleration amplitude level as a chatter criterion. The amplitude may vary depending on the sensitivity of the accelerometer, the mounting location, and so on. It is also influenced by environmental disturbances from other machines and equipment in the workshop. Hence, reliable and unified dimensionless indicators which can be used as chatter-detection criteria are still under investigation. In previous work, the coherence function of two orthogonal acceleration signals from the bending vibrations of the tool was proposed to detect chatter. 17 The results have shown that the two accelerations are highly correlated at the chatter frequency, resulting in a sharp increase in their coherence function to a value that approaches unity when chatter occurs. However, because of the use of the FFT for its evaluation, this approach poses serious theoretical drawbacks when applied for processing machining signals. 22 As mentioned above, since the FFT conceals the time-domain information, it is blind to non-stationary transient information and ineffective for online detection of the onset of chatter. Although STFT can obtain localized time–frequency information, it is difficult to achieve good time and frequency resolutions at the same time.
To overcome the limitations of the coherence-based methods described above, the use of continuous wavelet analysis that is extensively used in tool-condition monitoring might be considered. The coefficients C(a, b) of the WT of the signal f(t) can be expressed as 47
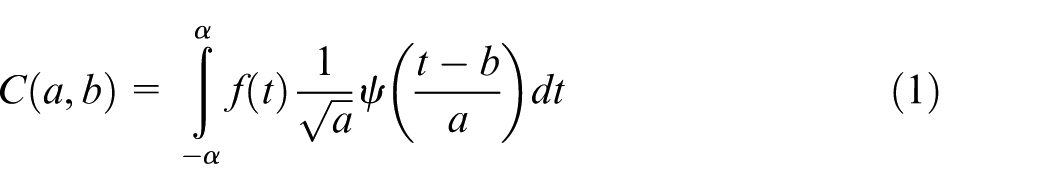
where a and b are the scaling and shifting parameters in the WT, respectively, and ψ is a square integral function.
The wavelet cross spectrum and wavelet coherence of time signals x(t) and y(t) can be defined as 40
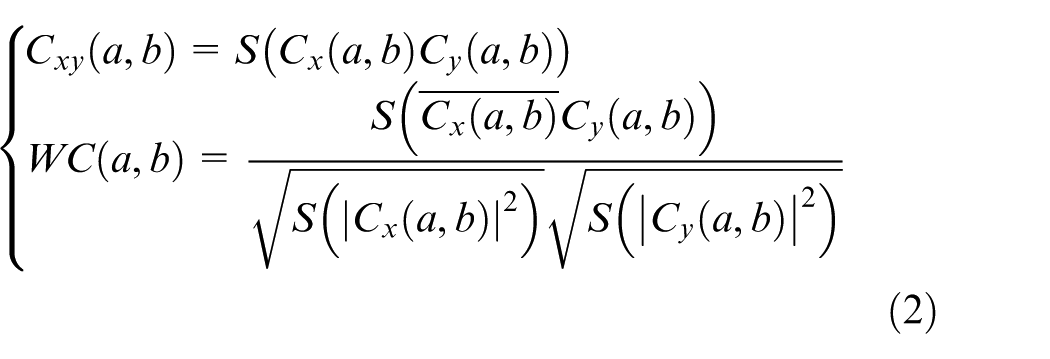
where Cx(a, b) and Cy(a, b) denote the continuous WTs of x(t) and y(t) at scales a and positions b, respectively. The
To detect chatter, a novel chatter-detection method based on wavelet coherence functions is proposed below for evaluating the stability of the micro-milling process. As shown in Figure 1, milling cutters can be considered to have two orthogonal degrees of freedom given that rigidity in the tool’s Z-axis direction is much higher than in the X- and Y-axis directions, respectively. The dynamics of the milling system can be given by
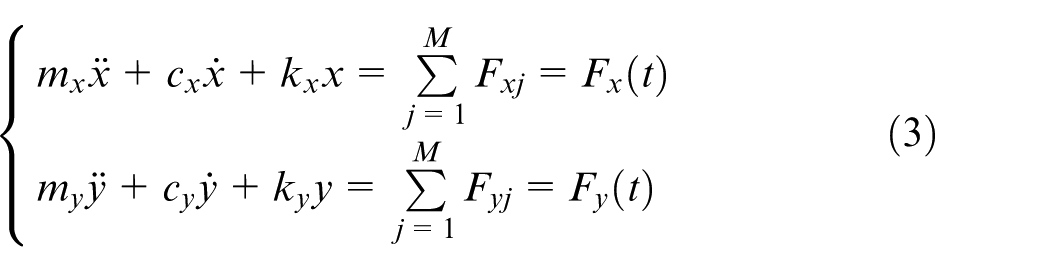
where
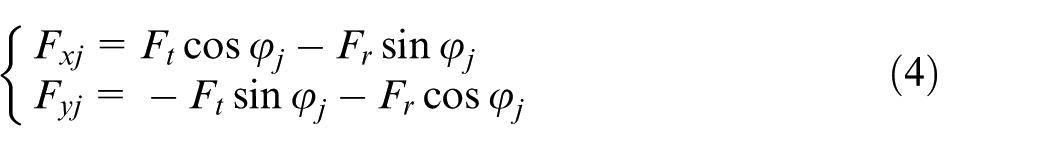
where mx and my are the masses; cx and cy are the damping coefficients; kx and ky are the stiffness of the machine tool structure in the modal X- and Y-axis directions, respectively; j is the tooth number; M is the number of cutter teeth; Fx and Fy are the components of the cutting force that are applied on the workpiece in the X- and Y-axis directions, respectively;
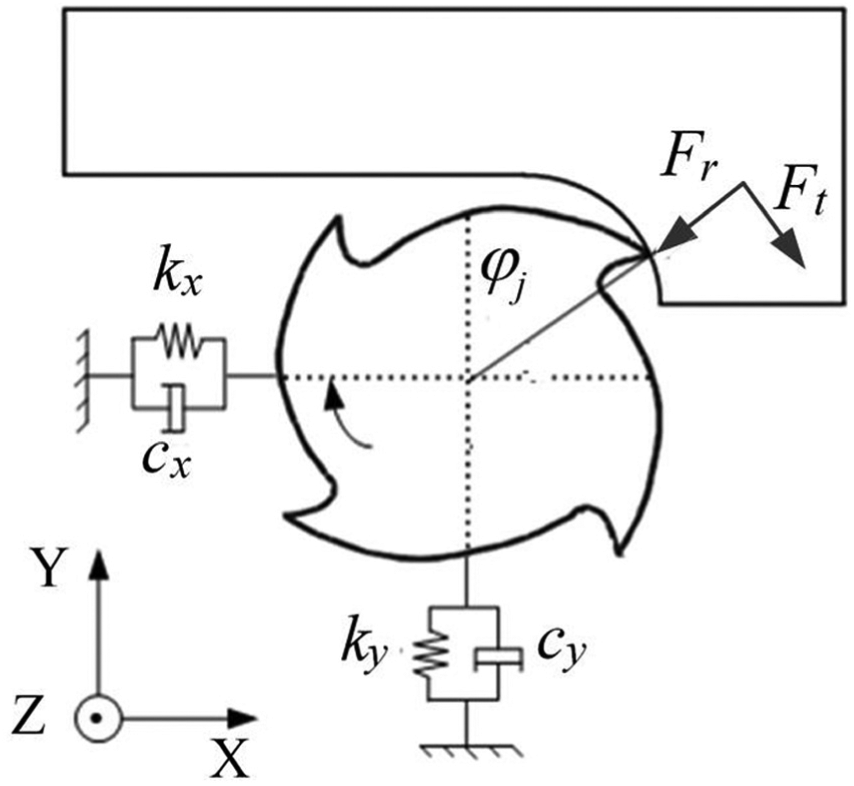
Dynamic model of milling with 2 degrees of freedom.
In the micro-end-milling process, the components of the cutting force Fx and Fy cause the workpiece to vibrate in the X- and Y-axis directions, respectively. Before chatter occurs, the dominant frequency of the cutting force or acceleration is distributed at the multiples of the spindle frequency (SF) defined by the spindle speed n (r/min) as n/60. Therefore, the vibration energy is distributed at the multiples of SF, and the wavelet coherence function at these frequencies slightly increases before chatter occurs. During chatter, the cutting system vibrates simultaneously in both the X- and Y-axis directions and is characterized with two correlated harmonic signals at the same chatter frequency at which nearly all the vibration energy is concentrated. Therefore, the value of the wavelet coherence function at the chatter frequency is expected to be close to unity at the onset of chatter. Thus, the variation of the wavelet coherence function is proposed to be used for chatter detection. This postulate will be verified by experiments in the sections below.
Experimental setup
Machine tool and work material
The experimental setup is shown in Figure 2. The machine used in this experiment was a 5-axis computer numerical controlled (CNC) machining center (Deckle-Macho DMU-P60). The maximum spindle speed is up to 18,000 r/min. The travel distances in the X-, Y-, and Z-axis directions are 600, 700, and 600 mm, respectively. The cutting tools were two flutes flat-end mills with a diameter of 600 μm. The helix and rake angles were approximately 30° and 10°, respectively. The microscopic picture of the cutter is shown in Figure 3. Two accelerometers (PCB Model 352C65) were mounted on the base of the workpiece in the X- and Y-axis directions to capture the vibration signals, respectively. The accelerometers are high-sensitivity miniature (2 g) ceramic shear ICP accelerometers with a sensitivity of 100 mV/g, a frequency range of (±5%) from 0.5 to 10 kHz and a resonant frequency of greater than 35 kHz.
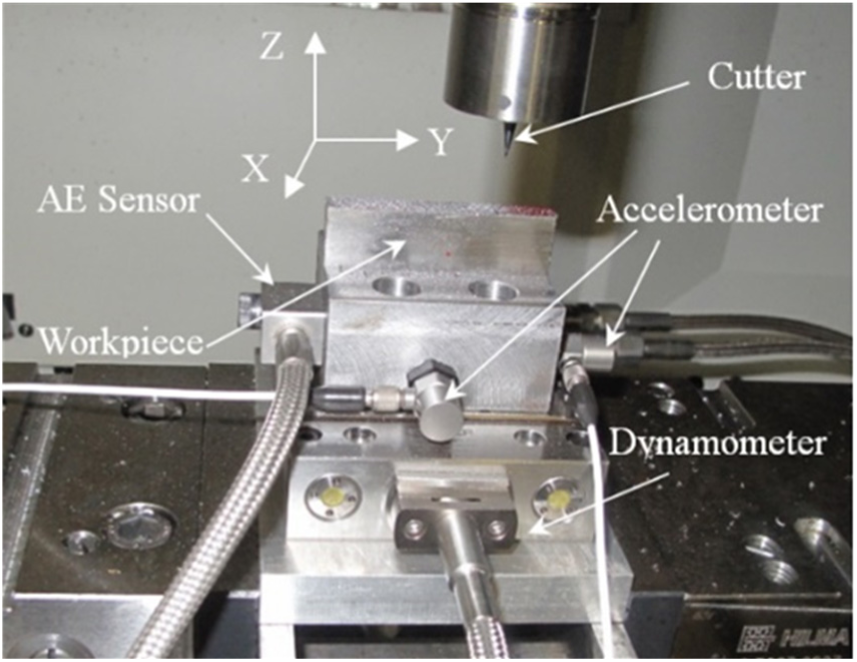
Experimental setup.
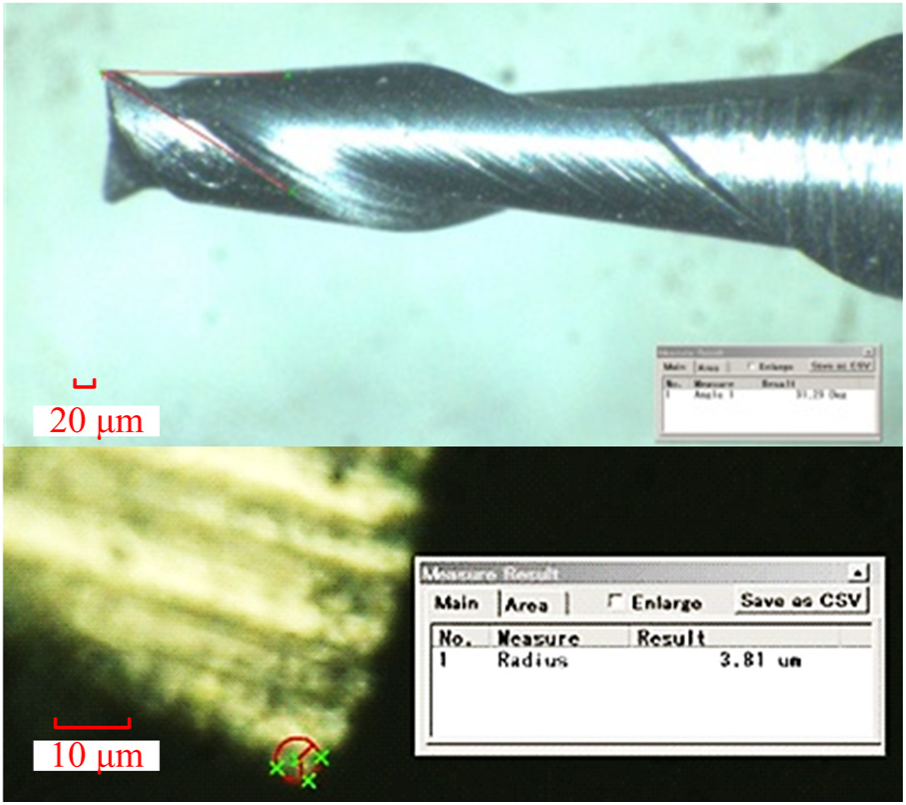
Photomicrograph of the milling tool.
The workpiece material used in this research was AISI 1040 carbon steel. The workpiece was designed with a base and a rectangular block of 60 mm × 8 mm × 18 mm on the top. To assure the same depth of cut, the workpiece was machined using a larger diameter tool (8-mm end-mill) to clean the top surface to establish a zero-cutting plane before micro-end milling the workpiece.
Design of experiments
The design of experiments technique is important for the analysis of the influence of process variables on the response variables. Although, there are many factors that need to be considered in micro-end-milling processes, there are three common variables, namely the cutting speed, feed rate, and depth of cut, which are mostly considered by researchers to control the micro-end-milling process. 48 In this study, spindle speed (n) and feed per tooth (fz) were chosen as design factors, while the depth of cut was kept constant at 50 μm. To investigate the effect of machining parameters on chatter occurrence, a full factorial design was used. The spindle speeds ranged from 10,000 to 16,000 r/min in 2000 r/min increments, and the feed per tooth are set as 0.5, 1, 2, 3, 5, and 7 μm, respectively. There are 24 cases of slot-milling experiments conducted by feeding the cutting tool along the width of the workpiece. The cases are sorted by principle that setting the spindle speeds increase in 2000 r/min increments in four cases while per teeth is set as the same. For example, for cases 1–4, spindle speeds are 10,000, 12,000, 14,000, and 16,000 r/min, respectively, and feed per teeth is the same as 0.5 μm. For cases 5–8, spindle speeds are 10,000, 12,000, 14,000, and 16,000 r/min, respectively, and feed per teeth is the same as 1 μm. The remaining cases are set in the same manner. Kim 49 proposed that the minimum chip thickness is 30% of the cutting-edge radius. The radius of the cutting edge in this study is about 3.8 μm as shown in Figure 3. Thus, the minimum chip thickness is about 1.2 μm. As it can be seen, the values of the feed per tooth include values both below and above the minimum chip thickness.
Determination of the resonant frequencies
The basic resonant frequencies of the key machine tool components, including the workpiece-table and the cutting tool-spindle, were identified through impact hammer testing. A PCB Piezotronics model 086C03 ICP impact hammer was used to strike the test object with an impulse force. A hard tip was selected, thus the impulse force consisted of a nearly constant force over a broad frequency range to excite all resonances in that range. The impact force was measured by the embedded force sensor in the instrumented hammer. For the workpiece-table system, the resultant vibrations in the X- or Y-axis directions were measured with the 352C65 PCB accelerometers, as shown in Figure 4(a). Due to the tiny size of the micro-end-milling cutter, it was impractical to attach an accelerometer to it. Quintana and Ciurana 50 pointed out that laser-displacement transducers are more practical to measure the frequency response function in such cases. Thus, a Keyence LK-G87 CCD laser-displacement sensor was used to measure the vibration response of the end of the tool in a non-contact manner, as shown in Figure 4(b). The impact force and the vibration response signals were acquired by using a Prosig P8004 and a digital action tracking system (DATS) with a sampling rate of 10 kHz to obtain the frequency response function and to identify the resonant frequencies. The measured resonant frequencies are listed in Table 1.
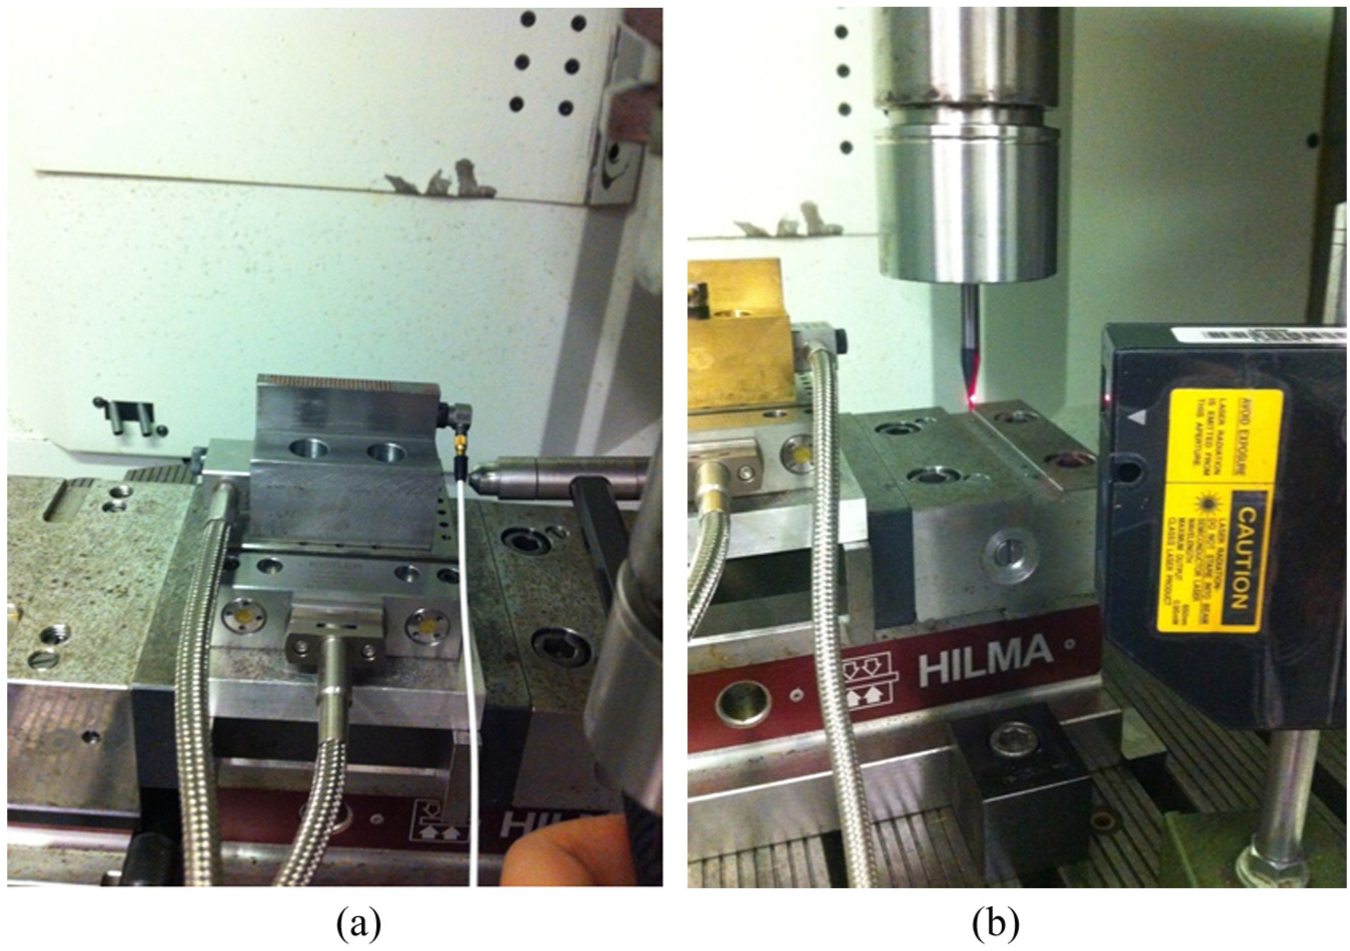
Impact hammer testing setup: (a) for the workpiece-table and (b) for the tool-spindle.
Identified resonant frequencies of the workpiece-table and tool-spindle.
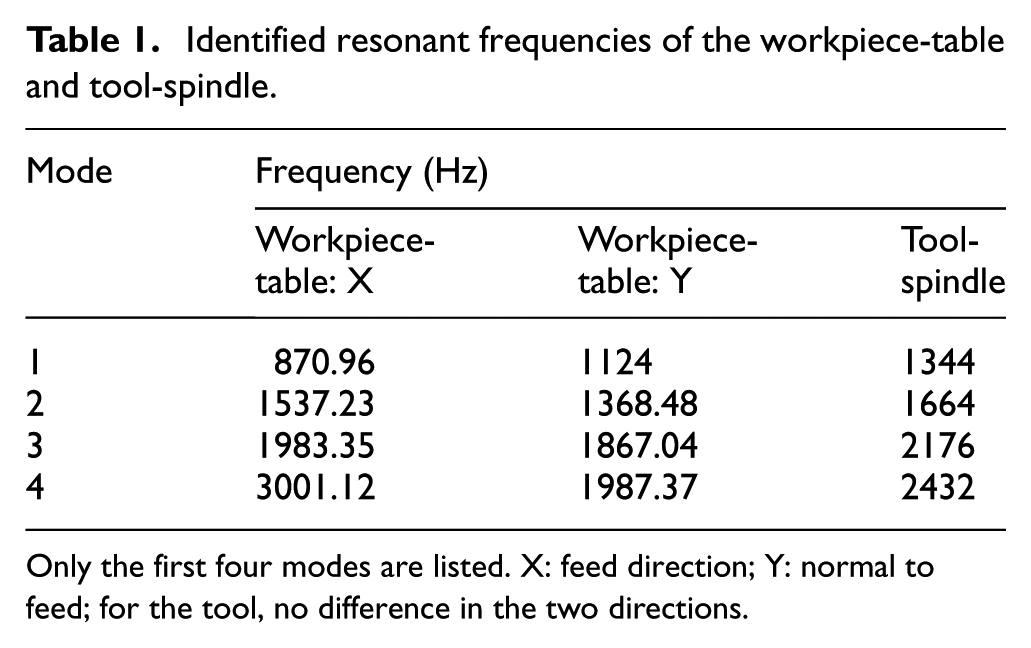
Only the first four modes are listed. X: feed direction; Y: normal to feed; for the tool, no difference in the two directions.
Results and discussion
In our previous work, 14 the mean root-mean-square (RMS) of the acceleration was defined as a chatter indicator, which is expressed as
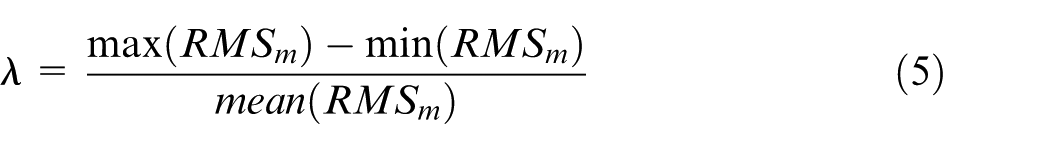
where
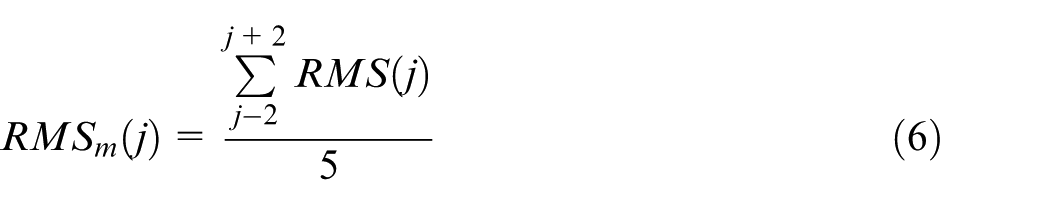
and RMS(j) is the RMS of the acceleration for the jth cutter revolution. According to this RMS-based chatter indicator, an indicator value below 0.8 implies a stable cutting process while values between 0.8 and 1.2 indicate marginally stable cutting conditions. When the value exceeds 1.2, chatter occurs. The calculated RMS-based chatter indicators versus feed per tooth under different cutting speeds corresponding to the cutting conditions are shown in Figure 5.
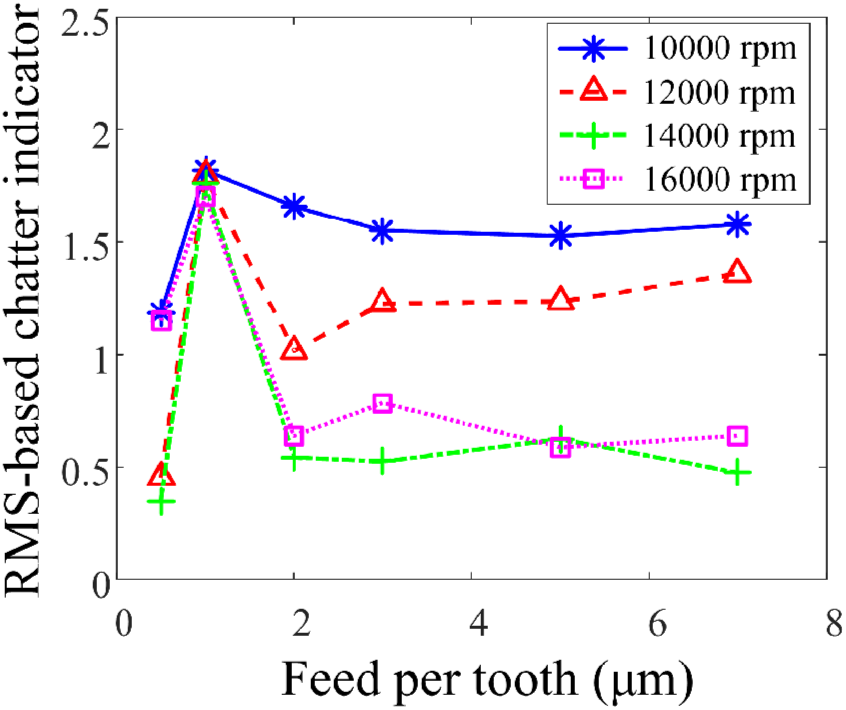
RMS-based chatter indicator versus the feed for different cutting speeds.
To verify the effectiveness of the wavelet coherence function for chatter detection, two typical chatter occurrence parameters were chosen based on the results shown in Figure 5 to analyze the feasibility and the sensitivity of this method. The analysis results are discussed in detail below.
Feasibility of wavelet coherence functions for chatter detection
The feasibility of the wavelet coherence function for chatter detection is tested corresponding to a micro-end-milling process at a spindle speed of 14,000 r/min and a feed per tooth of 1 μm. The characteristics of the acceleration in the X- and Y-axis directions for this cutting process are shown in Figure 6, respectively. As shown in Figure 6(a) and (d), the cutting starts at time 4.6 s, and it can be divided into two stages. The first stage from 4.6 to 12.8 s, the amplitude of the acceleration in the X- and Y-axis directions are about 2.5 m/s2. The frequency spectrum of the acceleration during this stage in the X-, Y-axis directions are presented in Figure 6(b) and (e), respectively. In both directions, the dominant peak values occur at multiplies of the SF. The tool-passing frequency (TPF) is defined as the number of teeth of the cutter multiplied by SF. In the X-axis direction, the highest peak appears at SF, and there are numerous small peaks around 5 × SF, while in the Y-axis direction, the highest peak appears at 8 × SF, and there are numerous small peaks between 7 × SF and 8 × SF pointed out by circles. This indicates that the cutting system is stable, but it is likely to induce chatter. The second stage from 12.8 s lasts until the end of cutting. The amplitudes of the acceleration show a significant increase compared to the first stage in both directions. The frequency spectrum of acceleration during the second stage in the X- and Y-axis directions is presented in Figure 6(c) and (f), respectively. Compared to the first stage, the SF and its harmonic frequencies are still present in both directions, and the dominant peak values are at 1093, 1327, and 1553 Hz, which are not a harmonic of the SF. It is interesting to note that the three dominant frequency peaks are equidistantly spaced. The central frequency of 1327 Hz is very close to the first resonant frequency of the spindle-cutter system which was 1344 Hz, while the other two peaks are located at the two sides with an equal frequency spacing of 234 Hz, which is roughly the SF. With chatter onset in this case, due to the limited stiffness of the micro-milling cutter during the tool–workpiece dynamic interaction, the fundamental resonant frequency of the cutter becomes dominant, along with the modulation by the spindle rotational frequency.
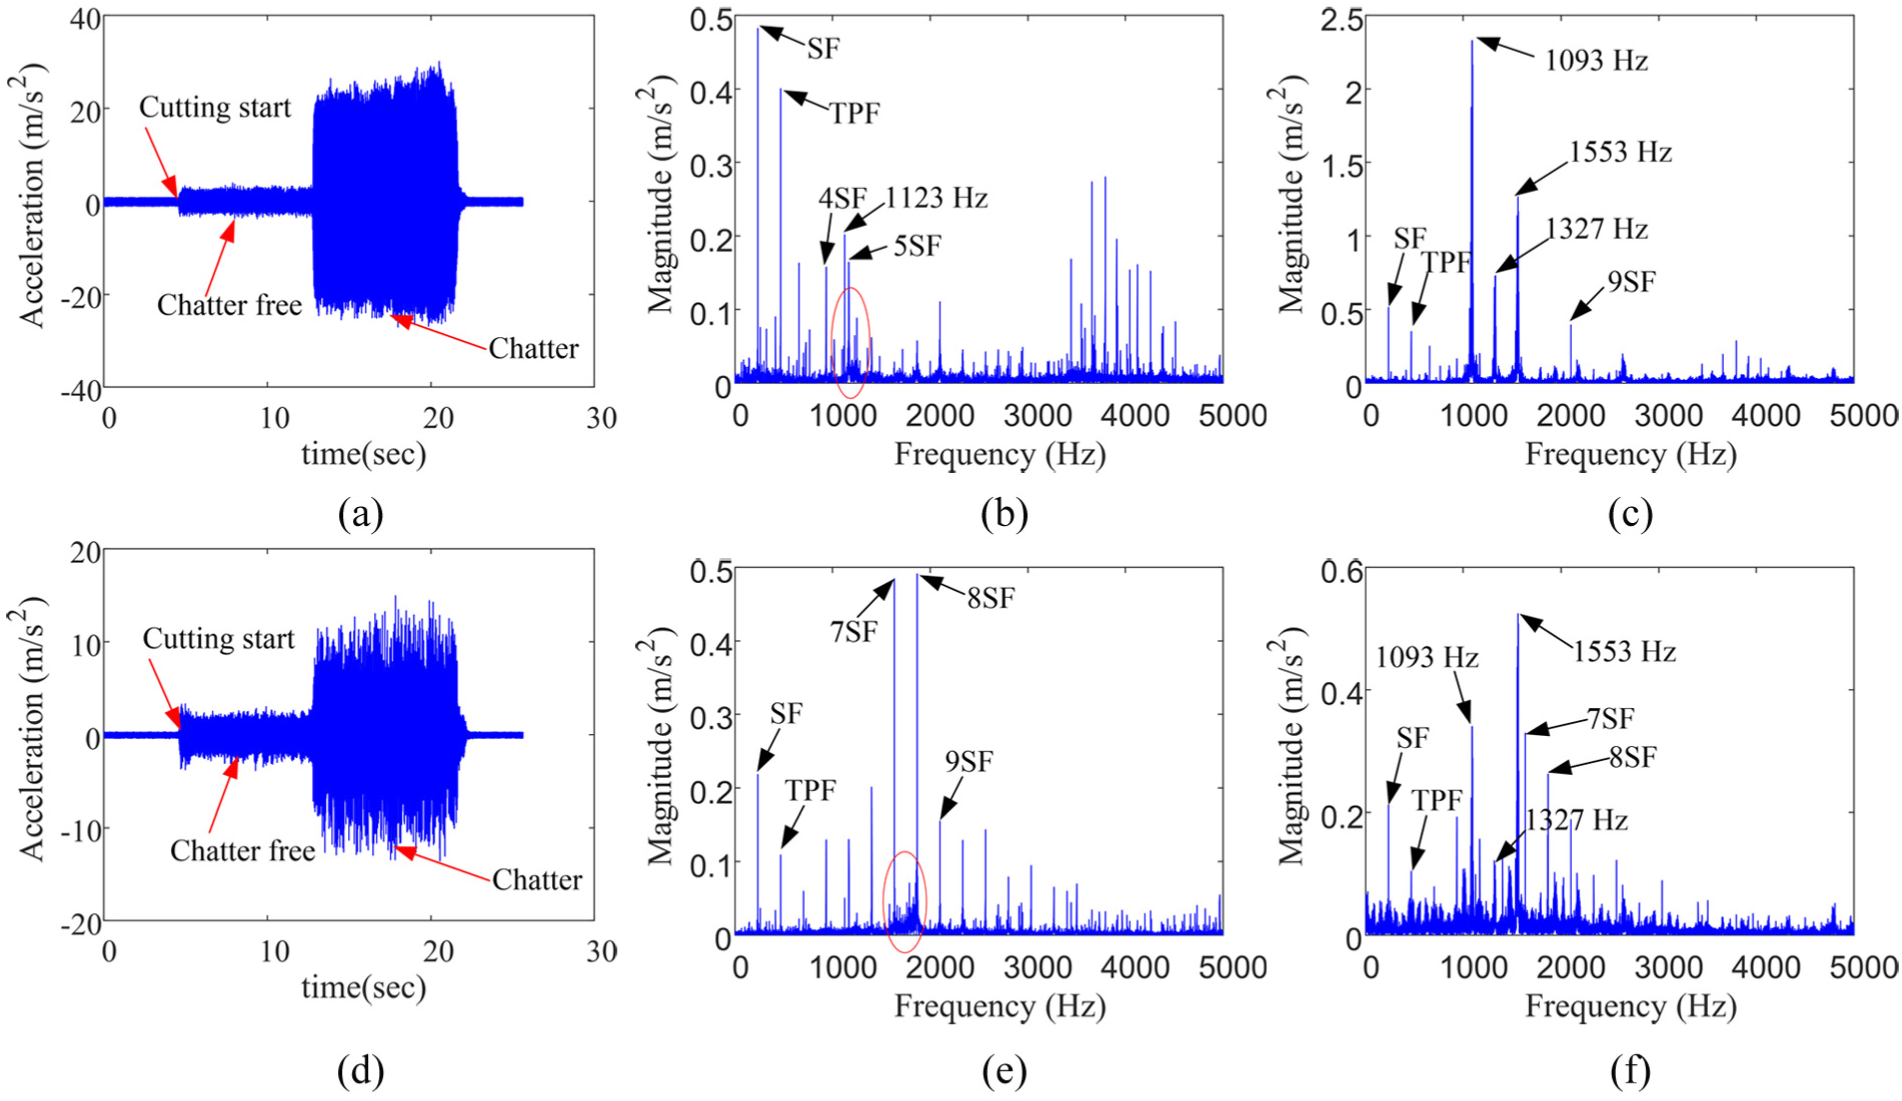
Characteristics of the acceleration before and after chatter occurs (n = 14,000 r/min, fz = 1 μm) in the time and frequency domains: (a) acceleration signal in the X-axis direction in the time domain; (b) frequency spectrum of the acceleration in the X-axis direction—stable state; (c) frequency spectrum of the acceleration in the X-axis direction—chatter state; (d) acceleration signal in the Y-axis direction in the time domain; (e) frequency spectrum of the acceleration in the Y-axis direction—stable state; and (f) frequency spectrum of the acceleration in the Y-axis direction—chatter state.
Images from the chatter and chatter-free regions at the bottom surface of the slot are shown in Figure 7. Before chatter occurs, the trochoidal tool-tip trajectory marks are clearly shown on the workpiece (Figure 7(a)). However, when chatter occurs, the violent self-excited vibrations lead to the continual rubbing of the tool tip at the bottom surface of the slot. In this situation, the trochoidal tool-tip trajectory marks disappeared as shown in Figure 7(b).
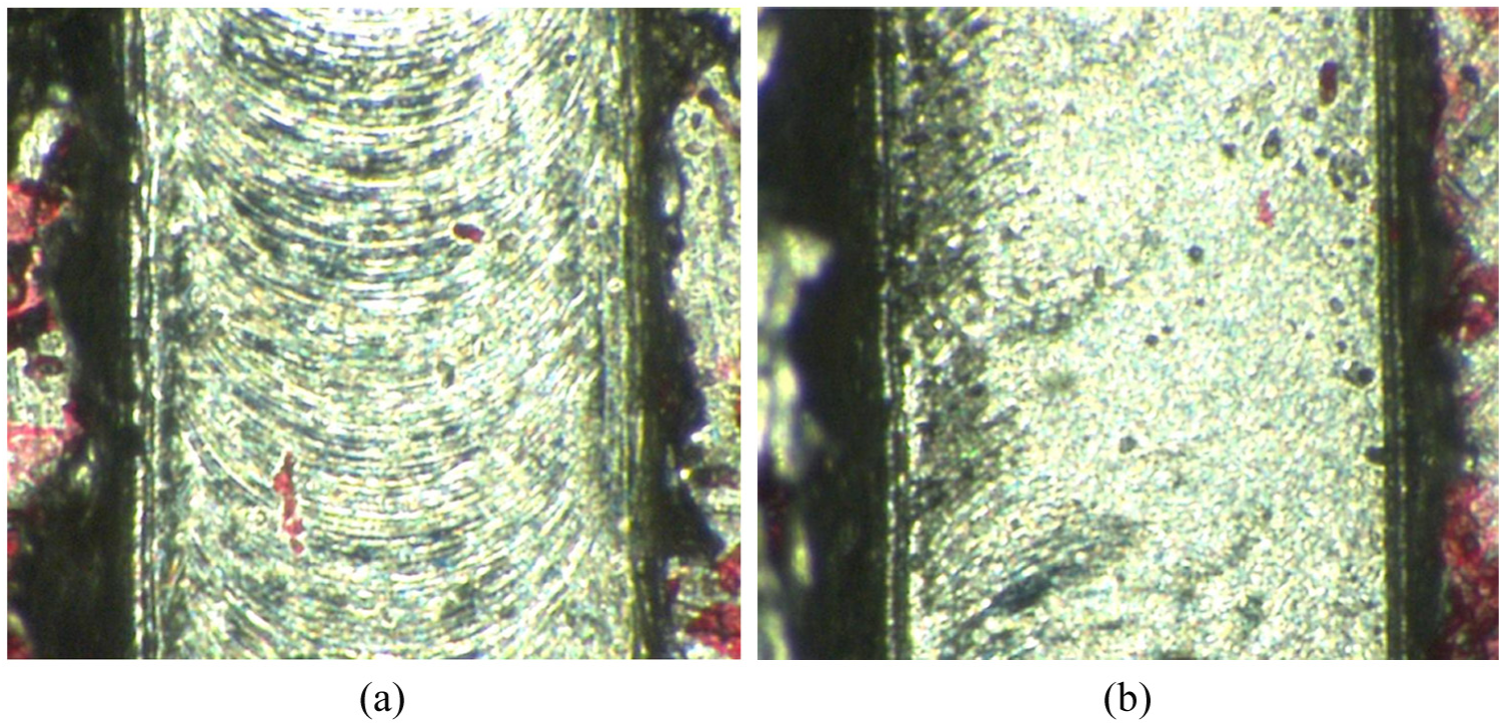
Comparison of images from chatter and chatter-free regions; (a) chatter-free region and (b) chatter region.
Surface roughness values (Ra) at the bottom of the slot surface were measured by a Talysurf 50 stylus tip profilometer, traveling along a straight line over the bottom surface of the machined workpiece. The minimum resolution of this profilometer is 0.16 nm. Surface roughness values consponding to each cutting condition were measured five times. The surface roughness consponding to a spindle speed of 14,000 r/min at different feeds per tooth is shown in Figure 8. Filiz et al. 48 experimentally studied the variation of surface roughness in micro-end-milling processes. Their results have shown that the surface roughness is nearly constant when the feed per tooth is smaller than 3 μm/tooth and increases with feed rate for larger feed rates. These results are consistent with Filiz’s results at high feed rates, that is, 3–7 μm/tooth as shown in Figure 8. However, it is clearly shown that the surface roughness suddenly increases at a feed per tooth of 1 μm. As discussed above, chatter occurs when the feed per tooth is 1 μm. This indicates that chatter occurance clearly leads to poor surface finish.
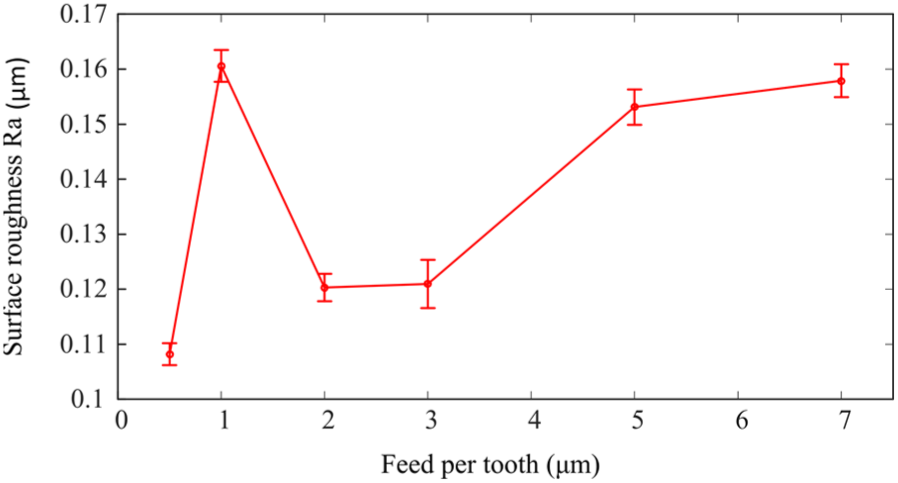
The variation of surface roughness at different feeds per tooth.
Based on equation (2), the wavelet cross spectra and the wavelet coherence of the accelerations in the X- and Y-axis directions are calculated and presented in Figure 9. The values of the wavelet cross spectra and of the wavelet coherence are displayed in colors with the scale presented to the right of the graph, respectively. It can be seen that the value of the wavelet cross spectrum is almost zero during the first stage as shown in Figure 9(a). The values of the wavelet coherence are mainly distributed in multiples of SF and do not exceed 0.8 in the first stage (Figure 9(b)). However, there are distinct increases in the value of the wavelet cross spectrum in the high-frequency bands when chatter occurs during the second stage. The two accelerations are highly correlated at the chatter frequency, resulting in a sharp increase in the wavelet coherence to a value approaching unity as shown again in Figure 9(b).
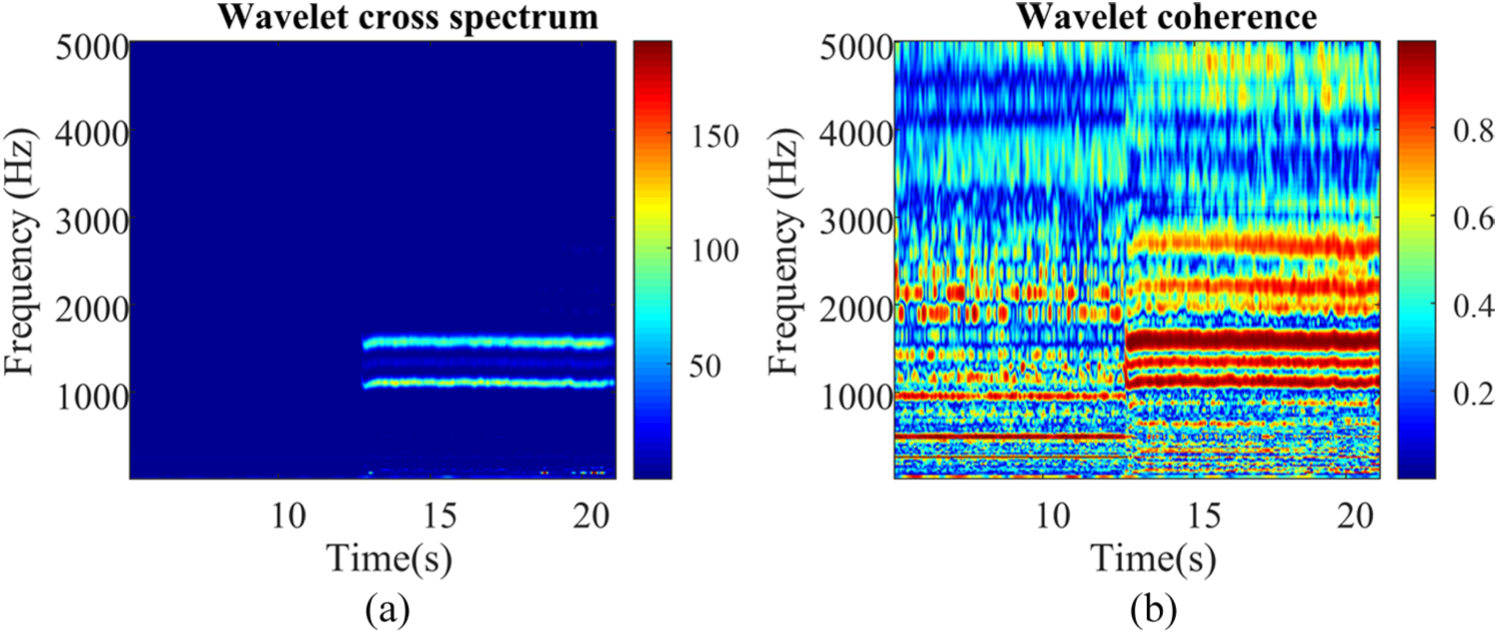
The wavelet cross spectra and wavelet coherence of accelerations in X- and Y-axis direction (n = 14,000 r/min, fz = 1 μm): (a) wavelet cross spectrum and (b) wavelet coherence function.
Sensitivity of wavelet coherence functions for chatter detection
The sensitivity of wavelet coherence functions for chatter detection is tested corresponding to a micro-end-milling process at a spindle speed of 16,000 r/min and a feed per tooth of 1 μm. Figure 10 shows the accelerations in the time and frequency domains, the wavelet cross spectra, and the wavelet coherence of the accelerations in the X- and Y-axis directions. This cutting process can also be divided into two stages. In the first stage from 3.8 to 7 s, there are obvious variations of the acceleration amplitudes in the time domain as shown in Figure 10(a) and (d). The frequency spectra of the accelerations in the X- and Y-axis directions during this stage are shown in Figure 10(b) and (e), respectively. In both directions, the dominant frequency is still SF, but the TPF is not significant. This implies that the cutting tool edges are not anymore equally engaged with the workpiece. In the X-direction, an obvious peak occurs at 1098 Hz, and there are abundant small peaks around this frequency. While, an obvious peak occurs at 1867 Hz which is 7 × SF and there are abundant small peaks between 1067 Hz (4 × SF) and 1867 Hz (7 × SF) in the Y-axis direction. This indicates that the cutting system is gradually becoming unstable, that is, the onset of chatter before it fully develops. This state will be referred to as marginal stability/chatter state. Chatter is fully developed at 7 s, and its occurrence is discontinuous which can be clearly identified from the time-domain waveform of the acceleration. This stage can be referred to as the discontinuous chatter stage. This discontinuous chatter might be caused by the nonlinearity of the cutting process when chatter occurs. Significant tool–workpiece vibrations may lead to loss of contact between the tool and workpiece at some time instances. The frequency spectra of the acceleration signals in the X- and Y-axis directions in this stage are shown in Figure 10(c) and (f). In the X-axis direction, there are three obvious dominant frequencies located at 989.6, 1257, and 1523 Hz. The pattern is similar to the previous cases, with a central peak at 1257 Hz, and SF-modulated two side-band peaks, with a spacing of 266 Hz. There are more small peaks between 1067 (4 × SF) and 1867 Hz (7 × SF) compared to marginal chatter in the Y-axis direction. Although, the largest amplitude appears at the frequency of 1867 Hz (7 × SF) in the Y-axis direction, frequencies at 1257 and 1523 Hz can also be clearly observed. Figure 10(g) presents the wavelet cross spectra of the acceleration in the X- and Y-axis directions. The value of the wavelet cross spectra is small in the marginal chatter stage. In the discontinuous chatter stage, the value of the wavelet cross spectra increases with the occurrence of chatter. The wavelet coherence of the accelerations is shown in Figure 10(h). The value of the wavelet coherence in the high-frequency band obviously increases during marginal chatter, which demonstrates that the wavelet coherence can detect chatter even before it is fully developed. Therefore, action can be taken to restrain chatter in the marginal chatter stage. The wavelet coherence also changes with the occurrence of chatter in the discontinuous chatter stage, which demonstrates that the wavelet coherence can sensitively monitor the occurrence of chatter.
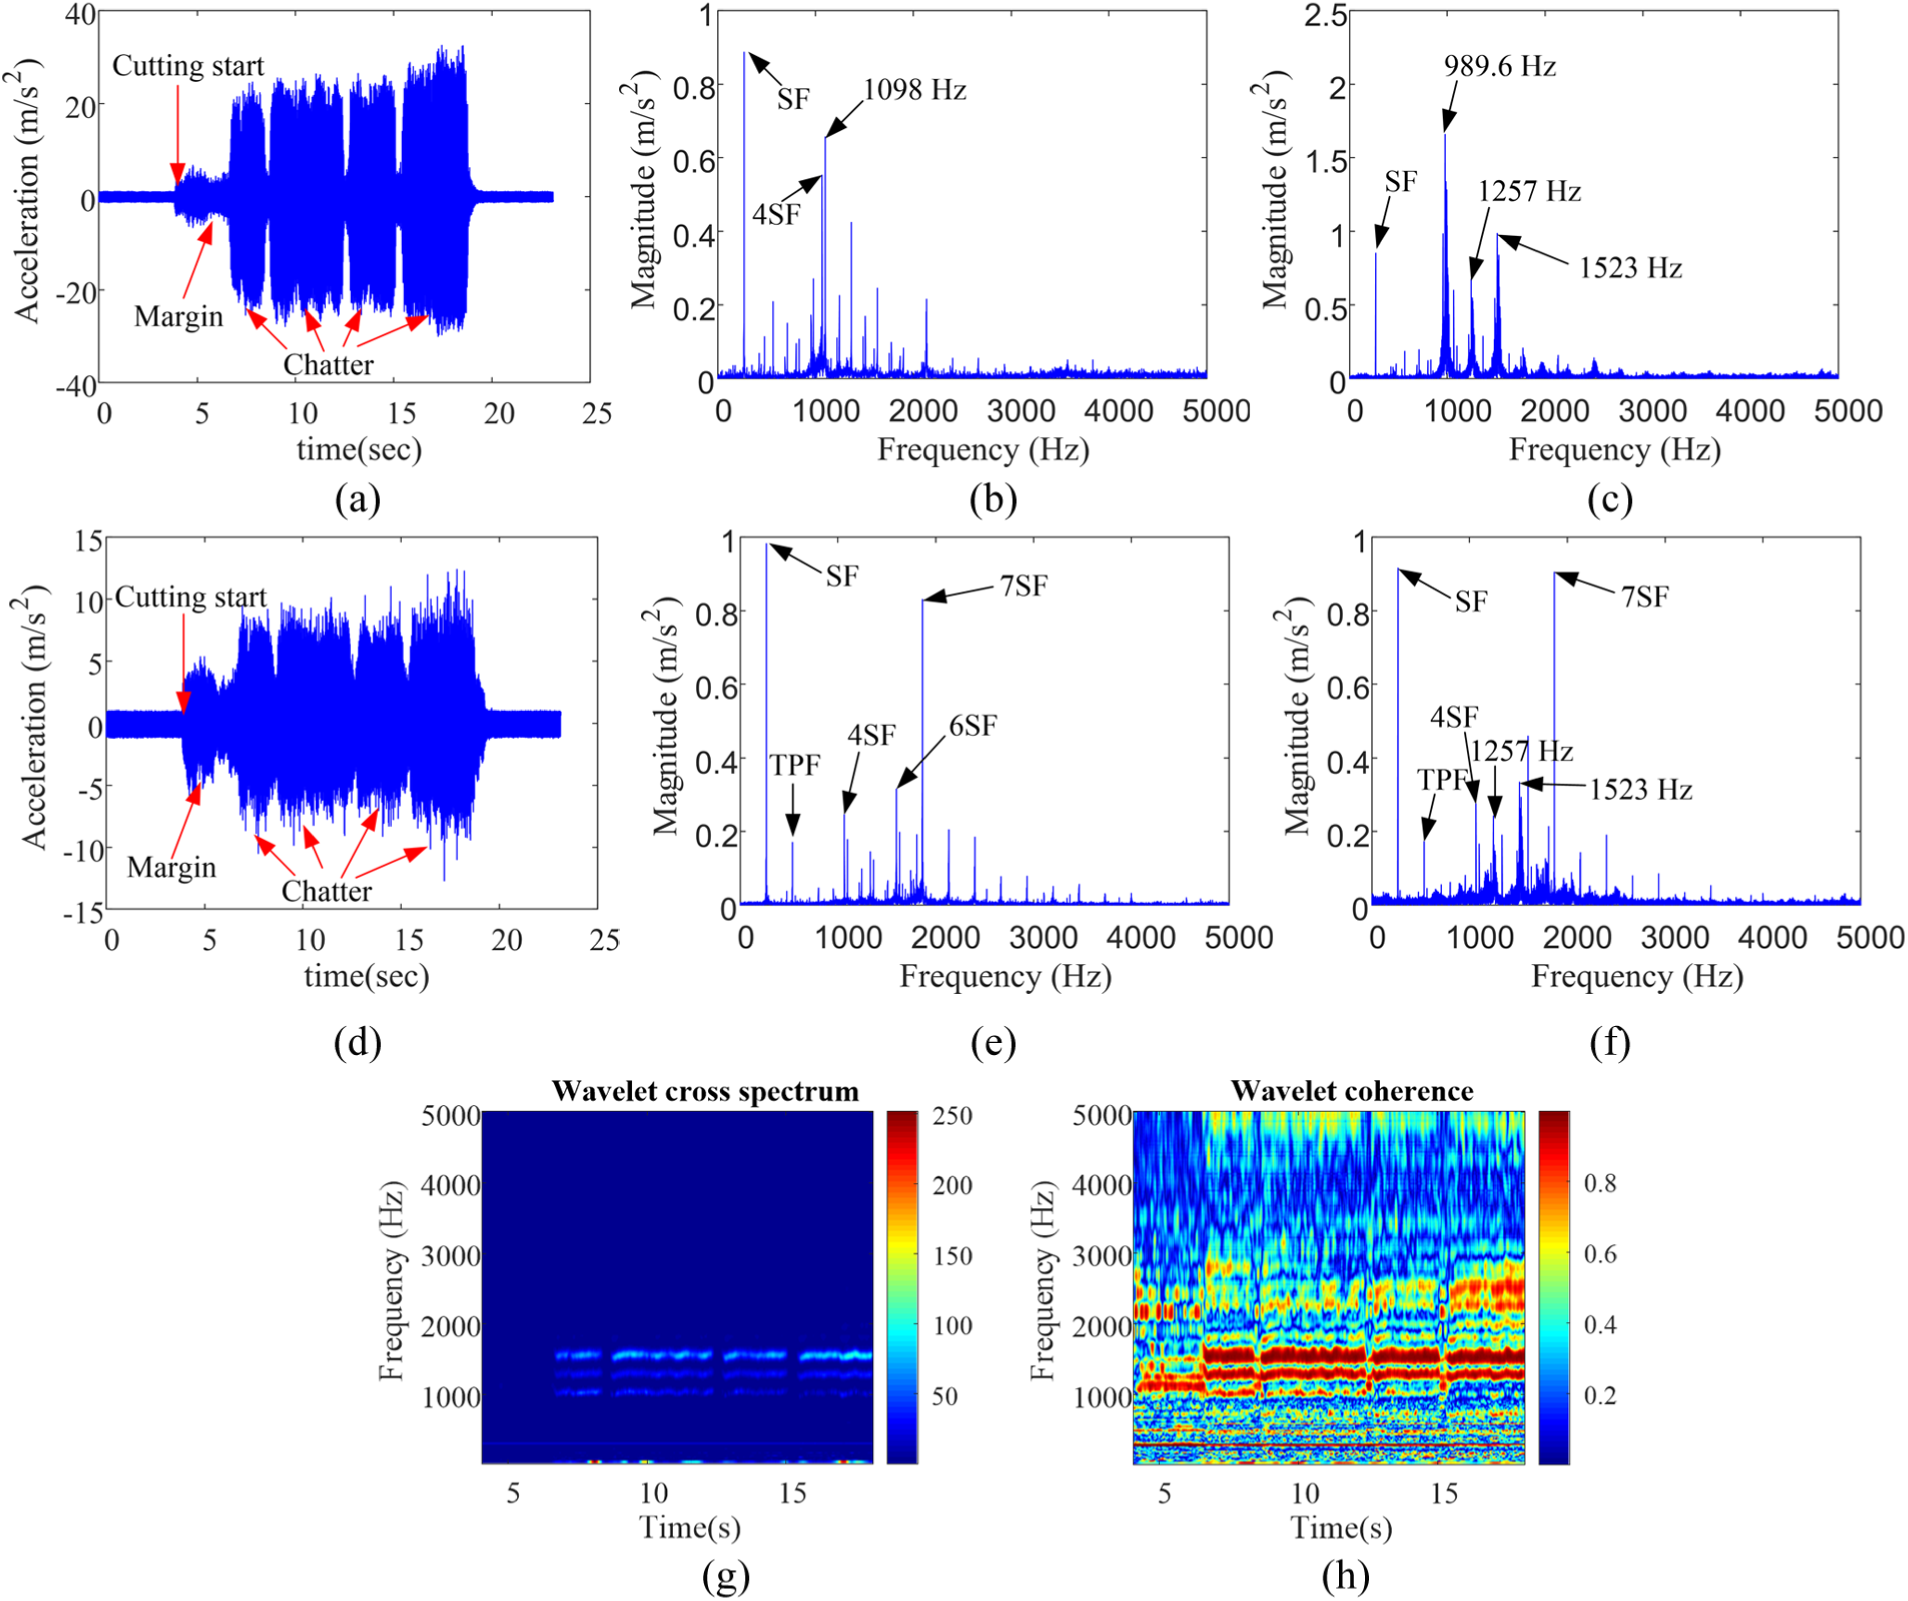
Characteristics of the acceleration, the wavelet cross spectrum and wavelet coherence of the accelerations in the X- and Y-axis directions (n = 16,000 r/min, fz = 1 μm): (a) acceleration signal in the X-axis direction in time domain; (b) frequency spectrum of the acceleration in the X-axis direction—marginal chatter; (c) frequency spectrum of the acceleration in the X-axis direction—discontinuous chatter; (d) acceleration signal in the Y-axis direction in time domain; (e) frequency spectrum of the acceleration in the Y-axis direction—marginal chatter; (f) frequency spectrum of the acceleration in the Y-axis direction—discontinuous chatter; (g) wavelet cross spectrum; and (h) wavelet coherence.
Conclusion
In this article, a novel chatter-detection method is proposed for micro-milling processes based on the wavelet coherence function. The novel chatter-detection method integrates the useful properties of the coherence function for chatter detection and of WT for adaptive time–frequency analysis. The method relies on the use of acquired orthogonal acceleration signals to calculate the wavelet coherence functions directly without complex feature extraction; thereby, providing an easy way to detect chatter. During chatter, the cutting system vibrates simultaneously in both the X- and Y-axis directions and is characterized by two correlated harmonic signals at the same chatter frequency at which nearly all the vibration energy is concentrated. Therefore, the value of the wavelet coherence function at the chatter frequency approaches unity at the onset of chatter. The feasibility and sensitivity of the proposed method are verified by experiments. The experimental results show that the method can effectively monitor the occurrence of chatter even before chatter fully develops. Since the proposed chatter-detection method does not rely on complex feature extraction, it has the potential to be broadly applied in industrial machining operations.
Footnotes
Appendix 1
Acknowledgements
The authors would like to thank the School of Mechanical and Manufacturing Engineering, UNSW for assistance with the experiments, and the National Foundation of China (grant no. 51675367). The authors would also like to acknowledge the contribution of Dr Yun Chen in the experimental work.
Declaration of conflicting interests
The author(s) declared no potential conflicts of interest with respect to the research, authorship, and/or publication of this article.
Funding
The author(s) disclosed receipt of the following financial support for the research, authorship, and/or publication of this article: The National Foundation of China (Grant No. 51675367).