
Abstract
The fabrication of nanostructure materials using severe plastic deformation techniques with improved properties has received attention over the recent years. Twist extrusion has become one of the most widely spread techniques of the severe plastic deformation processes. This article reports the experimental investigations on the twist extrusion forming of AA6082-T6 aluminum alloy. The central composite design was utilized to plan the experiments, and response surface methodology was employed for developing experimental models. The forming load, temperature and number of passes were considered as input parameters in this study. The process performances such as tensile strength and hardness were evaluated. The results of analysis of variance indicated that the proposed mathematical models obtained can effectively describe the performances within the limits of factors being studied. The experimental values were in good agreement with the predicted values.
Keywords
Introduction
Aluminum and its alloys play a vital role in modern engineering as they are the most used nonferrous material. The 6xxx group of aluminum alloys contains magnesium and silicon as the major alloying elements. 1 AA6082-T6 is a precipitation hardenable medium strength alloy, which has the highest strength in the 6xxx series. 2 Due to its superior mechanical properties, good corrosion resistance, ease of processing and low cost, it has been widely used in automotive, aerospace and construction engineering. 3 It is difficult to obtain the ultrafine grain (UFG) structures with grain size of <10 µm using the conventional recrystallization process and thermo-mechanical treatments in aluminum alloys, but it is possible to obtain UFG structures of aluminum alloys with grain size of <1 µm by applying bulk forming processes based on severe plastic deformation (SPD). 4 SPD is one of the promising techniques applied to bulk materials to produce fine grain structure with gorgeous properties. 5 Several basic SPD techniques such as equal channel angular pressing (ECAP), 6 high-pressure torsion (HPT), accumulative roll bonding (ARB), multiaxial forging and twist extrusion (TE) 7 and derivative SPD processes such as cyclic extrusion compression (CEC), 8 repetitive corrugation and straightening (RCS) and twist channel angular pressing (TCAP) 9 have been used to improve the properties of metals. TE is a relatively new and attracting SPD technique in a group of metal forming processes through which large strains are induced in the material in order to obtain significant grain refinement.10,11 Many studies have been reported on the SPD process of AA6082-T6 aluminum alloys, but very few studies on TE process of AA6082-T6 alloy have been reported so far.
A commercial AA6082 alloy in fully annealed condition processed by ECAP to attain UFG structure was investigated by Angella et al. 12 This study was focused on evolution of intermetallic in alloy structure and the final tensile properties and fracture behavior. It was noted that individual grains elongate and shear bands appear after the first pass, and the elongation gets reduced in the following passes. It was also found that pure silicon particles get diminished after six ECAP passes, whereas the amount and composition of other secondary phases remained substantially unchanged. Also, the alloy strength underwent a steep rise during the first pass and near saturation on further straining. Micro-hardness measurement suggested that moderate aging effect was better. The microstructure and texture in Al 6082 commercial alloy as a function of number of ECAP passes were evaluated by Chowdhury et al., 13 where the low-angle grain boundaries (LAGBs) in nonequilibrium state were converted into more equilibrated high-angle grain boundaries (HAGBs). It was found that UFG microstructure with high dislocation density (4 × 10¹⁴ m−2) was achieved after one pass and increased with the number of passes. The texture weakened up to four passes, but it was quite unaffected between four and eight passes. The yield strength increased monotonously even after saturation of dislocation density. The grain size indicated that more equilibrated HAGBs have higher strengthening effect than nonequilibrium boundary structures. A study on the evolution of UFG microstructure in a commercial Al 6082 alloy during ECAP processing was presented by Gubicza et al. 14 X-ray diffraction profile was used to determine crystalline size and dislocation density. The material was aged at 420 °C for 40 min before ECAP and was considered as an initial specimen. It was proved that a nano-sized microstructure with high dislocation density was achieved even after one ECAP pass and dislocation density increased with increase of ECAP deformation up to 4 passes. Also the yield stress increased with the increase of ECAP deformation up to four passes, which was two times higher than the initial state of specimen. Valiev et al. 15 investigated that UFG metals and alloys can be easily fabricated by ECAP procedure. To upgrade the process efficiency and techniques to deform hard materials, modified conventional ECAP was used. Serious attention was given to basic principles in ECAP-like slip systems and shearing patterns. It was concluded that ECAP is experimentally influenced by pressing regimes and die geometry, and it is also important to recognize that processing by ECAP represents an effective tool for achieving grain refinement. It was also reported that it is important to acknowledge that recent studies have demonstrated very clearly a great potential for the use of SPD processing and the incorporation of ECAP in industrial applications. Computational study of Ti-6Al-4V flow behaviors during the TE process was carried out by Akbari Mousavi et al. 16 The TE process under high pressure was simulated using the finite element method (FEM). The Abaqus code was used for the FEM. The Johnson–Cook constitutive equation was used to describe the behavior of the Ti-6Al-4V alloy during the twist deformation. It was reported that both the pure shear and simple shear modes are present in the TE process across the sample. It was also concluded that maximum and minimum effective strains are achieved at the corner and at the center, and the magnitude of the deformation also changes across the length of the specimen. The effective strain produced at the butt end corner of the sample was higher than that obtained at the tip corner of the sample. The TE experiments on pure aluminum were performed by Seyed Ali et al. 17 The FE analysis of the von Mises stress and the equivalent plastic strain in the outer longitudinal and transverse cross sections, which are parallel and normal to the billet axis, respectively, was carried out. It was concluded that the end of the workpiece underwent more equivalent plastic strains in contrast to the head of the sample and the corner regions experienced more strains than the center zone did. Even though many works have been reported on TE, there are only very few works reported on optimizing the process parameters for conducting TE process. In this study, the experimental investigations on the TE of AA6082-T6 aluminum alloy were carried out to find the effects of process parameters. The central composite design (CCD) was utilized to plan the experiments and response surface methodology (RSM) was employed for developing experimental models.
Experimental procedure
The material used for this study is AA6082-T6 alloy, which is machined into rectangular cross sections of size of 28 × 18 × 100 mm. The chemical composition and the mechanical properties of the material are shown in Tables 1 and 2, respectively. The split die and the container assembly used for conducting the experiments are shown in Figure 1(a) and (b). TE experiments were conducted in a Yuken-made 150-ton hydraulic press for three different passes by maintaining the specimens and die at 350°C for every pass. Similarly, the experiments were carried out at the temperatures of 425°C and 500°C, respectively. Initially, the billet was inserted in the die, which has a cross section of 28 × 18 mm. After deforming in the twist die, which has a slope angle of β = 36°, it comes out in the die with the cross section of 18 × 28 mm. The billet was inserted in the same direction to perform the second and third passes. The ram speed was maintained at 1 mm/s for every pass. The twist extruded specimens were cooled in ambient air to relieve the internal stresses.
Chemical composition of the AA6082-T6 aluminum alloy.
Mechanical properties of AA6082-T6 aluminum alloy.
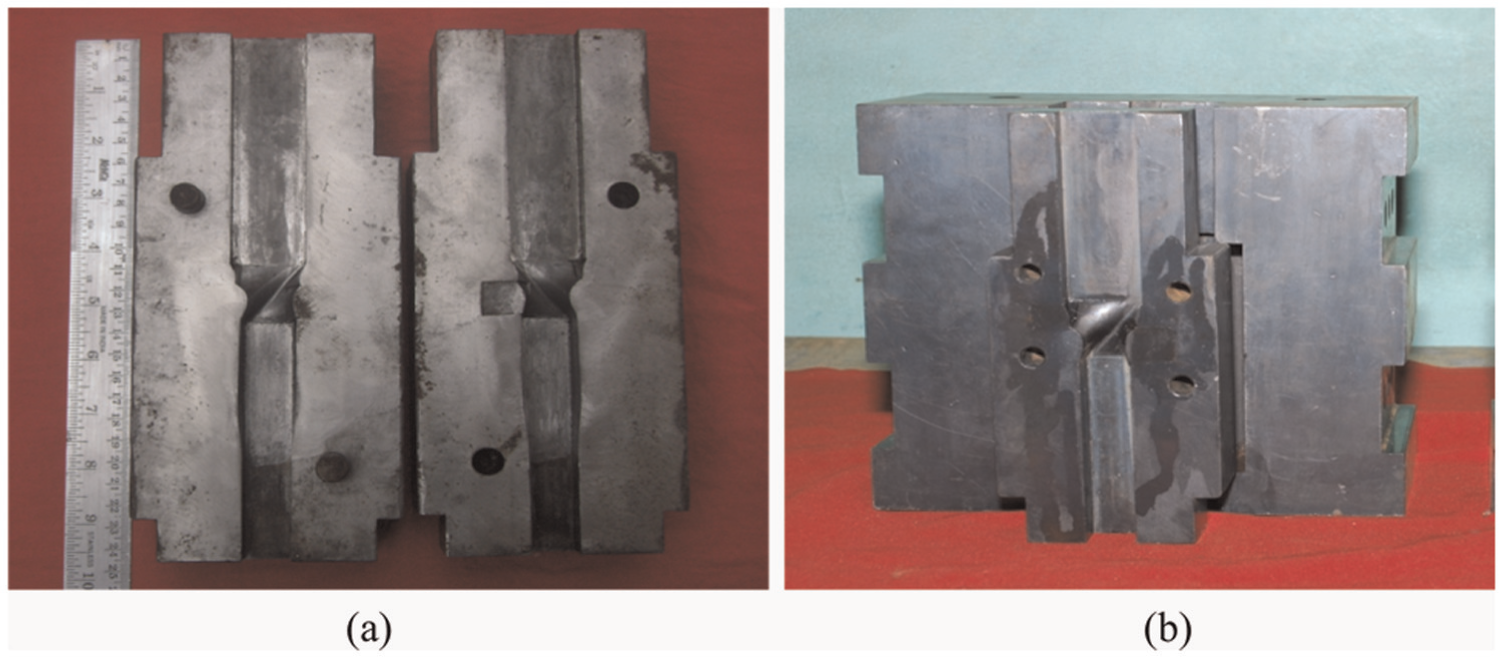
(a) Split die and (b) container and die assembly.
The specimens before and after three TE passes are shown in Figure 2(a) and (b). Vickers hardness (HV) test was conducted using an Akashi MVK-E3 testing machine with an applied load of 25 g for 15 s.
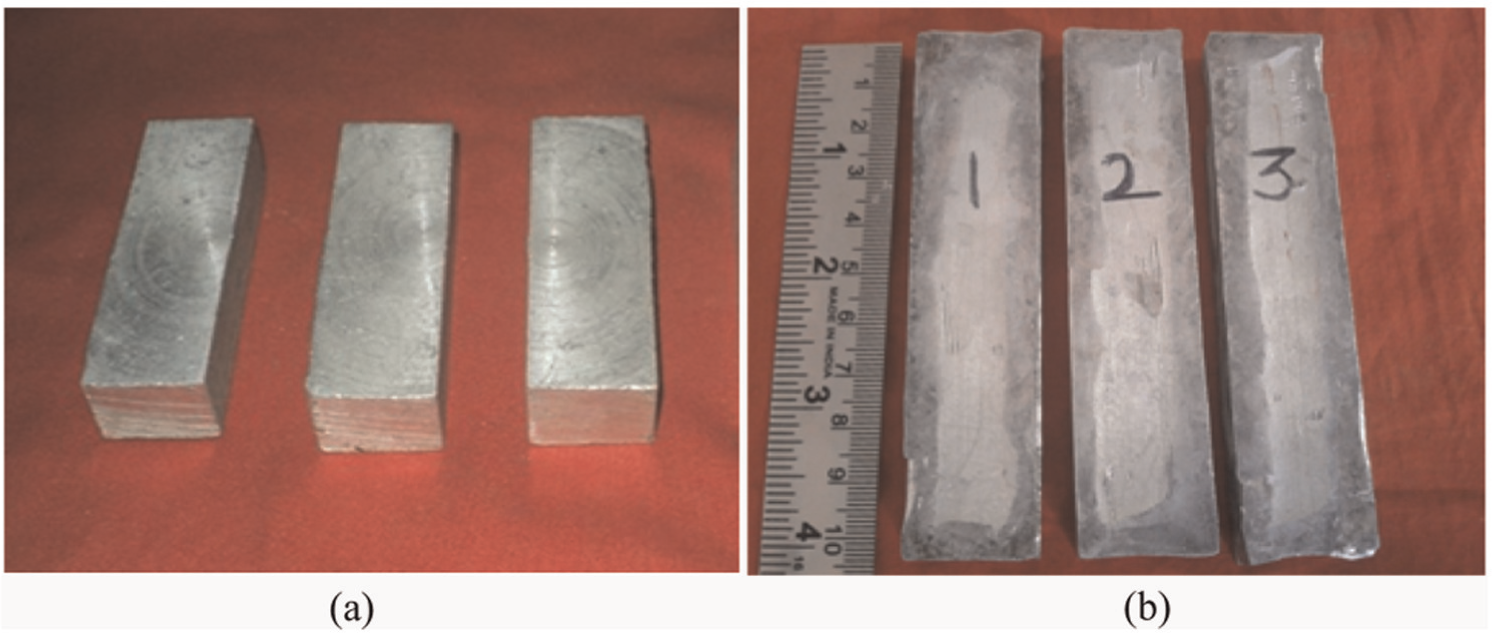
AA 6082-T6 specimens: (a) before twist extrusion and (b) after three twist extrusion passes.
Specimens were cut in longitudinal and transverse directions by an abrasive saw, mechanically ground by abrasive papers and polished with a cloth containing suspension of silica powders. Hardness measurements were made with an interval of 0.5 mm to avoid any effect of neighboring indentations. The specimens for conducting the tensile tests were prepared using ASTM B557M-10 standard.
Hounsfield extensometer universal testing machine of model H20 K-W of 20 kN capacity was used for performing the tensile tests. The specimen is held at ends by means of grips with grip holder of the crosshead. One end of the specimen is kept fixed, while the other end is attached to a mobile crosshead. The crosshead moves by means of an electric motor. The equipment has a provision for simultaneously measuring the applied load versus elongation.
The tensile test specimens before and after fracture are shown in Figure 3(a) and (b). The microstructural study was carried out on a Hitachi S-3400N scanning electron microscope (SEM) after preparing the specimens by polishing and etching with Keller’s solution to reveal the microstructure. To study the microstructural changes in the specimens after TE, the specimens were prepared by cutting them perpendicular to the axial direction. Then the microstructural analysis was carried out along the longitudinal and transverse directions along the cross section.
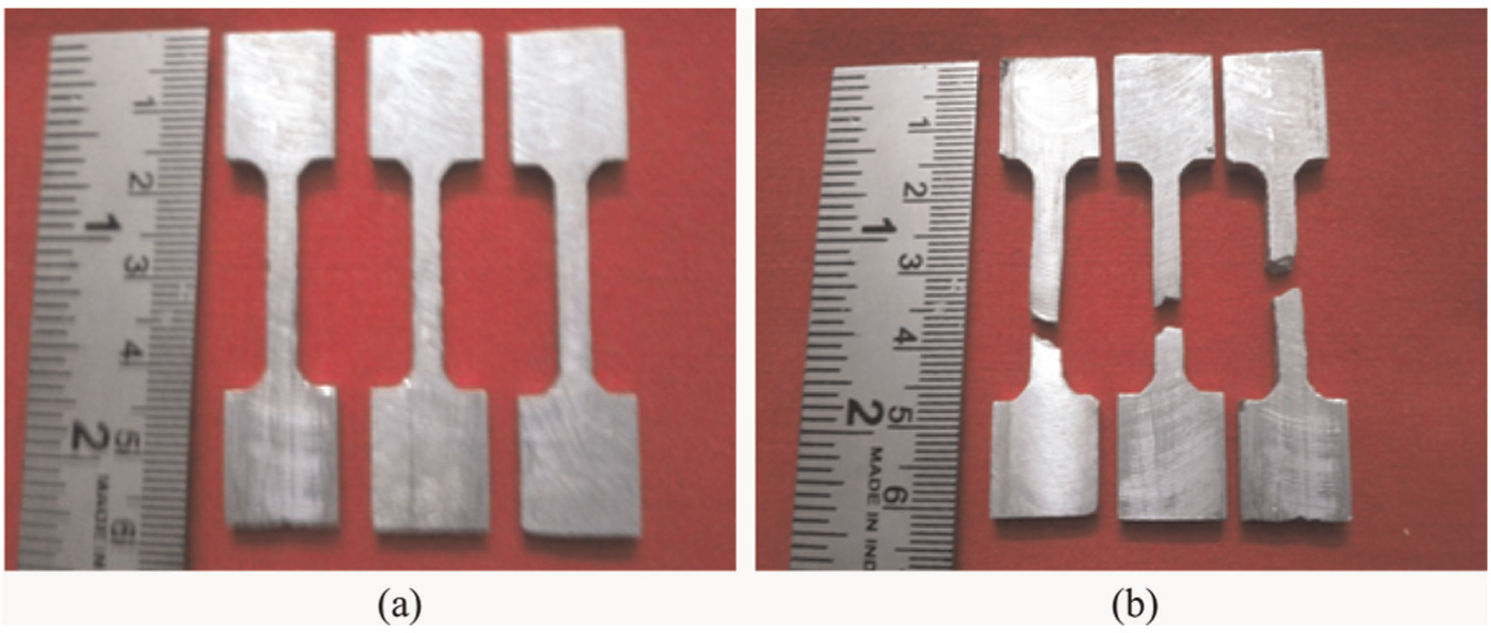
Tensile test specimens: (a) before fracture and (b) after fracture.
Development of mathematical model
The experimental outcomes are based on planning and executing the experimental procedures accurately. In order to achieve optimum results, the experiments are planned on the basis of RSM technique used in experimental design. RSM is an interaction of mathematical and statistical techniques for modeling and optimizing the response variables, which incorporates quantitative independent variables.18–21 If all the variables are assumed to be measurable, the response surface can be expressed as

where Y is the answer of the system,
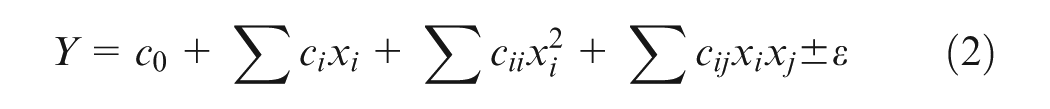
where Y is the corresponding response, xi is the coded level of n controlling forming parameters and ε is the experimental error. The terms ci, cii and cij are the second-order regression coefficients. For three factors, the selected polynomial could be expressed as
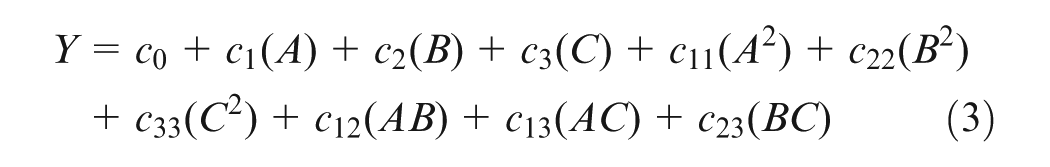
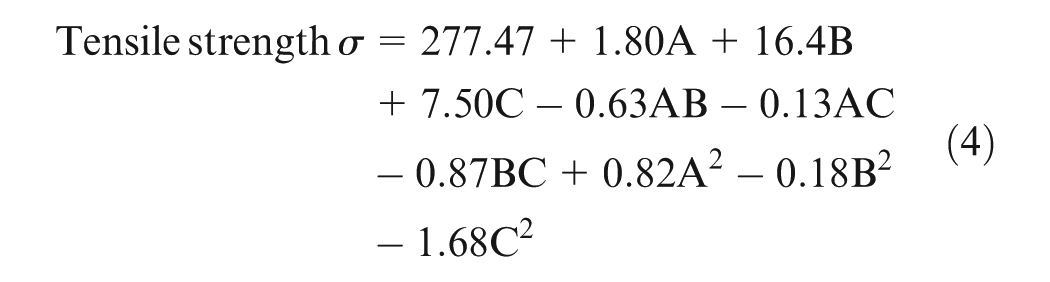
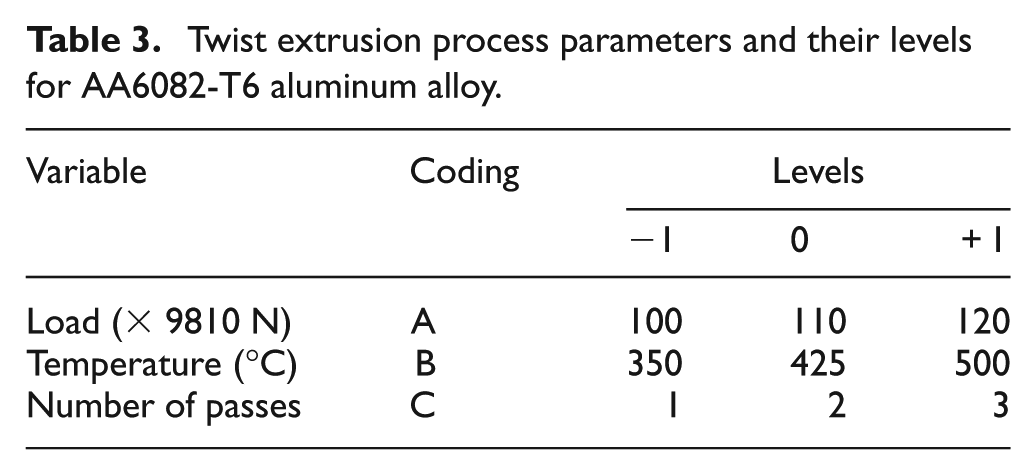
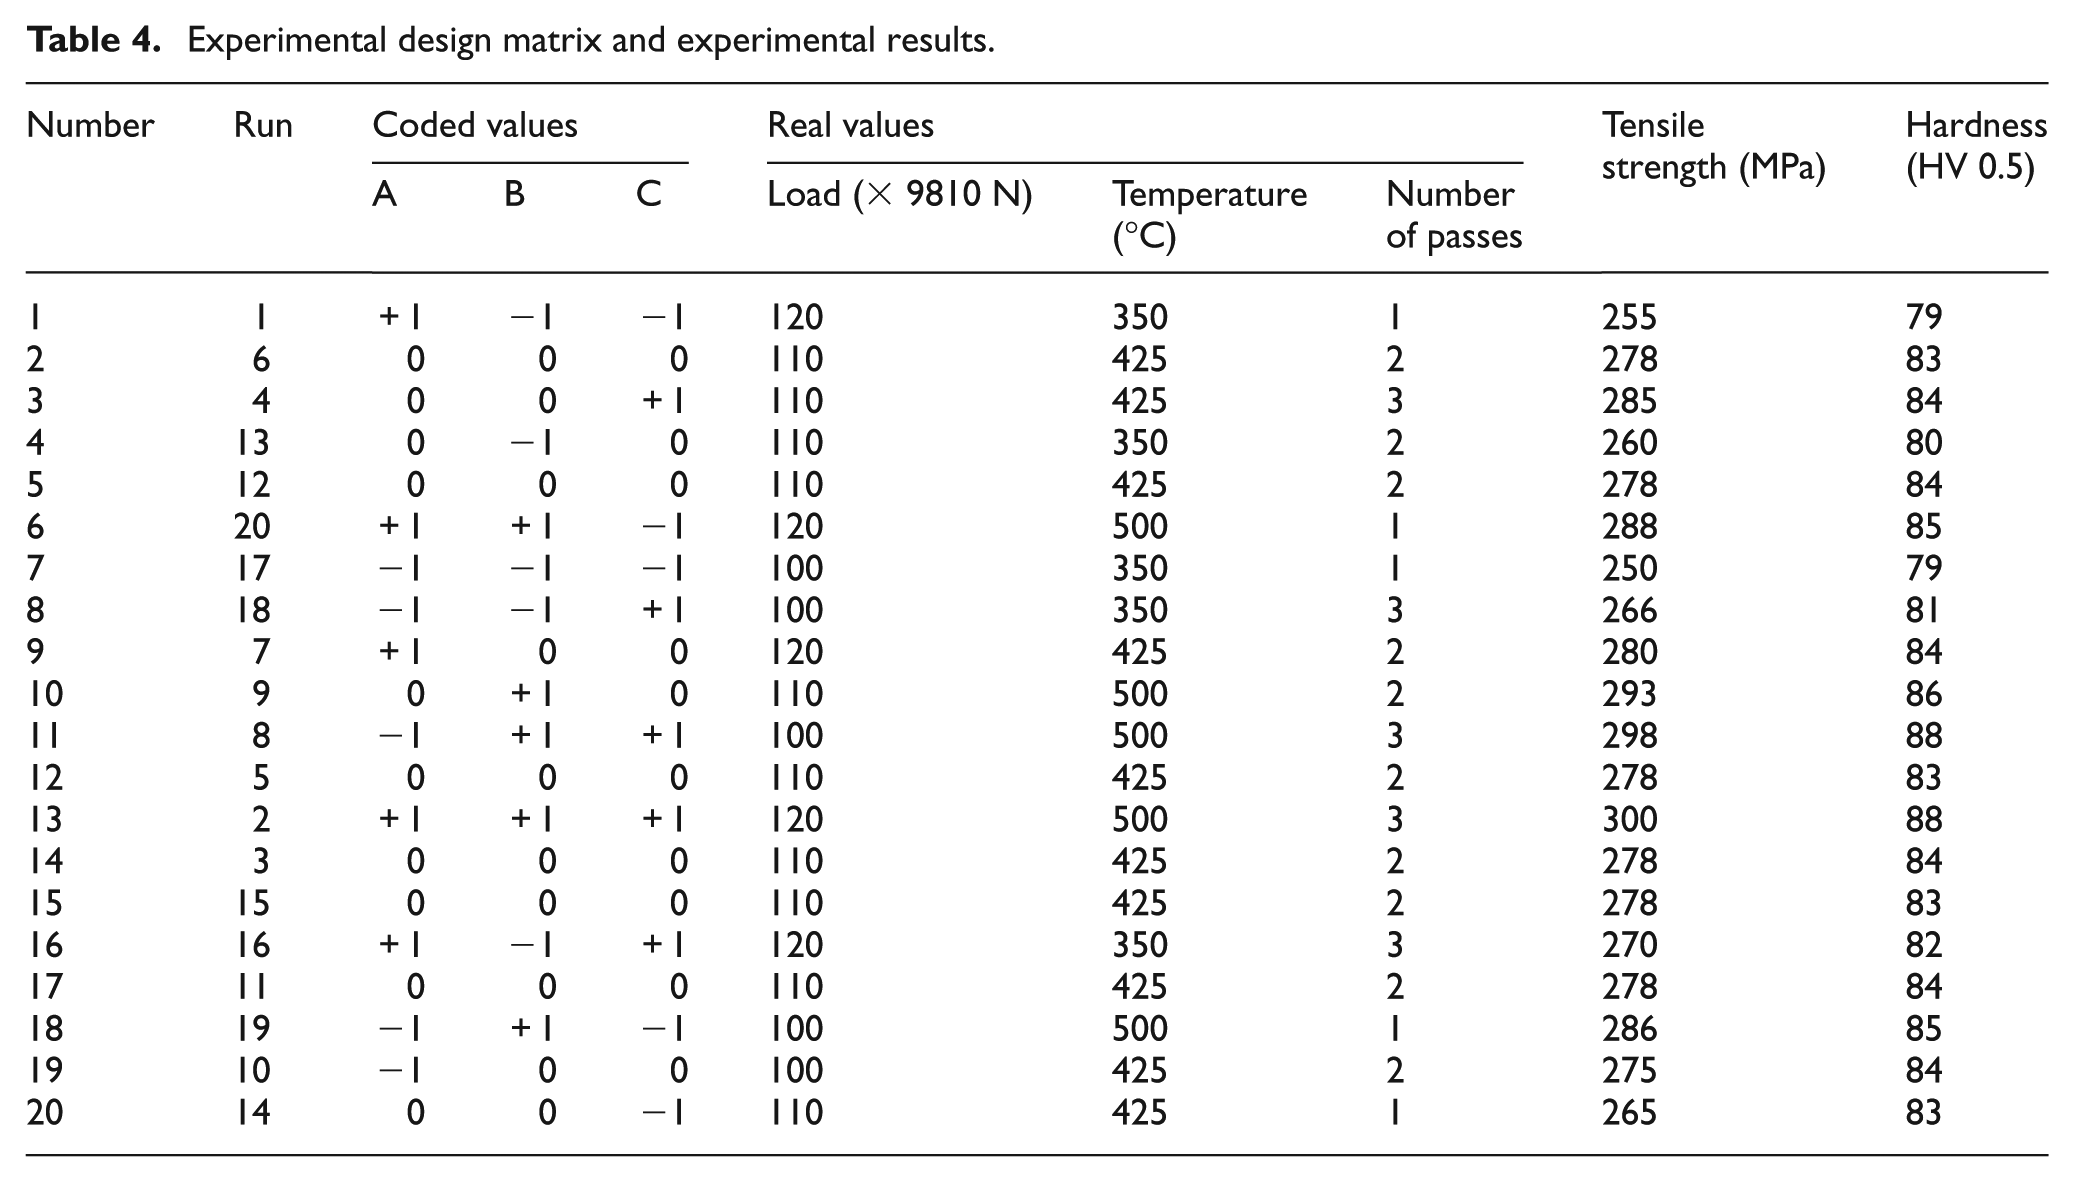
The experiments were designed on the basis of the CCD technique in this study. The factorial portion of CCD is a full factorial design with all combinations of the factors at two levels (high: +1 and low: −1) and composed of eight star points and six central points (coded level 0), which is the midpoint between the high and low levels, corresponds to α value of 1. 22 Table 3 shows the coded and actual values of the three TE process parameters and their possible ranges. The load calculations were arrived from the initial stage of the die design. It depends on the dimensions of the workpiece. In order to study the effect of the load characteristic, three different limits were selected from the calculated load based on trial and error. The temperature ranges were selected in between hot working range of >0.5 Tm of AA6082-T6 alloy, that is, (325 °C) to the recrystallization temperature (500 °C). The numbers of passes were selected based on the previous reported results.16,23 The experimental design matrix and experimental results are presented in Table 4. According to the experimental plan, a total of 20 experiments were conducted with three various values of input process variables A, B and C. Two repetitions of experiments per alignment were conducted and the average values of the output parameters are displayed in Table 4. After determining the significant coefficients at 95% confidence level, the final model was developed only using these coefficients. The backward elimination process eliminates the insignificant terms to adjust the fitted quadratic models. 24 The final quadratic models to estimate the tensile strength (σ) and hardness (H) are given in equations (4) and (5), respectively
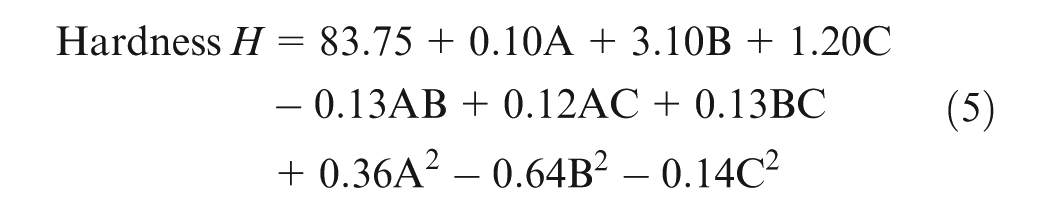
Twist extrusion process parameters and their levels for AA6082-T6 aluminum alloy.
Experimental design matrix and experimental results.
Results and discussion
Microstructural analysis
The SPD performed consecutively on the materials with low recovery rates results in decrease of grain size and also leads to homogeneous microstructures. 25 Since AA6082-T6 is a precipitation hardenable alloy, fine particles may be precipitated in the AA6082-T6 alloy during TE conducted at high temperature. The research results of Zendehdel and Hassani 26 proved that precipitates can appreciably contribute to microstructure refinement. To obtain homogeneous ultrafine microstructure, it is essential to perform TE more than one pass. As a result of this, TE experiments were conducted on AA6082-T6 alloy at different temperatures and several numbers of passes. The microstructural analyses were carried out to study the grain refinement after every pass at different temperatures. To study the effect of temperature and number of passes on grain refinement, the microstructures of the specimens processed at one, two and three TE passes at 350°C, 425°C and 500°C were taken. The results of the microstructures of one and three TE passes processed at 350 °C and 500 °C are presented in Figure 5(e) and (f). Figure 4 shows the SEM microstructure of the AA6082-T6 specimen in the as-received condition. The structure shows the coarse grains with equiaxed structures with an average grain size of 38 µm.
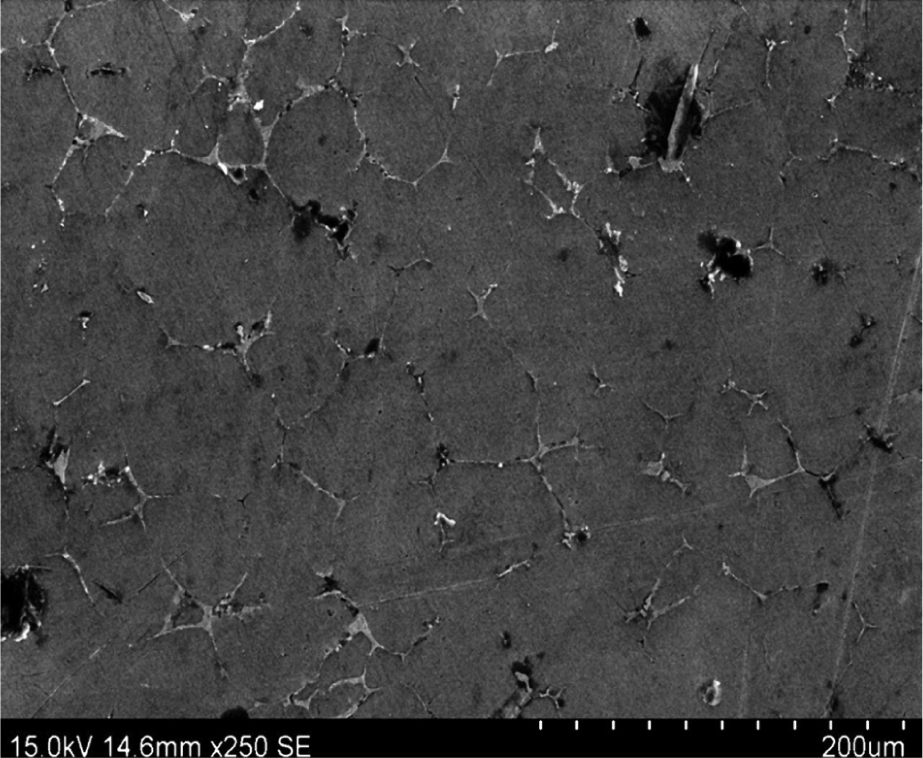
Microstructure of AA6082-T6 before extrusion.
The SEM microstructure of the specimen after one TE pass at 350 °C is shown in Figure 5(a). The microstructure indicates that the billet undergoes very high strain and the grains are oriented in the direction of twist. The grains in the outside edge are mostly elongated and the flow of the material is created due to temperature and the geometry of the TE die. It is also observed that HAGBs originate after one TE pass. Some deformation twins were also observed due to SPD. The HAGBs, which are found after first pass TE at 350 °C, recover to form fine equiaxed grains with an average grain size of 30 µm after three extrusion passes, which is observed in Figure 5(b). The microstructure becomes finer with clear vortex flow of the billet material at 425 °C as observed in Figure 5(c). The microstructure appears to be homogeneous with more number of grains after three extrusion passes at 425 °C with an average grain size of 28 µm, as illustrated in Figure 5(d). The same trend was noted in the microstructures of the specimen, as shown in Figure 5(e) and (f), where the specimen is processed at 500 °C. The average grain size was reduced from 28 to 22 µm.
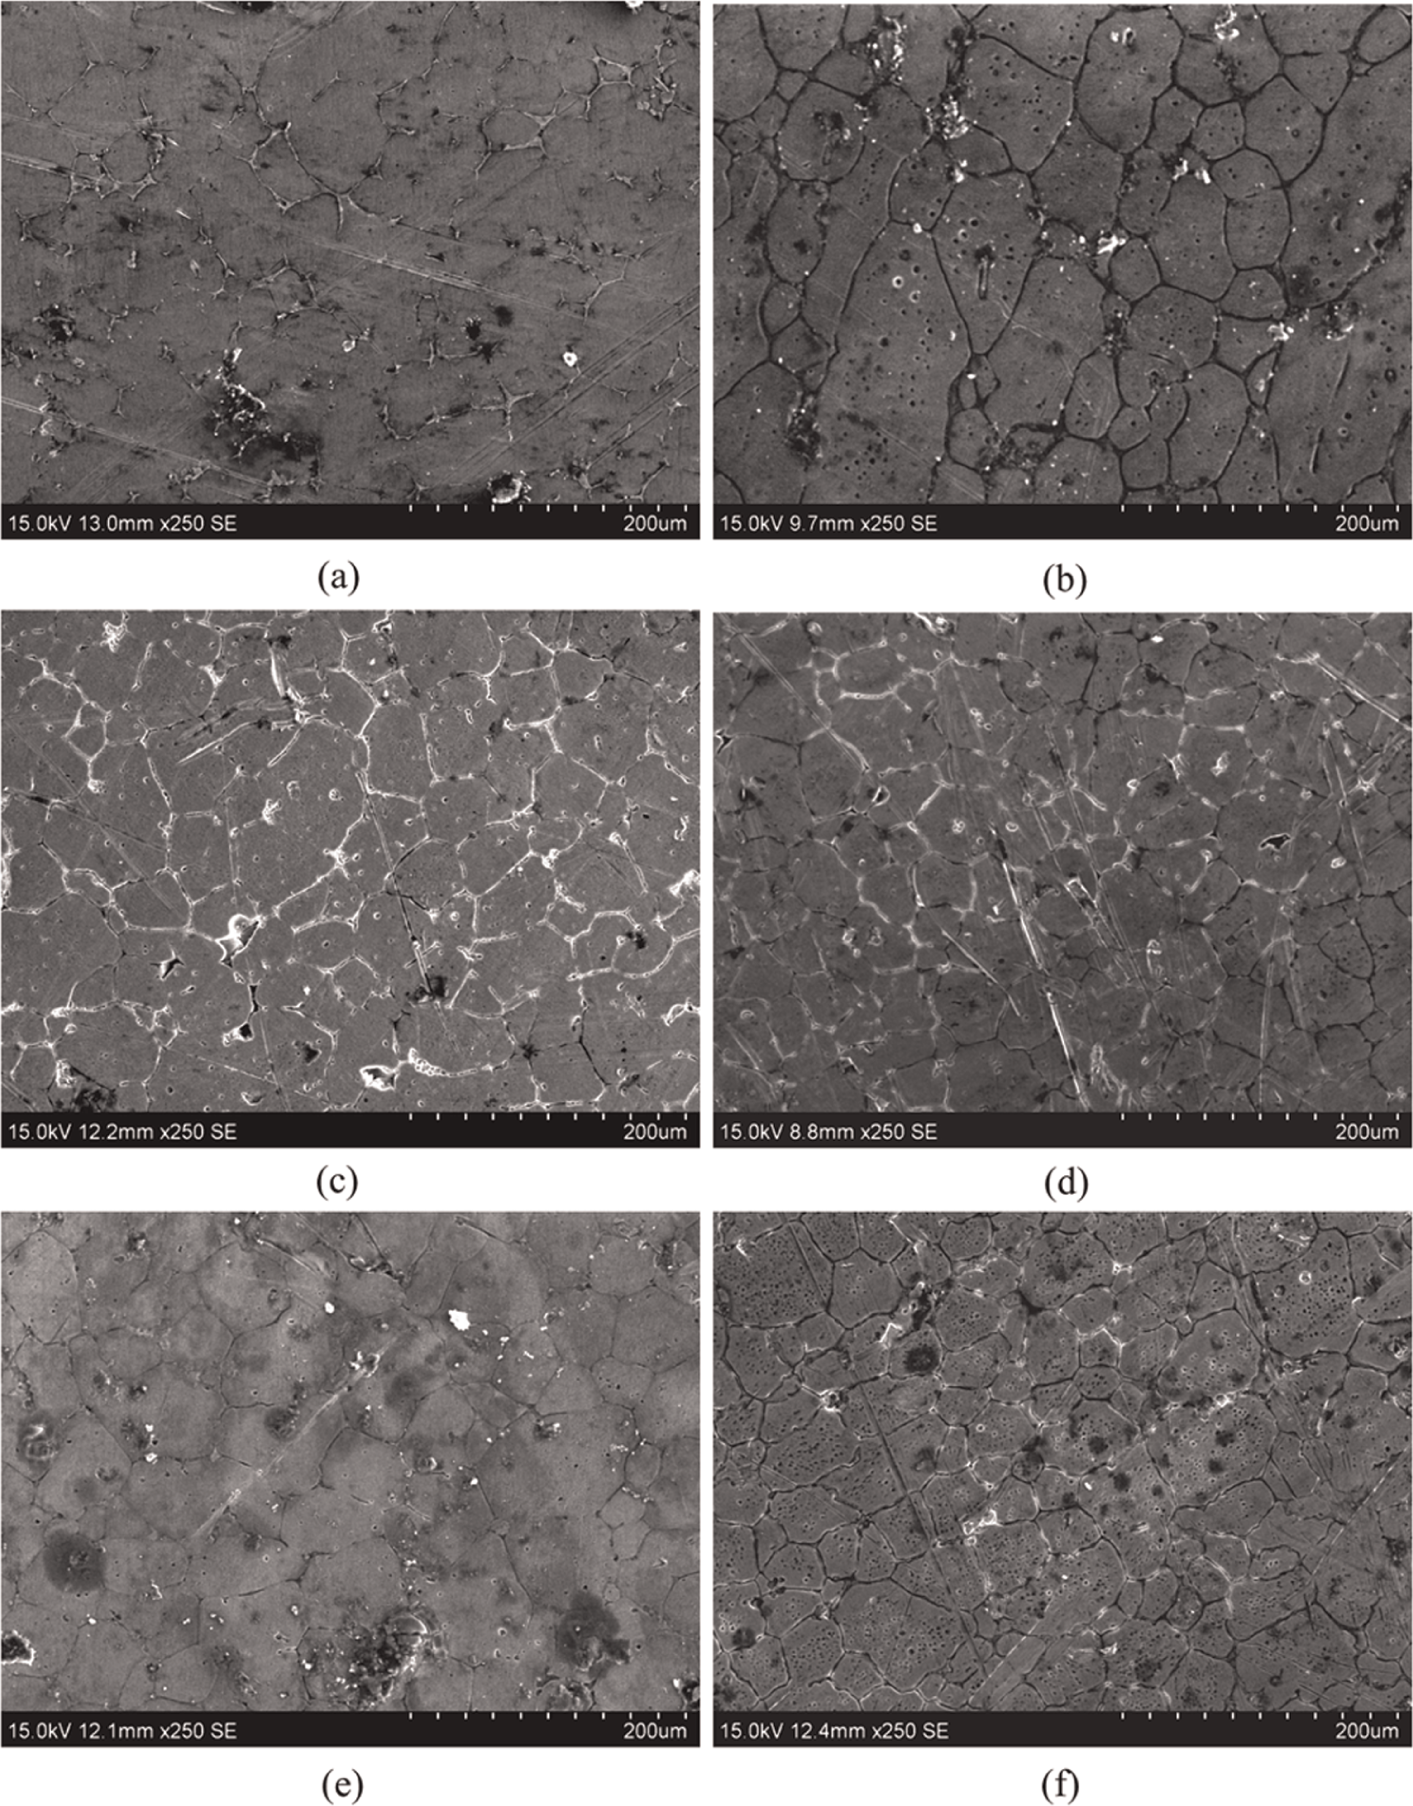
SEM microstructures of TE samples after (a) one pass at 350 °C, (b) three passes at 350 °C, (c) one pass at 425 °C, (d) three passes at 425 °C, (e) one pass at 500 °C and (f) three passes at 500 °C.
From the microstructural observations, it was observed that there is a considerable increase in the number of grains and decrease in the size of the grains at higher temperatures and more number of passes. The average grain size of the material before TE was 38 µm, which was reduced to 22 µm after three TE passes. This grain refinement may be the reason for enhanced tensile strength and hardness, which is in agreement with the results of previous studies.27,28
Testing the adequacy of the model
The capability of the developed model was tested using analysis of variance (ANOVA). The results of the quadratic models in the form of ANOVA for tensile strength and hardness are presented in Tables 5 and 6, respectively. The model F value implies that the model is significant. The value of p > F in Tables 5 and 6 for models is less than 0.0001, which indicates that the obtained models are significant. Similarly, the load (A), tensile strength (B), number of passes (C), interaction effect of load and temperature (AB), interaction effect of load and number of passes (AC), interaction effect of temperature and number of passes (BC), second-order term of load (A), tensile strength (B) and number of passes (C) have significant effect for both responses, the tensile strength and hardness. Lack of fit is not significant as it is desired.
ANOVA results for tensile strength (only significant terms).
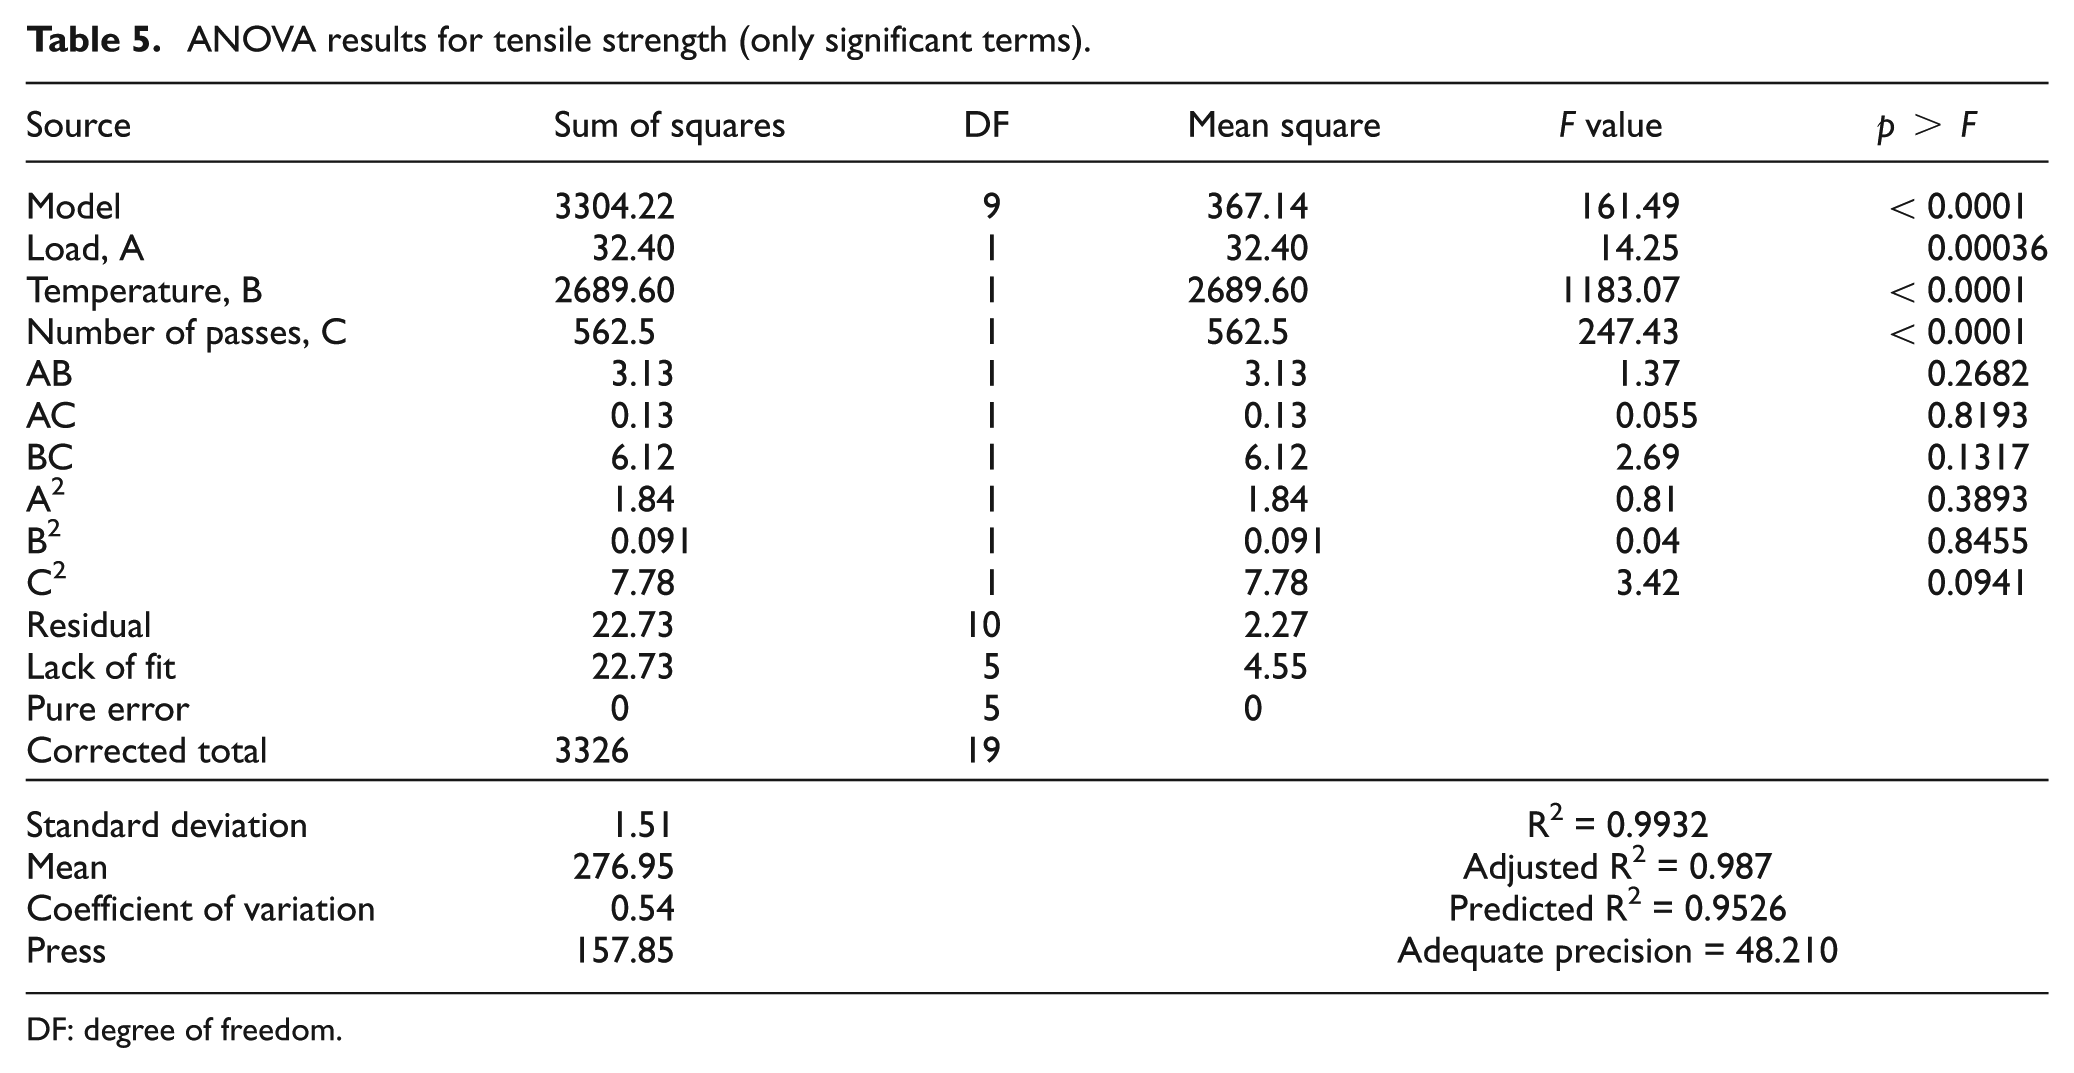
DF: degree of freedom.
ANOVA results for hardness (only significant terms).
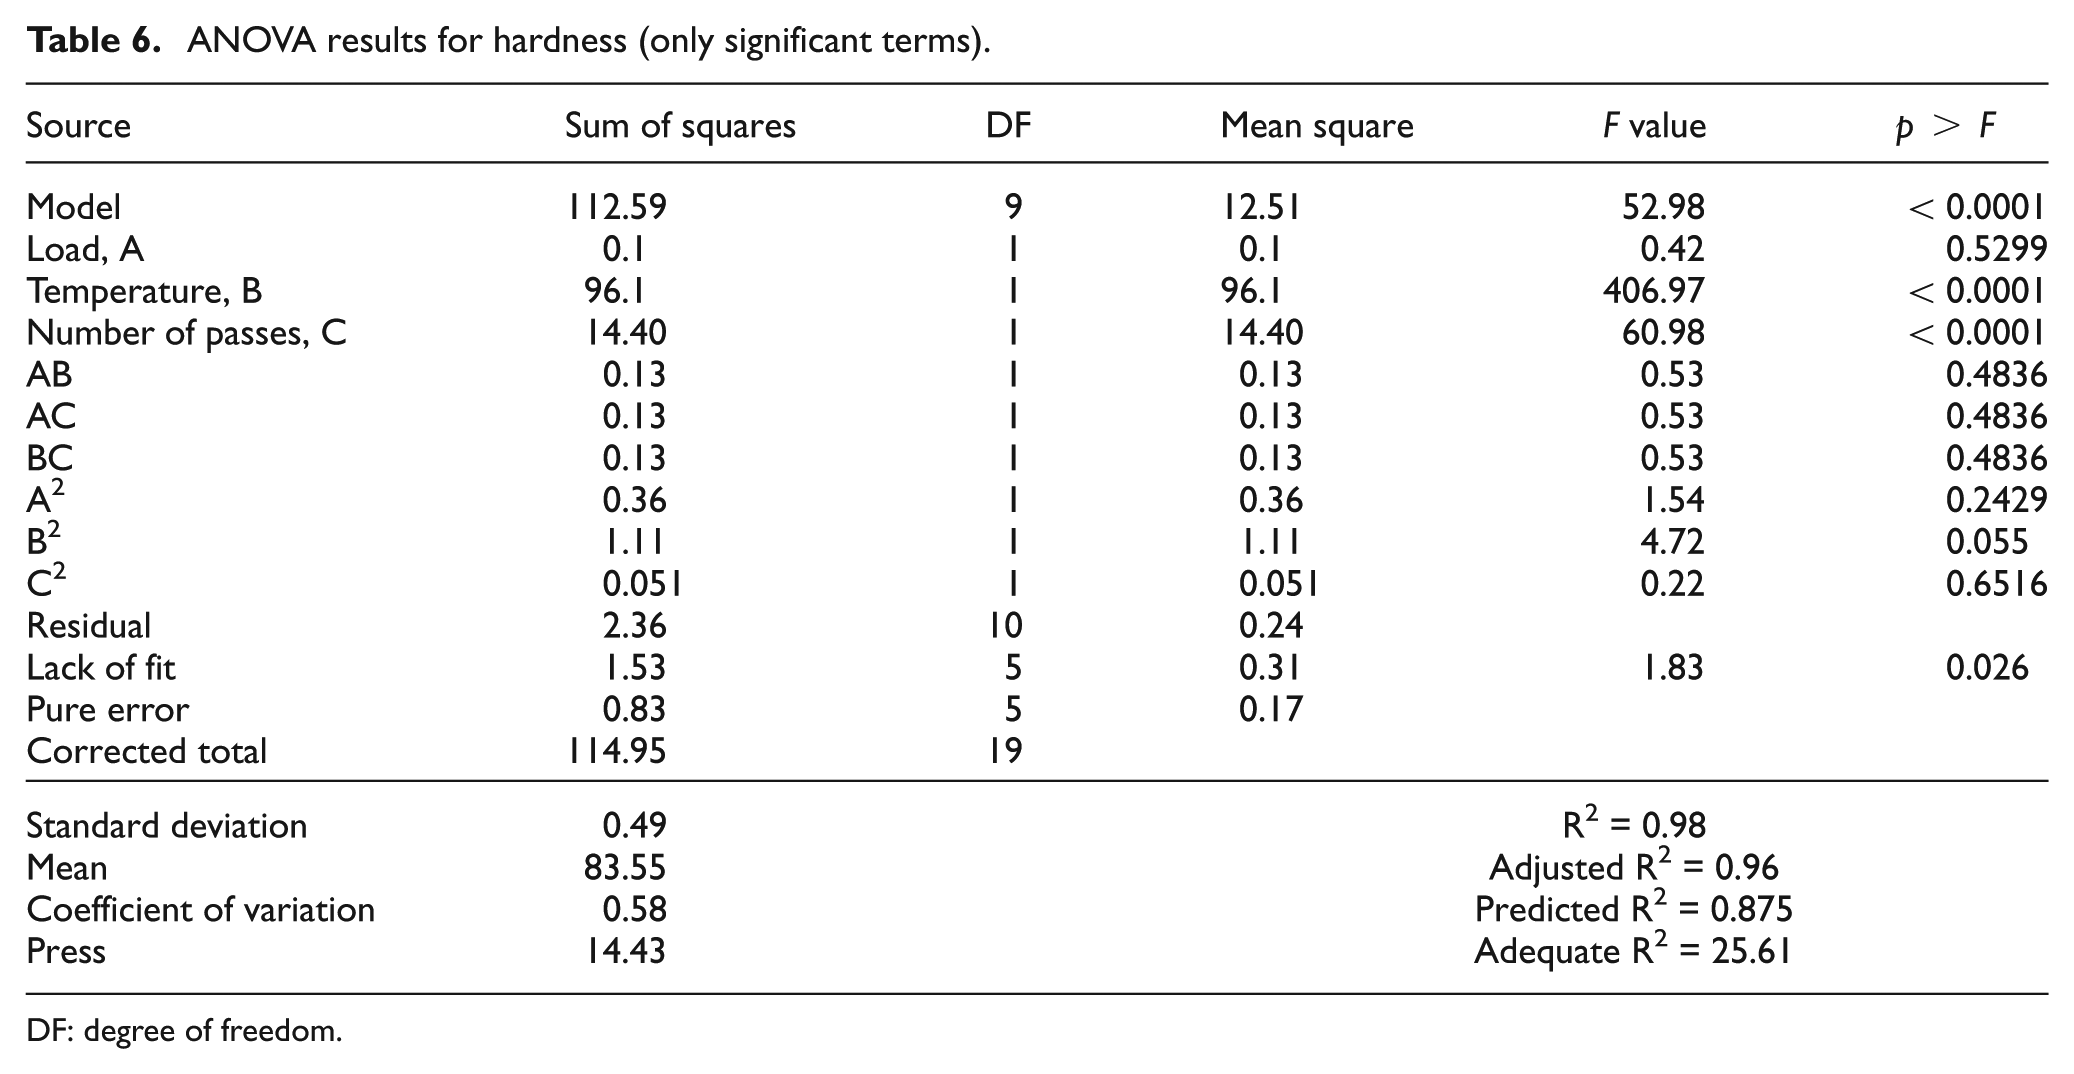
DF: degree of freedom.
The models obtained show higher values of determination coefficients (R2) and adequate precision (AP). The values obtained were as follows: R2 = 0.9932 and AP = 48.21 for tensile strength; R2 = 0.9795 and AP = 25.61 for hardness, which indicates the goodness of fit for the model for predicting the experimental results. The values of adjusted determination coefficient (adjusted R2 = 0.987 for tensile strength and adjusted R2 = 0.961 for hardness) are also high, which indicates high significance of the model. Predicted R2 is also in good agreement with the adjusted R2. The lower value of the coefficient of variation (CV = 0.54 and 0.58, for tensile strength and hardness, respectively) indicates that the conducted experiments are reliable with high precision.
Effect of process parameters on tensile strength and hardness
Figure 6(a)–(c) illustrates the estimated response surface for tensile strength in relation to the load, temperature and number of passes. It is observed that the tensile strength increases with increase in load, temperature and number of passes. The reason for this behavior is due to the homogeneity of the deformed billet. This is expected to be improved with higher number of passes due to the transfer of shear to the adjacent material via work hardening.29,30 Moreover, higher temperature and more number of passes lead to grain refinement of the alloy AA6082, which is evident from Figure 5(a)–(f). This may be the reason for increase in tensile strength, which is well agreed with the already reported results of TE experiments.17,28
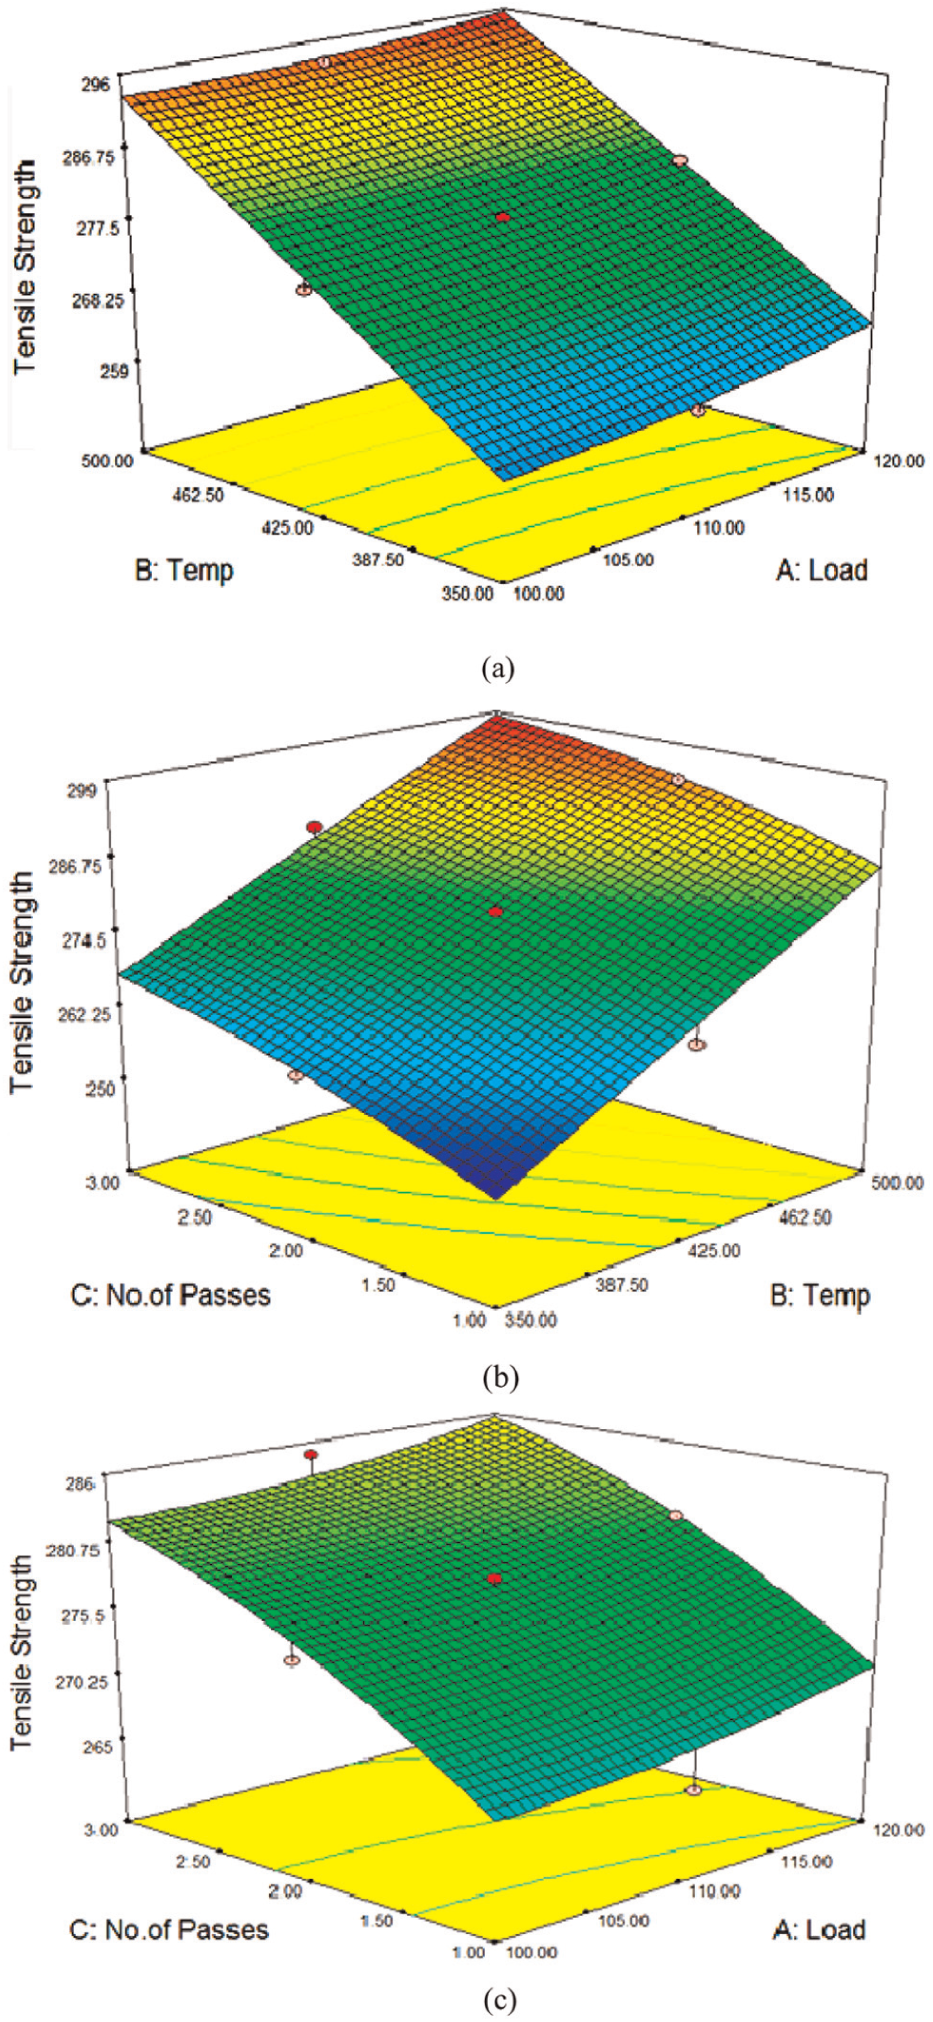
Response of (a) load, (b) temperature and (c) number of passes on tensile strength.
The response surface for hardness in relation to the load, temperature and number of passes is shown in Figure 7(a)–(c). It is observed that the hardness increases with increase in load, temperature and number of passes. The hardness values of the as-received samples are homogeneous at the center and the edge of the sample, and the average hardness values obtained are 75 HV. There is non-homogeneity in the hardness values of the twist extruded samples, which is less at the center compared to the edge of the sample, but there is a reasonable increase in the average hardness values of 87 HV as compared to 75 HV of the as-received sample. The distribution of precipitates during precipitation hardening can be expected to exhibit different behaviors during plastic deformation. 1 As the TE experiments were carried out at higher temperatures, the material undergoes recrystallization and grain growth. As the twist extruded material is slowly cooled in ambient air, the second phase particles are precipitated leading to increase in hardness. Moreover, the large strain, which is created at higher number of passes, results in grain refinement. This may be the reason for this behavior. This is well agreed with the reported results.23,27
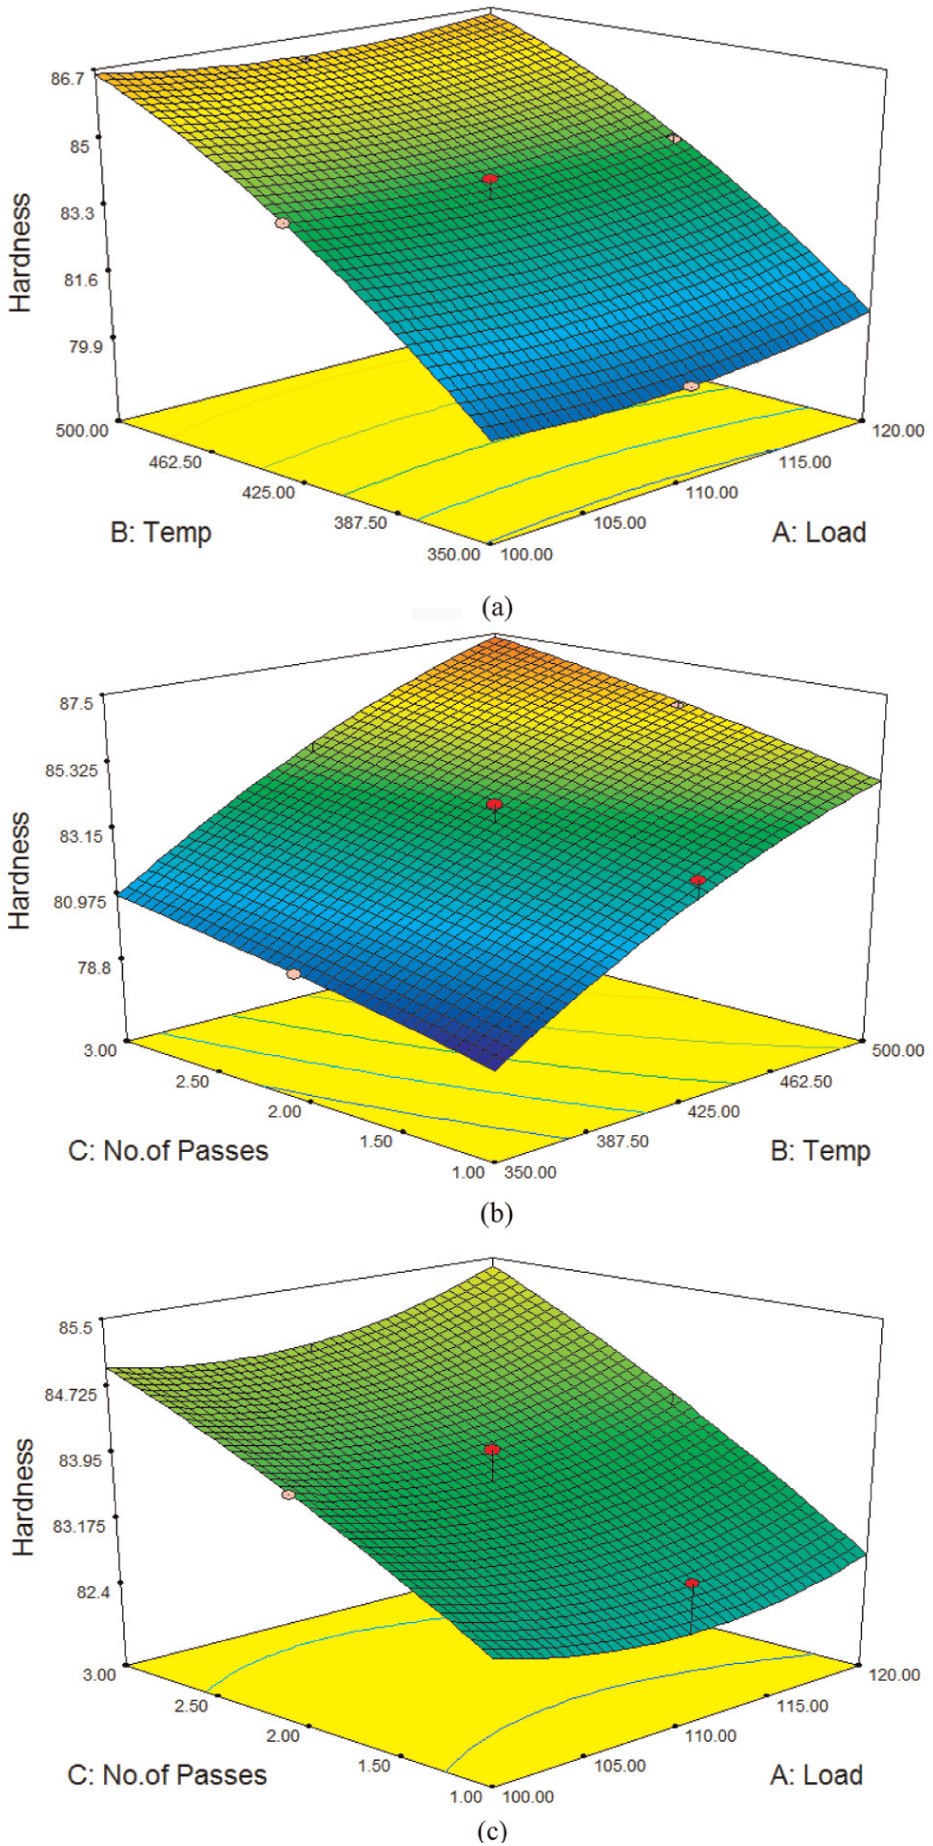
Response of (a) load, (b) temperature and (c) number of passes on hardness.
The quadratic graphs in Figures 6(a)–(c) and 7(a)–(c) show that the effect of temperature and number of passes are quite higher than that of the variation in load. From this, it is clear that the load is an insignificant parameter compared to the temperature and number of passes, which were considered to be the significant parameters.
Multi-response optimization and confirmation experiment
For selecting the optimal TE forming parameter combinations such as forming load, temperature and number of passes for obtaining improved process performance, for example, tensile strength and hardness, a multiple response method called desirability, which is proposed by Derringer and Suich, is followed. It is an excellent method for industry for optimizing multiple quality problems.18,19 The desirable ranges are from 0 to 1. A value of 1 represents the ideal case; 0 indicates that one or more responses are outside their acceptable limits. The factor settings with maximum total desirability are considered to be the optimal parameter conditions. This combination has been evaluated with the help of Design Expert software. The maximum desirability of 0.992, which is obtained for the combined objective, is shown in Figure 8. Two responses such as tensile strength and hardness were optimized using the developed models, as shown in equations (4) and (5), and the optimum values of the responses for the input parameters obtained from the software are shown in Figure 9. The ramps show the desirability for each factor and each response, as well as the combined desirability. It can be generated for each optimum found. The solutions are sorted from best to worst. A highlighted point shows both the exact value of the factor or response and how well that goal was satisfied.
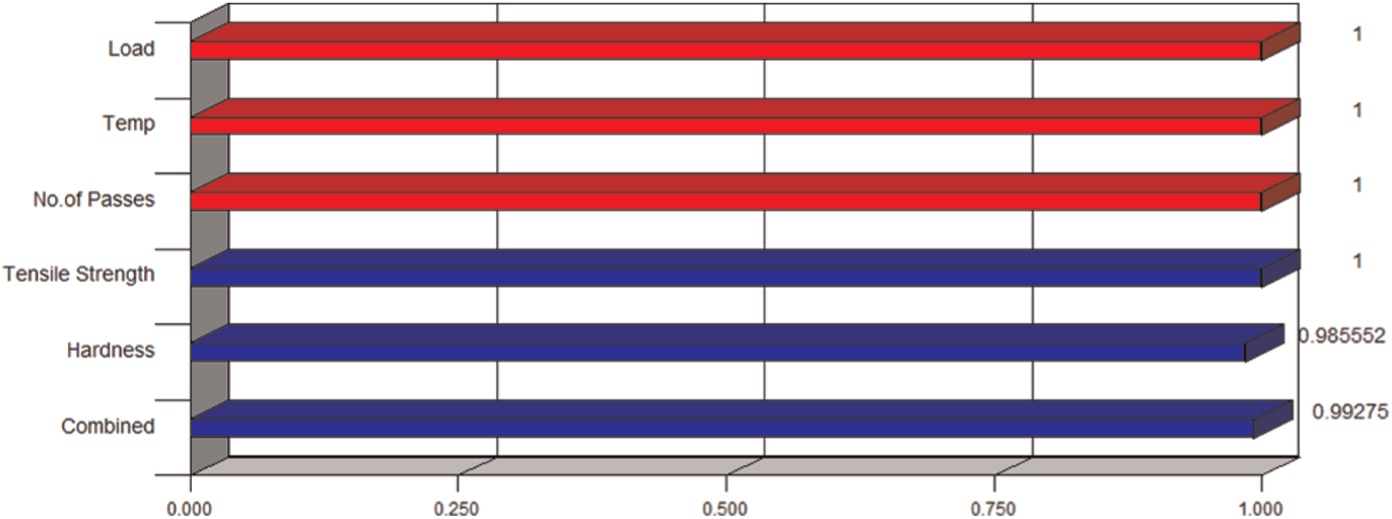
Bar graph showing maximum desirability of 0.992 for the combined objective.
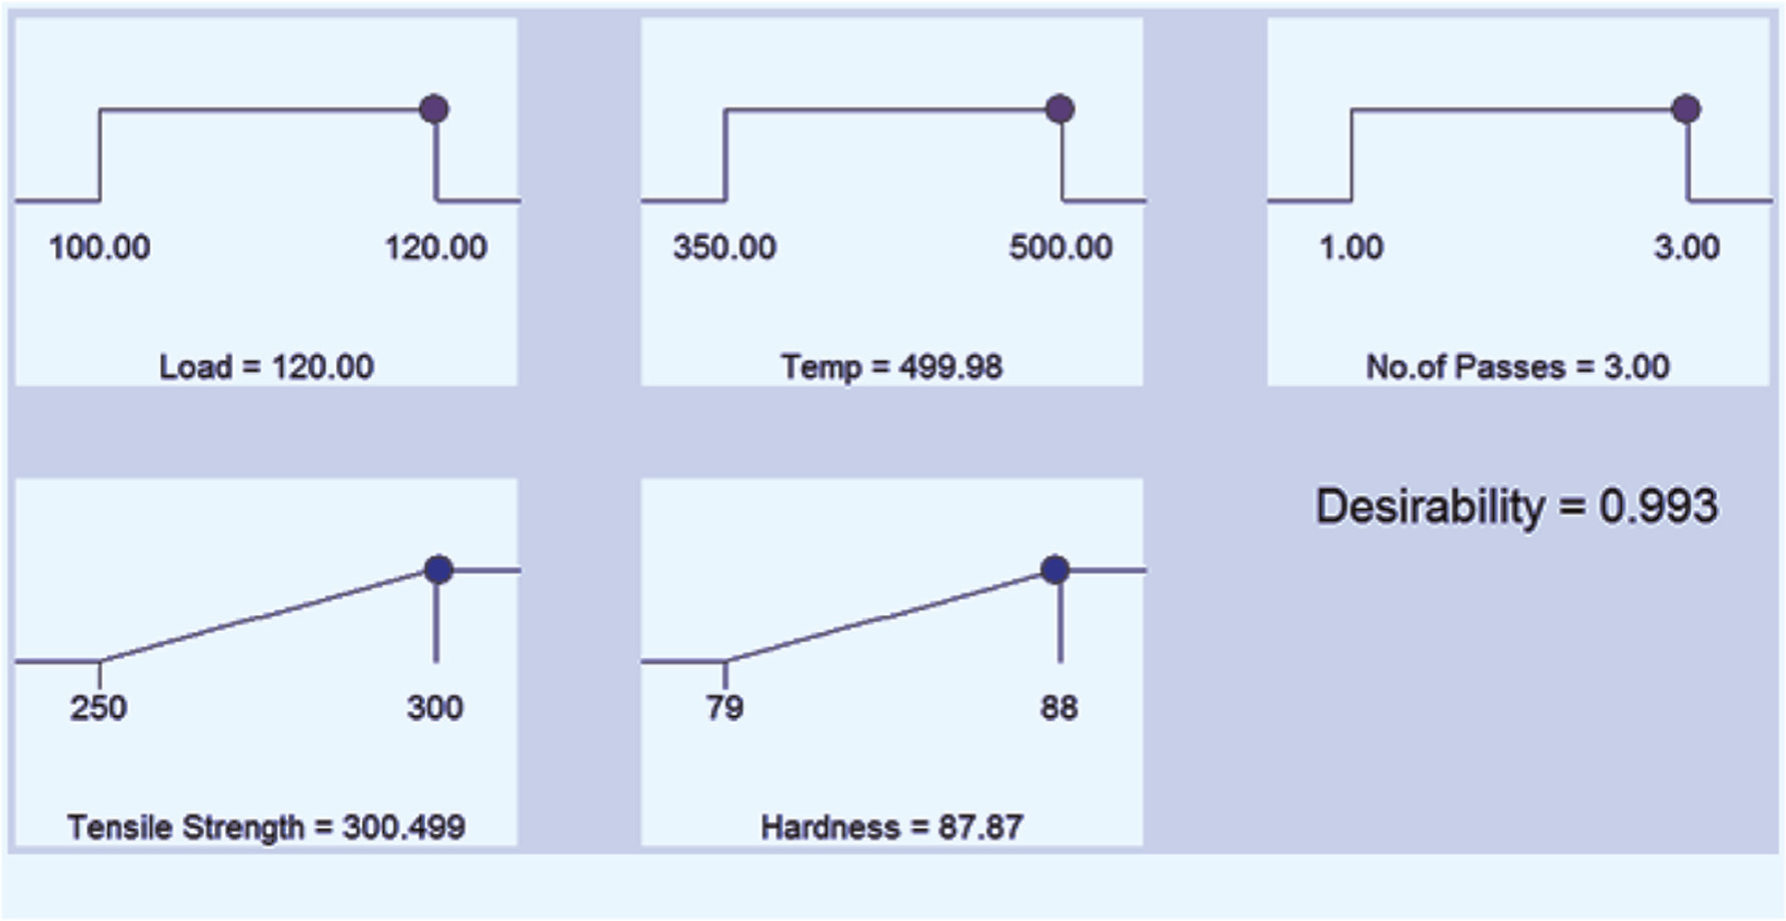
Numerical optimization ramps.
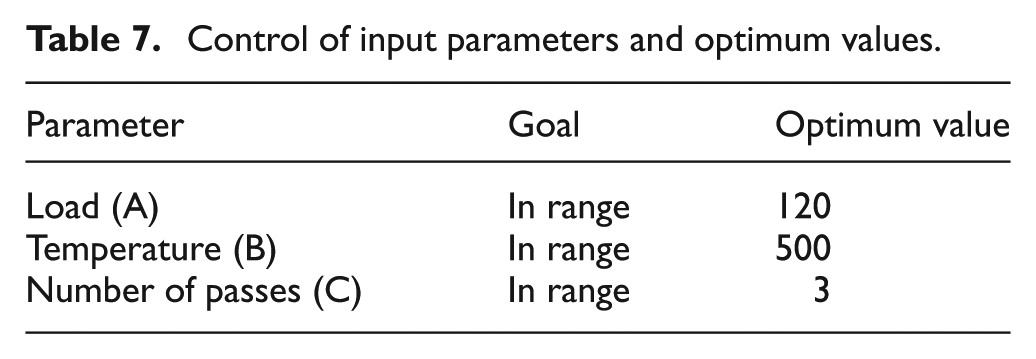
The optimum values of input parameters and the experimental validations of the developed models with the optimal parameters are shown in Tables 7 and 8, respectively. After selecting the optimal level of the process parameters, the last step is to predict and verify the performance of the responses using the optimal level of forming parameters. For doing this, a confirmation experiment is carried out. A successful confirmation experiment is defined as one where the average of the samples falls within the predicted range. 31 When the average of the results from the confirmation experiments falls within the range, it proves that the significant factors as well as their levels are selected properly and lie within the range, as shown in Table 7. Five confirmation TE experiments were conducted based on the optimal input parameters such as load (120 N), temperature (500 °C) and number of passes (three) for maximizing tensile strength and hardness.
Control of input parameters and optimum values.
Experimental validations of developed models with optimal input parameters.
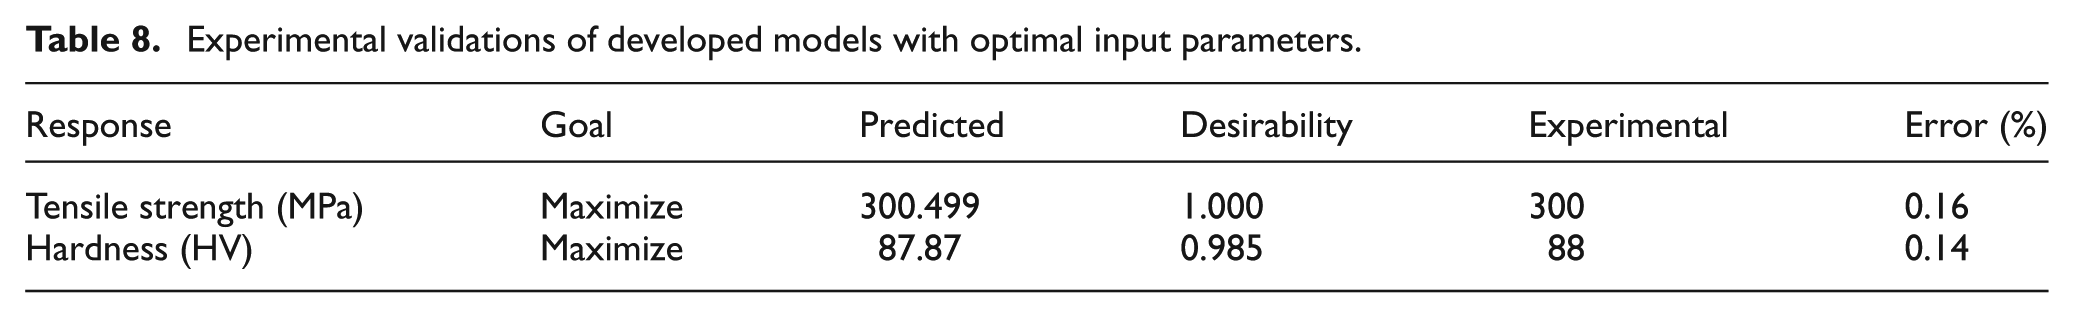
The average of the two responses, tensile strength and hardness, of the experimental results was found to be 300 MPa and 88 HV, respectively. Table 8 shows the predicted and experimental validation of the developed models for the responses with optimal input parameters during TE of AA6082-T6 aluminum alloy. The objective is to maximize the tensile strength and hardness, and hence, it is higher the better type characteristic. From Table 8, it is observed that the calculated error is small. From this, it is clear that the predicted values conform to the experimental results.
Conclusion
The use of design of experiments for conducting the TE experiments has been described in this study. Two models were developed for predicting the tensile strength and hardness of the AA6082-T6 aluminum alloy by TE using RSM. The following conclusions were obtained from this study:
The developed mathematical model of tensile strength and hardness is reasonably suited with the experimental values since the error between experimental and predicted values at the optimal combination of input parameters for tensile strength and hardness lies within 0.16% and 0.14%, respectively.
Temperature and number of passes have greater influence on tensile strength and hardness than extrusion load, which is least significant.
The tensile strength and hardness increased by 10%–12% with higher temperature and more number of passes.
A maximum tensile strength of 300 MPa and hardness of 88 HV are obtained by the specimens twist extruded with optimized parameters of 120 ton load, 500 °C temperature and three number of TE passes.
From the microstructural observations, it was observed that the microstructure of the specimen before TE shows coarse grains with equiaxed structures with an average grain size of 38 µm. TE performed at higher temperature and more number of passes leads to a significant grain refinement of 15%–20%, which is the reason for increase in tensile strength and hardness.
The results obtained with various mathematical models will be useful for selecting parameter setting for achieving desired tensile strength and hardness for TE process.
Footnotes
Declaration of conflicting interests
The authors declare that there is no conflict of interest.
Funding
The authors gratefully acknowledge Defence Research and Development Organisation (DRDO), Directorate of Extramural Research & Intellectual Property Rights (ER&IPR), New Delhi, India, for its grant no. ERIP/ER/0903833/M/01/1371 toward carrying out this research.