
Abstract
The needs to rapid manufacture of automotive components have led to the extensive uses of high-speed drilling in hole-making operation. However, issues such as uncontrollable thrust force and hole quality need to be addressed effectively in order to have full benefit of high-speed machining. Modeling the effect of drilling parameters on the machining responses can be a useful approach in controlling the thrust force and surface quality of the hole. This article reports on the development of mathematical models for thrust force (Ft) and surface roughness (Ra) during high-speed drilling of Al–Si alloy using uncoated carbide tools. Central composite design coupled with response surface methodology was used to predict the Ft and Ra values in relation to the primary machining variables such as cutting speed and feed rate. Second-order polynomial models were developed for both responses, and the adequacy of models was verified by analysis of variance. Results show the goodness of response surface methodology in the development of mathematical models in explaining the variation of thrust force and surface roughness by relating them to the variations of cutting parameters. In the developed models, linear effects of cutting parameters have the highest contribution to the thrust force model, while their quadratic effects are the significant terms influencing the surface roughness. Consequently, the optimum cutting condition was predicted at the high and low levels of cutting speed and feed rate, respectively.
Keywords
Introduction
As a result of the advances in machine tool and cutting tool technologies, high-speed machining (HSM) is recognized as one of the most important manufacturing technologies to reduce the manufacturing lead time and to save machining cost. Besides that HSM also offers other advantages such as good surface finish and reduction in cutting force as reported in turning and milling operations. However, studies on application of HSM in drilling, which is one of the most common operations in aerospace and automotive industries, were less reported. High-speed drilling may associate with problems such as built-up edge (BUE) formation, chatter, feed mark domination, and high-volume chip evacuation, and in all these phenomena can have significant effect on the cutting forces and final hole quality. Therefore, modeling the effect of drilling parameters on the machining responses is very important to control the desired outputs in the process of high-speed drilling.
In a theoretical investigation, Armarego and Cheng1,2 developed mathematical models for the prediction of thrust force and torque based on the thin shear zone model during drilling using conventional general purpose drills and drill lips of flat rake face drills, which is a modified drill in order to simplify the calculations. They claimed that the model for modified drill gives reasonable trends when tested numerically, while the model for conventional drills with a curved rake face failed to give an acceptable trend for the same analysis. In another series of studies, Watson3–6 proposed two theoretical models for predicting the thrust force and torque when drilling K1045 steel using twist drills. In the first model, Watson assumed that the material that was drilled by each cutting lip could be considered as a series of independent elements, and the experimental results were 50% greater than the predicted values. For the second model, the chip was assumed as a single piece rather than a series of individual elements in order to consider the integrity of the chip, and results showed closer predicted values when compared to the actual values. In recent study, Elhachimi et al.7,8 used an analytic approach to express the thrust force and torque in high-speed drilling by considering the various factors such as tool geometry, cutting conditions, and thermal and mechanical properties of the work material. The mathematical model was developed based on the shear zone model of oblique cutting, and results showed that thrust force and torque depend significantly on all the drilling parameters.
In contrast to the analytical and theoretical models, empirical models based on the statistical approaches are being used widely by many researchers for predicting the cutting forces and surface roughness in different machining operations. Results obtained by theoretical models are usually far from the experimental results due to the assumptions that are being considered in order to simplify the models. In a recent empirical study, Kilickap et al. 9 showed the adequacy of response surface methodology (RSM) to model the effect of cutting parameters on the surface roughness during drilling of AISI 1045. RSM was also adopted by Tsao 10 in the prediction of drilling-induced thrust force using various drilling parameters, and it was reported that thrust force increases with increase in diameter ratio and feed rate. Other statistical approaches such as Taguchi method have been also used for predicting the thrust force and torque in drilling of different materials.11–13
The interest toward the application of Al–Si for automotive components is increasing lately, mainly due to its attractive properties such as lightweight, environment friendliness, and low cost. In recent years, few experimental studies have been carried out in drilling of Al–Si using ordinary cutting speeds. High adhesion of aluminum on the drill cutting edge and its flutes is the main factor that causes surface finish deterioration, chip clogging along the flute, and consequently rapid drill failure when drilling of Al–Si alloys. These problems are more significant when drilling these alloys under dry condition. Previous studies had shown the superiority of uncoated carbide tools in reducing adhered material as compared to physical vapor deposition (PVD)–coated carbide tools.14,15 However, supremacy of diamond-like carbon coating was reported by Bhowmick and Alpas 16 in drilling Al–Si alloys. They concluded that the application of nonhydrogenated diamond-like carbon (NH-DLC) coating results in the reduction of drilling thrust force and BUE formation. Contrary to earlier findings, Braga et al. 17 claimed that diamond-like carbon (DLC)–coated tools did not exhibit improvement in tool life when compared to uncoated drill under high feed rates when drilling Al–Si alloys using minimum quantity lubrication (MQL) and flood of abundant soluble oil. Roy et al. 18 carried out some experiments in dry turning of pure Al and Al–12% Si alloys using different coated carbide inserts. Although the developed diamond coating showed positive result in reducing BUE, it did not improve the tool life significantly as compared to uncoated tool when machining Al–12% Si. Therefore, diamond-like carbon tools may not be recommended as an appropriate candidate for the industrial scales due to their high price compared to commercial carbide tools.
Although other researchers have investigated the performance of carbide-coated tools in drilling Al–Si alloys with the intention to reduce the BUE and improve the surface finish, there are still lack of studies on the effect of cutting variables on the responses when drilling with ordinary available tools in the market. The aim of this study is to develop mathematical models using RSM to predict the thrust force and surface roughness when high-speed drilling of Al–Si alloy using uncoated carbide drills.
RSM
RSM is an approach to determine an empirical equation for an unknown functional form relating the expected value of the response variable to the influential predictor variables using designed experiments. 19 However, it is a local analysis, and the developed model is only valid within the studied range of parameters. 20 In this study, RSM was utilized to explore and model the effect of cutting parameters on the thrust force and surface roughness. Cutting speed (v) and feed rate (f) were chosen as the independent variables, and the desired responses were the average surface roughness (Ra) and drilling thrust force (Ft).
Second-order polynomial has been selected as a default response that usually works quite well in a relatively small region. 21 However, the model must be reduced to the first-order model if the functional relationship between the expected value of the response variable and coded predictor variables in the region of interest can be approximated by linear equation, and in this case, the use of second-order model is not necessary. Moreover, a polynomial of higher degree must be used if there is significant lack of fit for the second-order model. These concerns are evaluated in section “Analysis of the developed mathematical models.” In order to model the response surface, a second-order polynomial response can be fitted into the following equation
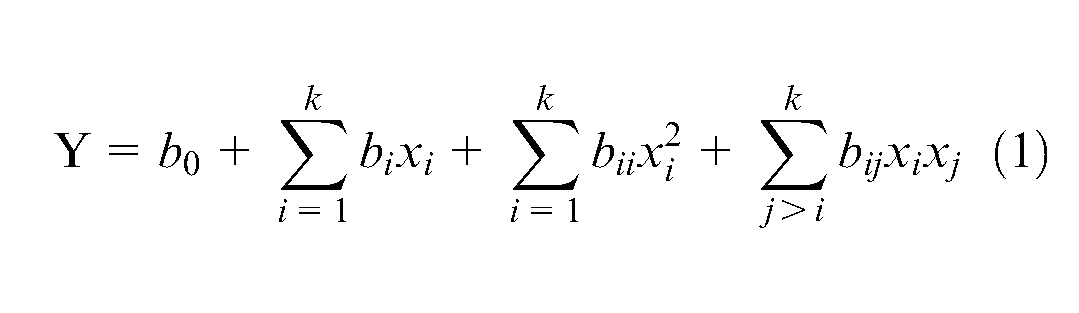
where Y is response and k is the number of variables while xi and xj are independent variables (cutting speed and feed rae);
Actual variables are transformed to coded variables for


where
Experimental design
Since a second-order model is used, at least three distinct values of each predictor variable are required for experimental design strategies. Clearly,
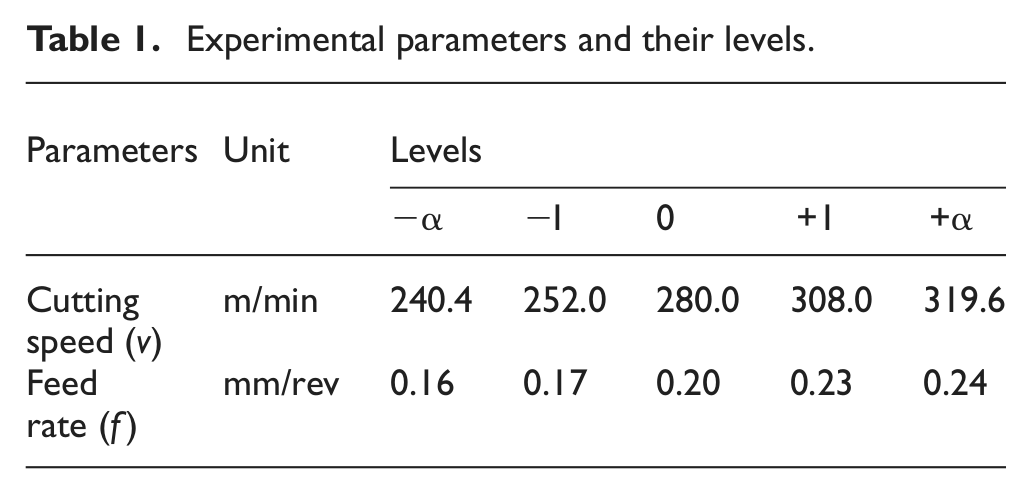
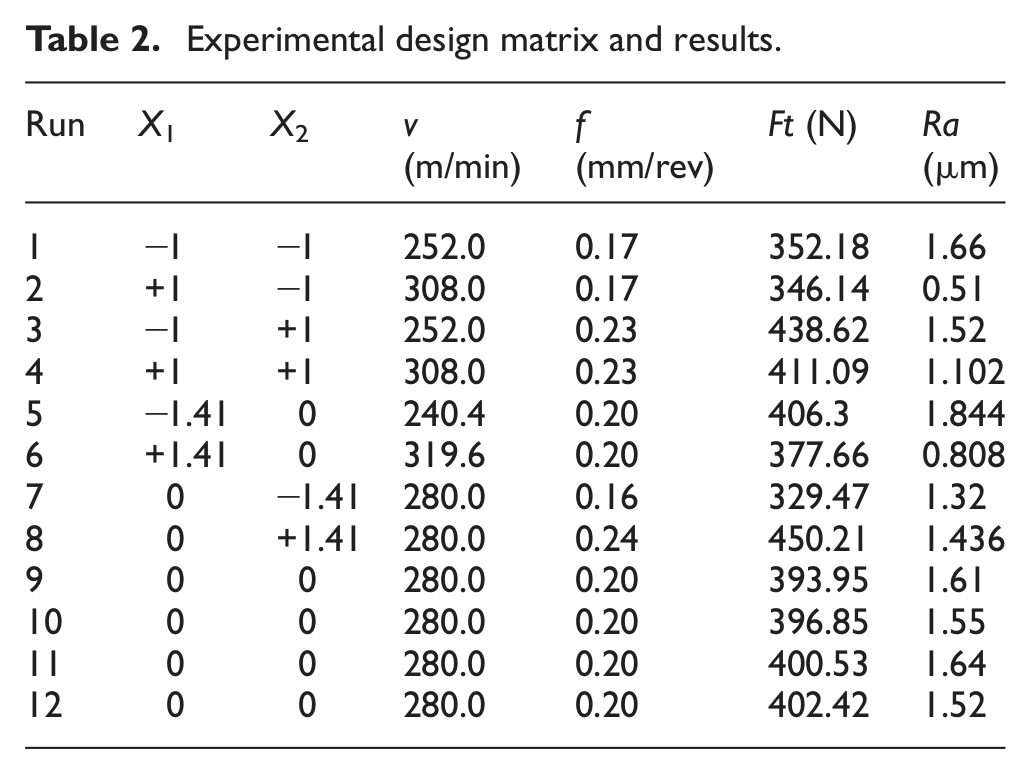
Table 1 shows the cutting parameters and their levels in coded and actual values. Therefore, the designed experimental planes consist of 12 cutting tests, and they are listed in Table 2 based on the standard run orders. After running the experiments and data collection, Design Expert software (version 7.1) from Stat-Ease Inc. was used to analyze the results, develop the models, and acquire the optimum cutting condition.
Experimental parameters and their levels.
Experimental design matrix and results.
Experimental procedures
Cold chamber die cast aluminum–silicon alloy (A383), which is commonly used in automotive industry, was chosen as the workpiece material. The specimens were turned into cylindrical parts with 60 mm diameter and 10 mm thickness.
In order to eliminate the effect of tool wear on surface roughness and thrust force, a new uncoated carbide drill manufactured by PRECISETECH with split point geometry (DIN-standard 1412 form C) and diameter of 6 mm was used in every cutting condition of the high-speed drilling of Al–Si alloy. The substrate of the drills consists of 90% WC + 10% Co (ISO K20/K30 grade). Point geometry of the uncoated drill edge is shown in Figure 1. Through holes of 10 mm depth were drilled using a MAHO MH 700S CNC machining center. The machine transversal speed ranges from 1 to 4000 mm/min and its spindle power is 15 kW (20.1 hp) with a maximum speed of 5000 r/min. Therefore, a spindle speed increaser attachment (BIG DAISHOWA GTG5) was used in order to achieve the desired speed of high-speed drilling operation. This high-speed spindle uses a gear driving system with ratio of 4.67 and maximum speed limit of 20,000 r/min. Flood coolant method with flow rate of 19.4 L/min was also employed during drilling operation. The coolant type is semi-synthetic low-mineral oil, water-miscible with 6% concentration. A Kistler type 9443B dynamometer was used where the workpiece was mounted via a fixture to record the thrust forces (Fz) during the drilling process. Graphical results of thrust force versus machining time were recorded for all cutting conditions. Figure 2 illustrates an example of typical thrust force profile at a constant cutting speed and different feed rates. The experimental response value was the average thrust force values calculated during the engagement of the drill into the work material until the drill tip reaches to the back of plate.
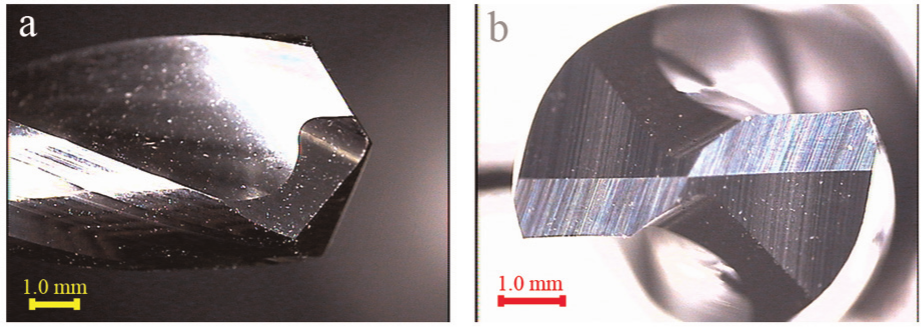
Cutting edge geometry: (a) rake face and (b) flank face.
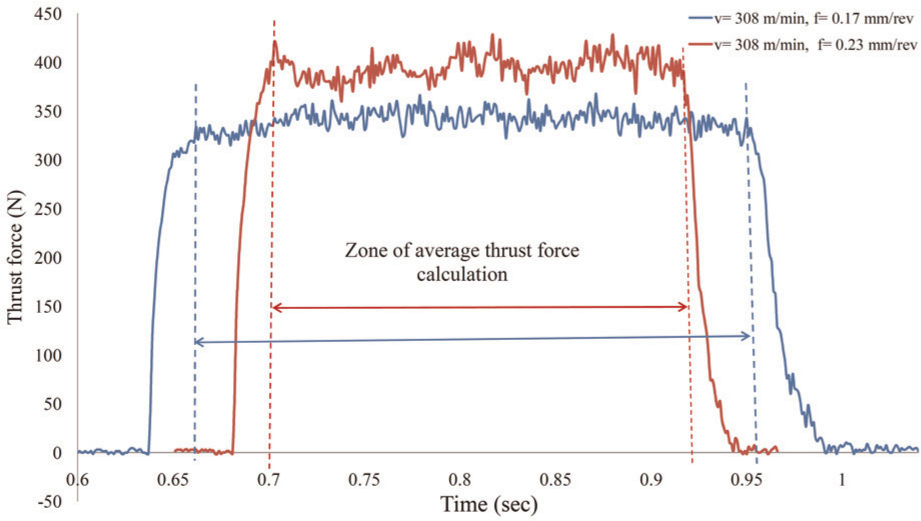
A typical thrust force profile.
The surface roughness (Ra) of the drilled holes was measured using a Handysurf E-35 surface roughness tester. Surface roughness readings were taken at the three positions of the center hole depth, spaced at 90° intervals around the hole periphery. The measured length was 4 mm and the cut-off length was fixed at 0.8 mm. Finally, the average of three readings for each hole was considered as the final surface roughness value.
Results and discussion
Mathematical modeling
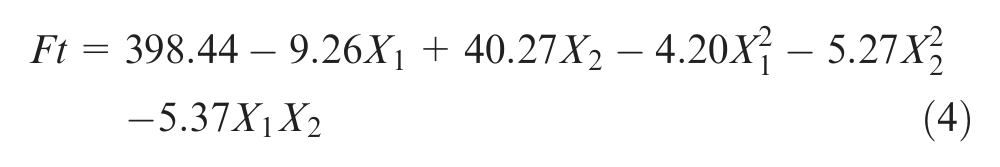
Based on the proposed second-order polynomial model, the mathematical model is developed from coefficients obtained using the Design Expert software, which expressed the relationship between thrust force and surface roughness using the selected drilling parameters (cutting speed and feed rate). The model equation for thrust force in terms of coded factors is given by
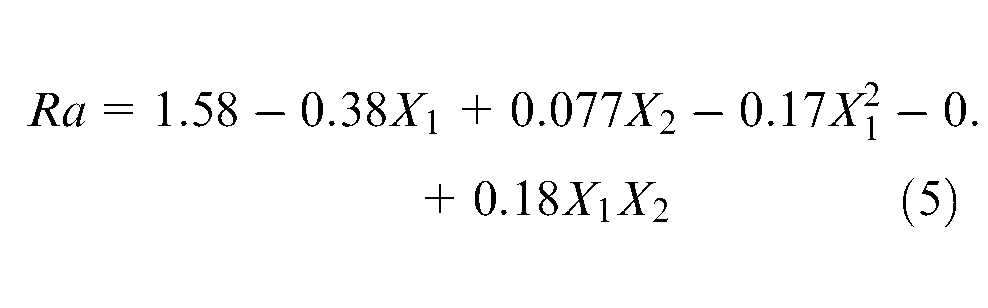
The following equation is the empirical model for surface roughness in terms of coded factors
Analysis of the developed mathematical models
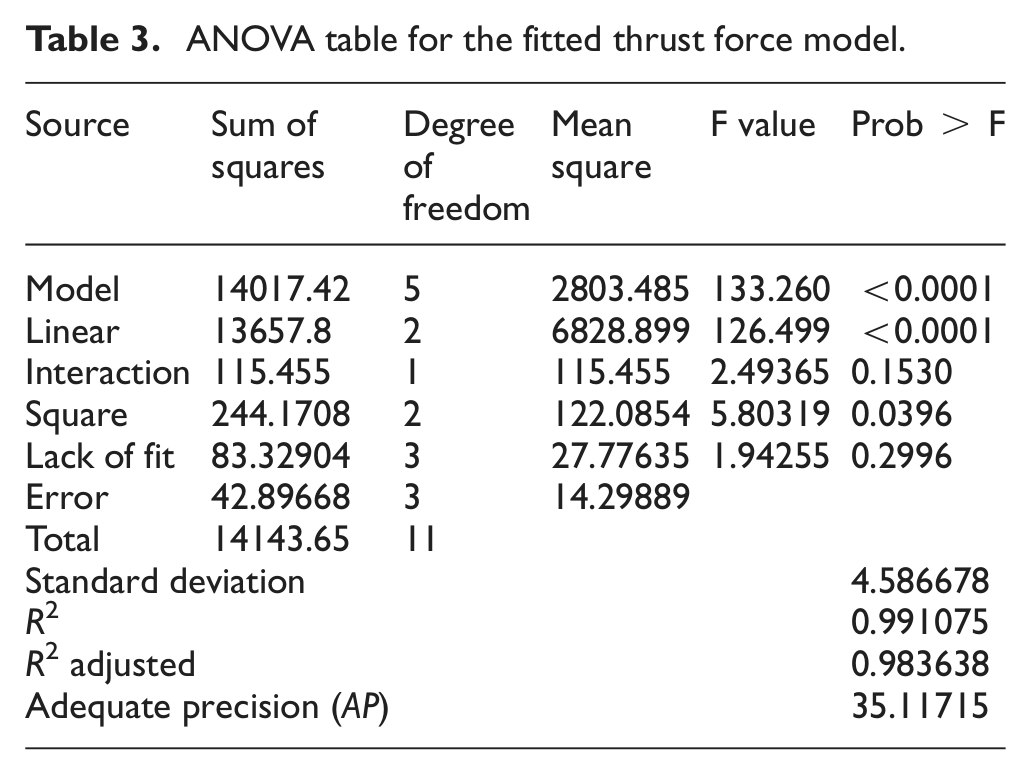
In this study, the adequacy of models developed from the responses is validated by statistical approaches such as analysis of variance (ANOVA) that is practiced by group of researchers.12,22–24 Besides that, running the confirmation tests for model validation is recommended by some other researchers.9,25–27 However, it was not practicable in this research due to the limited number of tools. Therefore, F ratio test and ANOVA were performed to evaluate the statistical significances of the fitted quadratic model and to justify the adequacy of the final model. Results for the thrust force and surface roughness model are shown in Tables 3 and 4, respectively, and suggest initially that second-order model could be appropriate choice since their quadratic term is statistically significant. Since values of “Prob > F” for both thrust force and surface roughness models are less than 0.05 (i.e. p = 0.05 or 95% confidence), the obtained models are considered to be statistically significant that is desirable. Moreover, there is no significant lack of fit for the second-order models because their Prob > F values are higher than 0.05 and thus suggesting that these models adequately fit the data.
ANOVA table for the fitted thrust force model.
ANOVA table for the fitted surface roughness model.
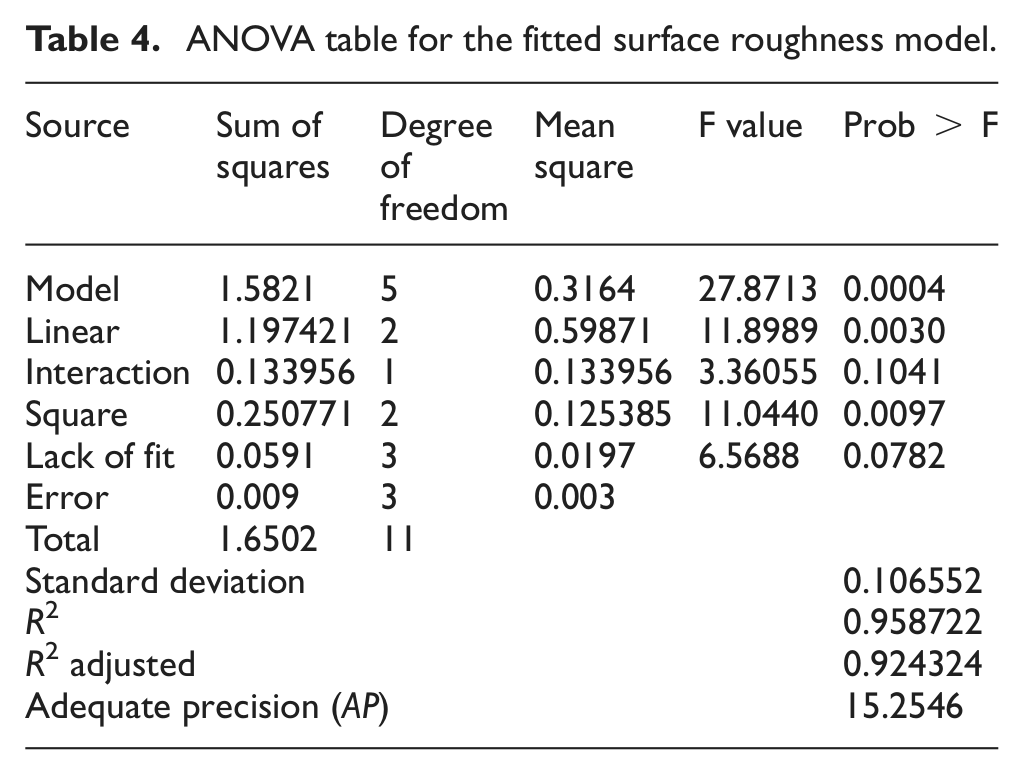
The coefficient of determination
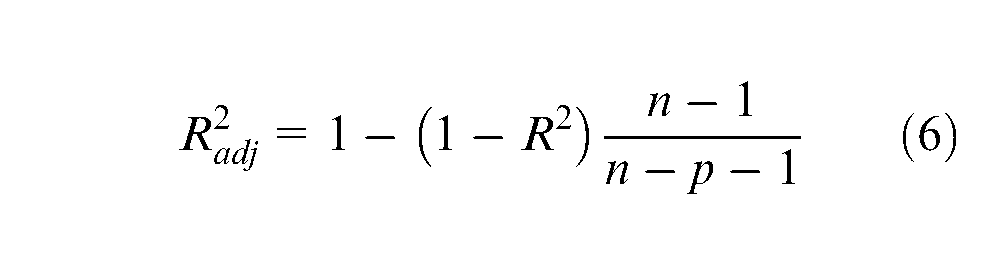
where n is the sample size and p is the number of coefficients in the model excluding the constant term. The value of
The normal probability plot of the residuals for Ft (Figure 3(a)) showed that the resulting residuals fall nearly on a straight line, and it indicates that error of any sample data conforms to a normal distribution. Figure 3(b) also illustrates that residuals are independent of its predicted value, and no obvious pattern and unusual structure were observed. Moreover, the results of the measured and predicted values of surface roughness are compared and displayed in Figure 4, and it is evident that predicted values are close to those readings recorded experimentally with a 95% confident interval. Similarly, the adequacy of surface roughness model was verified.
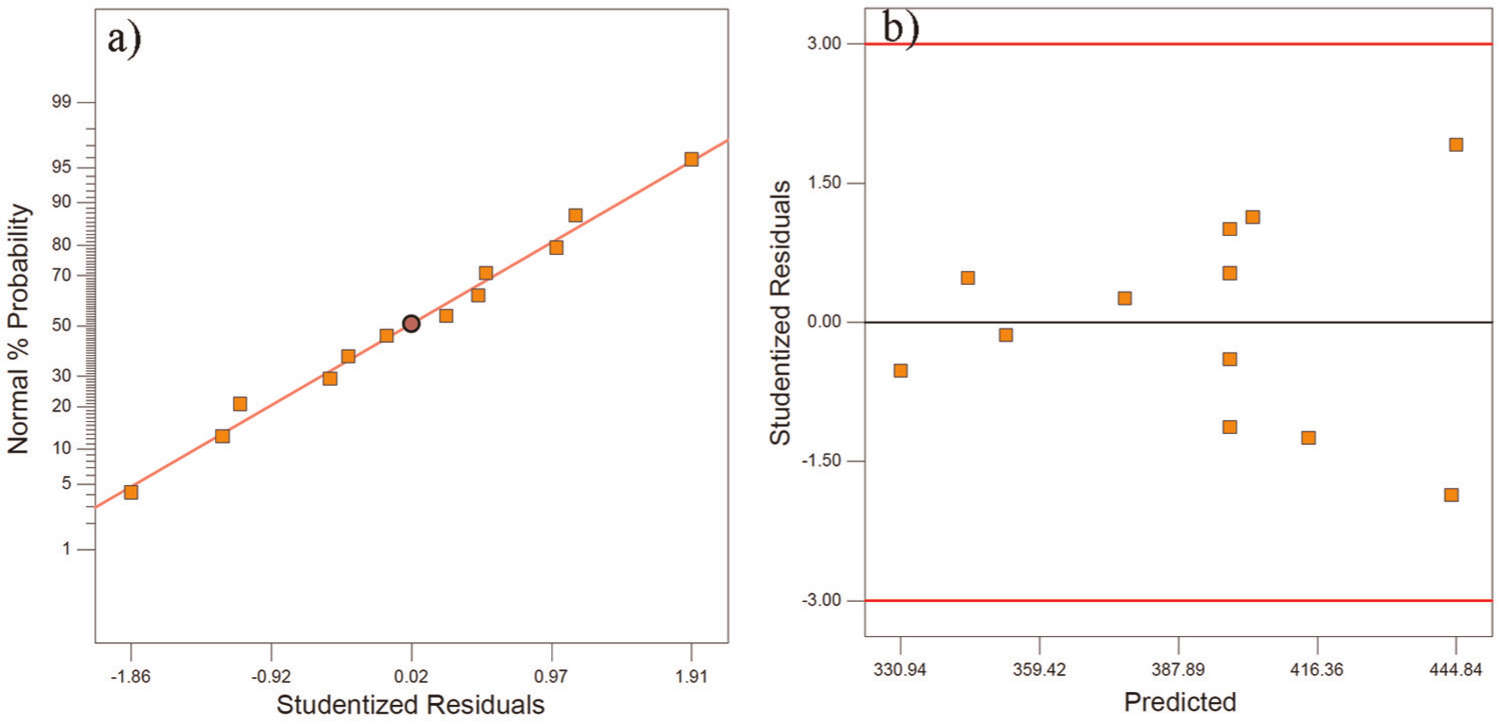
Residual diagnostic plots for thrust force model (Ft): (a) normal probability and (b) residuals versus predicted response.
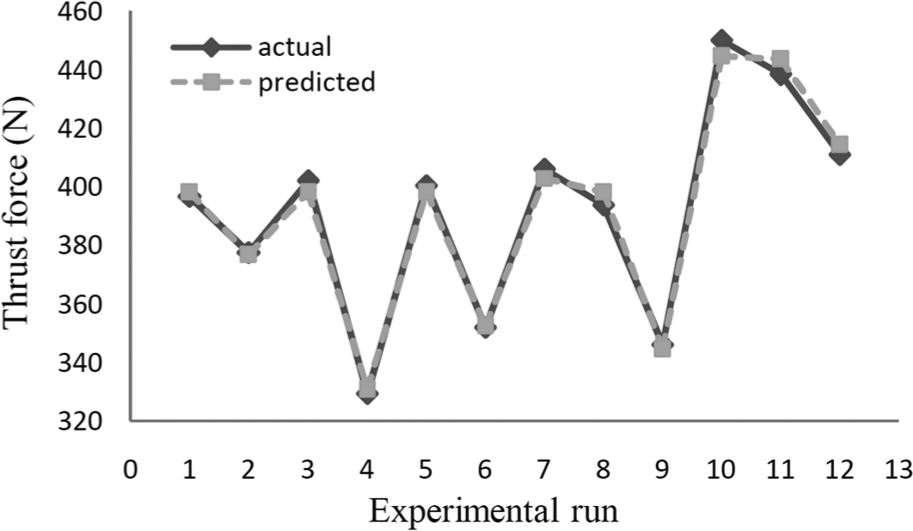
Comparison of predicted and experimental values of thrust force (Ft).
Effect of machining parameters on the thrust force
ANOVA obtained from the experimental results was used to identify the relative importance of drilling parameters with respect to the thrust force and surface roughness. Terms of the proposed second-order model will be considered significant if its “Prob > F” value is less than 0.05. The ANOVA results of the response surface quadratic model for thrust force are summarized in Table 5. As observed, linear and quadratic effects of feed rate and linear effect of cutting speed are the three most significant factors influencing the thrust force, while the linear term of feed rate has the highest contribution to the model since it possesses the lowest “Prob > F” value.
Results of the analysis of variance for the thrust force (Ft).
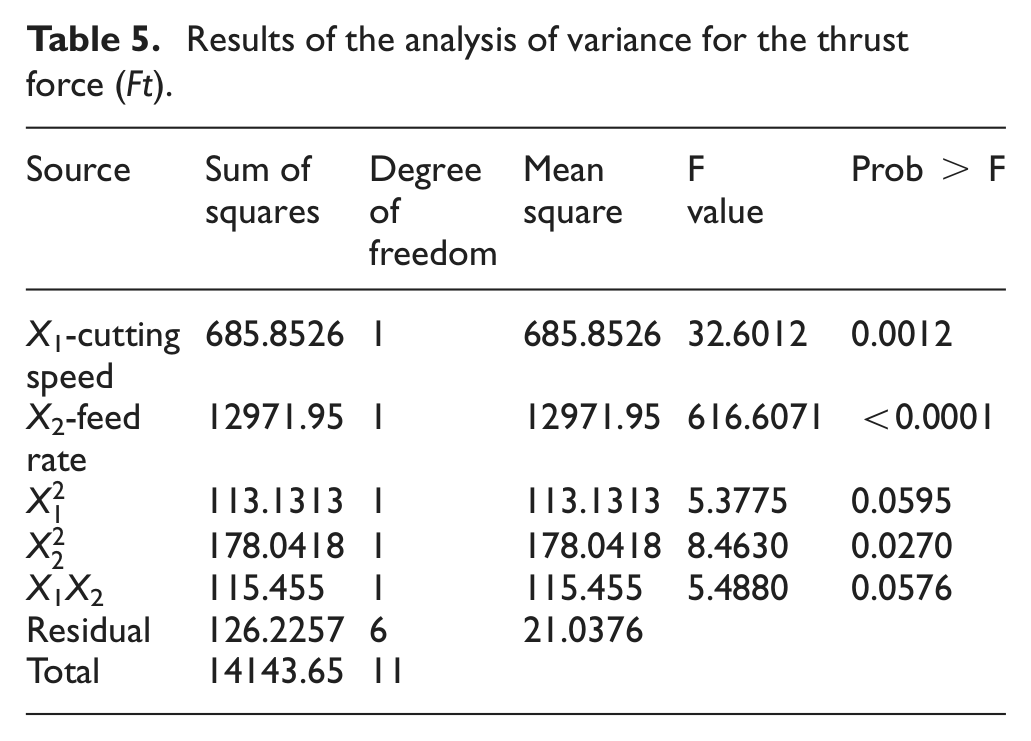
Figure 5(a) and (b) shows the three-dimensional (3D) surface graph and contour plot, constructed from the fitted final model of experimental results (equation (4)) and presents the influence of cutting speed (v) and feed rate (f ) on the thrust force (Ft). From these figures, it can be noted that increase in feed rate increases the thrust force. This is attributed to the increase of uncut chip thickness that is often referred to the chip load in metal cutting. Hence, thrust force is proportional to the chip load, and it increases with increase in feed rate. Moreover, it is clear that thrust force decreases with increasing cutting speed. Practically, in machining of ductile materials like aluminum, cutting force decreases with increasing of cutting speeds due to the high temperature generated and consequently plastic softening in the machining zone. 28 Although the square term of the model for cutting speed is not significant, its “Prob > F” value is close to 0.05 and its negative coefficient indicates that effect of cutting speed on thrust forces is increased at the highest level of cutting speed. This trend could be explained by the high strain rate and heat concentration in the primary shear zone that is high enough to overcome the effect of conductive heat loss at very high cutting speed. 29
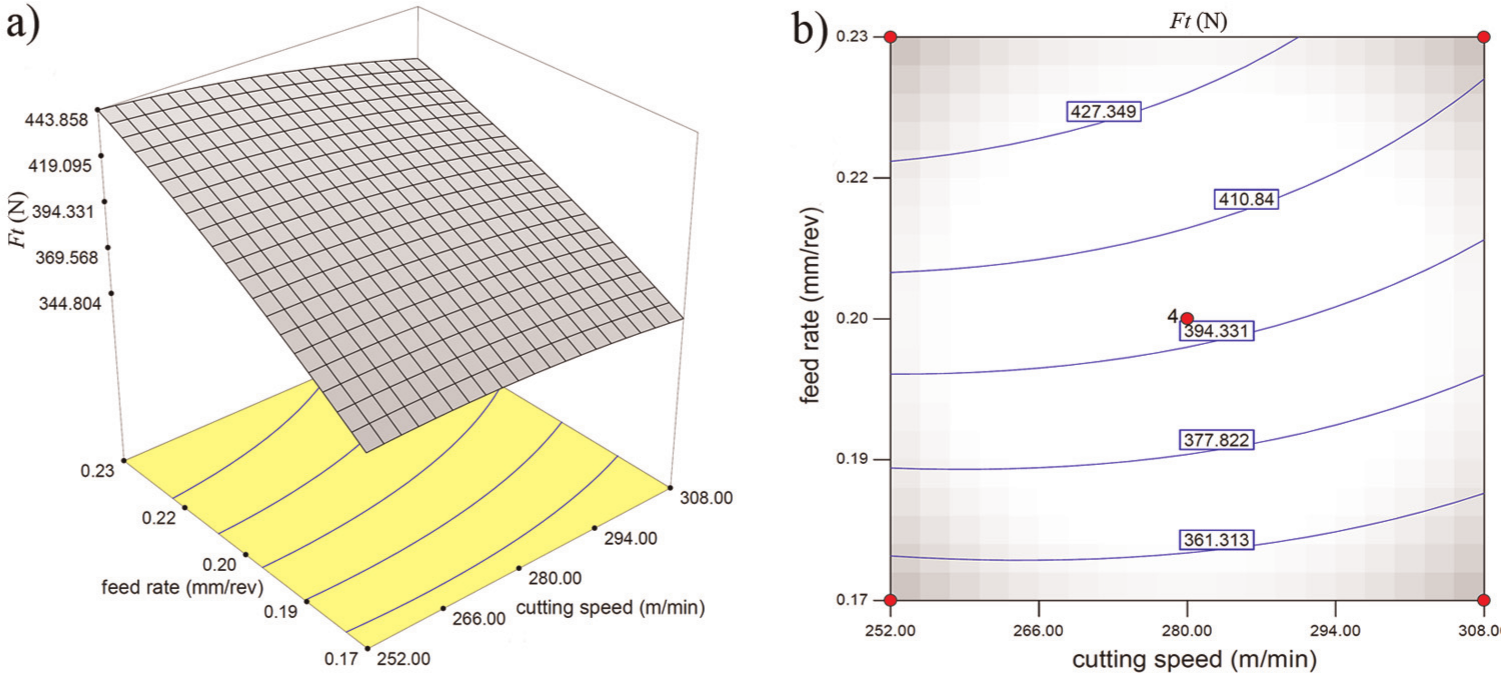
Effect of cutting speed and feed rate on thrust force: (a) 3D surface graph and (b) contour plot.
However, it is reported that the decrease in flow stress in the primary shear zone caused by the thermal softening effects would not exceed 50% reduction in cutting force due to the elastic limit of workpiece material. 30 Moreover, the sliding coefficient of friction at the chip–tool interface is approximately independent of the applied load and the cutting speed placed beyond the zero speed and below the speed required to cause thermal softening of the less refractory surface. 31 Thus suggesting that the decrease in thrust force may be contributed by the reduction in the effective friction at the tool–chip interface due to thinning of the chip. An increase in cutting speed increases the shear angle, which decreases the shear plane. Smaller shear plane leads to smaller chip thickness and hence lower shear force.32,33 This hypothesis can be supported by the interaction term of cutting speed and feed rate, whose “Prob > F” value is close to 0.05. Figure 6 shows their interaction graph and revealed that thrust force reduction due to the increase of cutting speed is more significant in the highest level of feed rate in which possess the highest uncut chip thickness. Further evidences on chip morphology are presented in the early study. 34
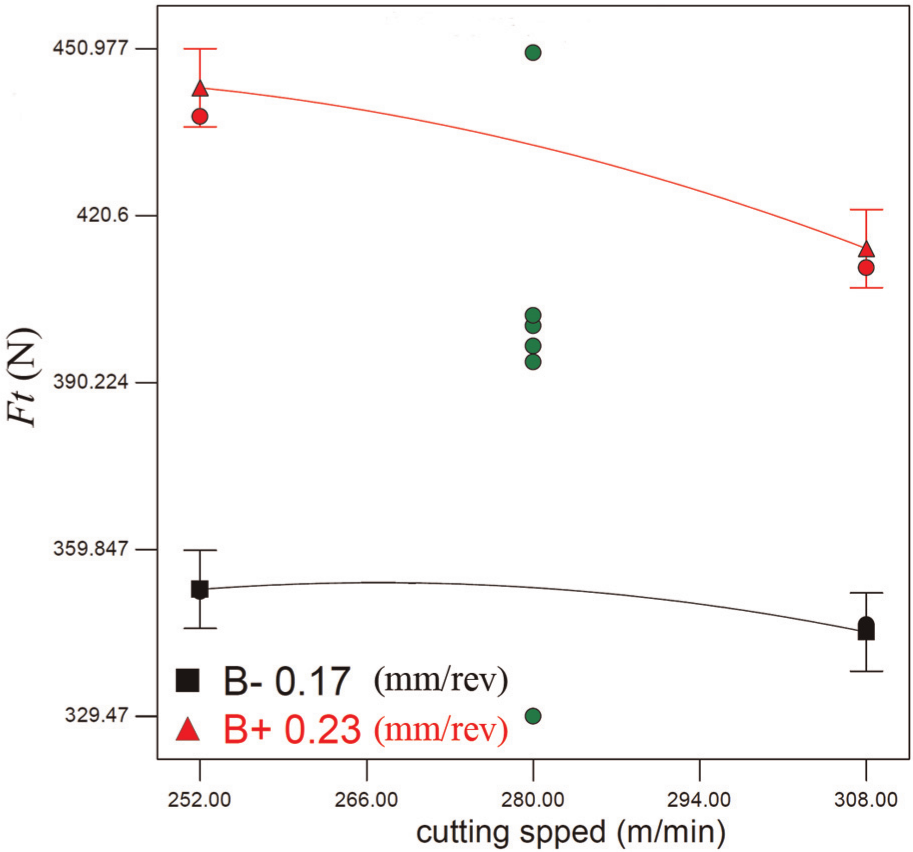
Variation of thrust force with cutting speed at different feed rates.
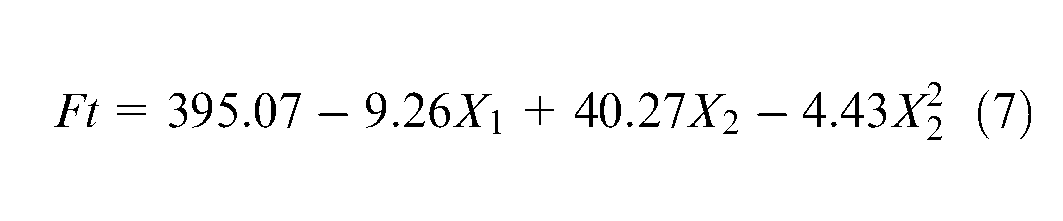
As mentioned earlier, the quadratic term of cutting speed and interaction effect of cutting speed and feed rate are insignificant in thrust force model. These insignificant terms of model (excluding those required to support hierarchy) can be removed in order to simplify the model. By implementing the backward elimination method to reduce the insignificant terms, the final models of response in terms of coded factors are presented in equation (7). The backward elimination process should not cause significant lack of fit and inadequacy of reduced model. The goodness of reduced thrust force model was drawn by the same way discussed earlier.
Effect of machining parameters on the surface roughness
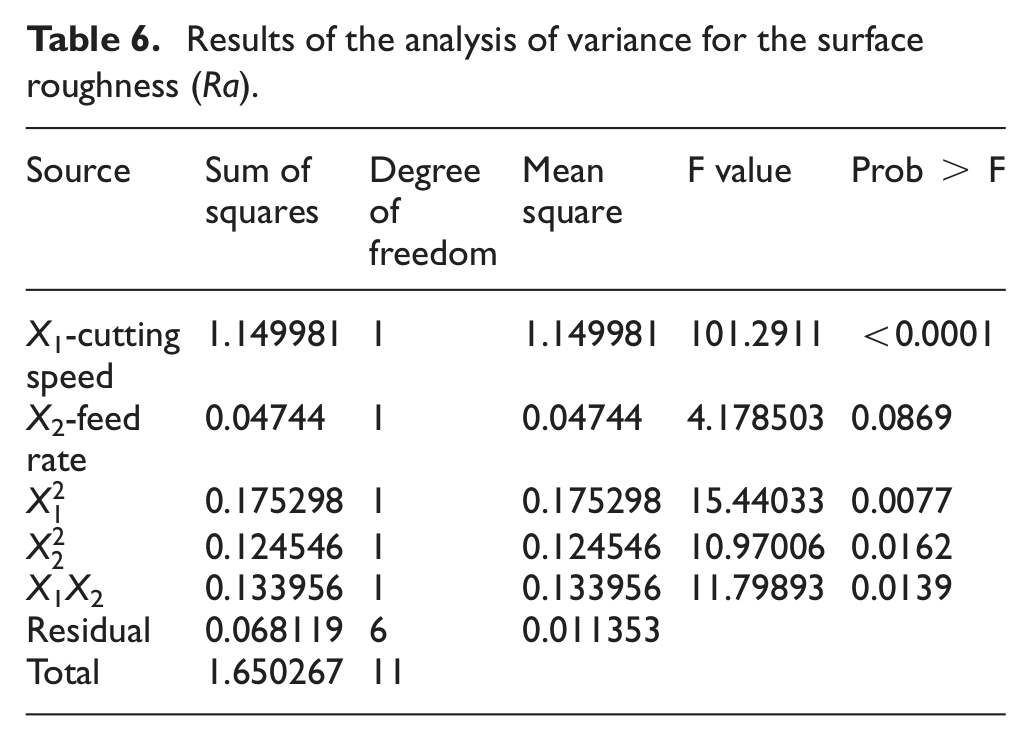
Table 6 shows the ANOVA results of the response surface quadratic model for surface roughness (Ra), and results showed that all terms of the proposed second-order model except linear effect of feed rate are influencing the surface roughness of drilled holes significantly, while the linear term of cutting speed has the highest contribution to the model.
Results of the analysis of variance for the surface roughness (Ra).
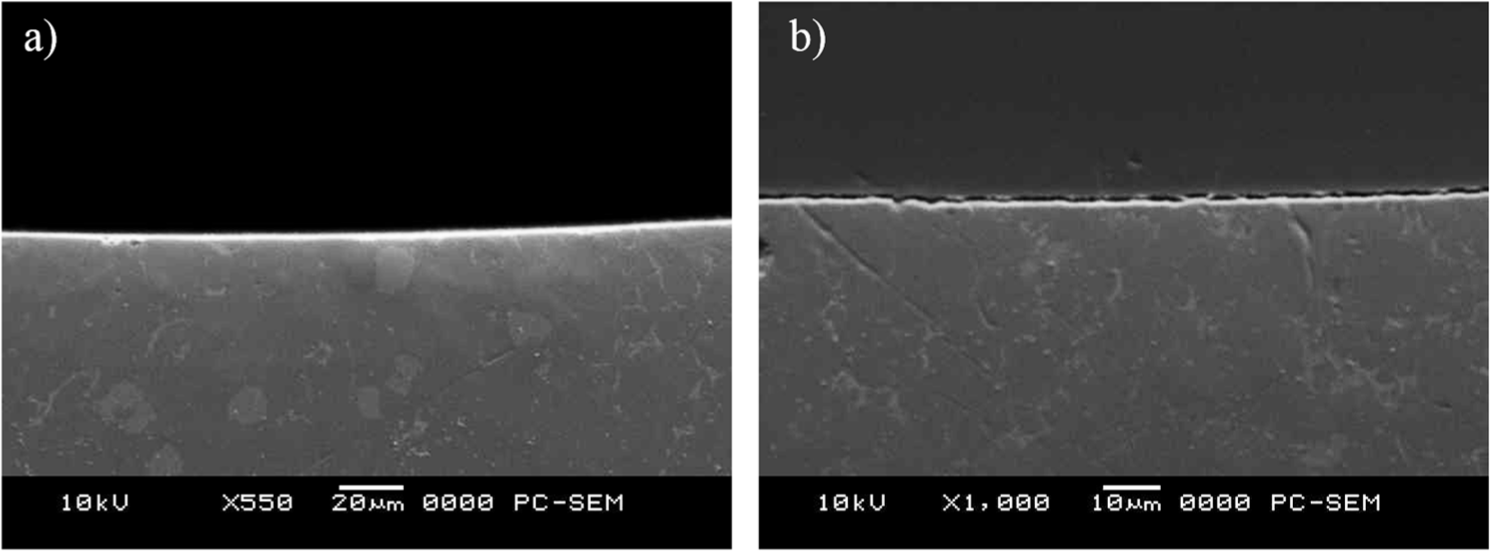
Effect of cutting speed and feed rate on surface roughness is illustrated graphically in Figure 7. It can be noted from these figures that the surface roughness decreases as the cutting speed increases at both low and high levels of feed rates. This phenomenon was attributed to the BUE formation on the cutting edge at lower cutting speed and its ploughing effect on the machined surface. 35 At low cutting speed, deformed chip tends to weld to the tool due to the high friction between the tool and removed material that slides on the tool rake face. Figure 8 shows scanning electron microscope (SEM) micrograph of the cutting edge and its energy-dispersive X-ray (EDX) analysis that proves the adhesion of large portion of work material. However, there is insufficient time for the deformed chips to weld to the cutting edge and BUE formation at high cutting speeds, hence producing better surface finish. This statement can obviously be seen in Figure 9, which shows the BUE of the cutting edge after drilling the first hole at two axial runs of experiments with different cutting speeds. In addition, the BUE may become unstable and eventually separates from the tool, leaving a portion of adhered layer on the drilled surface. This phenomenon can be clearly observed on the surface of hole drilled at the cutting speed of 252/ m/min and feed rate of 0.23 mm/rev (Figure 10(a)), while free ploughed of machined surface with good quality in Figure 10(b) was obtained at higher cutting speed of 308 m/min and feed rate of 0.17 mm/rev.
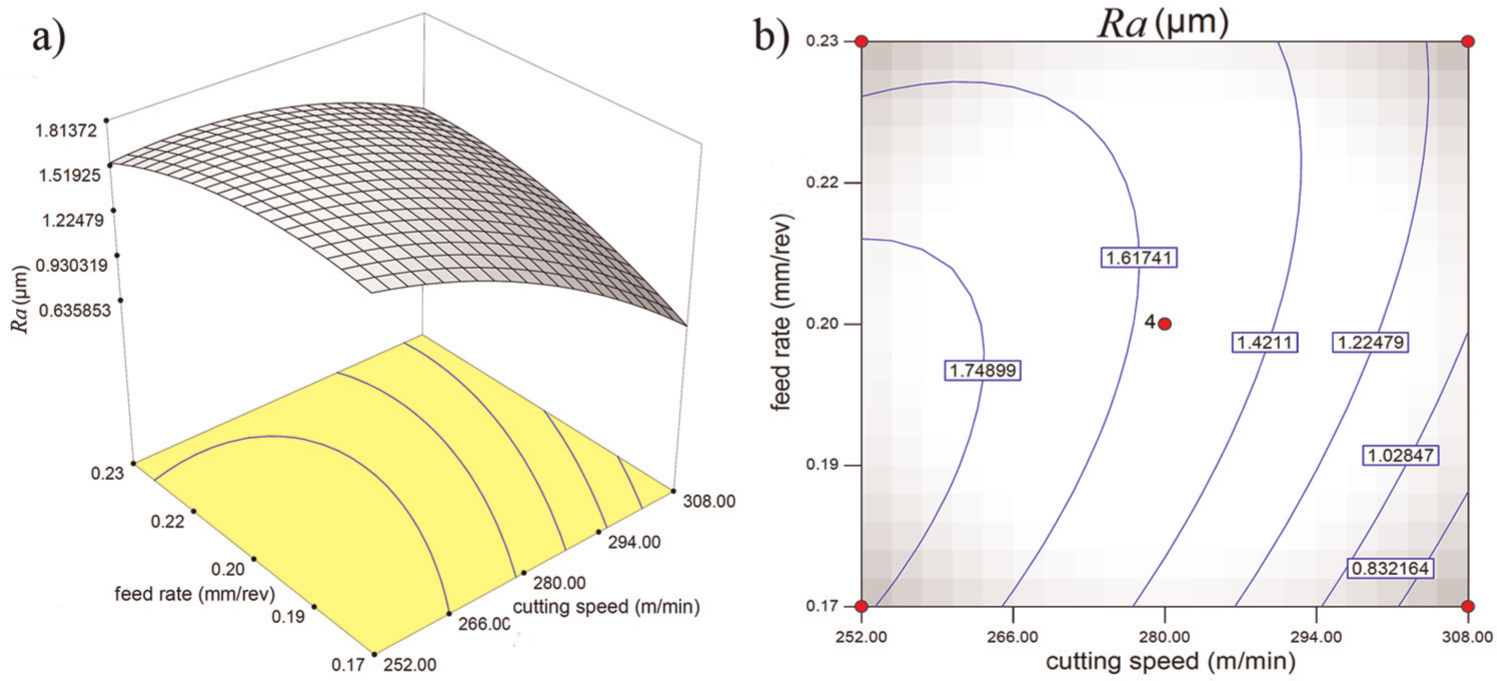
Effect of cutting speed and feed rate on surface roughness (Ra): (a) 3D surface graph and (b) contour plot.
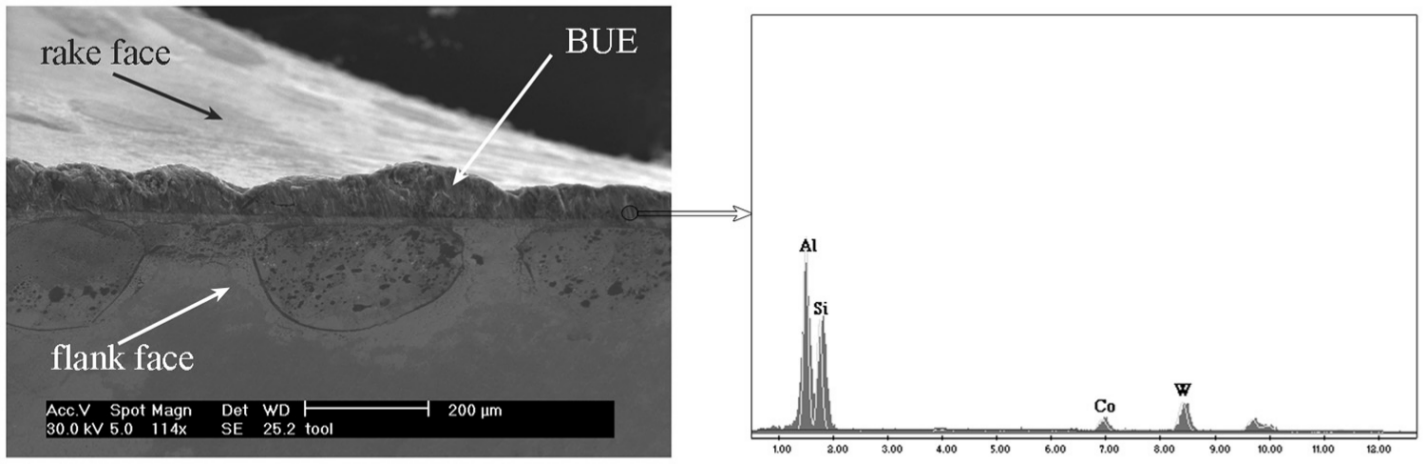
SEM micrograph of BUE formation on cutting edge (v = 280 m/min, f = 0.2 mm/rev).
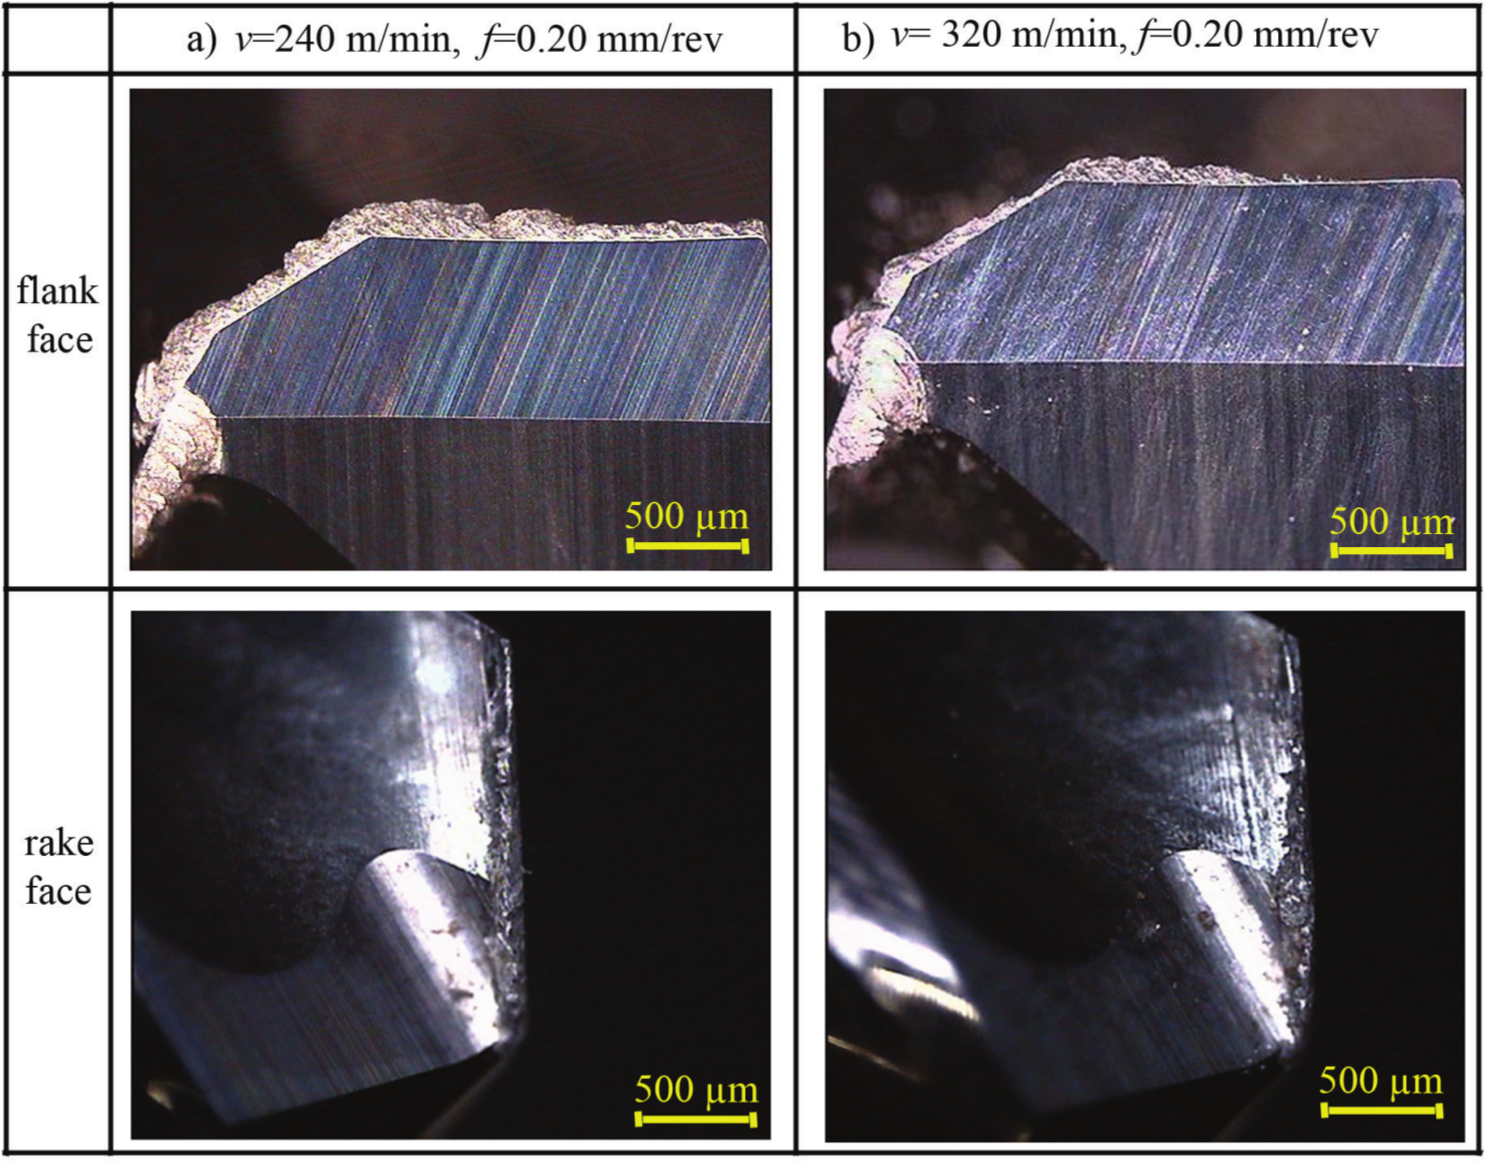
Built-up edge formation on cutting edge at the highest and lowest levels of cutting speed: (a) v = 240 m/min, f = 0.2 mm/rev and (b) v = 320 m/min, f = 0.2 mm/rev.
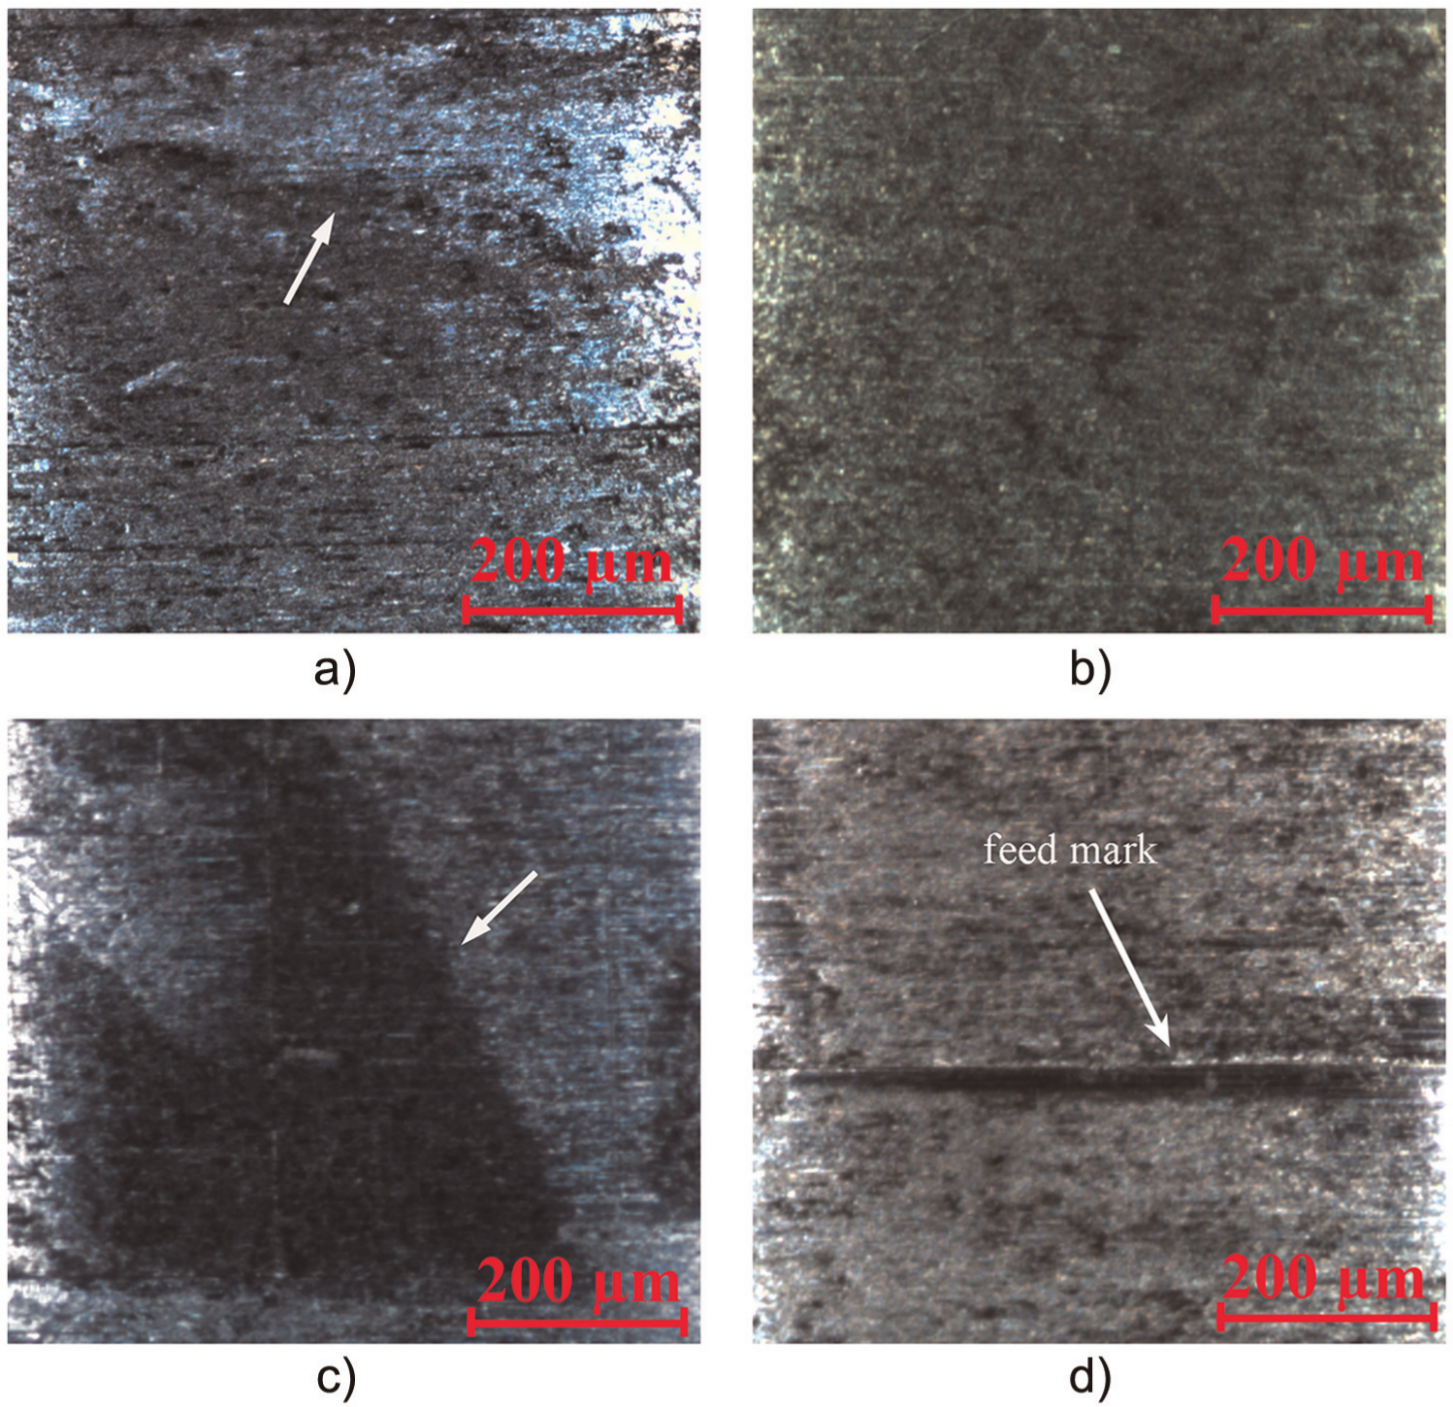
Effect of cutting parameters on machined surface: (a) v = 252 m/min, f = 0.23 mm/rev; (b) v = 308 m/min, f = 0.17 mm/rev; (c) v = 252 m/min, f = 0.17 mm/rev; and (d) v = 308 m/min, f = 0.23 mm/rev.
The shape and size of the generated chips are another important factors that have influence on the quality of drilled hole. Figure 10(c) shows the effect of chip sliding against the hole wall that turns the shiny silver color of machined surface to gray color indicating the deterioration of the surface finish. Long chips that were produced at low cutting speeds seem to smear the hole wall during sliding through the flutes.34,36Figure 11 shows four types of chips observed at all cutting conditions. However, conical chips had higher tendency to appear at low cutting speeds. The reasons of this phenomenon were broadly discussed in the earlier study. 34
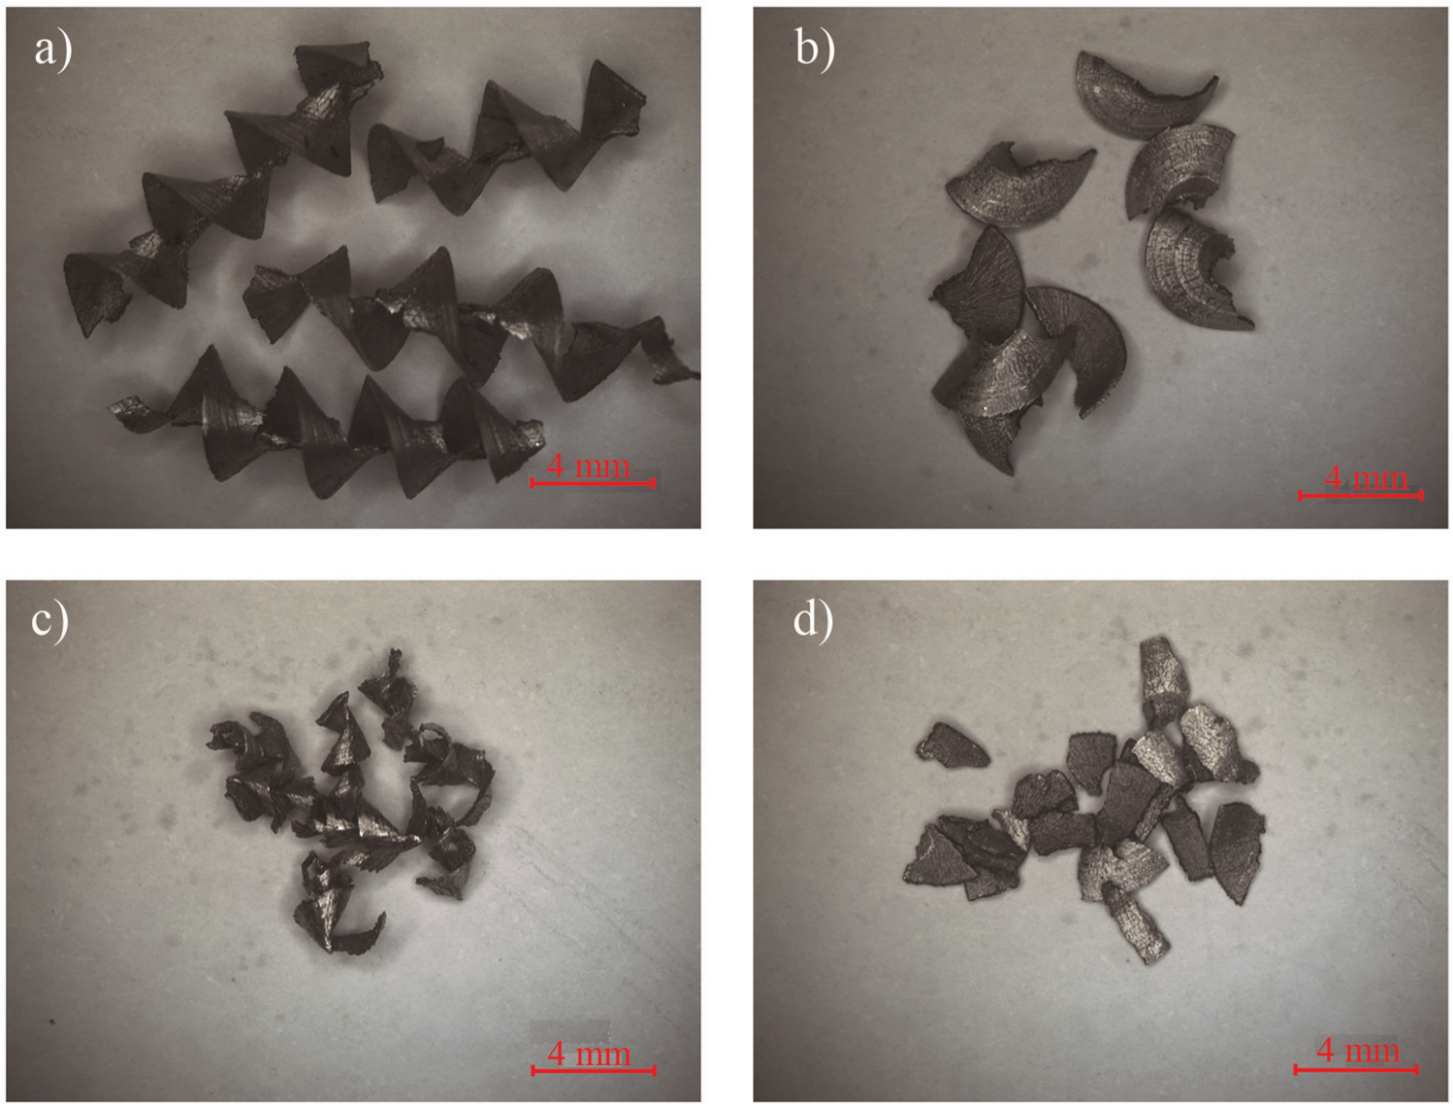
Four major chip forms generated by uncoated carbide drill: (a) conical, (b) broken conical, (c) chisel edge, and (d) amorphous.
Results in Table 6 show that the effect of feed rate is relatively insignificant when compared to cutting speed that could be described by the significant effect of BUE on surface roughness and its high dependency to the cutting speed. However, from interaction graph of cutting speed and feed rate (Figure 12), it is observed that the effect of cutting speed increment in reducing the surface roughness at the highest level of feed rate is less significant than its effect at lowest level of feed rate. This phenomenon can be described by the domination of feed mark that normally deteriorates the surface finish as feed rate increases. The effects of feed mark domination can be observed in Figure 10(d) at the highest level of feed rate.
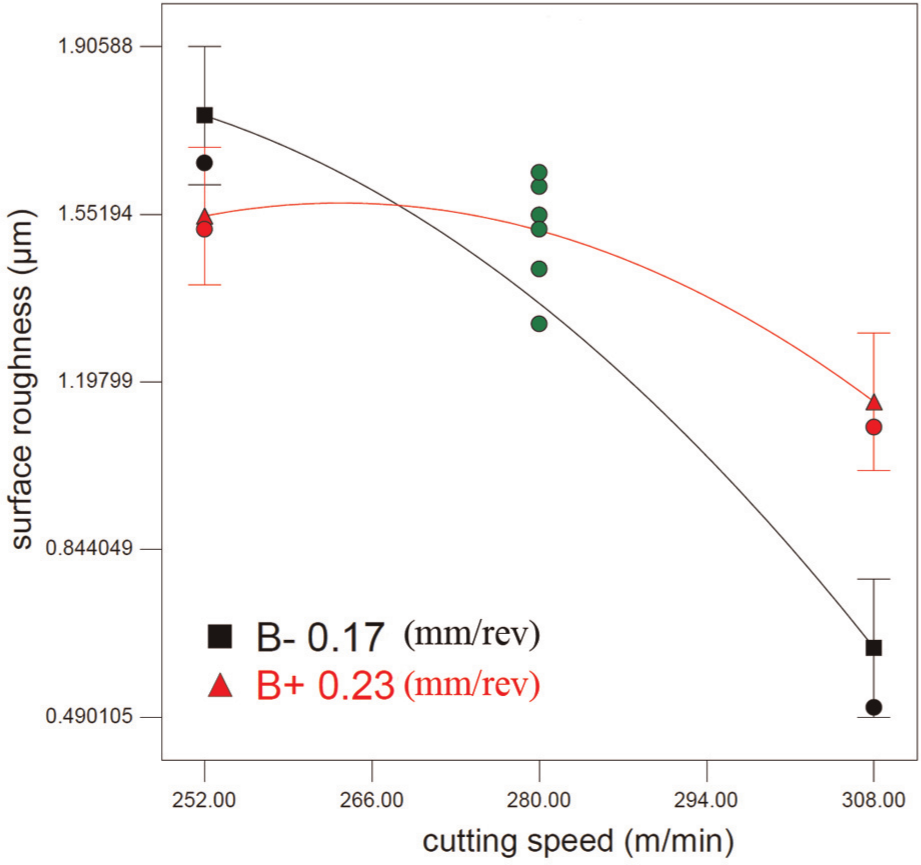
Variation of surface roughness with cutting speed at different feed rates.
The microstructural analysis and SEM micrograph of drilled holes subsurface at different cutting conditions (Figures 13 and 14) revealed the absence of defects such as fragmentation and fallout of silicon particles close to the machined surface observed in the earlier study when drilling Al–Si alloy using conventional high-speed steel (HSS) drills. 37 Subsequently, these microstructural damages could contribute to the poor surface finish of the drilled surface. The reason of this improvement must be attributed to the lower thrust force obtained when using split point geometry in this study as compared to conventional drill point. The chisel edge of the conventional point of the HSS drill has a high negative rake angle and it causes that drill tend to “walk” or drift during entry and thus require high thrust force. On the other hand, the split point of drill shaped by the notch type web thinning reduces the chisel edge length and thrust force and improves chip evacuation from the center of the drill. 38 Moreover, the presence of the bevel ground on the rake face reduces the contact in tool–workpiece interface.
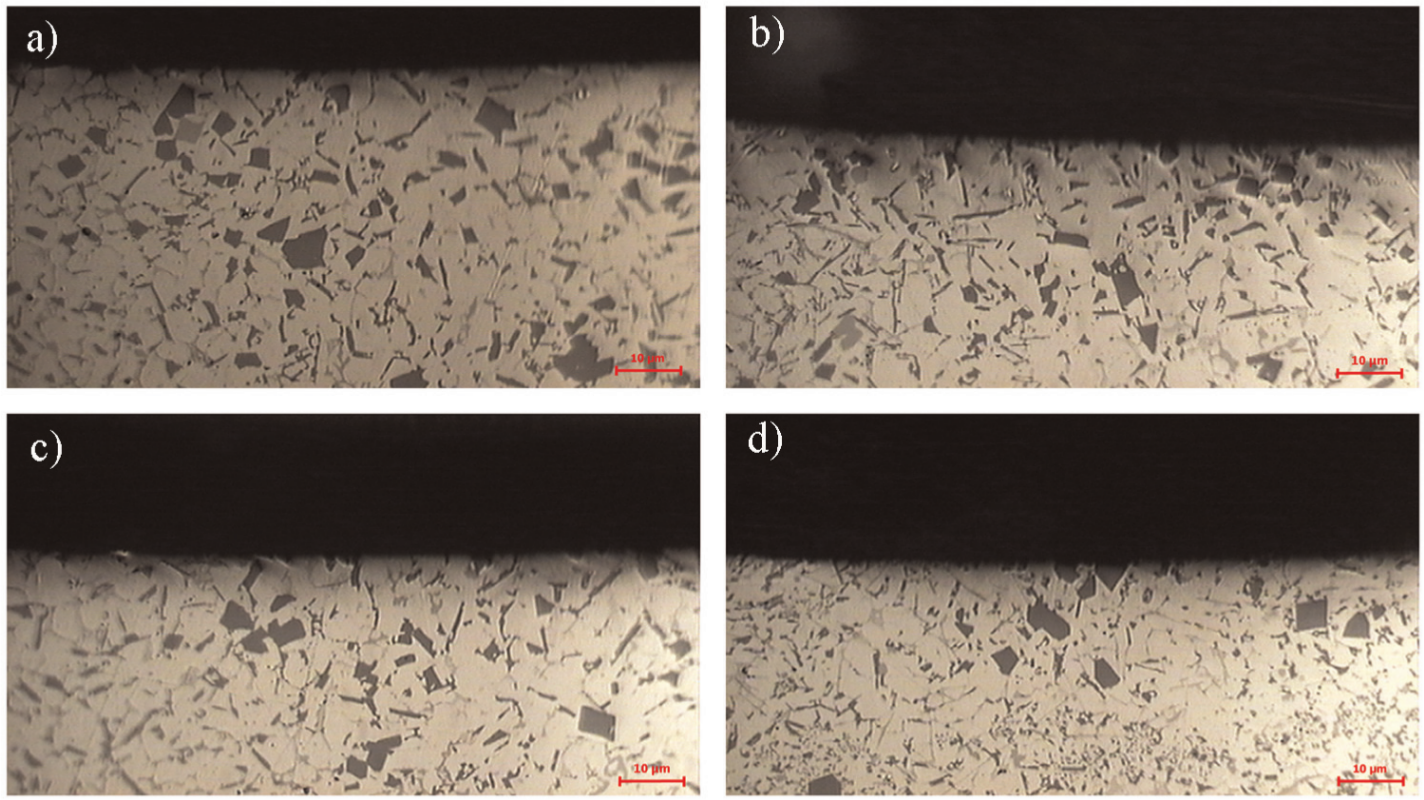
Optical micrograph of subsurface of the drilled hole using uncoated carbide drill: (a) v = 240 m/min, f = 0.2 mm/rev; (b) v = 320 m/min, f = 0.2 mm/rev; (c) v = 240 m/min, f = 0.2 mm/rev; and (d) v = 320 m/min, f = 0.2 mm/rev.
SEM micrograph of holes’ subsurface drilled using uncoated carbide drill at f = 0.2 mm/rev: (a) v = 240 m/min and (b) v = 320 m/min.
Optimization of cutting parameters
In this study, desirability approach popularized by Derringer and Suich
39
is applied to determine the optimal cutting condition for high-speed drilling of Al–Si alloy. This method is being used to optimize a process with respect to several criteria simultaneously and locates the operating condition (
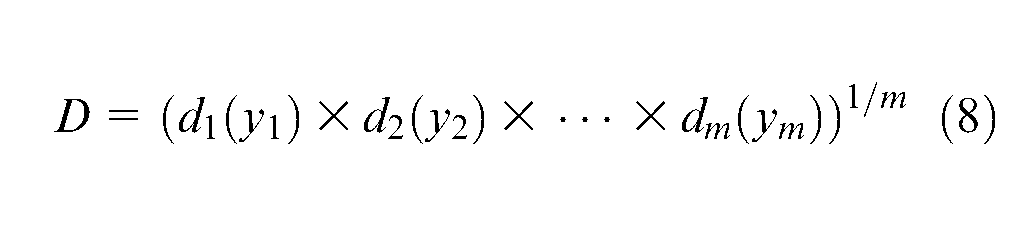
where m is the number of responses. The solution with maximum overall desirability can be selected as the optimal operation condition. Design Expert software also employs desirability approach for response optimization, and it has been used in this study to optimize the response parameters. The optimization target is defined so as to minimize the surface roughness and thrust force. Equal weights are given to every response while input parameters may be varied between following ranges


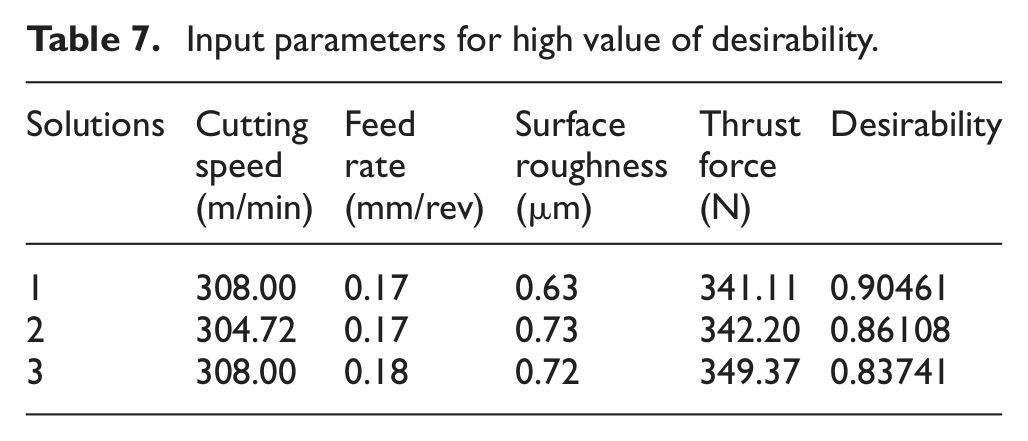
Table 7 shows the offered solutions, their desirability, and value of responses predicted for thrust force and surface roughness. The proposed solution with highest desirability was selected as the optimum cutting condition that is indicated in the contour plot of overall desirability, as shown in Figure 15(a). Figure 15(b) shows the overall desirability curve that is maximized in the region of high cutting speed and low feed rate.
Input parameters for high value of desirability.
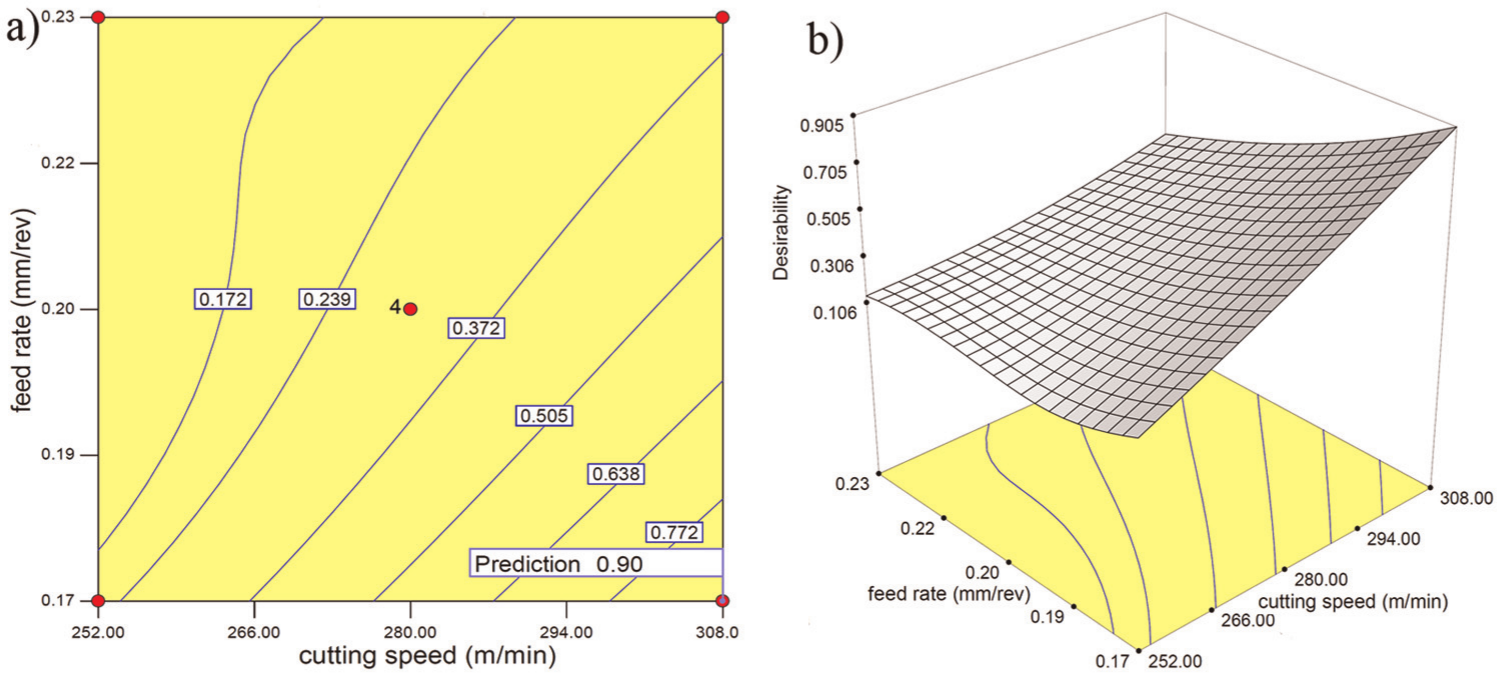
Result of overall desirability function: (a) contour plot and (b) 3D surface graph.
Conclusion
In this article, RSM approach was used to study the effect of cutting speed and feed rate on the thrust force and surface roughness during high-speed drilling of A383 aluminum alloy. The experiments were planned based on CCD in order to decrease the number of experiments. Second-order polynomial models were developed for thrust force and surface roughness, and the adequacy of the models was evaluated using ANOVA. From the study, the following conclusions were proposed:
Second-order models were fitted for both thrust force and surface roughness results, which these models are able to explain 99% and 95% of the variation in the thrust force and surface roughness values, respectively, by relating them to the changes of cutting speed and feed rate.
Linear effect of cutting speed and feed rate had the highest contribution to the thrust force model. An increase in cutting speed leads to a decrease in thrust force, while increase in feed rate tends to increase the thrust force. Moreover, thrust force reduction due to the increase of cutting speed is more significant in the highest level of feed rate.
Linear and quadratic effects of cutting speed are the most significant terms influencing the surface roughness. In general, the surface roughness decreases as the cutting speed increases, while increase in feed rare resulted in poor surface finish due to the domination of feed mark feature on the drilled surface.
Favorable holes’ subsurface quality was observed when using split point geometry in the range of cutting parameters used in this study, and minimum surface roughness and thrust force were predicted for cutting speed of 308 m/min and feed rate of 0.17 mm/rev.
Footnotes
Funding
This study was financially supported by the Ministry of Higher Education Malaysia (MOHE), Research Management Center, and UTM through Research University Grant (RUG) funding number Q.J130000. 7124.02H43.