
Abstract
The mechanical properties of metallic strips can be improved by producing an ultra-fine-grained microstructure. The equal-channel angular rolling process is a severe plastic deformation technique suitable for such a purpose. In this article, the effect of the equal-channel angular rolling parameters on the equivalent plastic strain is investigated and their optimum values are reported. The analysis is focused on the following parameters: thickness ratio (K), die channel angle (ϕ), die outer corner angle (ψ), fillet radius (r), friction coefficient between strip and rolls (µ), and friction factor between strip and die (m). Using a combination of the finite element modeling and the response surface methodology with central composite design, a simple and efficient quadratic model is developed to predict the equivalent plastic strain dependence on the equal-channel angular rolling process parameters. The analysis of variance is applied to assess the validity of the model and find the significant parameters. The results show that the die channel angle is the most significant parameter, while the friction coefficient between strip and rolls has no considerable effect on equivalent plastic strain. Moreover, the following optimum values of the parameters are obtained: K = 0.96, ϕ = 90.10°, ψ = 21.21°, r = 2.31 mm, µ = 0.20, and m = 0.19. An increase of about 14.86% in the equivalent plastic strain can be achieved by adopting these values for the process parameters.
Keywords
Introduction
Extensive research has been conducted to investigate the structural evolution and the change in the mechanical response associated with severe plastic deformation (SPD). The studies proved that materials with ultra-fine-grained (UFG) structure can be obtained by inducing high plastic strains. Conventional metal forming techniques such as rolling, extrusion, and drawing are not able to develop sufficient strains for producing fine-grained components. 1 The SPD processing techniques have been developed to overcome this disadvantage.
Among the SPD techniques, equal-channel angular pressing (ECAP) 2 has gained a commercial significance in recent years, since it can be used as a procedure through which various bulk UFG materials can be produced without changing their cross section. ECAP is able to develop plastic strains of ∼1 at a single pass.3,4 Since negligible change occurs in the cross-sectional shape of specimens after ECAP, a multi-pass operation is also possible.4–7 Therefore, this method has been used to produce UFG bulk materials with enhanced mechanical properties.3,4,8 According to the Hall–Petch relationship, 9 reducing the grain size leads to an increase in the strength and hardness characteristics. Therefore, materials with uniform UFGs can be used as high-strength materials. However, the ECAP process has two major disadvantages. First, it cannot handle long and thin sheet metal, being restricted to bulk metals with rectangular and circular cross sections. Second, ECAP cannot be applied in a continuous manner, which results in low production efficiency and high cost.10,11
Several attempts have been made to overcome these disadvantages. Techniques including equal-channel angular drawing (ECAD), 12 accumulative roll bonding (ARB), 13 repetitive corrugation and straightening (RCS), 14 continuous shear deformation process (conshearing), 15 continuous confined strip shearing (C2S2), 16 continuous frictional angular extrusion (CFAE), 17 equal-channel angular sheet extrusion, 18 ECAP-Conform, 19 and so on have been recently developed as continuous ECAP methods usable for the production of UFG sheet materials.
Lee et al. 20 introduced the so-called C2S2 process based on ECAP, which enables the production of metallic strips in a continuous manner and can induce shear strains into a long and thin metallic sheet. The newly developed process was termed dissimilar channel angular pressing (DCAP) and equal-channel angular rolling (ECAR) to distinguish this technique from the conventional ECAP. During this process, a thin metal strip is fed through the feeding rolls into the inlet channel. In order to prevent metal strip escape from the rolls’ gap, the inlet cross section of the channel is slightly thinner than that of the strip. Then the material flows into the forming zone where the inlet and the outlet channels intersect at a specific angle. The strip then flows into the outlet channel, which has the original thickness of the strip, allowing the metallic strip to recover its initial thickness and leave the ECAR die with its original shape. Figure 1(a) illustrates the ECAR process with an initial strip thickness of 2 mm, inlet channel thickness of 1.8 mm, outlet channel thickness of 2 mm, die channel angle of 120°, and die outer corner angle of 0°. Figure 1(b) shows the ECAR die mounted on the rolling mills and the load cells by means of which the upper roller force was measured.
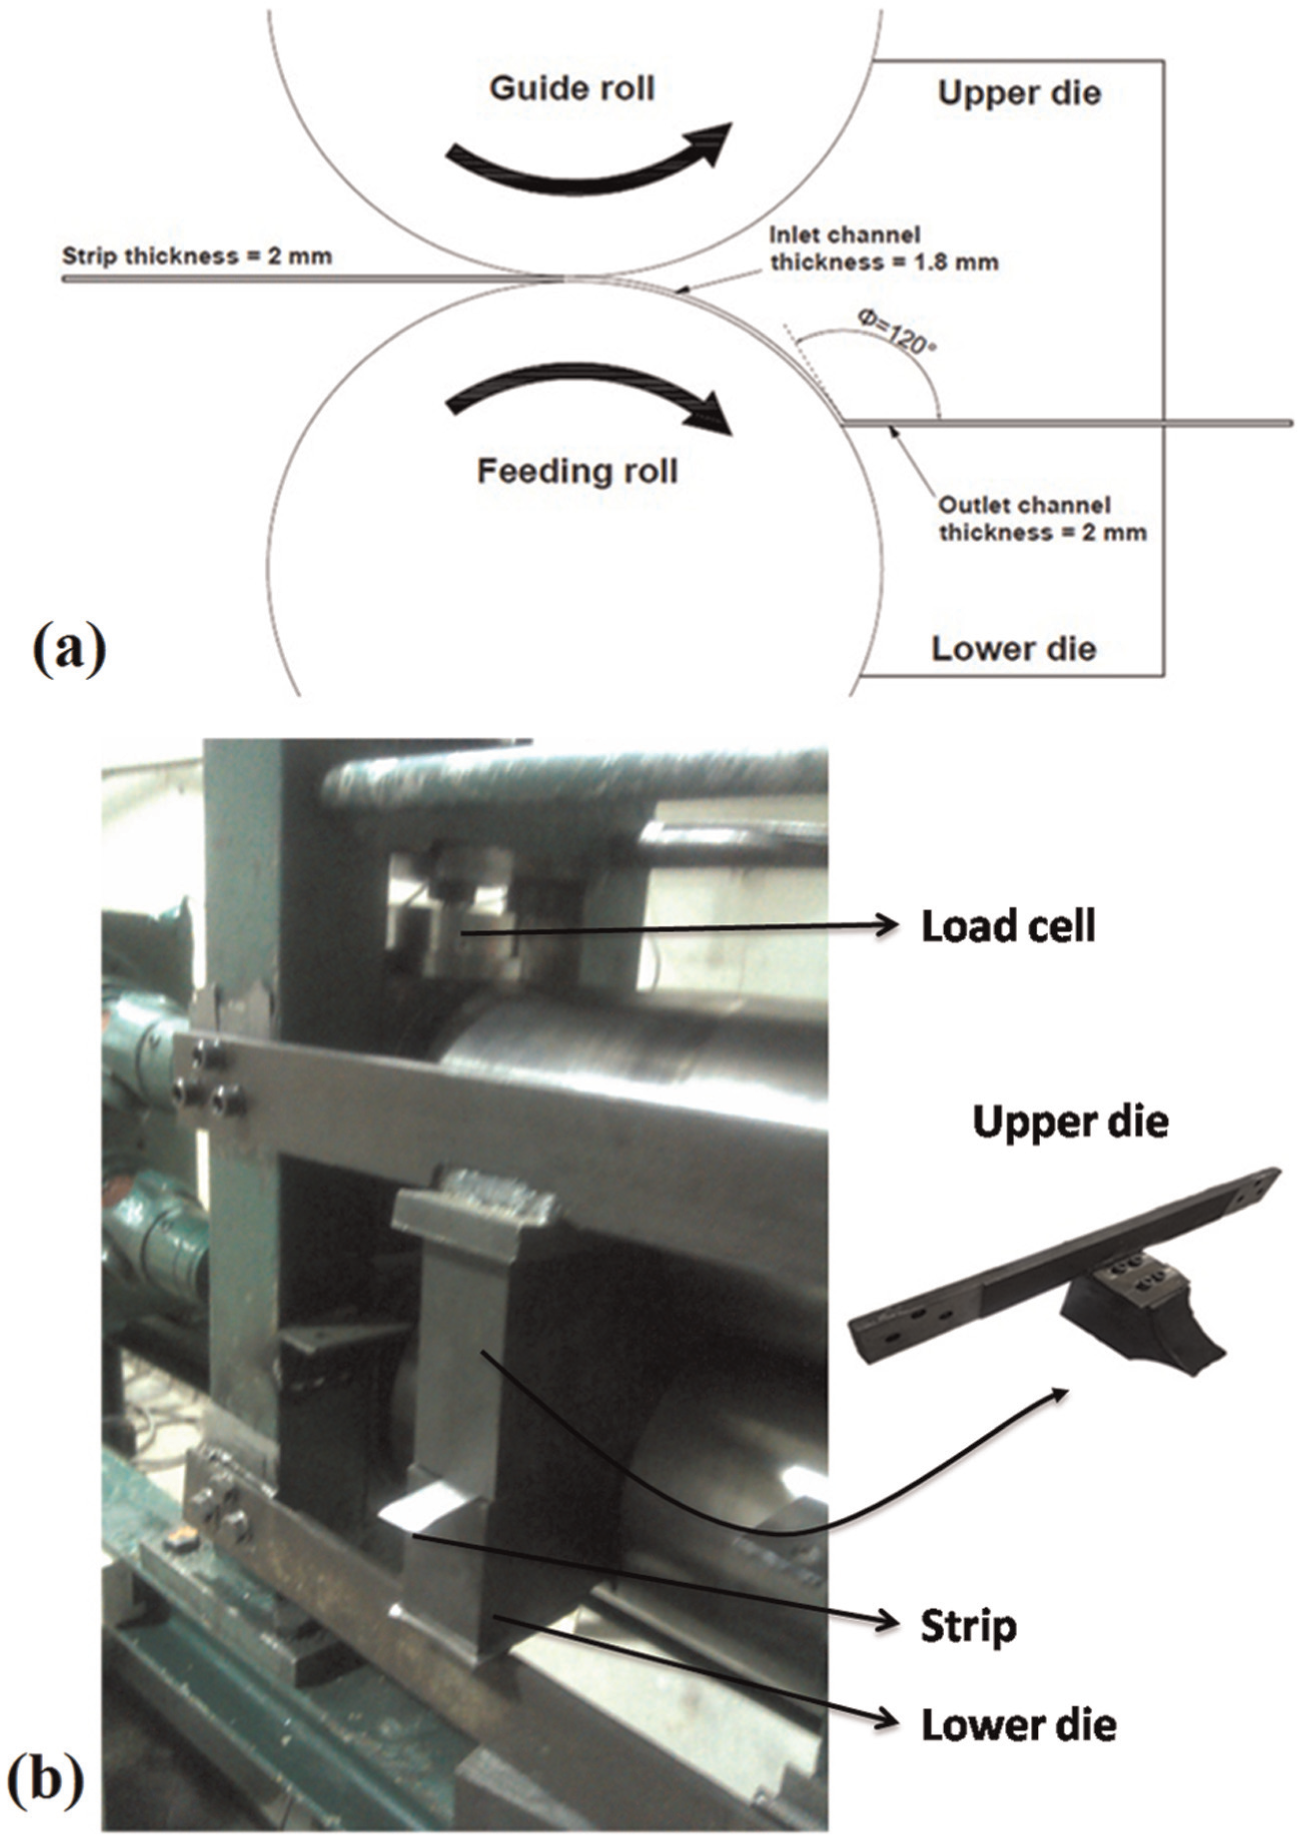
(a) Schematic illustration of ECAR process and (b) ECAR die mounted on the rolling mills.
Although it is possible to produce severe plastic strains using SPD processes like ECAP, ECAR, and ARB, if the technological parameters are not set properly, the efficiency of these processes will be inappropriate. For this reason, many attempts have been made to optimize the parameters of the SPD processes. Srinivasan and Cherukuri 21 optimized the ECAP parameters for strain homogeneity. In their work, the effect of parameters such as the outside corner angle, inner radius, and shear friction on the strain homogeneity was investigated. Ebrahimi et al. 22 used the finite element method (FEM) to obtain higher values of the effective strain, more uniform strain distributions, and lower pressing forces in ECAP. Luri and Luis Pérez 23 performed a numerical investigation on the effect of the geometrical parameters of the dies and the part on the punch force in the equal-channel angular extrusion process. Xu et al. 24 investigated the influence of the geometrical and frictional parameters of the die on the deformation behavior of the pure aluminum sheets in the ECAR process. Wei et al. 25 showed that the distribution of the effective strain in most regions of the workpiece is uniform in ECAR. As the die channel angle increases, the effective strain decreases and becomes more uniform over the whole specimen. Kvačkaj et al. 26 used the FEM to investigate the effects of the die angle and friction parameters on the stress and strain distribution, strain homogeneity, shear deformation, and the required torque in ECAR.
The traditional optimization method considers one factor at a time and keeps the level of all the other variables fixed. Using this method in applications with multiple effective variables is expensive and time-consuming. Furthermore, the interaction between factors is ignored in this method. Therefore, in order to overcome these disadvantages, other methods like response surface methodology (RSM) can be used in order to evaluate the effect of several factors and responses with an acceptable number of experiments. RSM also provides simple relationships for the prediction of responses. Many successful optimizations and predictions have been performed using RSM in different fields. Some examples of RSM application in the field of metal forming are as follows: Venkateswarlu et al.
27
optimized the friction stir processing parameters using RSM. They obtained an improved microstructure for magnesium AZ31B alloy, which showed better mechanical properties and formability. Velmanirajan et al.
28
utilized RSM to predict the formability of aluminum alloys. Naceur et al.
29
optimized tool geometry in sheet metal forming in order to reduce the springback using RSM. Although ECAR processes are widely investigated in recently published articles, there is no work devoted to the optimization of the process parameters. To partially fill this gap, in this research, RSM and the analysis of variance (ANOVA) are employed to obtain the optimum values of the ECAR parameters. These parameters are the thickness ratio (K, the ratio of strip thickness at inlet channel to the strip thickness at outlet channel), die channel angle (
Finite element analysis
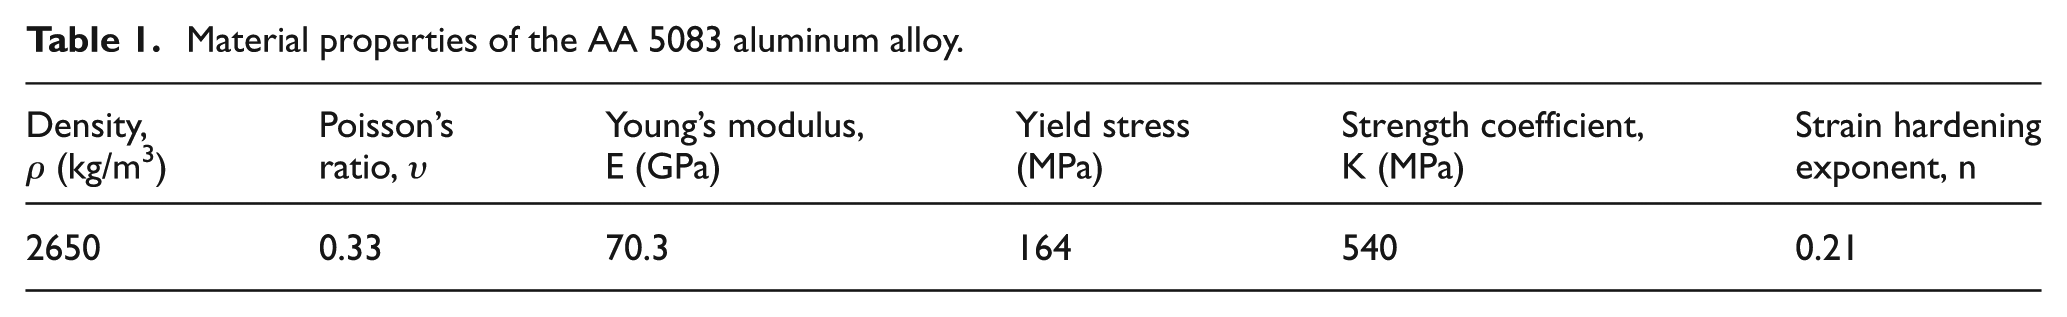
Finite element analysis is an effective tool to predict the material flow properties and field variables, especially for the metal forming processes like ECAR. In this research, AA5083 aluminum alloy specimens with 300 mm length, 30 mm width, and 2 mm thickness were employed. Two-dimensional (2D) finite element simulations were carried out using the commercial ABAQUS/Explicit software to obtain the distribution of the equivalent plastic strain (PEEQ) in the specimens. The mechanical response of the aluminum alloy was described using an isotropic elastoplastic constitutive model. The upper and lower dies and rollers were represented as discrete rigid bodies. A constant angular speed of 1.15 rad/s was assumed for the rollers. The friction force between the rolls and the strip acts as a driving force to push the strip through the ECAR die. The Coulomb friction model with a constant coefficient of friction
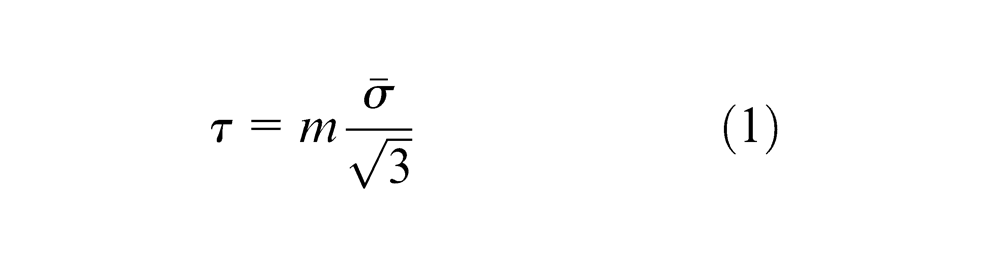
where
Material properties of the AA 5083 aluminum alloy.
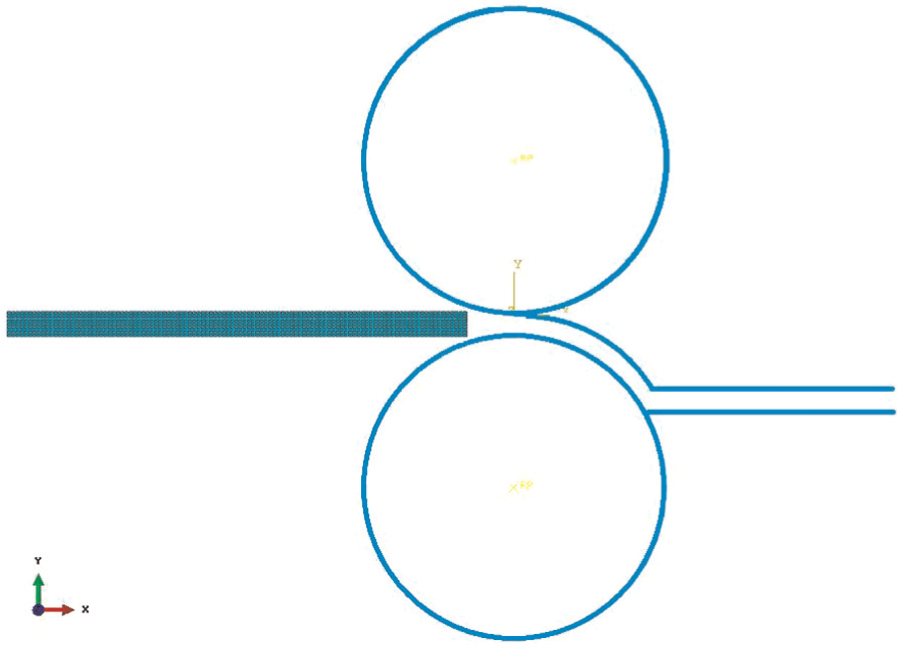
Finite element model of the ECAR process.
The values of the parameters in the finite element model were selected according to the experimental condition. The geometrical parameters, the thickness ratio (
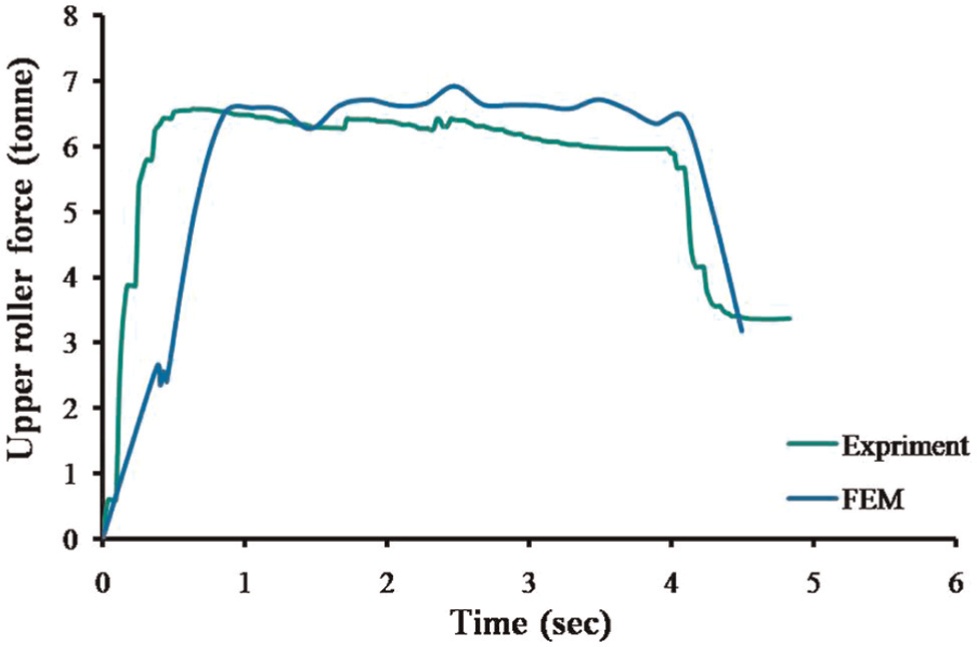
Comparison between the experimental and computed forces for the first ECAR pass.
Figure 4 shows some specimens after single-pass ECAR (
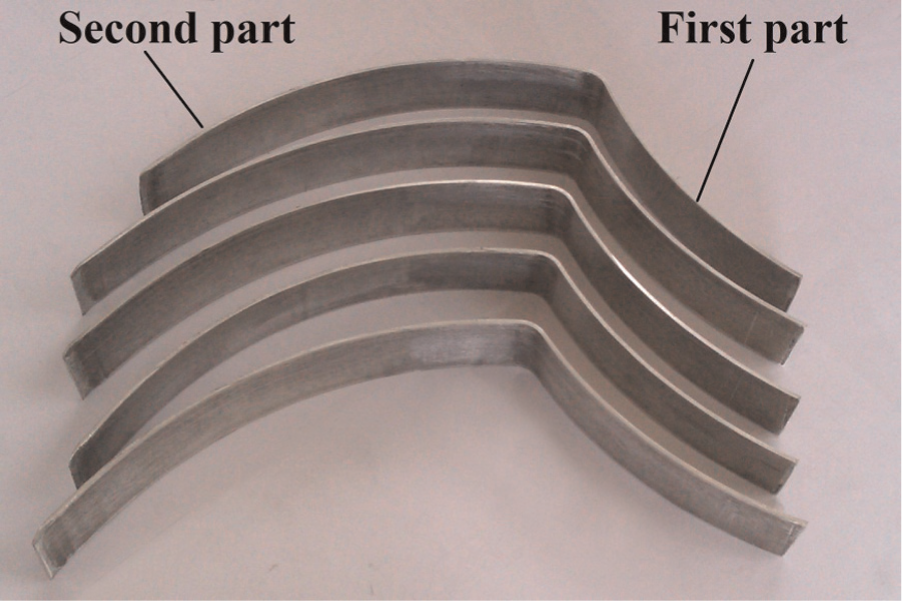
Single-pass ECARed samples (
Figure 5(a) shows PEEQs obtained by numerical simulations in the middle path of the strip with respect to distance (longitudinal direction of the sample). The sharp increase in the PEEQ value visible on every curve in Figure 5(a) corresponds to the transition from the rolled to the severely deformed regions of the specimens. As one may note in Figure 5(a) that increased maxima of the PEEQ can be obtained by decreasing the die channel angle.
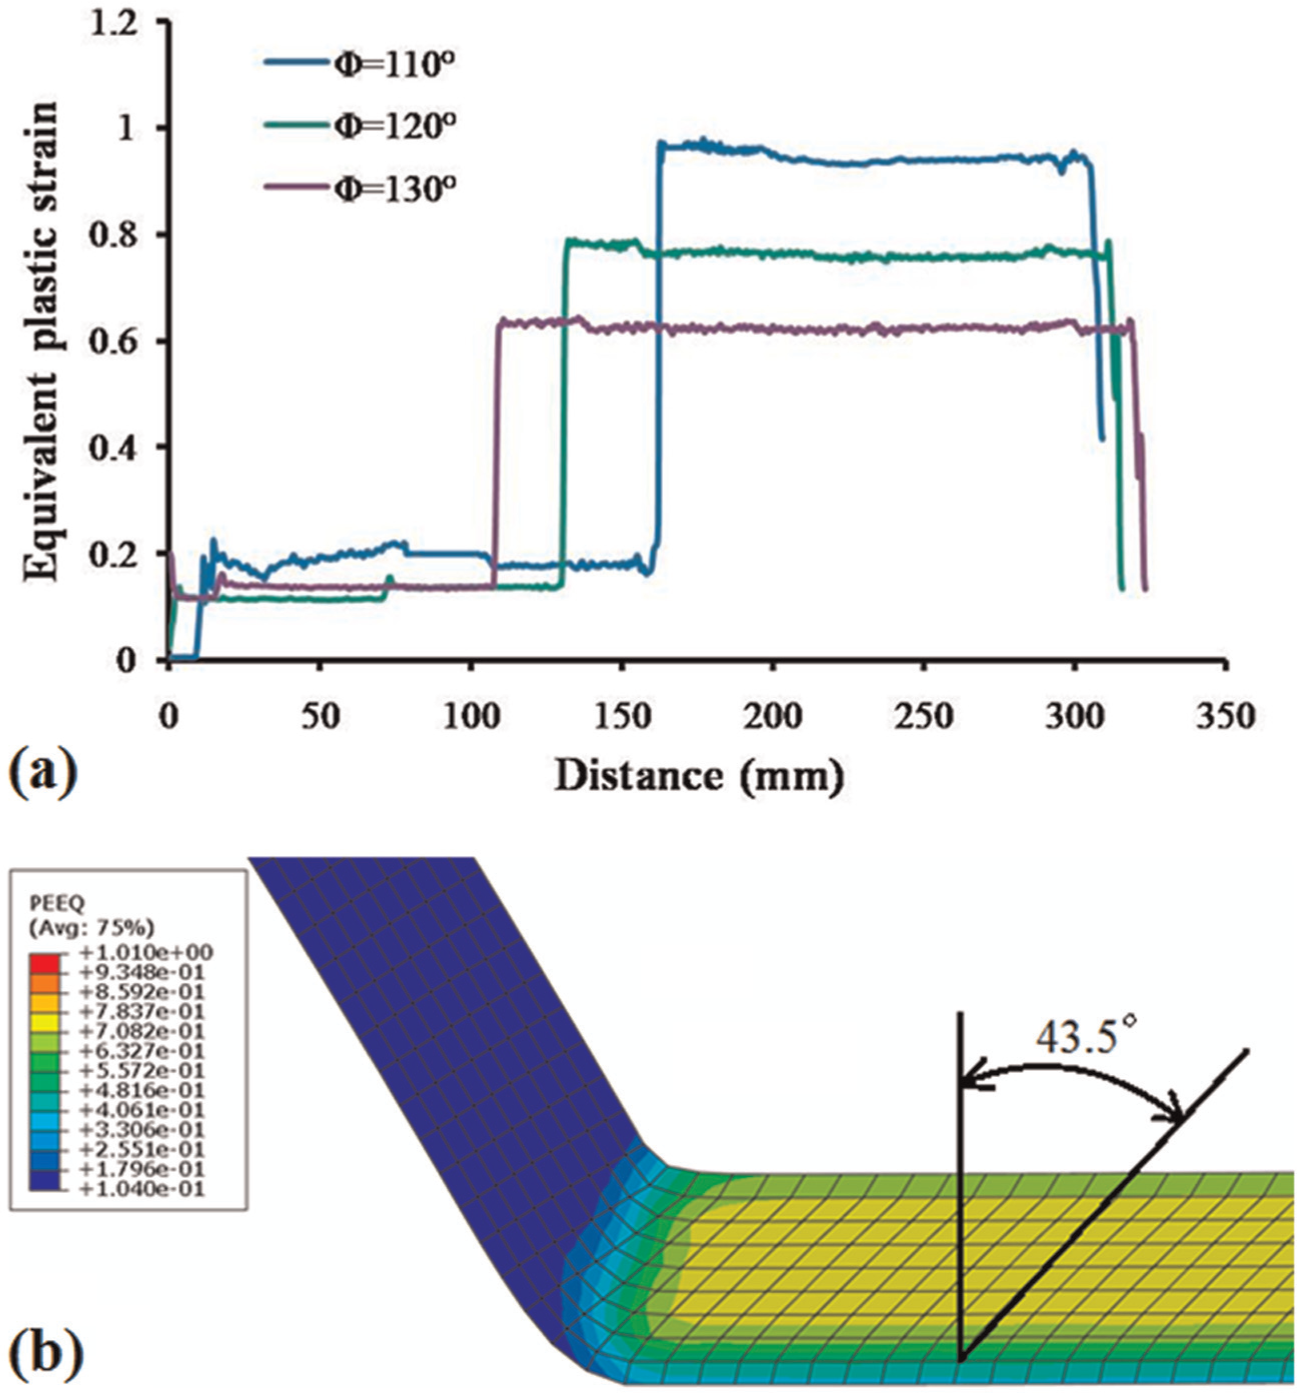
(a) Effect of the die angle on the equivalent plastic strain (PEEQ) along the middle path of strip and (b) shear deformation after single ECAR (channel angles of 120°).
During ECAR process, plastic strains with three major sources are imposed to the strip. The first one is the normal plastic strain that is imposed to the strip during rolling and reduction of the thickness. The second and the most important part of the plastic strain is the shear strain that is imposed to the strip during passing through the intersection of the die channels and the last one is the shear plastic strain caused by the frictional sliding of the strip during ECAR process. Figure 5(b) illustrates the distortion of the elements due to shear plastic deformations, which are imposed at the intersection of the die channels and frictional contact surfaces (frictional contact between top and bottom surfaces of the strip with die surface). The first and the second plastic strains can be calculated by analytical formulations. Iwahashi et al. 31 developed an analytical model for calculation of the shear strain in ECAP process. This model that was modified by Lee et al. 16 for calculation of the shear strain imposed to the strip at the shear deformation zone in the ECAR process. This shear strain can be obtained using
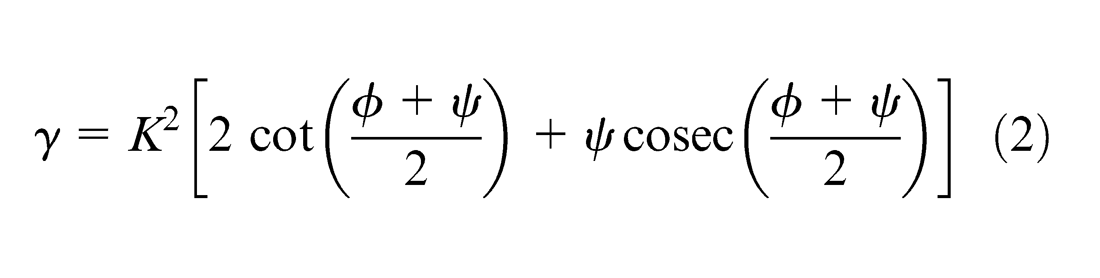
where
where
where
Central composite design
Box–Behnken and central composite designs (CCDs) are the most recommended types of RSM designs. In this research, CCD was applied for experimental design. Generally, CCD can be classified into three types, namely, circumscribed, inscribed, and face-centered CCD. Among these CCDs, the central composite inscribed (CCI) design is suitable for situations in which the limits of the factors are truly limits. 33 In this study, since the specified upper and lower limits of the parameters (factors) satisfy these conditions, the CCI design was used. The CCI design considers the upper and lower limits as the start points and creates a factorial or fractional factorial design within these limits.
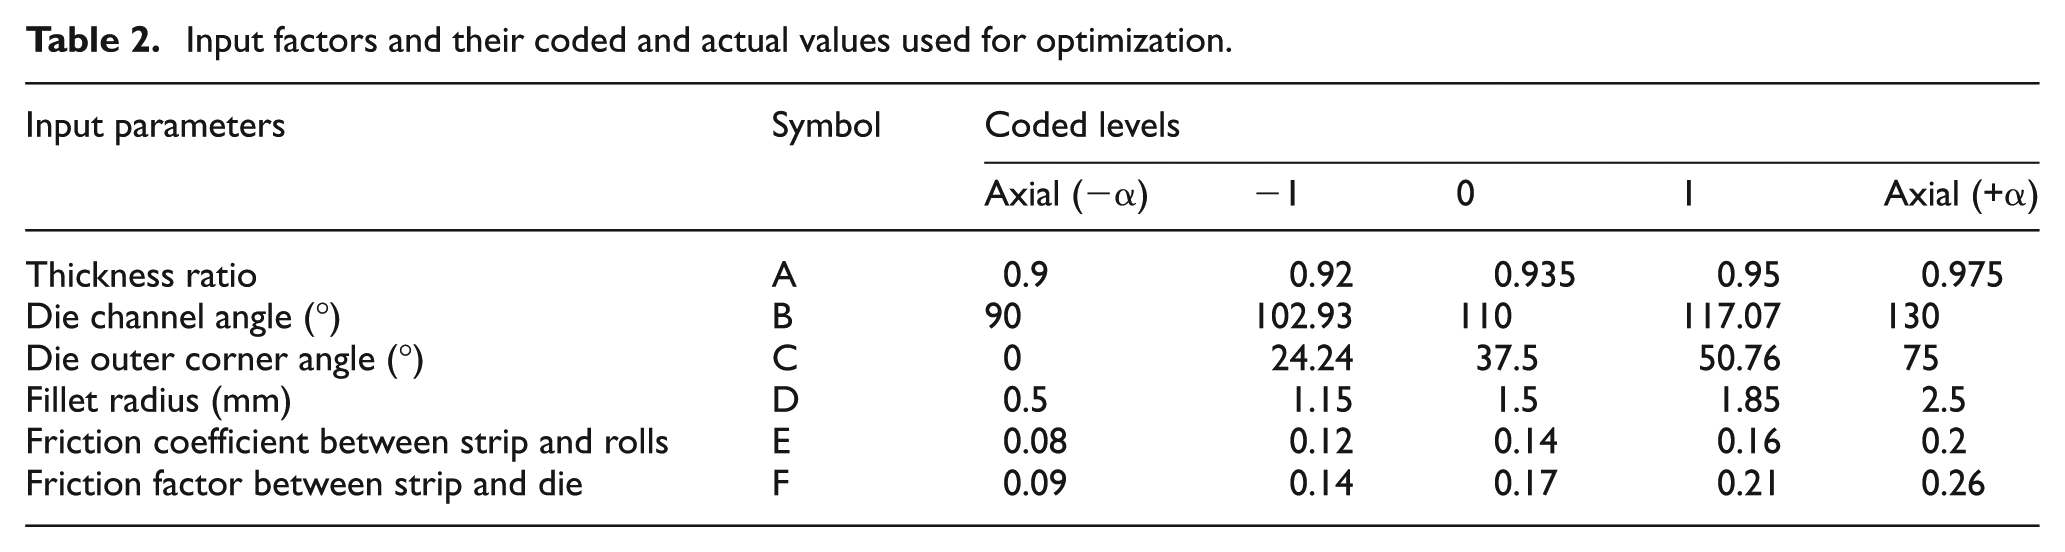
The optimization procedure was designed based on the six-factor CCI design consisting of the thickness ratio (
Input factors and their coded and actual values used for optimization.
Six-factor CCI design with numerical and predicted values of PEEQ. Fact: Factorial points.

The average PEEQs of the strips were considered as the desired response in our study. The values of the average PEEQs (actual value of the response, Table 3) were obtained by least-square fitting a straight line to the upper chunks of the PEEQ curves. The predicted values of the response were obtained using RSM. According to Table 3, 10 center points have been selected in our RSM design. The actual plastic strain values for these center points are identical because they were calculated in the absence of external noises.
ANOVA
A custom quadratic model was developed for the prediction of plastic strains. The ANOVA method was used to assess the fitness of the model to the numerical data. The results of the ANOVA analysis are listed in Table 4. In this table, the F-value is the ratio of the model mean square to the appropriate error mean square. Larger F-values indicate the likelihood that the variance contributed by the model is significantly larger than the random error. 35 The probability of a larger F-value (p-value or prob > F) is the probability of seeing the observed F-value if the null hypothesis is true (there is no factor effect). Small probability values call for rejection of the null hypothesis. In other words, if the p-value is very small (less than 0.05), then the terms in the model have a significant effect on the response. The p-value equals the proportion of the area under the curve of the F-distribution that lies beyond the observed F-value. 34
ANOVA table for the equivalent plastic strain.
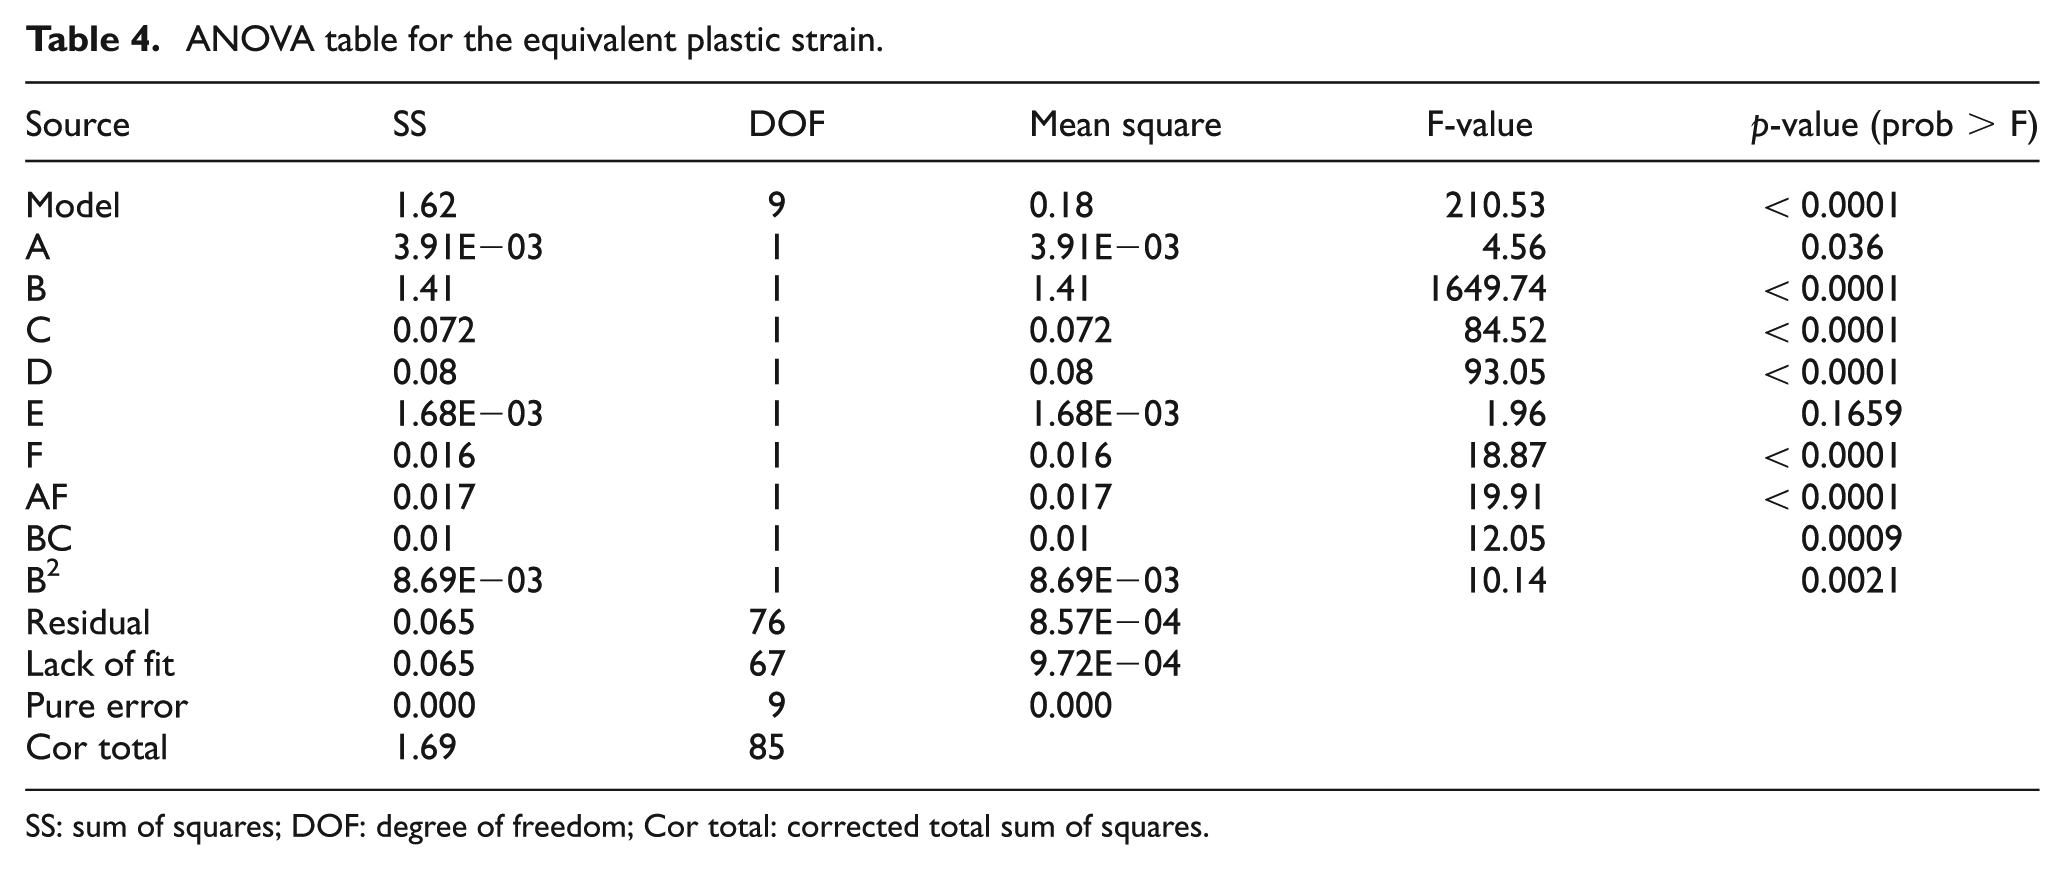
SS: sum of squares; DOF: degree of freedom; Cor total: corrected total sum of squares.
In Table 4, we included only six independent factors (Table 2) and the significant quadratic terms, that is, AF, BC, and B2. The F-value of the custom quadratic model is equal to 210.53, which implies that the model is robust. According to Table 4, the probability of occurrence for such a large F-value is less than 0.01% (p < 0.0001), mainly due to the noises that appear in the data acquisition.
The p-values less than 0.05 identify the significant terms. According to this criterion, A, B, C, D, F, AF, BC, and B2 are significant terms. All the other terms (characterized by p-values greater than 0.05) were removed from the analysis.
The data provided by ANOVA were used to obtain a quadratic relationship between the response (PEEQ) and the significant terms A, B, C, D, F, AF, BC, and B2 as follows
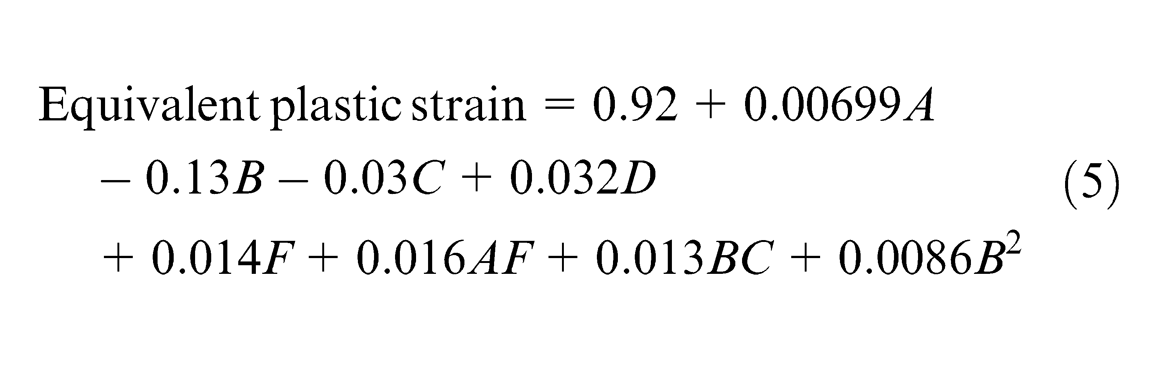
Equation (5) was used to predict the PEEQ values. A comparison between the predictions of equation (5) and the finite element results is shown in Table 3. One may note the high accuracy of the model. The coefficient of correlation (R2) for the model is equal to 0.9614, which is quite reasonable for the response surface. Another approach is to employ the sum of squares (SS) to test the statistical significance of the terms and the model. For this purpose, we can use
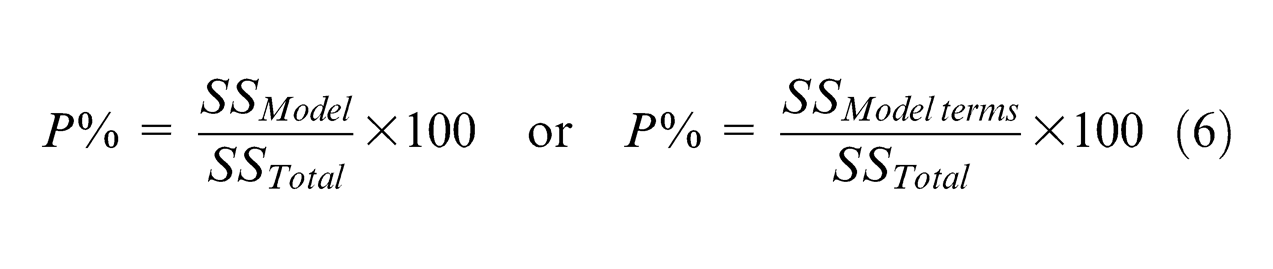
so that P% is the percentage contribution of the model or model terms. The P% for the model is about 96.14%, which indicates that the conducted model has a high confidence level. In this regard, P% for “lack of fit” is about 3.86% meaning that the model is well reproducing the actual data. The same conclusion can be formulated with respect to the high values of R2 (adjusted R2 is 95.69%). Moreover, the p-values of the second-order terms, that is, AF, BC, and B2 in equation (5), are <0.0001, 0.0009, and 0.0021, respectively. This indicates that they have a significant effect on the model.
Graphical interpretation of the models
Response contour and surface plots are useful tools to investigate the interaction and the individual effects of the process parameters on PEEQ. Figure 6 shows the combined effects of the thickness ratio (A) and friction factor between strip and die (F) on PEEQ. The die channel angle, die outer corner angle, fillet radius, and friction coefficient between strip and rolls were hold at 110°, 37.5°, 1.5 mm, and 0.14 (center point values), respectively. According to Figure 6, the highest value of PEEQ (1.09) was obtained at the highest values of the thickness ratio (0.97) and friction factor between strip and die (0.26). The PEEQ usually increases with the increase in the thickness ratio and the friction between strip and die. But Figure 6 unexpectedly shows that the PEEQ decreases at lower thickness ratios with an increase in the friction between strip and die. Also, this figure shows that the PEEQ decreases at the lower friction factors with an increase in the thickness ratio. This indicates that there is an interaction between the friction factor and the thickness ratio in the ECAR process. With an increase in the thickness ratio, two events will happen. First, the shear strain and consequently the PEEQ will increase due to the increase in the difference between the inner and the outer arc lengths at the shear deformation region. Second, the flow of the material through shear deformation region will be facilitated due to the decrease in the required thickness recovery, which results in a lower value of the PEEQ. So it seems that at a lower value of the friction factor between the strip and the die, the PEEQ is more influenced by the second circumstance, and hence, its value decreases with the increase in the thickness ratio. As mentioned above, Figure 6 shows that at the lower values of the thickness ratio, the PEEQ decreases slightly with the increase in the friction factor. Such a behavior could be the result of some changes in shear strain with respect to different process parameters. 36 The explicit discussion about the other possible reasons requires more investigations.
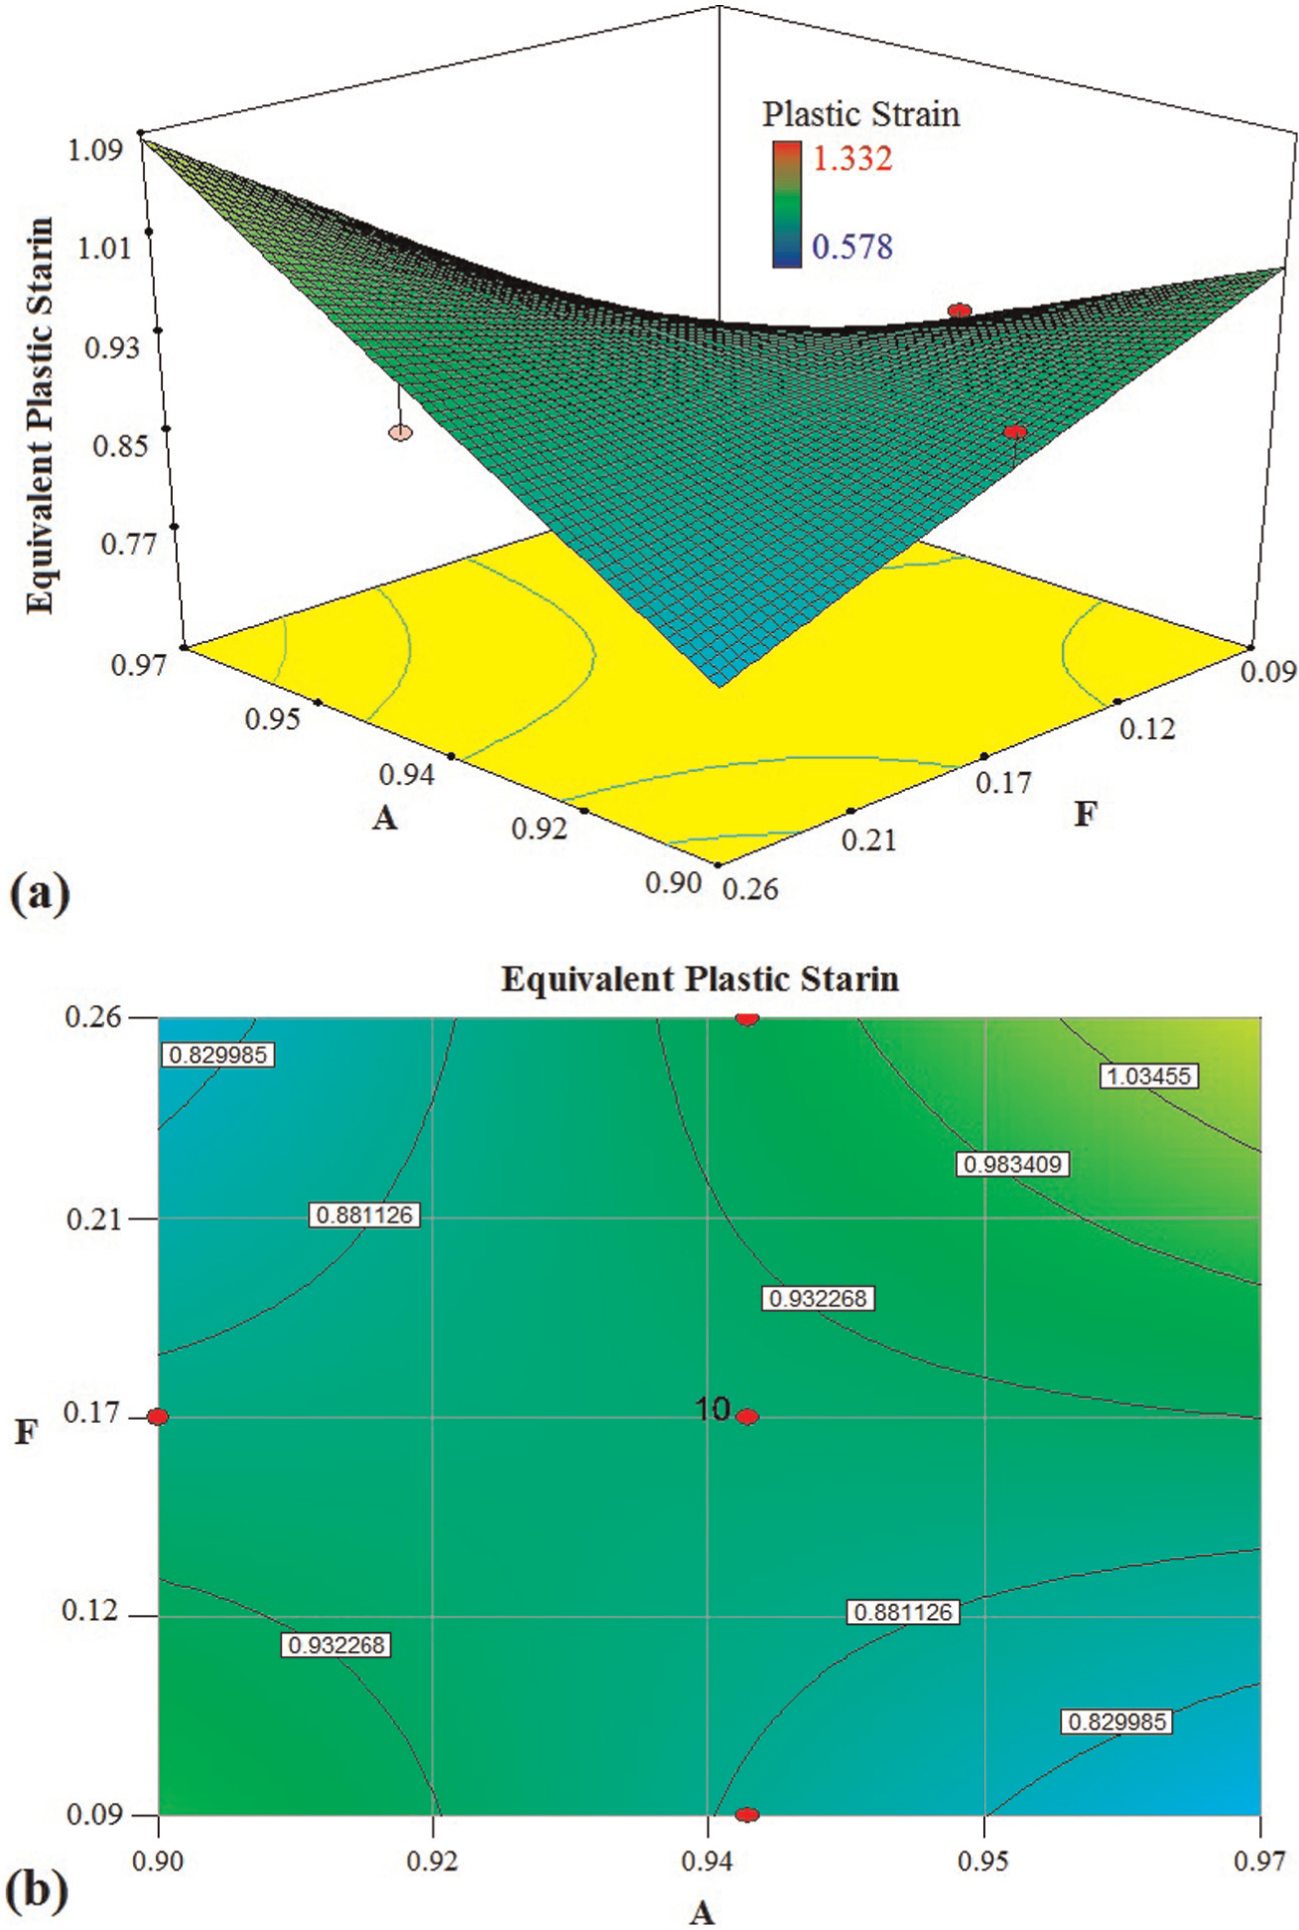
(a) Response surface and (b) contour plots of the equivalent plastic strain with A and F factors.
In Figure 6, the blue and red colors are related to the minimum (0.578) and maximum (1.332) values of PEEQ. The green color, which is dominant in Figure 6, shows the average value of PEEQ so that in these ranges of thickness ratio and friction factor between strip and die (other parameters are fixed at the center point), an average PEEQ can be achieved.
Figure 7 shows the combined effects of the die channel angle (B) and die outer corner angle (C) on PEEQ. The thickness ratio, fillet radius, friction coefficient between strip and rolls, and friction factor between strip and die were hold at 0.94, 1.5 mm, 0.14, and 0.17 (center point values), respectively. As one may note that the highest value of PEEQ (1.55) corresponds to the lowest values of the die channel angle (90°) and the die outer corner angle (0°). However, there are some limitations for the selection of these angles; inappropriate choice of these angles (beside the values of other parameters) increases the forming forces extensively and can prevent the strip from feeding into the die channel in some cases. This causes the strip dragging at the intersection of the die channels and the failure of the ECAR process. Therefore, these limitations must be considered when selecting the die channel and corner angles. Figure 7 also shows that the PEEQs change in a wider range as compared to Figure 6 and depicts that the die channel angle is the most significant factor in the ECAR process.
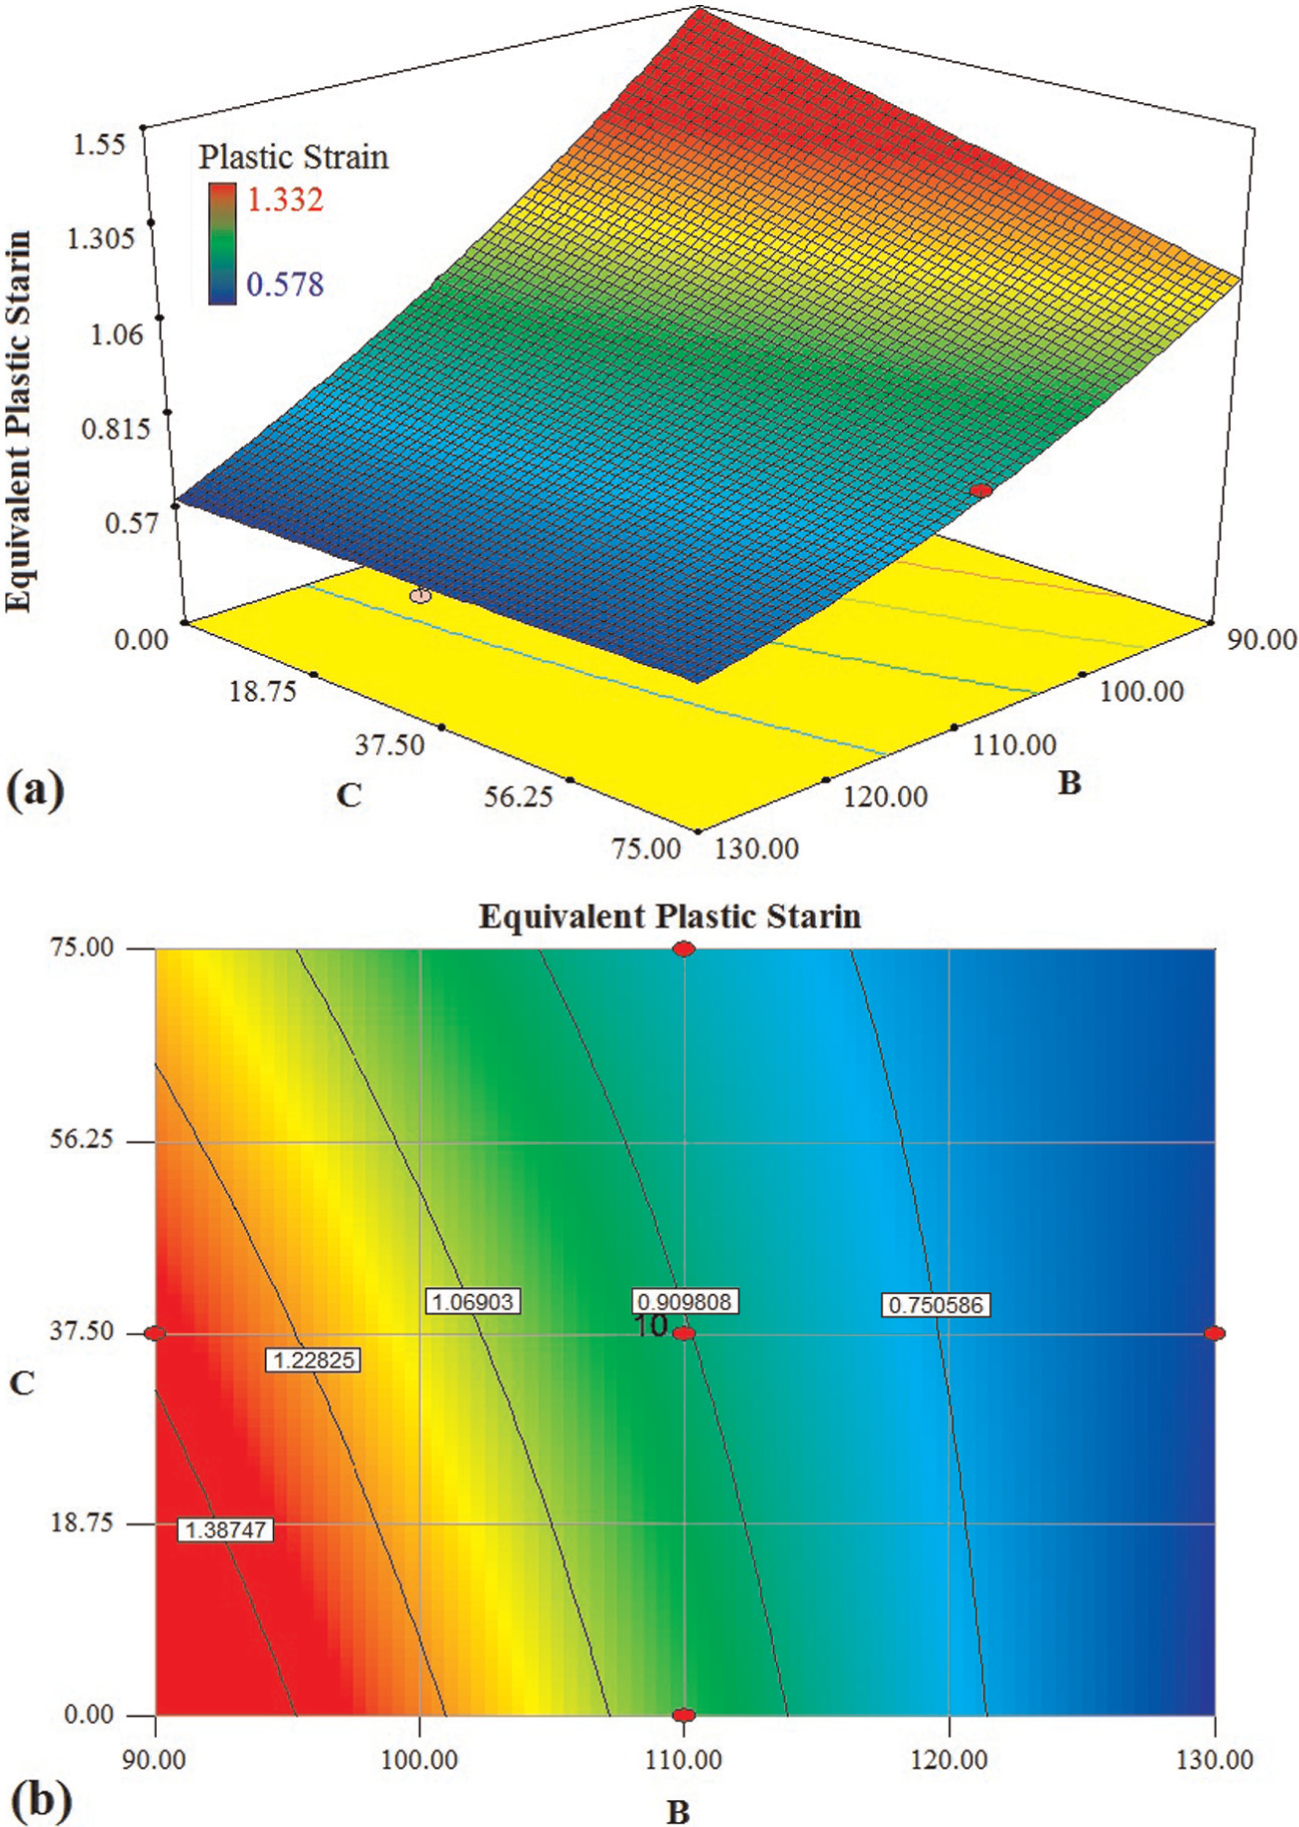
(a) Response surface and (b) contour plots of the equivalent plastic strain with B and C factors.
Optimization
The optimum values of the thickness ratio, die channel angle, die outer corner angle, fillet radius, friction coefficient between strip and rolls, and friction factor between strip and die were obtained using the data generated by the statistical analysis. Design-Expert searches for a combination of factors that simultaneously satisfy the constraints set for each of the response and factors. These conditions are stated in Table 5. The optimum values of the factors (in their specified ranges) led to the maximum value of PEEQ. These optimum values are listed in the last column of Table 5. In this condition, the predicted PEEQ (1.53) shows an improvement of about 14.86% as compared to the highest value of PEEQ (1.332). It is also worthwhile mentioning that the possibility of accomplishing the ECAR process must be considered in the selection of the optimum values of the parameters. For this purpose, finite element simulation of the ECAR process was performed using the optimum values of the parameters. Figure 8(a) shows the PEEQ curve obtained from this numerical simulation. Furthermore, Figure 8(b) illustrates the PEEQ distribution at the strip after the optimization. The accomplishment of the finite element simulation and the reasonable agreement between the predictions of the optimization procedure and the finite element simulation (∼4% relative error) prove the validity of the obtained optimum values. On the other hand, the values of the parameters, which lead to the maximum PEEQ in Figure 7 (1.55), are not acceptable. Because in this case, the finite element simulation of the ECAR process aborts due to the failure in feeding the strip into the ECAR die.
Optimization goal and constraints for all factors and the response.
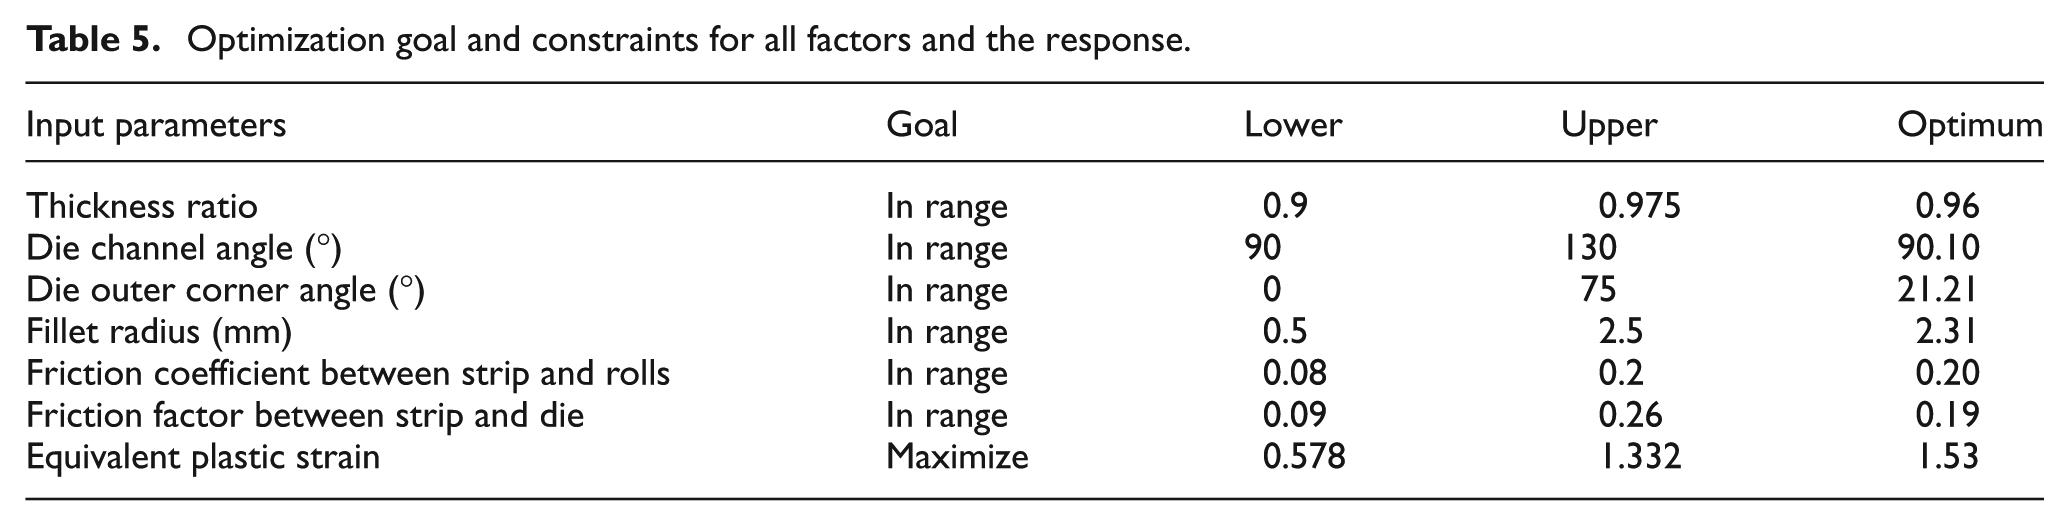
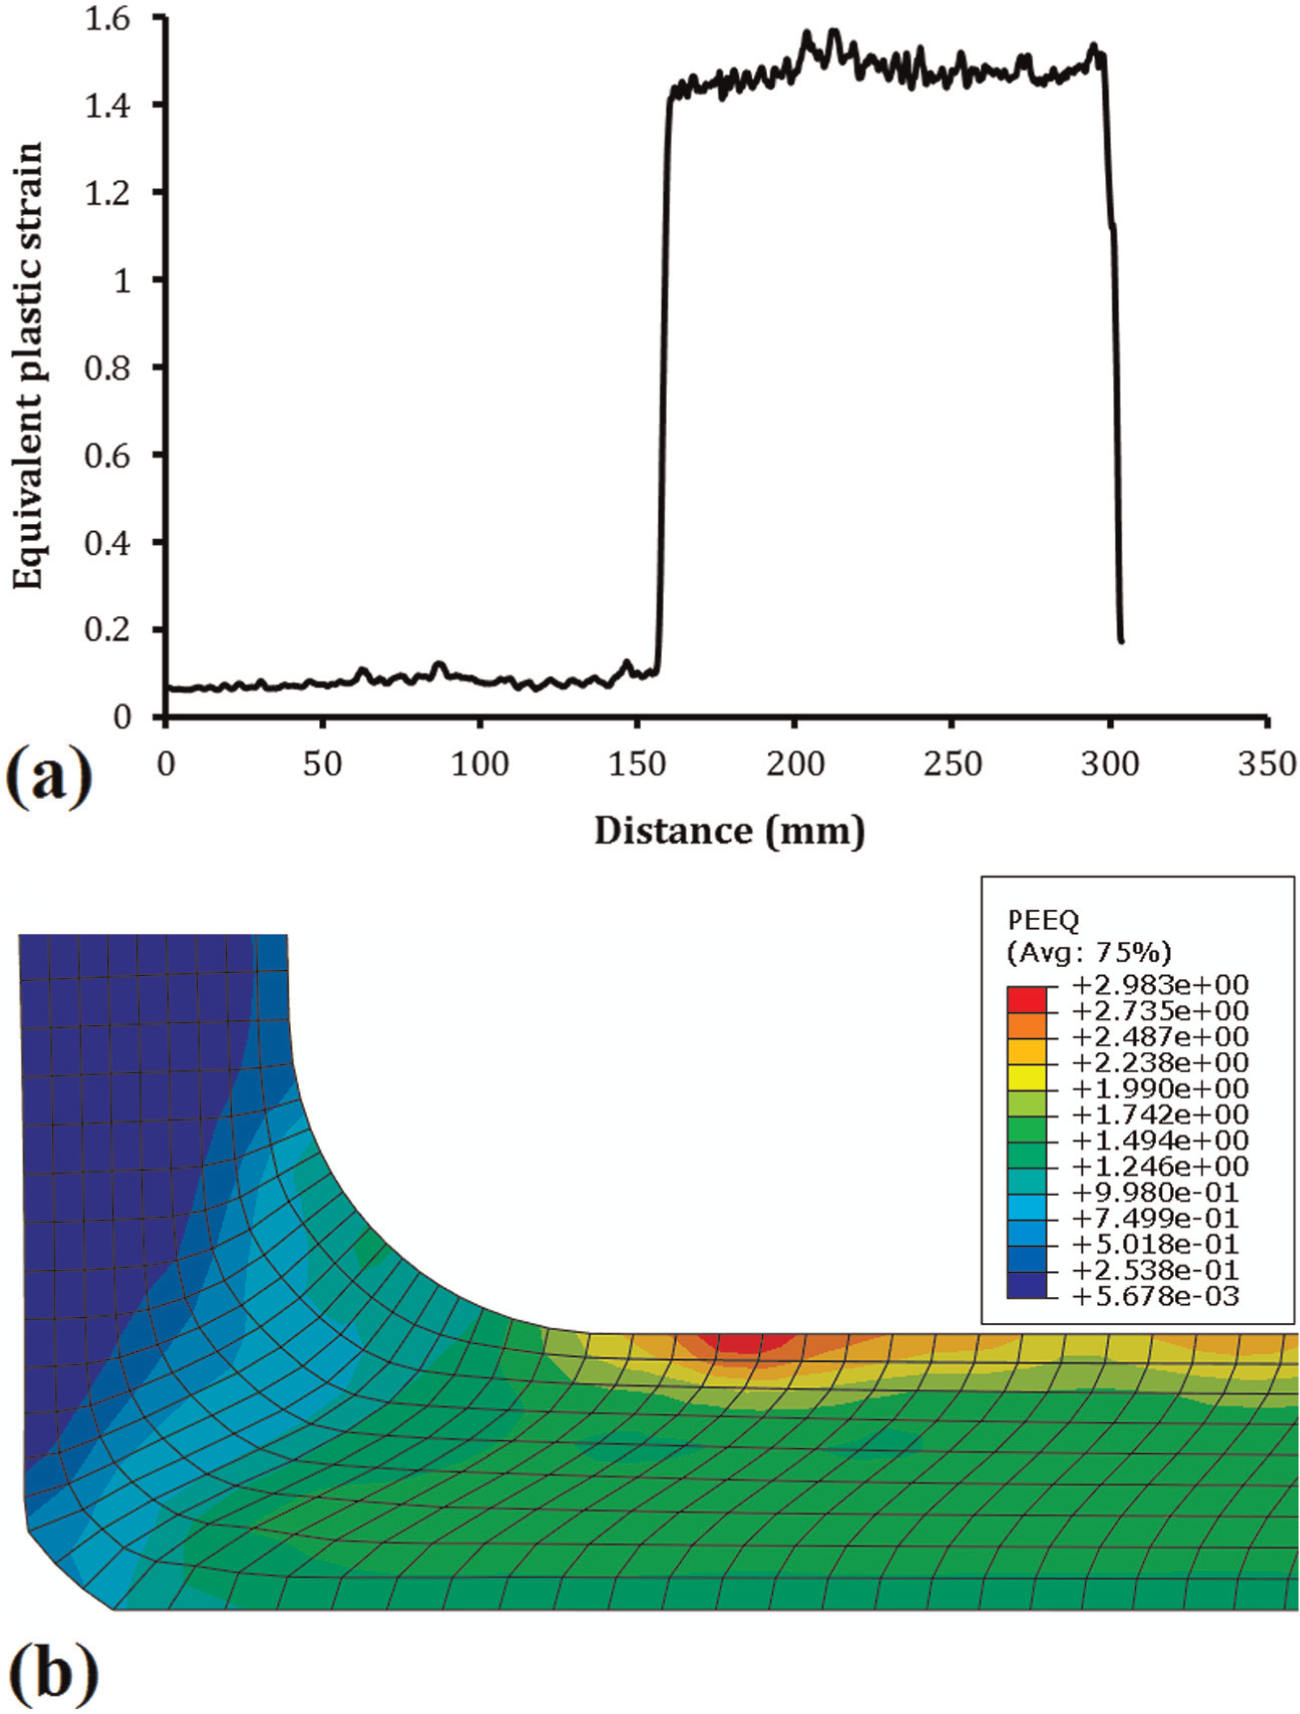
(a) PEEQ along the middle path of strip and (b) the distribution of the PEEQ after the optimization.
Conclusion
The numerical simulation of the ECAR process was conducted utilizing 2D finite element analysis. The RSM and the ANOVA were employed to study the effects of the ECAR parameters on the induced PEEQ. On the basis of this analysis, the following conclusions can be formulated:
A quadratic model is able to predict the PEEQ by considering the significant terms provided by ANOVA. This model can be used as an efficient tool to evaluate the PEEQ with high accuracy.
ANOVA showed that the thickness ratio, die channel angle, die outer corner angle, fillet radius, and friction factor between strip and die have significant effects on the PEEQ induced during the ECAR processes. Furthermore, the contour and surface plots of PEEQ show that the die channel angle and die outer corner angle have the most important influence on PEEQ (die channel angle is the most significant parameter).
Optimum values of ECAR parameters, which result in maximum PEEQ, were derived. The optimum values of the parameters are
Footnotes
Declaration of conflicting interests
The authors declare that there is no conflict of interest.
Funding
This research received no specific grant from any funding agency in the public, commercial, or not-for-profit sectors.