
Abstract
Design and manufacturing engineers are not fully aware of the different possibilities that PolyJet™ technology offers. The goal of this article is to provide the design and manufacturing engineers with greater knowledge about the final properties of parts printed with PolyJet rapid prototyping technology. This knowledge includes the effect of printing orientation and post-processing on the mechanical and surface properties of printed parts. Eighteen different samples considered all the possible printing orientations and the surface finishing treatments recommended by the manufacturer. These finishing properties include part printing using the matte/glossy option and removal of the support material using water pressure and/or a caustic soda bath. Tensile tests and surface roughness measurements were analysed for the printed samples using the statistical design of experiments in order to determinate the influence of the printing orientation and finishing properties on the results. These tests showed that the part orientation has a significant effect on elastic modulus and fracture stress while there is no statistical significance on ultimate tensile strength. With regard to the finish, none of the tensile test outputs showed significant differences. In terms of roughness, the analysis of variance indicated that position and finish presented statistically significant differences between the means of the three roughness directions. From all these experiences, it is possible to conclude that the glossy finish and the xy printing direction worked very well regarding roughness, whereas the critical load direction of the part should be placed along the x-axis when printing.
Introduction
Additive manufacturing (AM) is the process of creating a physical object based on its virtual representation by adding material layer by layer. 1 Its main advantage with respect to traditional manufacturing methods is that virtually any geometry can be built, offering almost unlimited and unconstrained geometric complexity. In essence, the statement ‘what you model is what you build’ rings true. 2 Although AM technologies offer this main benefit compared to traditional manufacturing methods, it is also true that manufacturing the parts with complicated internal structures is still a problem. 3 Despite this handicap, this free-form fabrication method has meant that AM technologies are becoming more and more popular among design and manufacturing engineers for building and then testing design prototypes (called rapid prototyping), for obtaining production tools (rapid tooling) – that is, moulds and dies – or even for building and then using that prototype as a final part in the final product (direct manufacturing). Current AM technologies not only present opportunities for design and manufacturing engineers but also challenge in the incoming years in order to improve the drawbacks that each AM process has associated with it.4,5 The number of AM technologies available for engineers differs in terms of resolution, accuracy, speed and materials for printing, although one single technology does not normally have all the best properties (i.e. speed effective printers give very rough surfaces, whereas high-resolution technologies are very slow). Depending on the raw material, these technologies are classified as follows: (1) liquid-based processes, for example, stereolithography apparatus (SLA) and PolyJet™; (2) solid-based processes, for example, fused deposition modelling (FDM) and (3) powder-based processes, that is, selective laser sintering (SLS) and three-dimensional (3D) inkjet printing. Although these technologies are becoming more common and widely accepted by engineers, they are not aware of the different possibilities or limitations that printing orientations have for the final piece because (1) they are more concerned about looking at the orientation that minimizes printing time and raw material or (2) the material datasheets provided by suppliers do not provide enough information regarding how printed parts will behave in the real world.
Within the literature and since the early years of AM, many research projects have tried to fix these abovementioned issues by studying the effect of strength, accuracy and roughness depending on the printing orientation, layer thickness and material for printing. These studies are focused on one single technology or are meeting broader goals by trying to compare different technologies among themselves using both conventional and statistical analyses: FDM, 6 SLS,7–10 3D printing11,12 and SLA.13,14
In terms of the PolyJet technology, there are still very few research projects oriented towards the users of PolyJet printers. PolyJet technology (Stratasys Ltd, Minneapolis, MN, USA and Rehovot, Israel), represented by the Eden and Connex families, uses several heads to accurately deposit acrylic-based photopolymer droplets. These heads are placed on a jetting head that slides back and forth along the x-axis, jetting tiny droplets of ultraviolet (UV) curable resin onto the build tray. Depending on the size of the object, the jetting head also moves along the y-axis until the layer is completed. After building each layer, UV bulbs alongside the jetting head harden the layer, and the tray moves down in the z direction a certain distance so the next layer can be printed. Half of the heads are dedicated to the gel-like photopolymer ‘support material’, and the remaining heads are for the ‘model material’. Kim and Oh 15 studied various parameters, including dimensional accuracy, roughness and strength, using the Eden 500 printer but without studying the effect of the post-processing in depth. Udroiu and Mihail 16 carried out some experiments with several square samples in order to study the effect of printing direction on the surface finish, but no statistical analysis was performed. Vieira et al. 17 studied the mechanical and optical properties of PolyJet printing material depending on the post-cure treatment, whereas Brajlih et al. 18 created a computer method for the process of optimizing the scale factor values used in PolyJet’s rapid prototyping procedures. The most recent study was carried out by Barclift and Williams 19 who analysed the effect of build orientation and the distance between specimens in elastic modulus and tensile strength using a full factorial design. All these studies did not provide all possible information for a PolyJet technology user: some did not study all possible orientations, others did not take into account the post-process treatments, while very few analysed which variables are statistically significant for both roughness and strength properties.
The aim of this article is to provide engineers with greater knowledge about the surface roughness and strength properties of parts printed with PolyJet technology by studying the influence of all possible part orientations when printing and the post-process treatments on printed parts by means of a statistical design of experiment (DOE) approach.
Methods
Two different tests were performed in order to research the properties of printed parts: tensile tests and surface roughness tests. A tensile test is the most fundamental type of mechanical test where a testing sample is subjected to uniaxial tension until failure. The results from the test are widely used to gain a better understanding of different materials and to select the proper material for a particular application. Surface roughness quantifies the vertical deviations of a manufactured surface from its ideal form and its value determinates how a real object will behave with its environment, that is, wear by friction. These two tests in combination with a statistical DOE approach were used to determinate whether specific build orientation parameters and post-process treatment had an effect on the mechanical strength and surface quality of PolyJet printed parts.
Specimens
The specimens for both tests were modelled in accordance with BS EN ISO 527-2:1996 as shown in Figure 1 using CREO 1.0 CAD software from PTC (PTC Corporate Headquarters, Needham, MA, USA). The specimen was then exported in the stereolithography (STL) file format and printed using the PolyJet technology. Two different photopolymer materials were used for printing: ‘model material’ and ‘support material’. These materials together allow complicated geometries to be built. The printer used for this research project was the Objet Eden 330, which has a print resolution of 42, 84 and 16 µm in the x-, y- and z-axes, respectively. The ‘model material’ used was the general purpose Fullcure 720, the most common material provided by the printer manufacturer to the final printer users, and the ‘support material’ was Fullcure 705.
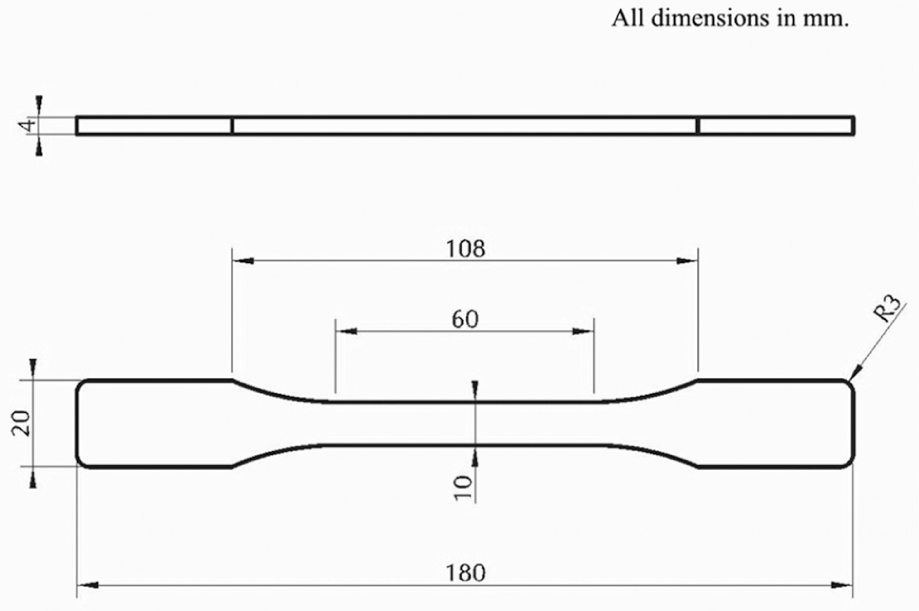
Specimen dimensions in millimetres for tensile testing.
Test specimens were produced at a nominal thickness of 4 mm and they were printed taking into consideration the only two parameters that a regular user of the PolyJet technology can modify: position and finish. For position, the specimens were printed with the major dimension parallel with six different orientations (xy, xz, yz, yz, zx and zy, where the first letter denotes the specimen’s main axis and the second letter is the minor axis). For the finishing process, three different options were available: (1) printed in glossy, where the upper and vertical surfaces of the specimen are free of support material after printing (G); (2) printed in matte where the upper and vertical surfaces have support material that is later removed in post-processing either via water pressure (WP) and (3) printed in matte with support material removed via water pressure plus caustic soda bath (WP + CS), depending on manufacturer’s recommendation. The remaining parameter configurations, that is, head movement speed and material injection rate, were not considered because a regular user cannot change them with the software provided by the manufacturer and as a consequence, they are set at the manufacturer’s default. A total of 18 specimens were obtained in a single tray. All specimens were conditioned for 30 days at 20 °C (±1 °C) and 60% (±5%) relative humidity prior to testing. For DOE, these 18 specimens were divided and numbered according to the two main factors: six levels for position and three levels for finish (Table 1 and Figure 2).
The 18 specimens depending on the printing orientation and surface finishing for DOE: six levels for position and three for finish.
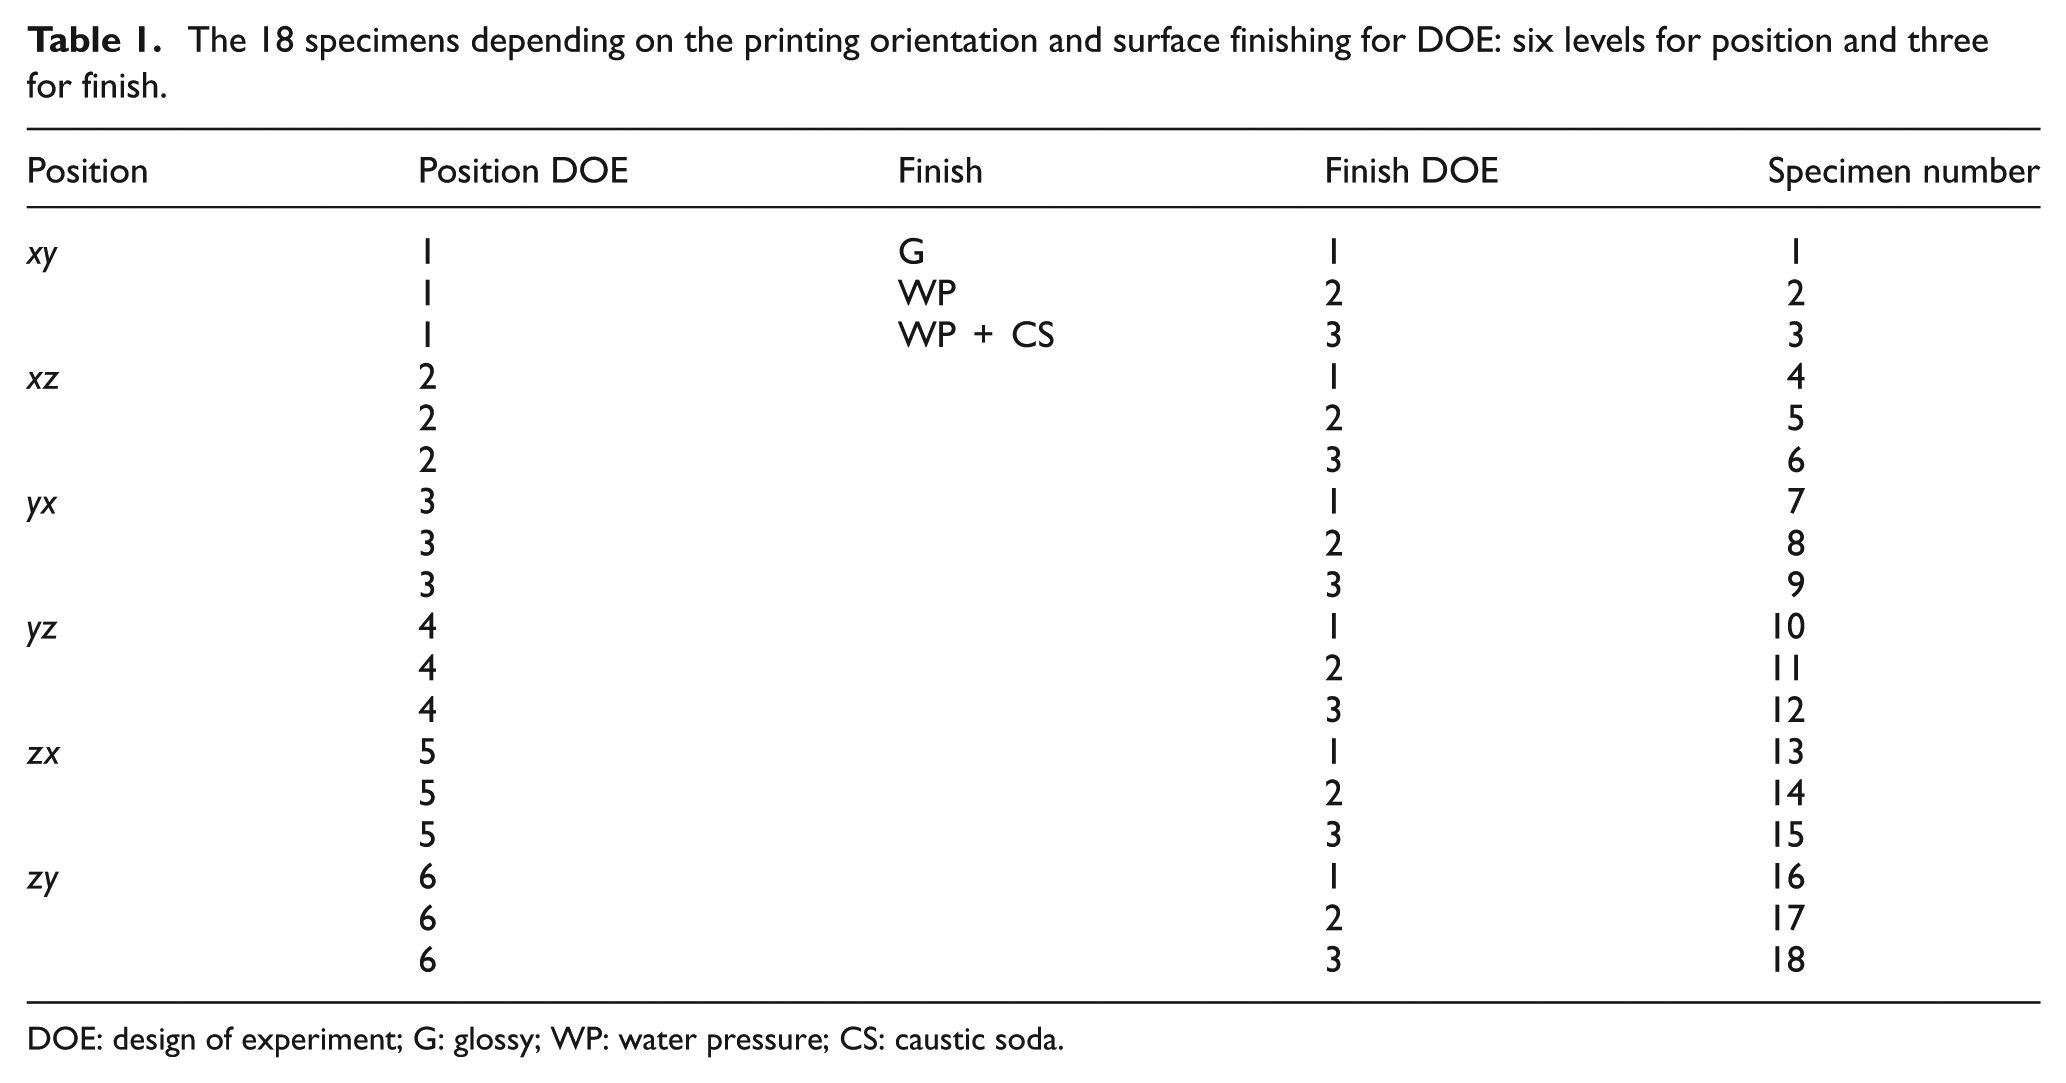
DOE: design of experiment; G: glossy; WP: water pressure; CS: caustic soda.
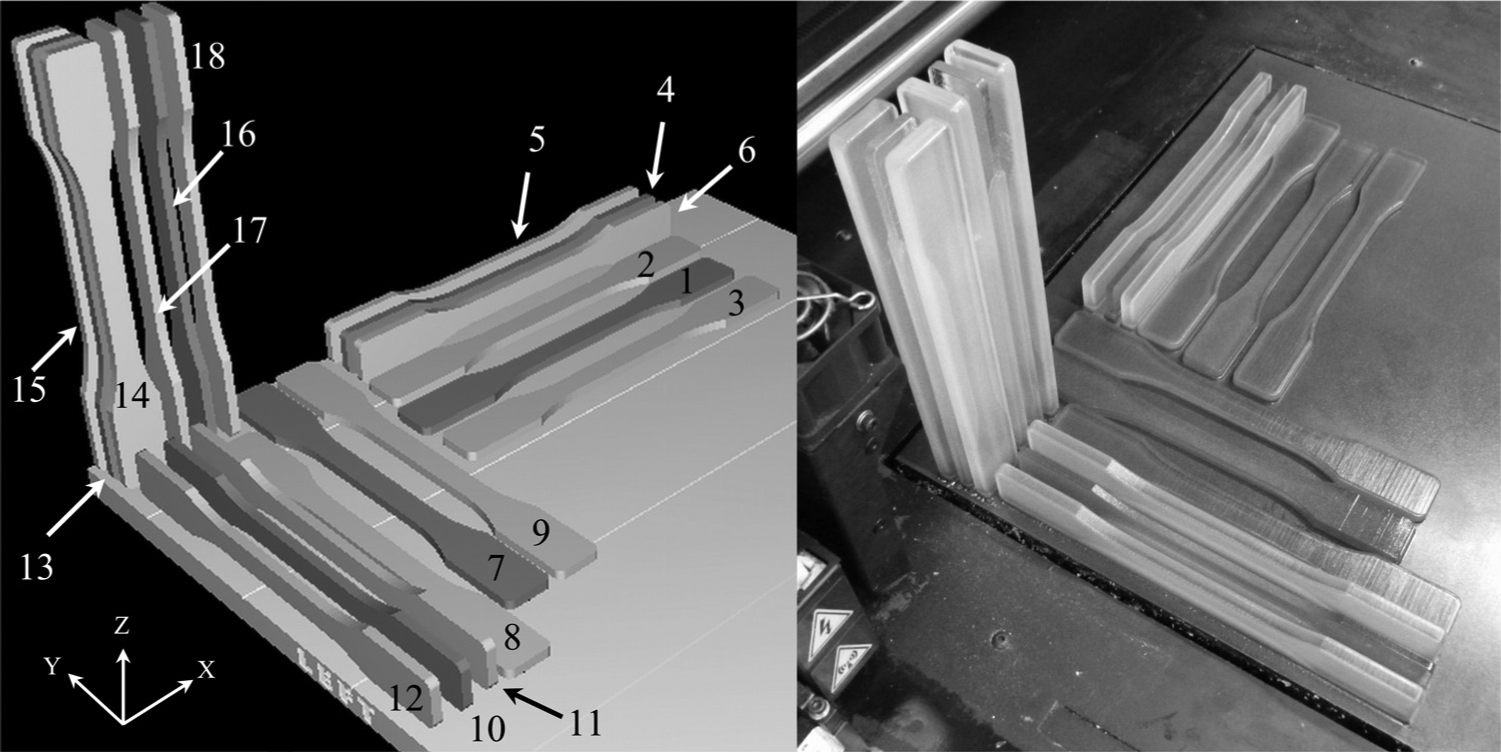
Positioning of the 18 specimens on the printing tray: printing software (left) versus Eden 330 tray (right).
Tensile testing
Tensile tests were performed on the specimens using an Instron model 4467 (Instron Worldwide, Norwood, MA, USA) tensile test machine that has a 30-kN load cell and is fitted with a long travel (50 mm) contact extensometer. Each sample was subjected to a cross-head speed of 1 mm/min until failure of the specimen. The primary goal of the tensile testing was to generate force–extension data. To this end, a support computer running LabVIEW software (National Instruments, Newbury, UK) and connected to the tensile machine was used to visualize and record the force–extension curves of each of the specimens. From each one of the curves obtained, four mechanical parameters were calculated: the elastic modulus, the ultimate tensile strength (UTS), the elongation at break and the fracture stress. Young’s modulus for each specimen was calculated by considering the stress values at the strains of 0.005 and 0.02. The load–displacement outputs from the tensile test machine were normalized to stress–strain data. For this study, the true stress was used by considering the area of the specimen at any instant during the tests. The stress was calculated as

where F is the force required and A is the area at any instant. True stress was related to the engineering stress assuming that the testing materials were incompressible, and that the volume did not change during the tests. Hence
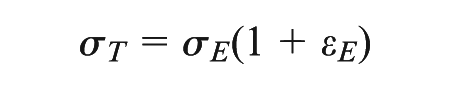
where σE is the engineering stress defined as the ratio of the applied load to the undeformed cross-sectional area of the specimen and εE is the engineering strain defined as the ratio between the elongation of the specimen and its initial length.
The true strain was calculated as
where L is the length of the specimen at any time and Lo is its initial length. Similarly, the true strain can be related to the engineering strain as

Surface roughness testing
Roughness tests on the specimens were performed on the Mitutoyo SJ 301 (Mitutoyo Corporation, Kanawaga, Japan) portable roughness machine featuring a measuring range of 0.25 mm, a returning speed of 1 mm/s and a contact force of 0.75 N. Before taking any measurements, the machine itself had to be calibrated with the help of a rectangular plate with a known roughness of 3.05 µm. In this calibration, the plate was set on a planar surface and in contact with the head of the roughness machine. The head was then moved across the plate’s surface and after a few seconds the machine set internal parameters to adjust itself to the plate roughness.
There were eight measurements for each specimen, four tests for each of the two printed directions. For this process, instead of placing the calibration plate on a planar surface, the selected specimen was placed on it, with the opposite surface in contact with the machine head. The results obtained from the machine were the mean roughness (Ra) and the maximum difference between the upper and lower peak of the roughness curve (Ry).
Results
Tensile testing
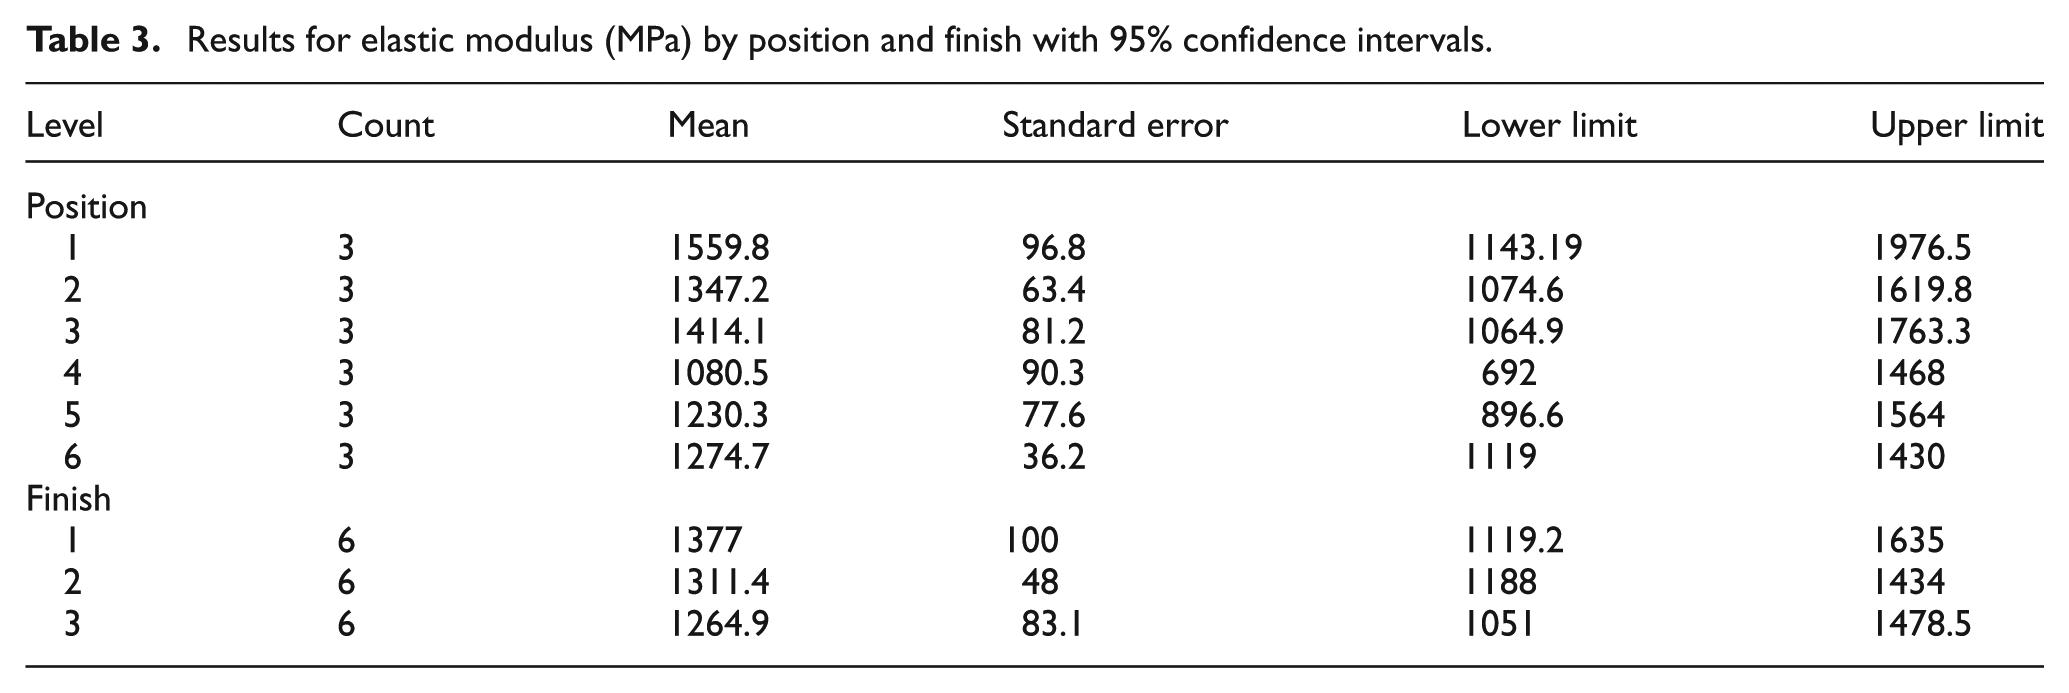
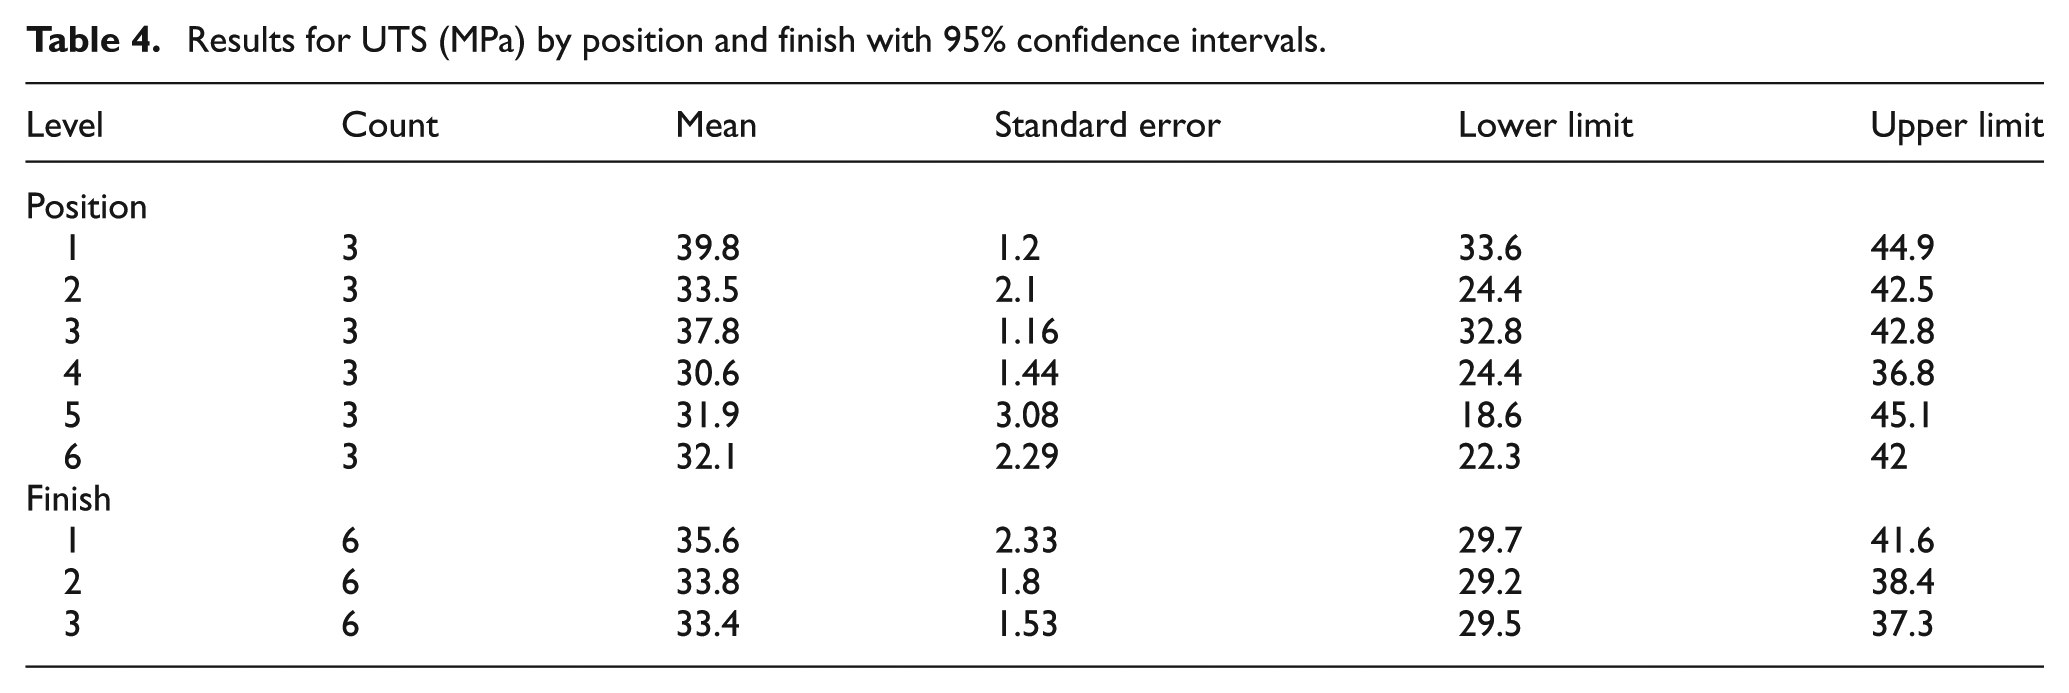
The results of the experiments are shown in Table 2, along with the basic statistical data. Elastic modulus, UTS and fracture stress were normally distributed according to the Anderson–Darling test with significance values of 0.82, 0.75 and 0.53, respectively. Tables 3–5 present the experimental results for the two factors by elastic modulus, UTS and fracture stress, including the standard error and 95% confidence intervals.
Tensile testing result for the 18 specimens depending on the printing orientation and the surface finish.
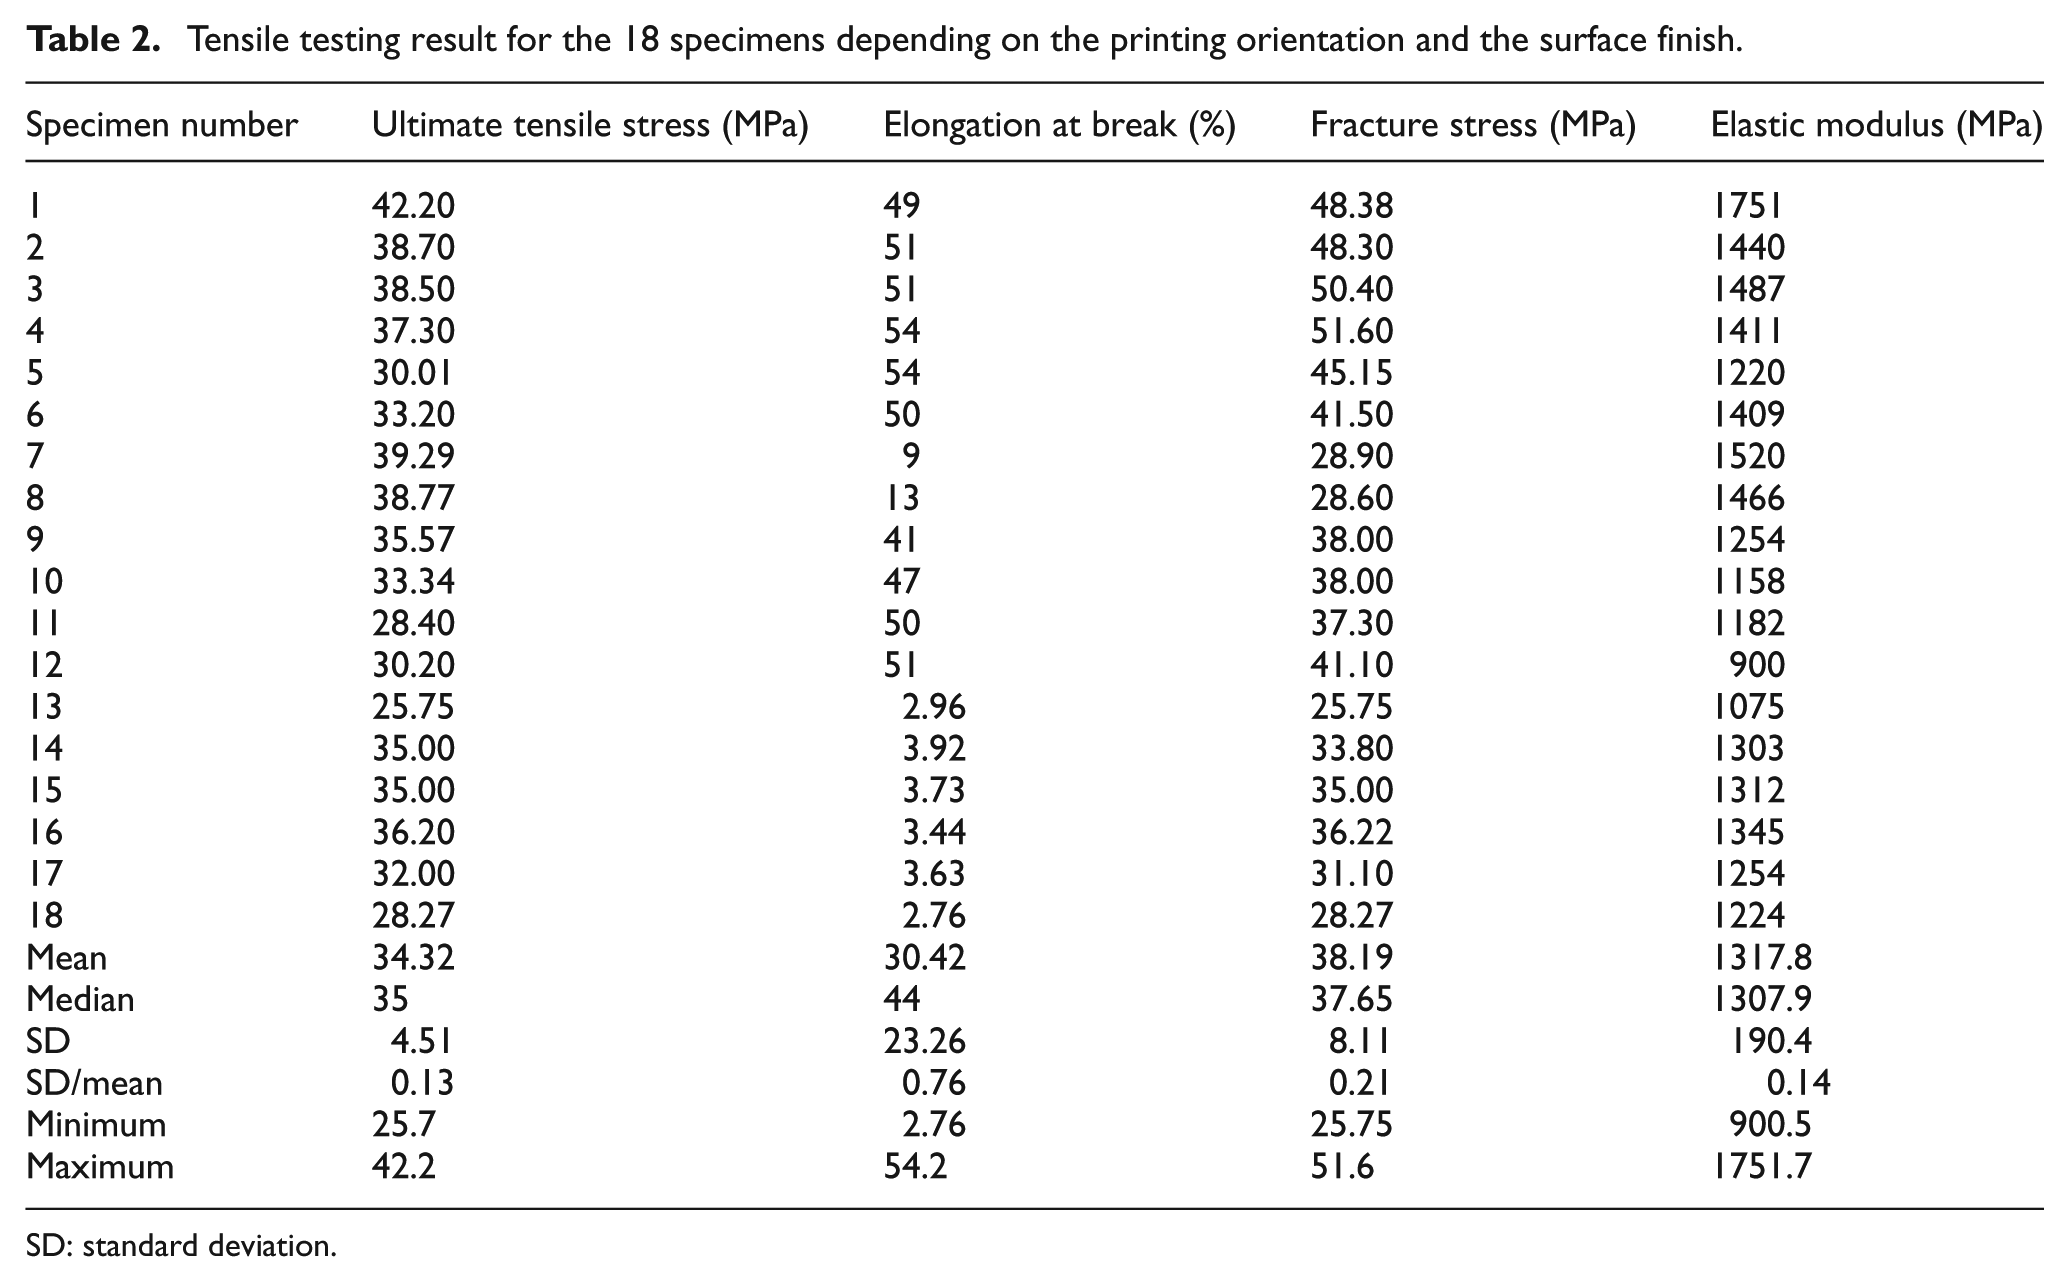
SD: standard deviation.
Results for elastic modulus (MPa) by position and finish with 95% confidence intervals.
Results for UTS (MPa) by position and finish with 95% confidence intervals.
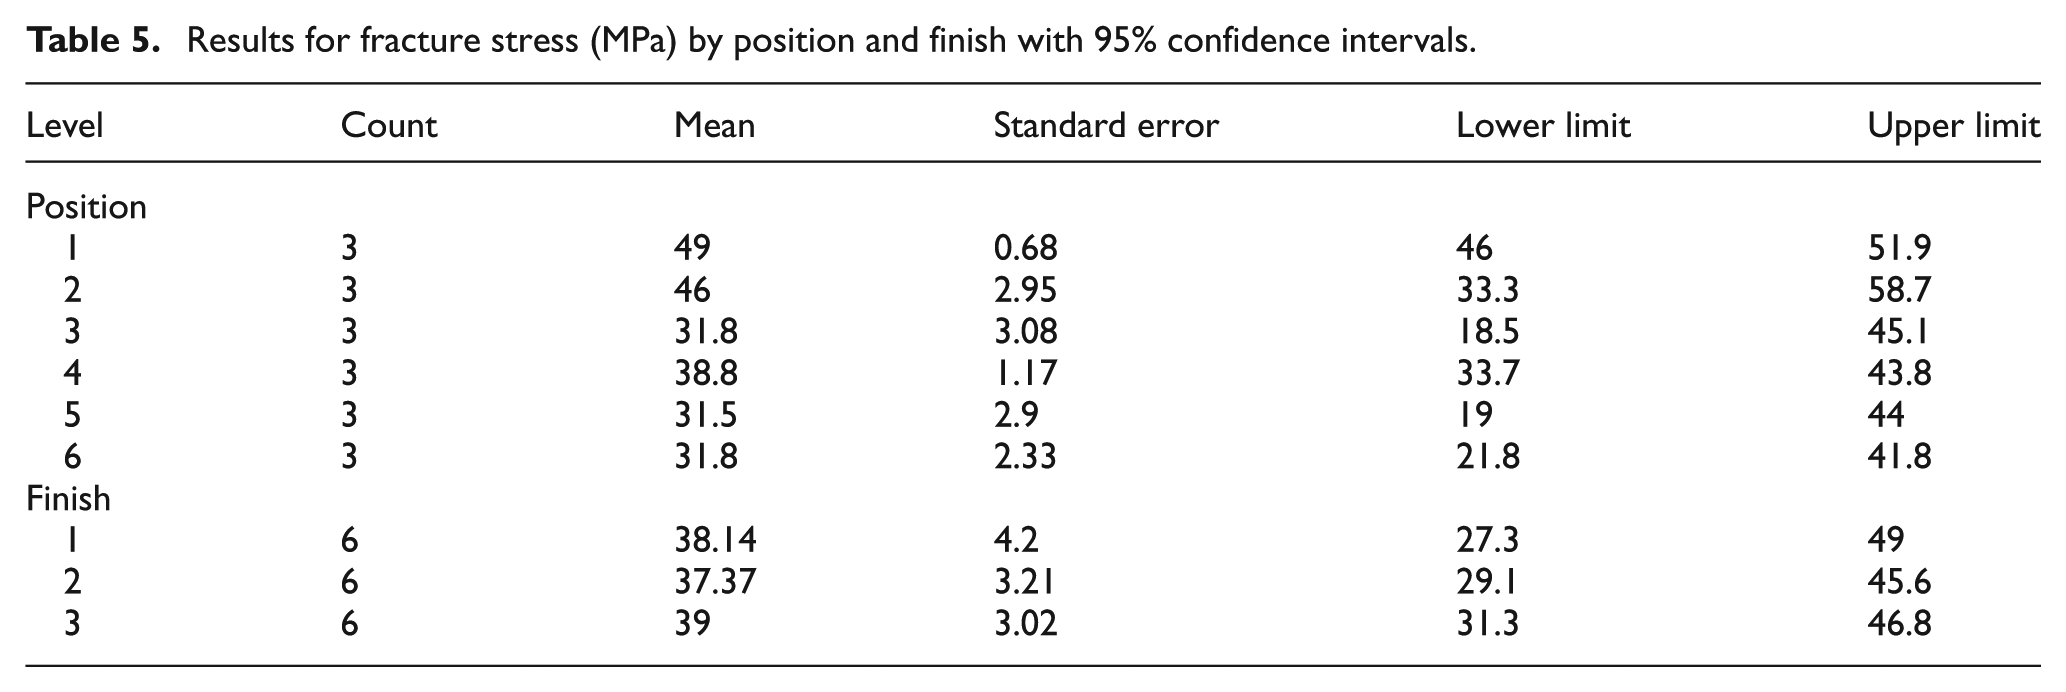
Results for fracture stress (MPa) by position and finish with 95% confidence intervals.
These results are graphically plotted in Figures 3–9. The 95% confidence interval test of elongation at break was not performed because the data from the experiments did not follow a normal distribution after the Anderson–Darling test (p < 0.005).
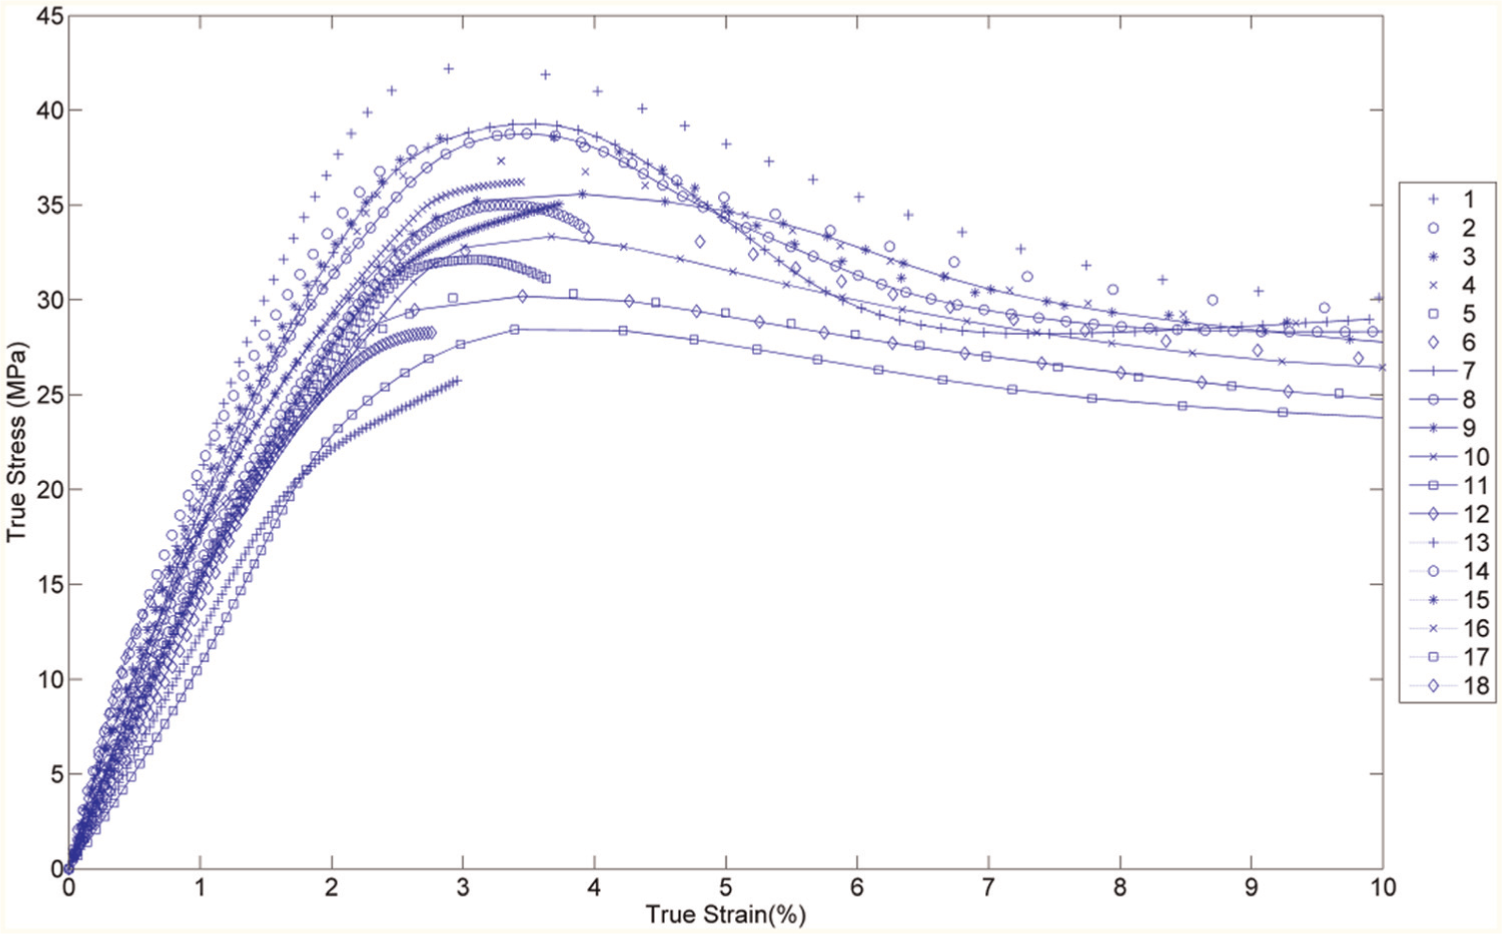
Stress–strain curves for the 18 specimens for the first 10% elongation.
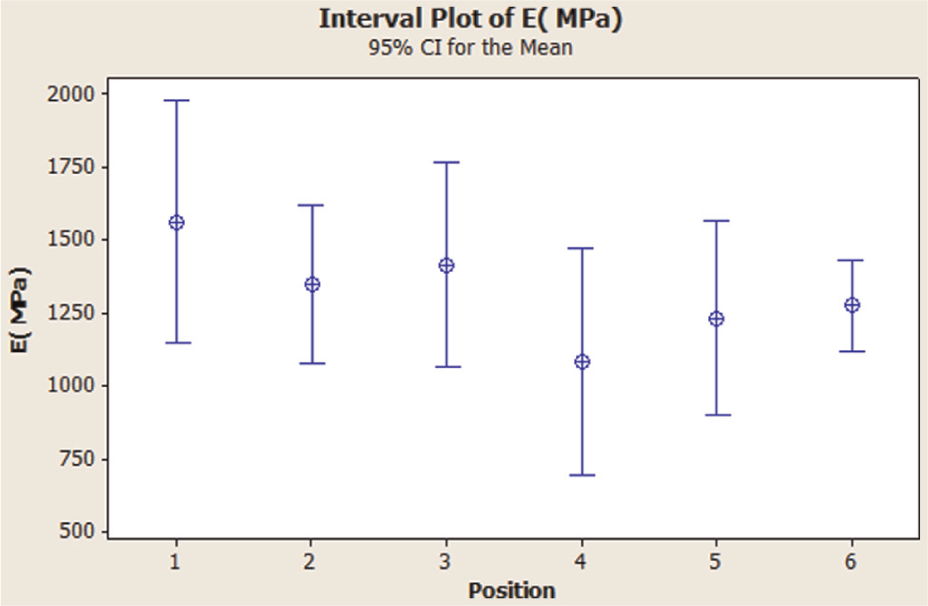
Means and 95% CI for elastic modulus by position.
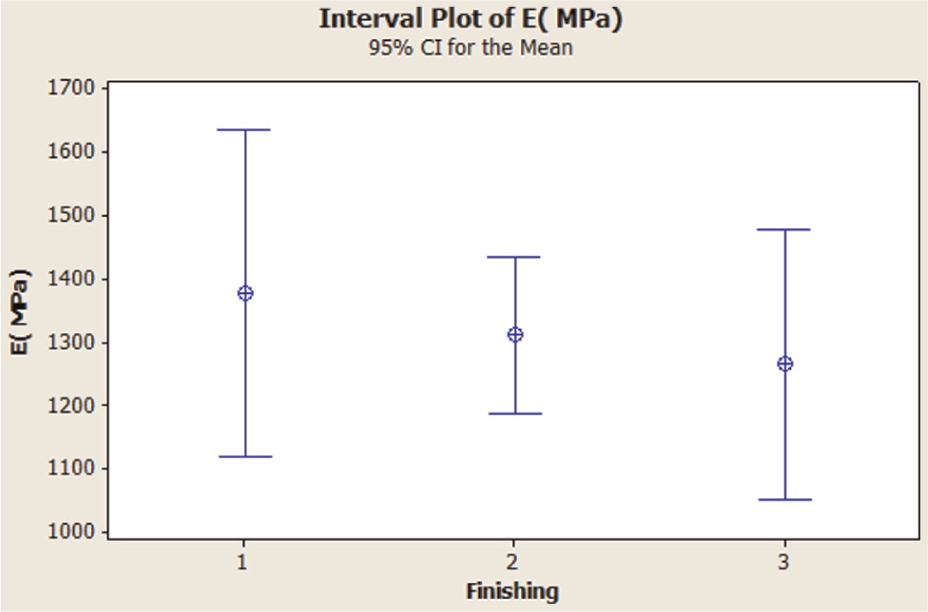
Means and 95% CI for elastic modulus by finish.
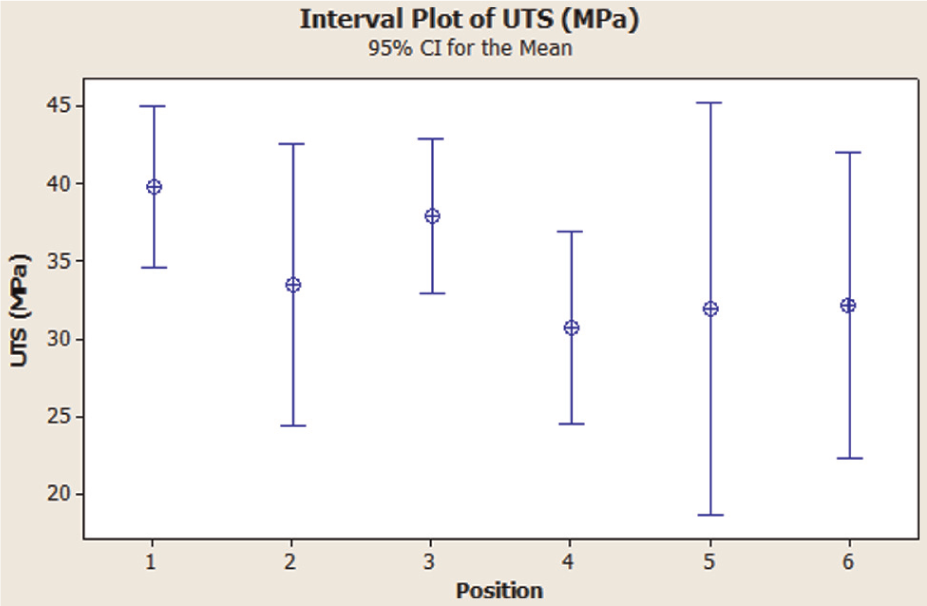
Means and 95% CI for UTS by position.
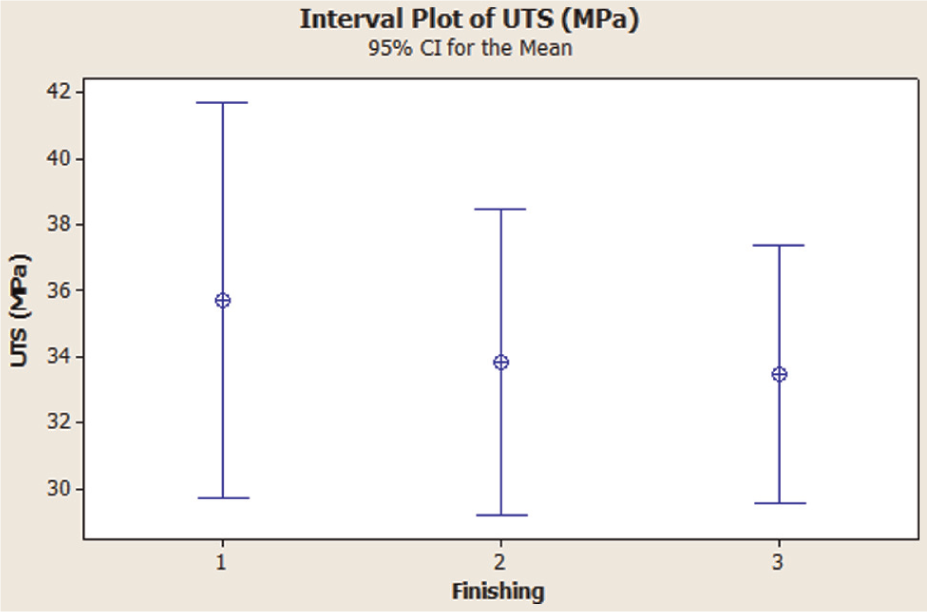
Means and 95% CI for UTS by finish.
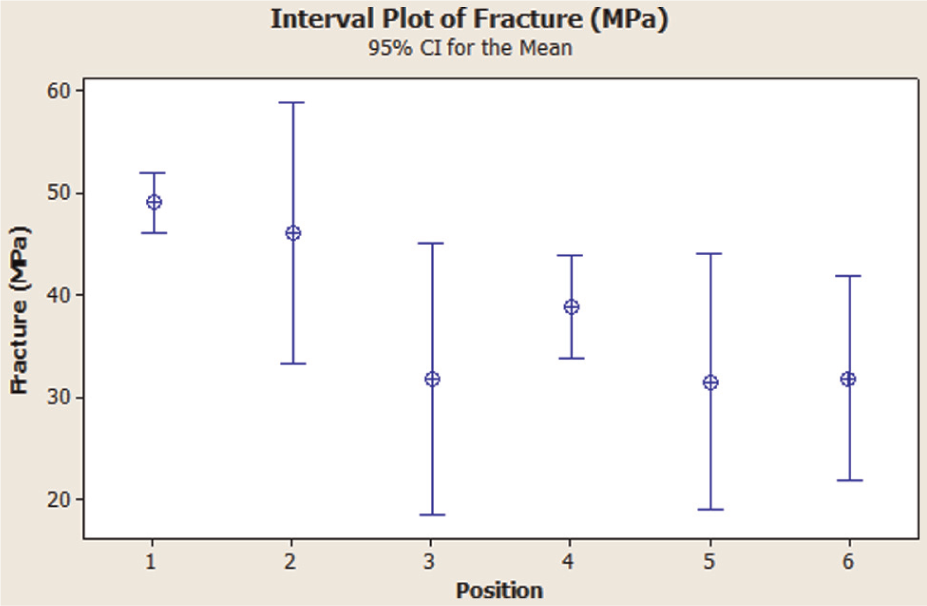
Means and 95% CI for fracture stress by position.
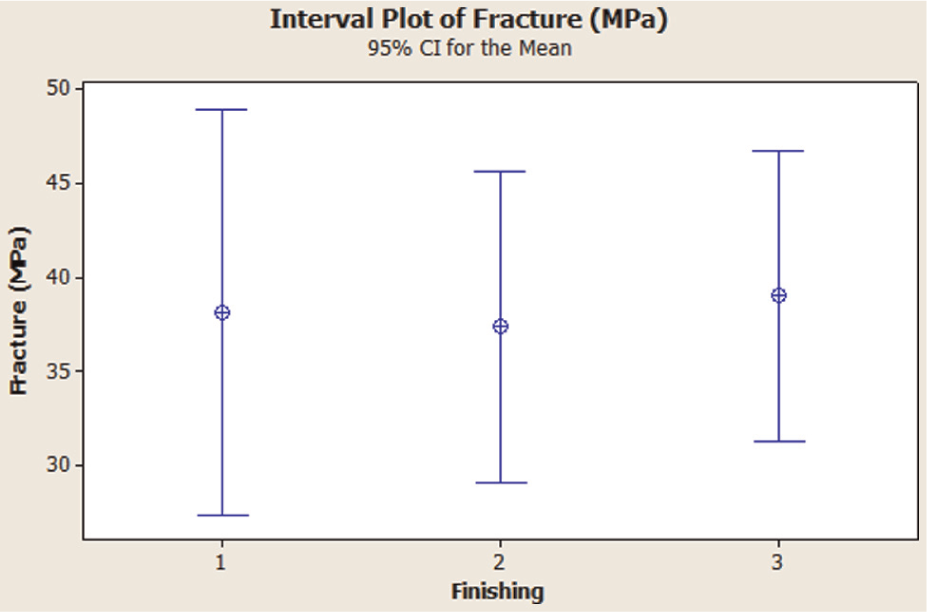
Means and 95% CI for fracture stress by finish.
With regard to Young’s modulus, taking into account only the surface finish, it seems that in general, the matte finish involves specimens with the lowest modulus, although they were very close to those of the CS bath. As for the printing direction, the results indicate that the specimens that have x as the major axis have more resistance to deformation than those printed in the y or z direction. With respect to the UTS, glossy specimens seem to present higher resistance, independently of the position, while having x as the major axis presents higher values, similar to the behaviour with elastic modulus. Regarding elongation at break, we can clearly see that the ductility of the z specimens is almost non-existent: they broke without any warning at around 5%. In contrast, the toughness values of the x and y specimens were much higher: their elongation at break was definitely higher and more energy was needed before fracturing. Finally, the fracture stress values of the x specimens had the highest values while those grouped by finish presented very similar values.
A two-way between-group analysis of variance (ANOVA) was conducted to explore the influence of the two main factors on the results with six levels for position and three levels for finish at a confidence level of 95%. ANOVA assumptions were met for elastic modulus, UTS and fracture stress: the data were normally distributed and the groups presented equal variances according to Bartlett’s and Levene’s tests of equality at a 95% level of confidence (Table 6). 20 As there was only one observation for each level combination (nij = 1), there were not enough degrees of freedom to investigate and test interaction effects, so it was assumed that there was no interaction between the independent variables.
Results for Levene’s and Bartlett’s test for homogeneity of variance: strength properties by factor.
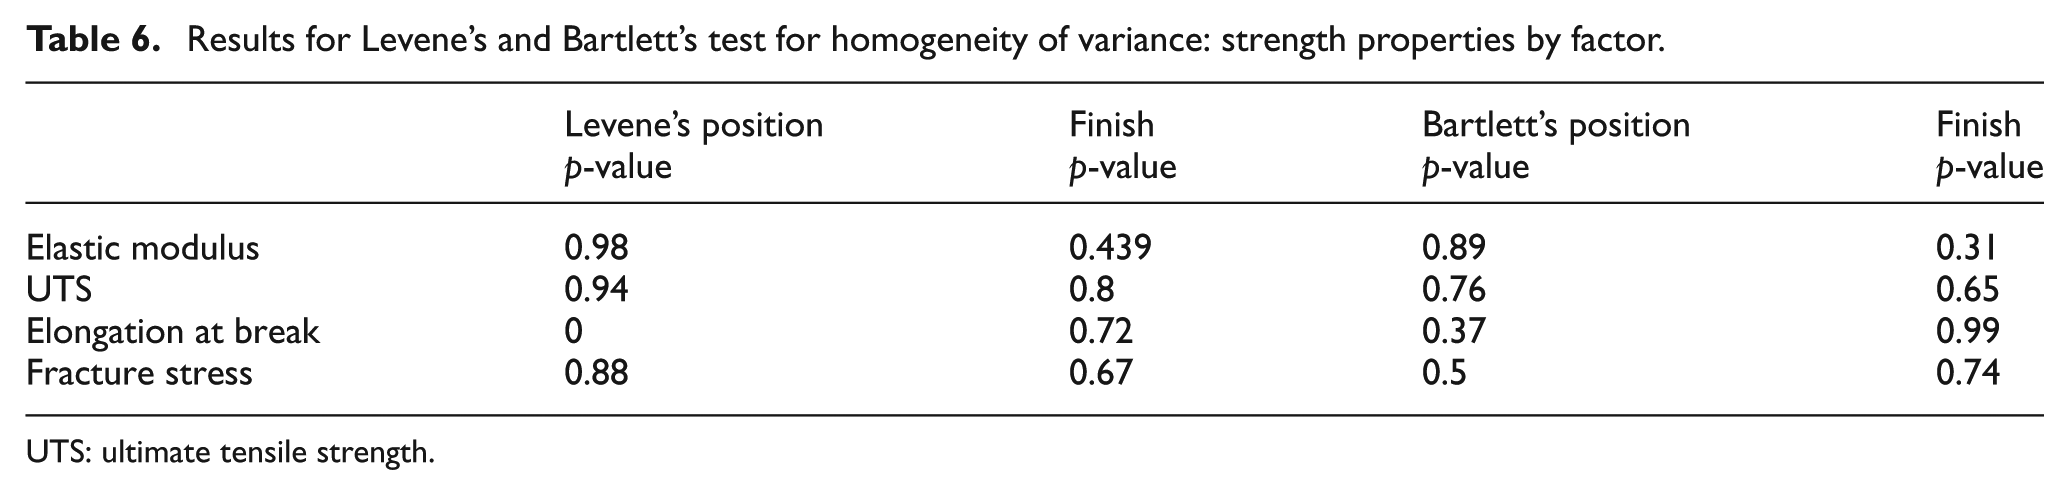
UTS: ultimate tensile strength.
For elongation at break, the data from the experiments were not adequate for the ANOVA model because they did not approximate a normal distribution and they did not present the same variance for position according to Bartlett’s and Levene’s tests of equality at 95% level of confidence. Nevertheless, the ANOVA was calculated, but the results should be taken with caution. Tables 7–10 show the ANOVA results.
Analysis of variance for elastic modulus.
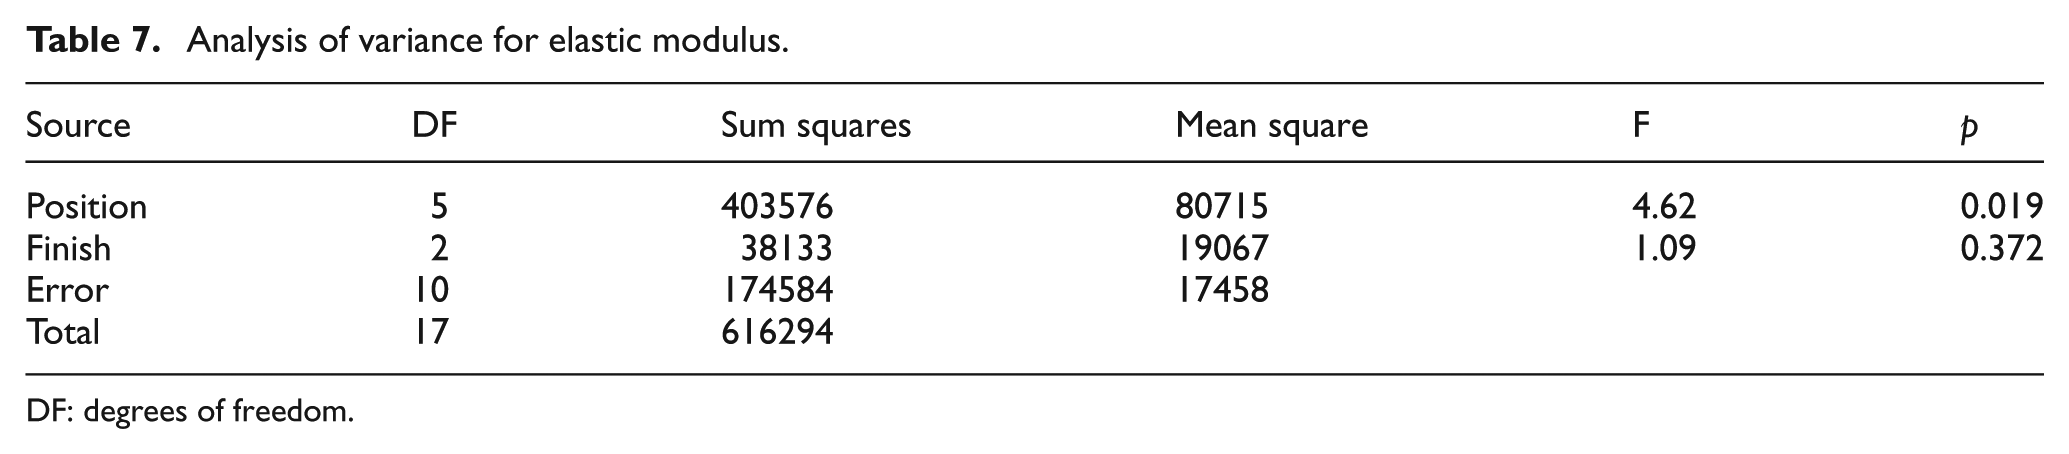
DF: degrees of freedom.
Analysis of variance for UTS.
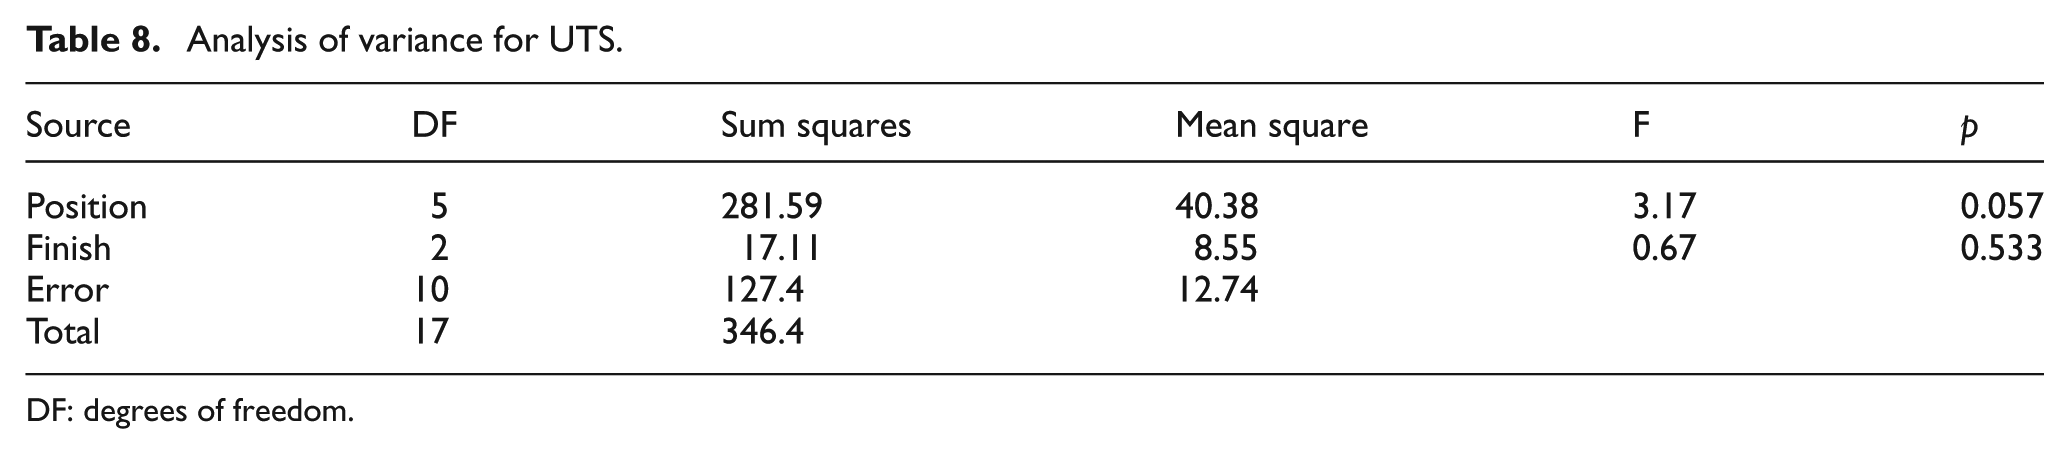
DF: degrees of freedom.
Analysis of variance for fracture stress.
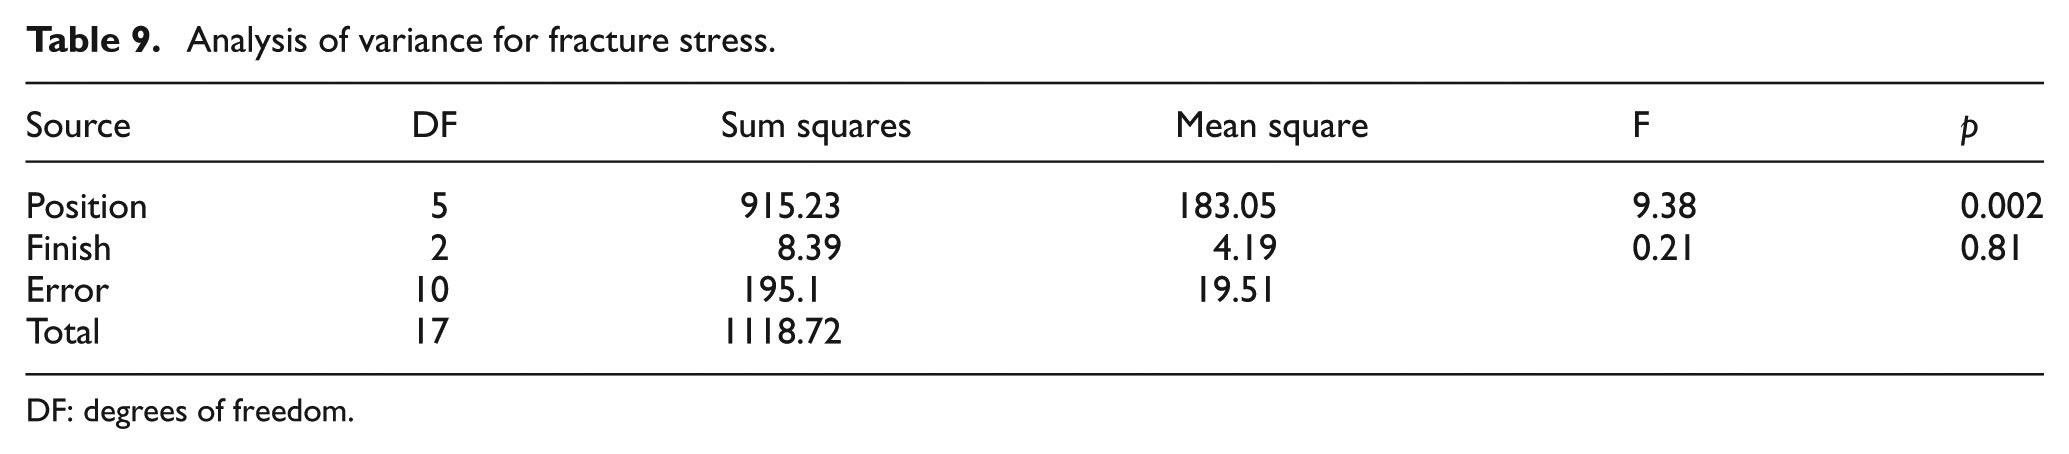
DF: degrees of freedom.
Analysis of variance for elongation at break.
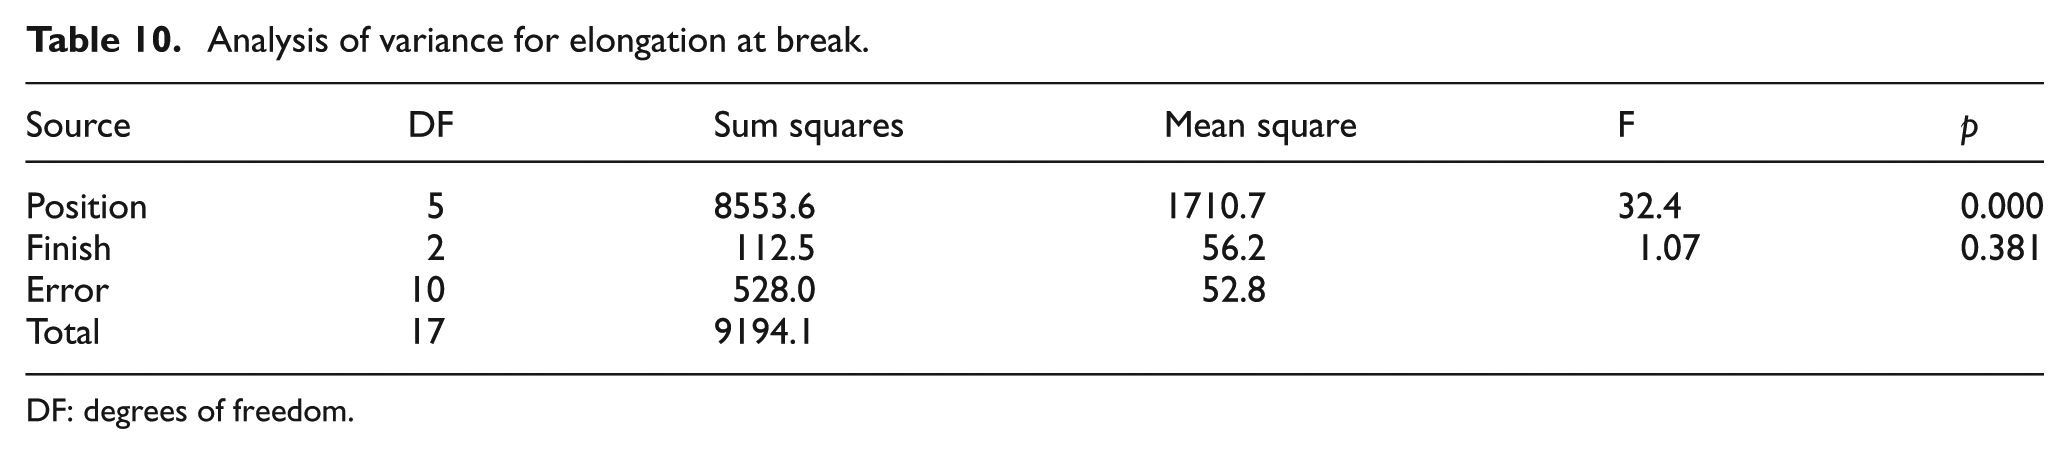
DF: degrees of freedom.
For tensile outputs and position, there are statistically significant differences between the mean values of elastic modulus (p = 0.019) and the mean values of fracture stresses (p = 0.002), while there is a slightly statistically significant difference for UTS in position (p = 0.057). As for finish, none of the tensile test outputs shows significant differences. For elongation at break, it seemed that position had a strong influence on the results (p = 0.0). Post hoc comparisons of elastic modulus by position using Tukey’s honestly significant difference (HSD) test indicated that the xy orientation was significantly different from the zx orientation. The other orientations did not differ significantly from either of the other levels.
Surface roughness testing
The results are shown in Table 11. Table 12 presents the experimental results for the three factors by the mean roughness measured on the three axes.
Mean roughness results for the 18 specimens depending on the printing orientation and the surface finishing.
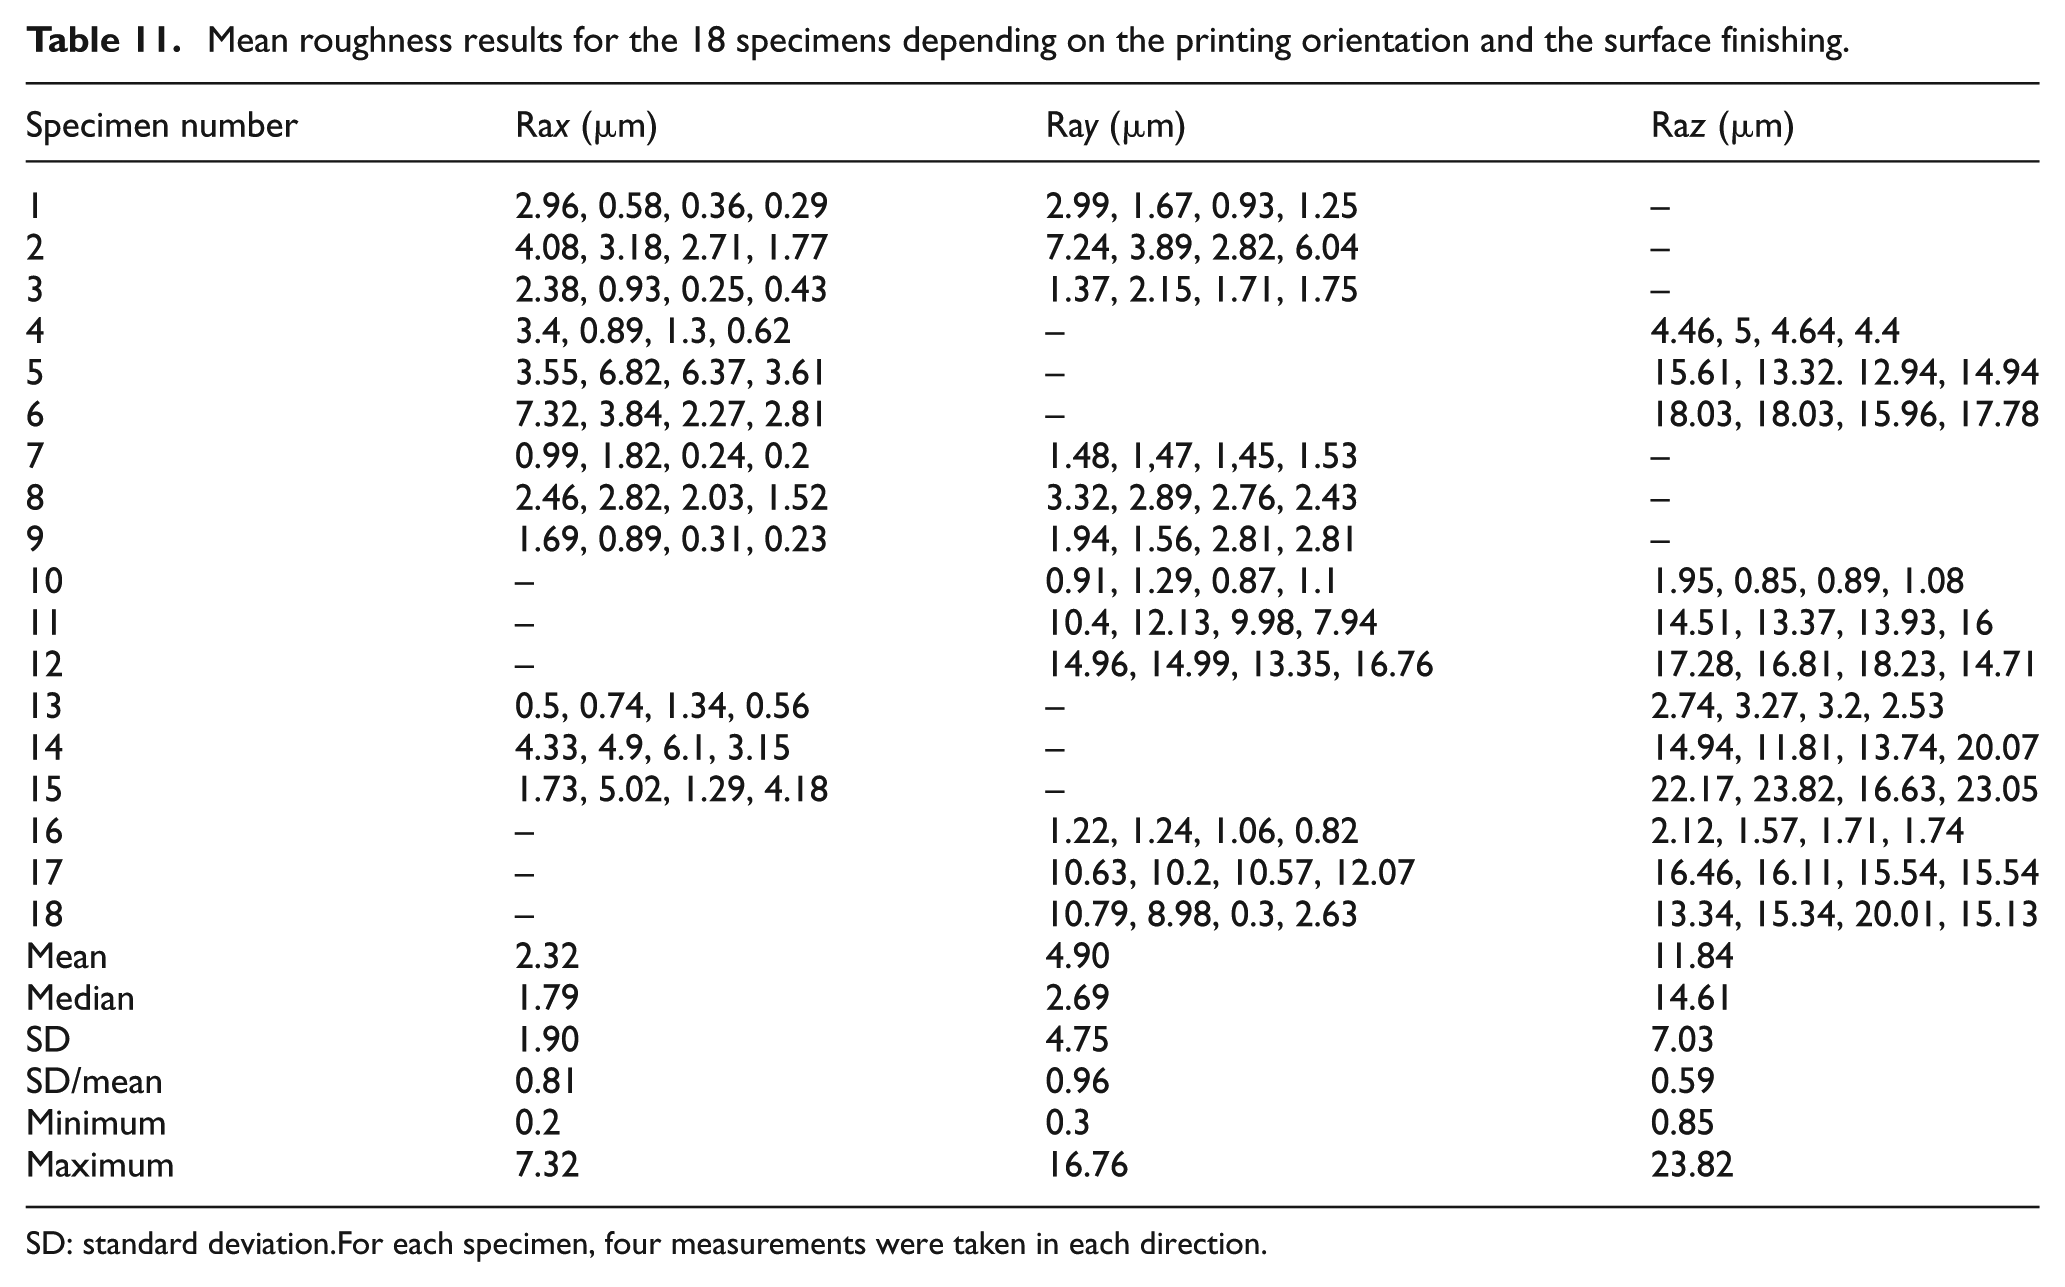
SD: standard deviation. For each specimen, four measurements were taken in each direction.
Results for Ra (µm) for the three main axes by position and finish.
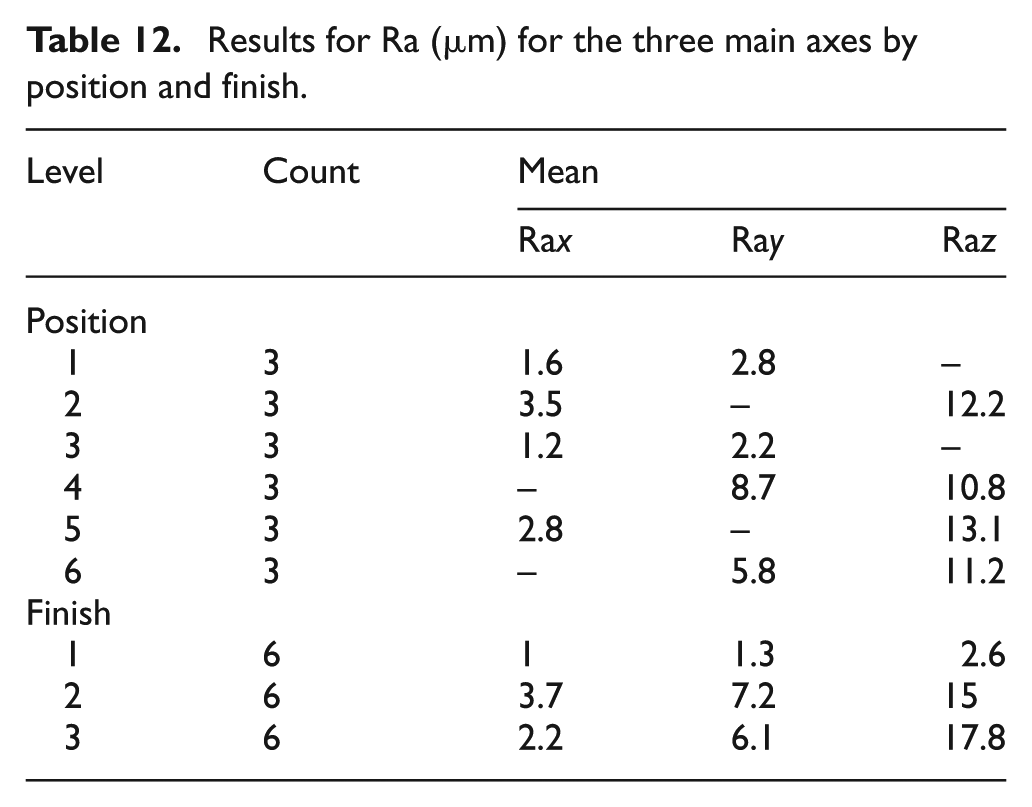
The Anderson–Darling test indicated that none of the three roughnesses was normally distributed (p < 0.005). Analysing both tables, the glossy finish produced the least roughness, regardless of post-process approach and the major and minor axes chosen for the printing process. With regard to the inclusion of a CS bath, it clearly reduces specimen roughness in the x direction in comparison with the specimen without the bath. However, on the z-axis, the results are almost the same with or without the bath, whereas on the y-axis the results are better in all circumstances with the exception of the yz orientation. The z-axis also presented the worst roughness independent of the finishing process. With the exception of the glossy finishing, the roughness is approximately the same as the printer resolution on the z-axis (16 µm). With respect to the other two major axes, the x-axis presents slightly less roughness than the y-axis.
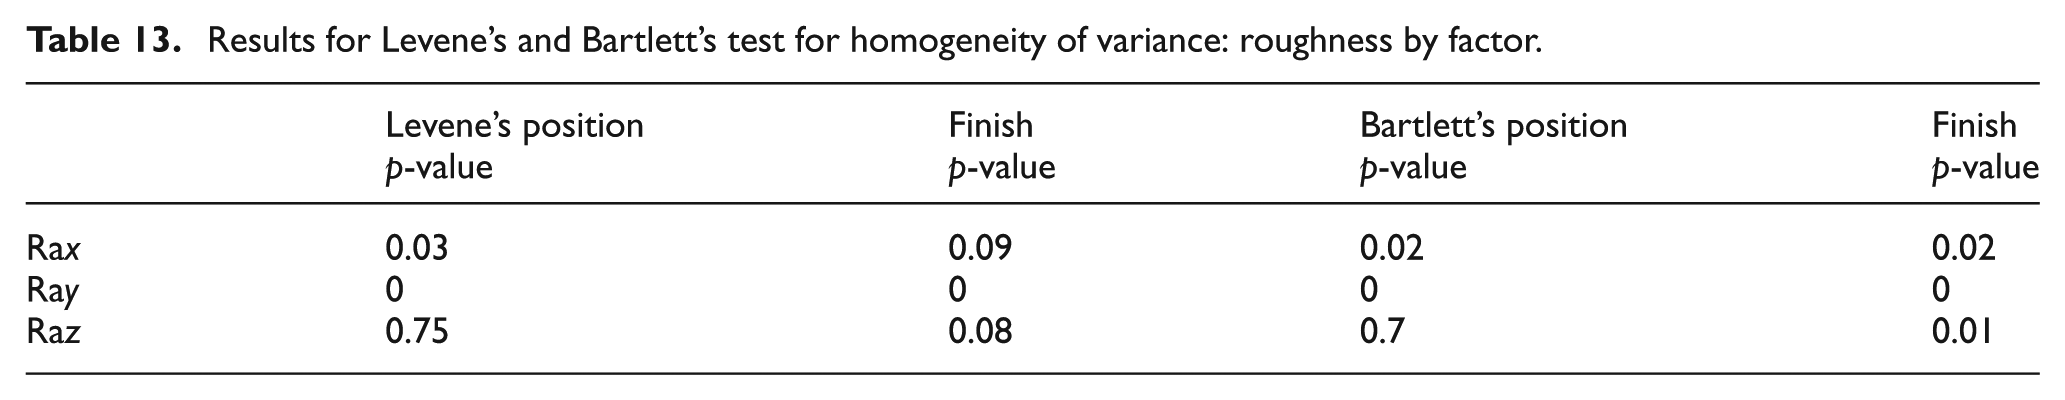
Similar to elongation at break, an ANOVA test was not appropriate because the mean roughness data in the three axes from the experiments did not present a normal distribution, and the variance for position and finish was the same (Table 13). However, despite not meeting the two assumptions, the ANOVA was also calculated for the surface roughness in the three axes, but taking the significance results with great caution. The conclusions of these tests indicate that both position and finish presented statistically significant differences between the means of the three roughness directions (p = 0.0–0.013) (Tables 14–16).
Results for Levene’s and Bartlett’s test for homogeneity of variance: roughness by factor.
Analysis of variance for Ra in the x-axis.
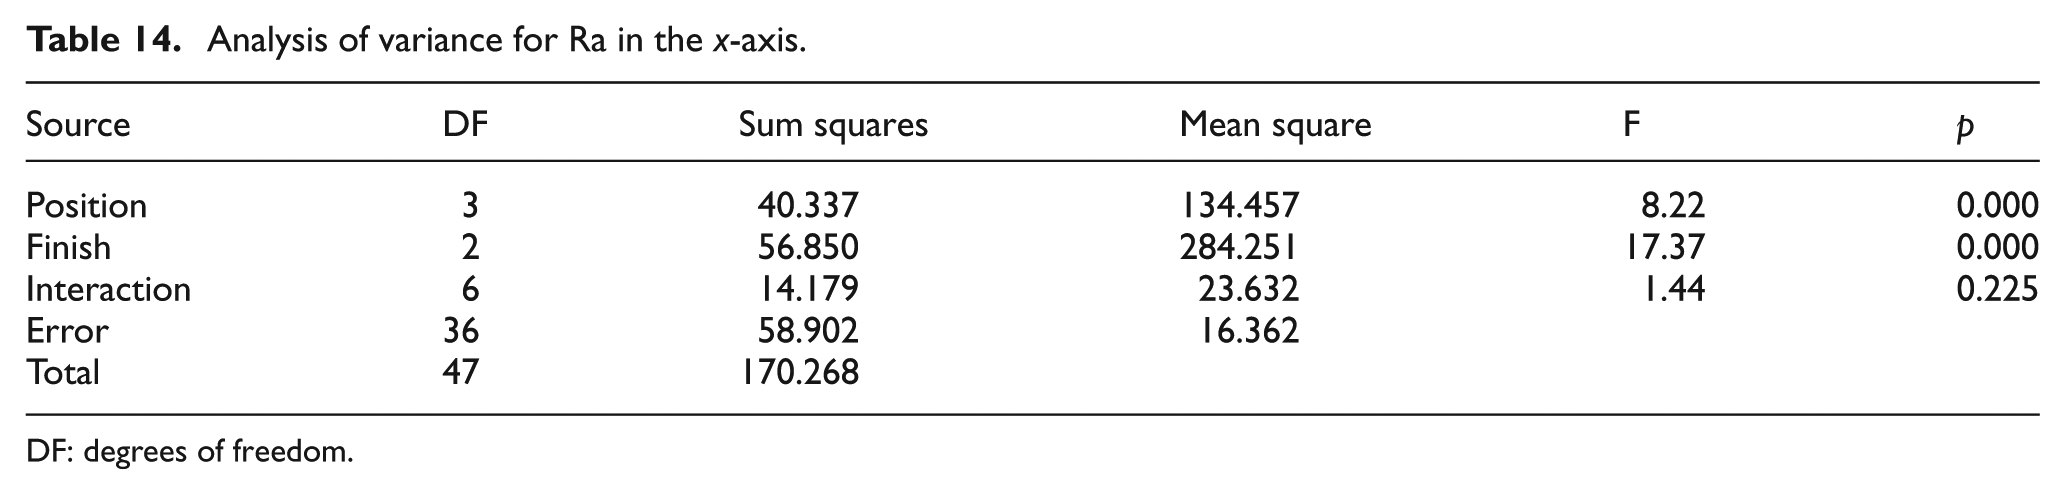
DF: degrees of freedom.
Analysis of variance for Ra in the y-axis.
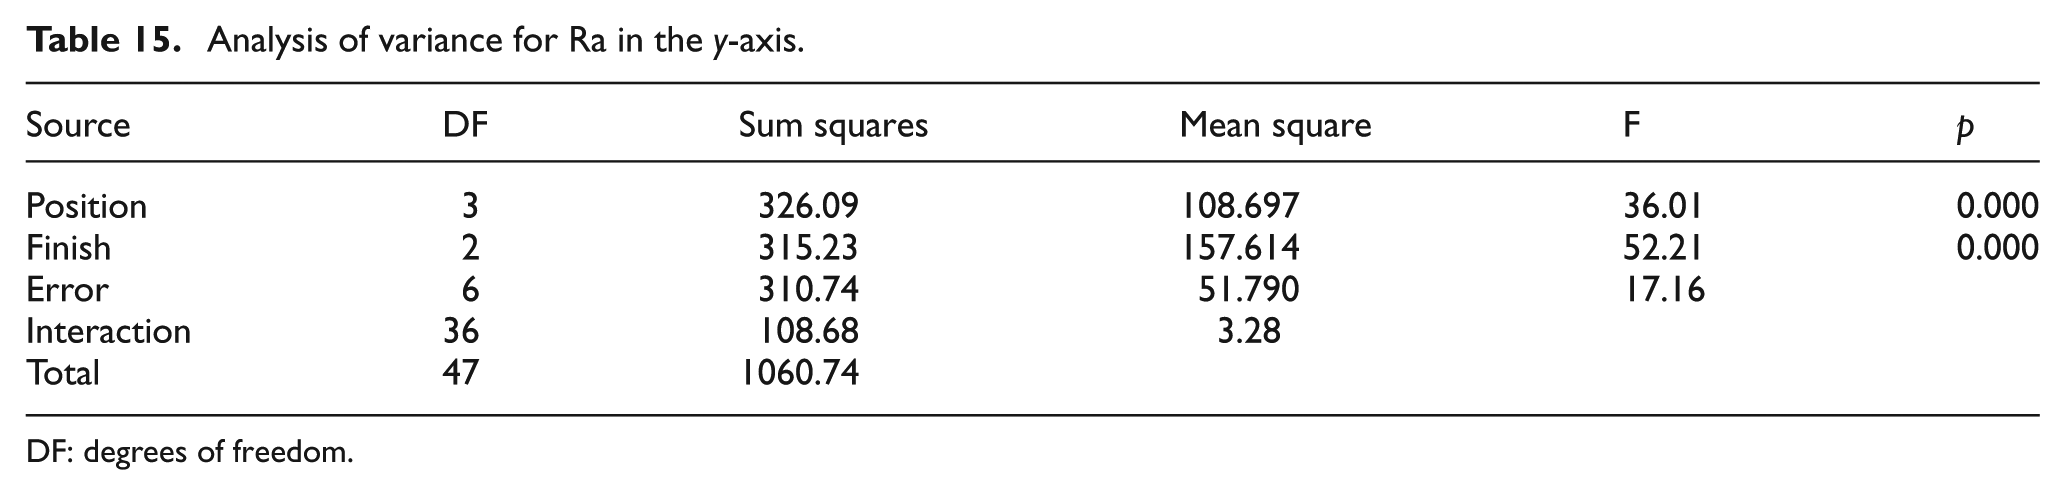
DF: degrees of freedom.
Analysis of variance for Ra in the z-axis.
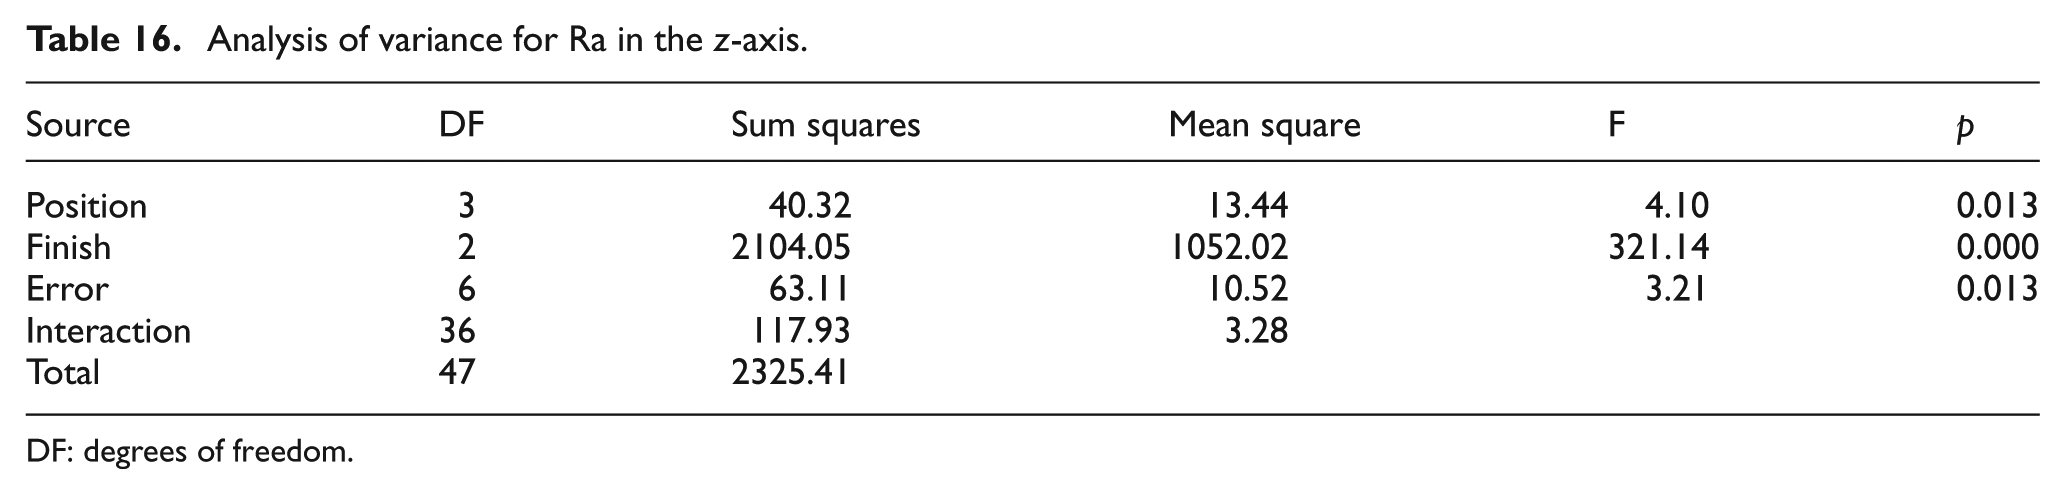
DF: degrees of freedom.
Strength and roughness interaction
The results from both tests were statistically compared to analyse whether specimen roughness could predict specimen strength. For each axis, a statistical analysis was performed to verify whether roughness influences the UTS value. The means of the measured roughness values in Table 11 were calculated. For instance, the average roughness of Specimen 1 in the x direction was 1.04 µm, the result of summing the individual roughness from Table 11 (2.96 + 0.58 + 0.36 + 0.29) and dividing the sum by the number of measurements taken (no. 4). These mean values were grouped into six different levels depending on the resulting mean value: Level 1 (0–4 µm), Level 2 (4–8 µm), Level 3 (8–12 µm), Level 4 (12–16 µm), Level 5 (16–20 µm) and Level 6 (greater than 20 µm) (Table 17). Continuing with the example, the roughness of Specimen 1 in the x direction was Level 1 since it fell between the established ranges for the first level.
Resulting means for Ra in the three axes and grouping by level.
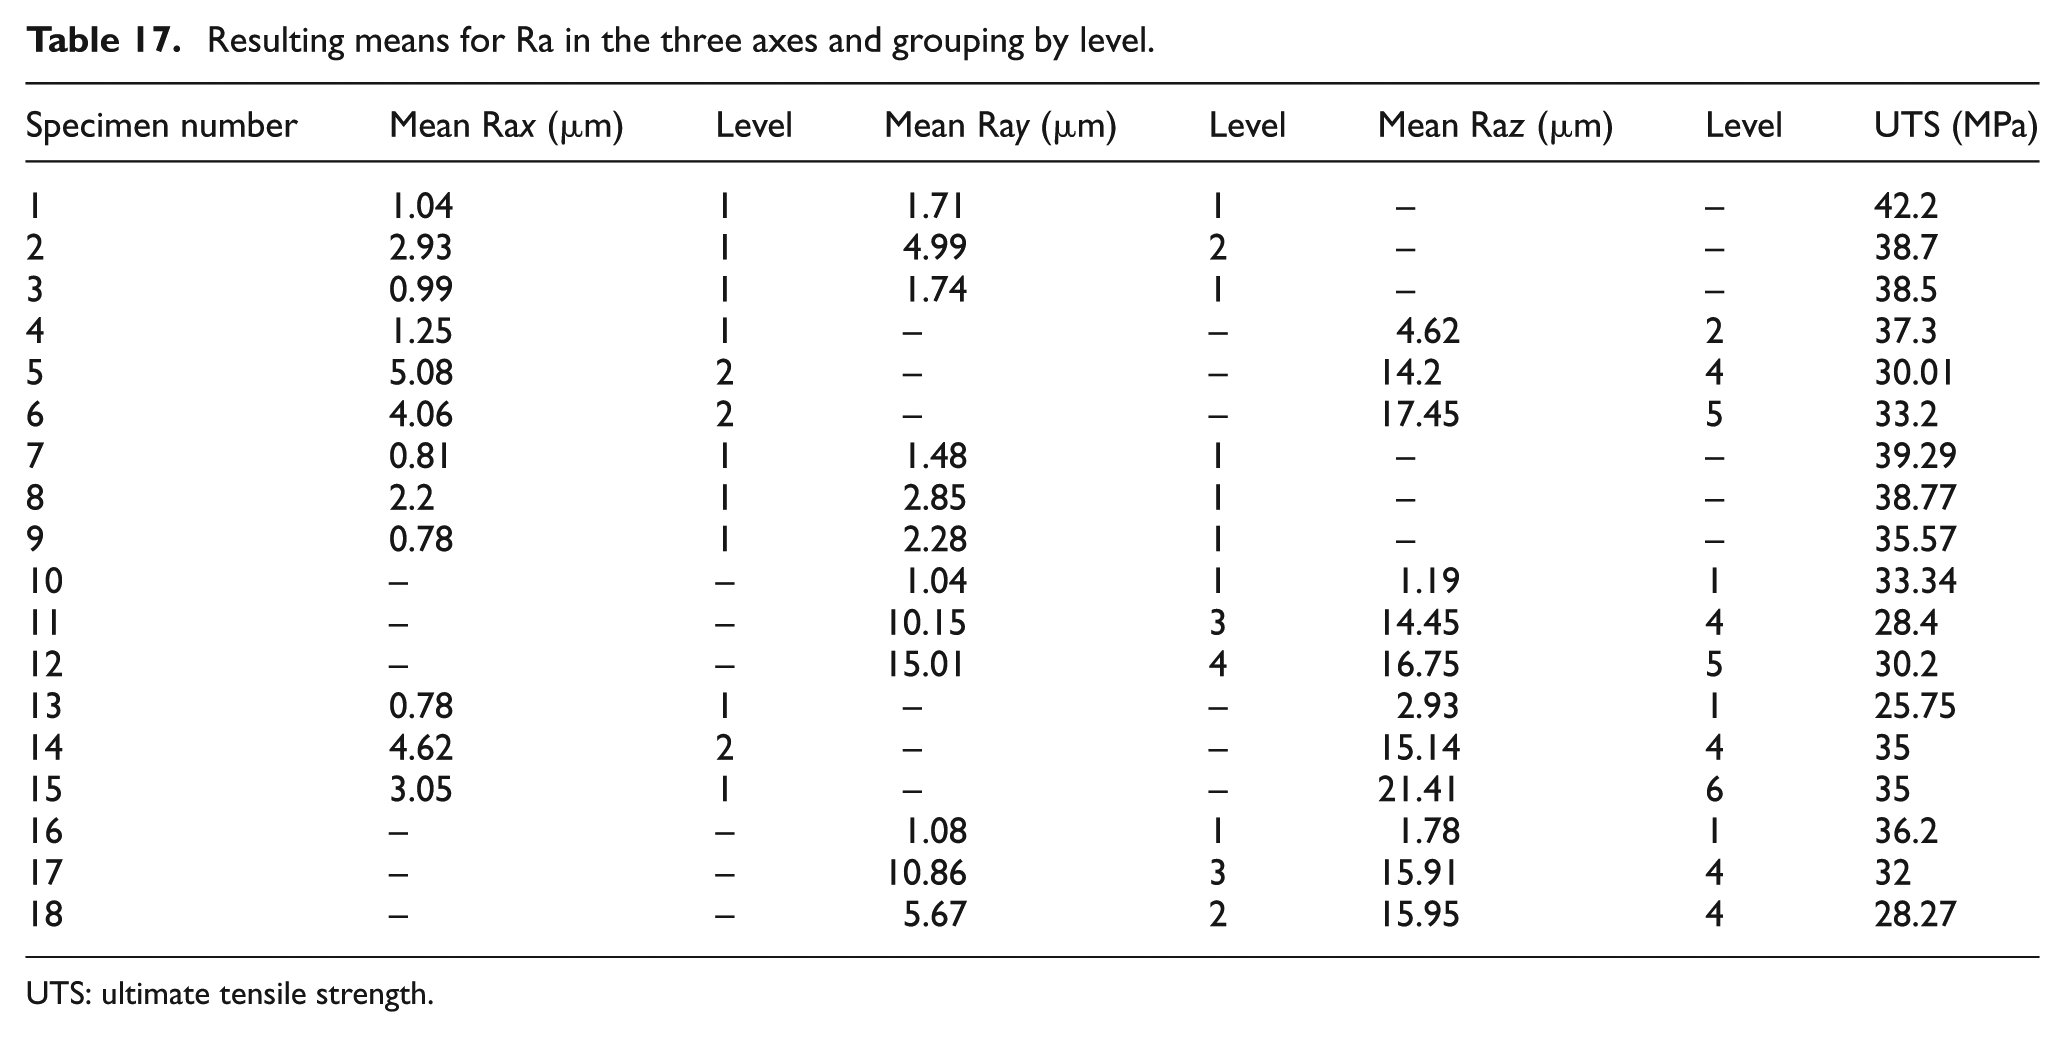
UTS: ultimate tensile strength.
For the x-axis, a Student’s t-test was carried out to compare the resulting means for each sample, while two one-way ANOVAs were performed in the y- and the z-axes. In each axis, only 12 specimens were used as input data because some specimens did not provide roughness in the selected axis. For example, in the x-axis, only the specimens numbered from 1 to 9 and 13 to 15 were used since there was no roughness measurement for the rest of the specimens in the x-axis. Hence, the level column for those 12 specimens and the corresponding UTS values were used for Student’s t-test. The input data for the ANOVA tests in the y- and z-axes were collected in a similar way. The assumption of normality and homogeneity of variance were met for the inputs of all tests. The results showed that there was no statistically significant difference in any of the three axes: x-axis (p = 0.106), y-axis (p = 0.096) and z-axis (p = 0.54), meaning that roughness is not critical for the UTS value.
Discussion
Several points of this work deserve discussion. Although the results presented in this article are based only on the Objet Eden 330 printer, they could be extrapolated to more modern printers that use the same technology. The two major Objet families have increased their resolution only on the y-axis, featuring 600 dpi (42 µm) on the x- and y-axes and 16 µm in the z-axis. This means that if we extrapolate the results of this research, the engineer could, for instance, position their part to get the maximum resistance not only on the x-axis but also on the y-axis in terms of stiffness. However, as z resolution remains unchanged, it is obvious that the z direction is still the least recommended for printing, at least if Fullcure 720 is the material selected for printing. Among the available materials provided by Stratasys/Objet, there are other rigid materials that other researchers have begun to study 6 and that will lead to further interesting investigations.
Returning to the elongation at break, the low ductility found in the z direction has been confirmed by other researchers and could be related to the PolyJet technology itself. With this technology, the material is injected on the tray in a liquid state and then converted into a solid by means of two UV lights positioned on the right and left sides of the printing heads. The liquid drops are mixed in the same slice (xy plane) without any restrictions before being exposed to the UV light, meaning that they get to the solid state at the same time and their molecules are perfectly joined. In contrast, the joining of printed slices in the z direction is different because the liquid molecules of the current slice, when solidified, are joined to the previous slice, which is solid and not liquid at the moment of joining. The results indicate that the cohesion is not very high. This special behaviour could be investigated in the future if the manufacturer allows the user to change more printing parameters than currently available. As mentioned previously, at this time, engineers can only work with the orientation and the finishing process, and they are not able to change other interesting parameters in order to, for example, modify the support strategy or even the amount of resin that is injected or the way that the resin is solidified by the UV lights.
Regarding the statistical analysis, the ANOVA tests may not be completely reliable and must be taken as an approximation with the current raw data for elongation at break and surface roughness. Future work is necessary to check whether violations of these assumptions can cause any major problem for the ANOVA or whether the ANOVA is reasonably tolerant with these violations as has been suggested by other authors. 21 Otherwise, a stronger ANOVA with these variables would be necessary in order to confirm or reject the conclusions presented in this article. This analysis should involve the raw data transformation in such a way that the resulting transformed variable agrees with the normality and variance homogeneity assumptions for the ANOVA. These transformations could include, among other things, logarithmic scaling, power transformation or square root conversion.
The tensile tests described herein were focused on the BS EN ISO 527-2:1996 regulation, which recommends a uniform cross-head speed of 1 mm/min while testing the specimen. The strain rate effect was not considered in this article, but it would be interesting to know whether the PolyJet technology materials increase their mechanical properties with strain rate, similar to other plastic materials. With those new mechanical properties, additional statistical studies should also be carried out to analyse whether the axes remain critical when printing the prototype. In addition, it would also be interesting to analyse the anisotropy behaviour of the Fullcure 720 material. This would involve new tensile tests that consider not only a main extensometer for the longitudinal displacements but also a second extensometer to measure the change in width of the specimen while performing the tensile tests.
Conclusion
From the design and manufacturing engineer’s point of view, when printing in rapid prototyping, it is very important to know all the necessary information in order to produce a prototype with certain properties. This information is sometimes confusing and not very useful in real designs. This article presents a statistical study that shows that the orientation of the printing part and the finishing process have significant influence on the final properties of the printed part; consequently, this article provides the basic knowledge an engineer must be aware of when printing with PolyJet technology. We have shown that glossy finish gets the best results in terms of roughness. However, a glossy finish is not always recommended due to geometry limitations (thin walls). If this finish is not possible due to geometry constraints, the most recommended choice is to clean the support material via a process of using WP and a subsequent CS bath. Regarding printing direction, the critical surfaces must be placed close to the xy plane to get the best roughness results. In terms of stiffness, the critical load direction of the desired piece should be placed along the x-axis when printing.
Footnotes
Declaration of conflicting interests
The authors declare that there is no conflict of interest.
Funding
This research received no specific grant from any funding agency in the public, commercial or not-for-profit sectors.