
Abstract
As additive manufacturing expands from rapid prototyping into rapid production, it is becoming more important to consider the mechanical performance of candidate products in addition to their functional attributes as a prototype. This study demonstrates how a design of experiments approach can be used to optimise the tensile and notched bending properties of the materials used in the process, while also considering the time of production and material efficiency. Such an approach can allow manufacturers to optimise the build in terms of the time, cost and material properties according to the requirements of the product. The main conclusion of this study was that when considering the significant contributors, similar build parameters result in optimised properties for both specimen types. It was also found that the layer height, being insignificant to the mechanical properties of both specimens, was critical to the cost control in terms of build time and material usage. Thus, the maximum layer height could be used to incorporate cost control into the design without affecting final performance.
Keywords
Introduction
The term ‘additive manufacturing’ (AM) describes technology where parts are built layer by layer. Beginning with stereo-lithography in the 1980s, 1 many techniques have since been developed, such as laminated object manufacturing (LOM), fused deposition modelling (FDM), selective laser sintering (SLS) and three-dimensional printing (3DP). 2 Initially, such technologies were limited to prototype production 3 and the term ‘rapid prototyping’ (RP) became prevalent. RP describes the speedy production of a representation or part prior to commercialisation. 4 However, recent advances (in both technology and material) have increased the applicability of AM processes to the creation of end-use parts.5,6
The breakthrough of AM into direct manufacturing as opposed to RP has given several benefits. For example, the extension of design freedoms enables manufacture of highly complex parts which are more difficult to produce by conventional methods such as milling or casting. 7 The additive nature of AM saves on material waste compared to traditional subtractive methods, which remove materials to produce the net shape. 8 Also, the independence of design complexity and production costs further increases the industrial applicability of AM. 9 The technology is now widely used in the medical, automotive and aerospace industries. However, AM products are highly anisotropic, and their properties are directionally dependent due to the layered nature of their structure. 10
FDM is an extrusion-based AM technology that was originally developed by Stratasys, USA, in the early 1990s. It consists of both computer-aided design (CAD) and computer-aided manufacture (CAM). The CAD/CAM operation required the initial CAD model to be drawn and broken down into layers in the x–y plane, with the layer-by-layer build occurring in the z plane. 11 The ease at which the CAD model can be refined significantly reduces design and development time, and consequently time to market. In RP, the physical presence of a prototype can also reduce the likelihood of initial design being misunderstood at shop floor level. 12
The FDM technique utilises a heating chamber to melt the polymer that is fed into the system as filament. The filament is pushed into the chamber by a tractor wheel arrangement and it is this that generates the extrusion pressure. 4 The nozzle extrudes a printing material one layer at a time where it is desired resulting in a cylindrical coiled morphology of each layer. 6 The main advantage of FDM is in the range of materials that can be processed, resulting in products with a wide range of tailored properties for specific applications. Full lists of FDM materials are available on suppliers’ websites, such as Stratasys.
AM produces parts on a generic fabrication bed without part-specific fixturing and tooling. However, a significant amount of human intervention is required to produce quality parts and a significant degree of expertise is required to produce parts of consistent quality, and often a trial-and-error basis is used. 13 Zhou et al. 14 established that layer thickness, hatch space, over cure, gap and position on the build plane are control factors for Stereolithography (SLA) accuracy. The Taguchi method can be used to identify a functional relationship between combinations of control factors and part quality. Thomson and Crawford 15 chose build time, surface finish and part strength to quantify the requirements with respect to part orientation. Part orientation, layer thickness and hatch space were identified as key control parameters. Frank and Fadel 16 developed an interactive system to decide suitable part deposition orientation. Ghorpade et al. 17 used a swarm intelligence approach to optimise part orientation for surface finish in FDM. Lan et al. 18 determined deposition orientation for SLA parts based on the considerations of surface quality, build time or complexity of the support structures. Pham et al. 19 developed a system to orient CAD models for part deposition in SLA to obtain the best trade-off among build time, cost and accuracy. McClurkin and Rosen 20 developed statistical models to predict build time, accuracy and surface finish of SLA parts using response surface methodology.
The literature review presented above reveals that most AM research is related to SLA and SLS processes. FDM studies using Taguchi’s parameter design21,22 investigated the influence of layer thickness, part orientation, raster angle, air gap and raster width along with their interactions on dimensional accuracy. The process parameters influence the responses in a highly non-linear manner and the experimental results to identify optimum parameter settings to minimise percentage change in length, width and thickness of standard test specimens indicate that optimal factor settings for each performance characteristic are different. Bharath et al. 23 indicated that layer thickness and part orientation have a significant effect on the roughness of parts fabricated using FDM. Anitha et al. 24 used the Taguchi method to determine the effect of layer thickness, road width and deposition speed each at three levels on the surface roughness of components. The results indicate that layer thickness is the most influencing process parameter affecting surface roughness. Part orientation is an important process parameter for part strength, dimensional accuracy, surface finish, part build time and cost and so on. 25 Tests have been conducted by changing the orientation to estimate mechanical properties and both tensile strength and flexural strength have been shown to decrease as orientation angle increases. 26 Thrimurthulu et al. 27 determined the optimal part deposition orientation for FDM process for contradicting objectives, namely, build time and average part surface roughness. In FDM for RP, Ingole et al. 28 looked to optimisation of build orientation in minimising part cost.
In FDM, bonding between the filaments is caused by local re-melting of previously solidified material and diffusion. The deposition speed may alter the heating and cooling cycles and results in a different degree of thermal gradient and thus also affects the uniformity of the stress and influences the part accuracy. 29 At lower slice thickness, the nozzle deposition speed is slower as compared to higher slice thickness. While depositing the material at the turns near the boundary of part, nozzle speed has to be decreased and then increased to uniform speed. 30 Stress accumulation also increases with layer thickness and road width. Thicker layers mean fewer layers, which may reduce the number of heating and cooling cycles. Also, a smaller road width will input less heat into the part but requires more loops to fill a certain area. More loops means more time required for deposition of a single layer and a more non-uniform nozzle speed. 29
The growing material choice in FDM provides a wide range or properties available to designers and the first step in meeting product requirements is selection of the appropriate material, for both function and mechanical performance. The part designer generally carries out a study of the part and quality requirements based on accuracy, build time, strength and efficiency and the end-use products also have to satisfy certain requirements, in terms of cost and material usage. This can be a time-consuming experience reliant on subjective observations. Thus, it would be useful to establish the relationship between build parameters and final product properties. The objectives of this article are to quantify the requirements for optimisation of FDM and the study aims to find the optimum build parameter settings for four different mechanical properties resulting from two types of tests: tensile – giving tensile strength and Young’s modulus, and single-edged notched bend (SENB) – giving peak SENB load and SENB modulus. In addition to the mechanical properties, the study will consider build time and part weight.
This research is a starting point for the creation of a knowledge repository of resultant properties from specific build parameters. It is hoped that this would be a useful tool for designers in the selection of build parameters, given their mechanical property requirements of their product. Benchmarking against build time and material efficiency for each combination of parameters would also allow designers to best compromise where build time and/or material costs are to be considered alongside (or in some cases exclusive from) mechanical performance.
Methodology
Build parameters
The focus of this research is on optimisation of tensile and notched bending properties of FDM Parts. To investigate how the build settings affect the process performance, this experimental research was focused on build time, part weight and material strength properties. To acquire the necessary information, the investigated FDM parameters were as follows:
Slice orientation (SO);
Number of shells;
Infill percentage;
Layer height.
These parameters were chosen as they represent the modifiable inputs to the FDM machine. Other parameters such as raster angle and width, air gap and nozzle speed were not studied as these are kept fixed by the machinery used.
The SO refers to the orientation at which the object is printed and is depicted in Figure 1. For the tensile test part, the fused deposition was across the length of the specimen for both builds. For the SENB test part, the fused deposition build was across the length of the specimen for one build and across the width for the second build. For simplicity, the builds are referred to as the front SO and side SO for both test parts. A top SO was not studied as the effect of layer bonding would be the limiting factor for tensile strength and therefore unsuitable in a study aiming to optimise the mechanical properties.
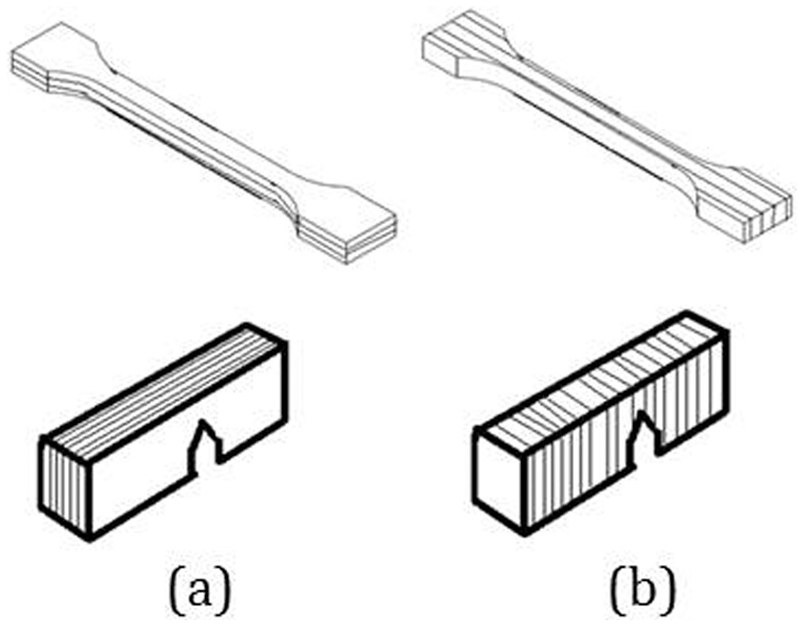
(a) Front SO and (b) side SO.
A shell is a border outline that is printed first for each layer. There is a minimum of one shell per layer for this FDM machine (Makerbot Replicator 2). More shells can be added, resulting in concentric borders being printed towards the centre of the object. If a large number of shells have been chosen and they cannot all fit into the object, the machine will print as many as it can before there is no space left. The width of the shells does not change, regardless of layer height, and remains at 0.4 mm, which is the nozzle diameter. In this research, two shell values are considered: 1 (the minimum) and 4, as five shells resulted in poor-quality SENB specimens with a side SO. Thus, four shells was the maximum achievable for high-quality specimens of both types regardless of other inputs.
The infill represents the density of the internal structure of the object. The infill is printed after the shell(s). A 100% infill will result in a completely solid structure. An infill that is lower than 100% will result in a regular hexagonal pattern being printed, with the hexagons proportionally decreasing in size with a higher infill. A lower infill will reduce the time taken to print and will reduce the mass of the object. The level of infill is given by a percentage, and the amount can be modified in the design software. This study considered a 100% infill for maximum strength and a 60% infill for reduced material weight and faster build time. A total of 60% was chosen as the lower limit as this was the lowest level at which all specimens were successfully built. At infill levels under 60%, the nozzle would tear the specimen from the platform.
In layer-based manufacture, the object is sliced into layers which are deposited sequentially. The layer height setting defines the thickness of each print layer. A low thickness requires more layers to complete the model which results in an increase in build time; consequently, a large thickness layer can improve the time taken to produce the build but can also result in negative quality effects such as the stair step effect on the surface of the part. The layer height can be modified using the design software and in this research layer, heights of 0.15 and 0.4 mm were considered, 0.4 mm being the maximum (the diameter of the nozzle) and 0.15 mm the minimum (as lower layer heights resulted in nozzle blockage and further tearing of the specimen from the build plate). Other approaches to minimisation of the stair step effect include optimisation of part orientation.
Specimen design
The focus of this research is optimisation of the properties of FDM parts. To acquire the necessary information on build time, part weight and material properties, the following response variables were determined:
Tensile build time (min);
SENB build time (min);
Tensile mean part weight (g);
SENB mean part weight (g);
Tensile strength (MPa);
Young’s modulus (GPa);
Peak SENB load (N);
SENB modulus, Ebend (MPa).
Schematics of each are depicted in Figure 2(a) and (b) for tensile and SENB specimens, respectively. Each design conforms to the appropriate standard: ISO 527-2 (tensile) and ISO 13586 (SENB).
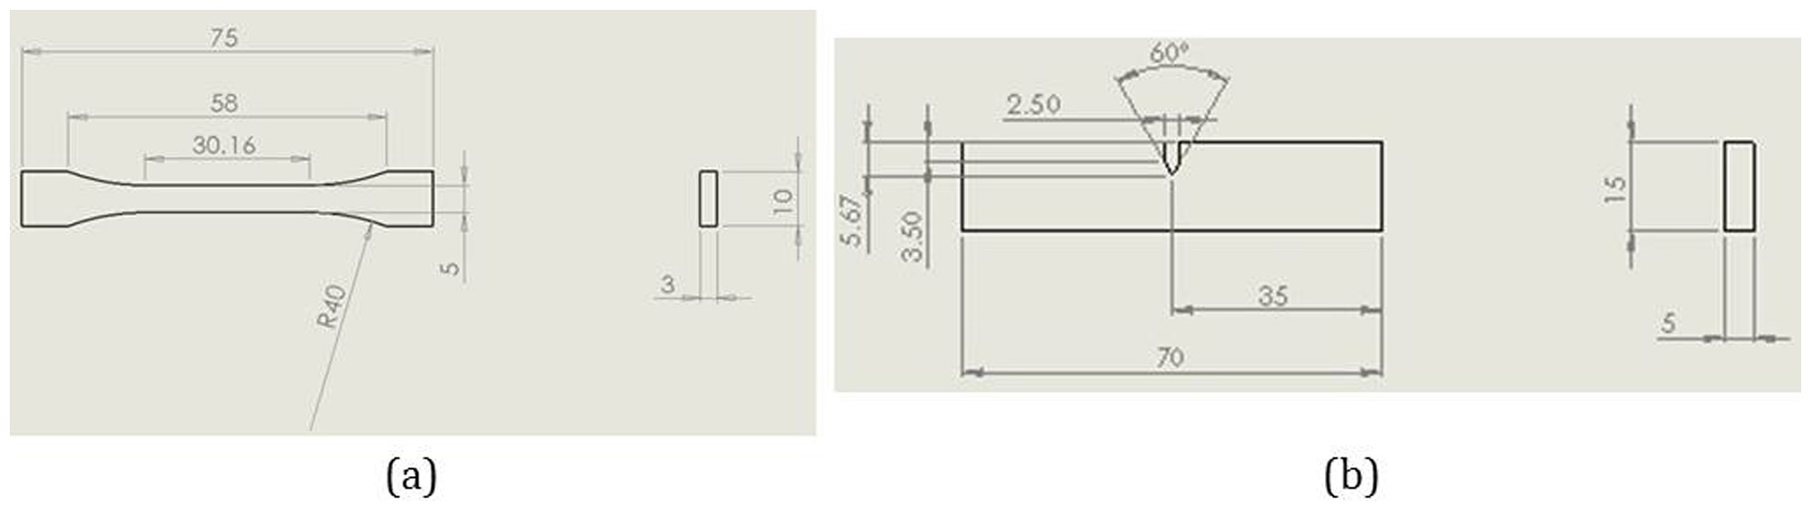
Specimen schematics of (a) tensile specimen and (b) SENB specimen (all dimensions are in millimetres, unless otherwise stated).
Test material
The material used in this research was polylactic acid (PLA) filament of diameter of 1.75 mm, supplied by Makerbot. The filament was designed specifically for use with all fifth-generation Makerbot Replicator printers, which include the Replicator 2 used in this work. PLA is an aliphatic polyester, a biodegradable thermoplastic that can be processed by techniques such as AM, injection moulding, extrusion, spinning and casting. PLA products are used in a wide variety of applications, and geometrically complex tools can be additively manufactured. The biodegradability of PLA has led to extensive use in the disposable packaging industry. Sectors where mechanical performance is paramount include the medical implant sector, where quantification of the mechanical properties with the build parameters would be especially important.
Design of experiments
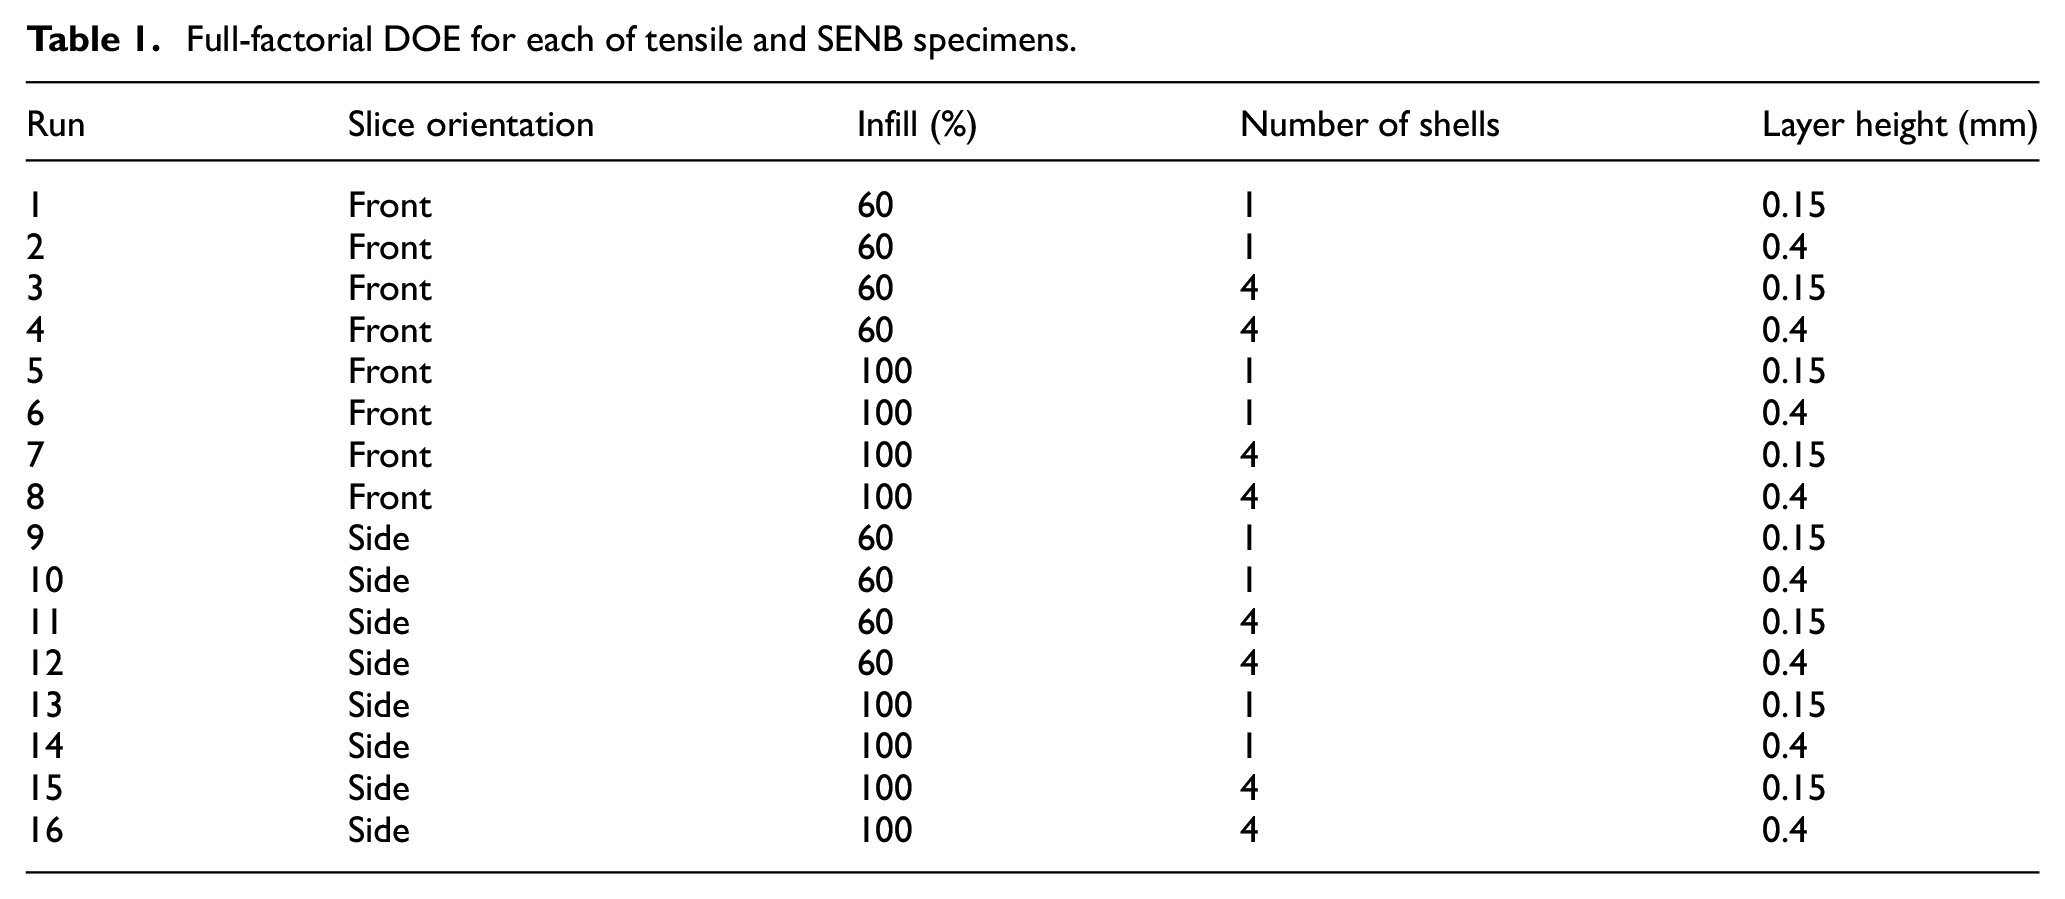
The Taguchi design of experiments (DOE) method was used to plan the research with the objectives of acquiring data in a controlled way, obtaining information about the behaviour of the FDM process and also identifying significant factors affecting the process. To investigate how the process affects the material performance, this experimental research was focused on the eight outputs defined in section ‘Specimen design’. The optimisation is based on a function of four process factors, build orientation, infill, the number of shells and layer height. Given that four factors at two levels were considered for the selected material, a Taguchi L16 orthogonal array (OA) was selected (Table 1). A full-factorial two-level DOE was adopted for the study, for both tensile and SENB specimens. The two-level design incorporating four parameters requires 24 = 16 total experiments for each mechanical property to be tested; the 16 experiments were randomised and each experimental run was repeated. Based on the L16 OA defined in this way, 10 trials were performed for each combination of controlled parameters. Thus, 320 experimental trials in total were carried out. The eight response variables are based on the factorial array depicted in Table 1.
Full-factorial DOE for each of tensile and SENB specimens.
FDM
All the specimens were sliced and prepared for printing using MakerWare software and then printed using Makerbot Replicator 2 printers, using PLA filament of 1.75-mm diameter. The Makerbot Replicator 2 translates the CAD file instructions via USB or SD card, heats the filament and the servo motors drive it through the nozzle to perform the layer manufacture. The machine has a build volume of 285 × 153 × 155 mm and a layer resolution of up to 100 µm. It is limited to processing PLA filaments of 1.75-mm diameter and has a nozzle diameter of 0.4 mm. Default settings for the extrusion temperature and extrusion speed of the Makerbot were employed as recommended by the manufacturer.
Mechanical testing
The tensile tests were carried out using a Zwick Roell Z010 machine. A 10-kN load cell was used, with an accuracy of 0.08% for the load range measured. The results were gathered using TestXpert II 3.6 software, and from the data calculated tensile strength and Young’s modulus. The SENB tests were carried out using an Instron 4507 machine, with an accuracy of 0.01% for the 1-kN load cell that was used, and from the resulting load versus deflection curve calculated the peak SENB load and SENB modulus. Tests were carried out at 1 mm/min and 10 mm/min for the tensile and SENB specimens, respectively. The experimental methods followed the standards stated previously (section ‘Specimen design’).
Data analysis
The data from the mechanical testing were analysed using MiniTab 16. The main effects’ plots for the means (of each measured property from each Run of 10 specimens) were generated to assess the effect of each level of a parameter (positive or negative, depending on the gradient) on a given property. Pareto plots were generated to determine which single parameters and parameter interactions significantly affected each measured property (at 95% confidence level).
Results and discussion
Build time and material efficiency
In RP, the main focus is on cost minimisation and performance-specific characteristics, such as mechanical properties, are of less importance. In terms of build parameters, this can be achieved by reducing build time and increasing material efficiency. Table 2 displays the results of the build time and material usage (measured by mean part weight of the specimens), along with the mean values of all calculated mechanical properties from both the tensile and SENB specimens. It would be intuitive to relate faster build times with smaller part weights; however, this is not necessarily always the case, as shown by Figure 3(a) and (b), which displays the relationship between the two results (part weight multiplied by build time) for tensile and SENB specimens, respectively. From both results, it is clear that the layer height has a large effect; the odd numbered runs (with the shorter 0.15-mm layer height) all being less efficient in both cases than the even numbered runs with the higher 0.4-mm layer height. It can also be seen that Run 13 (side SO, 100% infill, 1 shell, 0.4-mm layers) for the tensile specimen stands out as the highest build time and part weight of all the runs. For the SENB specimens, Runs 11 (side SO, 60% infill, 4 shells, 0.15-mm layers), 13 (side SO, 100% infill, 1 shell, 0.15-mm layers) and 15 (side SO, 100% infill, 4 shells, 0.15-mm layers) stand out in terms of increasing build time and part weight. Optimisation for a combination of short build time and low material use would yield the lowest values of the product of part weight and build time. For both sets of specimens, this was Run 10 (side SO, 60% infill, 1 shell, 0.4-mm layers). By plotting the main effects (the effect each level of a parameter has on the measured value), the recommended parameters are different to those of Run 10 (Figure 4). In both cases, the largest effect is confirmed as the layer height. In particular, the negative gradient illustrates a reduction in the product build time and part weight with an increase in layer height from 0.15 to 0.4 mm.
Results of build time and mean part weight (for tensile and SENB specimens), tensile strength and Young’s modulus (for tensile specimens) and peak SENB load and SENB modulus (for SENB specimens).
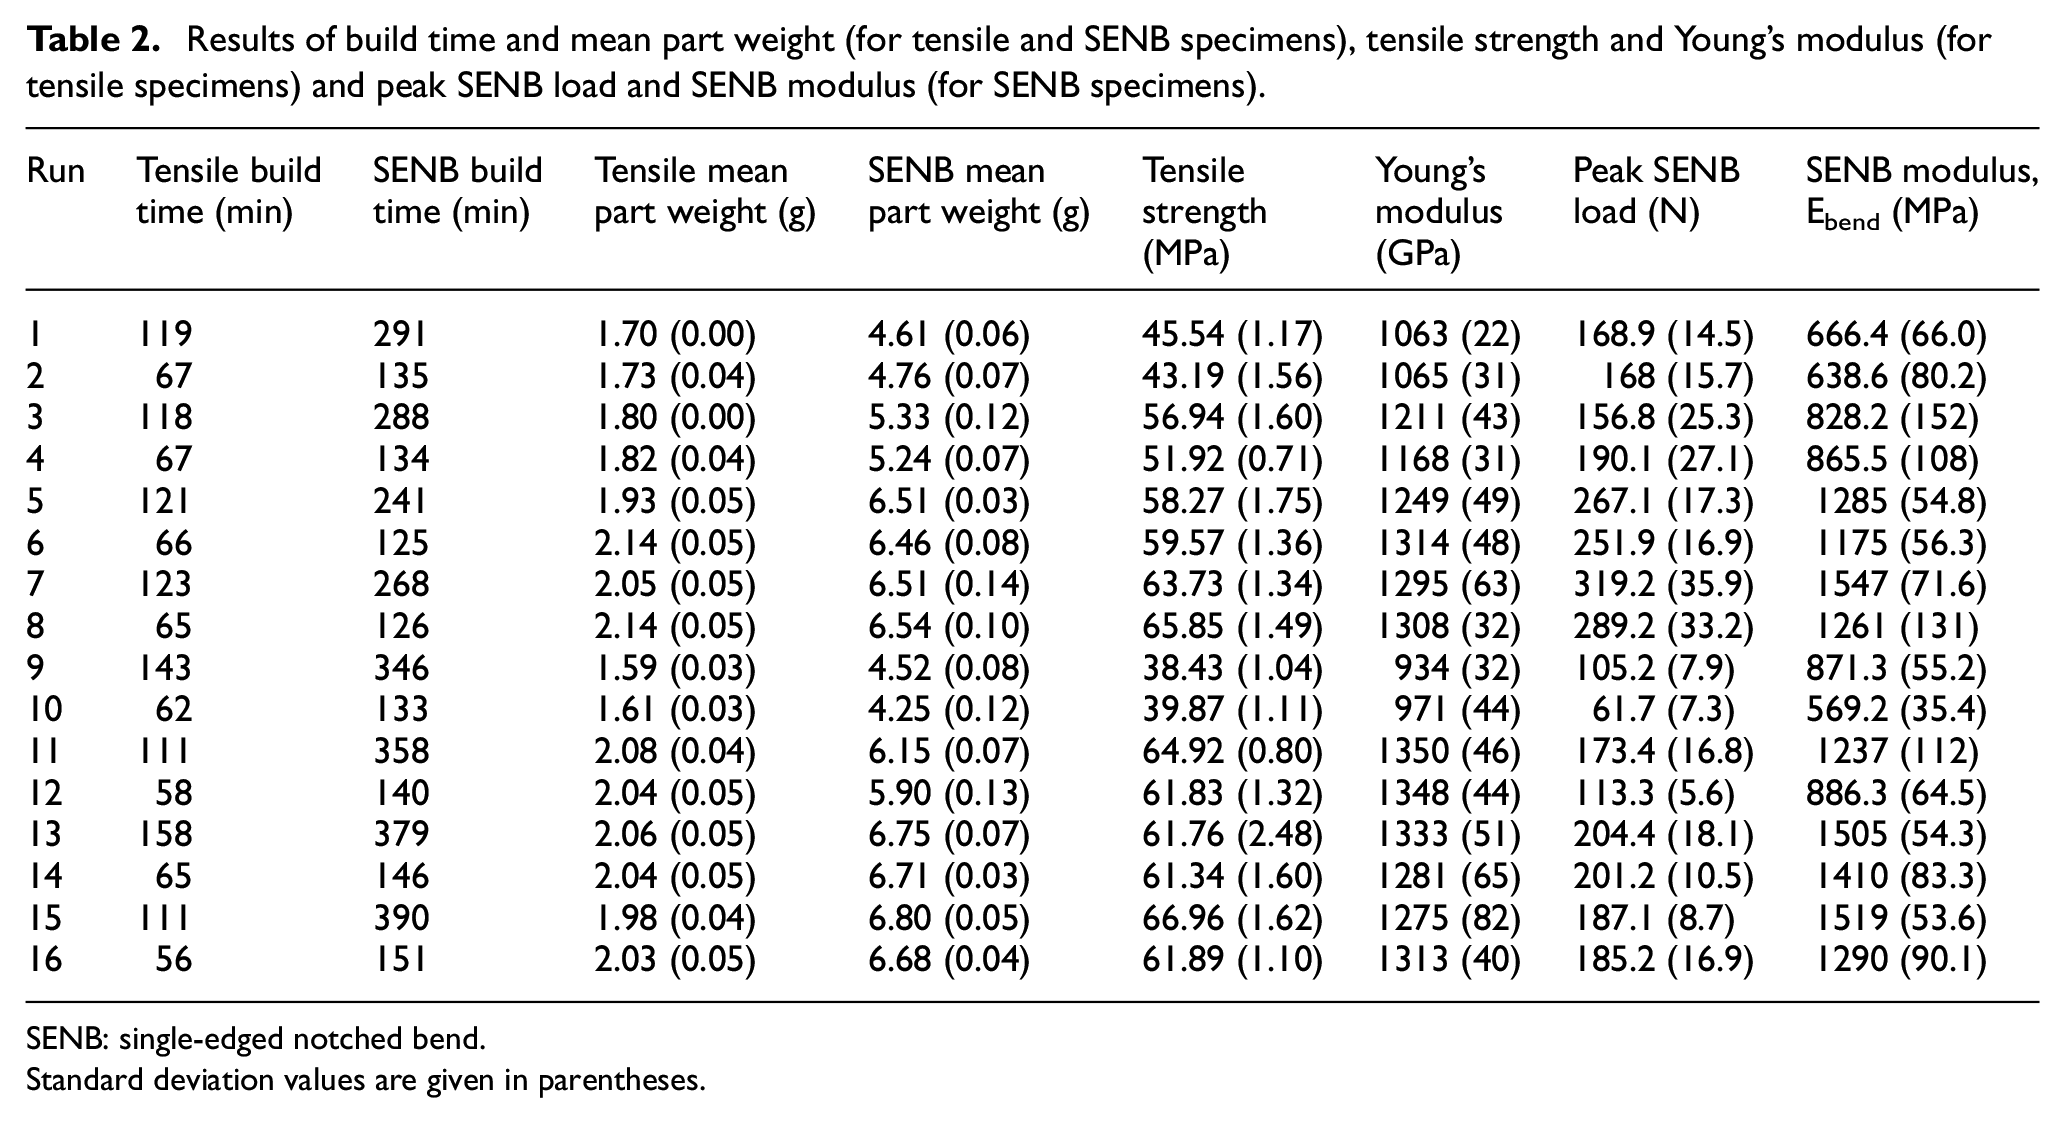
SENB: single-edged notched bend.
Standard deviation values are given in parentheses.
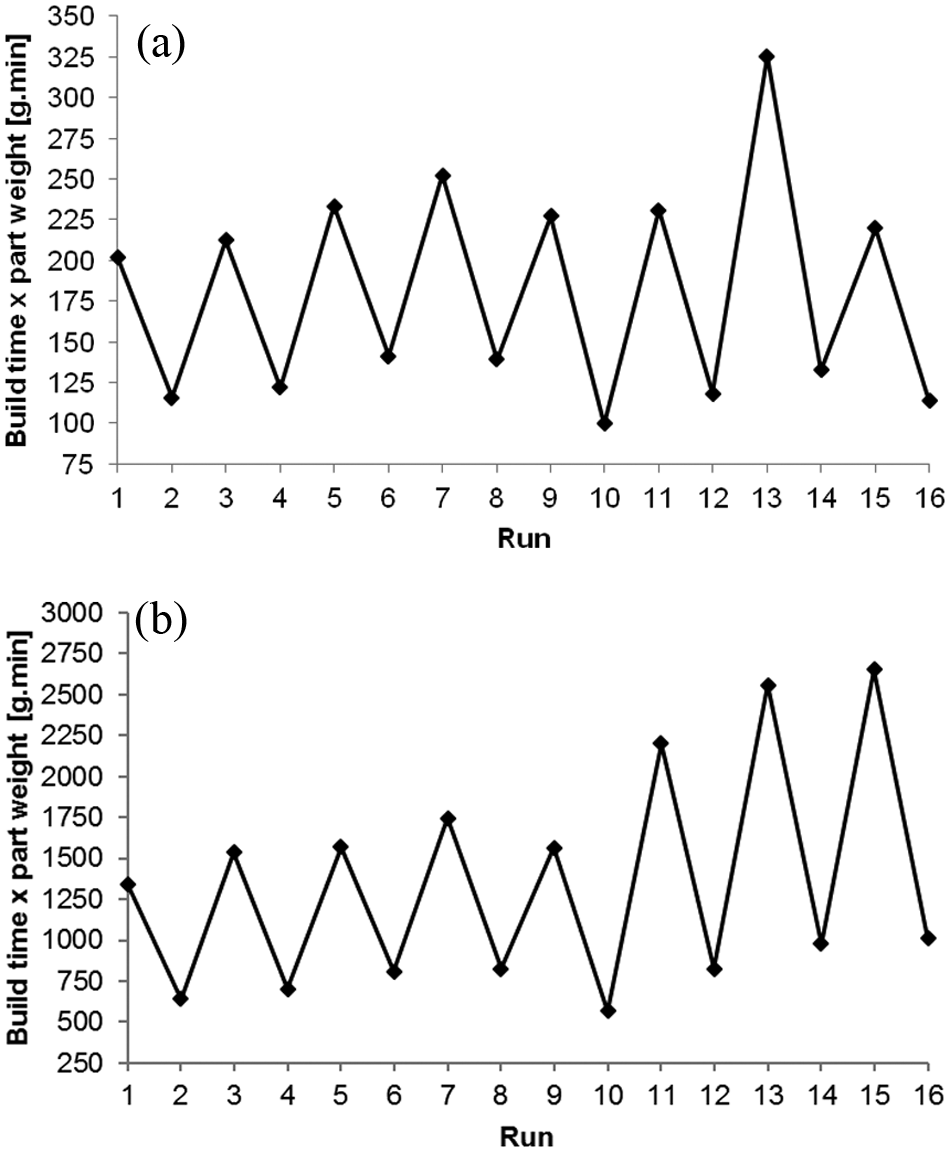
Product of build time and mean part weight for (a) tensile and (b) SENB specimens.
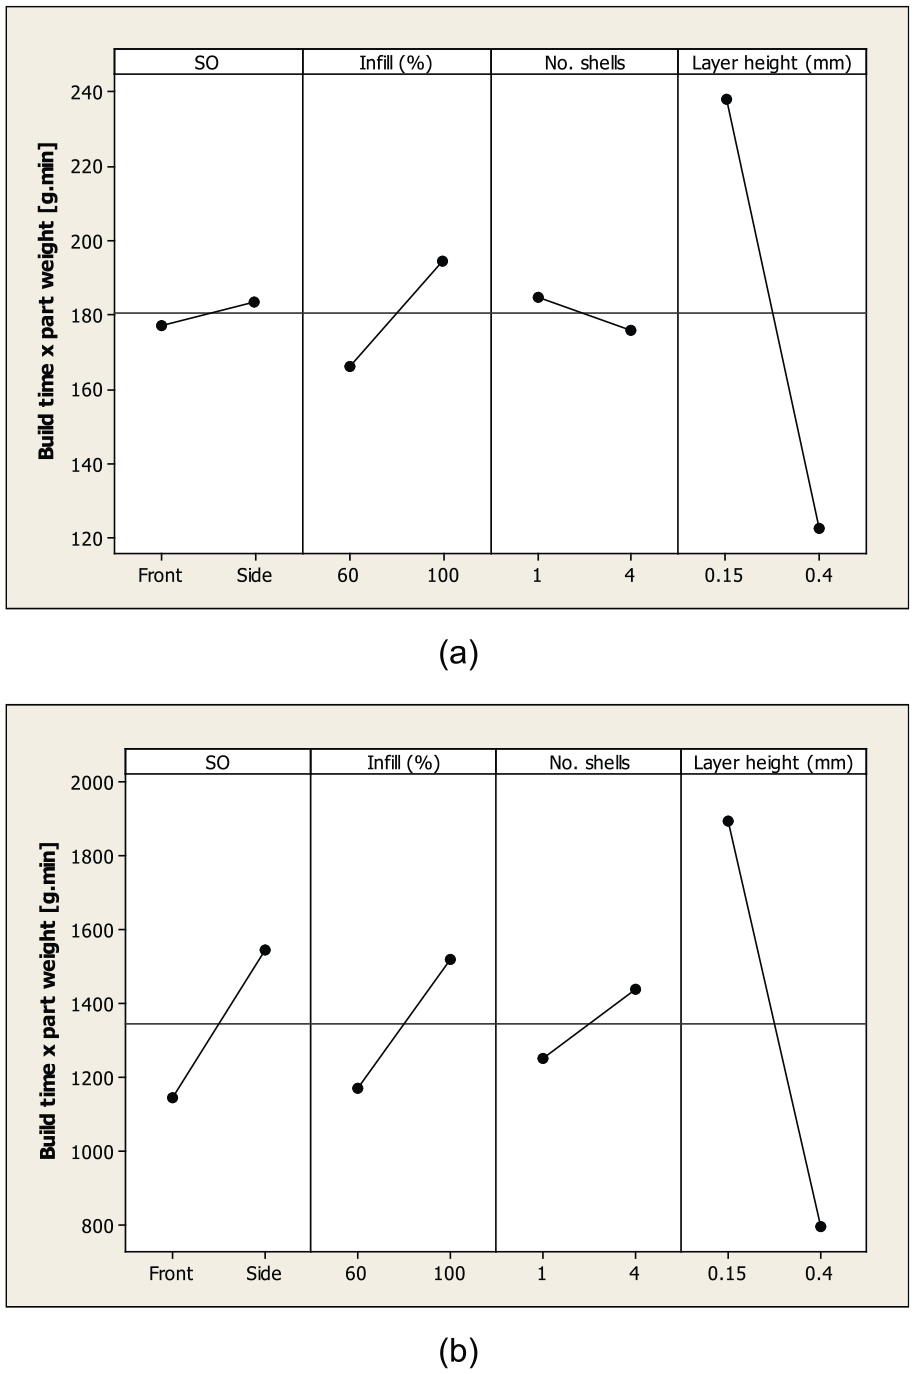
Main effects’ plots for product of build time and part weight for (a) tensile and (b) SENB specimens.
The tensile and SENB specimens differ in the recommended number of shells. However, this does not appear to be significant, as confirmed by the Pareto plots (Figure 5), which show that layer height is the most significant for both specimen types (at 95% confidence level). Thus, a simple recommendation for cost control in terms of build time and material usage would be to use the maximum layer height. Interestingly, Figure 5 indicates that the SO is significant for the SENB specimens. This could be due to a smaller number of longer slices requiring less build time than a larger number of shorter slices.
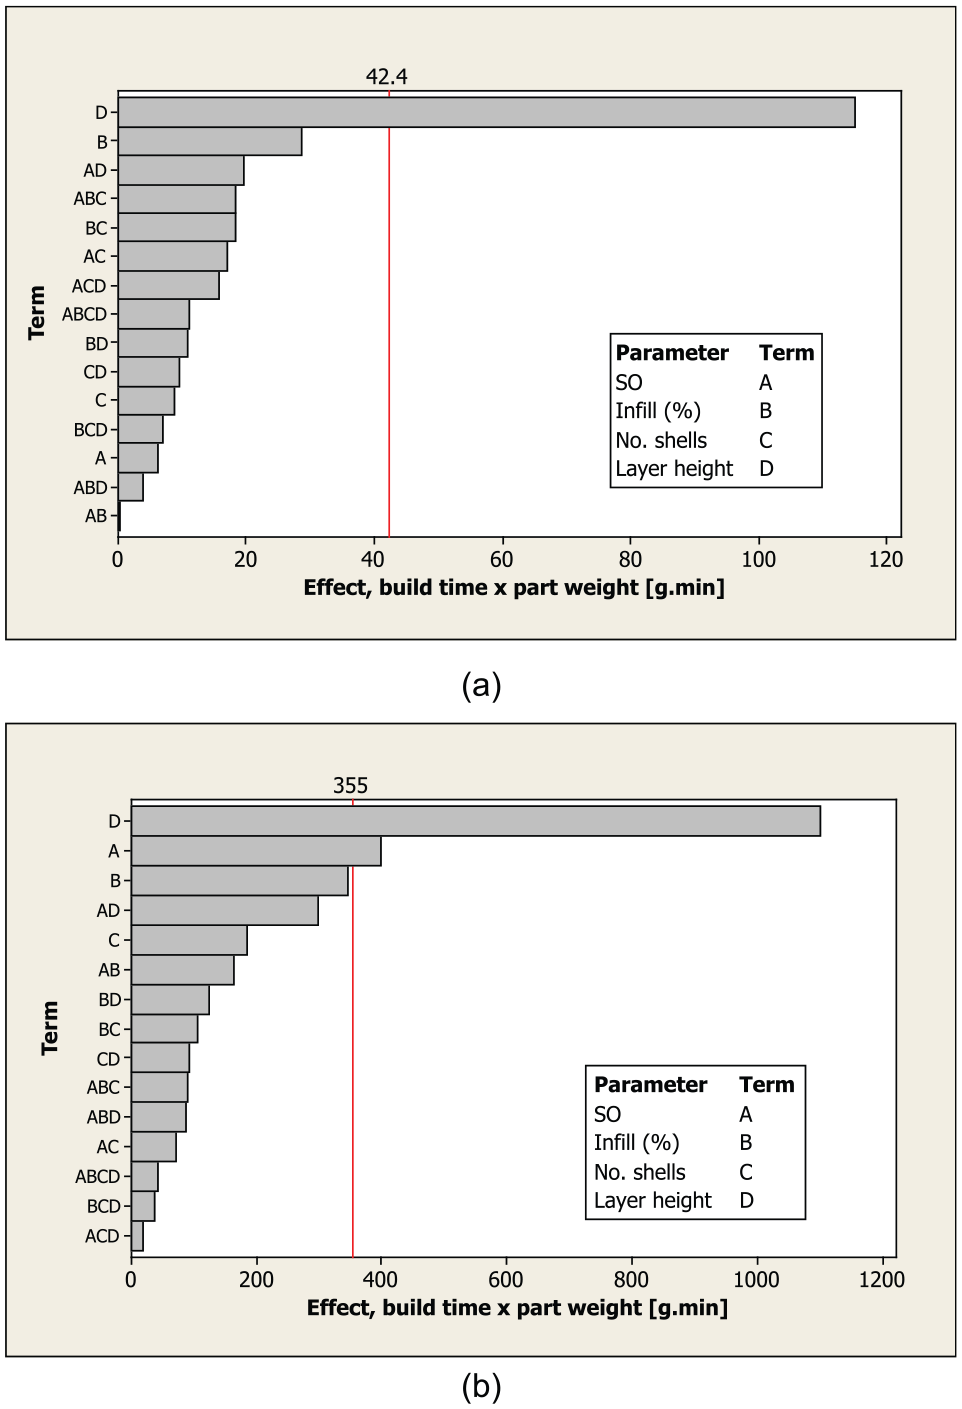
Pareto plots for product of build time and part weight for (a) tensile and (b) SENB specimens.
As AM technologies become more applicable to rapid manufacturing, expanding from their traditional applications in RP, designers and producers would need to consider the performance characteristics of their products. Examples include the mechanical properties, surface finish and temperature, fatigue and corrosion resistance. In such performance-specific products, cost control through fast build times and material efficiency (section ‘Build time and material efficiency’) becomes a secondary consideration. In this work, the mechanical properties are the focus, specifically tensile and SENB properties, and these are discussed in the following two sections.
Tensile tests
Table 2 lists the calculated mean tensile strength and Young’s modulus values from the tensile tests. The standard deviation values are given in parentheses. The data are presented graphically in Figure 6, where the error bars depict 1 standard deviation from the mean value.
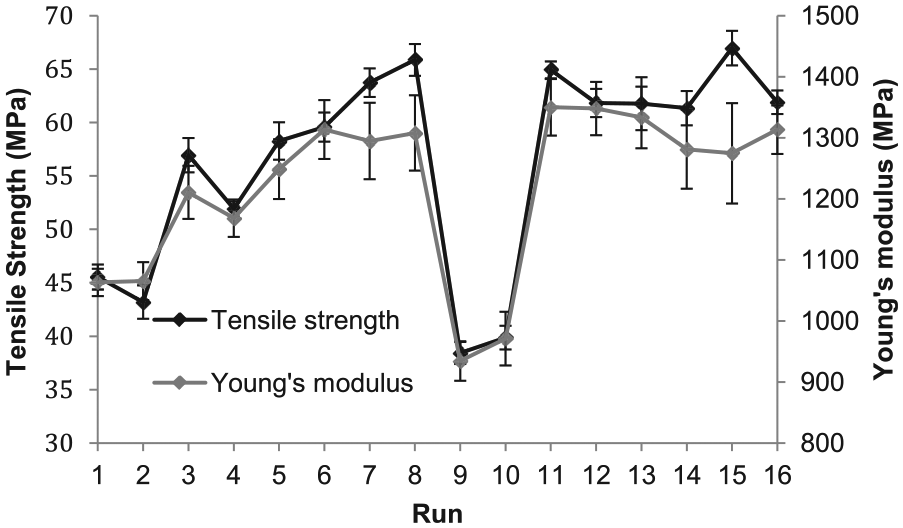
Mean tensile strength and Young’s modulus calculated from tensile tests.
It is clear from Figure 6 that the tensile properties of the parts are dependent on the build parameters. The highest value for tensile strength was 66.96 MPa (Run 15 – side SO, 100% infill, 4 shells, 0.15-mm layers) and the lowest 38.43 MPa (Run 9 – side SO, 60% infill, 1 shell, 0.15-mm layers). For Young’s modulus, the highest value was 1349.9 MPa (Run 11 – side SO, 60% infill, 4 shells, 0.15-mm layers) and the lowest 934.3 MPa (again Run 9).
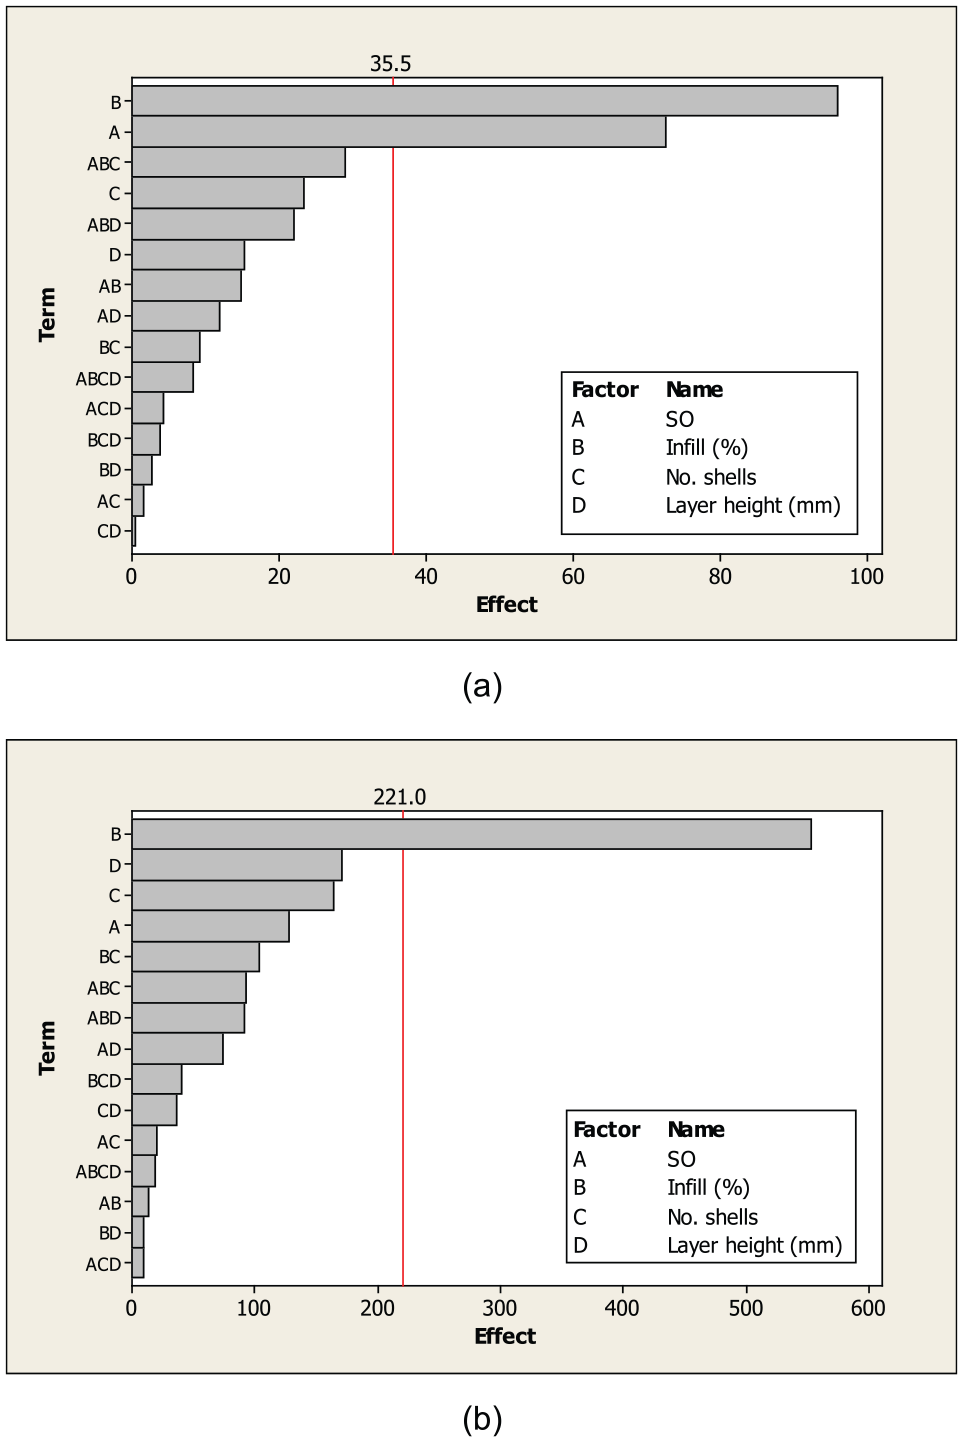
The main effects’ plots (Figure 7) show that the infill and number of shells are the most important parameters. This is confirmed by the Pareto plots (Figure 8), which indicate that the infill is the most significant factor, followed by the number of shells and then a combination of the two. This is to be expected as a 100% infill builds a completely solid structure, which would be stronger and stiffer than the honeycomb pattern printed at infills of less than 100%. The SO is not a significant factor on its own. This would only be apparent if a top SO was used, where the tensile properties would be inhibited by layer bonding (Figure 1). The SO does appear to be significant when combined with the number of shells, and both infill and the number of shells for Young’s modulus (Figure 8), favouring a side SO (Figure 7). This phenomenon would require further study, as any contributions to stiffness should be similar for both front and side SOs as the layers in the structure are parallel to the load axis in both cases (Figure 1). It is this alignment with the load axis which explains why layer height is not a significant factor for either tensile strength or Young’s modulus (Figure 8).
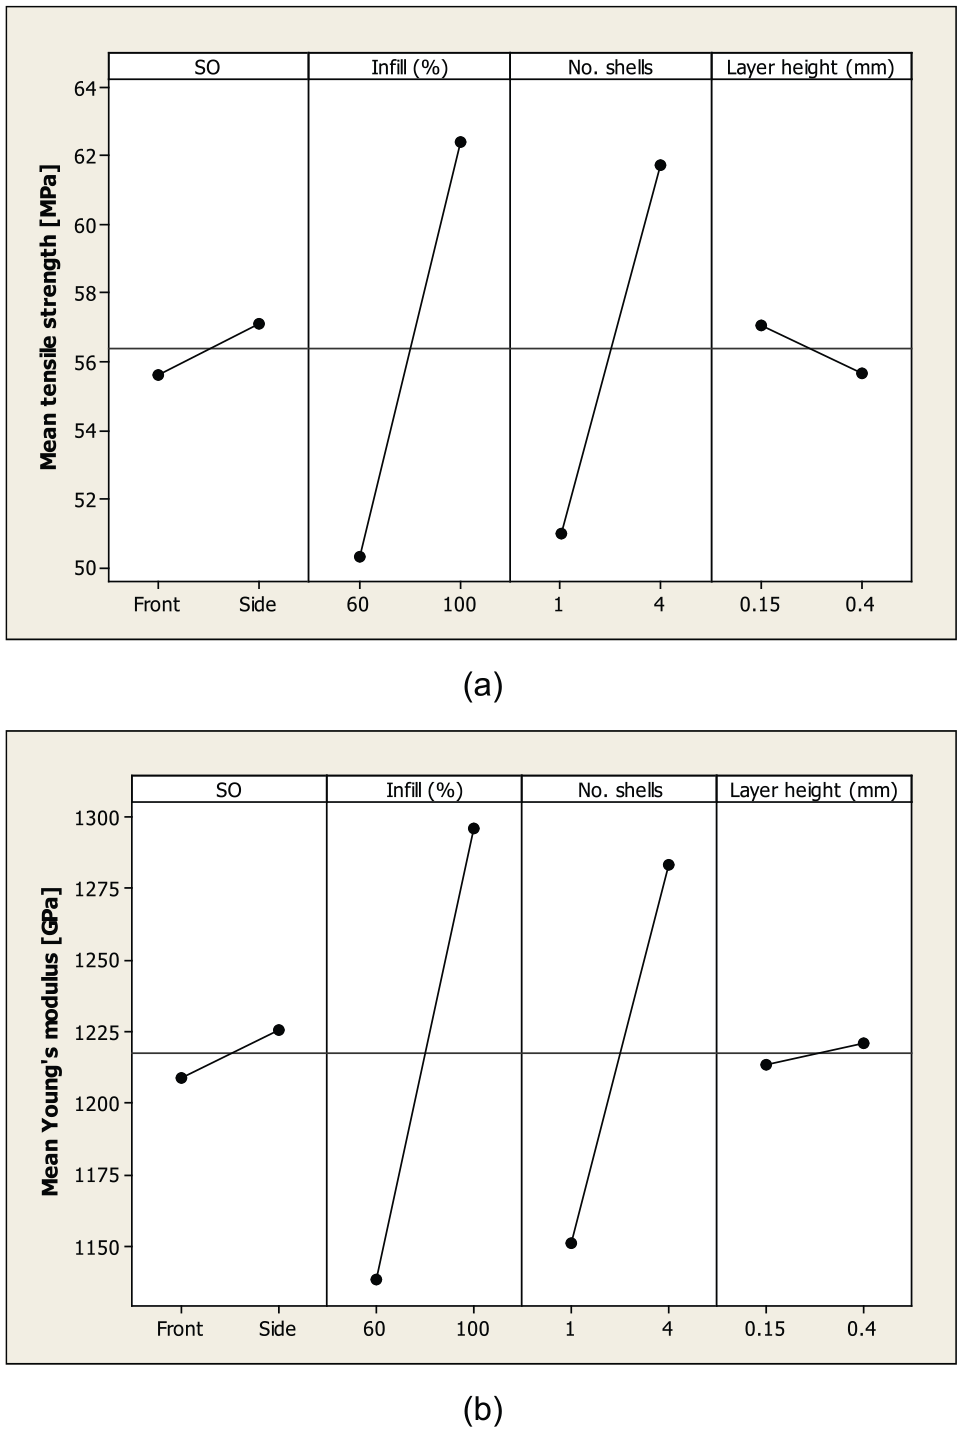
Main effects’ plots for (a) tensile strength and (b) Young’s modulus.
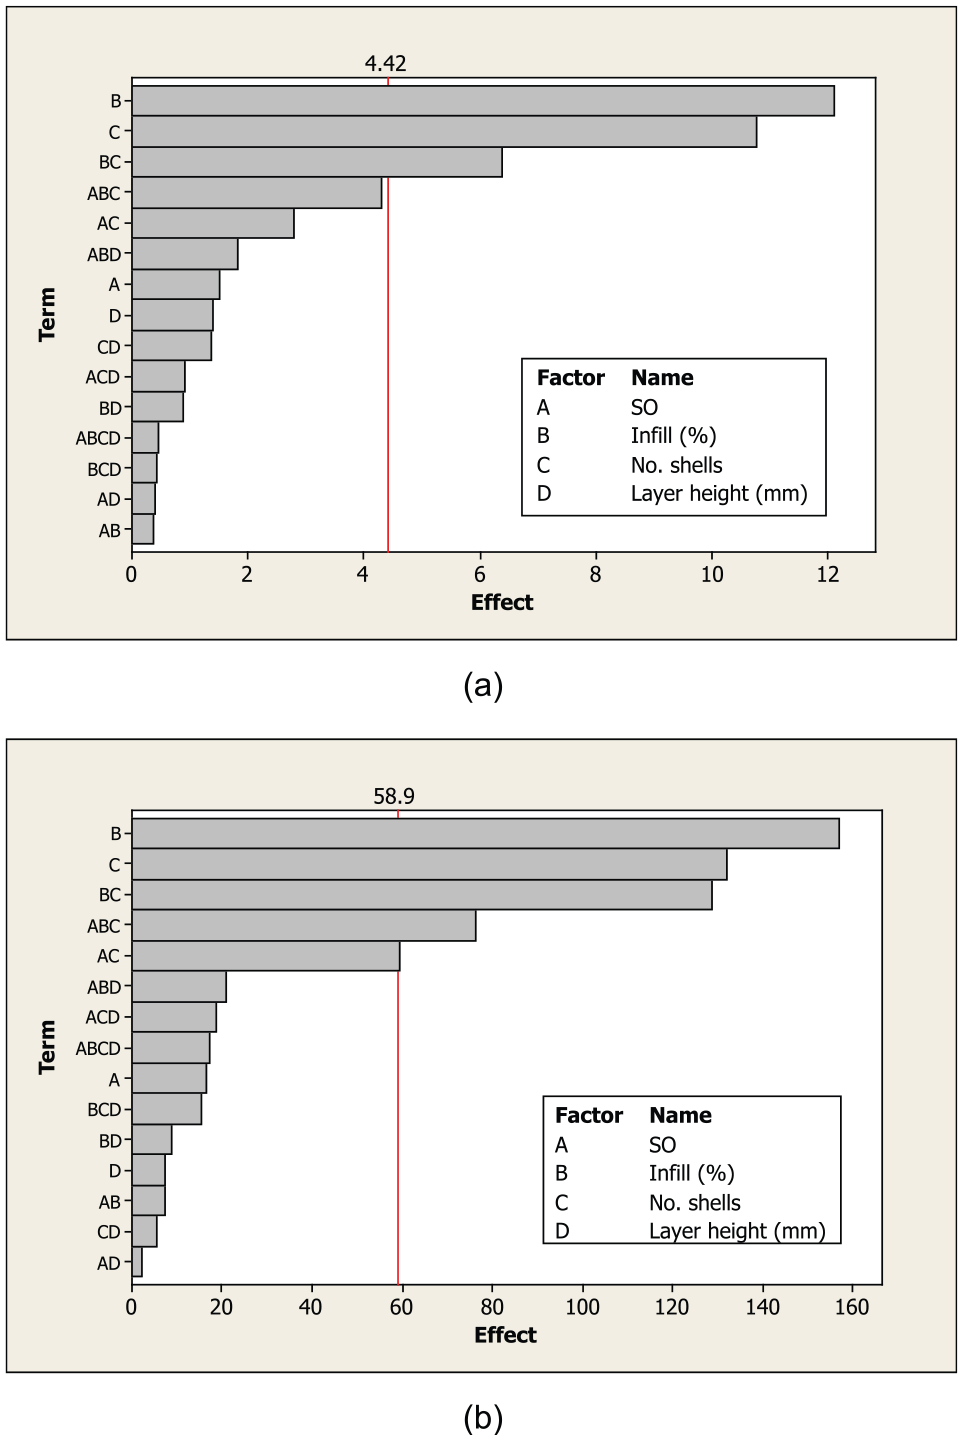
Pareto plots for (a) tensile strength and (b) Young’s modulus.
Thus, in a product where optimisation of tensile properties is the critical factor, the analysis recommends that a 100% infill and 4 shells be used. A front SO would also be recommended according to the analysis; however, this is unlikely to be significant, although further work would be required to verify this. The layer height is insignificant to the tensile properties and would only come into play in the use of a top SO, which would anyway be discarded as an option where tensile strength is critical due to the effect of layer bonding discussed earlier. Thus, a recommendation for incorporating cost control (discussed in section ‘Build time and material efficiency’) would be to use the maximum layer height, as this is the most significant factor (Figure 5).
SENB tests
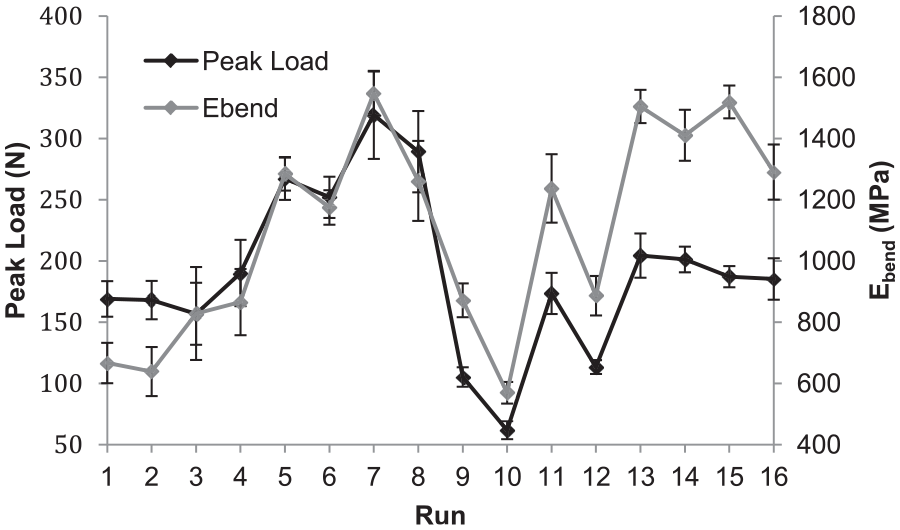
Table 2 lists the calculated mean peak load and bending modulus values from the SENB tests. The standard deviation values are given in parentheses. The data are presented graphically in Figure 9, where the error bars depict 1 standard deviation from the mean value. It is clear from Figure 9 that like the tensile properties, the SENB properties of the parts depend much on the build parameters.
Mean peak load and bending modulus calculated from SENB tests.
The highest value for peak load was 319.2 N (Run 7 – front SO, 100% infill, 4 shells, 0.15-mm layers) and the lowest 61.7 N (Run 10 – side SO, 60% infill, 1 shell, 0.4-mm layers). For bending modulus, the highest value was 1349.9 MPa (Run 11 – side SO, 60% infill, 4 shells, 0.15-mm layers) and the lowest 934.3 MPa (Run 9 – side SO, 60% infill, 1 shell, 0.15-mm layers).
The main effects’ plots (Figure 10) indicate that the level of infill is the most significant factor, and that bending strength and stiffness parameters are cooperative except in the case of SO, with load-bearing capacity optimised with a front SO and stiffness apparently favouring a side SO. However, according to the Pareto plots (Figure 11), the SO is only a significant factor for bending load and not bending modulus (at 95% confidence level). It would be expected that both the properties would be optimised by a front SO, as here the layers are perpendicular to the direction of load, whereas with a side SO, they are parallel (Figure 1). Thus, although the analysis recommends a side SO (Figure 10) for optimising bending modulus, the highest value was achieved by a front SO (1547 MPa, Run 7) and the lowest by a side SO (569.2 MPa, Run 10). The recommendation here would be to use a front SO; as the analysis shows that it is insignificant to the bending modulus, the significance to bending load makes it preferable where a component needs to be both strong and stiff.
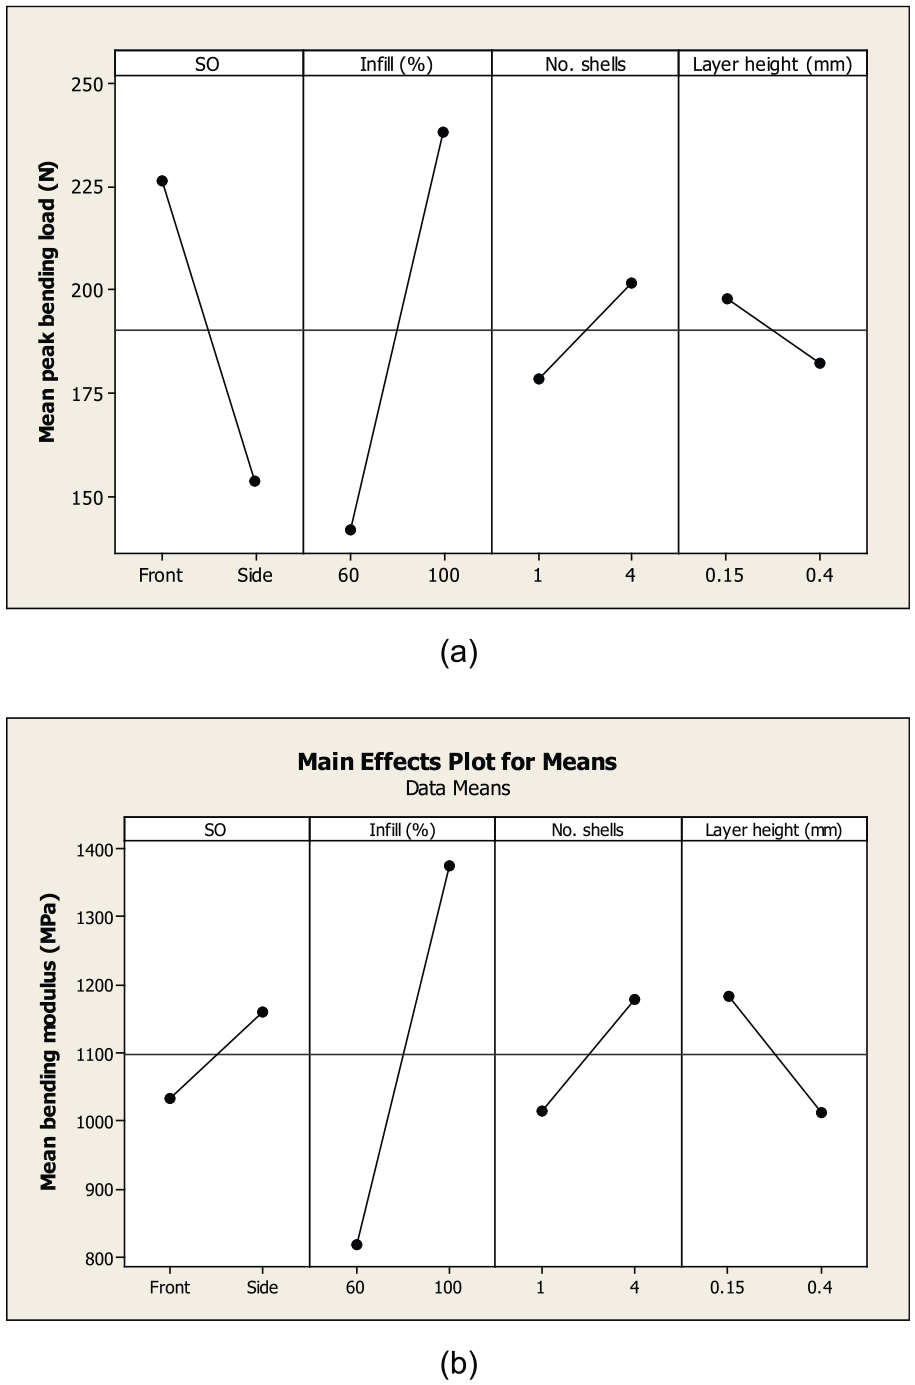
Main effects’ plots for (a) peak bending load and (b) bending modulus.
Pareto plots for (a) peak bending load and (b) bending modulus.
The level of infill being most significant (as with tensile properties) is explained by the same reasons outlined in section ‘Tensile tests’, namely that a completely solid structure (100% infill) exhibits greater stiffness than the honeycomb patterns printed at infill levels less than 100%. However, in contrast to the tensile properties, the number of shells (while still recommending a higher number according to Figure 10) is not a significant factor in bending properties (Figure 11). This is likely due to their being out of plane to the load axis (Figure 1).
The recommended parameters for optimisation of SENB properties would therefore be a front SO and 100% infill. The number of shells is not significant, nor is it significant in cost control (Figure 5). As with the tensile properties, the layer height is not a significant factor in the bending properties (Figure 11), and thus, a recommendation for incorporating cost cutting into SENB properties optimisation would be to use the maximum layer height (as was the case with the tensile properties).
Conclusion and further work
Summary of recommendations
This article reports an experimental investigation of process parameters’ effects on the tensile and notched bending properties of FDM parts. Using the DOE approach, the tensile, SENB properties and cost control results were studied as a function of four process factors, build orientation, infill, the number of shells and layer height. From the statistical analyses, specific recommendations can be made for optimisation. Table 3 breaks down the significant parameters (at 95% confidence level) affecting each output. Optimisation for both sets of properties (tensile and SENB) and for cost control (accounting for a combination of build time and part weight) is summarised in Table 4.
Significant parameters (at 95% confidence level) affecting each output.
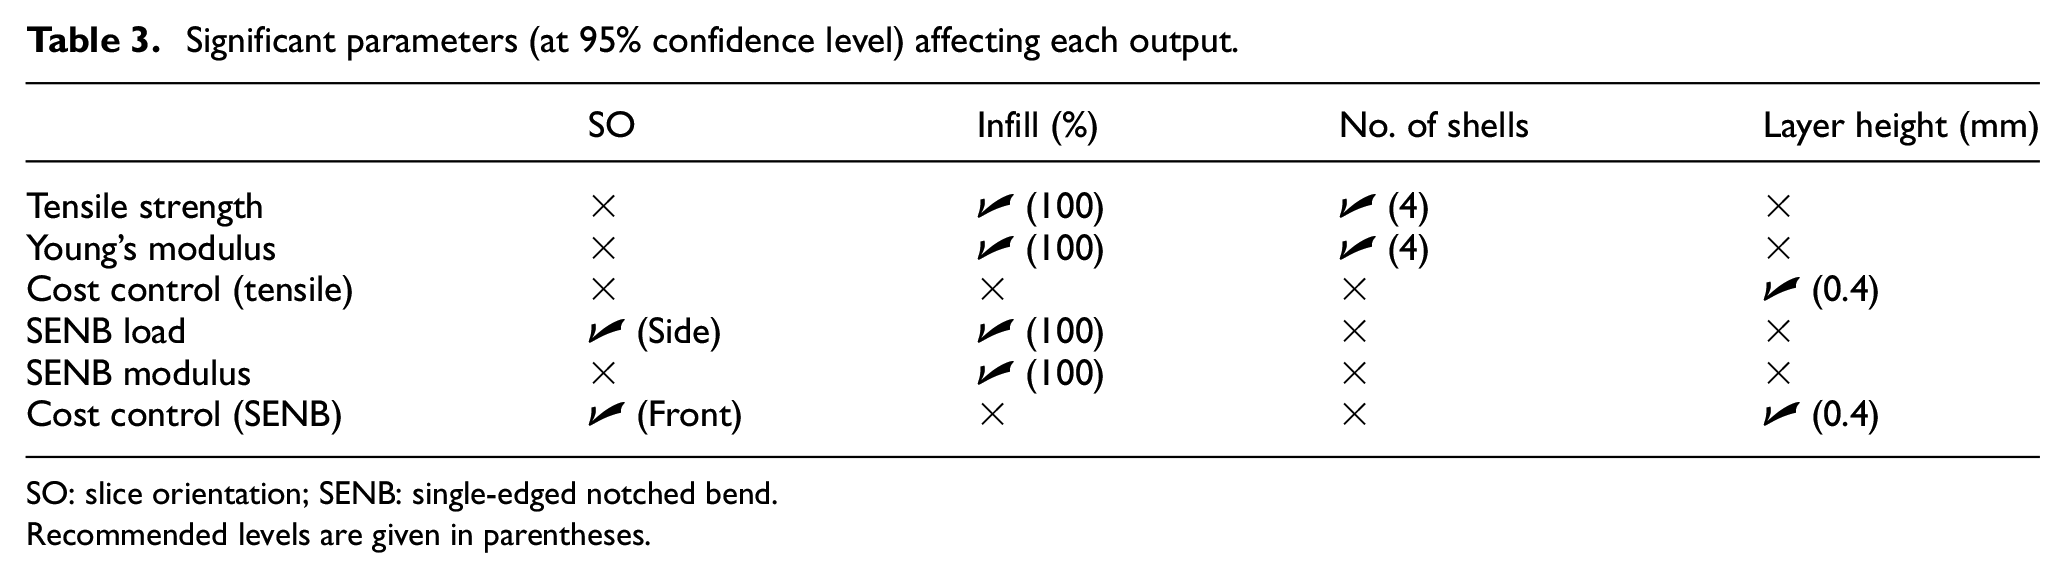
SO: slice orientation; SENB: single-edged notched bend.
Recommended levels are given in parentheses.
Recommended build parameters for optimisation of tensile and SENB properties and cost control.
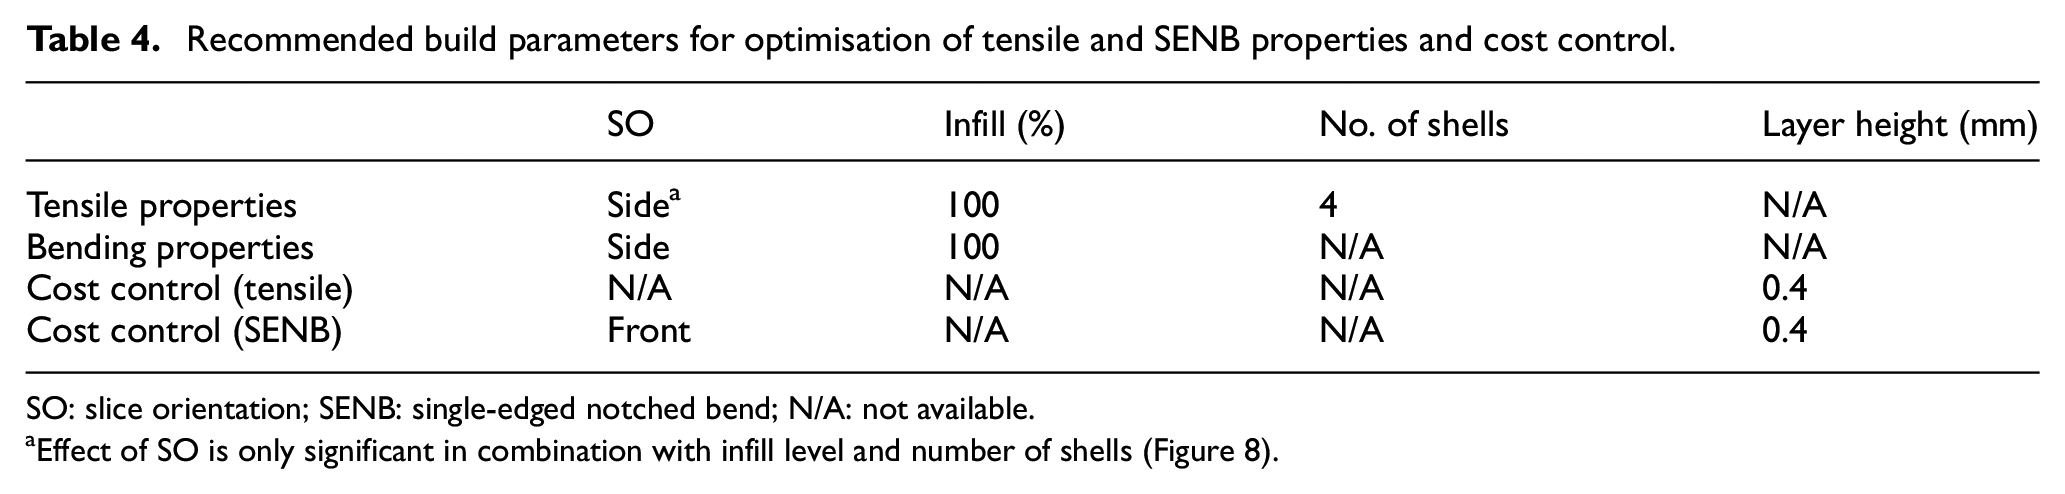
SO: slice orientation; SENB: single-edged notched bend; N/A: not available.
Effect of SO is only significant in combination with infill level and number of shells (Figure 8).
The main conclusions made based on the obtained results are as follows:
Where cost control is the principal factor (such as in RP), the highest layer height should be used, regardless of specimen type. The infill level and number of shells have no significant effect. The front SO recommendation for SENB specimens could be due to it taking less time to print relatively longer, fewer layers than relatively shorter, more layers (see Figure 1). Validation of this will form part of further work.
Both the mechanical properties tested benefit from a side SO. For tensile specimens, the effect of SO was only significant in combination with infill level and number of shells (Figure 8). For SENB specimens, the front SO recommendation for cost control is of secondary importance to the layer height. It is therefore recommended that a side SO be used when optimising load-bearing, and the front SO where stiffness is to be optimised (as the side SO is only significant in optimising peak load). Layer height was inconsequential to mechanical performance as the layers were parallel to the loading axis. The 100% infill resulted in stronger, stiffer structures.
The recommended parameters are largely cooperative across the two specimen types. The only discrepancy is that the higher number of shells significantly optimises tensile properties, while being insignificant to SENB properties. However, this can be misleading in the design of a component required to withstand both tensile and bending load, as it is unlikely that the component will need to bear both types of load in the same plane. Should a generally rectangular component be required to bear tensile load in the x-axis and bending load in the y- and/or z-axis, a side SO with respect to tensile load for a generally rectangular specimen is equivalent to a top SO in the y-axis and a front SO in the z-axis (Figure 1).
One important conclusion is that the tensile and SENB properties can be optimised while still maximising efficiency through using the maximum layer height.
Recommendations for further work
Validation of the recommendation of side SO through a DOE approach.
Expand the types of samples and properties measured to contribute to the building of a database.
Analysis and testing of real-world products where mechanical performance is critical. Selected products will require multiple mechanical performance characteristics at different loading axes. This will aid the combinational analysis and expand the work to encompass optimisation of multiple properties.
Development and verification of a mathematical model for prediction of outputs based on input parameters.
Footnotes
Declaration of Conflicting Interests
The author(s) declared no potential conflicts of interest with respect to the research, authorship and/or publication of this article.
Funding
The author(s) disclosed receipt of the following financial support for the research, authorship, and/or publication of this article: The authors would like to acknowledge the support of the Advanced Sustainable Manufacturing Technologies (ASTUTE) project, which is part funded from the EU’s European Regional Development Fund through the Welsh European Funding Office, in enabling the research upon which this article is based. Further information on ASTUTE can be found at ![]()