
Abstract
In this research work, friction stir welding of aluminium alloy AA5083-H321 is performed for optimization of the process parameters for maximum joint strength. Taguchi’s L9 orthogonal array has been used for three parameters – tool rotational speed, traverse speed and tool tilt angle. Multi-response optimization has been carried out through Taguchi-based grey relational analysis. The grey relational grade has been calculated for all three responses – ultimate tensile strength, percentage elongation and micro-hardness. Analysis of variance is the tool used for obtaining grey relational grade to find out the significant process parameters. Tool rotational speed and traverse speed are the two most significant parameters which influence most of the quality characteristics of friction stir welded joint. Validation of the predicted values done through confirmation experiments at optimum setting shows a good agreement with the experimental values.
Keywords
Introduction
Friction stir welding (FSW) was used for the first time in 1991 for laboratory research work at TWI, United Kingdom. But the process of joining two aluminium sheets through FSW was so revolutionary that it captured the instant focus of the welding experts and industrialists. FSW provided the best key solution for all the experts who were facing difficulty for joining aluminium and its alloys at higher temperature. 1 Aerospace industry and modern automobile industry got new opportunities to have a relook for better use of the most available metal on earth. Nowadays, flow of expertise in FSW and maximum use of resources with minimum waste make FSW process more valuable and more automatic joining process. 2
In FSW, a rotation tool with a pin is inserted in the weld line until the tool shoulder touches the upper surface of the plates. Frictional heat is induced between the tool shoulder and the welding plates which increase the temperature up to recrystallization temperature and the inserted pin intermixes the plasticize material to make solid-state welding. The used welded sheets may be of same or dissimilar materials. The mechanism of FSW process is shown in Figure 1. There are two sides of the welding; during clockwise rotation of the tool and forward feed, the left side is called the advancing side and the right side is called the retreating side. During welding joint, zones are formed named as (a) nugget zone (NZ), (b) thermo-mechanical-affected zone (TMAZ), (c) heat-affected zone and (d) base material which are represented in Figure 2. The central zone is the NZ where intermixing of the material is taken place. TMAZ is a zone of maximum deformation without intermixing. Heat-affected zone experiences the temperature variation without any deformation.

A schematic diagram of friction stir welding process.
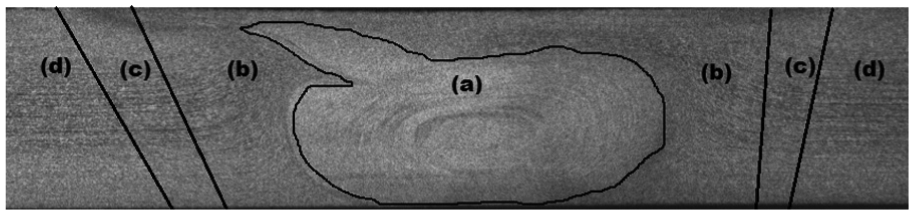
Welding zone of FSW: (a) nugget zone, (b) thermo-mechanical-affected zone, (c) heat-affected zone and (d) base material.
The solid-state welding produces welded joint without melting of the material sheets; therefore, a number of defects, for example, porosity, cracking and blow holes which appear during conventional fusion welding process, are avoided.1,3–7 In FSW, high temperature below the melting point is attained through friction between the tool shoulder and the joining sheets as well as frictional heat produced by the tool pin and the semi-solid material through the plastic flow of the materials under the tool shoulder.
The effect of different parameters on the welding joint strength has been investigated by many researchers.8–11 Taguchi with grey relational analysis (GRA) has been used by many researchers in their respective fields for optimization of processes.12–18 Taguchi technique has been used, 19 but GRA for FSW has been used rarely, as the process has been used in aviation industry and marine industry; therefore, optimization of the process is very essential for having good factor of safety at different applications. Through this article, an attempt has been made to find out the valuable results for FSW experimentation and improved joint strength.
Experimental set-up
A non-consumable tool with a concave shoulder and a flat face cylindrical pin has been used for the FSW. Two sheets of aluminium alloy AA5083-H321 have been welded through FSW process. The used material AA5083 consists of main alloying elements, that is, 4.3% Mg, 0.63% Mn, 0.076% Si, 0.11% Cr–Zn–V and remaining aluminium. Each sheet’s dimensions are 150 mm × 75 mm × 4.5 mm and the edges of each sheet have been properly cleaned and made distortion free for the proper alignment of the two mating edges. Tool steel H-13 material has been used for the welding tool. It consists of concave shoulder with diameter of 18 mm and tool pin dimensions – diameter of 6 mm and length of 4.3 mm. The tool penetration depth has been fixed at 4.46 mm from the upper touch point. Three parameters – tool rotational speed (TRS), traverse speed (TS) and tool tilt angle (TTA) – have been selected for investigation based on the review of literature and some pilot study. The selected process parameters with their three levels are given in Table 1. Input force, initial tool feed time and some other parameters have been kept constant during experimentation.
Input process parameters and their levels.

TRS: tool rotational speed; TS: traverse speed; TTA: tool tilt angle.
Taguchi-based GRA has been used through selection of L9 orthogonal array. Ultimate tensile strength (UTS), hardness and percentage elongation are the most important measures to ascertain the quality of the butt welded joint. GRA has been used to get the maximum values of the output variables. Orthogonal array L9 experiments are given in Table 2.
Average response values of different responses.

TRS: tool rotational speed; TS: traverse speed; TTA: tool tilt angle; UTS: ultimate tensile strength; EL: elongation.
The experiments have been conducted on a suitably modified vertical milling machine of Bharat Fritz Werner make. A fixture has been fabricated for proper holding of the workpiece on the milling machine table. FSW components and the arrangement of the plates have been shown in Figure 3.

Experimental set-up.
For the testing of FSW butt welded joint, tensile test specimens were prepared in transverse direction as per ASTM E8M-04 module. The prepared tensile test specimens are shown in Figure 4. All the samples are tested at room temperature at a 40-kN universal testing machine. UTS test results are presented in Table 2. Micro-hardness is an important response which also helps to predict joint quality. The NZ or stirred zone has been selected due to well intermixing of the materials. Vickers’s hardness tests have been performed for better micro-hardness. Indentation load 10 kgf has been applied for 15 s. Percentage elongation and Vickers’s hardness (HV) testing results are also given in Table 2.

Prepared tensile test specimens as per ASTM-E8.
Taguchi approach and GRA
Many researchers have used different statistical tools for optimization study of FSW process. Taguchi approach is one of the most useful techniques for single-response optimization studies used for a number of engineering problems.15,20–23 In the present scenario of rapid manufacturing and cost reducing with maximum utilization, complex processes have several quality characteristics. In such situations, several multi-response optimization techniques are needed and the Taguchi-based GRA has been used in this work.
GRA was developed in 1982 by Deng Ju-Long. 24 Grey system works like a black box concept where the known and unknown factors are put together to get optimized responses. GRA uses normalization of data to calculate grey relational coefficients (GRCs) and grey relational grades (GRGs). It calculates the optimum arrangement, and the analysis of variance (ANOVA) is applied for the prediction of optimum GRGs as given by Flow chart 1.

Steps for grey relational analysis.
UTS, micro-hardness and percentage elongation of FSWed joint are very important quality factors. All these characteristics are of ‘larger-the-better’ type and their maximum values are sought simultaneously.
The first step is to create grey relational generation with values between 0 and 1. This generation is achieved for all the three quality characteristics – smaller-the-better, larger-the-better and nominal the best. For this investigation, all the selected quality characteristics are of the type larger-the-better, and grey relational generation is calculated by equation (1)24–26

where
Now GRCs have been calculated with the respective deviation calculations as given in equations (2) and (3)24,26

where
GRC for each experiment of L9 orthogonal array has been calculated through equation (3). The final step of calculation of GRG is performed for calculating the relationship strength between the reference series and the compatibility series. Its value varies between 0 and 1. Higher value of GRG shows better relationship and it is considered as an ideal case. GRG is the average summation of GRCs. It is calculated by the following equation (4)

where
Larger value of GRG indicates that the corresponding experimental results are closer to the ideal value or normalized value.
Results and discussion
Calculation of signal-to-noise ratio
The average values of all the responses have been reported in Table 2 with the input parameter settings. In the first part of the analysis, signal-to-noise (S/N) ratios for all three responses have been calculated. As mentioned earlier, higher values of UTS, HV and percentage elongation give better welding performance; therefore, equation (5) was used for the calculation of S/N ratio. Three iterations of the responses have been performed through mechanical testing. The FSW joint testing results with S/N ratios are given in Table 3

where n is the number of experiment replications and yijk is the response variable value of the ith performance characteristic in the jth experiment at the kth trial.
S/N ratios of different responses.

S/N: signal-to-noise.
Data processing and calculation of deviation sequence
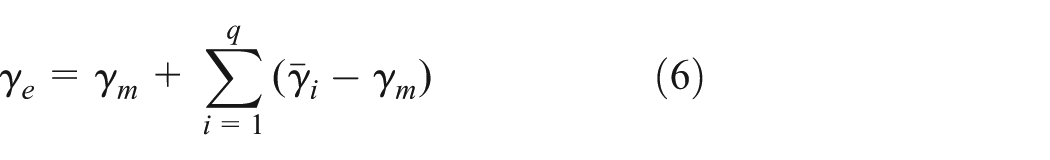
The next part of the analysis is to normalize S/N ratio of each response using equation (1). The results are presented in Table 4. Calculations of Experiment 1 for UTS, EL and HV are given as follows

Sequences of responses after data processing and deviation sequence.
UTS: ultimate tensile strength; EL: elongation.
For calculating GRCs, the deviation sequences were determined, and the results are presented in Table 4. For Experiment 1, deviation sequence as determined from equation (2) is given as follows

Estimation of GRCs and grades
The deviation sequences as given in Table 4 were used for estimation of GRCs through equation (3). The distinguished coefficient (ζ) has been assigned a generalized value of 0.5 for all performance characteristics. For calculating GRCs, equation (3) has been used and the results have been reported in Table 5. The sample calculation for Experiment no. 1 is given as follows

Estimation of GRCs and GRGs.

GRC: grey relational coefficient; GRG: grey relational grade; UTS: ultimate tensile strength; EL: elongation.
All the values of GRCs for all nine experiments have been calculated using equation (1). GRGs for all performance characteristics were determined using equation (4). Weightage for performance characteristics UTS, EL and HV is 0.5, 0.3 and 0.2, respectively, which has been decided according to the importance of the output parameter for practical application. GRG for Experiment 1 is calculated as

All nine experiments’ GRCs have been used for calculating GRGs through equation (4). All the values of GRGs randomly vary between 0 and 1. As the value of GRG reaches maximum, it represents strong relationship between the reference sequence and the comparability sequence.
This investigation of optimization of the complex multiple response characteristics of FSW has been transformed into simple optimization of single GRG. Taguchi approach is best suited for single-response optimization in the form of GRG. The GRG values corresponding to the three levels of the selected process parameters and the main effects in terms of GRG are reported in Table 6.
Grey relational grade for all three levels.

Estimation of optimum levels of input process parameters
After calculation of the average value of GRG for each level of the process parameters, the maximum value of GRG is selected for each process parameter. The bold values of GRG in Table 6 represent the maximum values among the three levels for each process parameter. These values correspond to TRS of 950 r/min, TS of tool of 28 mm/min and TTA of 3° for better performance characteristics as shown in Figure 5. It is revealed from Figure 6 that the optimum values of the process parameters give the maximum values of GRG.

Plots of signal-to-noise ratio of quality characteristics.

Plot of main effects of grey relational grade.
Implementation of ANOVA
ANOVA is implemented to establish the significance and contribution of each process parameter to the GRG value. Table 7 represents the ANOVA results and the percentage contribution of each factor.
ANOVA results for grey relational grade.

TRS: tool rotational speed; TS: traverse speed; TTA: tool tilt angle.
The tabulated F-ratio at 95% confidence level is 3.2296. As seen from the ANOVA Table 7, there are two process parameters – TRS and TS – which have 55.18% and 36.64% contribution on GRG, respectively. TTA has an insignificant contribution of 5.63% on the GRG value.
The significant parameters and their optimal level selection indicate that the plastic flow of the material under the tool plays an important role for higher joint strength. Proper mixing of the materials makes FSW joint more efficient; in other words, heat generation is an important characteristic which is responsible for joint strength. During lower heat generation, two welded materials remain separate resulting in poor joint strength. The higher heat generation is also a reason for poor joint strength, because higher heat makes grain growth or second phase grains of larger size due to which the size of the heat-affected zone becomes large resulting in a decrease in tensile strength and micro-hardness. Higher tool TS also produces low-quality weld. These situations lead to different defects such as pinholes and cracks in the welding zone.15,16
Optimal GRG value prediction and calculation of confidence interval
After calculation of the optimum value for each quality characteristic, optimal GRG value has been calculated using equation (5) for prediction and verification of improvement in GRG as given in equation (6)
The predicted optimum values are listed in Table 8. The value of

where
Here, R has a value of 3; total no. of experiments (N) = 9;
Actual and predicted values of grey relational grade.
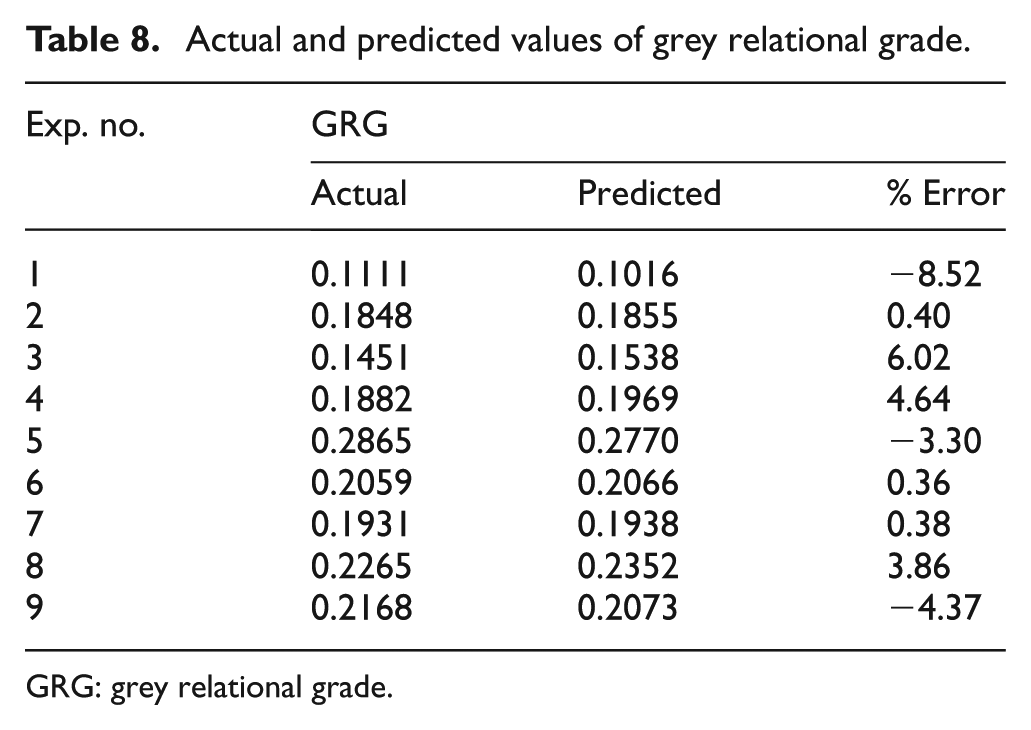
GRG: grey relational grade.
The calculated

Comparison between actual GRG and predicted GRG.
Confirmation experiments and GRG linear mathematical model
For the verification of the predicted GRG, a confirmation experiment was performed. The average values of UTS, %EL and micro-hardness are obtained as 314.3 MPa, 5.8% and 77 HV, respectively. The FSW joint at the optimized parameter setting is shown in Figure 8.

Visual view of (a) FS welded joint’s front side and (b) back side of the FS welded joint.
Scanning electron microscopy (SEM) testing of the confirmation experiment reveals that high compactness of the small grains around the centre weld line provides higher strength. The microstructure of the advancing side and the retreating side of the NZ is shown in Figure 9.
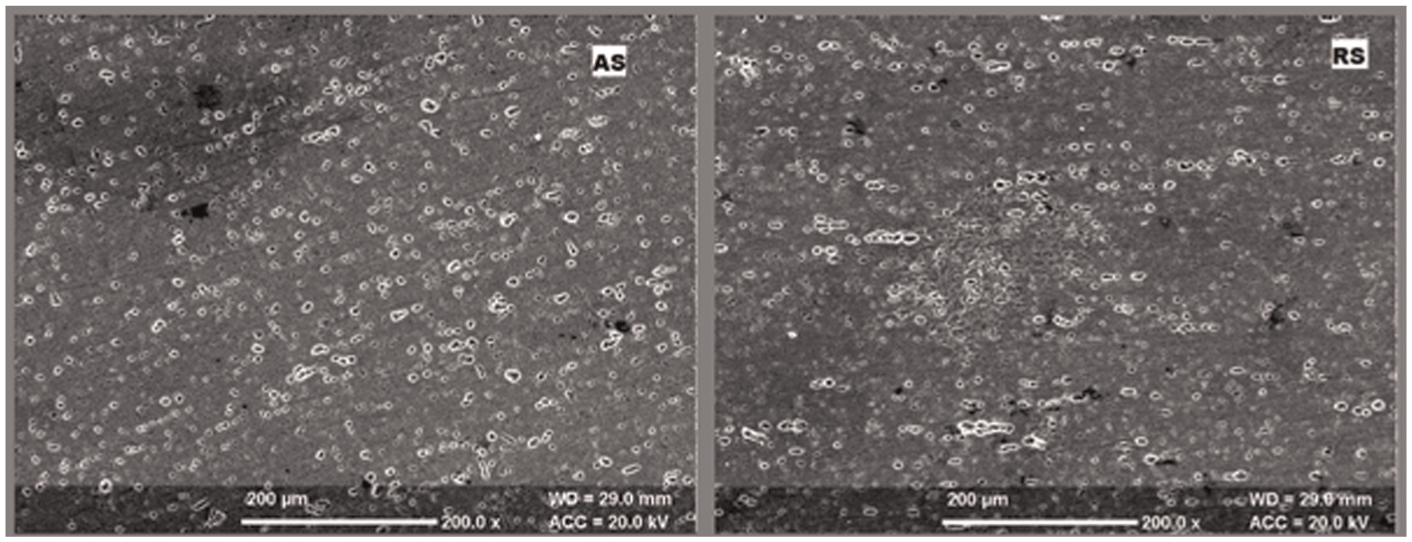
SEM microstructure images of advancing side (AS) and retreating side (RS).
During the FSW, the plastically deformed soften region has been replaced by the small equiaxed microstructure grains. The general linear model for GRG has been established through mathematical regression analysis of three parameters at three levels given in equation (8). A data set of the predicted GRG has been created through the developed linear model as reported in Table 8. The error difference between the actual and predicted values is −8.52 to 6.02. The adequacy of the developed mathematical model is tested using R2 value which falls between 0 and 1

The current mathematical model has R2 value of 97.46% which is near to 1. Such a high value of R2 indicates a good correlation between the actual values and the predicted values of GRG.
Conclusion
In this research study, Taguchi L9 orthogonal array has been used for multi-response optimization through GRA. FSW process parameters have been optimized through Taguchi-grey relational approach using GRG. The following conclusions have been drawn from this study:
The research study reveals that the optimum values of the process parameters for higher UTS and higher micro-hardness are TRS of 950 r/min, TS of 28 mm/min and TTA of 3°.
Two input parameters are dominating for FSW. The percent contributions of these parameters – TRS and TS in affecting the GRG value – are 55.18 and 36.64, respectively, as evidenced by ANOVA.
Taguchi with GRA provides a better optimization solution for FSW. The existence of the confirmation experiments’ values within the predicted range of the characteristics demonstrates it.
This investigation suggests that the complex optimization of multi-response problems can easily be simplified through Taguchi-based GRA and joint strength also enhanced at optimized settings.
Footnotes
Acknowledgements
The authors would like to acknowledge National Institute of Technology, Kurukshetra, India, for providing requisite facilities to accomplish this work.
Academic Editor: Alokesh Pramanik
Declaration of conflicting interests
The author(s) declared no potential conflicts of interest with respect to the research, authorship, and/or publication of this article.
Funding
The author(s) received no financial support for the research, authorship and/or publication of this article.