
Abstract
In this article, a grey–fuzzy-based algorithm with the Taguchi method is proposed to find the optimal process parameters’ setting for submerged arc welding process of AISI 1518 grade steel on the multiple performance characteristics such as tensile stress, toughness and hardness of weldment. Various process parameters, such as wire feed rate, stick out and traverse speed of welding process, were exposed by investigation. The proposed algorithm, coupling the grey relational analysis with the fuzzy logic, obtains a grey–fuzzy reasoning grade to evaluate the multiple performance characteristics according to the grey relational coefficient of each performance characteristic. Through the grey–fuzzy logic analysis, the optimization of multiple performance characteristics can be converted into the optimization of a single grey–fuzzy reasoning grade. Finally, the process parameters are optimized by the Taguchi method. The optimal process parameter combination becomes Wf-3 So-1 Ts-3, that is, the wire feed rate at level 3 (2 m/min), stick out at level 1 (20 mm) and traverse speed at level 3 (0.9 m/min) for maximum tensile stress and toughness and minimum hardness of weldments. It is also observed stick out on the overall mechanical property is more significant compared with other welding parameters (wire feed rate, traverse speed).
Keywords
Introduction
The submerged arc welding (SAW) process is a versatile process, as it gives best quality, saves time, reduces cost, improves repair procedure and process control, and increases efficiency and productivity. 1 It is mainly characterized by multiple process parameters influencing multiple performance outputs such as mechanical–metallurgical properties or characteristics, feature of bead geometry of weldment as well as the heat-affected zone (HAZ). 2 In SAW process, it is important to optimize the welding process parameters to achieve good welding performance. 3 Weld quality plays an important role as it improves material strength, hardness and toughness of the product, and these mechanical properties of a weldment are largely influenced by process parameters such as wire feed rate, stick out and traverse speed. Besides, direct and interactive effects of process parameters influence weld quality. Datta et al. 4 observed that electrode stick out seems to be an important process parameters in SAW with its direct significant effects on weld response parameters such as tensile strength, yield strength, toughness and hardness of weld. With increased stick out, hardness of weldments increases and yield strength and impact values decrease. Srivastava et al. 5 realized that the mechanical properties of weldment are influenced by the composition of base material. Smith et al. 6 studied that in weld metal, there is a decrease in yield strength but increase in toughness with increased heat input. Yayla et al. 7 observed that the welding methods have significant effects on the mechanical properties of weldments. Ramaswamy et al. 8 concluded that with the increase in plate thickness, the hardness and toughness increase. It is very important for the proper selection of process parameters to improve multiple performance characteristics. In most of the cases, the optimization has been performed using single-objective function. Fuzzy–grey relational analysis based on Taguchi method is the significant way for optimizing process parameters of weldment. Taguchi method has been widely applied to reduce losses in the manufacturing process and also used to reduce the number of experiments required. Literature highlights that Taguchi method is a very popular process optimization technique which saves time, but the method fails to solve multi-objective optimization problems.9–11 Many researchers are using different hybrid techniques to overcome this limitation: grey relation analysis theory 12 and desirability function approach (Kumar et al., 2000) 13 have been applied with Taguchi method, which can be easily optimized to solve the problem.14,15
The grey relation analysis theory introduced by Deng16,17 was used for solving the complex interrelationship among the multi-objective in various fields of welding manufacturing. Tarng et al. (2002) applied grey-based Taguchi method for optimization of SAW process parameters in hard facing. Datta et al. 12 also used grey relational analysis with Taguchi method to optimize multiple features of SAW process.18–20 Nandi and Datta (2010) proposed grey-based Taguchi method on quality loss function and it minimizes quality loss.
Fuzzy logic is also found to be a useful technique to solve optimization problem in the field of welding. It was introduced by Zadeh 21 to find the overall performance with respect to response characteristics. After Bellman and Zadeh 22 described the decision-making methods in fuzzy environments, an increasing number of studies have dealt with uncertain fuzzy problems by applying fuzzy set theory.23–25 Using fuzzy logic, optimization of complicated multiple performance characteristics can be converted into the optimization of a single grey–fuzzy reasoning grade or single Multi Performance Characteristic Index (MPCI), in which the optimum-level setting of process variables could be found by maximizing MPCI. 26 Therefore, optimization of the performance characteristics with fuzzy logics has been considered in this study. Tarng et al. 15 applied fuzzy logic in the Taguchi method to optimize the SAW process with multiple performance characteristics. Liu et al. 27 combined fuzzy-based grey relational analysis successfully to optimize multi-characterize problems in different processes.28,29
Thus, in this study, a new hybrid technique has been introduced with Taguchi method to determine the optimal process parameter. This approach consists of three major steps; in the initial step, grey relational analysis has been used to normalize the signal-to-noise (S/N) ratio of each response parameter. The second step deals with the execution of fuzzy interface system (FIS) in order to aggregate multiple performance characteristic into a single performance characteristic. These equivalent performance characteristics were then used in the last step to optimize the welding process parameter by Taguchi technique.
Experimental procedure
Material
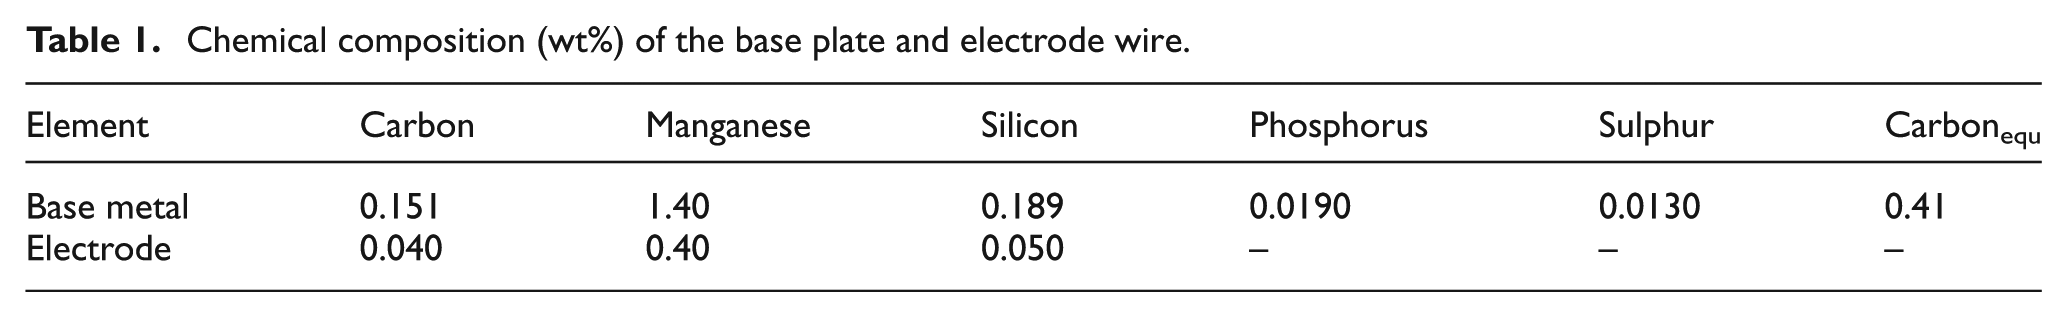
The base material used for experiments is AISI 1518 grade steel plate of sizes 200 mm × 100 mm × 12 mm which were cut from a big sheet, and 3.15-mm-diameter (∅) mild steel electrode coated with copper was used in this experiment. Table 1 shows the chemical composition of the base material and electrode wire.
Chemical composition (wt%) of the base plate and electrode wire.
Welding procedure
The experiment is conducted on SAW machine (Machine No.: Model PS-1200(F); Ador Welding Ltd, India) as shown in Figure 1 and welding is completed in a flat position, on each of the workpieces by forming a bead-on-plate. Flux used in this experiment is fused-type silicon product with grain size 0.2–1.6 mm with basicity index 1.6. Chemical composition of flux is Al2O3+ MnO2-35%, CaO + MgO-25%, SiO2+ TiO2-20% and CaF2-15%.
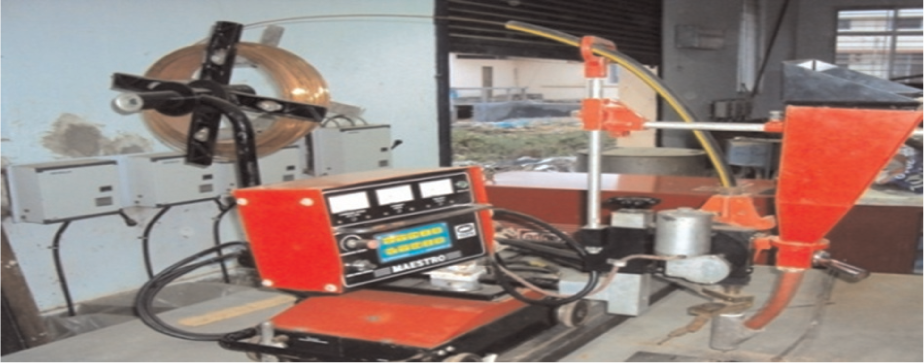
Submerged arc welding machine.
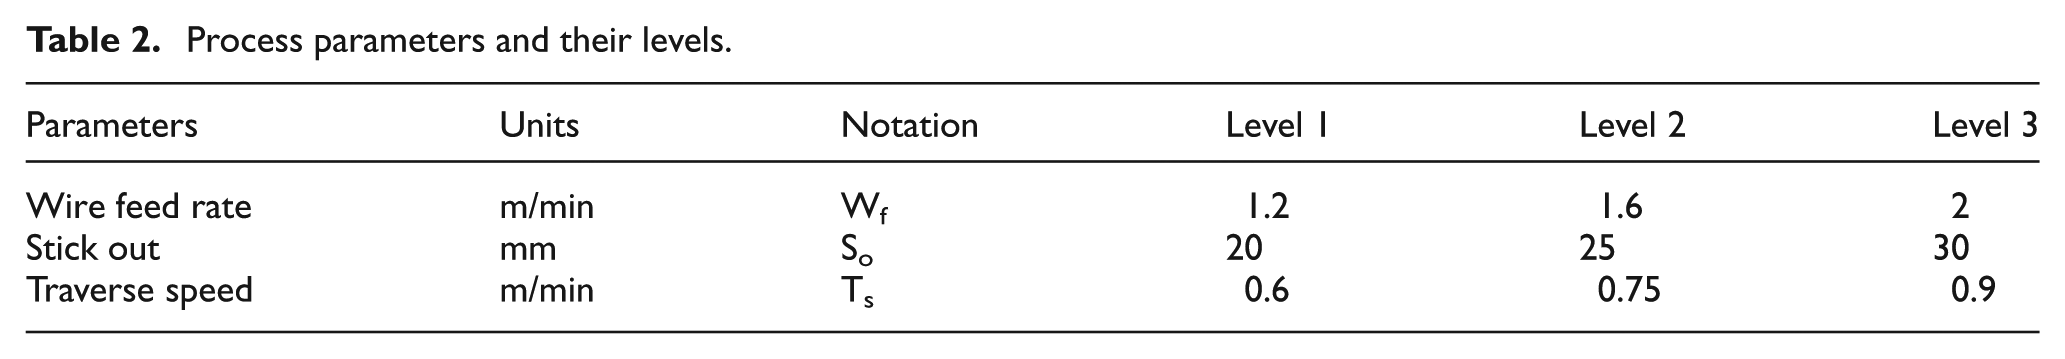
The experiment is also accompanied for three different values of wire feed rate, stick out and traverse speed based on Taguchi’s orthogonal array. The welding parameters (wire feed rate, traverse speed and stick out) and their associated levels are chosen on the basis of trial-and-error method by varying one factor at a time and also based on the literature study. Based on that study, wire feed rate, traverse speed and stick out were identified as the process control factors and the levels of the factors have been decided. The selected process control parameters and corresponding parametric values at different levels have been provided in Table 2.
Process parameters and their levels.
After completion of welding, solidified slag is removed and welded plate cooled at room temperature. Different welded specimens for testing are shown in Figure 2.
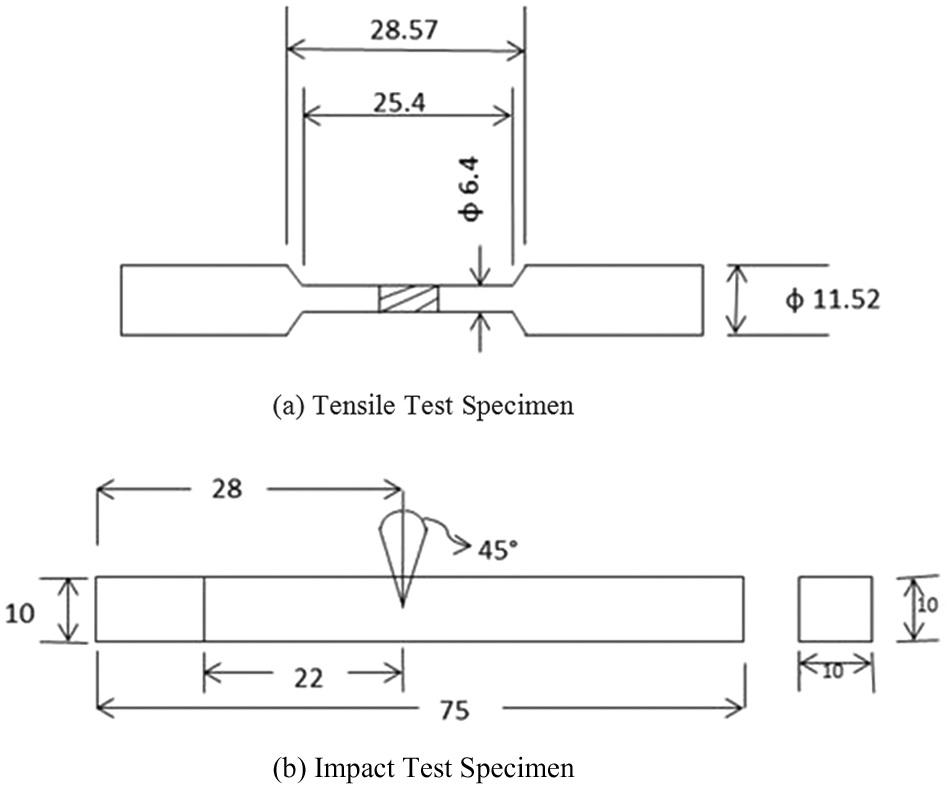
Different welded specimens for testing (all dimensional in mm): (a) tensile test specimen and (b) impact test specimen.
Inspections and testing of weldments
In the present analysis, the tests of the mechanical properties, namely, ultimate tensile strength, toughness and hardness of weld zone, have been carried out for all the welding conditions. First, the test plates are visually inspected for detection of any defect or irregularity of weldment, and after that various mechanical tests such as tensile stress, toughness and harness are carried out. For these purposes, different essential machines with various specifications used are given below.
Tensile test specimen
The tensile test specimen was prepared as per American Society for Testing and Materials (ASTM) E8 30 standards at ambient temperature and tested in a hydraulically controlled universal testing machine (Model No.: HL 59020) of 600 kN. The specimens are fixed at standard jaw fitted with the machine and 30.30 kN load is applied at constant strain rate 0.1506. At each experiment condition, three specimens are tested and average values are taken.
Toughness test specimen
As from the literature, it has been seen that the toughness of weld zone is lower as compared to the other zones of weldment. So, in this study, these tests are carried out at welding zone. Three specimen tests are carried out and the average values of tests are considered in this test. To find the toughness of each of the samples, Charpy V-notch impact test was carried out at room temperature (30 °C) as per ASTM E23 31 standards.
Hardness test specimen
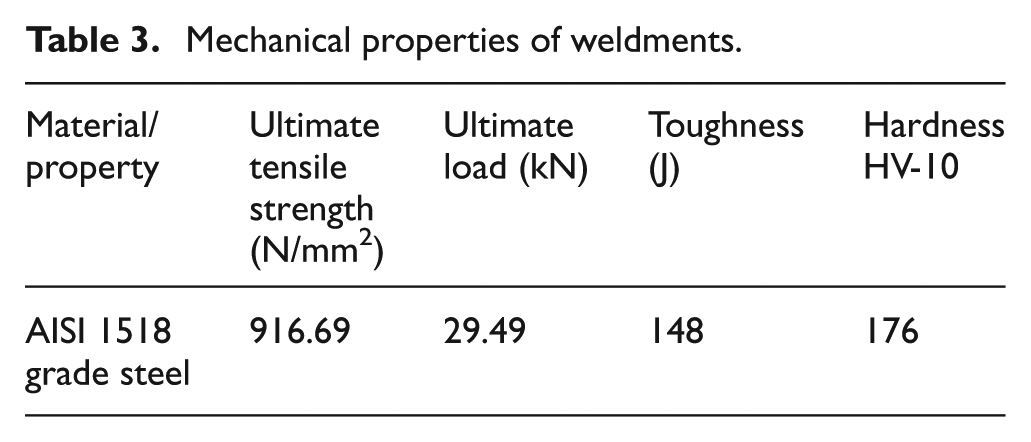
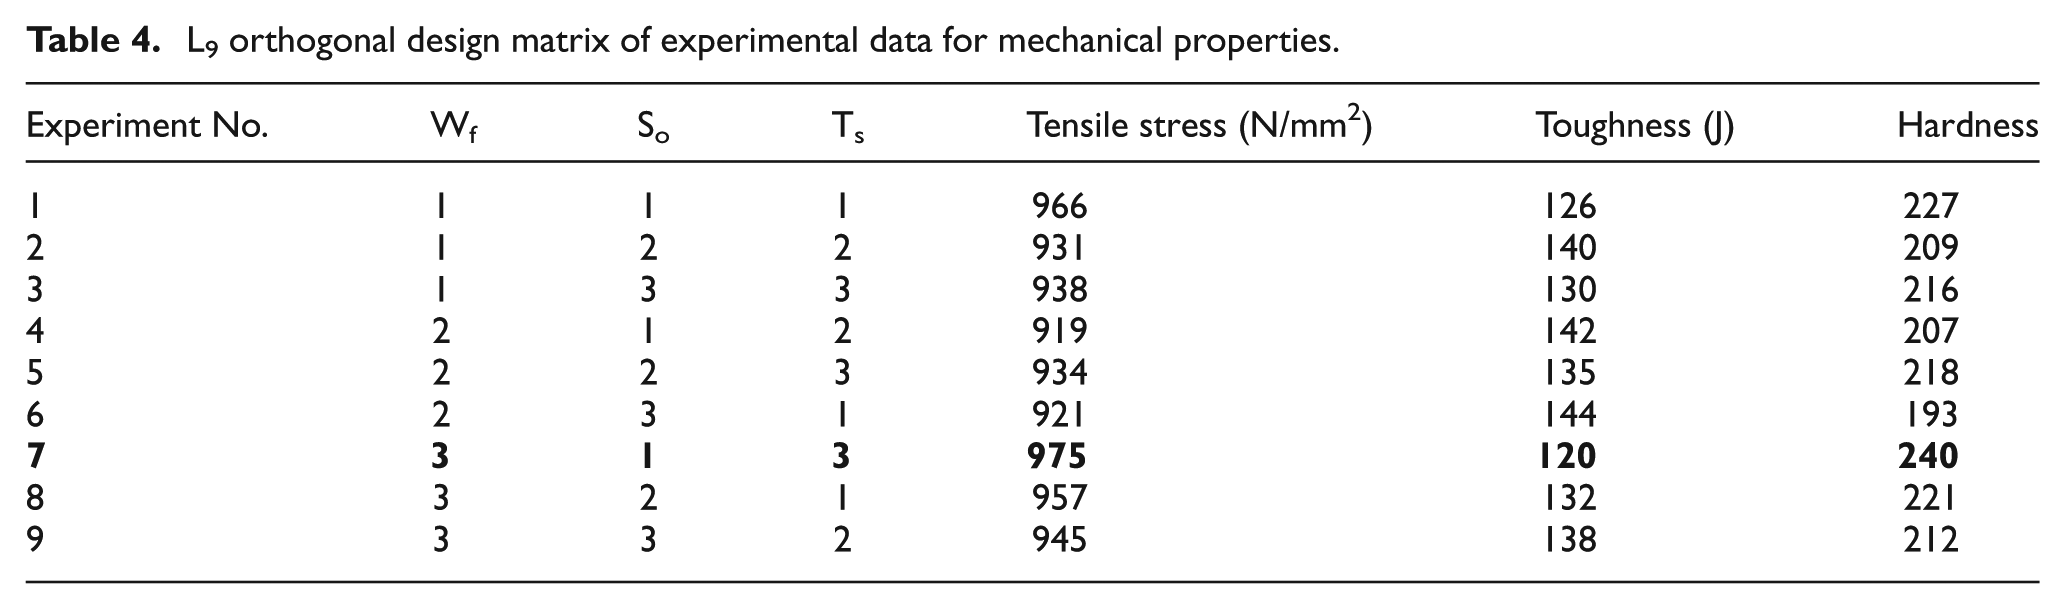
Hardness test specimen of the weld zone of all the samples has been carried out by semi Vickers hardness tester machine on B-scale using 100 kg major load. Hardness for each of the samples has been measured on the cross section of the welded plate. About three readings have been taken on each of such surfaces of the samples. Finally, the average hardness value is noted. Table 3 shows the mechanical properties of weldment. In this work, Taguchi’s L9 (3 × 3) orthogonal array design matrix has been selected and it is shown in Table 4.
Mechanical properties of weldments.
L9 orthogonal design matrix of experimental data for mechanical properties.
Analysis and discussion
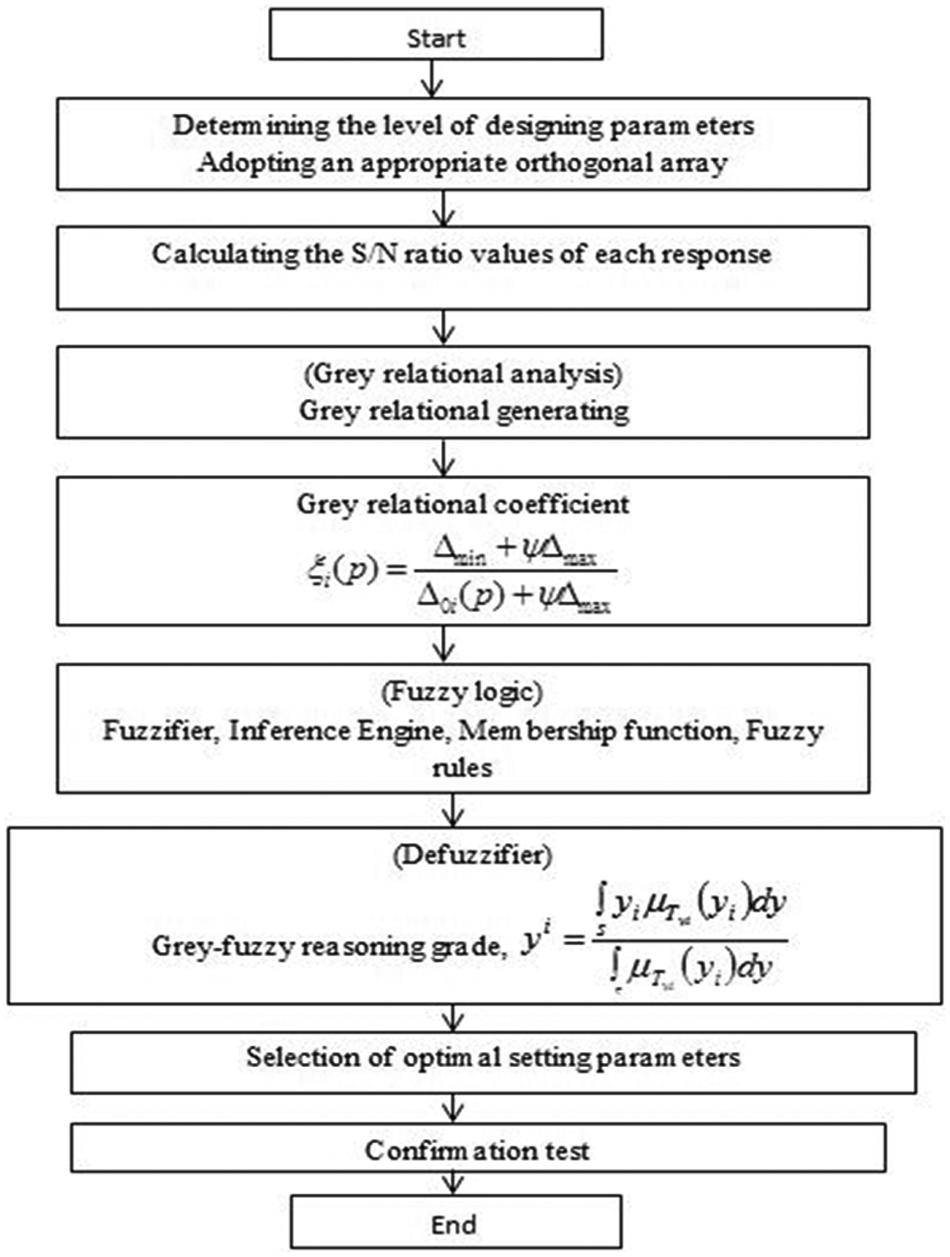
The algorithm of grey relational analysis and fuzzy-based Taguchi approach has been used to determine the optimal combinations of the process parameters for welding process which is described step by step as follows.
S/N ratio
First, S/N ratio is calculated for the corresponding responses, that is, tensile stress, toughness and hardness. S/N ratio is used to represent a performance characteristic. There are three categories of performance characteristic in the analysis of the S/N ratio, that is, the lower-the-better (LB), the higher-the-better and the nominal-the-better. In this article, to obtain optimal process parameter of weldments, the higher-the-better for tensile stress and toughness is considered. The function for the higher-the-better performance characteristic can be expressed as
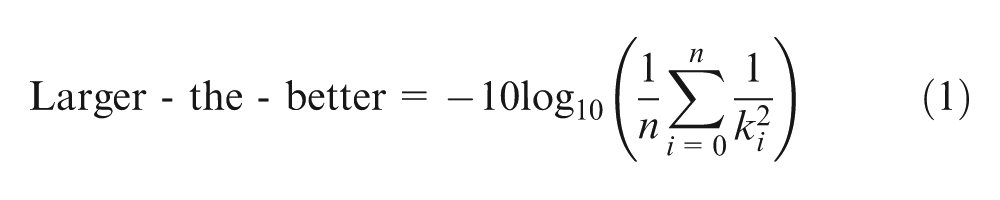
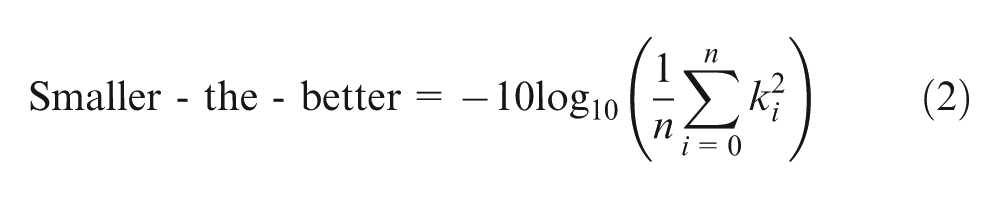
Here, ‘n’ is the number of measurements, and k the measured ith characteristic value. However, for hardness LB performance characteristic is chosen. For the LB performance characteristic, the function can be expressed as
In the Taguchi method, the S/N ratio is used to determine the deviation of the performance characteristic from the desired value. The experimental S/N ratio values of tensile stress, toughness and hardness of weldment are given Table 5.
S/N ratios of mechanical properties of weldment.
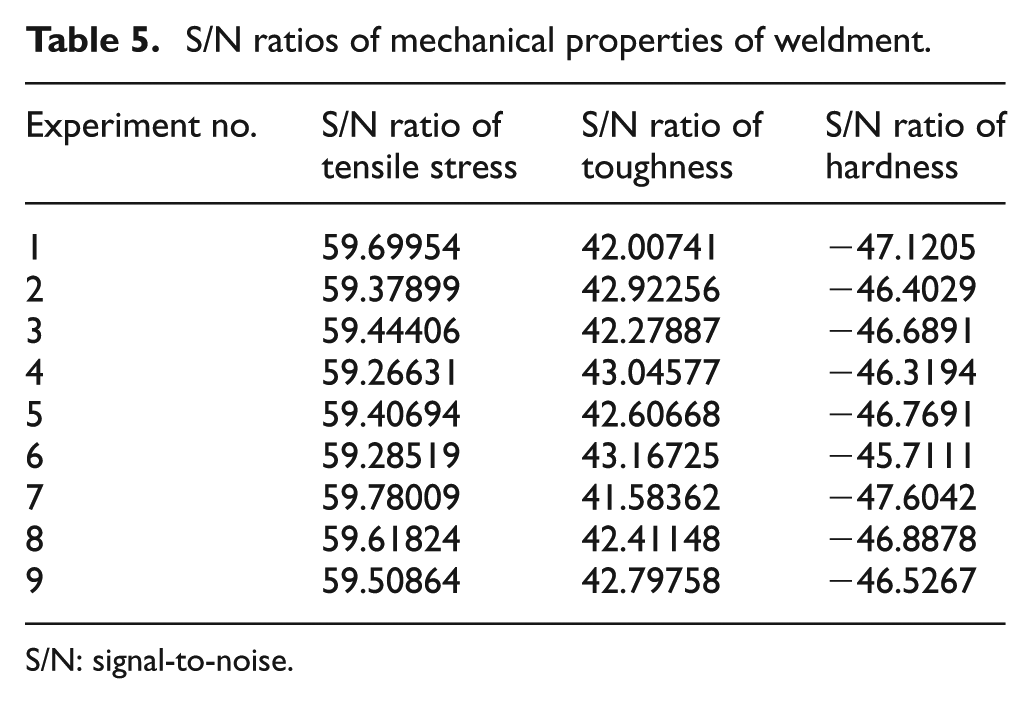
S/N: signal-to-noise.
Grey relational analysis
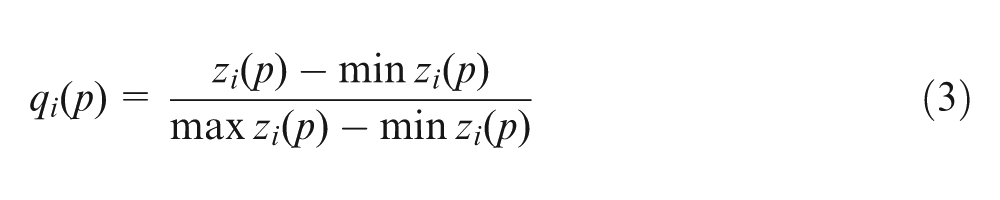
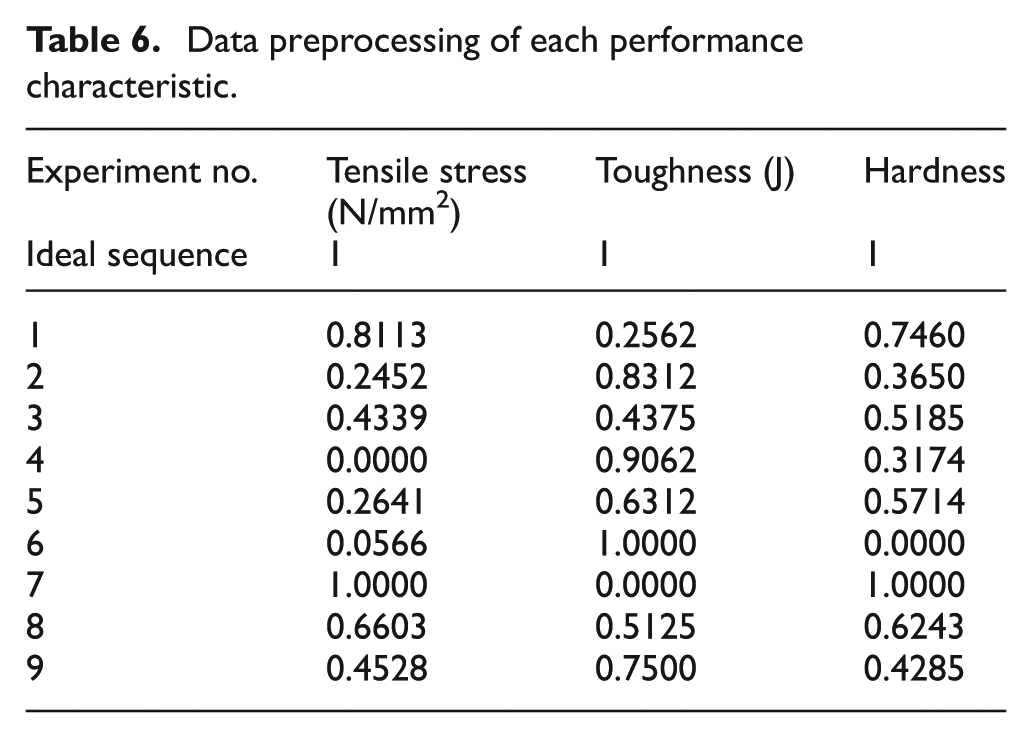
In this study, it has been mentioned that tensile stress and toughness should be as the higher-the-best, and hardness (Keshav Prasad and Dwivedi, 2008) of weldments as the smaller-the-best as possible for good weld. In grey relational analysis, the S/N ratio values are normalized for each response from 0 to unity. This process is known as data preprocessing or grey relational generation. The normalized values reveal the condition of better performance in the grey relational analysis. The larger value of the normalized values can be expressed as better performance, and the best-normalized values will be equal to 1. Next, the grey relational coefficient is calculated from the normalized experimental data to express the relationship between the desired and actual experimental data. In data preprocessing method, 32 S/N ratio of tensile stress and toughness as the larger-the-better criterion has been adopted. The normalized values can be calculated using equation (3)
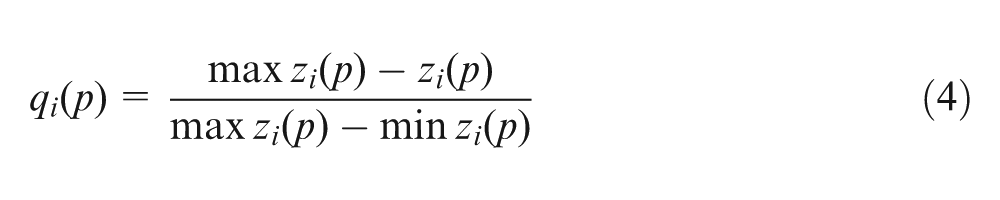
However, for hardness, LB criterion has been considered. The normalized values can be calculated using equation (4)
where
Data preprocessing of each performance characteristic.
The grey relational coefficient
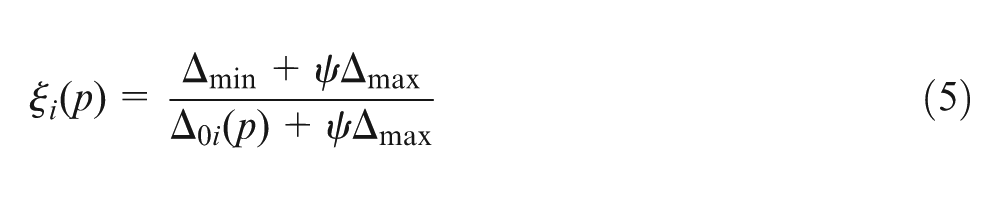
where
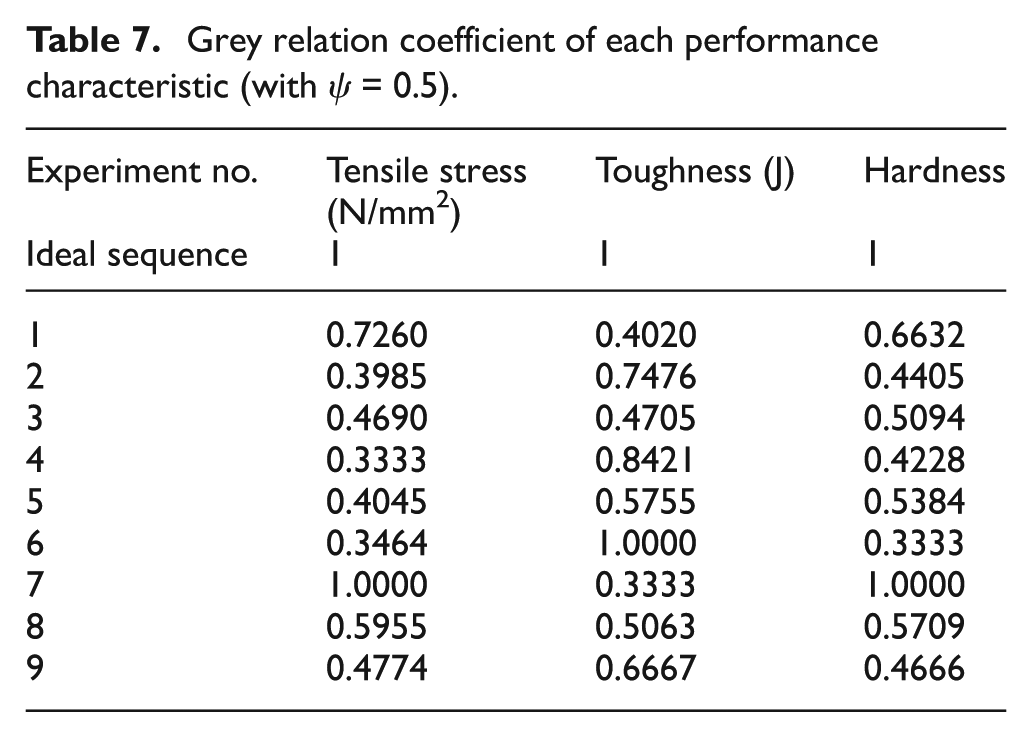
Grey relation coefficient of each performance characteristic (with ψ = 0.5).
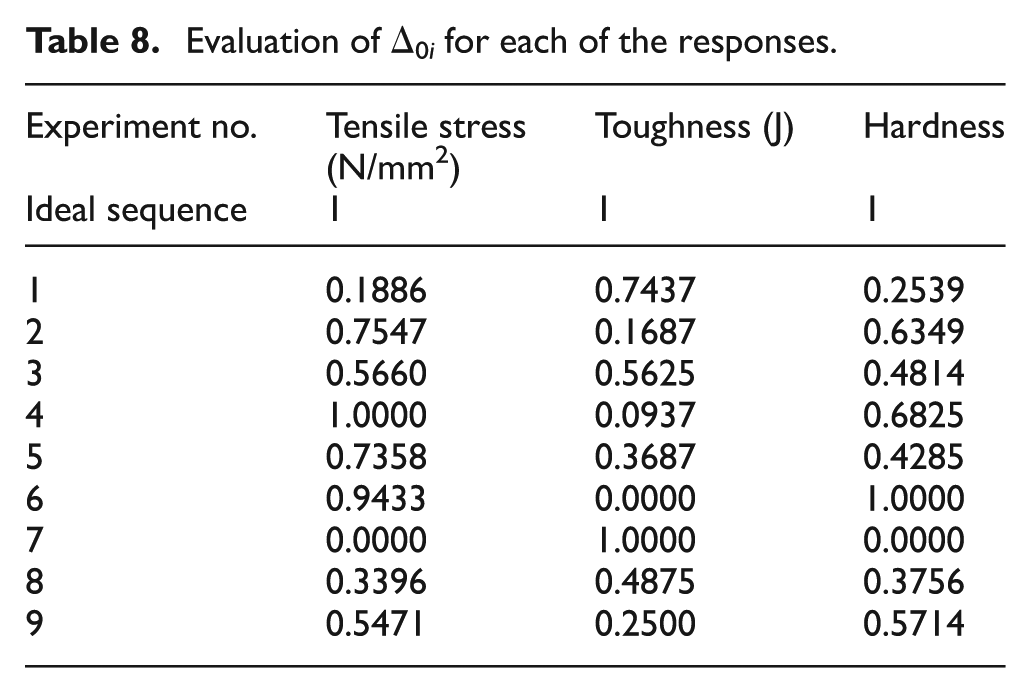
Evaluation of Δ0i for each of the responses.
Fuzzy logic
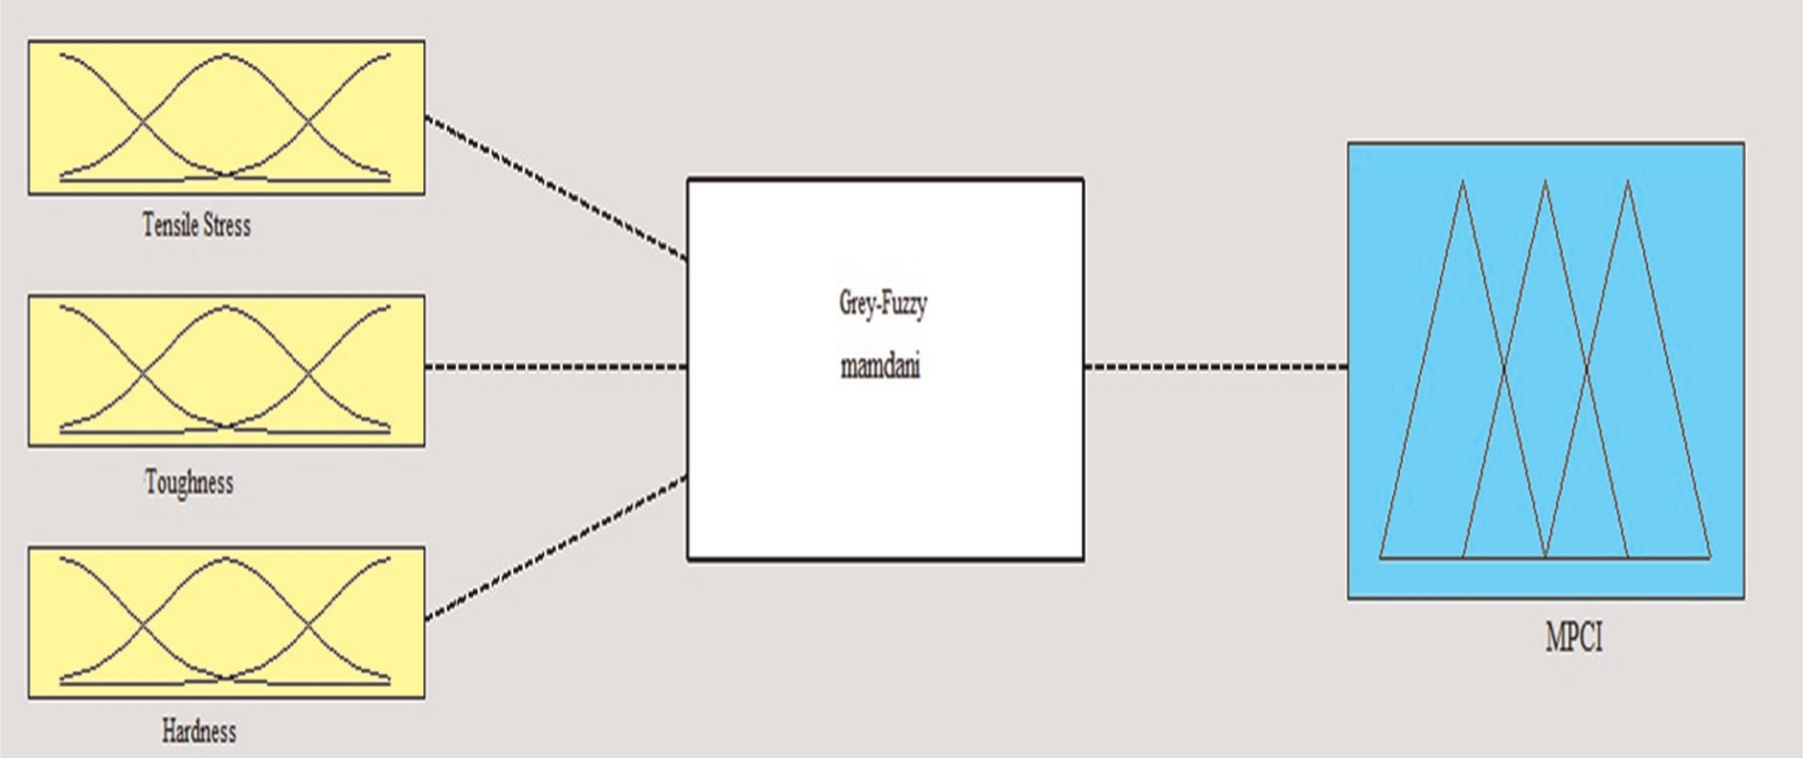
In the fuzzy logic analysis, three main stages are involved during the development of the model: formation of membership function (MF) (fuzzification), definition of the expert rules and selecting defuzzification method. The fuzzifier uses MFs to fuzzify the grey relational coefficient first and a fuzzy inference on fuzzy rules in order to generate a fuzzy value. Finally, the defuzzifier converts the fuzzy value into a grey–fuzzy reasoning grade. The structure of the three-input-one-output fuzzy logic unit is shown in Figure 3.
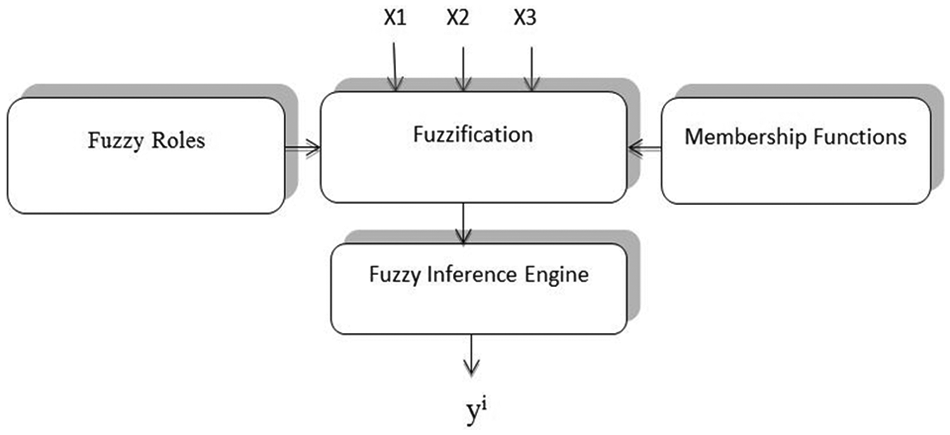
Structure of the three-input-one-output fuzzy logic.
MF
MF describes the fuzziness in a fuzzy set whether the elements in the set are discrete or continuous in graphical form. The MF essentially expresses all fuzziness for the particular fuzzy set; its description is the essence of a fuzzy property or operation. Some types of MF shapes are triangular, trapezoidal and Gaussian.
Fuzzy expert rules
The relationship between
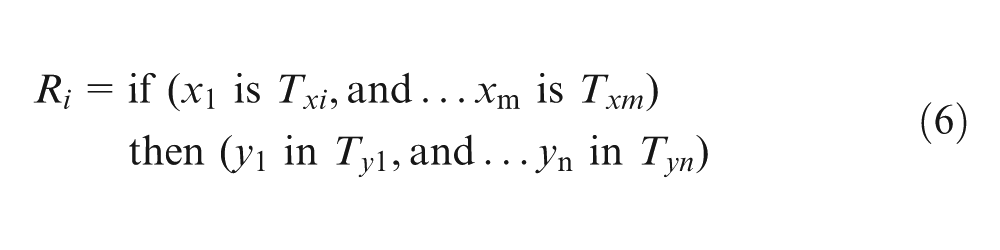
Inference mechanism
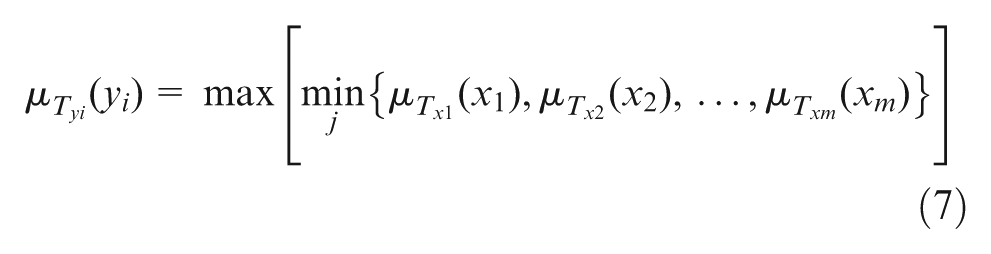
The inference mechanism will generate the output in linguistic form. Based on the fuzzy rules, the Mamdani implication method is employed for the fuzzy inference reasoning in this study. Here, M is the total number of fuzzy rule, xj (j = 1, 2, …, m) is the input variable, yi (i = 1, 2, …, n) is the output variable; Txj and Tyi are the fuzzy sets modelled by MFs
Defuzzification
Defuzzification converses the fuzzy quantity represented by MF to precise or Crisp quantity. The linguistic output will pass through defuzzification process to be in normal data form. In general, there are several methods for defuzzifying fuzzy sets. The centre of gravity, one of the most popular methods for defuzzifying fuzzy output functions, is employed in the study. The formula to find the centroid of the combined outputs
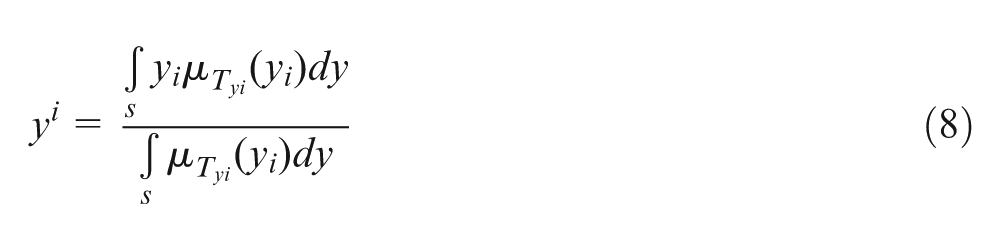
where the non-fuzzy value
Structure of the grey–fuzzy logic for the optimal process parameters.
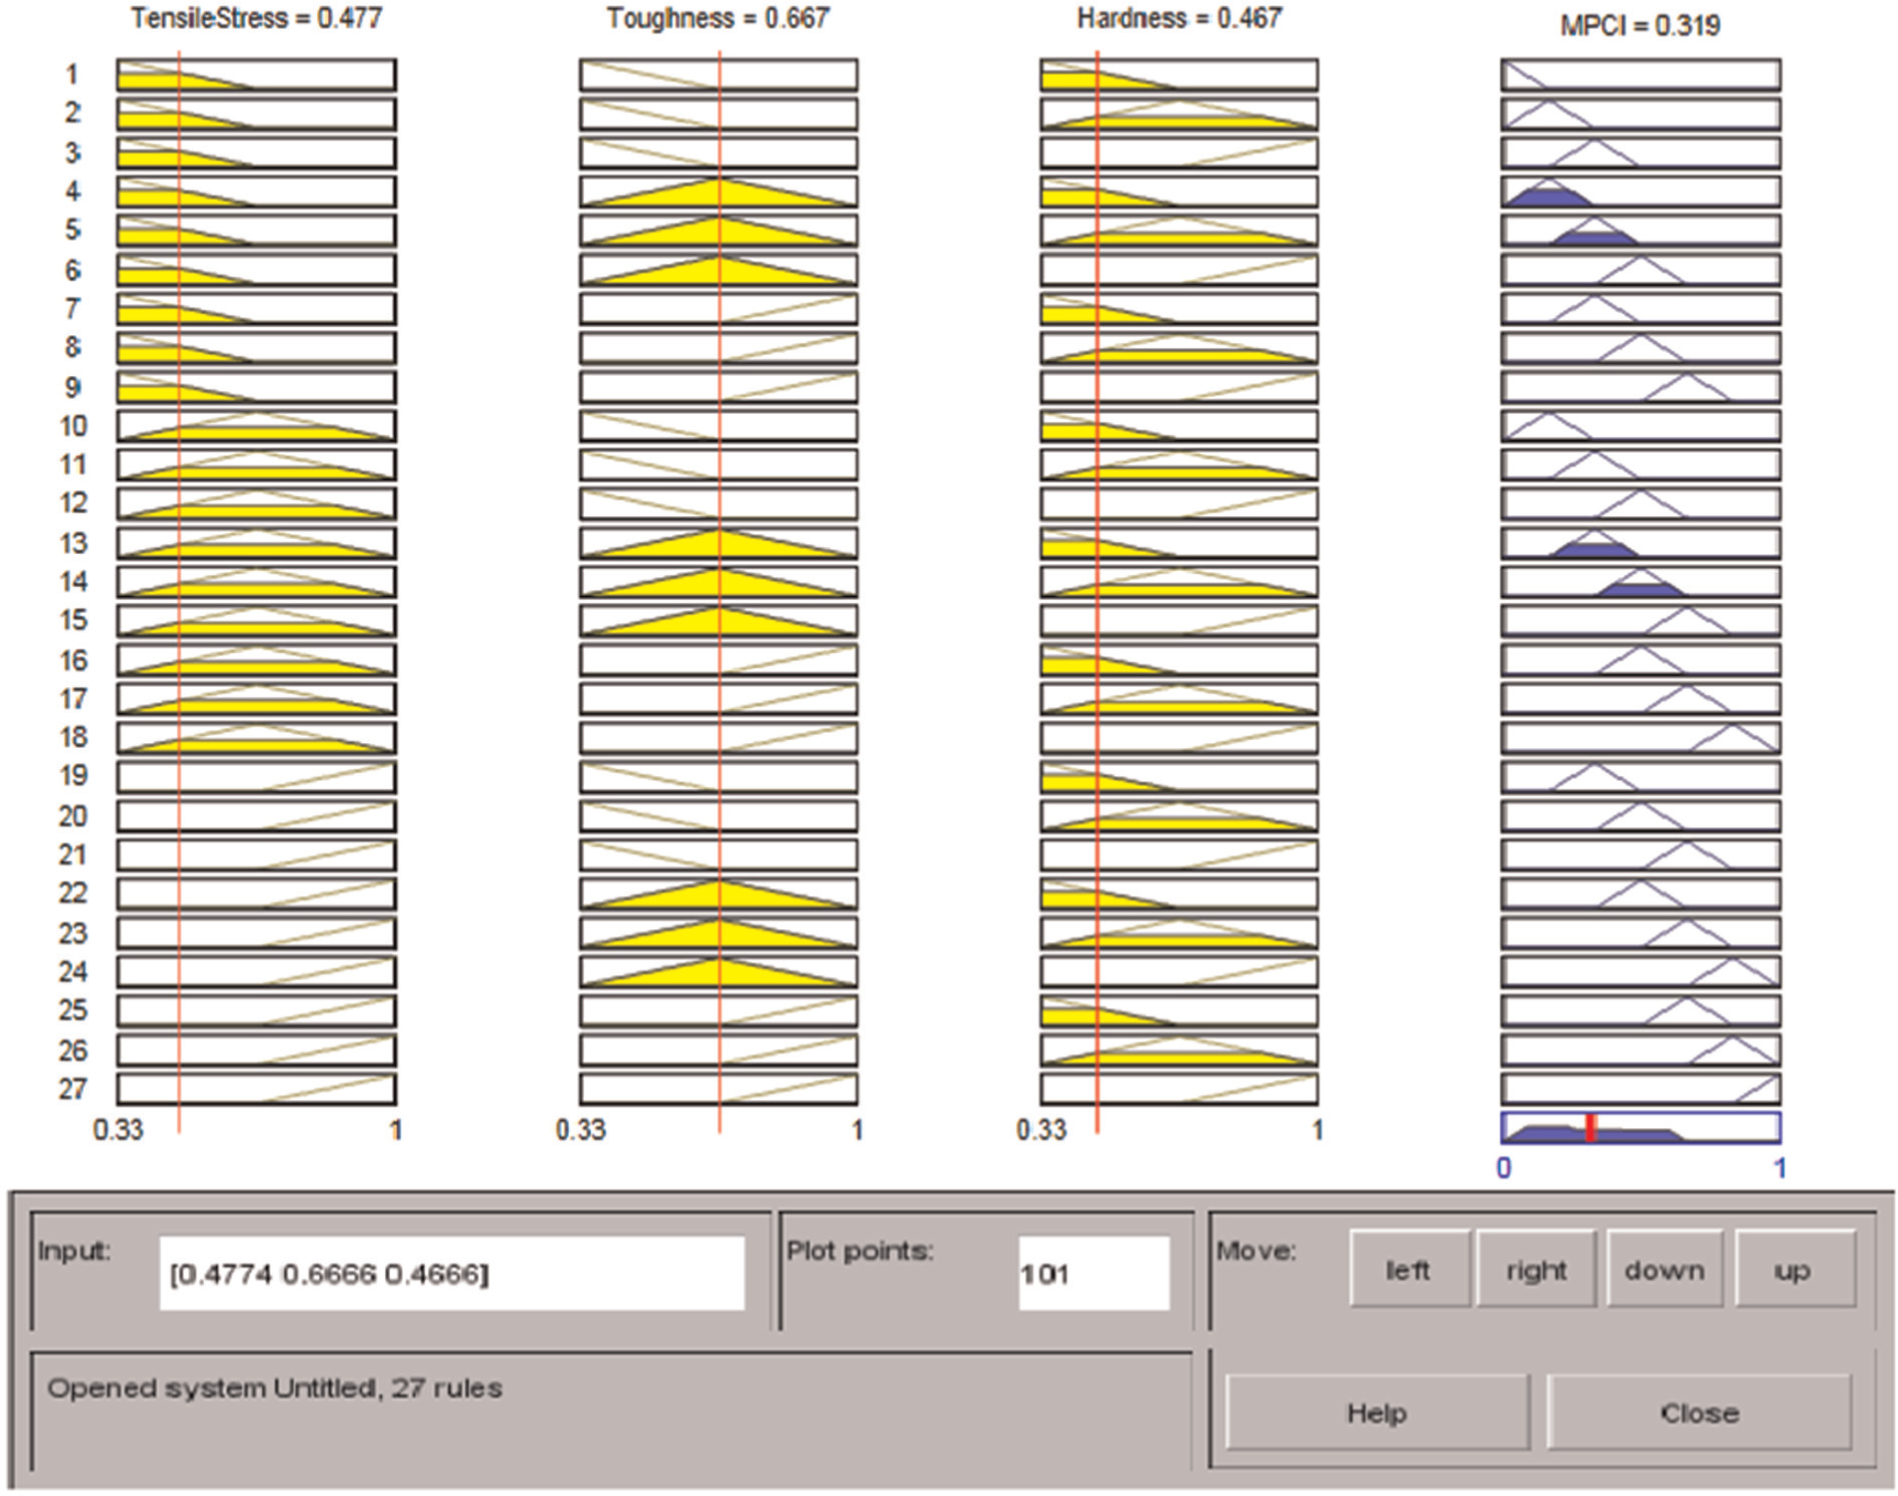
Individual grey relational coefficients of tensile stress, toughness and hardness are taken as input responses of fuzzy inference system and only output is MPCI. After the three input variables are fuzzified into the linguistic values, applying the fuzzy rules along with Mamdani inference, then the fuzzy linguistic values and their membership values covert to crisp value or MPCIs. As shown in Figure 5, three sets of theory for each of response parameter are used: small (S), medium (M) and large (L). Seven fuzzy sets have been assigned for output MPCI as shown in Figure 6: extreme small (ES), very small (VS), small (S), medium (M), large (L), very large (VL) and extreme large (EL), and 27 fuzzy rules (Table 9) are directly derived based on the fact that the larger the S/N ratio, the better the performance characteristic. The Mamdani implication method based on the fuzzy rules has been used to achieve the output MPCI (Figure 7).
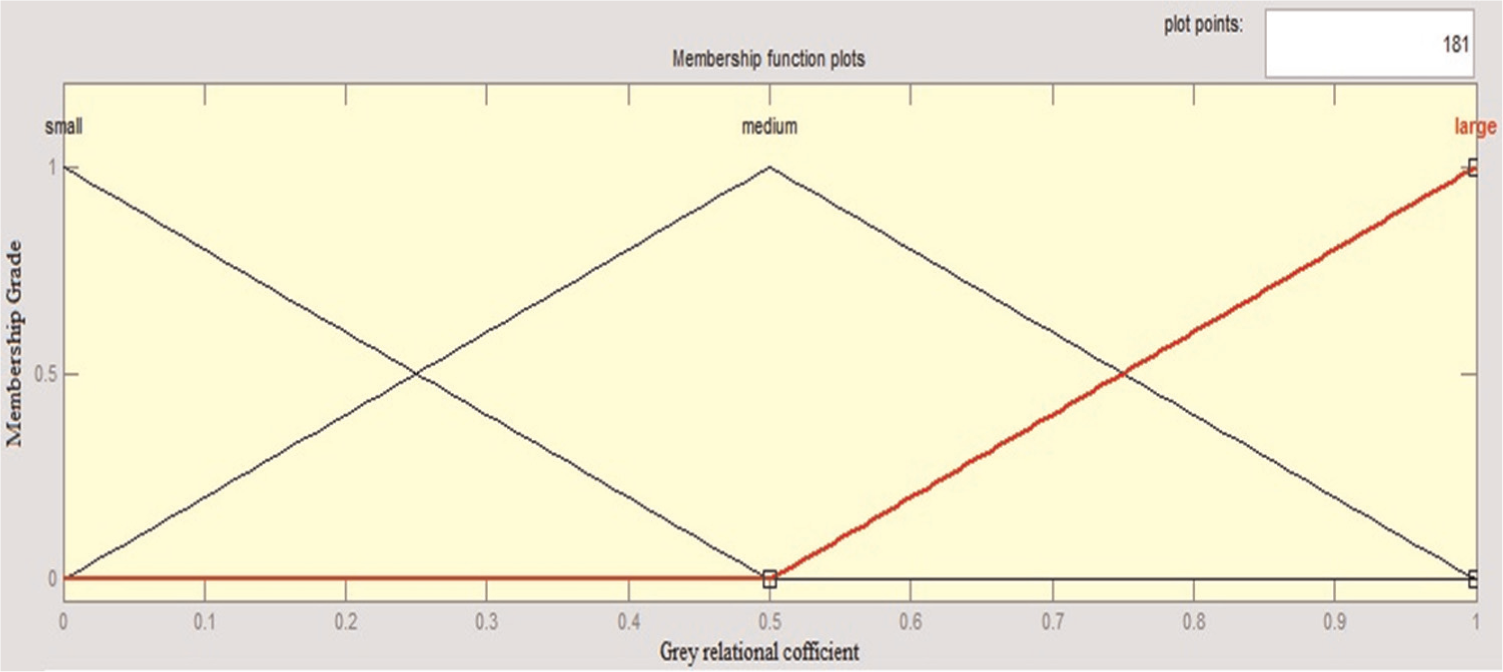
The triangle membership functions for the grey relational coefficient of tensile stress, toughness and hardness.
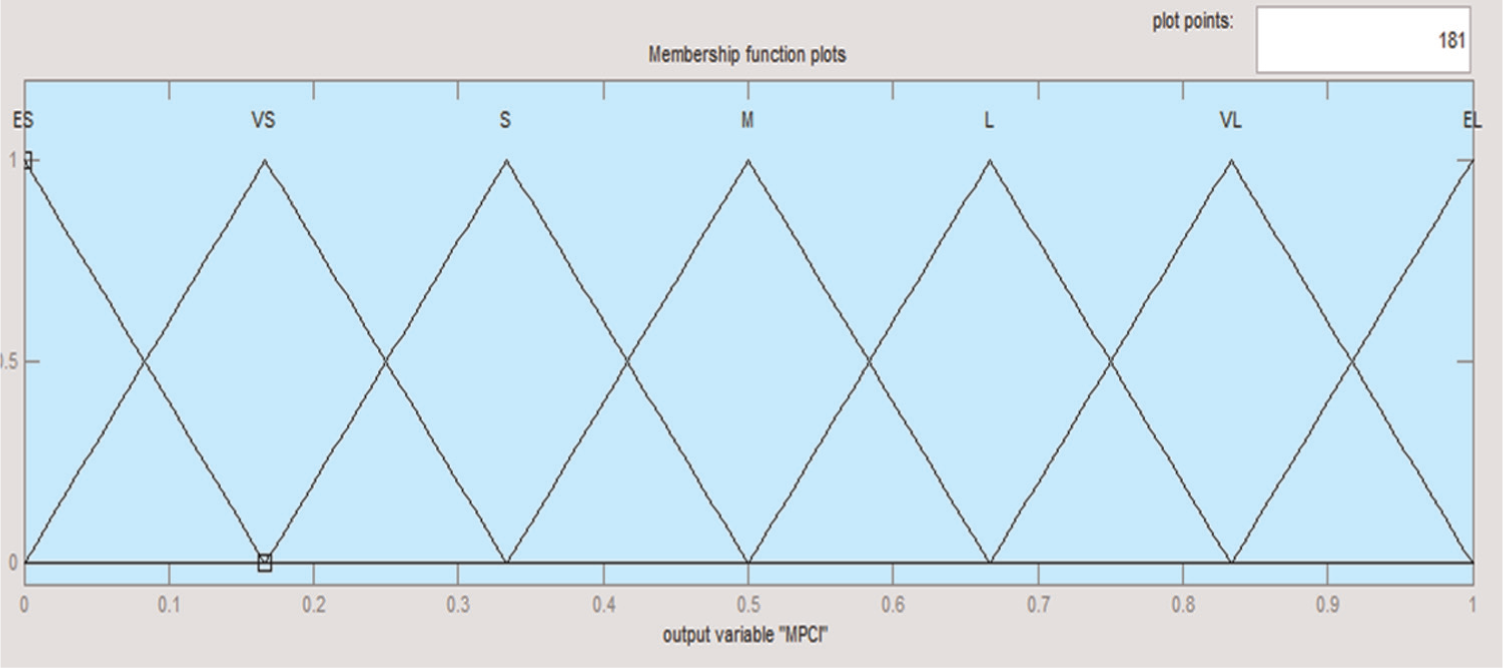
Membership functions for MPCI.
Fuzzy rule tables.
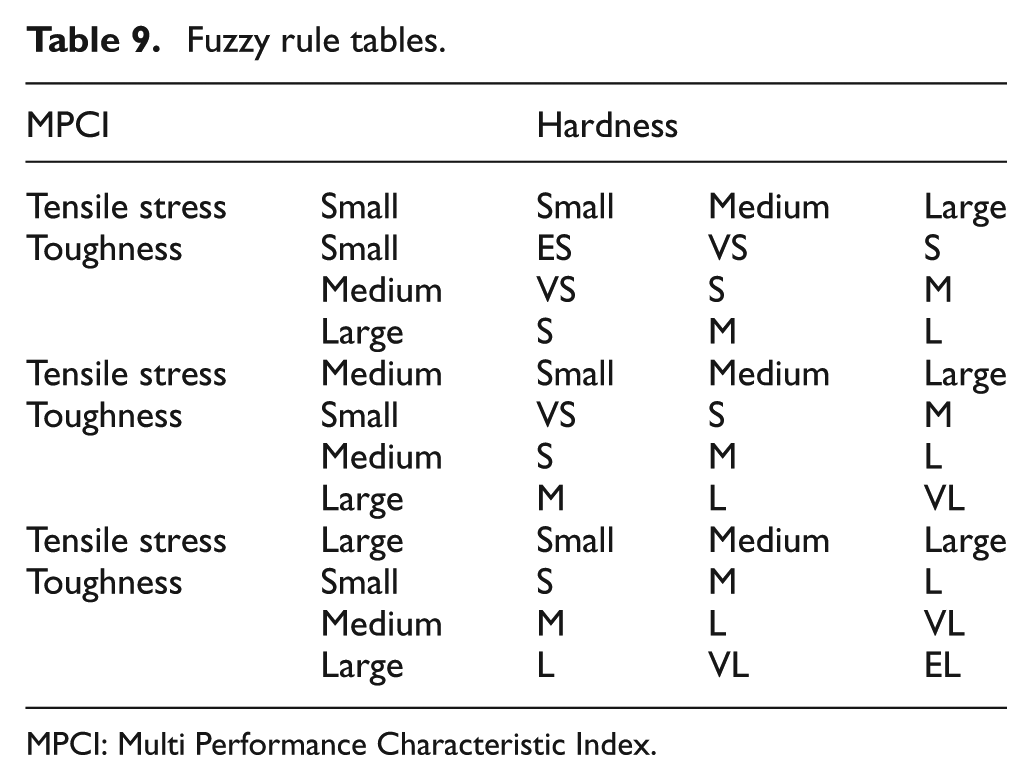
MPCI: Multi Performance Characteristic Index.
Fuzzy logic model for welding response.
Based on the above discussion, the good quality and productivity performance are indicated based on the larger value of MPCI, but because of many parametric combinations it may not be optimal; therefore, Taguchi method has been used to optimize the MPCIs. Taguchi method converts response value into corresponding S/N ratio to reach optimal level. In this analysis, the optimal parametric combination is determined by higher-the-better criteria of the response S/N ratio. Table 10 shows the result of MPCI values corresponding to the number of experiments by using MATLAB 7.11.0 (R2010b) generated fuzzy logic unit (Figure 8). Table 11 represents the effects of different factor parameters for MPCI due to different delta variations. The larger delta value influences the MPCI more than the smaller delta value, and it is easily shown that the stick out is the most significant factor influencing MPCI; the next significant factor is wire feed, then traverse speed.
Grey–fuzzy reasoning grade or MPCI and its S/N ratios.
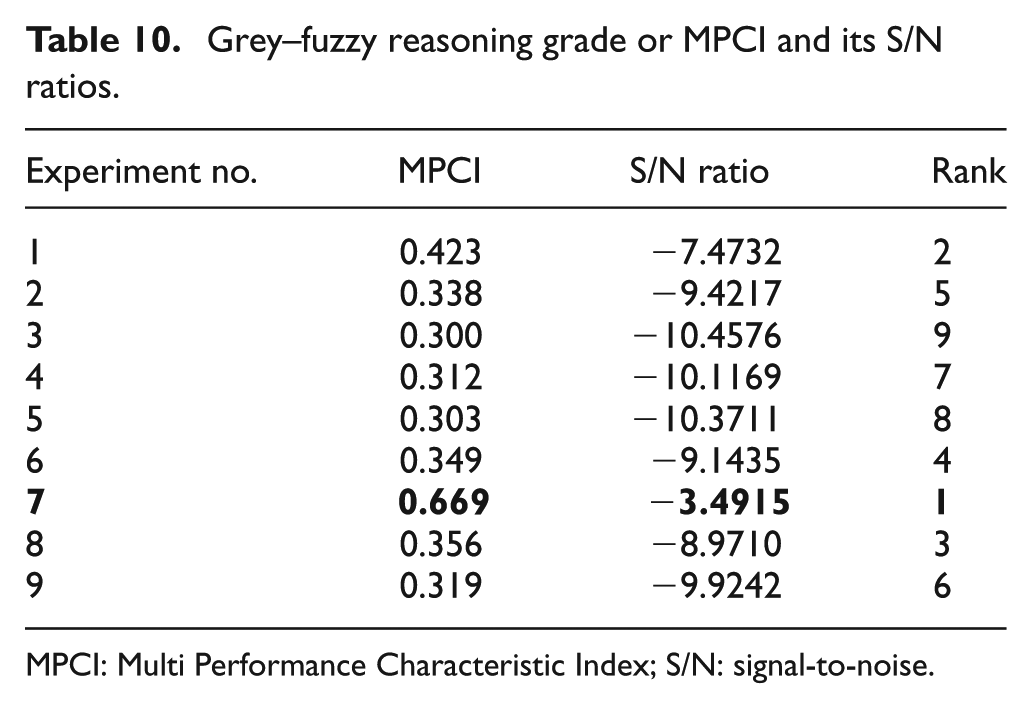
MPCI: Multi Performance Characteristic Index; S/N: signal-to-noise.
Fuzzy logic rules for present approach.
Mean value of MPCI.
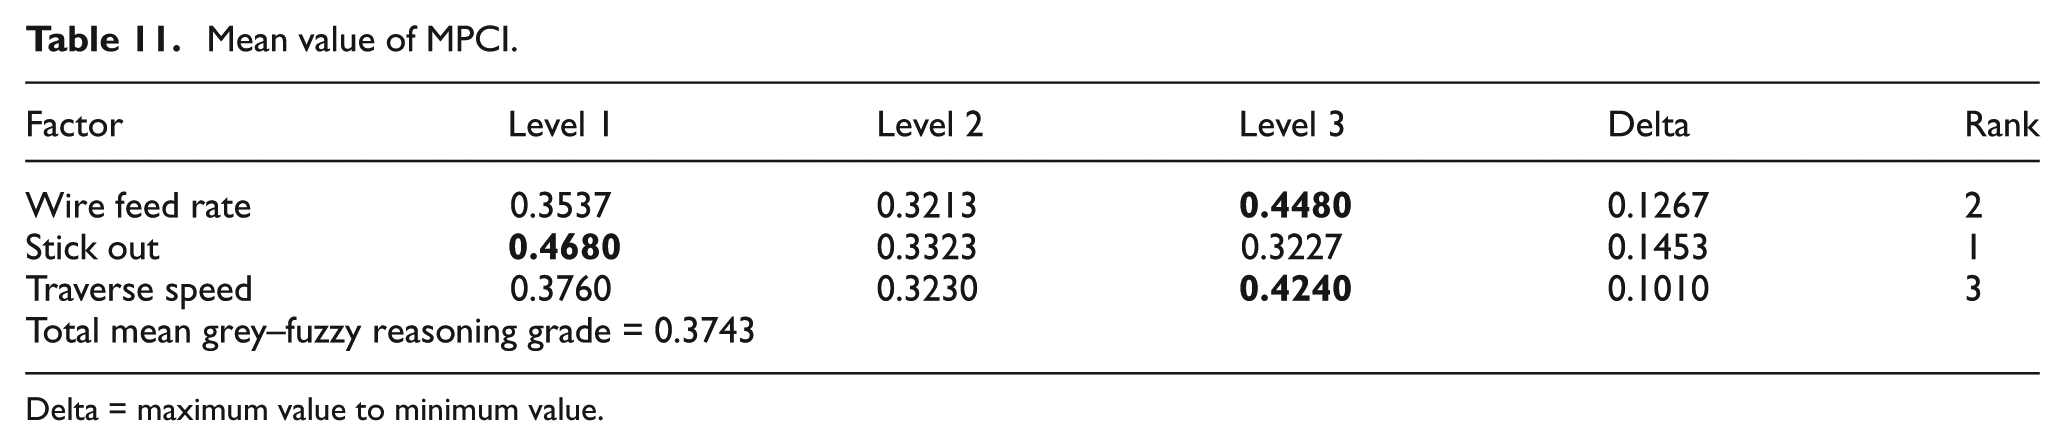
Delta = maximum value to minimum value.
Optimal process parameters of weldments are determined by using the Taguchi technique, and the effect of values of S/N ratios on the process parameters is illustrated in main effect plot as shown in Figure 9. Optimal setting becomes Wf-3 So-1 Tr-3, that is, level 3 of wire feed rate, level 1 of stick out and level 3 of traverse speed have large grey–fuzzy grade values.
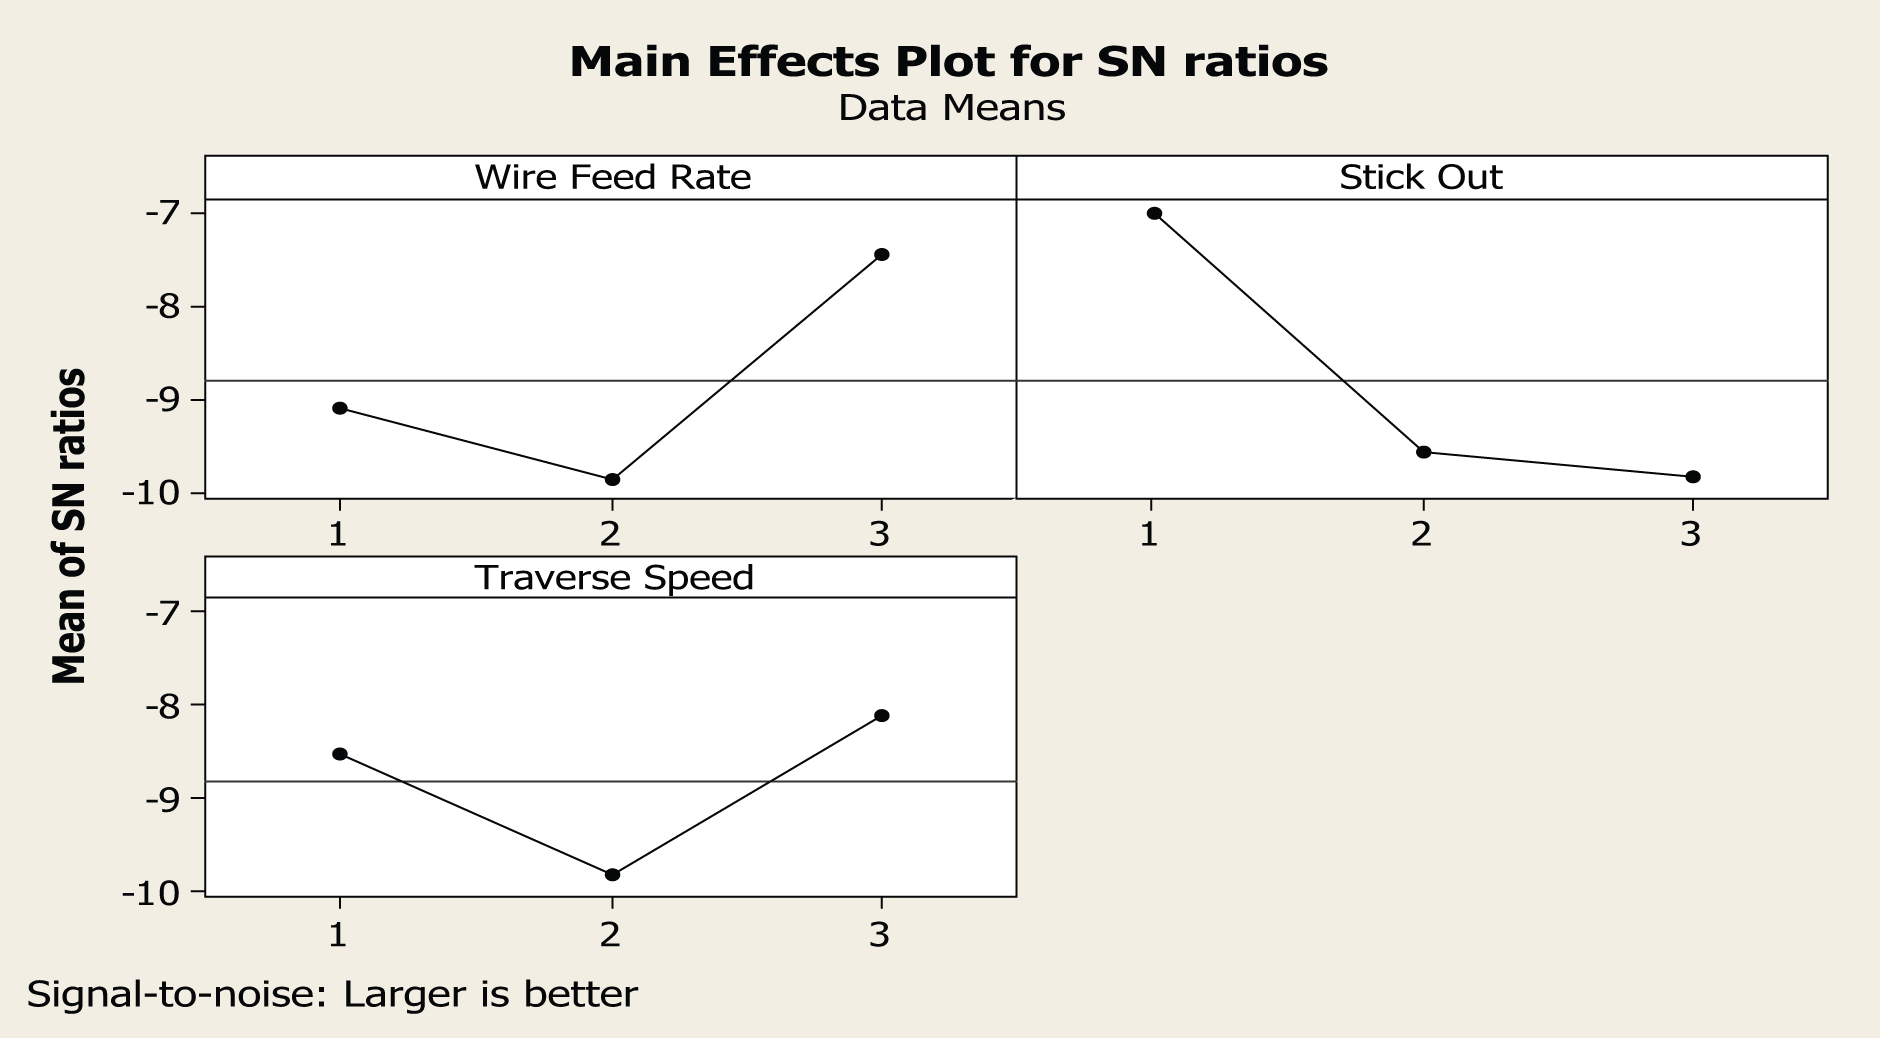
S/N ratio plot of MPCI.
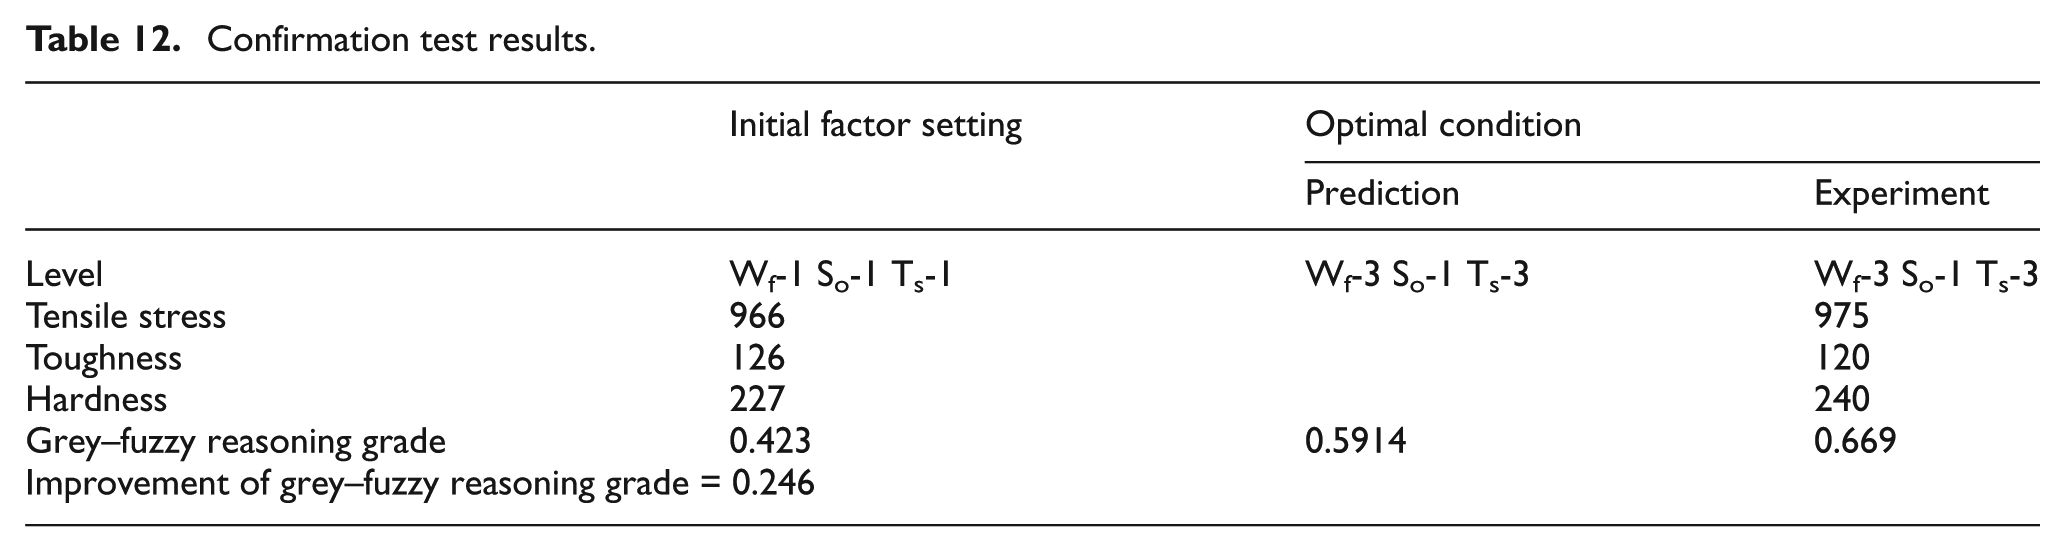
Confirmation test
After identifying the optimal level of process parameters, a confirmation test needs to be carried out in order to check the accuracy of investigation. The estimated grey–fuzzy grade
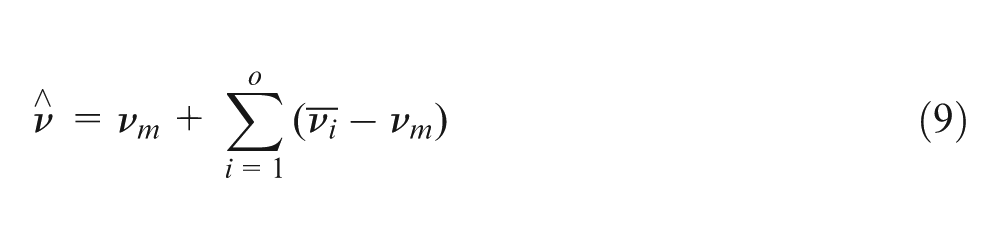
where
Confirmation test results.
Conclusion
This study has presented the use of the grey–fuzzy logics based on Taguchi technique to optimize the process parameters of SAW process with the multiple process responses. Through the grey–fuzzy logic analysis, it is shown here that the optimization of complicated multiple performance characteristics can be converted into the optimization of a single grey–fuzzy reasoning grade. As a result, this technique can greatly simplify the optimization procedure of the complicated multiple performance characteristics. The experimental result for the optimal setting shows that there is a great improvement using this technique. The conclusions that have been drawn in this study are as follows:
The proposed algorithm obtains a grey–fuzzy reasoning grade so as to evaluate the multiple performance characteristics. It is more effective to make the determination of optimal setting levels and can greatly simplify the optimization procedure for the complicated multiple performance characteristics.
The level constitution of optimal designing parameters is Wf-3 So-1 Ts-3 for maximizing the value of tensile stress and toughness, and for minimizing the value of hardness, simultaneously in the SAW process.
The effect of stick out on the overall mechanical property is more significant than other welding parameters.
As the quality loss is minimum in grey relational analysis, the present approach based on grey analysis is more effective for normalization of response parameters.
The proposed algorithm converts priority weights into linguistic so that the issue of assigning priority weight for each individual response can be avoided.
Confirmatory test has validated the parametric setting determined by grey–fuzzy-based Taguchi method. From the results of confirmation test, the multiple performance characteristics, including the tensile stress, toughness and hardness, have a considerable improvement by using the algorithm proposed in this study.
Footnotes
Acknowledgements
The authors offer their sincere thanks to Prof. S.C. Saha of Mechanical Engineering Department and Instructors of Workshop, NIT, Agartala, for their valuable help in finishing this work.
Declaration of conflicting interests
The authors declare that there is no conflict of interest.
Funding
This research received no specific grant from any funding agency in the public, commercial or not-for-profit sectors.