
Abstract
This article investigated the effect of wire electrical discharge machining process parameters such as pulse on time, pulse off time, pulse current and the wire drum speed on the surface roughness of machined hybrid metal matrix composite. The hybrid composite was prepared by inert gas–assisted electromagnetic stir casting process using 15 wt% Al2O3/SiC particulates (7.5% each) in metal matrix Al-7075 alloy. Taguchi method was used for parameter optimization, and the level of importance was determined using analysis of variance. The MINITAB15 software was used in the analysis. The results show that pulse on time, pulse current and pulse off time were significant parameters, whereas the wire drum speed had insignificant effect. In confirmation test, the average experimental value of surface roughness was within an error of 3.46% of the predicted value at the optimum level of process parameters.
Keywords
Introduction
Industry demands new materials showing high mechanical performance in terms of high strength-to-weight ratio, high toughness and lower value of coefficient of thermal expansion. Metal matrix composites (MMCs) have found many successful industrial applications in recent past as they meet the above-said properties along with good wear resistance and capability of operating at elevated temperature. 1 MMCs are fabricated by several processes such as casting and powder metallurgy. The machining of these MMCs is difficult by conventional machines. 2 Among various machining methods, the wire electrical discharge machining (WEDM) is one of the most versatile and useful technological processes to machine these materials. It is an effective and economical process for machining intricate and complex shapes in various conductive materials.3,4 The most important performance measures in WEDM are material removal rate (MRR), surface roughness (SR) of machined surface and kerf, that is, cutting width. The surface integrity after WEDM is a problem associated with this machining process. SR plays a very critical role in determining the quality of machined parts. A good quality surface improves fatigue strength, corrosion and wear resistance of the workpiece.5,6
Literature review
Gatto and Iuliano 7 studied the machining of AA2009/15% SiCW and AA2009/20% SiCW composites. The results showed that the machining speeds for cutting of both composites were equal. The SR of machined surface of 15% SiCW/2009 Al alloy composite was lesser than 20% SiCW/2009 Al alloy composite. No SiC reinforcement and Cu precipitates were found in the outer recast layer. 7
Mahapatra and Patnaik 8 studied the factors and their interactions both for maximization of MRR and minimization of SR in WEDM process using Taguchi method. The work material used was D2steel. The analysis showed that factors such as discharge current (A), pulse duration (B), dielectric flow rate (F) and interactions A × B and A × F have been found to play a significant role in cutting operations. The results of confirmation experiment agreed well with a prediction error of 4.062% with MRR and 1.53% with SR. 8
Kanlayasiri and Boonmug 9 investigated the effect of machining parameters on SR of wire electro discharge machined (wire EDMed) DC53 die steel. The investigated machining parameters were pulse on time, pulse off time, pulse peak current and wire tension. Analysis of variance (ANOVA) technique was used to find out the parameters affecting the SR. Results from ANOVA showed that pulse on time and pulse peak current are significant parameters to SR of wire EDMed DC53 die steel. The SR of test specimen increased as these two variables increased. The average prediction error was about 2.84%. 9
Ramakrishnan and Karunamoorthy 10 developed artificial neural network (ANN) model and multiresponse optimization technique to predict and select the best cutting parameters of WEDM. Inconel 718 was selected as work material to conduct experiment according to Taguchi L9 orthogonal array (OA). ANOVA was used to identify the level of importance of machining parameters. This study concluded that increasing the pulse on time and ignition current, the MRR was improved but it affected the SR. The increase of delay time improved the surface quality. 10
Esme et al. 11 studied the relationship between SR and WEDM cutting parameters. The level of significance was determined using ANOVA. The mathematical relationship between SR and WEDM cutting parameters were established by regression analysis method. The material used in the study was AISI4340 steel. The author compared the predicted values of SR by neural network (NN) and regression analysis techniques with experimental values. Pulse duration and open circuit voltage were found to be the major significant factor for SR (contribution 48.5% and 47.66%, respectively), whereas wire speed and dielectric flushing pressure were found to be the second ranking factor (contribution 0.66% and 0.46%, respectively). The predicted value of SR by NN was found to be nearer to experimental value (average error 4.90%) than to regression analysis (average error 7.17%). The results showed that NN was a good alternative to empirical modeling based on full factorial design. 11
Patil and Brahmankar 12 investigated the effects of machining parameters while machining 10% and 20% of Al2O3/Al composite using Taguchi method. The results showed that reinforcement percentage, current and pulse on time had significant effect on cutting rate, kerf width and SR. 12
Shandilya et al. 13 studied the quality of cut in AA6061/SiCW composite by WEDM and analyzed the results by response surface methodology (RSM). The machining parameters and response were servo voltage, pulse on time, pulse off time, wire feed rate and SR, respectively. The mathematical relationship between input parameters and the SR was established, and significant factors for the process were analyzed by ANOVA. According to the results, voltage was the most significant parameter on SR. The increase in voltage and pulse on time increased the SR but increase in pulse off time decreased it. The predicted value for SR (1.761 µm) found to be very close to the experimental value of SR (1.785 µm) at the optimum level of input process parameters with an error of 1.34% only. 13
Satishkumar et al. 14 investigated the effect of WEDM process parameters on MRR and SR as per design of experiment (DOE) approach using L9 OA. The results were analyzed by ANOVA. The work material used in the study was MMC having 5%, 10% and 15% volume fraction of SiCp in Al6061. Results of the study showed that increase in volume fraction of SiC increased SR. Also the maximum variation of 9.5% was observed for SR in experimental and the values obtained by the regression equation. 14
Jangra et al. 15 studied the effect of WEDM process parameters on MRR and SR. The work material used was tungsten carbide–cobalt (WC-Co) composite. The simultaneous optimization of MRR and SR was carried out using gray relational grade and Taguchi method. ANOVA showed that taper angle and pulse on time were the most significant parameters affecting the multiple machining characteristics. The percentage error between experimental and predicted results for MRR and SR were less than 4%. 15
Kamboj et al. 16 fabricated 5%, 10% and 15% SiC composites with aluminum alloy using stir casting process. The samples were investigated using scanning electron microscope (SEM) equipped with energy dispersive X-ray analysis system, X-ray diffraction analysis and differential thermal analysis (DTA) techniques. Mechanical properties like hardness, ultimate tensile strength and impact strength of these samples were investigated. The results of the study revealed that a full homogeneous dispersion of SiC particles in aluminum matrix was obtained without addition of any wetting agent. The peak in the X-ray traces corresponds to the presence of aluminum and SiC and the absence of any significant reactive constituents. The DTA curve showed an endothermic peak in aluminum matrix between 648 °C and 650 °C with a nil degradation of material. The authors concluded from the study that improvement in mechanical properties of three samples has been achieved. Sample 3 with 15% SiC shows a maximum hardness value (Vickers hardness number) of 120, ultimate tensile strength of 190 MPa and impact strength of 18 J. 16
Singh et al. 17 optimized the input process parameters considering assigned weight fraction of output quality characteristics using gray relational analysis. The output quality characteristics considered were thrust force, torque and SR under the experimental domain of cutting speed, feed, step diameter and point angle. The matrix material used for the production of MMC was Al-6063. MMCs were developed in-house with “stir and squeeze” casting method. The drilling experiments were designed as per Taguchi DOE using L9 OA. The combined methodology of OA, DOE and gray relational analysis was implemented to establish the best possible input process parameters that give minimum thrust force, torque and SR. The results reveal that with the help of gray relational analysis, output quality characteristics can be enhanced efficiently. 17
The objective of the present work is to optimize the machining parameters on SR of Al-7075/SiC/Al2O3 particulate hybrid composite using WEDM. The investigated machining parameters are pulse on time, pulse off time, pulse current and wire drum speed. ANOVA was used as the analytical tool in studying the effects of these machining parameters and their interaction effects. The machined surface of hybrid composite was also analyzed using SEM analysis.
Experimental procedure
Preparation of hybrid composite
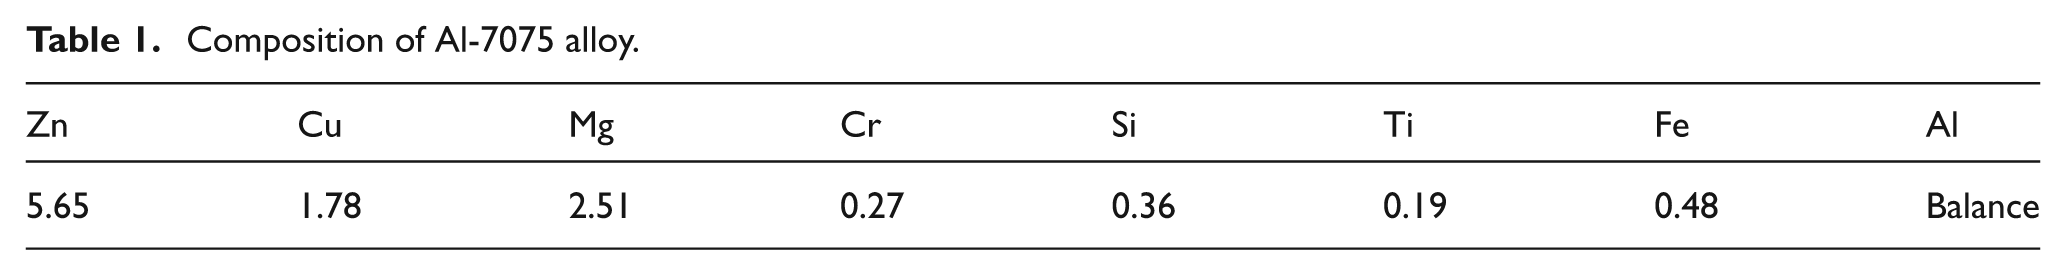
In this study, the material employed is hybrid composite. Cast ingot of 15 wt% Al2O3 and SiC particulates (7.5% each) are fabricated in metal matrix Al-7075 alloy. Commercially available wrought aluminum alloy 7075 is used as matrix alloy for the fabrication of hybrid composite. This is the most common Al-alloy of 7xxx series having great potential to be utilized in aerospace and automotive industry because of its high strength-to-weight ratio and good resistance to corrosion. The composition of Al-7075 alloy is shown in Table 1.
Composition of Al-7075 alloy.
SiC and Al2O3 in particulate form are used as reinforcements to produce hybrid composite. These reinforcements have 20- to 40-µm size particles and are used in combination in the ratio of 1:1. The melting process is carried out in a graphite crucible using electric resistance heating type muffle furnace. The de-gassing of melt is done by inert gas (Argon) for 10 min time before introduction of reinforcement into it. Also, inert gas atmosphere is maintained above the melt surface during the synthesis of hybrid composite so as to minimize oxidation of aluminum. When the melting is achieved at a temperature of 715 °C, the melt is quickly lifted from the furnace and placed inside the electromagnetic stirring device. The supply is switched on and a forced vortex is generated in the melt. The thoroughly mixed and preheated reinforcement phase (Al2O3+ SiC) particulate at a controlled rate was inducted into the melt. The reinforcement material particulates (Al2O3 and SiC) were mixed thoroughly and preheated to a temperature of 900 °C before induction into the melt. The electromagnetic stirring is continued till melt reached to solidus state. Figure 1 shows the microstructure of 15 wt% Al2O3 and SiC particulates (7.5% each) in Al-7075alloy MMC cast by inert gas–assisted electromagnetic stir casting process. The reinforcement phase is found to be uniformly distributed in the metal matrix.
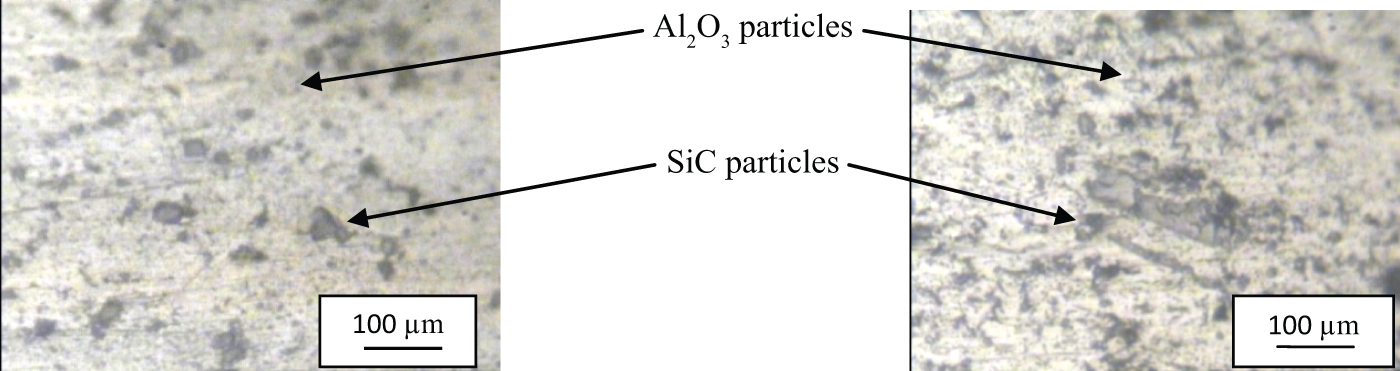
The microstructure of 15 wt% Al2O3 and SiC particulates (7.5% each) in Al-7075alloy composite.
Machining parameters and response
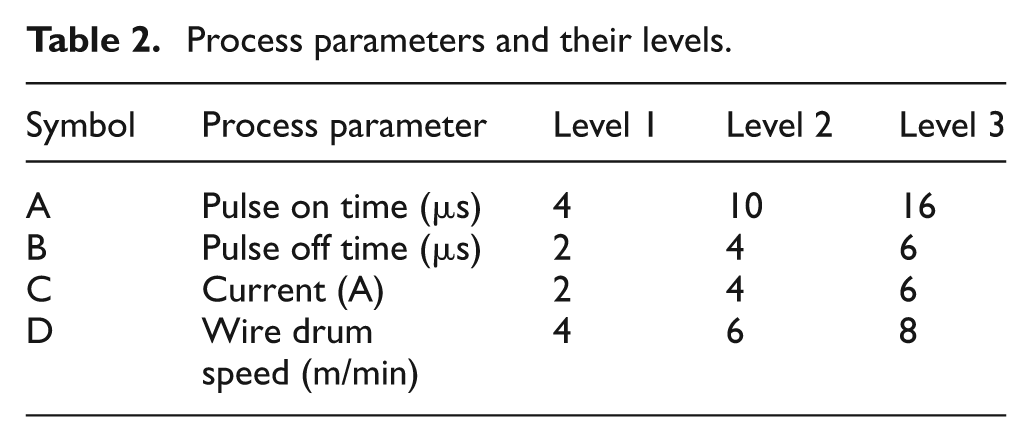
The four input process parameters, namely, pulse on time, pulse off time, pulse peak current and the wire drum speed were chosen as process variables to study their effects on SR generated on the machined surface while machining hybrid composite. The ranges of these process parameters were selected on the basis of machine capability, and the pilot experiments carried out using the one variable at a time approach. The process parameters and their ranges are shown in the Table 2.
Process parameters and their levels.
DOE using Taguchi method
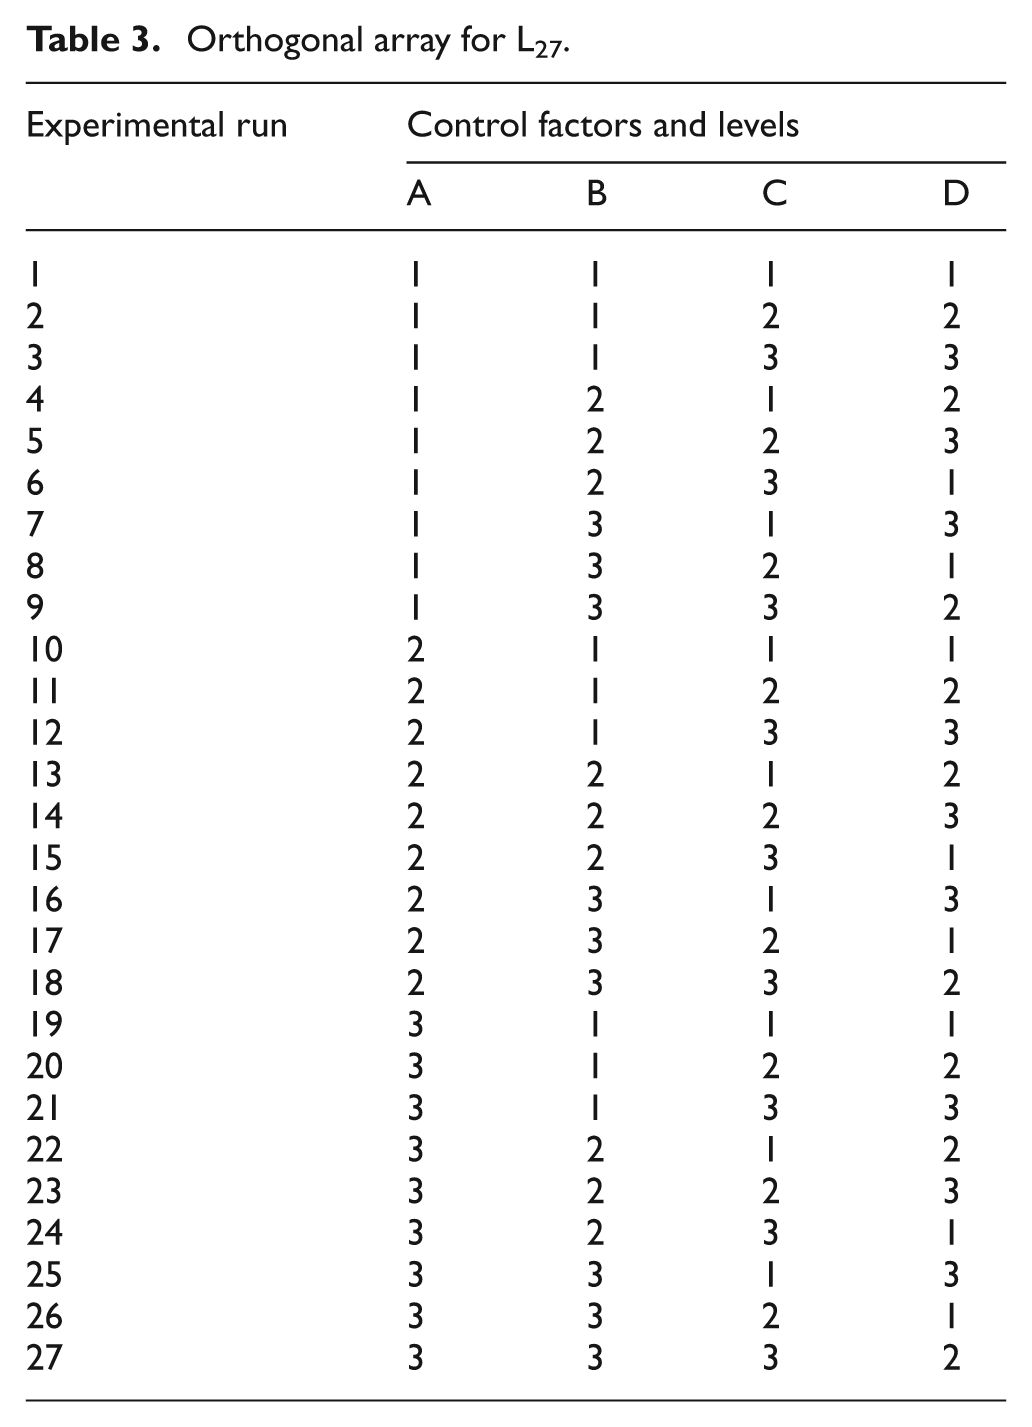
In order to get the optimum and accurate results, the DOE technique is used to collect the data. The OA forms the basis of the experimental analysis in the Taguchi method. 18 In this study, four control parameters pulse on time (A), pulse off time (B), pulse current (C) and wire drum speed (D) at three levels were selected. L27 OA was chosen as presented in Table 3. Software MINITAB15 was used to analyze the results.
Orthogonal array for L27.
Conduct of experiment
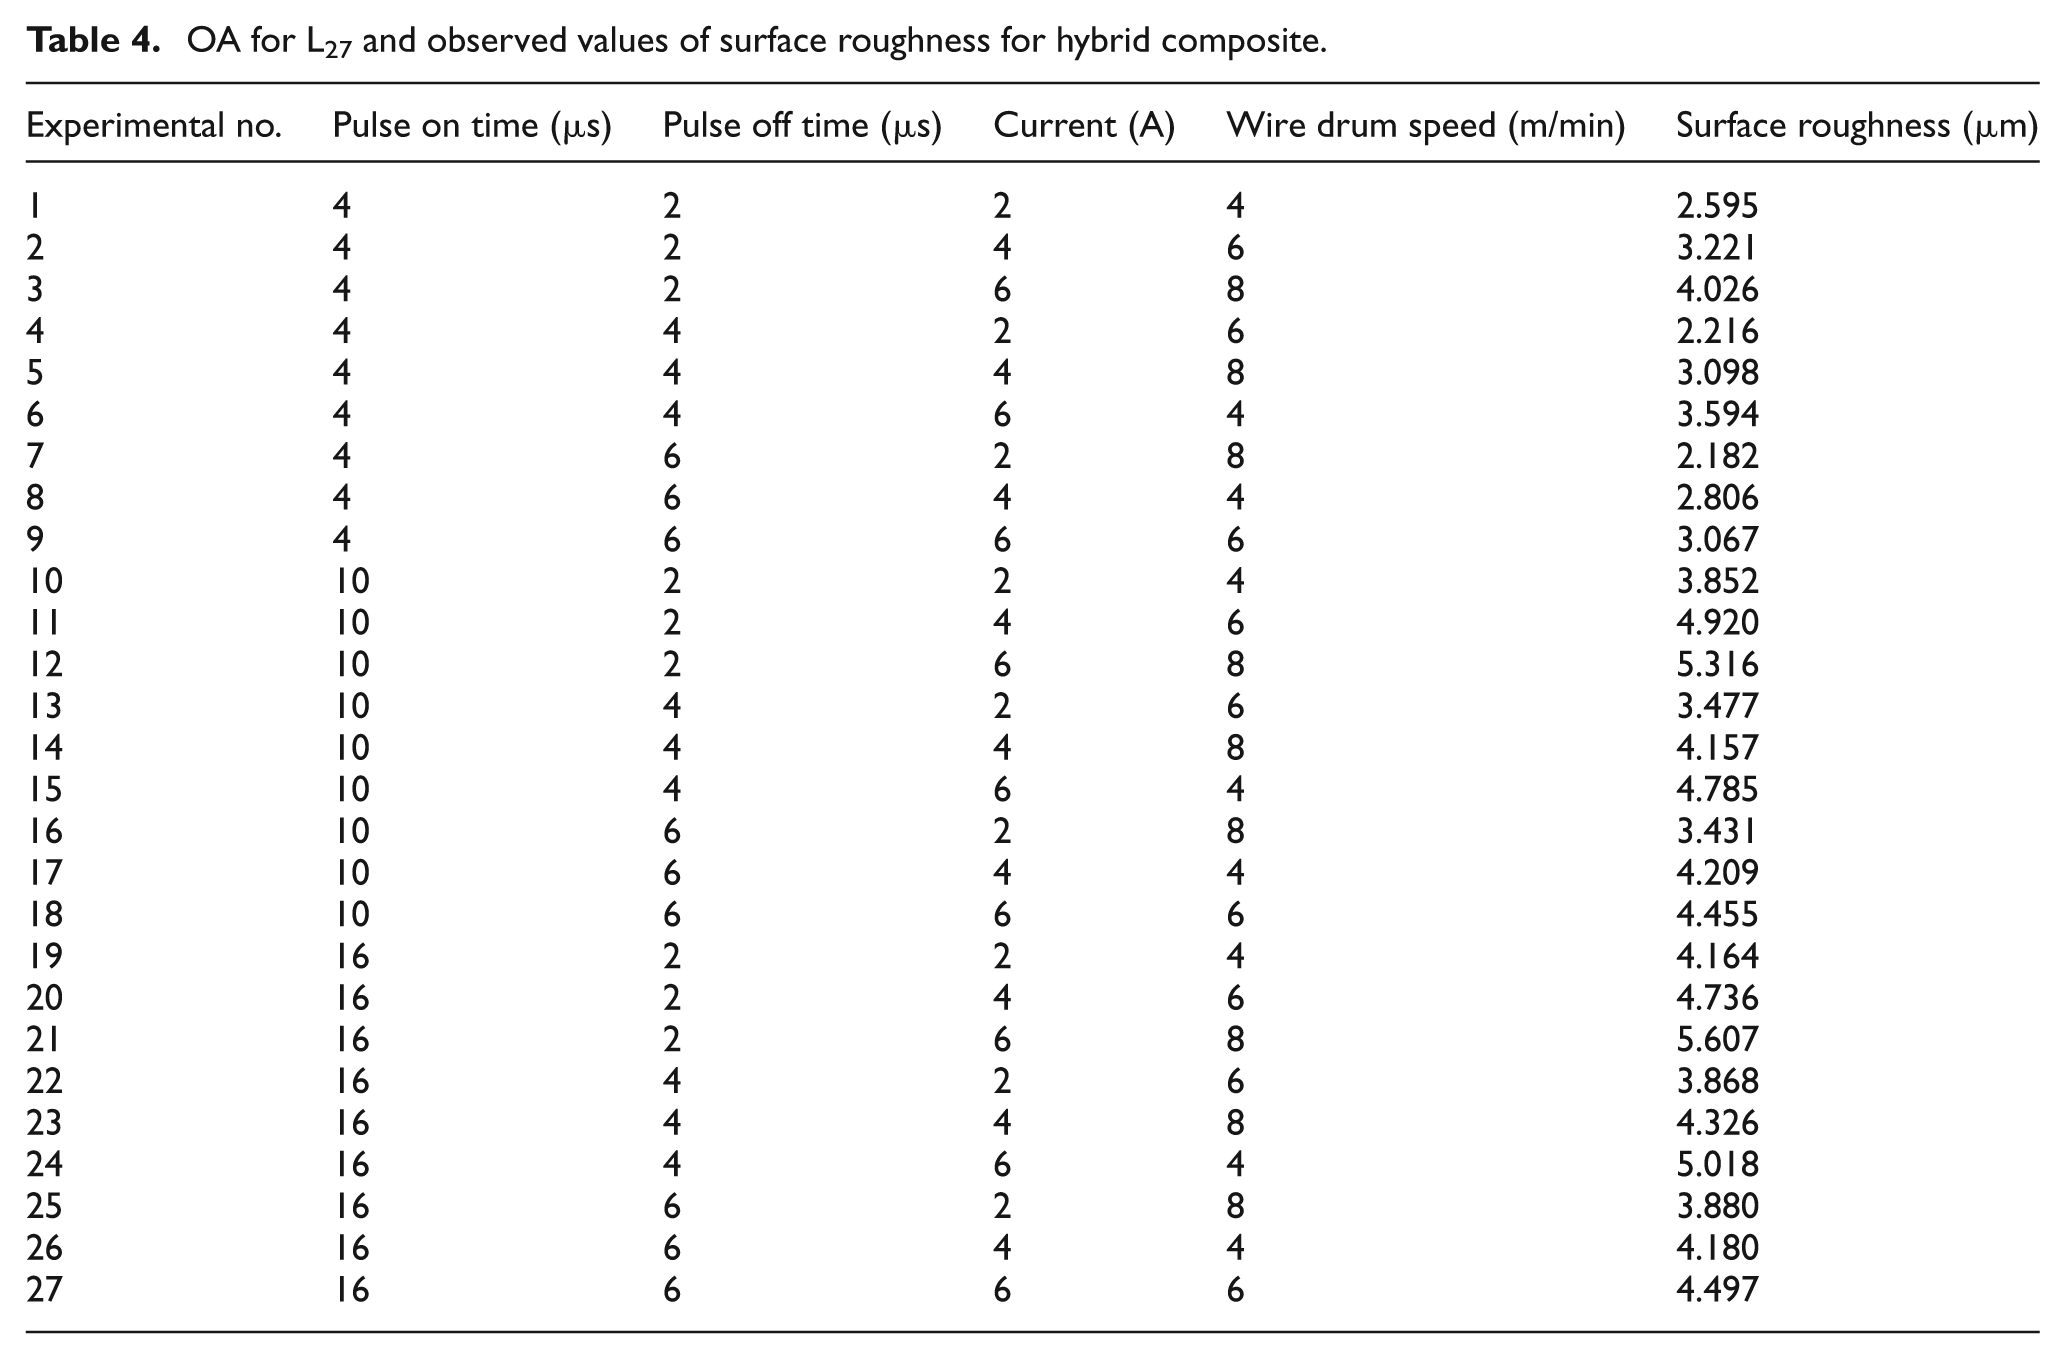
WEDM is a spark erosion process. The sparks are generated between the work piece and the wire electrode immersed in a dielectric fluid. The material is removed by a series of discrete sparks taking place at the area to be machined through electrothermal mechanism. The continuous flow of dielectric flushes away the removed particles from the machined region. The rectangular specimens of 4 mm thickness were prepared from the mid portion of the cast ingot. The length and width of specimen was 70 × 30 mm giving sufficient run for the machine to make various cuts of 10 mm length according to L27 OA. The top and bottom surfaces of the specimen were given smooth finish using 600 grade emery papers. The wire EDM used was WEDM program and control system from Jiang Nan Saite NC Equipment Co., Ltd, China. The molybdenum electrode wire of 0.18 mm diameter was used. The deionized water was used as dielectric at room temperature. The photographic view of wire EDM is shown in Figure 2(a) and the schematic diagram is shown in Figure 2(b). After machining, the specimens were cleaned with acetone. The SR (Ra) was measured in microns (µm) using Mitutoyo Surftest SV-2100. On each machined surface, the SR was measured at three places spread over the entire machined area and in the direction of cut (perpendicular to wire travel path). The average values of these measurements were used in this study. The cutoff length was 0.8 mm and stylus travel speed was 0.5 mm/s. The observed values of SR at different levels of the WEDM process parameters are shown in the Table 4.
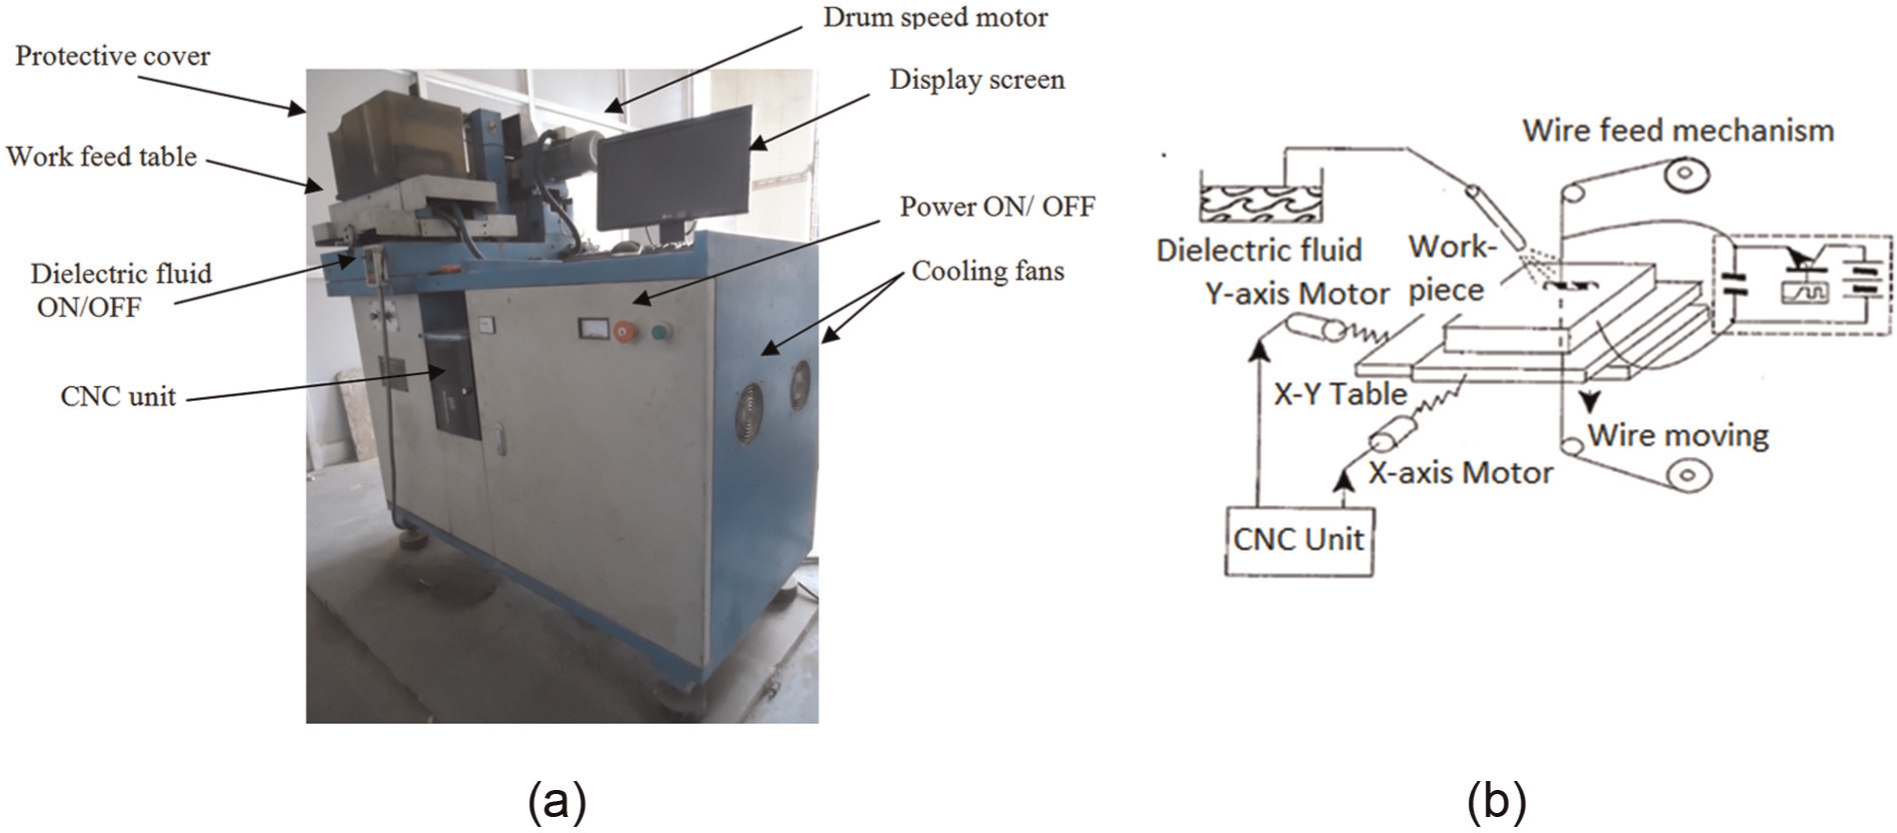
(a) Photographic view of wire EDM and (b) schematic diagram of wire EDM. 19
OA for L27 and observed values of surface roughness for hybrid composite.
Analysis of experiment
In Taguchi method parameter design, the basic method converts the objective parameter to the signal-to-noise (S/N) ratio, which is treated as the quality characteristic evaluation index. The S/N ratio is used to measure the sensitivity of the quality characteristic being investigated in a controlled manner. In Taguchi method, the term “signal” represents the desirable effect (mean) for the output characteristic and the term “noise” represents the undesirable effect (signal disturbance) for the output characteristic which influences the outcome due to external factors, namely, noise factors. The least variation and the optimal design are obtained by means of S/N ratio. The smaller is the better (SB) is selected for SR. In Taguchi method, a loss function is defined to calculate the deviation between experimental values and the designed values. Loss function value is further converted into S/N ratio. Minimizing quality loss is equivalent to maximizing the S/N ratio. The S/N ratio for SR is given by expression 20
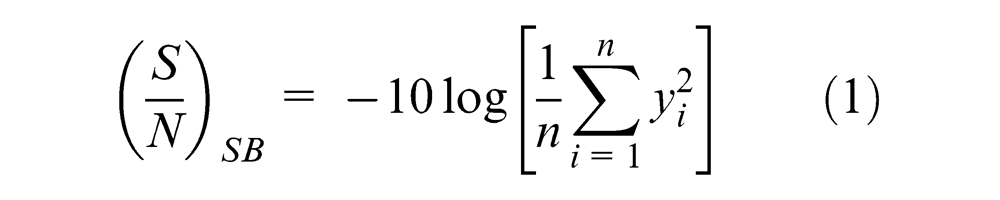
where yi is the ith result of experiment and n is the repeated number of the ith experiment.
Results and discussion
The most important parameter describing the machined surface integrity is the SR. For a machined component, the SR is set to be within prescribed limits. Thus, SR is paramount to any machining process to control the quality of machining.
Effect of process parameters on SR
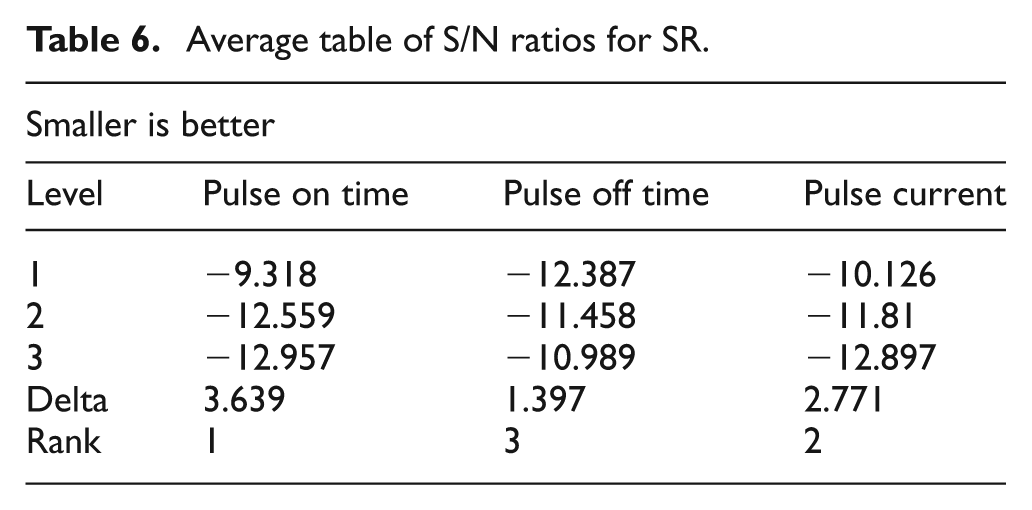
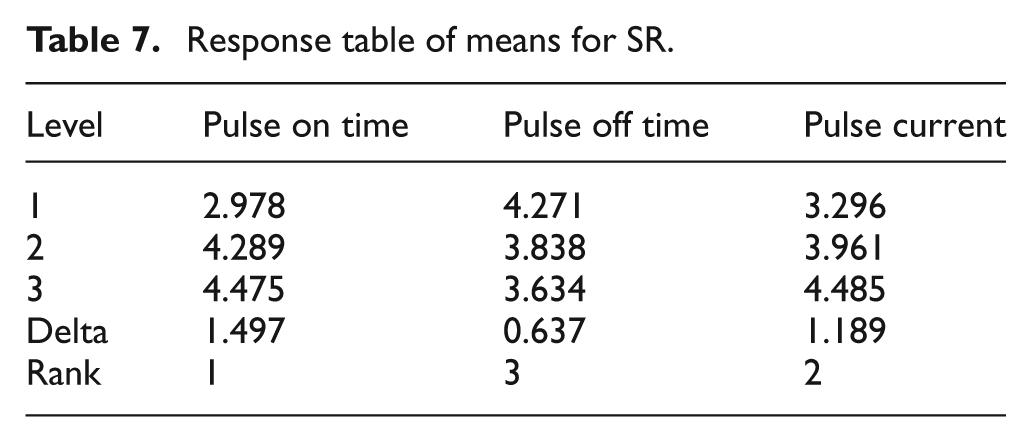
Table 4 shows the average SR data. Software MINITAB15 is used to analyze the results of SR. Based on the evidence at 95% confidence interval (CI) (α = 0.05), pulse on time, pulse off time and pulse peak current had significant effect on SR (p-value < 0.05), whereas wire drum speed did not affect the SR significantly (p-value > 0.05). Among the interactions, only the interaction between pulse on time and pulse peak current showed significant effect on the SR (p-value < 0.05). Other interactions were not statistically significant. Now, the data are pooled and Table 5 shows the pooled ANOVA for the SR. The percentage contribution of each parameter is calculated. The pulse on time was the most significant parameter that contributed maximum (59.70%) to the SR. The contributions from other parameters were pulse current 29.20% and pulse off time 7.58%. The contribution from second-order interaction, pulse on time × pulse peak current, was 2.09%. The average S/N ratios and average values of SR for each parameter are shown in Tables 6 and 7. The mean responses refer to the average value of the performance characteristic for each parameter at different levels. The average values of SR for each parameter at level 1, 2 and 3 were calculated and presented in Table 6. These values are plotted in Figure 3(a). The main effects (raw data) of the various process parameters when they change from the lower to higher levels are given in Table 7 and can be visualized in Figure 3(b). The S/N ratio analysis suggests that the best levels for minimum value of SR are A1, B3 and C1. The main effect plot for S/N ratio and mean and their interaction plots are shown in Figures 3(a) and (b) and 4, respectively.
ANOVA table for S/N ratios of SR (with pooling).
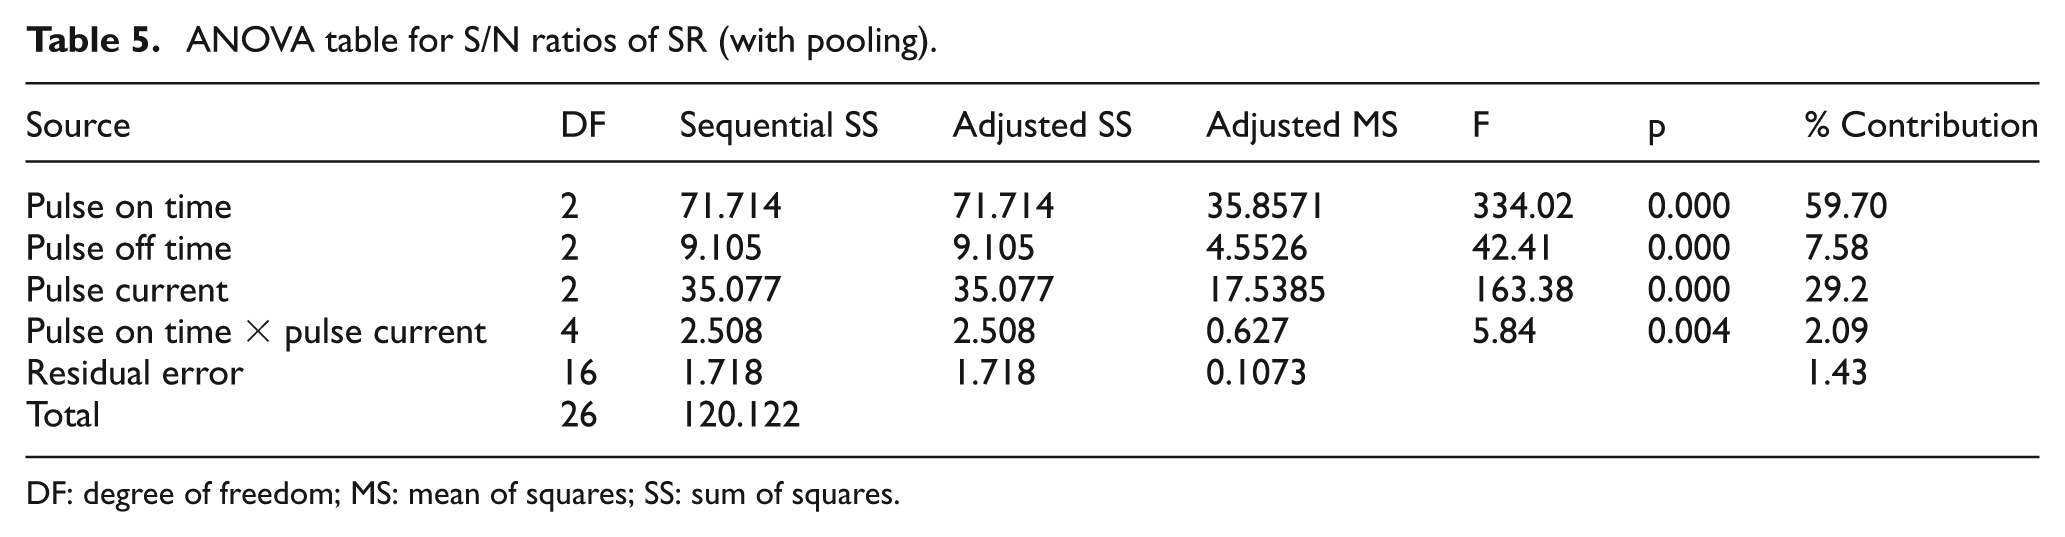
DF: degree of freedom; MS: mean of squares; SS: sum of squares.
Average table of S/N ratios for SR.
Response table of means for SR.
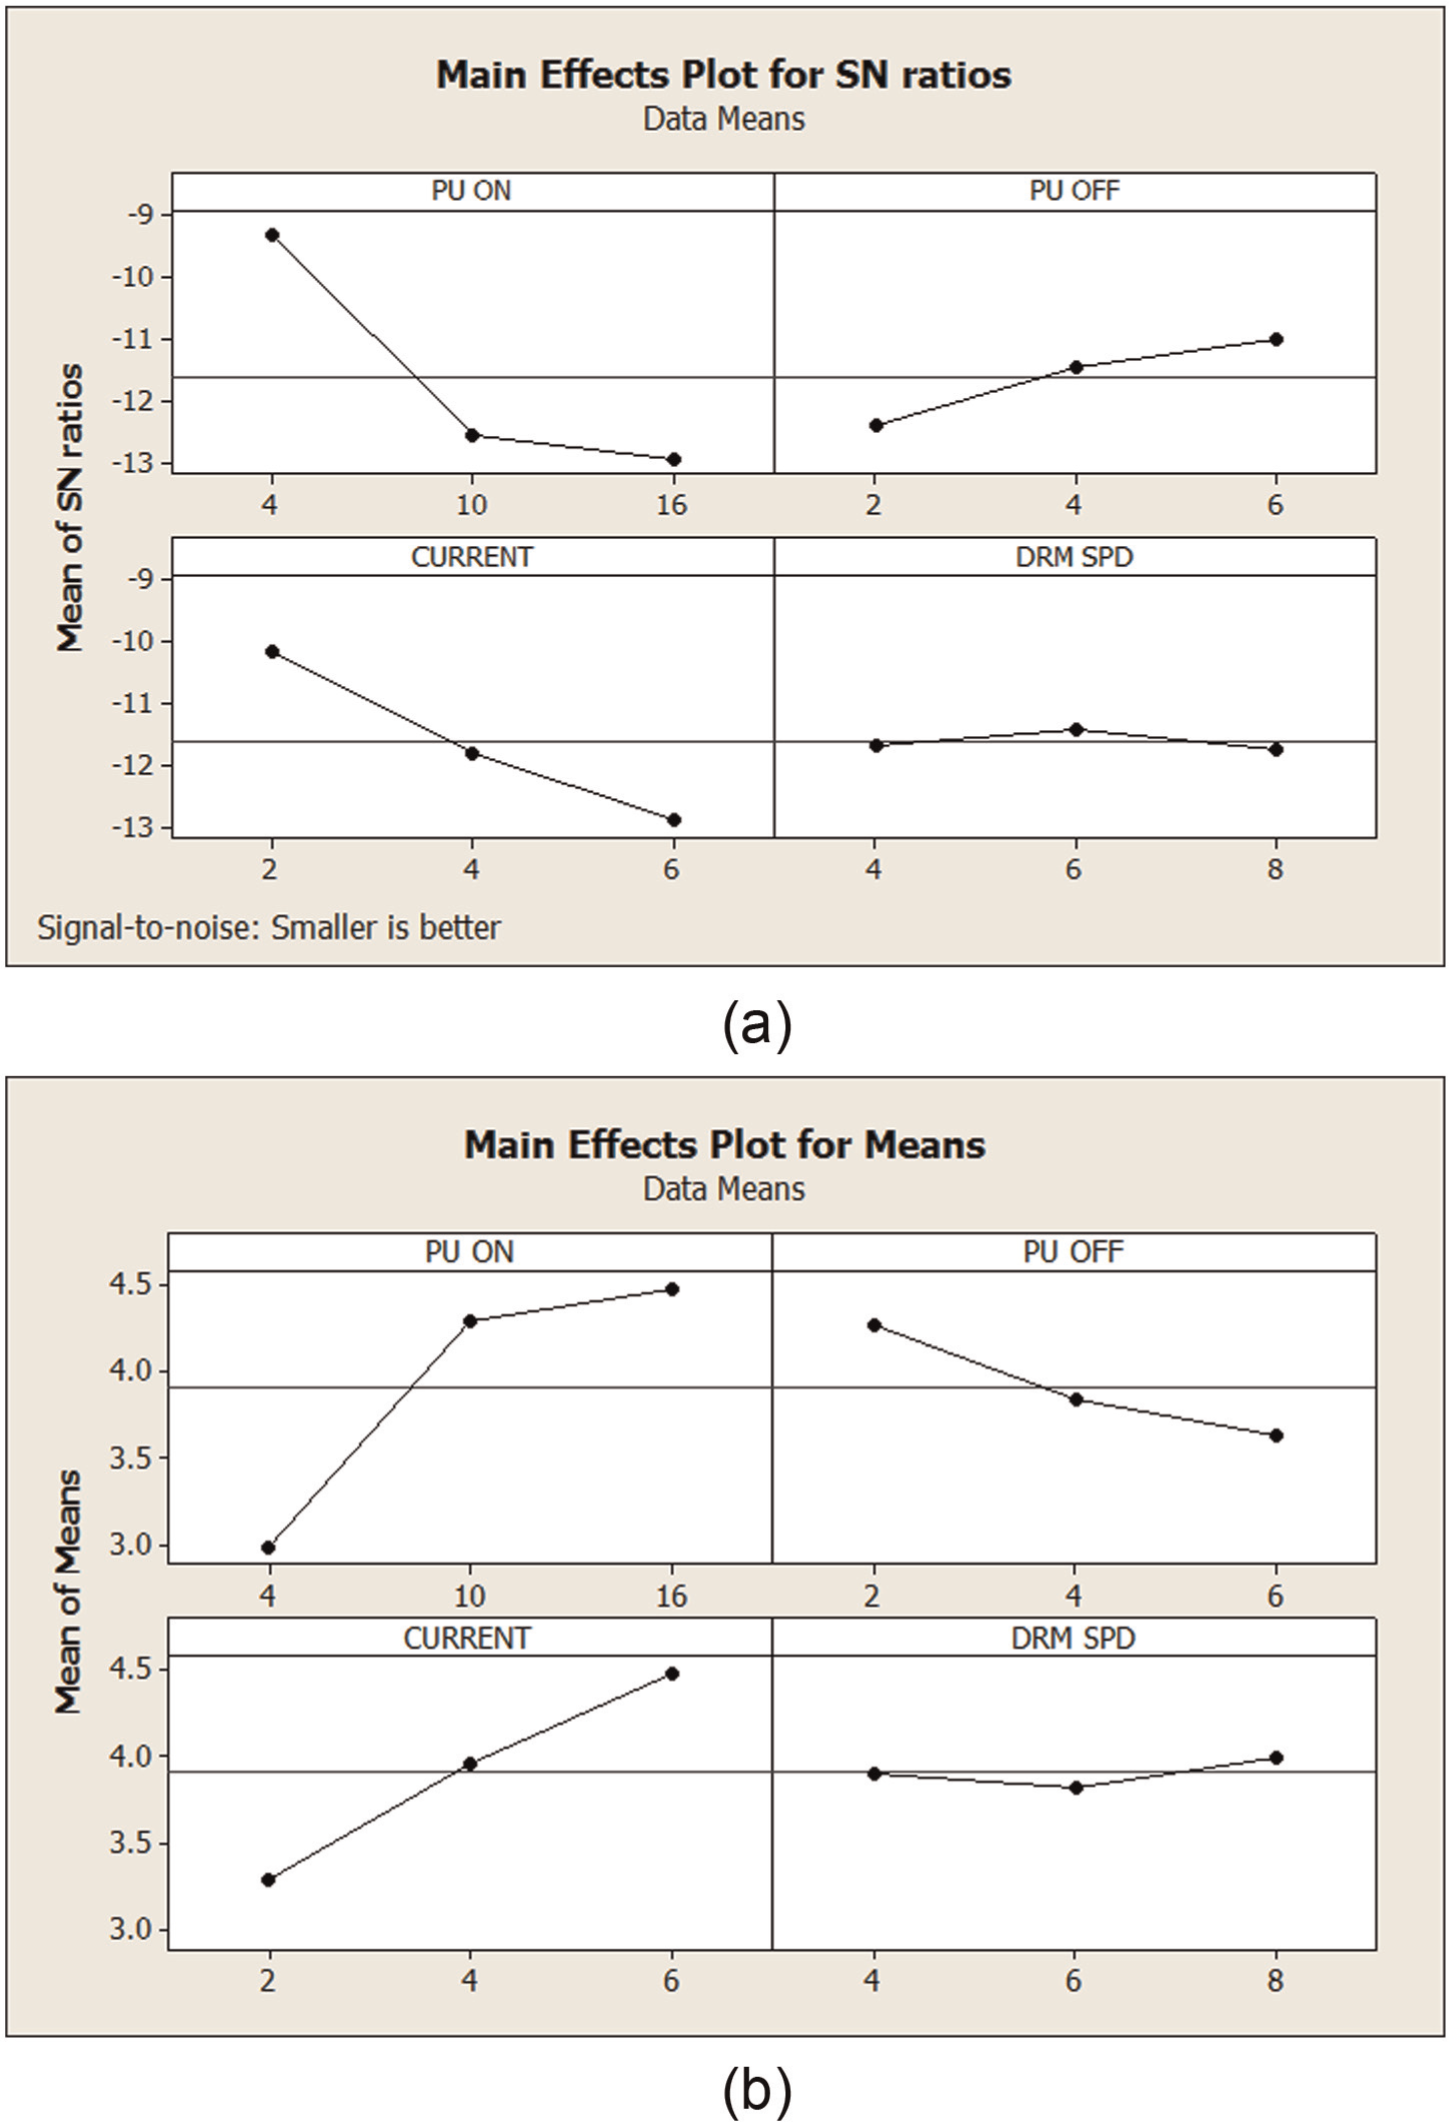
(a and b) Effect of process parameters on SR (main effects) for S/N ratio.
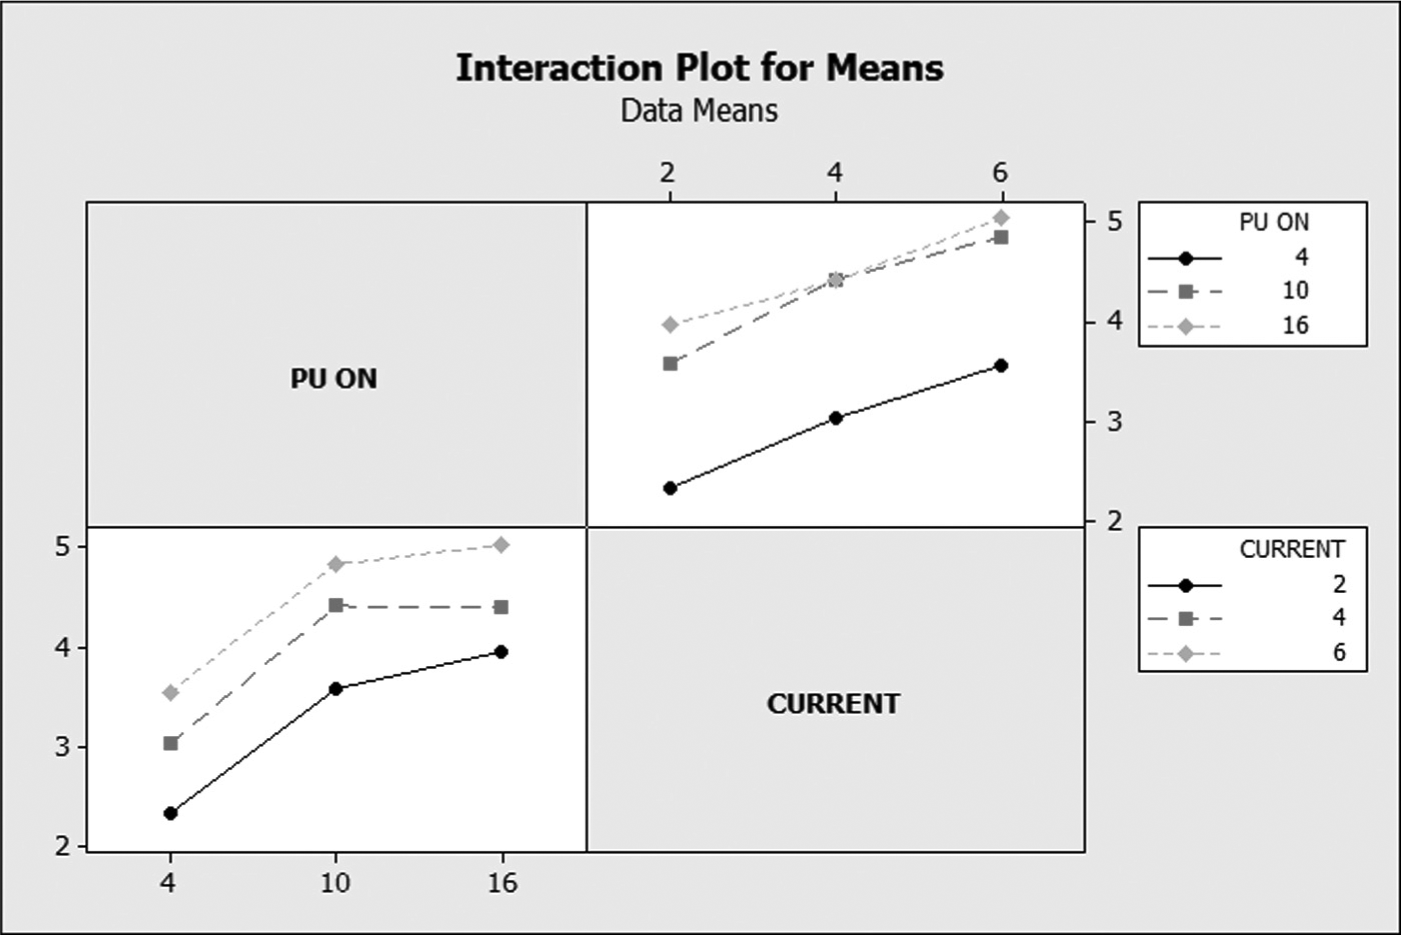
Interaction plot for S/N ratio on surface roughness.
Effect of pulse on time on SR
In WEDM process, the discharge energy produces very high temperature at the point where spark strikes the surface. This causes a minute part of specimen to melt and vaporize.
With each discharge, a crater is formed on the machined surface. Response graph in Figure 3(b) indicates the effect of pulse on time on the SR. The SR value is low at low pulse on time but it increases as the pulse on time increases. This can be explained as follows: lower pulse on time means lower discharge energy per spark resulting in a shallow crater being produced on the surface. This results in low value of SR, that is, smoother surface. Increasing the pulse on time means longer spark duration, that is, more amount of discharge energy per spark reaching the surface. Because of this, large amount of material melts per spark producing deeper and wider size craters. This increases the SR. The influence of pulse on time on the SR is highest as being the most significant parameter. Hence, to obtain good surface finish, the pulse on time should be kept as low as possible. Results from this study are in agreement with other researchers.8–12,15
Effect of pulse current on SR
Figure 3(b) indicates the effect of pulse current on the SR. The SR increases as the pulse current increases. This is because the discharge energy becomes intense with increase in the pulse current. This high intensity spark energy produces more powerful explosion resulting in deeper crater being created and more micro damage being inflicted on the surface. It is obvious that deeper craters will produce high SR. Hence, to obtain good surface finish, the pulse current should be kept as low as possible. Results from this study are in agreement with other researchers.8–10,12
Effect of pulse off time on SR
Figure 3(b) indicates the effect of pulse off time on the SR. The SR decreases as the pulse off time increases. This is because the less number of discharges occur for a specific period of time, resulting in small number of craters and less micro damage on the surface. This gives better surface quality, that is, less SR. Hence, to obtain good surface finish, the pulse off time should be kept as high as possible. Results from this study are in agreement with other researchers. 13
Effect of wire drum speed on SR
Figure 3(b) indicates the effect of wire drum speed on the SR. Although this is not a significant factor contributing to the SR but the response graph trends can be explained as follows. The response graph indicates that at the moderate level, the SR is minimum. SR increased when wire drum speed decreased. This may be because the debris in the gap is not flushed away quickly leading toward promoting the recast layer. At moderate level, the effective flushing of debris coupled with smear effect by the molten droplets on the cavities created by particle pull out results in lower value of SR. When wire drum speed increases from moderate level to higher level, the SR increased. It might be because the higher drum speed contributing to particle pull out and leading to creation of large size cavities and voids.
Figure 4 illustrates the interaction plot between pulse on time and pulse peak current. The plot reveals that pulse on time has the larger effect on the SR than that of pulse peak current.
Estimation of optimum performance characteristic
The optimum value of SR is predicted at the selected levels of significant parameters. The significant process parameters and their optimum levels are chosen from the response graph as A1, B3 and C1, that is, pulse on time at 4 µs, pulse off time at 6 µs and current level at 2 A.
The estimation mean of response characteristic can be computed as18,21
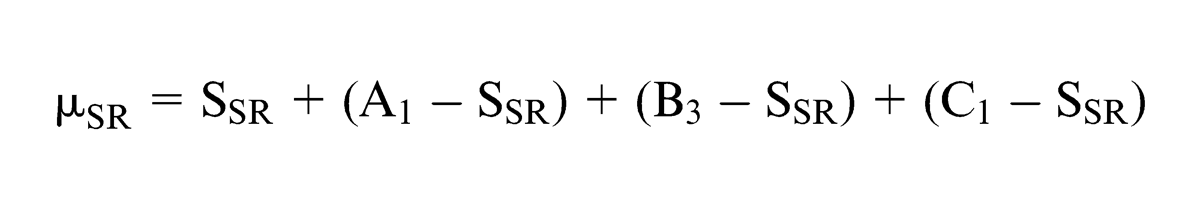
where SSR is the overall mean of SR = 3.914 µm.
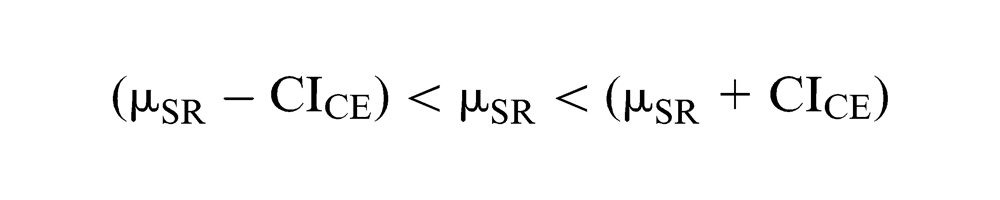
The CI for the predicted mean for the confirmation experiment can be calculated by the expression 20
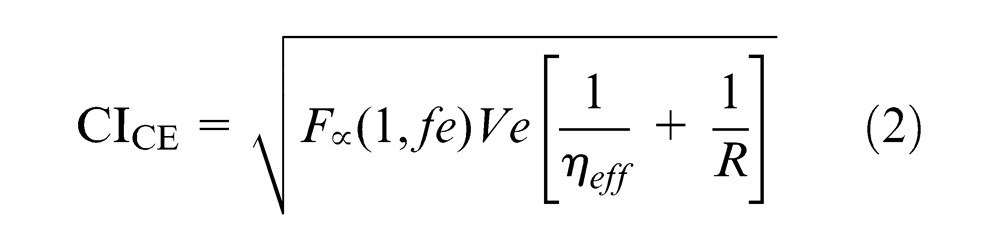
where
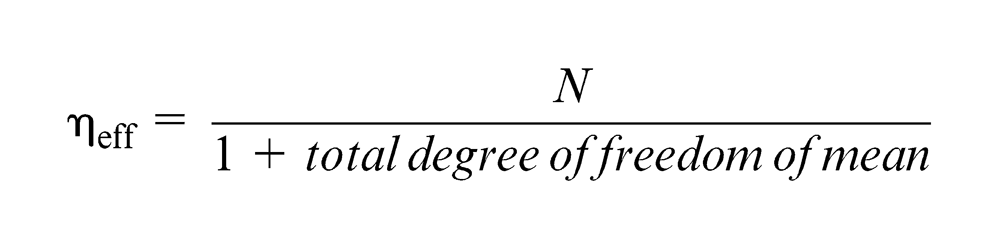
Therefore, ηeff = 27/(1 + 10) = 2.454.
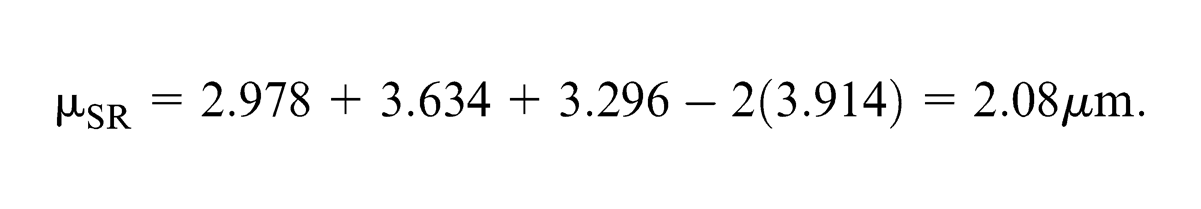
Sample size for confirmation experiment R = 1. Tabulated F ratio at 95% CI (α = 0.05); F = 4.49. So CICE = ± 0.72. The predicted mean of SR is µSR = 2.08. At 95% CI, the predicted optimum SR is

Confirmation test
Three confirmation tests are conducted at the optimum level of process parameters. The average mean value of SR is found to be within the CI reported in Table 8. The estimated error between predicted mean value and experimental average value is 3.46%.
Response at optimum levels of process parameters.
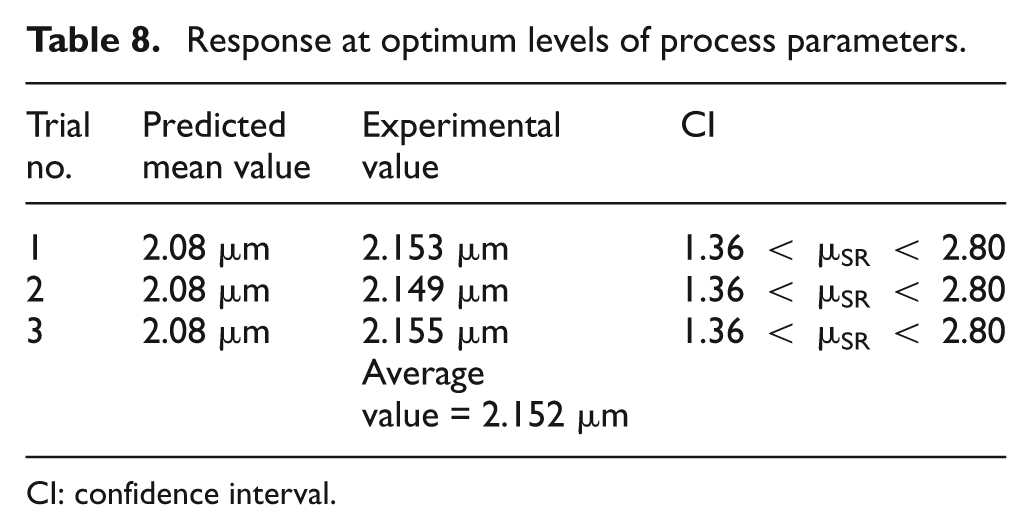
CI: confidence interval.
Microstructure and recast layer
To assess the surface measurement results, the SEM study of the machined surface is conducted. The SEM pictures of the machined surface of the 15 wt% (Al2O3/SiC)p/Al-7075 hybrid composite are shown in Figure 5(a)–(d) at various levels of parameter settings. In WEDM process, the molten material resulted due to discharge energy is getting blasted out of the surface by discharge pressure. This blasted material leaving the surface also quickly reaches to resolidification due to drastic cooling by the dielectric fluid and the substrate bulk material being at room temperature. This action produces craters and ridge rich surfaces in the WEDM process. The resolidification of this molten material that is not flushed away by the dielectric fluid forms a hard and brittle layer called white layer or recast layer. This resembles to liquid-like formation on the machined surface. This white layer contains craters, globules and the black patches. All the pictures show the evidence of melting of workpiece material due to WEDM process. Figure 5(a) shows the machined surface at lowest level of the parameter setting. The surface morphology shows that liquid-like formation is spread quiet evenly on the machined surface. The SR value is low due to less spark energy at this setting. Figure 5(b) shows the machined surface at moderate level setting of process parameters indicating the moderate effect of spark energy. The close observation of the SEM picture shows discrete localized pools of the molten metal formed during machining and getting resolidified on the surface. Figure 5(c) shows machined surface at higher setting of the process parameters. The craters are created by the intense discharge energy. The voids and craters are also created due to reinforcement particle pull out on the machined surface. Also the protruding reinforcement particles in the surface of machined composite make it more distinct from the other metallic surfaces. The black patches might have occurred by the arcing. This clearly indicates that the SR of the machined surface increases with increasing the pulse on time and the pulse peak current for the same volume fraction of the reinforcements. This is because increasing the pulse on time and pulse peak current generates intense discharge energy resulting in widening and deepening of discharge craters. Figure 5(d) is the machined surface under highest level of parameters setting showing the poor surface integrity having high value of SR.
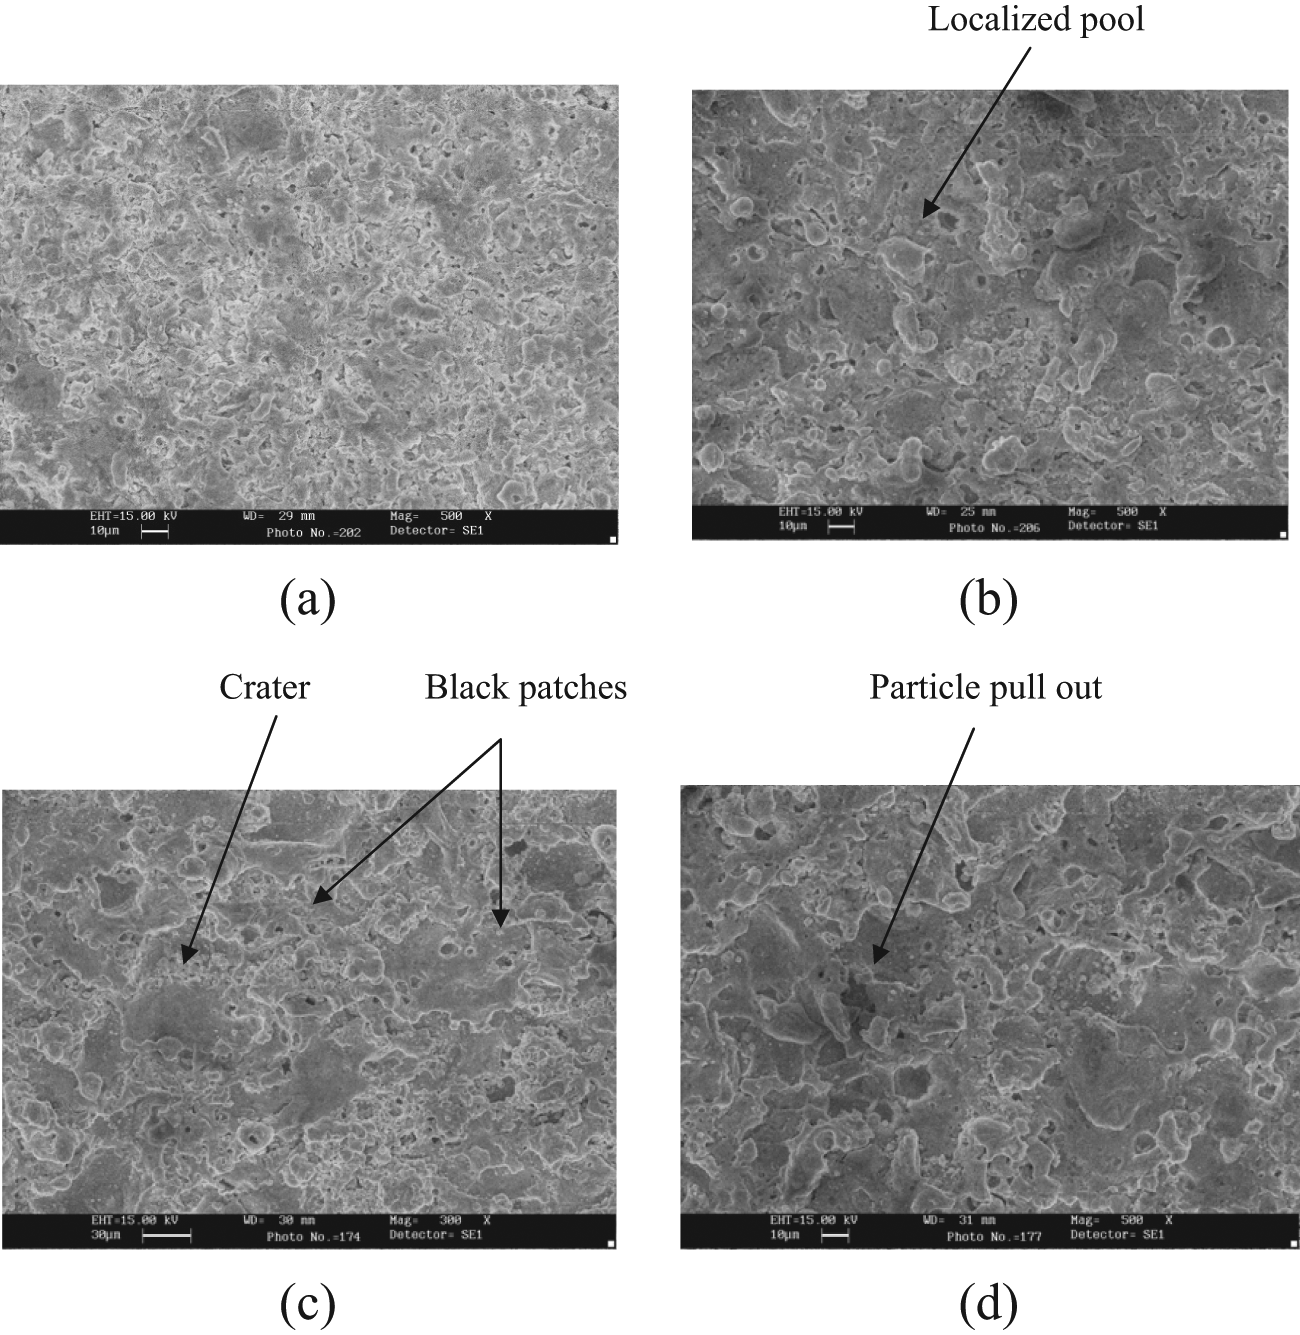
SEM picture of the machined surface of 15 wt%/Al2O3/SiCp/Al-7075 hybrid composite: (a) Pon = 4 µs, Poff = 2 µs, Pcur = 2 A, Ws = 4 m/min; (b) Pon = 10 µs, Poff = 4 µs, Pcur = 4 A, Ws = 8 m/min; (c) Pon = 10 µs, Poff = 4 µs, Pcur = 6 A, Ws = 4 m/min; and (d) Pon = 16 µs, Poff = 2 µs, Pcur = 6 A, Ws = 8 m/min.
Conclusion
Hybrid MMC of 15 wt% Al2O3 and SiC particulates (7.5% each) in Al-7075 alloy was prepared using inert gas–assisted electromagnetic stir casting process. The cast hybrid composite was machined on wire EDM. The following conclusions are drawn:
The linear parameters (pulse on time, pulse off time, pulse current) and interaction (pulse on time × pulse peak current) had significant effect on the SR.
The SR increases with increase in pulse on time and pulse current but decreased with increasing the pulse off time.
The average experimental value in confirmation test for SR (2.152 µm) is found to be close to the predicted value (2.08 µm) at optimum level of input process parameter. This was within an error of 3.46%.
The optimum value of process parameters for the minimum value of SR (2.08 µm) is pulse on time 4 µs, pulse off time 6 µs and pulse peak current at 2 A.
The surface topography analysis shows that SR is high at high level of process parameters setting. Liquid-like formation is observed in all the SEM pictures.
Footnotes
Appendix 1
Declaration of conflicting interests
The authors declare that there is no conflict of interest.
Funding
This research received no specific grant from any funding agency in the public, commercial or not-for-profit sectors.