
Abstract
DIN 1.4542 alloy is one of the most important hardening stainless steel alloys used in the aerospace industries. Wire electrical discharge machining is a suitable process for accurate shaping and is used in situations where complex shapes or hard materials need to be machined. However, wire electrical discharge machining generates surfaces that have poor surface integrity properties, such as high surface roughness and white layer. Based on our knowledge and information, it has never been investigated so far. So, in this experimental research, effects of machining parameters, such as the power, time-off, voltage and servo and number of finish passes on the surface integrity (i.e. the surface roughness and maximum thickness of white layer) were investigated by using analysis of variance and regression analysis. Then the optimization of machining parameters was carried out using a signal-to-noise ratio and micro-genetic algorithm methods. Finally, confirmation tests were conducted to verify the performance of the optimization methods. From the results, significant effects of the discharge current and number of finish passes on the surface roughness and thickness of white layer can be seen. Based on the micro-genetic algorithm optimization method, a reduction of 52% and 67% in the surface roughness and thickness of white layer, respectively, is observed.
Keywords
Introduction
Recently aerospace industries need to replace titanium alloy with high-strength alloys like hardening martensitic stainless steel (e.g. DIN 1.4542) because of its high strength, corrosion resistance and ability to work in high temperatures and at high load.
Wire electrical discharge machining (WEDM) is the greatest advantageous method for removing material1–7 and it is a suitable process when the workpiece material, such as DIN 1.4542 stainless alloy, is difficult to machine owing to high hardness and high strength. WEDM is an electro-thermal method that has damaging impact on surface integrity of machined surface such as tiny craters, micro-void and white layer. During machining, a portion of the workpiece is melted by small sparks and it is removed by a dielectric circulation system. The remaining material rapidly resolidifies to form a surface layer known as the white layer. The heat affected zone (HAZ) is under the white layer. The white layer and HAZ makes the WEDM surface susceptible for cracking and results in the reduction in fatigue strength.5,7–9 Decreasing and removing the damaging layer causes the improvement of surface integrity and enhancing the mechanical properties such as the fatigue strength. 10 Owing to the fact that final WEDM surfaces should be improved by a complementary operation such as grinding, the investigation of surface characteristic of WEDM surfaces is very crucial.
Literature review
Electrical discharge machining (EDM) is well known to have a large detrimental effect on surface integrity.10,11 In WEDM, surface integrity includes investigation of surface roughness, micro cracks, phase transformation, surface alloying white layer and mechanical properties.3,8,12–14 For this reason, investigation and optimization of a characteristic WEDM surface is very vital in aerospace industries. During the WEDM process, the surface roughness decreases with decreased discharge power or discharge current, energy per spark and pulse duration.7,14–17 It has been shown that a discharge current is more effective than voltage and time off on surface roughness.14,15 White layer thickness increases with an increase of energy per spark, pulse duration, pulse current7,8,18 and decreases with an increase of frequency. 7 Also, utilizing multi-cut passes decreases the surface roughness and white layer thickness.3,13
In many papers, some attempts have been made to optimize the WEDM process by single- and multi-objective optimization methods. Furthermore, the modeling of the WEDM process was investigated by using artificial neural networks (ANN). Time series techniques, simulated annealing algorithm, artificial bee colony and signal-to-noise ratio analysis were used to characterize the WEDM surface.14,18–26
Recently, in laser machining, cutting parameters such as laser power and cutting speed have been optimized with consideration of workpiece surface roughness, top kerf and width of the HAZ. 27 Cutting force, material removal rate and surface roughness in a milling process are optimized by grey relation analysis. 28 Taguchi method, fuzzy logic, genetic and micro-genetic algorithms (micro-GAs) have been used for the multi-objective optimization of manufacturing processes.29–33
Presented papers have offered the optimization of only limited performance characteristics in WEDM machining. However, a few works have investigated the surface integrity, such as surface roughness and thickness of the white layer.5,7,14,22 Furthermore, attention has been focused on only the WEDM of composites, die steel and super alloys,7,15,18 and hardening martensitic stainless alloys, such as DIN 1.4542, has rarely been investigated. The simultaneous optimization of the surface roughness (Ra) and thickness of white layer (W.L.) of DIN 1.4542 stainless steel alloy by using the micro-GA can highlight the novelty of the paper.
In this paper, effects of WEDM parameters, including the power, number of finish passes, time-off, servo and voltage on the surface roughness and thickness of the white layer of DIN 1.4542 stainless steel alloy, have been investigated by using analysis of variance (ANOVA) and regression analysis. The optimization of machining parameters was carried out using the signal-to-noise (S/N) ratio method and micro-GA. Finally, the performance of these two methods was comparatively analyzed.
Since better surface integrity in aerospace industries is crucial, the main objective of this research is maintaining the minimum surface roughness and thickness of the recast layer.
Experimental setup and equipments
In this research, all experiments were conducted on an ONA R250 5-axis computer numerically controlled (CNC) WEDM machine. The specimens of DIN 1.4542 precipitation hardening martensitic stainless alloy with 16.5% Cr and 4.5% Ni were used. Owing to its appropriate mechanical properties (i.e. 1200 MPa tensile strength and 38 HRc hardness), this alloy is mostly used in the aerospace industry. Additionally, the workpieces were tempered at 496 °C for 4 h to obtain a 38 HRc hardened martensitic structure.
In this paper, two important characteristics of surface integrity, including the surface roughness and maximum thickness of white layer, were investigated. The surface roughness was measured by using a Mahr Perthometer M2 mobile roughness measurement for each section with a 0.8 mm cut-off length (according to DIN EN ISO 3274: 1998). The thickness of the white layer was measured by Axiolab A ZEISS optical microscopy. Specimens were cut for each run of the experimental design as 5 × 8 mm, mounted in epoxy and polished to expose a cross-section of the white layer. To reveal the white layer, specimens were immersed in Marble etchant composed of 10 g CuSO4, 50 ml Hydrochloric acid and 50 ml water for 40 s.
Design of experiments and experimental results
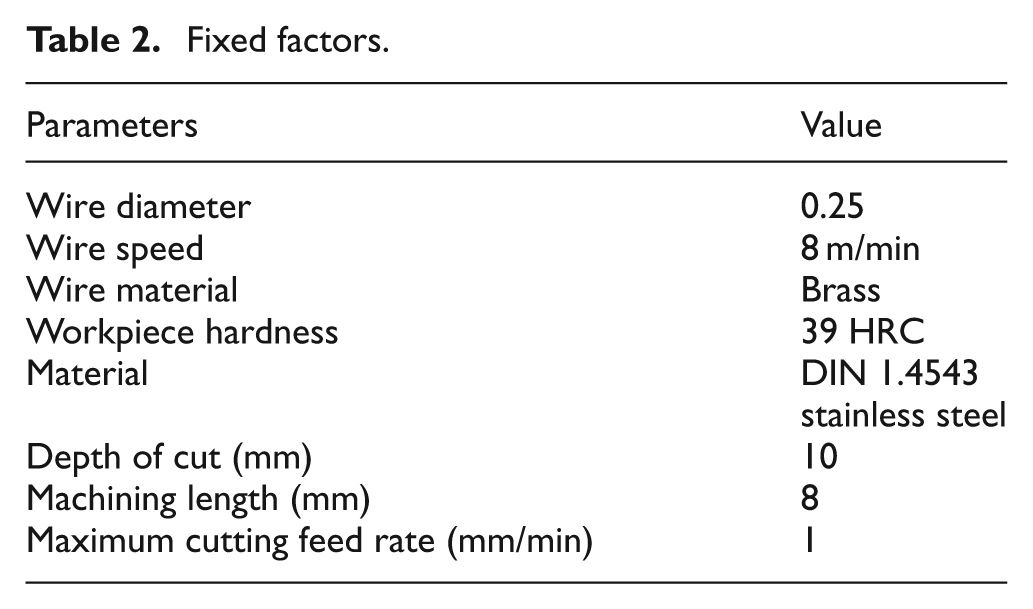
Proper design of the experiment is vital for higher efficiency, accuracy in analyses and reduction in costs. The Taguchi approach used in this paper is one of the useful and most economical methods of design for experiment.34–38 Input factors and their levels and definitions are shown in Table 1. The power, time-off, voltage, servo, invers and number of finish passes are chosen as input factors. For an inverse factor, two levels are selected, and for other factors, three levels are chosen. These factors and their levels are selected according to the ONA (ONA ELECTRO-EROSION, Durango, Bizkaia, Spain) technology manual and initial experiments implemented for finishing operations and preventing wire breakage. It should be noted that the inverse is only recommended while the very high surface quality is sought and the materials being worked on are well suited to electrolysis, such as titanium and hard metals. Fixed factors are presented in Table 2. These factors have an insignificant effect on the process performance including surface roughness and maximum thickness of white layer. It should be noted that the deionized water is applied as dielectric.
Factors and levels of experimental design.
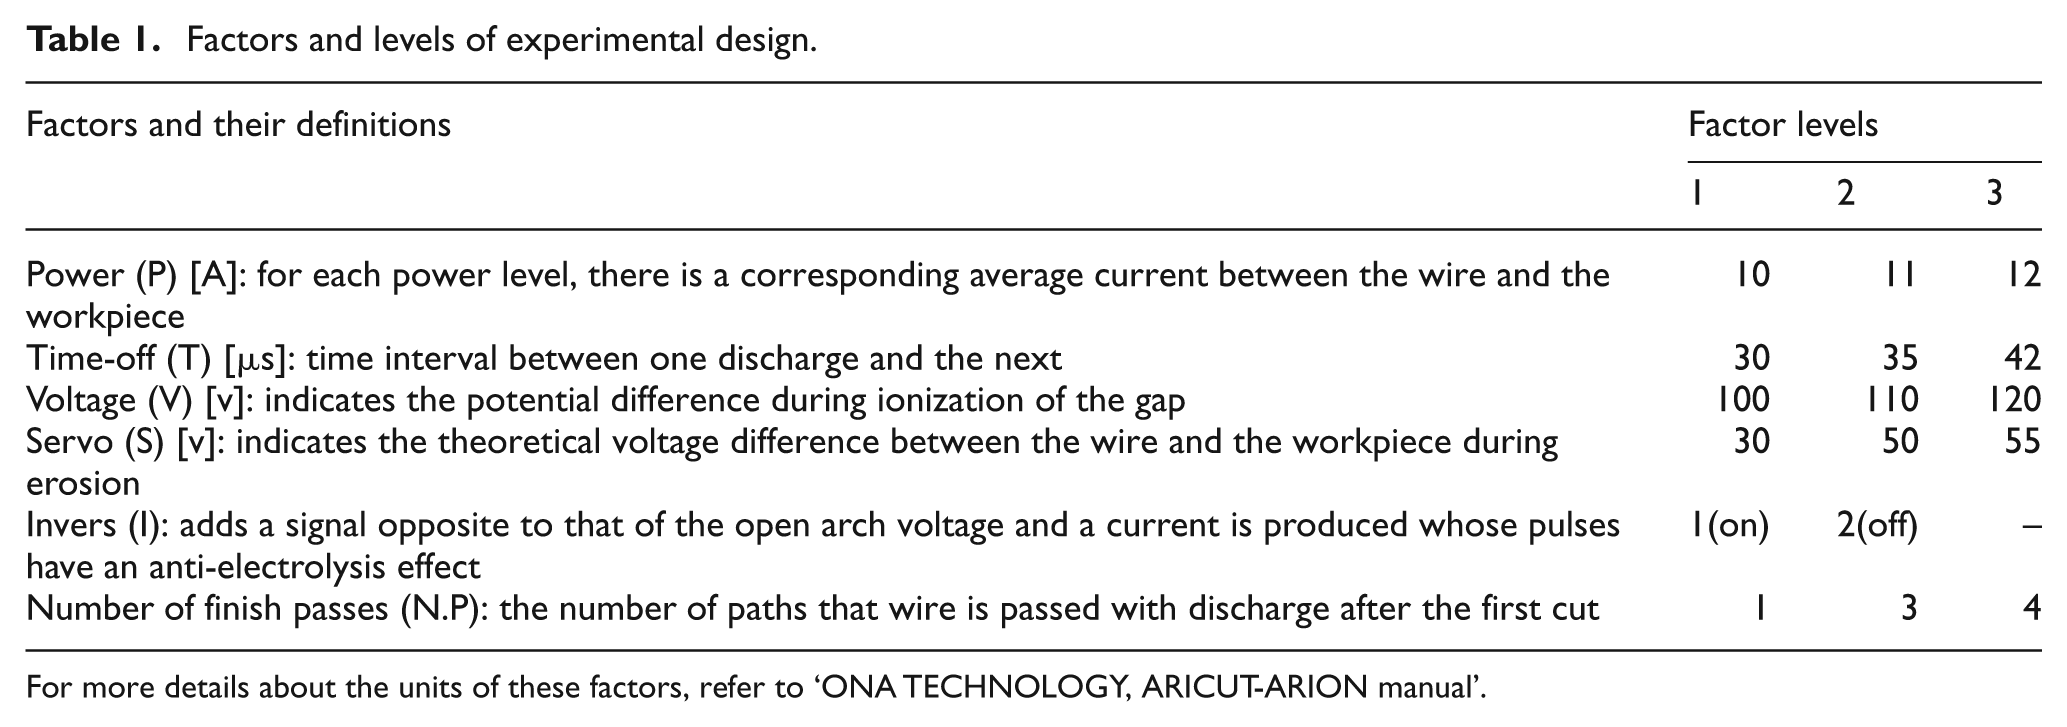
For more details about the units of these factors, refer to ‘ONA TECHNOLOGY, ARICUT-ARION manual’
Fixed factors.
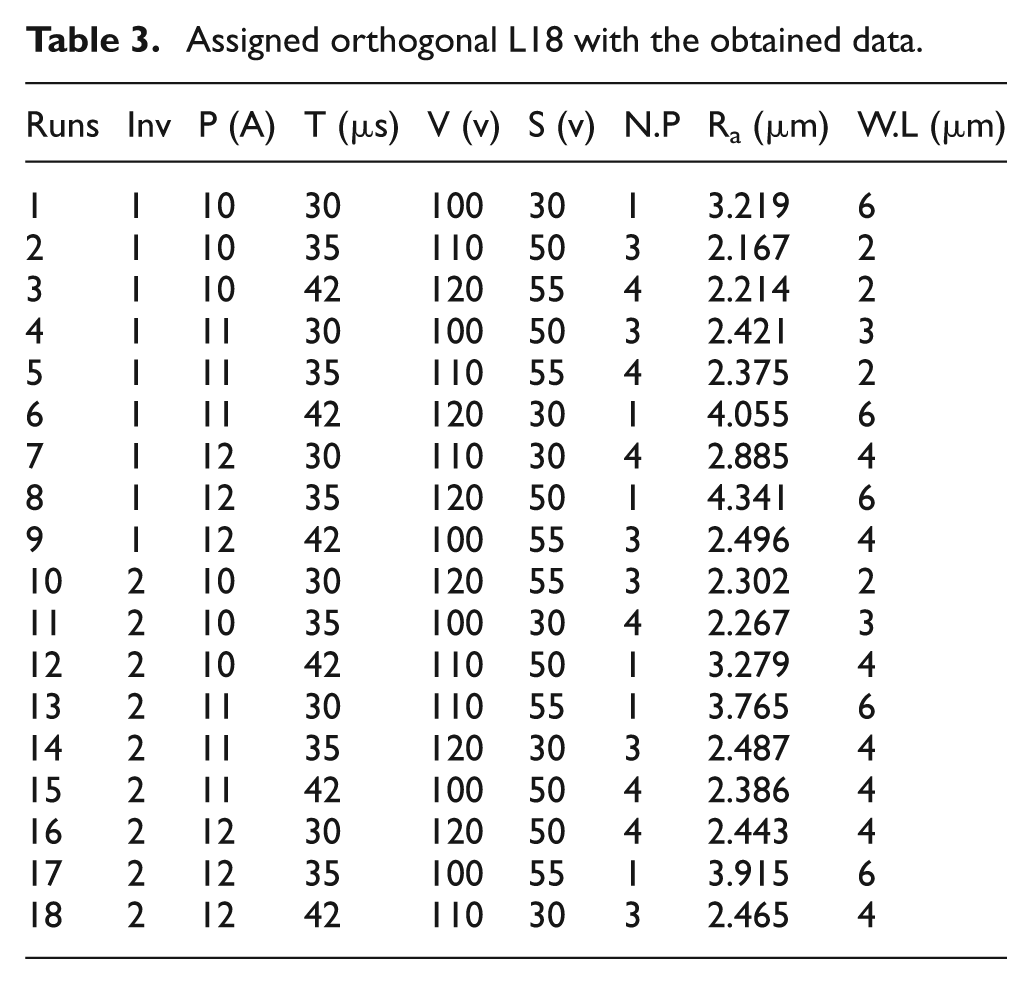
Assigned orthogonal L18 with the obtained data are shown in Table 3. In this table, Ra and W.L refers to the surface roughness and maximum thickness of white layer, respectively.
Assigned orthogonal L18 with the obtained data.
Each sample is investigated three times for finding out the thickness of white layers and surface roughness. A white layer, usually referred to as the white layer owing to its resistance to etching on ferrous material. During the experiments, light of the optical microscope is adjusted to reveal the white layer. It was found that the thickness of white layer ranged from 2 to 6 µm. Figure 1(a) and (b) shows the obtained white layer and its value.

(a) Micrograph of polished and etched in marble etchant under following machining condition: Invers=on P = 10A T = 20 µs V = 100 v S = 30 v N.P = 1. (b) Maximum thickness of the white layer
The results of some other experiments, with their machining condition and measured surface roughness and maximum thickness of white layer, are shown in Figure 2. No cracks on the HAZ can be recognized in all samples, possibly because of good thermal conductivity of DIN 1.4542, which agrees with other published reports for WEDM of brass and the same grade of stainless steel.3,8 Across all the experiments, there isn’t any evidence of micro-cracks owing to the high tensile strength of DIN 1.4542. During WEDM, cracking will usually occur if the localized stresses exceed the fracture strength of the base material.
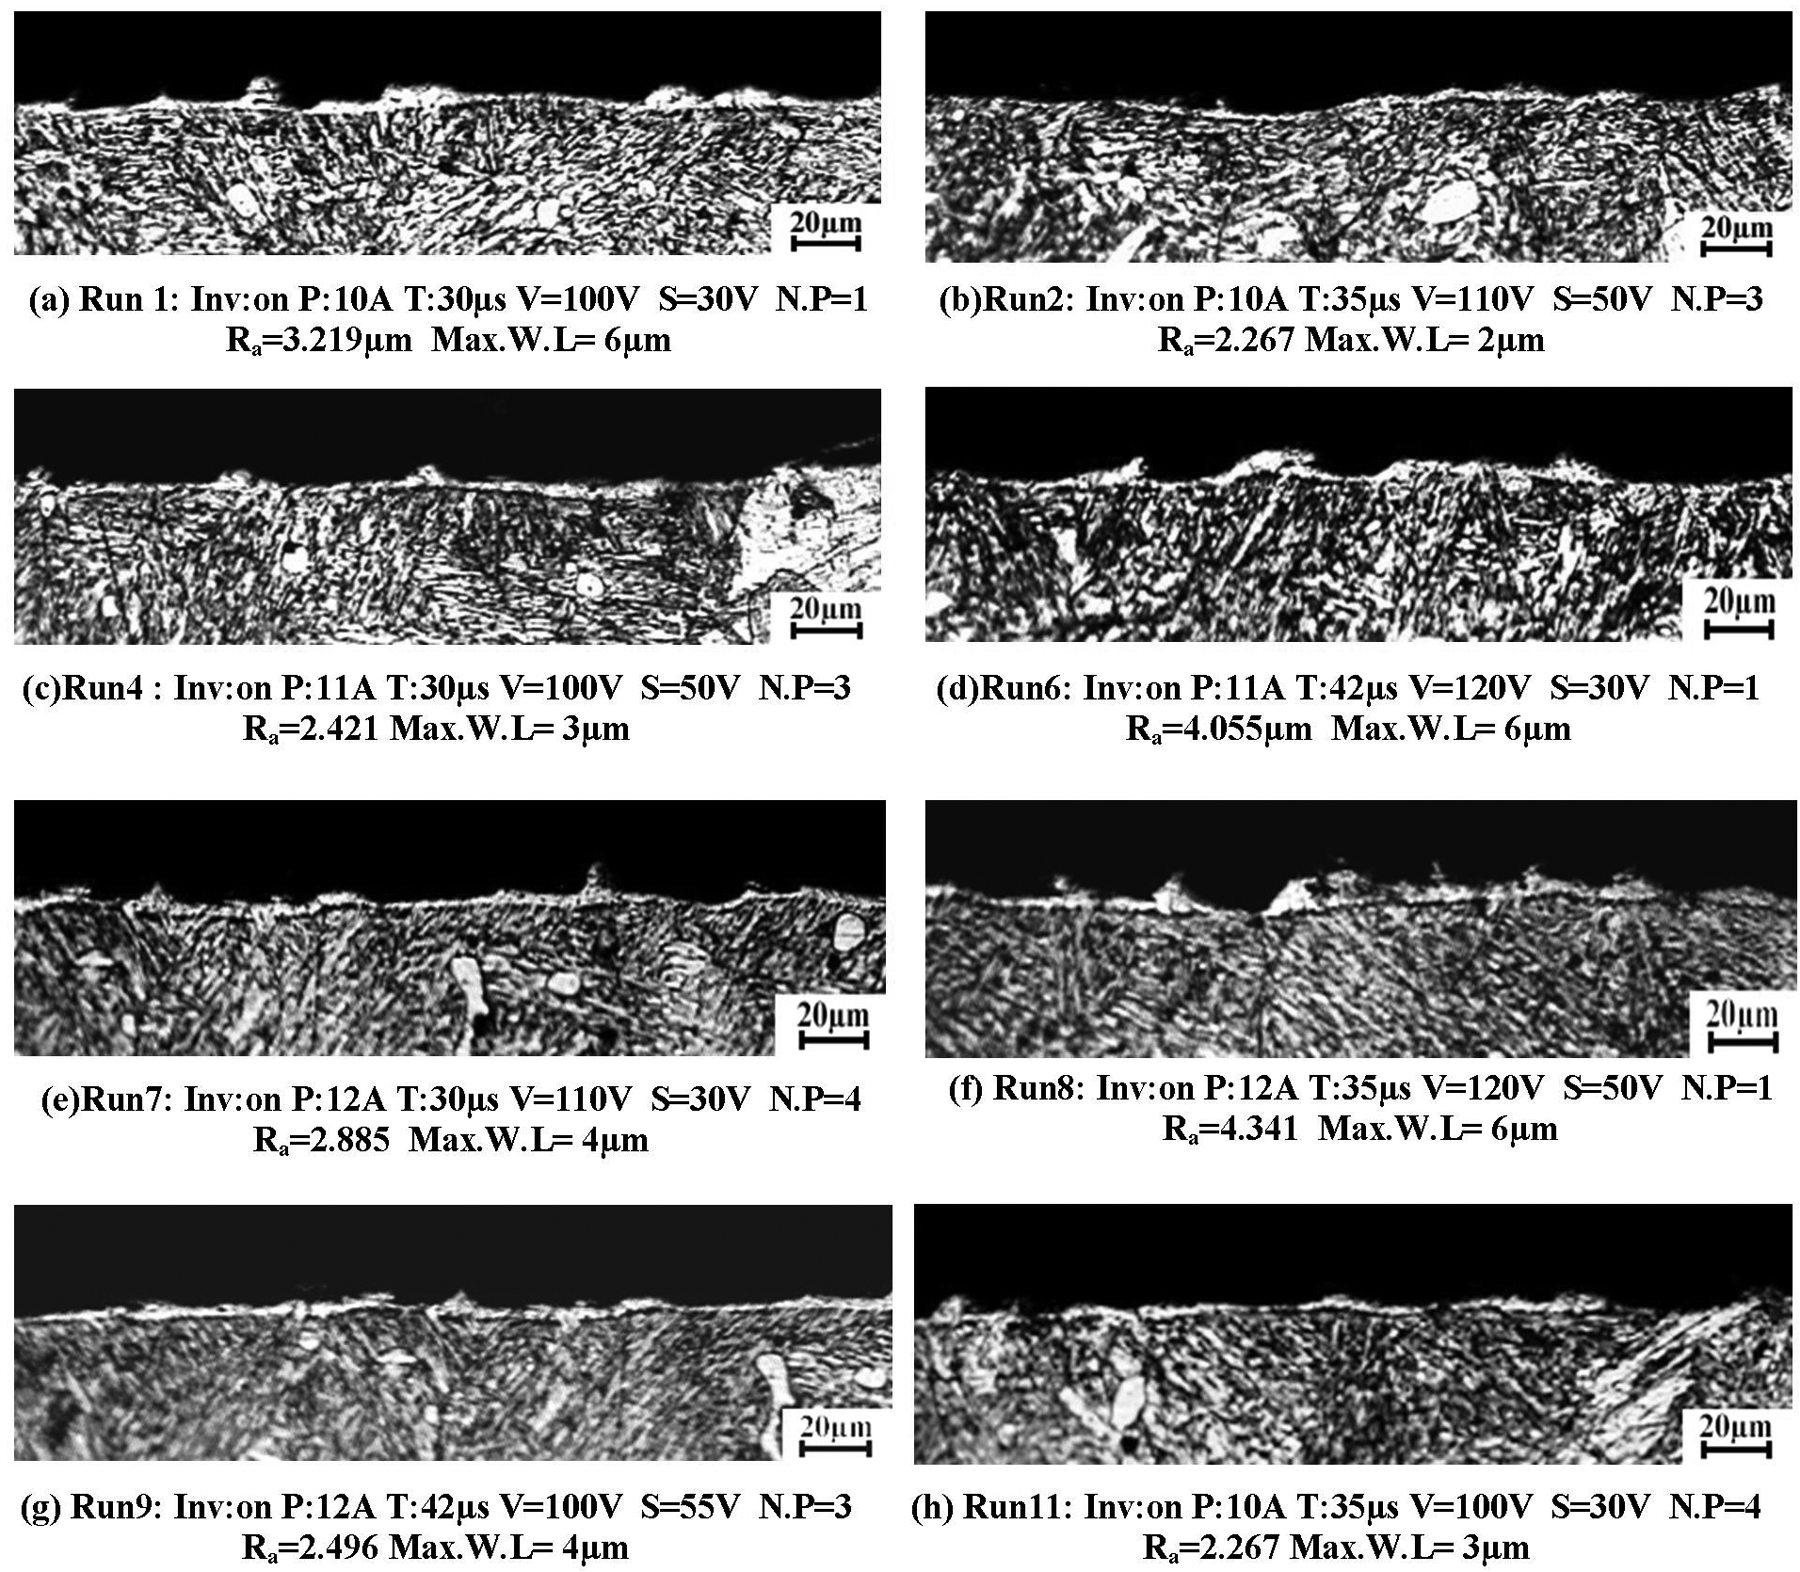
Cross-sectional micrograph of specimens after WEDM under different machining conditions. Thickness of the white layer and surface roughness were indicated below the micrograph from (a) to (h).
Data analysis and discussion
Effect of factors
ANOVA is used in this research to investigate the effect of different factors on the surface roughness and thickness of the white layer. By assuming that residuals are normally distributed and independent, and the variance is constant, this analysis tests the null hypothesis in which each factor (and interaction) is assumed to have significant effect on the response. 38 If ANOVA (by means of P-values) implies that the null hypothesis is to be rejected, it will be concluded that the corresponding factor has no significant effect on the process. When P-value is less than 0.05 (confidence interval is 95% in this research), it indicates that errors are not normally distributed. 38
Tables 4 and 5 present the results of ANOVA for surface roughness and maximum thickness of the white layer, respectively. In these tables, DF denotes degree of freedom and, sequential sum of squares and adjusted mean squares are respectively designated by Seq SS and Adj MS.14,38
Analysis of variance for Ra.
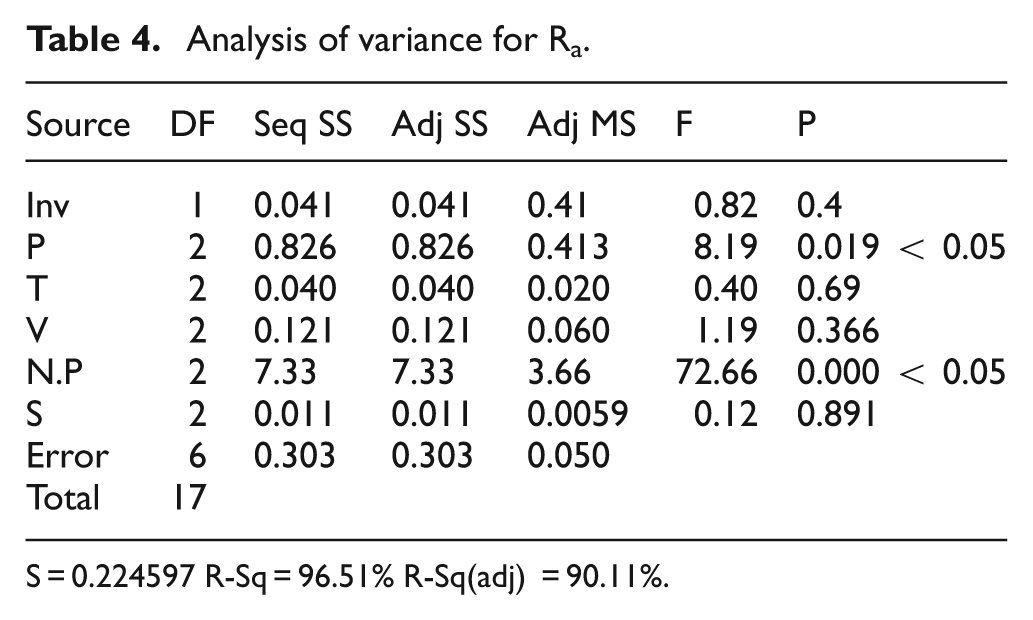
S = 0.224597 R-Sq = 96.51% R-Sq(adj) = 90.11%
Analysis of variance for W.L.
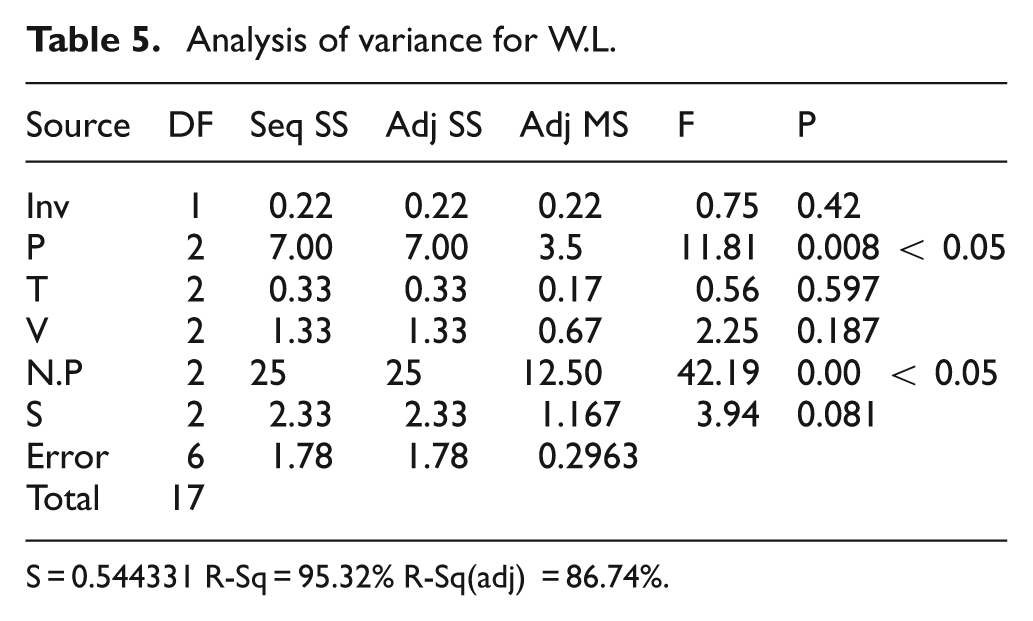
S = 0.544331 R-Sq = 95.32% R-Sq(adj) = 86.74%
As shown in Tables 4 and 5, the power and number of finish passes have the most influence on the surface roughness and thickness of white layer, respectively. Figure 3 shows effects of factors on the surface roughness and thickness of the white layer.
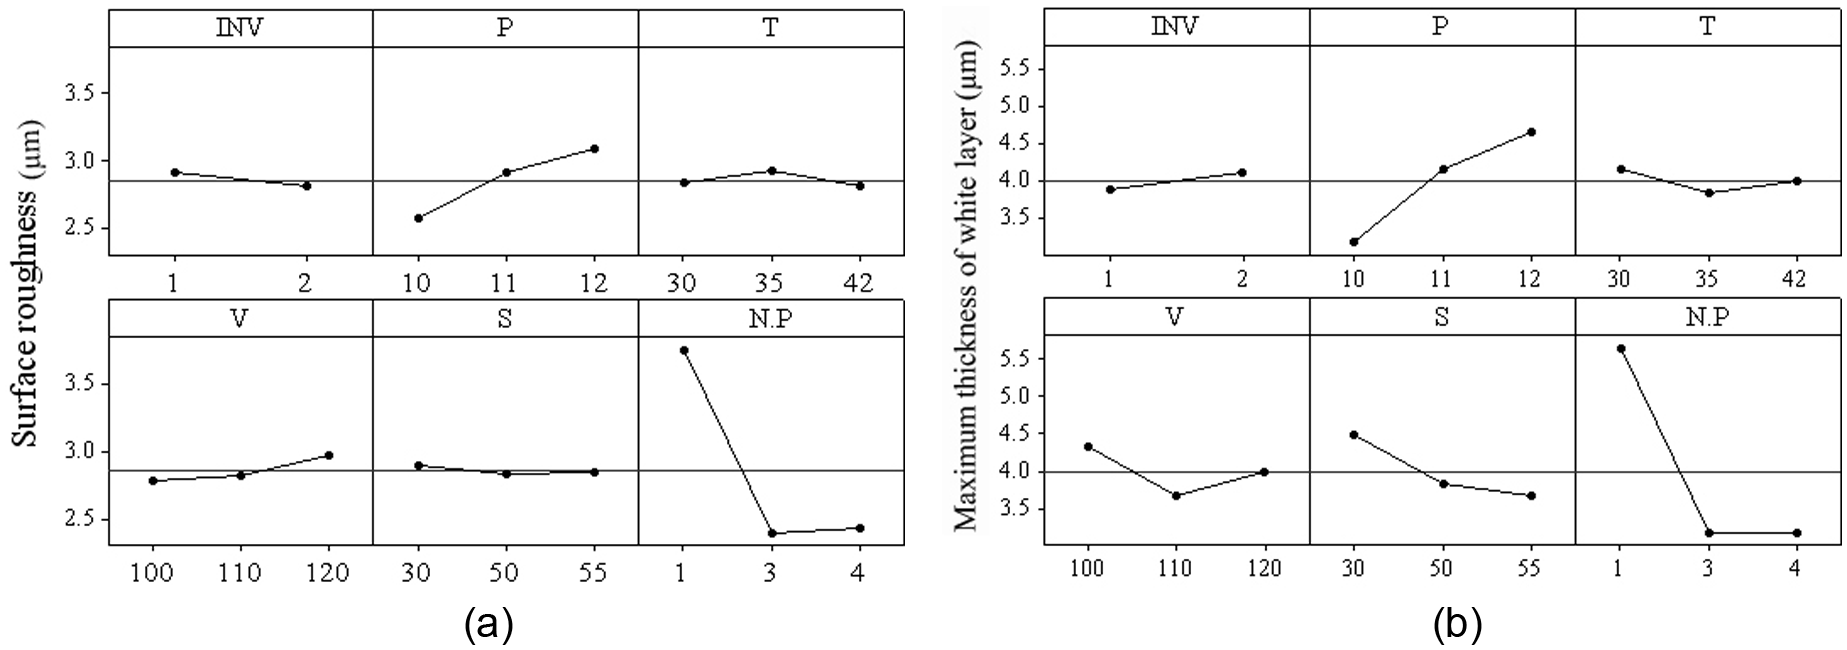
(a) Effect of factors on Ra, and (b) effect of factors on thickness of the W.L.
According to ANOVA, the surface roughness and thickness of the white layer decreases with the decreased discharge power and increased number of finish passes. The increase of discharge power increases the energy per spark, so, the surface roughness and thickness of the white layer are increased, which agrees with published reports for WEDM of hardened steel.8,20,22 Also, the increase in the number of passes in a remelt of a portion of primary white layer. During the finish pass, cutting is done by less energy spark, 3 for this reason, surface roughness and thickness of the white layer were decreased. Considering Figure 2(f)–(h), by decreasing the discharged power to 10 A and using four passes, the surface roughness is decreased twice as much. In this case the thickness of the white layer is decreased from 6 µm to 2 µm.
Regression analysis
The regression analysis is performed to model the WEDM process and obtain a correlation between factors and responses. The least square method is used in regression analysis to fit a model to the experimental data. 38 In this paper, to obtain the best WEDM process model, two types of statistical models, including linear and exponential expressions, are selected for modeling the surface roughness and white layer.
The linear and exponential regression equations for surface roughness (Ra) are respectively presented in equations 1 and 2
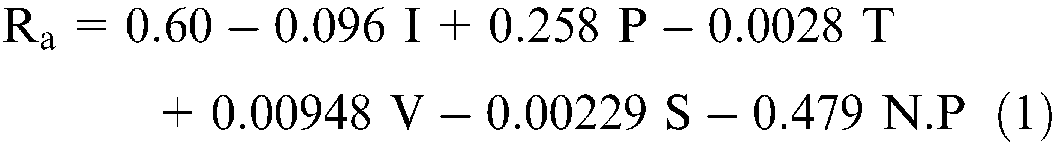
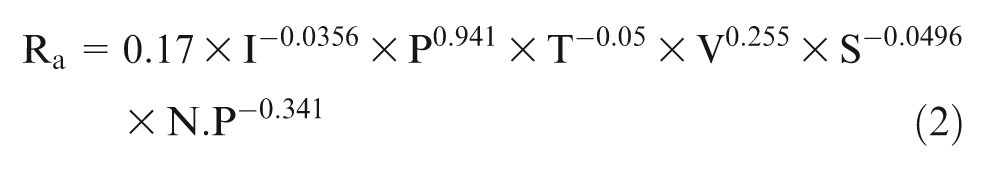
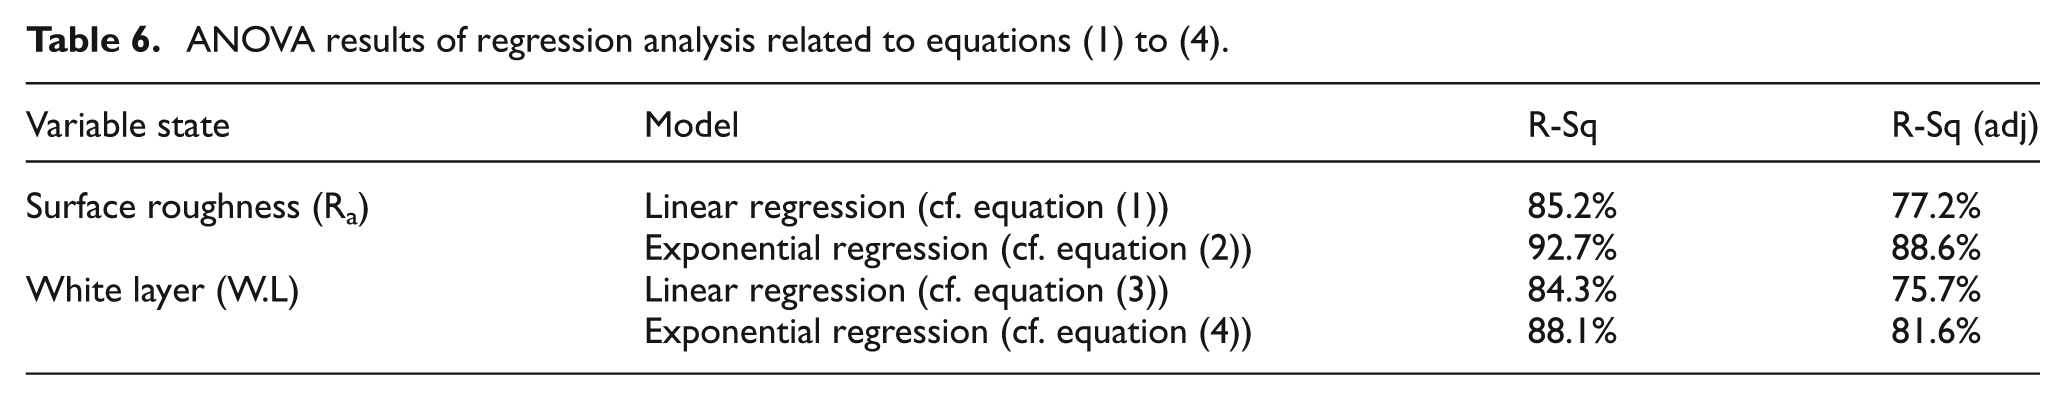
Where I, P(A), T(µs), V(v), S(v) and N.P are machining parameters (see Table.1). The estimated R-Sq and R-Sq(adj) parameters using the regression analysis are shown in Table 6.
ANOVA results of regression analysis related to equations (1) to (4).
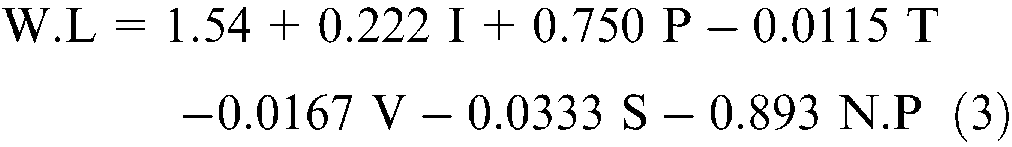
The linear and exponential regression equations for the thickness of the white layer are, respectively, as follows
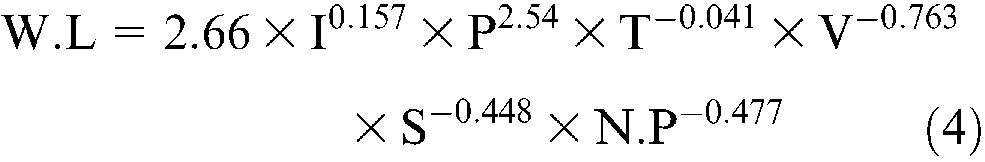
The estimated R-Sq and R-Sq(adj) parameters are shown in Table 6. R-Sq and R-Sq(adj) values show level of accuracy of the statistical model. According to Table 6, exponential equations have shown more proper modeling performance.
Regression models are used as a fitness function in genetic algorithms and so, the accuracy of these models is very vital in the performance of optimization.
Optimization of WEDM process
S/N ratio analysis
S/N ratio method is a single optimization method that is used to find out the optimal factor levels. In this paper ‘smaller is better’ as sense of desirability, is used for responses including the surface roughness and thickness of the white layer. S/N ratio, η, is calculated using the following equation34,35
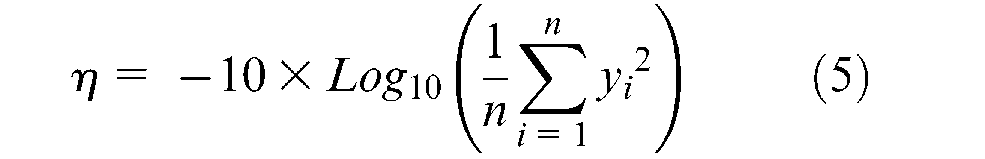
where
Optimal setting for surface roughness and thickness of the white layer.
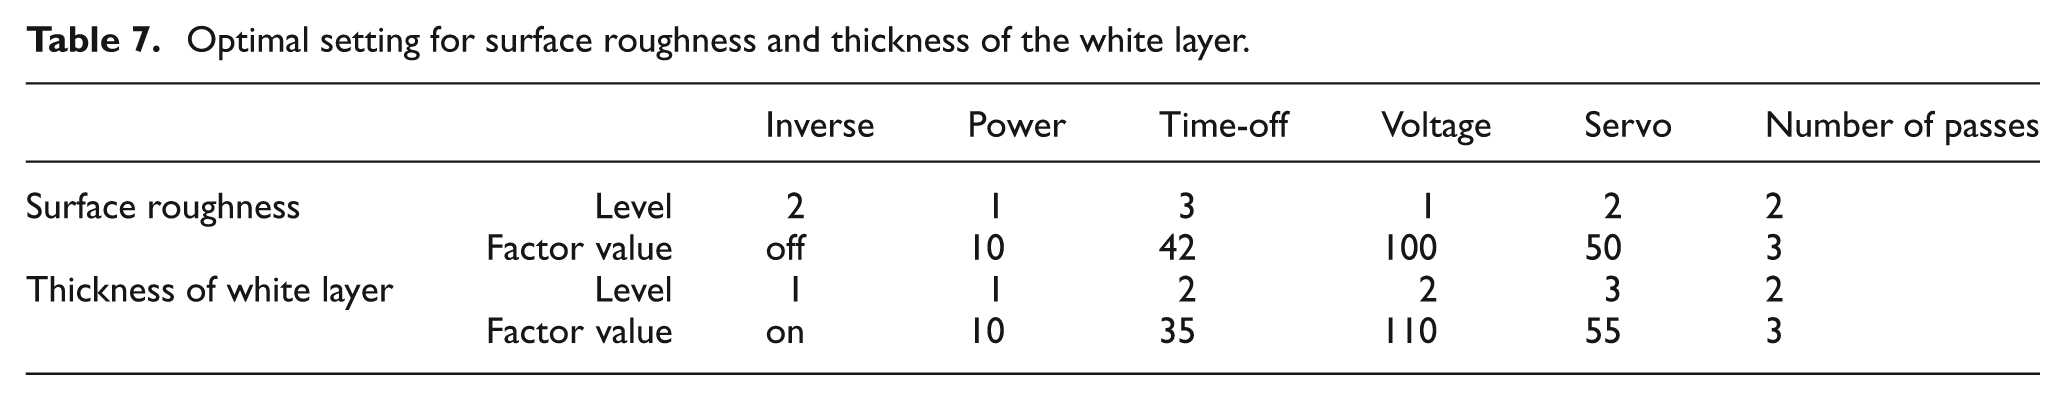
To verify the improvement of the performance characteristics, the confirmation tests are performed. Optimal S/N ratio (
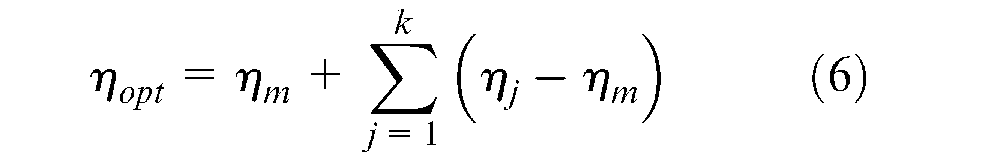
where
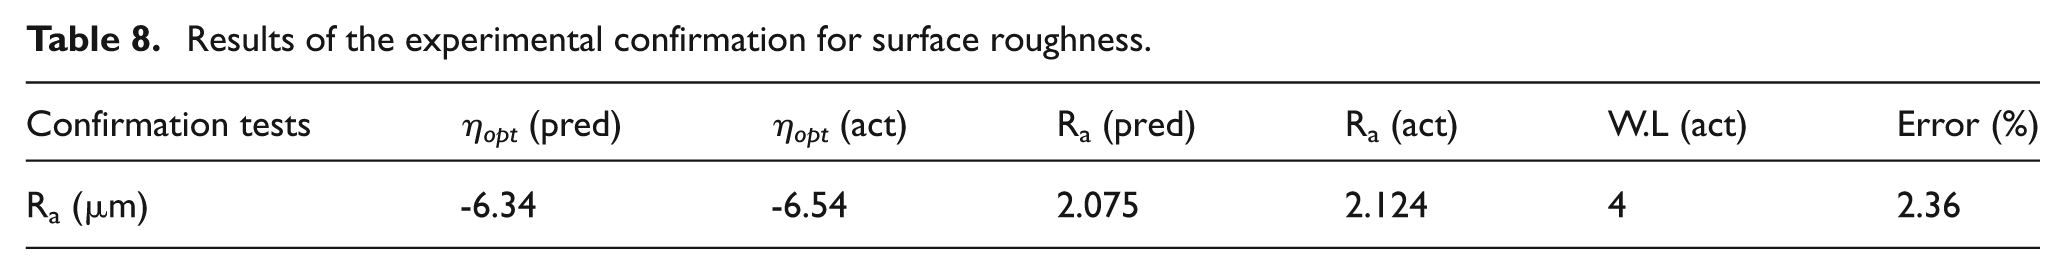
Results of the experimental confirmation for surface roughness.
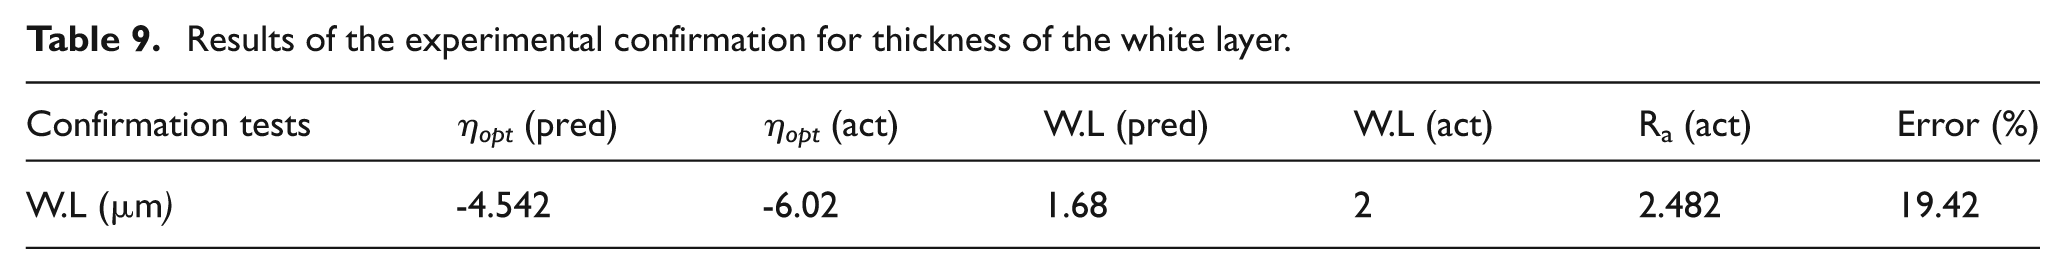
Results of the experimental confirmation for thickness of the white layer.
Multi objective optimization
In this section, the micro-GA, as a multi-objective optimization method, is used to optimize the machining parameters in the WEDM process. The micro-GA is widely taken into consideration by scientists and engineers.39–41 The term micro-GA refers to a small population genetic algorithm with reinitialization. The major advantage of this algorithm lies in the reduction of computational cost and time.31,40–42 As opposed to single-objective optimization methods, which propose only one single optimum solution, multi-objective optimization techniques present a set of alternative optimum solutions. One of the most notable supremacy of micro-GA method over the other methods is to optimize more than one response coincidentally. Moreover, the micro-GA has shown higher speed of convergence in comparison with the conventional genetic algorithm.31,41–42
According to the fundamental genetic algorithm presented by Coello, 40 each generation of chromosome should have a better property than the previous generation. This chromosome can be regarded as a mathematical variable.
The flowchart of the algorithm is shown in Figure 4. As is seen, there are two kinds of memories; (a) the population memory that is used as the source of diversity of approach and, (b) the external memory that is applied to archive member of the Pareto optimal set. The population memory includes two regulatable parts (i.e. replaceable and non-replaceable memories).39–41 However, the optimization steps are as follows.
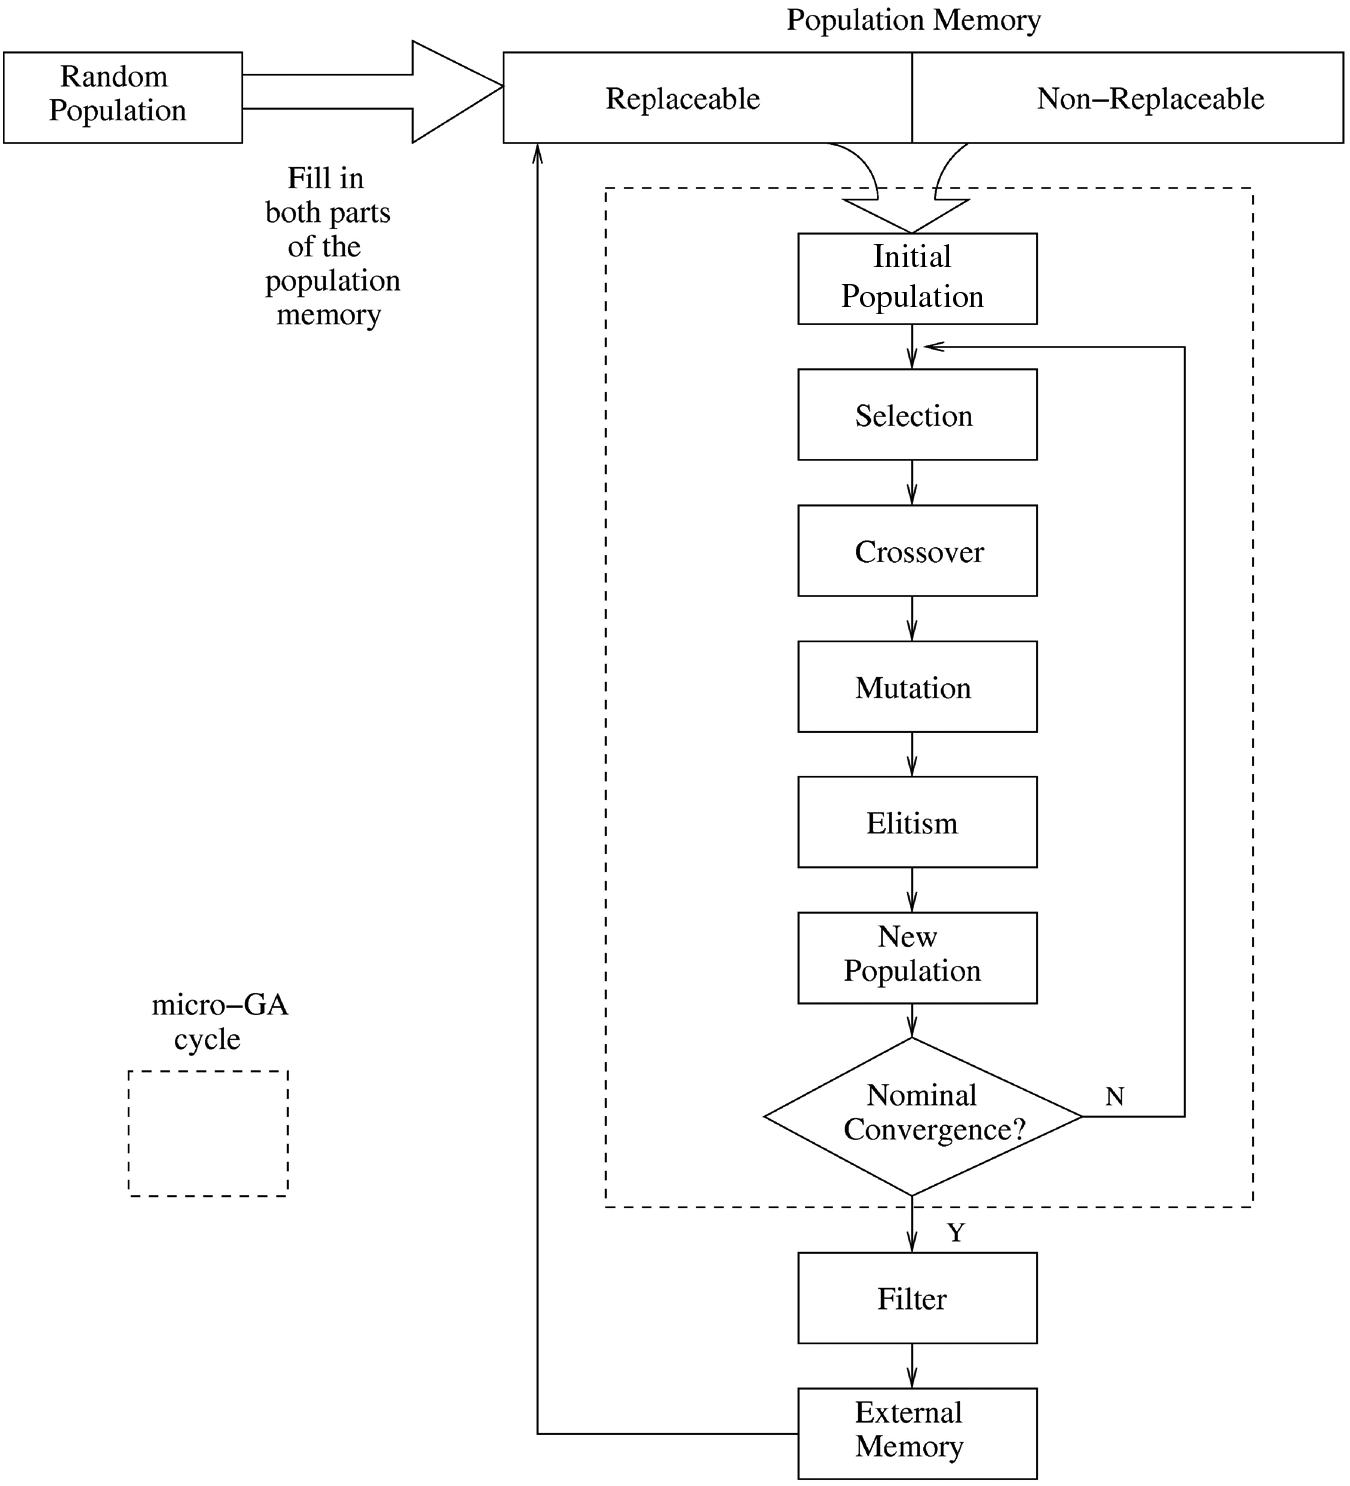
Micro-GA flowchart. 41
Initialization of the population and population memory. Based on the fitness functions (see equations (2) and (4)), the initial population is set to random values. The initial random population is taken from both portions of the population memory to allow greater diversity.39–41
Evaluation of population with conventional genetic operators. In the operating cycle, the conventional genetic operator, including the selection, two point crossover, uniform mutation and elitism, is implemented. So a new population of the chromosomes is created.39–41 Note that, whereas the non-dominated vectors are stored, the valuable information obtained from the evolutionary process is not lost.
Evaluation of population and filtering (based on the Pareto Frontier method). When the nominal convergence is achieved, both the first and last non-dominated vectors of the final population are compared to the content of the external memory. Consequently, the resultant non-dominated vectors are stored in the external memory. Note that the population should be fixed at all stages.31,40,41
In this paper, regression analysis is used to obtain the fitness function based on minimizing the surface roughness and thickness of the white layer. The parameters of the proposed micro-GA method are shown in Table 10. Visual basic language programming is used to perform the micro-GA. The obtained results are shown in Figure 5. The optimum point is the middle point or middle chromosome (see Figure 5). Table 11 shows decoded parameter and confirmation tests for the optimum point. This confirmation test, which was performed on an ONA R250 WEDM machine, shows the accuracy of used micro-GA to optimize the surface roughness and thickness of the white layer, simultaneously.
Micro-GA parameters.
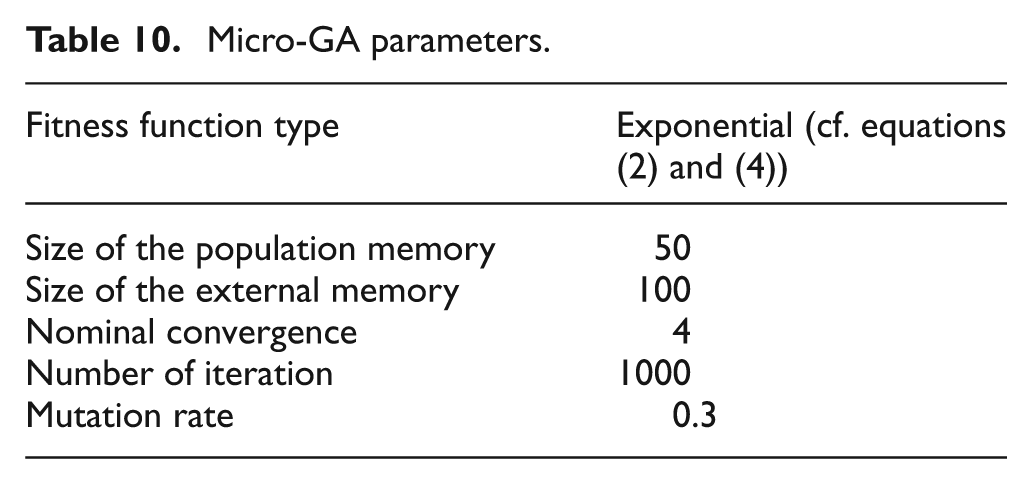
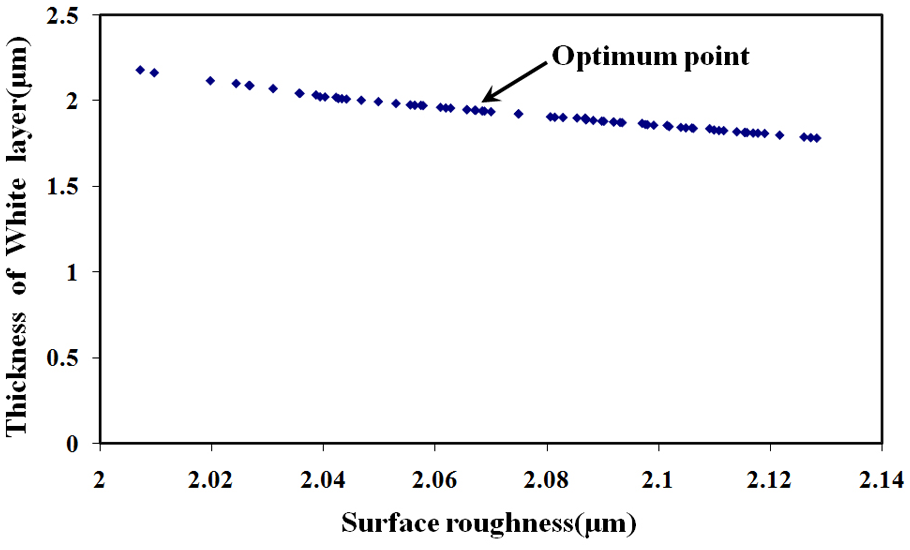
Diagram of Ra versus thickness of W.L created by micro-GA (Pareto frontier chart).
Results of the experimental confirmation using micro-GA.
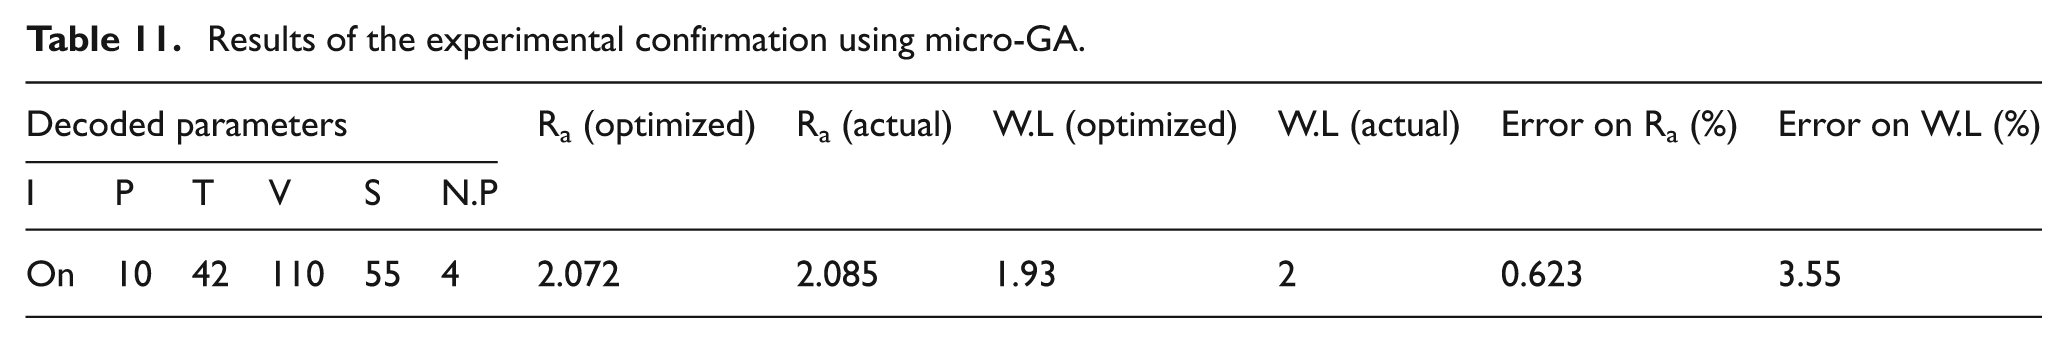
In this table, Ra (Exp) and W.L (Exp) are experimental process variables and Ra (MGA) and W.L (MGA) are obtained using micro-GA. The errors observed between the experimental and predicted process variables are shown in the last two columns.
The compared results, which are obtained by using the S/N ratio and micro-GA methods, are shown in Figure 6. According to this figure, the micro-GA has demonstrated better optimizing performance than that of the S/N ratio method. As shown in Figure 6(a), the resulted surface roughness and thickness of the white layer are 2.124 µm and 4 µm, respectively. Based on applying the optimal parameters in the WEDM process, the achieved surface roughness and thickness of the white layer are equal to 2.482 µm and 2 µm, respectively (see Figure 6(b)). Although the S/N ratio analysis is a single objective optimization method, it can properly optimize only one response. From Figure 6(b), it is seen that two responses (i.e. the surface roughness and thickness of the white layer) are coincidentally optimized by micro-GA.
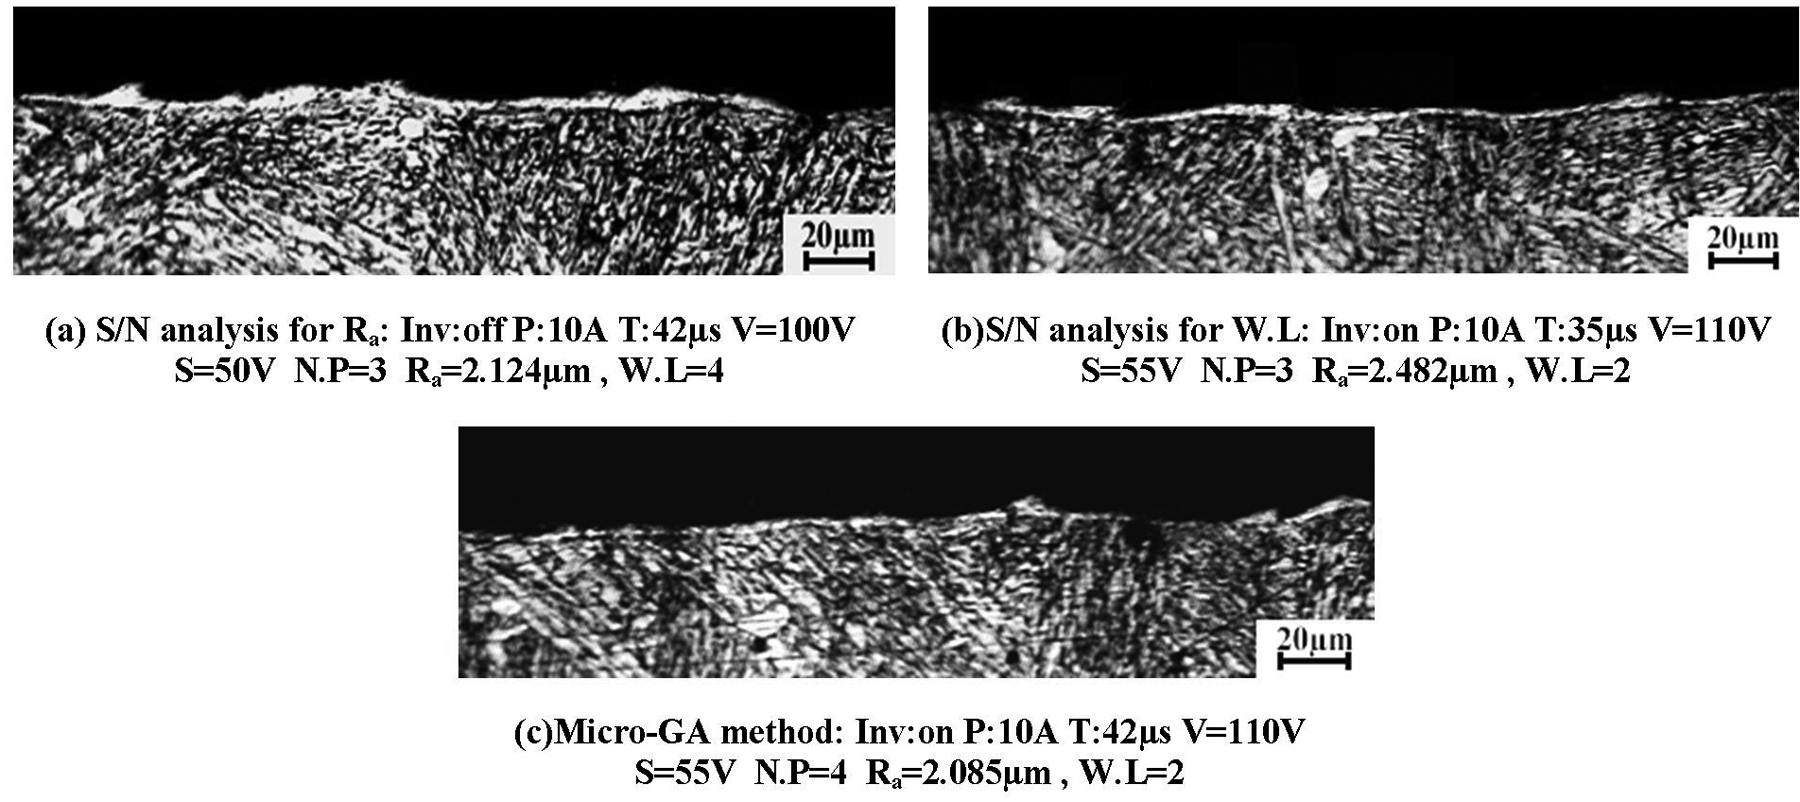
Cross-sectional micrograph of specimens under optimum condition.
Conclusions
Surface characteristics of the WEDM process of DIN 1.4542 stainless steel, including the surface roughness and thickness of the white layer, have been investigated. The optimization of machining parameters for obtaining the minimum surface roughness and least thickness of the white layer has been carried out by using the S/N ratio and micro-GA methods. The following remarks can be pointed out.
In experiments, the thickness of the white layer and surface roughness were ranged 2–6 µm and 4.055–2.167 µm, respectively. Furthermore, no cracks and HAZ are recognized on all samples.
The discharge power and number of finish passes have consecutively significant influence on the surface roughness and thickness of the white layer. The reduction of discharge power and the increase of finish passes minimize both the surface roughness from 4.055 to 2.167 µm and thickness of the white layer from 6 to 2 µm.
Exponential regression models have shown very good modeling capacity to establish the accurate fitness functions.
The micro-GA technique provides much better optimizing performance than one built with a S/N ratio method. During WEDM operations, reductions of up to 52% and 67% of the surface roughness and thickness of the white layer are accessible, respectively.
Footnotes
Acknowledgements
The authors gratefully acknowledge the support by Farakoosh Sepahan Company and Isfahan University of Technology. The authors would like to express their thanks to research affairs of the management of Farakoosh Sepahan Company, Mr. Akbari. Also, a special thanks to E. Rohani, J. Azimi, Mr Shafiee and Mr Parastegari for their close cooperation.
This research received no specific grant from any funding agency in the public, commercial, or not-for-profit sectors.