
Abstract
Machined surface condition of nickel-based superalloys has an important influence on the functional performance of the components. Proper selection of cutting parameters could improve surface finish and increase service life of parts and components. This research work bases on an experimental and statistical study of turning GH4169 nickel-based superalloy with cemented carbide tool. Surface damages like feed marks, tips, and surface tearing were discussed. The second-order polynomial model was used to describe the surface roughness response. Variance analysis was selected to eliminate the insignificant variables in the roughness model. The response surface methodology was used to investigate the combined effect of cutting parameters on two different dimensions surface roughness parameters. The optimization of cutting parameters for minimum surface roughness was obtained using desirability function method. The results demonstrate that feed rate has the most significant effect on surface roughness. High cutting speed and low feed rate result in better surface quality, but too low feed rate exacerbates built-up edge phenomenon and deteriorates surface condition. Optimal cutting parameters leading to the minimum surface roughness were highlighted.
Keywords
Introduction
Nickel-based superalloys, as a class of materials commonly operating at high temperature, highly corrosive airflow and complex loads environments, have excellent mechanical properties, good thermal stability and resistance to fatigue and creep, are widely used in aero engines, gas turbines and nuclear reactors. 1 However, due to the high material toughness and work hardening tendency, nickel-based superalloys are kinds of difficult materials to be processed. Processing nickel-based superalloys with inappropriate cutting parameters could lead to poor surface finish, which has a considerable impact on the fatigue strength, corrosion resistance and tribological properties of components. 2 For example, fatigue cracks usually initiate from surface defects, 3 and large surface roughness values reduce the fatigue life of components. 4 Yao et al. 5 investigated the effects of surface roughness and residual stress on the fatigue life of aluminum alloy after shot-peening. Components with smaller surface roughness and higher surface residual compressive stress will have a larger fatigue life. Zhu et al. 6 reported that the fatigue life of 30NiCrMoV12 steel in low cycle fatigue regime is mainly dominated by the crack propagation life, which consists of multiple surface cracking with interactions and coalescences. Ai et al. 7 established a probabilistic model based on defects information of metallic materials to evaluate the fatigue life of casting irons and aluminum alloys, results indicated that the probabilistic model can account for size effect and the model predictions show good correlation with experimental results. Therefore, it is necessary to study the influence of machining process on the machined surface condition, in order to obtain better surface finish and functional performance of machined parts and components. Numerous experimental studies have been used to quantify the effects of various cutting parameters on surface quality, but it is usually expensive and time-consuming to find all variables and their interactions that influence machined surface condition. Effective experimental designs should be adopted to obtain more comprehensive response results with fewer trials. Meanwhile, available prediction model should be established so that the surface condition or surface roughness can be predicted according to the cutting parameters, so as to improve the production efficiency and technical quality of components and reduce the manufacturing cost.
Surface damage is generally caused by the interaction of mechanical and thermochemical effects in the process of tool–workpiece contact. 8 Typical surface defects during machining of nickel-based superalloys include metal debris, feed marks, smeared material, built-up edge, cracked carbide particles and redeposited materials. 1 These defects have been analyzed under optical microscopy and scanning electron microscopy. If the suspected carbide particles and redeposited materials appear on the surface due to the abscission of the tool material particles or precipitation of the secondary grain boundary carbide, the energy dispersive spectrometer should be used to determine the elemental composition of these defects. Pawade et al. 9 reported that the machined surface shows redeposited materials at lower cutting speed (125 m/min) when investigating experimentally the dry machining of Inconel 718 with polycrystalline cubic boron nitride (PCBN) tool. The surface defects obviously reduce under high-speed cutting (475 m/min) and low depth of cut. Ginting and Nouari 10 presented the tearing of machined surface observed in milling titanium alloys in the cutting speed range of 100–120 m/min. The built-up edge due to the wear of the flank is the main reason for this defect. Zhou and Bushlya 8 showed that the degree of built-up edge formation and the generation of chip debris tend to be higher at low feed rate (0.1 mm/rev) in high-speed (100–400 m/min) turning of Inconel 718 with use of ceramic tools. The study of Liu et al. 11 suggested that the damage area of tearing debris decreases significantly with the increase in the cutting speed in milling of Inconel 718.
The research on the surface roughness of machined surface is mainly based on experiments combined with empirical relationship or statistical analysis. In current proposed empirical relationship,12,13 feed rate and the corner radius of tool tip are main items affecting surface roughness. Response surface methodology (RSM), as an economical and practical method combined with variance analysis, is widely used to investigate the relationship between surface roughness and cutting parameters. The first step of RSM is to establish the polynomial response expression of surface roughness and cutting parameters through experimental data, and analyze its variance, and then the response is analyzed by variance analysis. 14 A great deal of research has been conducted to investigate the influence of cutting parameters on surface roughness.15–24 The effect of cutting parameters on surface roughness varies relatively under different workpiece materials, cutting tool material and cutting conditions. General conclusions show that the lower the feed rate, the lower the surface roughness.17,21 Surface roughness decreases with increasing cutting speed, while depth of cut has no significant effect on roughness. 22 However, some studies have suggested that cutting speed has a more significant effect on surface roughness than feed rate. 10 In addition, appropriate experimental design could reduce cost in experimental research of surface roughness process. Common experimental design methods used in RSM analysis include full factorial design, 21 central composite design, 23 Box–Behnken designs 20 and Taguchi orthogonal design.9,15,19 Full factorial design and Taguchi orthogonal design can more adequately establish the relationship between variables and responses, while other experimental designs can establish reliable responses with relatively lower number of trials. RSM also can intuitively predict the range of cutting parameters under optimal surface roughness. More accurate predictions can be achieved by means of the desirability function method 25 and the artificial neural network (ANN) method.15,17,26 However, the current research mainly focuses on the single dimension surface roughness parameters for the optimization of cutting parameters. The effect of surface defects on machined surfaces is usually not considered. This will lead to a deviation between the expected optimization results and the actual surface finish. This research work would enrich the considerations in optimization of cutting parameters to obtain better surface quality, which is an innovation in the field of surface integrity research.
The aim of this study is to investigate the influence of the cutting parameters on the machined surface damage and surface roughness, during turning of GH4169 nickel-based superalloy using carbide tool with physical vapor–deposited (PVD) AlTiN coating. Surface defects were analyzed by optical microscopy, and surface roughness parameters were measured by roughness profiler. The response of the surface roughness to the cutting parameters was established using RSM. Two dimensions (amplitude and spacing) surface roughness parameters were considered to optimize cutting parameters through the application of desirability function method, and the influence of surface defects was added. The research on surface roughness and optimization of cutting parameters could provide a more refined reference for controlling the surface integrity and improving the service performance of manufactured components.
Experimental setup and analysis procedure
Material
The material used in the tests was nickel-based superalloy GH4169. The chemical composition and mechanical properties of the material at room temperature are described in Tables 1 and 2. The material was taken from a solid bar and has undergone the following heat treatment processes: heat preservation at 960 °C for 1 h and then air cooling, aging at 720 °C for 8 h and then furnace cooling to 620 °C with cooling rate 50 °C per hour, and maintaining at 620 °C for 8 h and then air cooling. 27
Chemical composition of GH4169 alloy.
Mechanical properties of GH4169 alloy.
Cutting condition and measurement setup
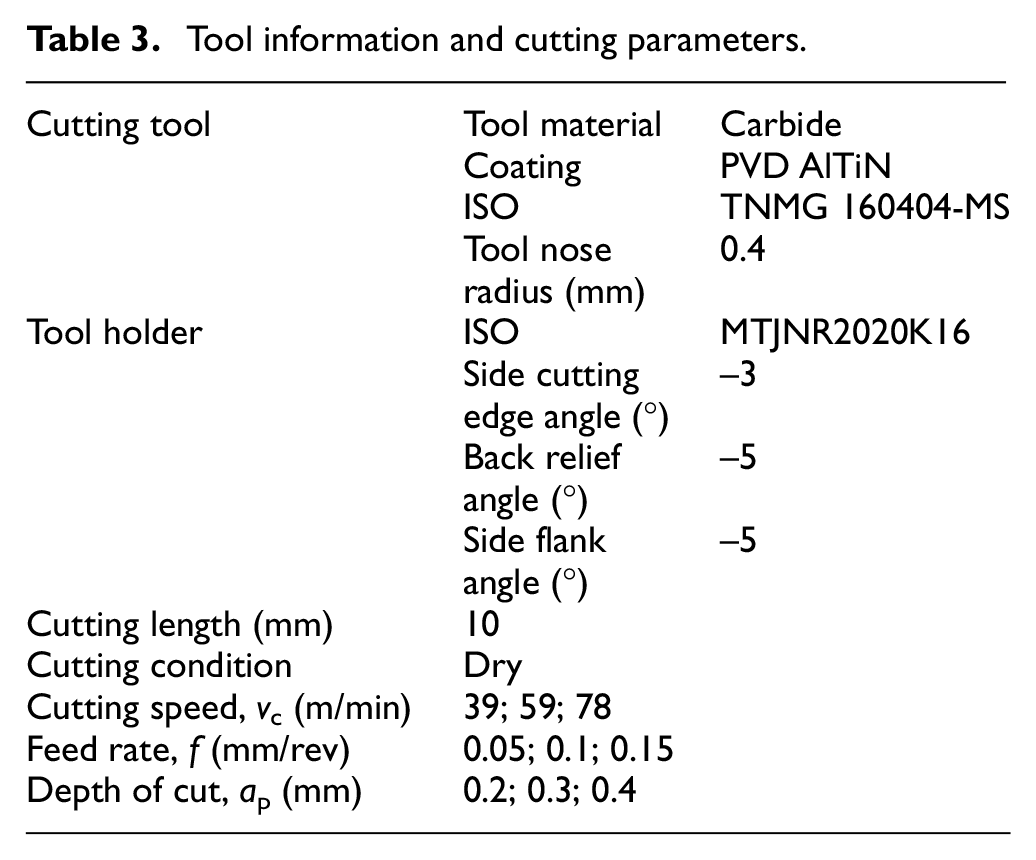
The turning experiments were carried out using FTC180 lathe under dry condition. The cutting insert used a carbide tool with PVD AlTiN coating produced by Kennametal company with ISO designation of TNMG 160404-MS. The tool holder is codified by ISO as MTJNR2020K16. Side cutting edge angle is −3°, back relief angle is −5° and side flank angle is −5°. The workpieces were in the form of round bars with 30 mm diameter and 350 mm length. Each step with 10 mm was machined under a specific cutting condition. Tool information and cutting conditions are summarized in Table 3. The purpose of this design is to eliminate the effect of clamping and positioning of workpiece from various test conditions. 28 In order to avoid the influence of tool wear on the machined surface, a new cutting tool was used under each set of cutting parameters. After the experiments, the surface morphology was examined using HIROX three-dimensional digital optical microscopy system and the surface roughness was measured by HOMMEL-ETAMIC T8000RC roughness profiler as shown in Figures 1 and 2, respectively.
Tool information and cutting parameters.
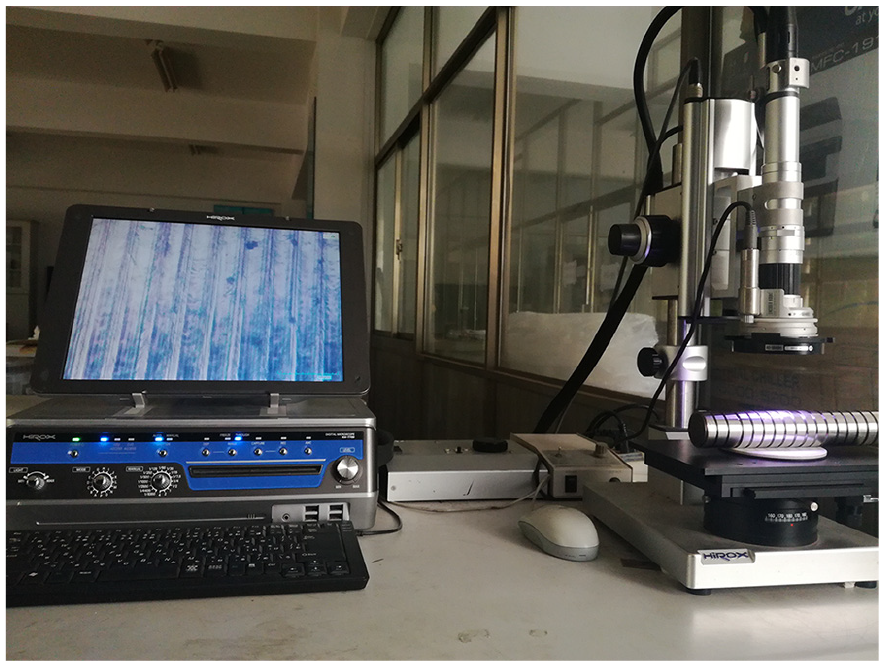
HIROX three-dimensional digital optical microscopy system.
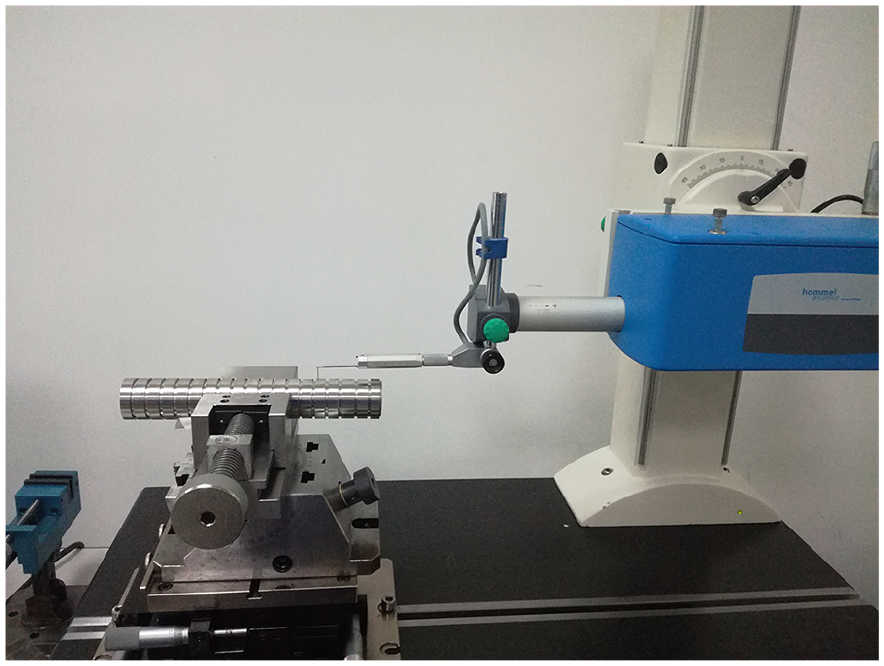
HOMMEL-ETAMIC T8000RC roughness profiler.
Experimental design and response surface method
Full factorial experimental design is one of the best tools for researching the effects of different variables on response. Multivariate regression analysis based on full factorial experimental design results can give a full description of independent variables and their interaction on the selected response equation. 14 In order to analyze the influence of cutting parameters on the surface roughness of machined surface in detail, the 33 full factorial design was selected in this article. Cutting speed vc, feed rate f, and depth of cut ap were selected as three factors and the three-level range of each cutting parameter factor as shown in Table 3. These factor levels result in 27 unique factor-level combinations. One replication of each of the factor-level combinations was conducted resulting in a total of 56 tests.
RSM can be used to analyze and optimize the responses affected by several variables. It is one of the most widely used methods to solve the optimization problems in the field of mechanical manufacturing. In this article, the response function of surface roughness was established by statistical method according to the experimental data, and the response surface was obtained to intuitively analyze the effects of cutting parameters on surface roughness. In the analysis process, a fitted second-order polynomial regression model was used to fit the response y. The model response of y, i.e. surface roughness parameter, can be written as the follows
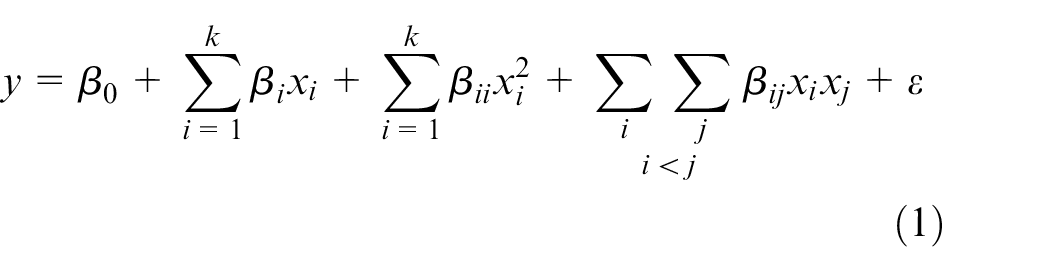
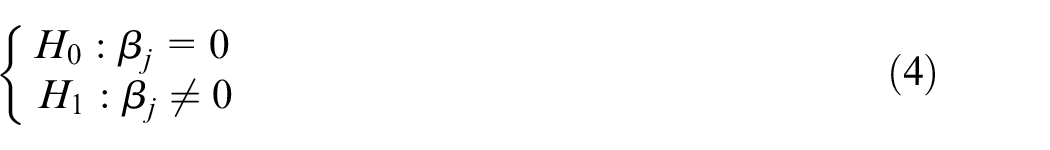
where β0 is the constant, and βi, βii and βij are the regression coefficients of the linear, quadratic and interaction terms, respectively. ε is the random error for system. xi and xj represent the factor variables corresponding to the cutting parameters studied, namely, cutting speed vc, feed rate f and depth of cut ap. The regression coefficients of the model can be estimated by least square method based on the experimental data. After establishing the regression model, analysis of variance (ANOVA) and test of significance are needed to measure the usefulness of the regression model, that is, to test hypothesis
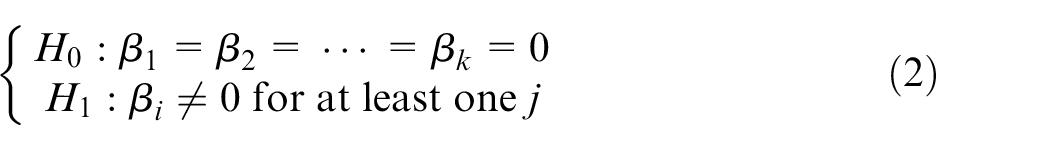
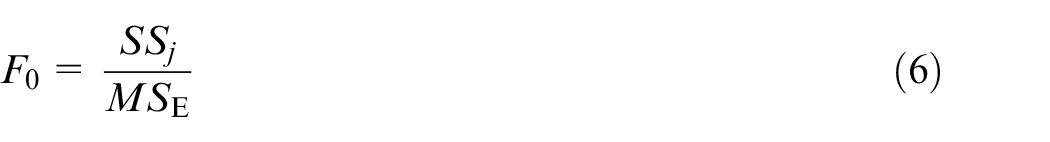
Rejection of H0 implies that at least one of the regression variables contributes significantly to the model. The test procedure for H0 is to compute
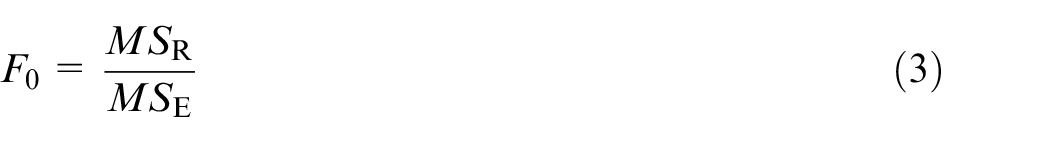
where the MSR and MSE are the mean square for regression and error. The H0 hypothesis would be rejected if the p value for the statistic F0 is less than the p value for the critical value Fα (k, n–k–1) determined by given significance level α, which indicates that there was a significant regression relationship between response and factor variables. The model regression relationship is significant does not mean that each variable has significant impact on the response. When a regression equation contains insignificant variables, it will not only add the complexity to the regression model but also increase the error of system, which will affect the prediction accuracy. Therefore, it is necessary to test the significance of each regression coefficient. And, the insignificant variable needs to be eliminated from the regression model and a new regression model needs to be established. The variable βj that are not significant in the regression model has a regression coefficient of zero, that is, to test hypothesis
Define SSj as the contribution of the jth regression variable in the regression square sum SSR, which can be shown as
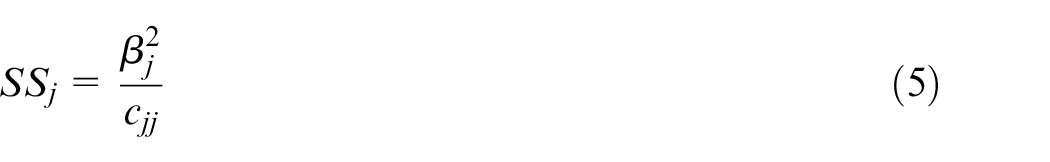
where cjj is the j element on the main diagonal of the matrix
If there are several insignificant variables, considering the correlation between regression coefficients, one insignificant variable should be eliminated at a time, and the regression model should be re-established and continued to be tested until the variables in the regression model are significantly correlated with the response.
Desirability function method
One of the most important aims of experiments related to manufacturing is to achieve the desired surface roughness with the optimal cutting parameters. 29 Based on the surface roughness response model, the desirability function method 25 was used to optimize the cutting parameters for the surface roughness parameters in order to obtain the smoother machined surface. The single desirability function with Smaller-the-Better characteristic is defined as follows
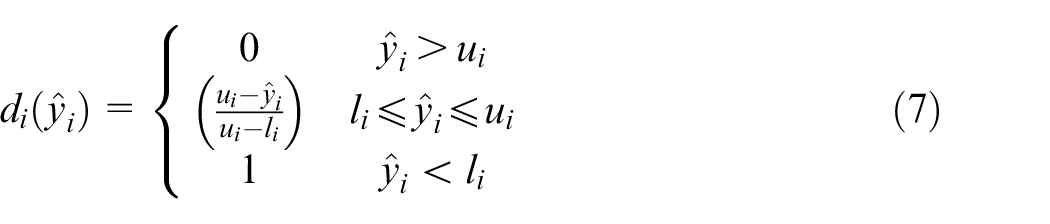
where yi is the single response predicted value of the ith output from the response model, ui and li are, respectively, the maximum and the minimum values of experimental data. For multiple responses, a combined desirability is defined as
The objective is to maximize the D in order to obtain the minimum response y. The flowchart explaining the experimental setup and method application is shown in Figure 3.
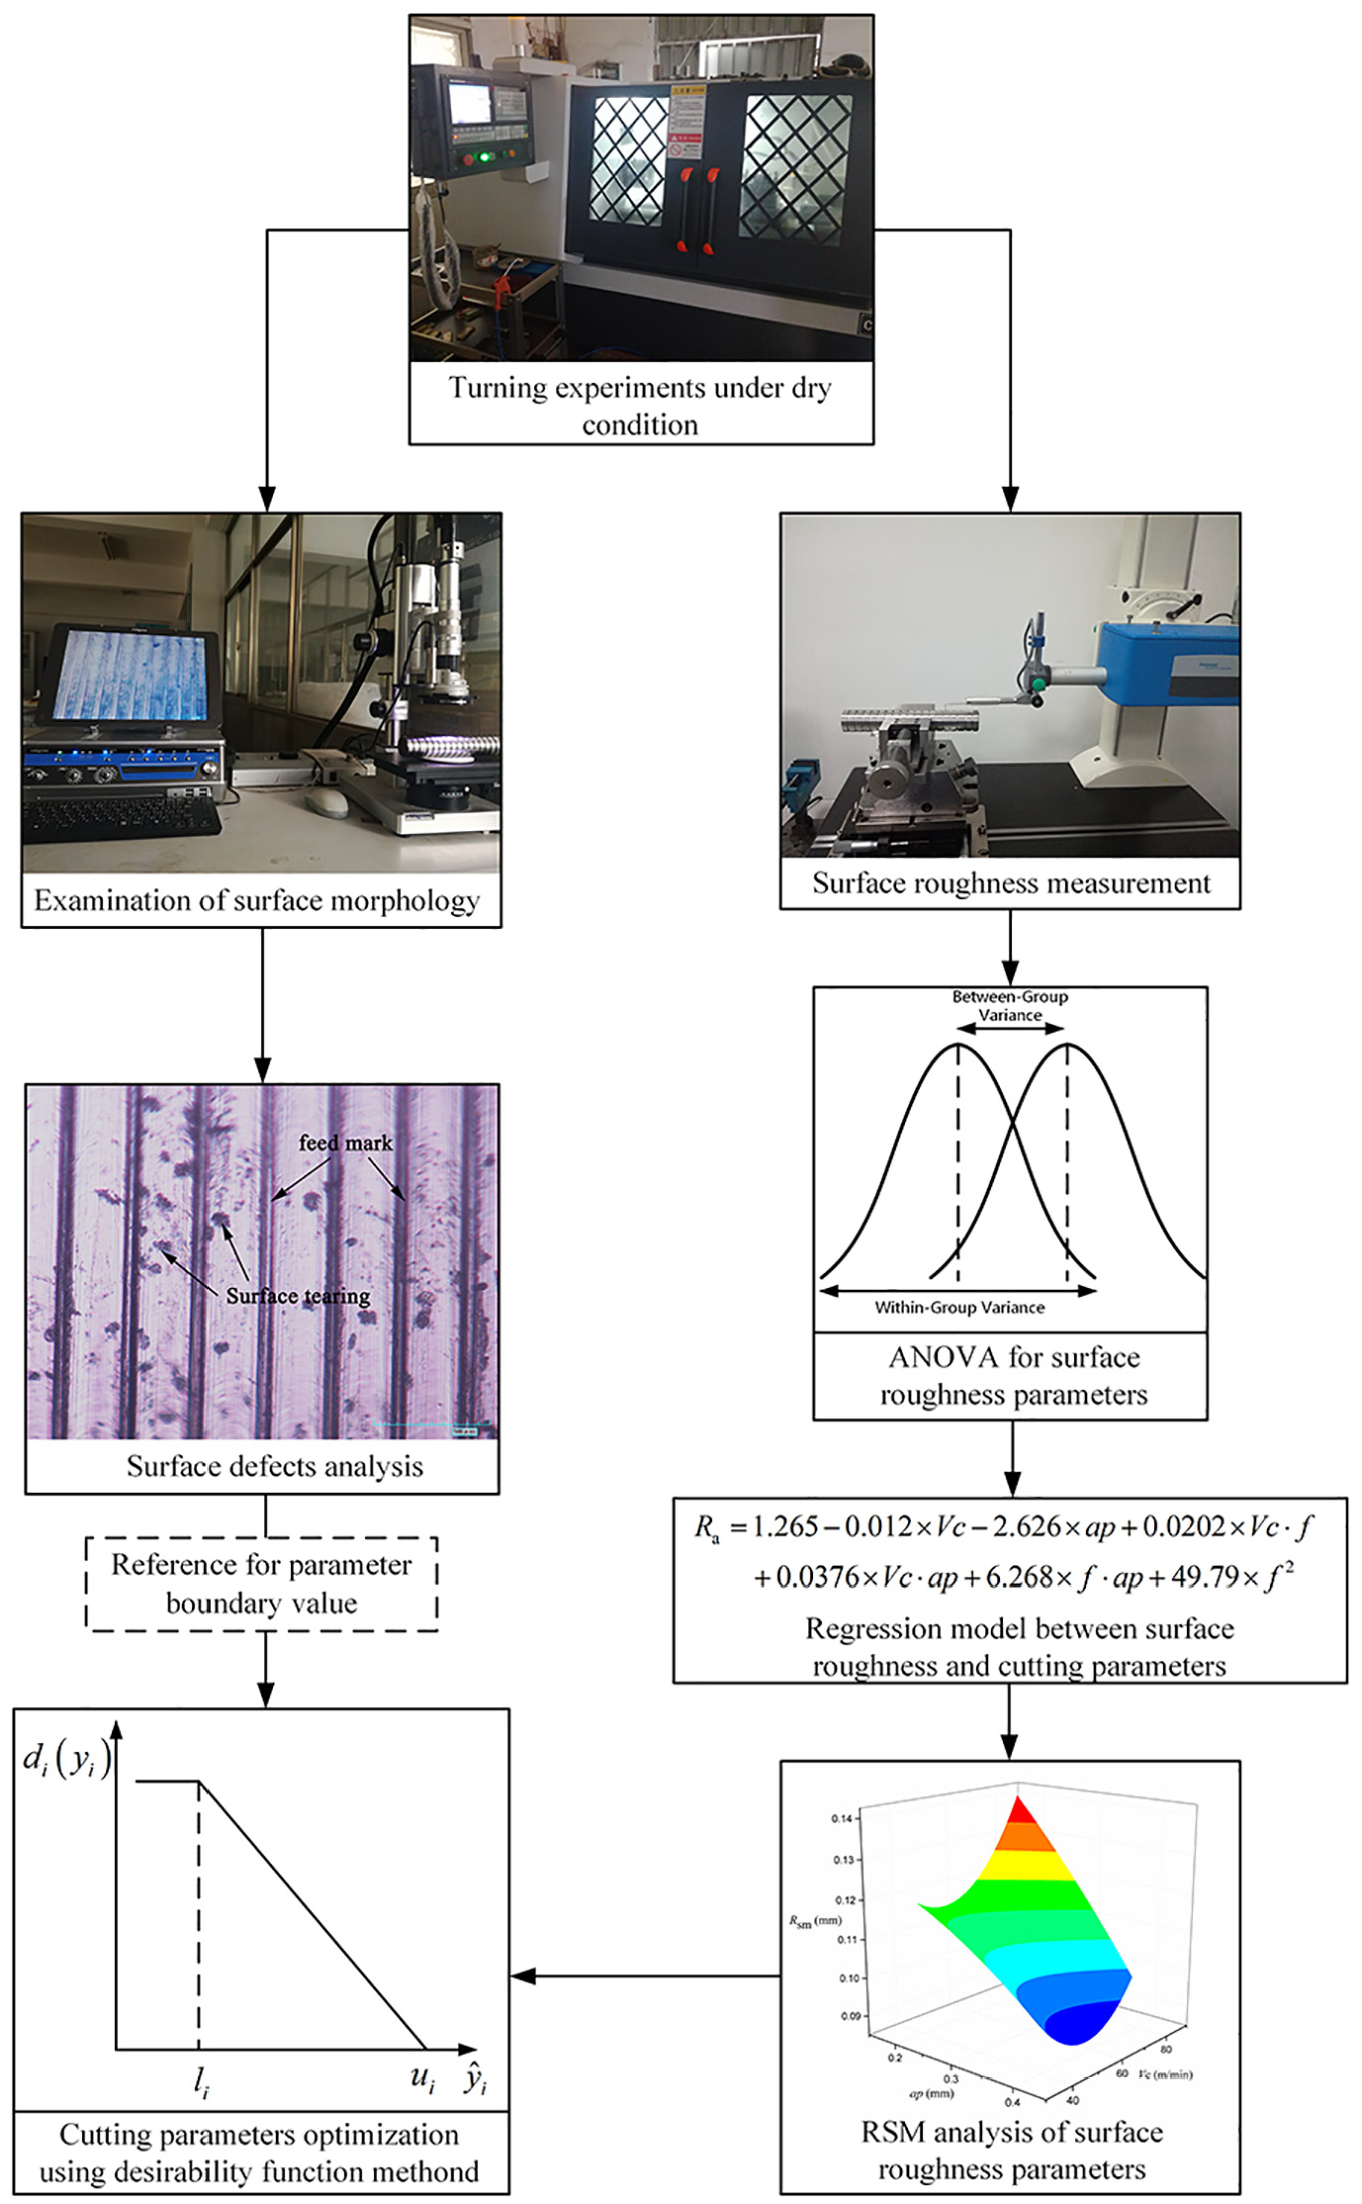
Illustration of experimental setup and method application.
Results and discussion
Observations of defects on the machined surface
Various surface defects and damages are formed on machined surfaces in cutting process. Machined surface defects and damages mainly include surface cavities, metal debris, feed marks, grooves and built-up edge.8,9 In this work, optical micrographs of the machined surfaces of GH4169 with different cutting parameters observed under HIROX optical microscopy system are shown in Figure 4.
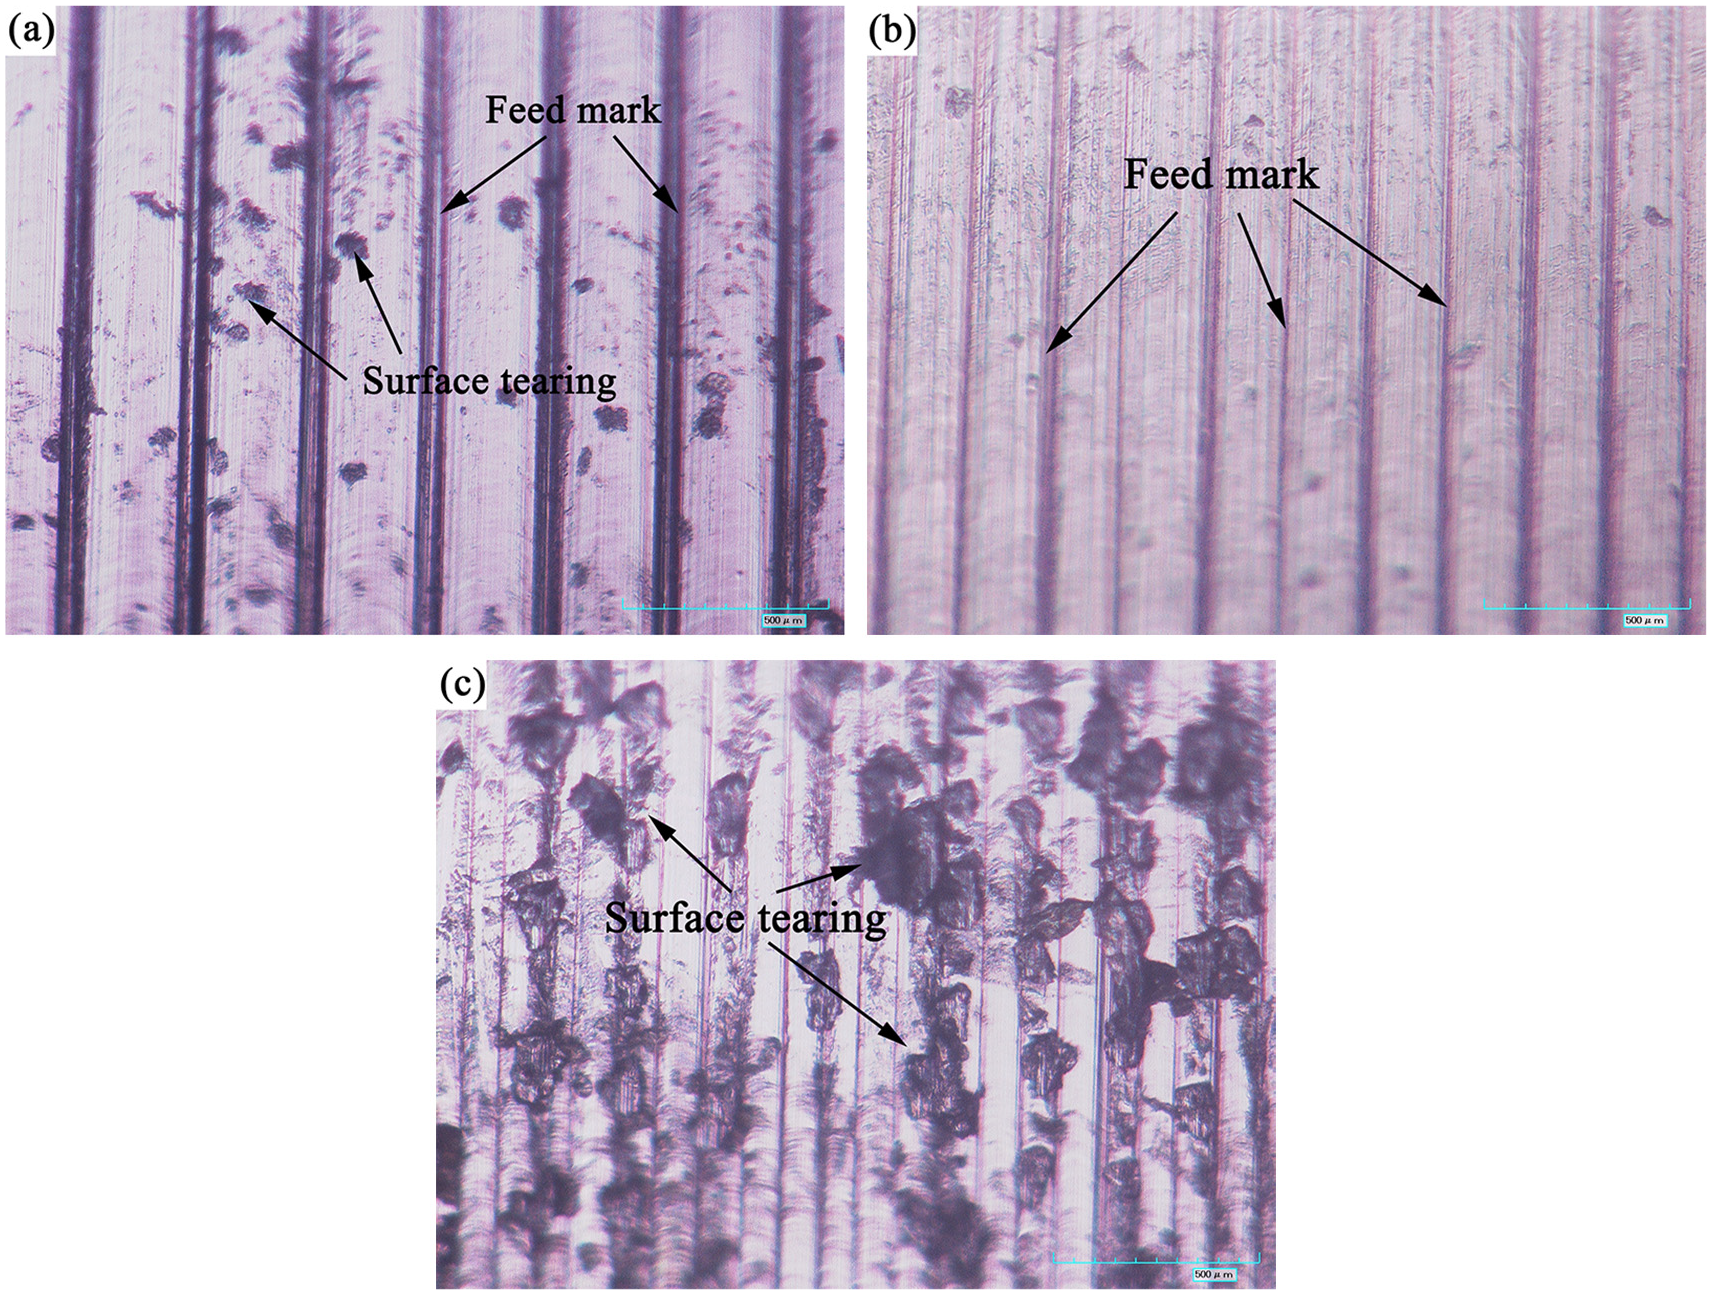
Optical microscope micrographs of surfaces in turning of GH4169: (a) vc = 59 m/min, f = 0.15 mm/rev, ap = 0.2 mm; (b) vc = 78 m/min, f = 0.1 mm/rev, ap = 0.2 mm; and (c) vc = 78 m/min, f = 0.03 mm/rev, ap = 0.2 mm.
It was evident that the periodic feed marks are formed on the machined surface, which show vertical strips with equal spacing under optical microscope, as shown in Figure 4(a)–(c). The feed mark is a kind of nature defects which generated by the axial feed of tool in cutting process. The distance between the strips became wider and the surface tearing is formed on the machined surfaces due to scratch of debris at medium cutting speed (vc = 59 m/min) and high feed rate (f = 0.15 mm/rev), as shown in Figure 4(a). With the decrease in the feed rate, the strips became narrower and the machined surface shows lesser flaws, as shown in Figure 4(b). However, at higher cutting speed (vc = 78 m/min), when the feed rate is as low as 0.03 mm/rev, the machined surfaces were seriously scratched and a large number of dark spots were observed under the optical microscope, as shown in Figure 4(c). The rake face of cemented carbide tool after turning GH4169 material is presented in Figure 5. Each tool was used only once under specific cutting conditions. The cutting parameters used are corresponding to those in Figure 4. A new tool is included in the figure as comparison. It can be shown that the adhesion of material, know as built-up edge, was observed on the rake face of tool tip. When cutting speed was fixed (vc = 78 m/min), the area of built-up edge is large and expands to cutting edge at f = 0.03 mm/rev, and pits due to the breaking-off of built-up edge debris were also observed, as shown in Figure 5(b). When f was increased to 0.05 mm/rev, the area of built-up edge is reduced and only accumulates at the tip of tool, as shown in Figure 5(a).
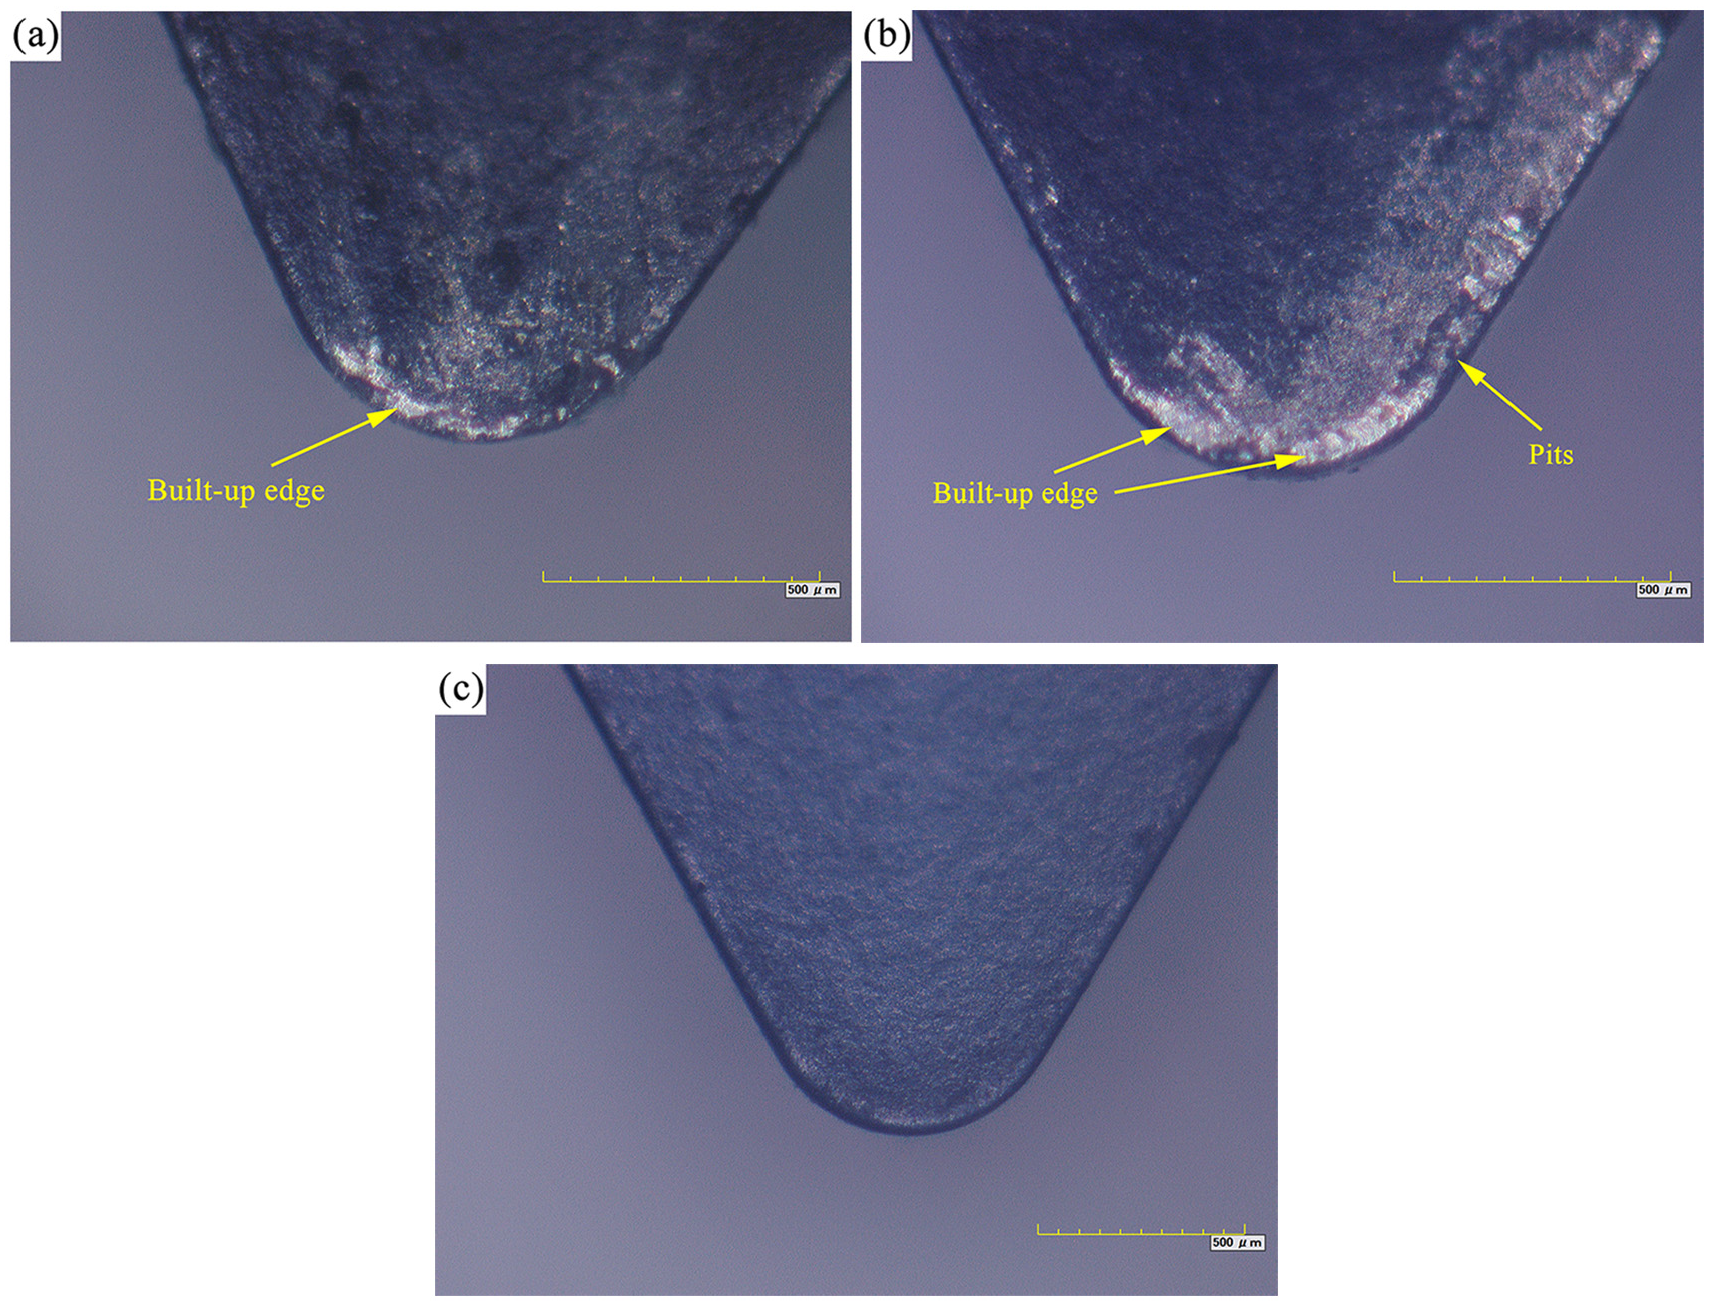
The rake face of cemented carbide tool after turning GH4169: (a) at vc = 78 m/min, f = 0.1 mm/rev, ap = 0.2 mm; (b) at vc = 78 m/min, f = 0.03 mm/rev, ap = 0.2 mm; and (c) new tool.
The material in a built-up edge is work-hardened and abrasive due to high temperature and plastic deformation. 2 Hard built-up edges and breaking-off debris in front of tool tip scratch the surface of the workpiece, causing damage to machined surface. When increasing the feed rate, the heat accumulation increases and the thermal softening effect of the material makes the built-up edge difficult to generate. The thermal softening effect produced by increasing the cutting speed also has the similar effect on the built-up edge. 9
In order to obtain better machined surface quality and reduce surface defects, it is necessary to ensure that the feed rate decreases appropriately without producing the scratched machined surface caused by built-up edge, that is, to determine the minimum feed rate. Several experiments have been carried out to discover that the machined surfaces are not susceptible to built-up edge when the feed rate f ≥ 0.05 mm/rev.
Analysis of surface roughness
Surface roughness, as the technical requirement of mechanical products, has an important impact on the surface quality and service performance of components. The characterization parameters which are commonly used to characterize surface roughness can be divided into amplitude parameters and spacing parameters. The most commonly used amplitude parameter Ra, that is, the arithmetic average roughness, and the spacing parameter Rsm, that is, the mean spacing of the asperities at the level of the central line, 2 were selected as the two dimensions surface roughness parameters to characterize the machined surface conditions. These two parameters are defined as follows
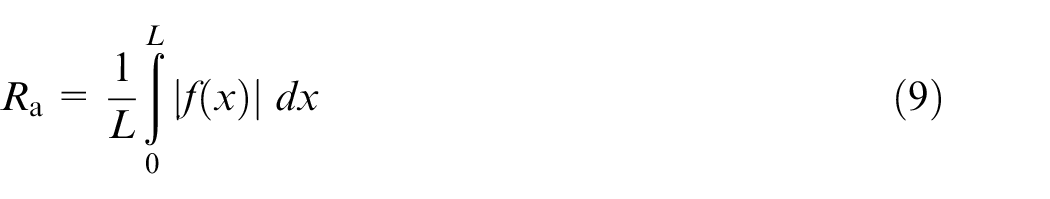
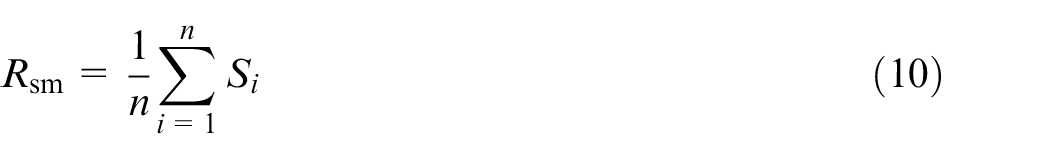
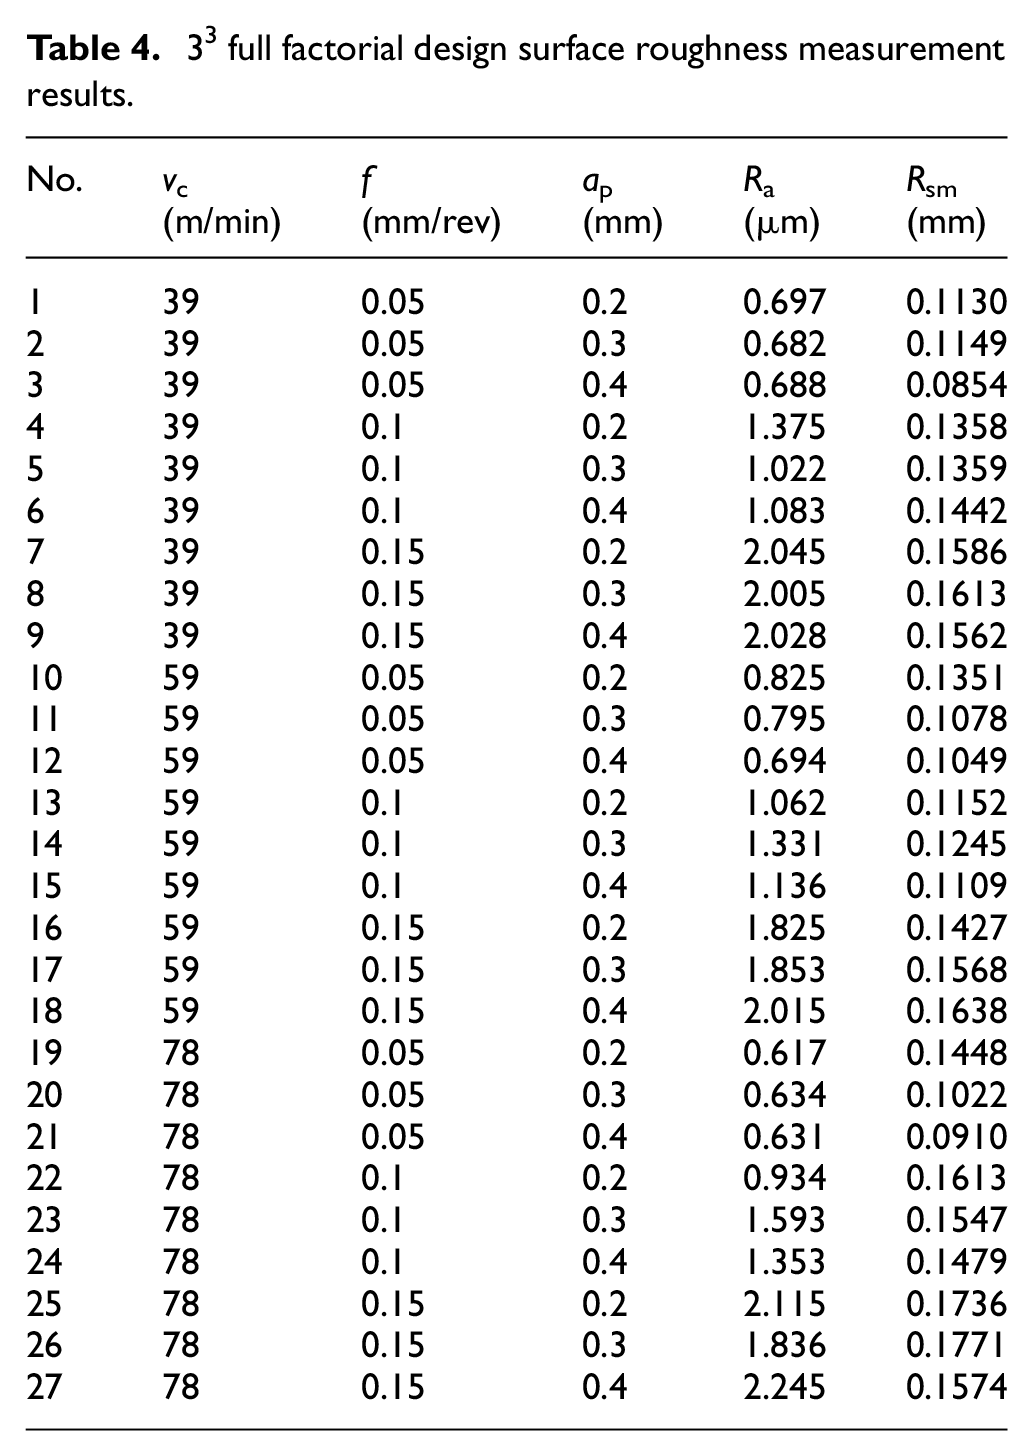
where L is the evaluation length, and f (x) is the deviations about the center line. Si is the distance between two successive peaks and n is the number of periods, as shown in Figure 6. The results of measuring the surface roughness according to the full factor test using the HOMMEL-ETAMIC T8000RC roughness profiler are shown in Table 4. The detection distance of surface is 4 mm, the probe moving speed is 0.50 mm/s and the measuring point spacing is 0.5 μm. The surface roughness measurement results of Ra and Rsm were obtained in the range of 0.617–2.245 μm and 0.0854–0.1771 mm, respectively.
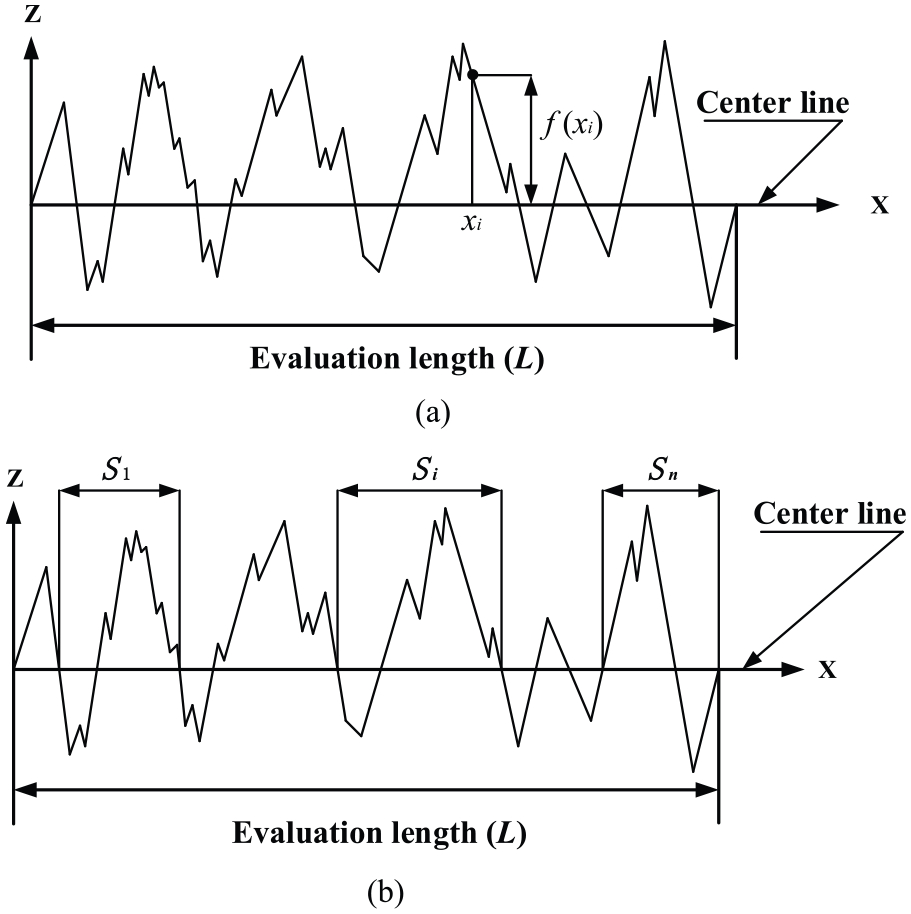
Illustration of surface roughness parameters: (a) Ra and (b) Rsm.
33 full factorial design surface roughness measurement results.
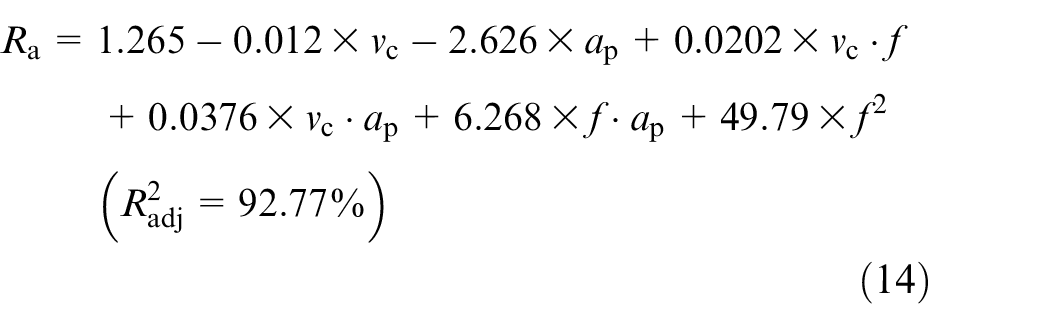
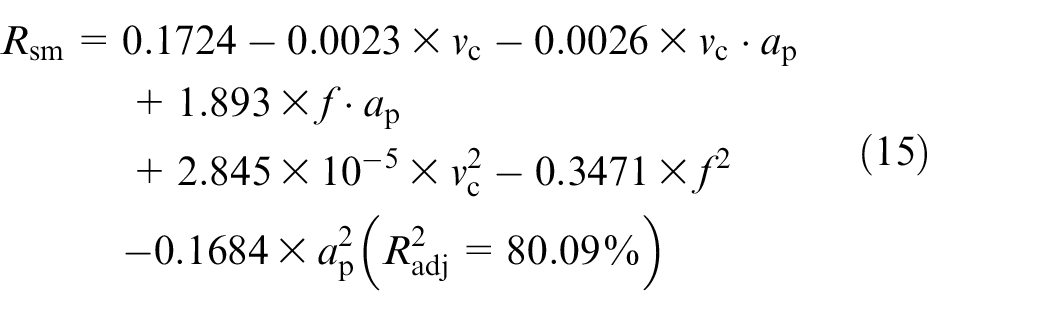
According to Table 4, the regression coefficients corresponding to each factor were calculated using least squares method, and second-order regression models between surface roughness parameters and regression variables were established
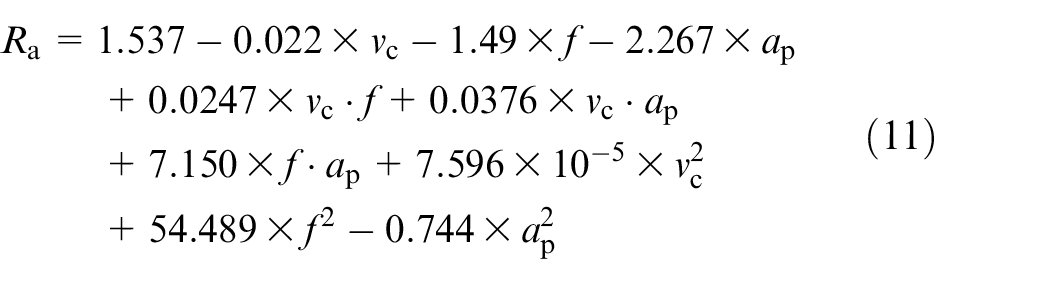
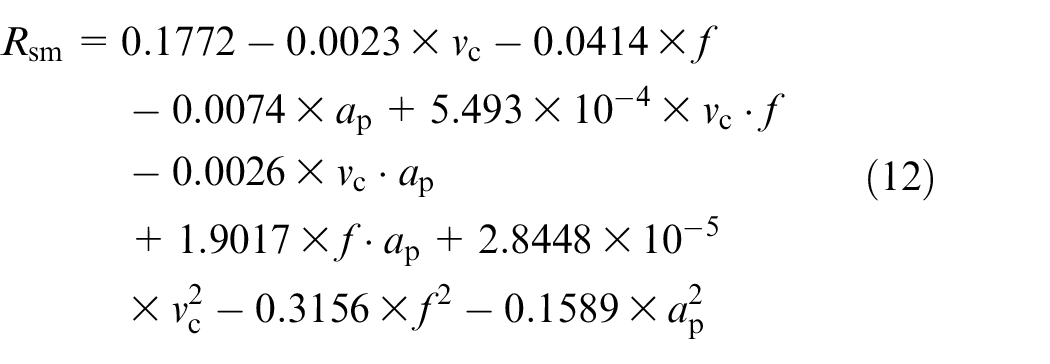
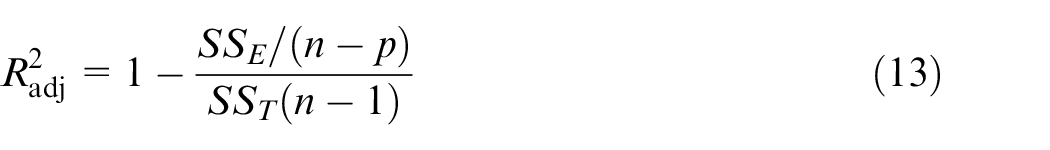
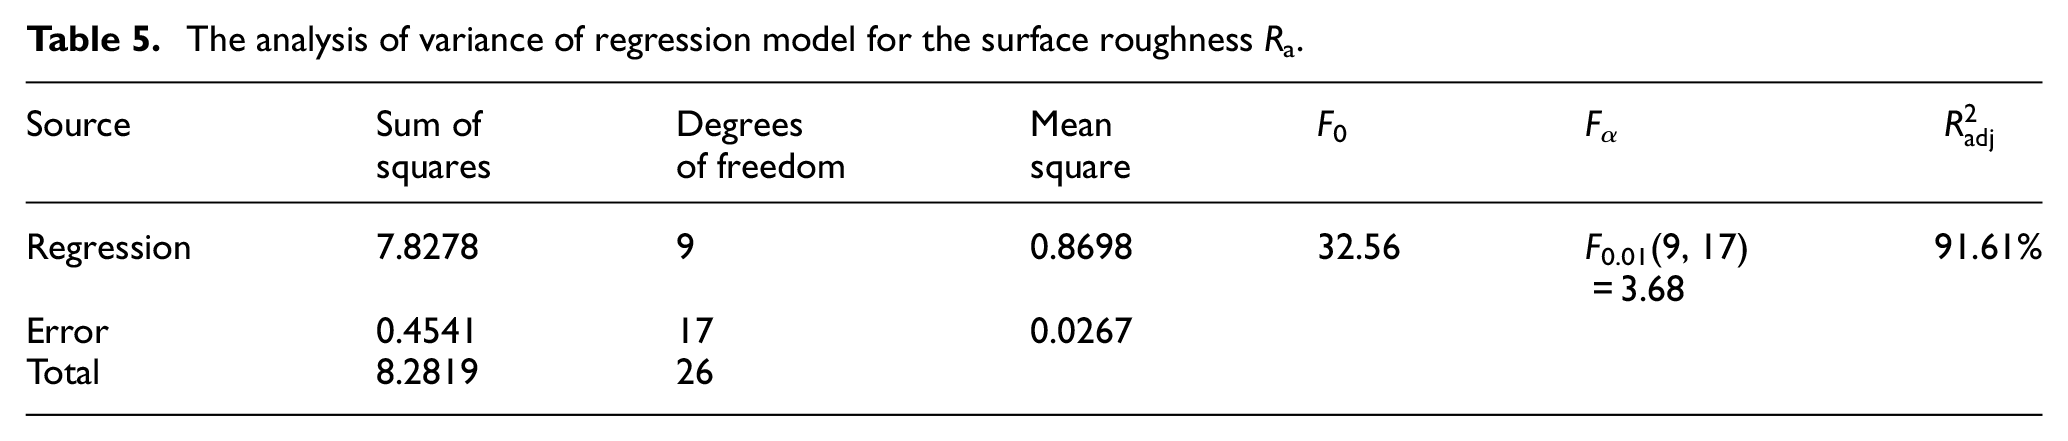
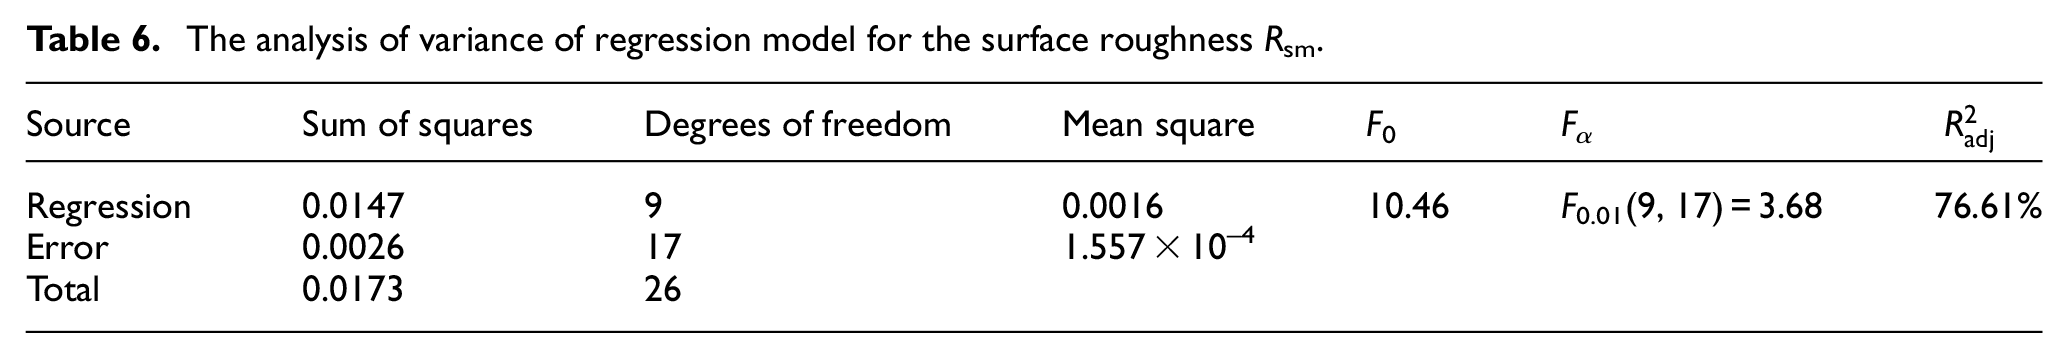
Tables 5 and 6 show the variance analysis of the regression models. The
The analysis of variance of regression model for the surface roughness Ra.
The analysis of variance of regression model for the surface roughness Rsm.
The more
According to section “Experimental design and response surface method,” the variables that have no significant impact on the response of the regression model should be excluded. Tables 7 and 8 show the ANOVA of each variable in the response model. Table 7 illustrates that the square terms of f is the most important term affecting Ra, its F0 value is 4.17 and contribution is 46.92%. The second important term is the interaction term of vc and ap with 2.42 of F0 value and 27.28% of contribution. The significant effect of feed rate on surface roughness Ra is in agreement with most of the research work results. Table 8 presents the single variable ANOVA of Rsm. It can be stated that the interaction term of f and ap has the highest statistical significance with 6.97 of F0 value and 45.15% of contribution. The square terms of vc and the interaction term of vc and ap have the considerably significance followed by the interaction term of f and ap. Although only a few F0 values of variables are larger than the critical value Fα, the prediction accuracy of the model can still be improved by eliminating the variables with lower F0 values, as mentioned earlier. By eliminating one insignificant variable and repeating step by step, the optimized regression model was re-established.
ANOVA of single variable in regression equation Ra.
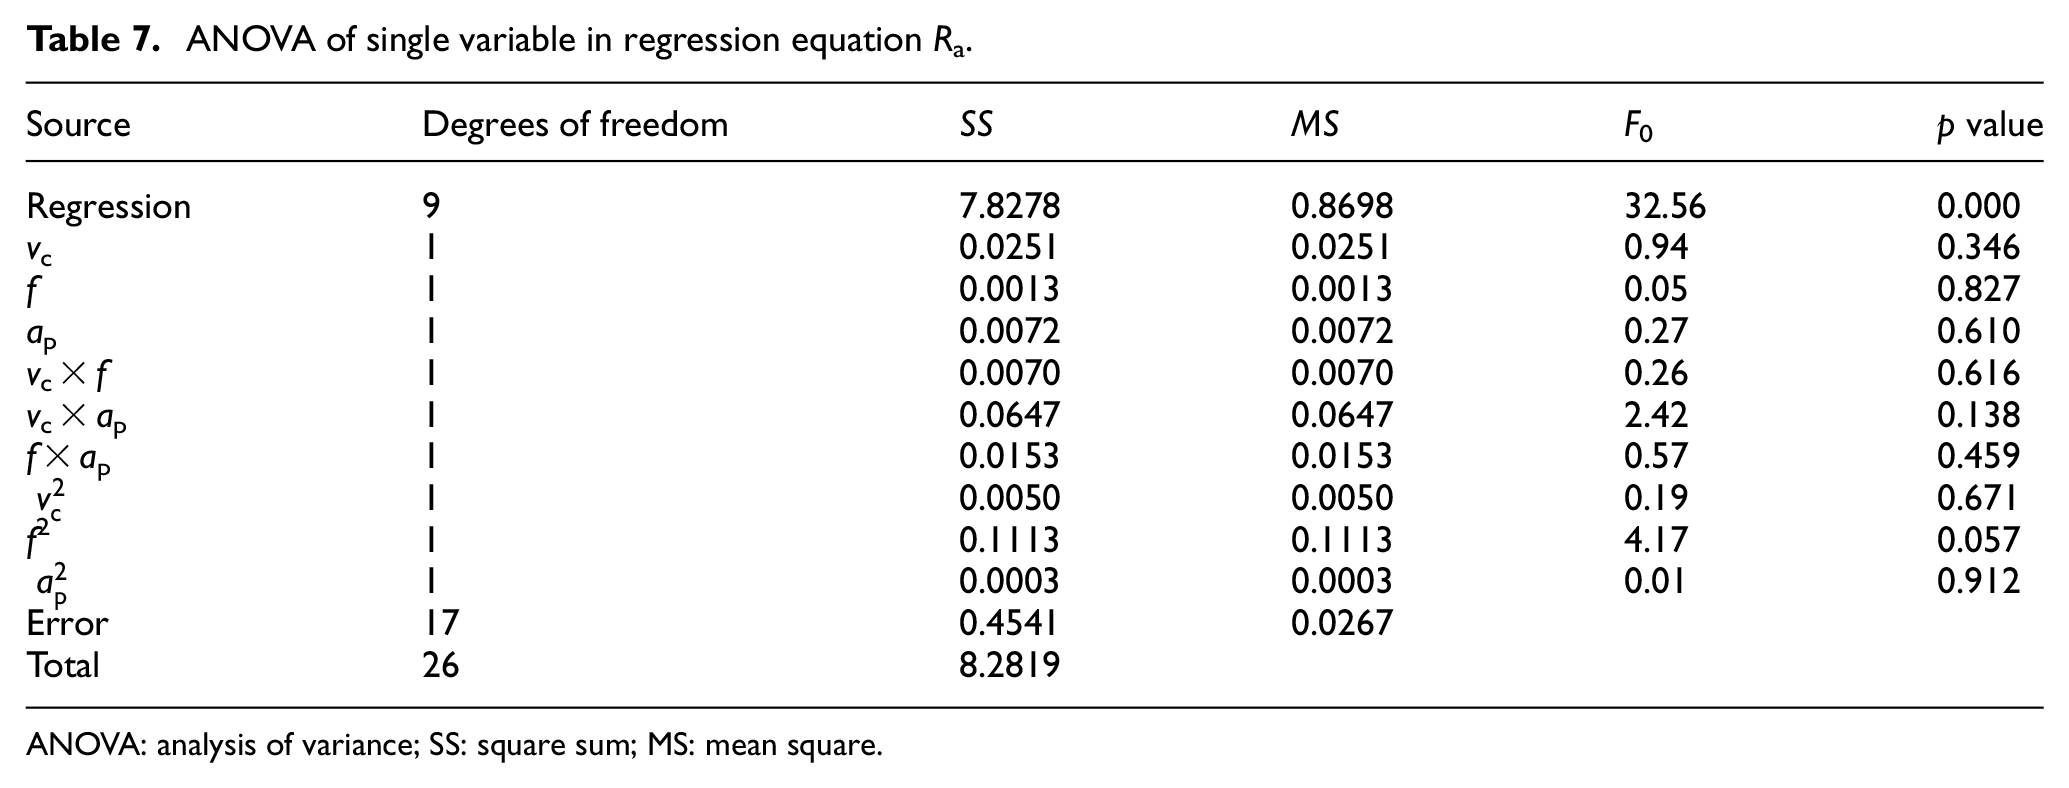
ANOVA: analysis of variance; SS: square sum; MS: mean square.
ANOVA of single variable in regression equation Rsm.
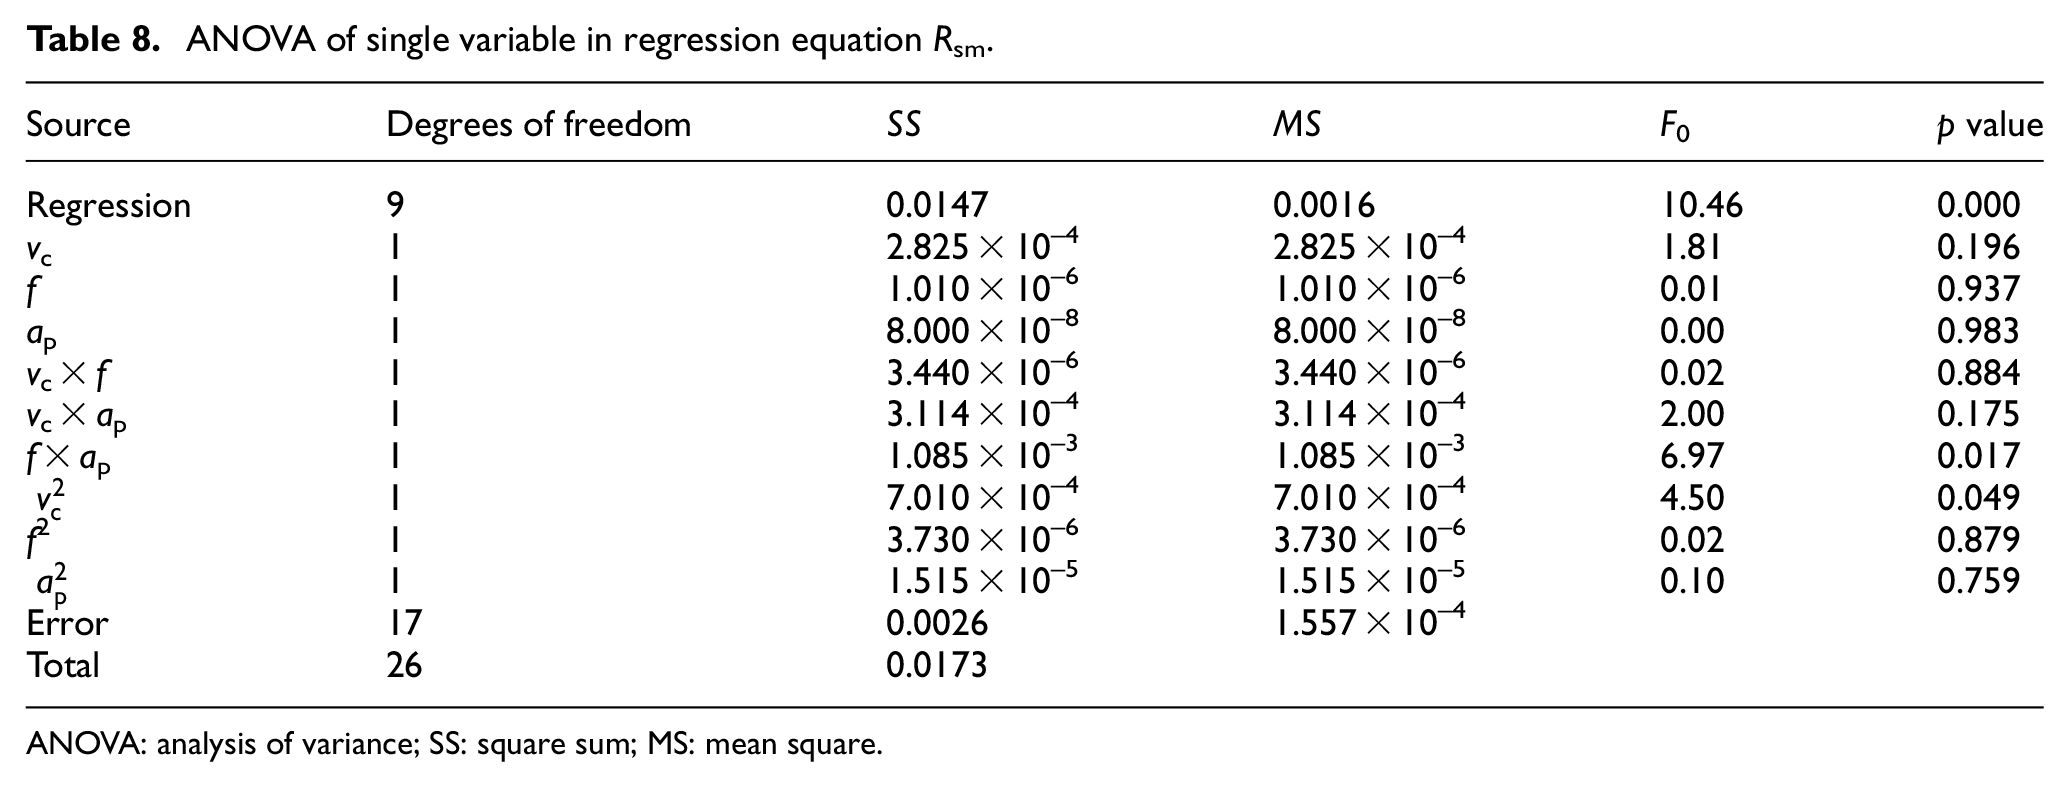
ANOVA: analysis of variance; SS: square sum; MS: mean square.
The
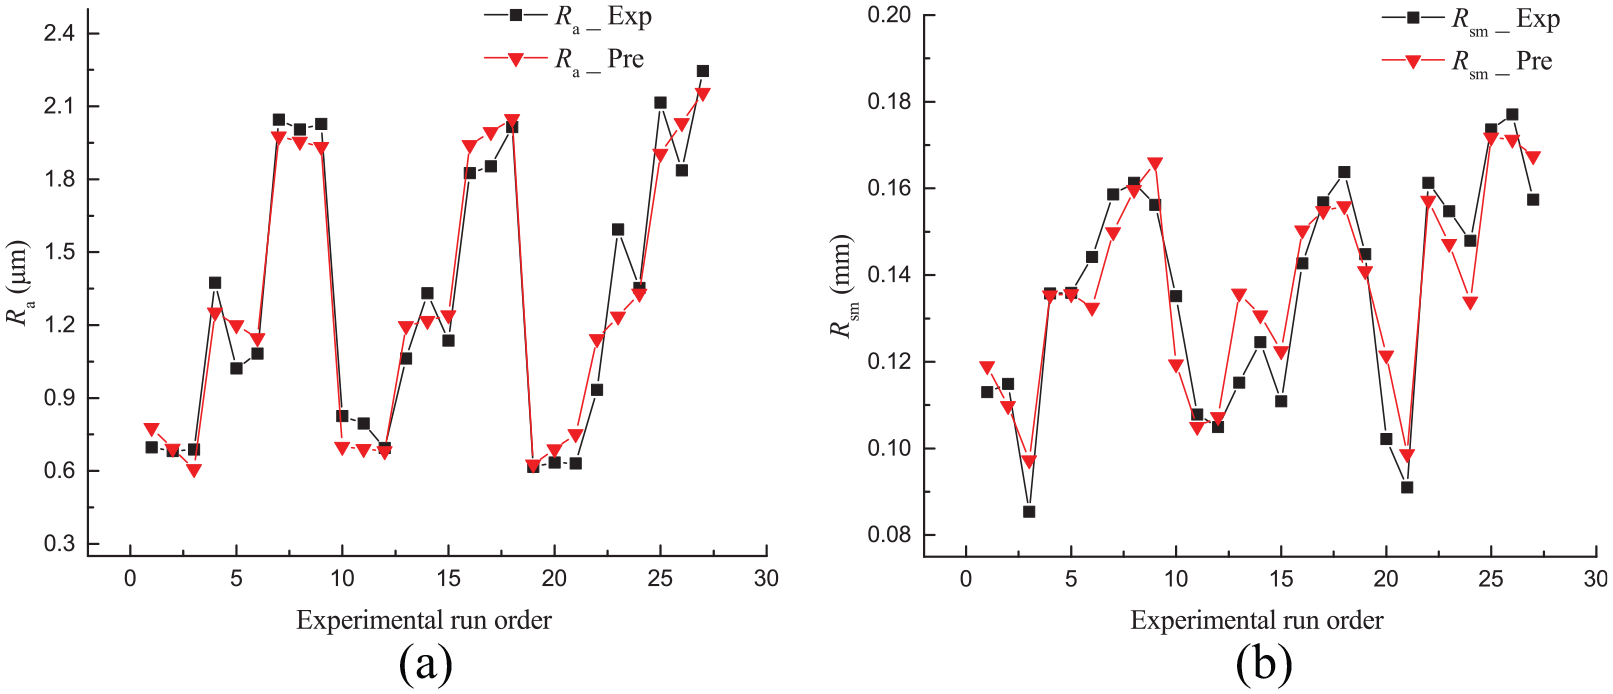
Comparison between the experimental and predicted results for (a) Ra and (b) Rsm.
In order to more intuitively understand the interaction influence of variables on response factors, three-dimensional response plots and contour maps for the surface roughness response were drawn based on the regression models equations (14) and (15). Since there are three variables in the model, one variable in each response surface will be set to a fixed value. For the effect of the cutting speed vc and depth of cut ap on response surfaces, the feed rate f kept at low factor level, and for the other response surfaces, variable that did not appear in the plots kept at middle level (Figures 8 and 9).
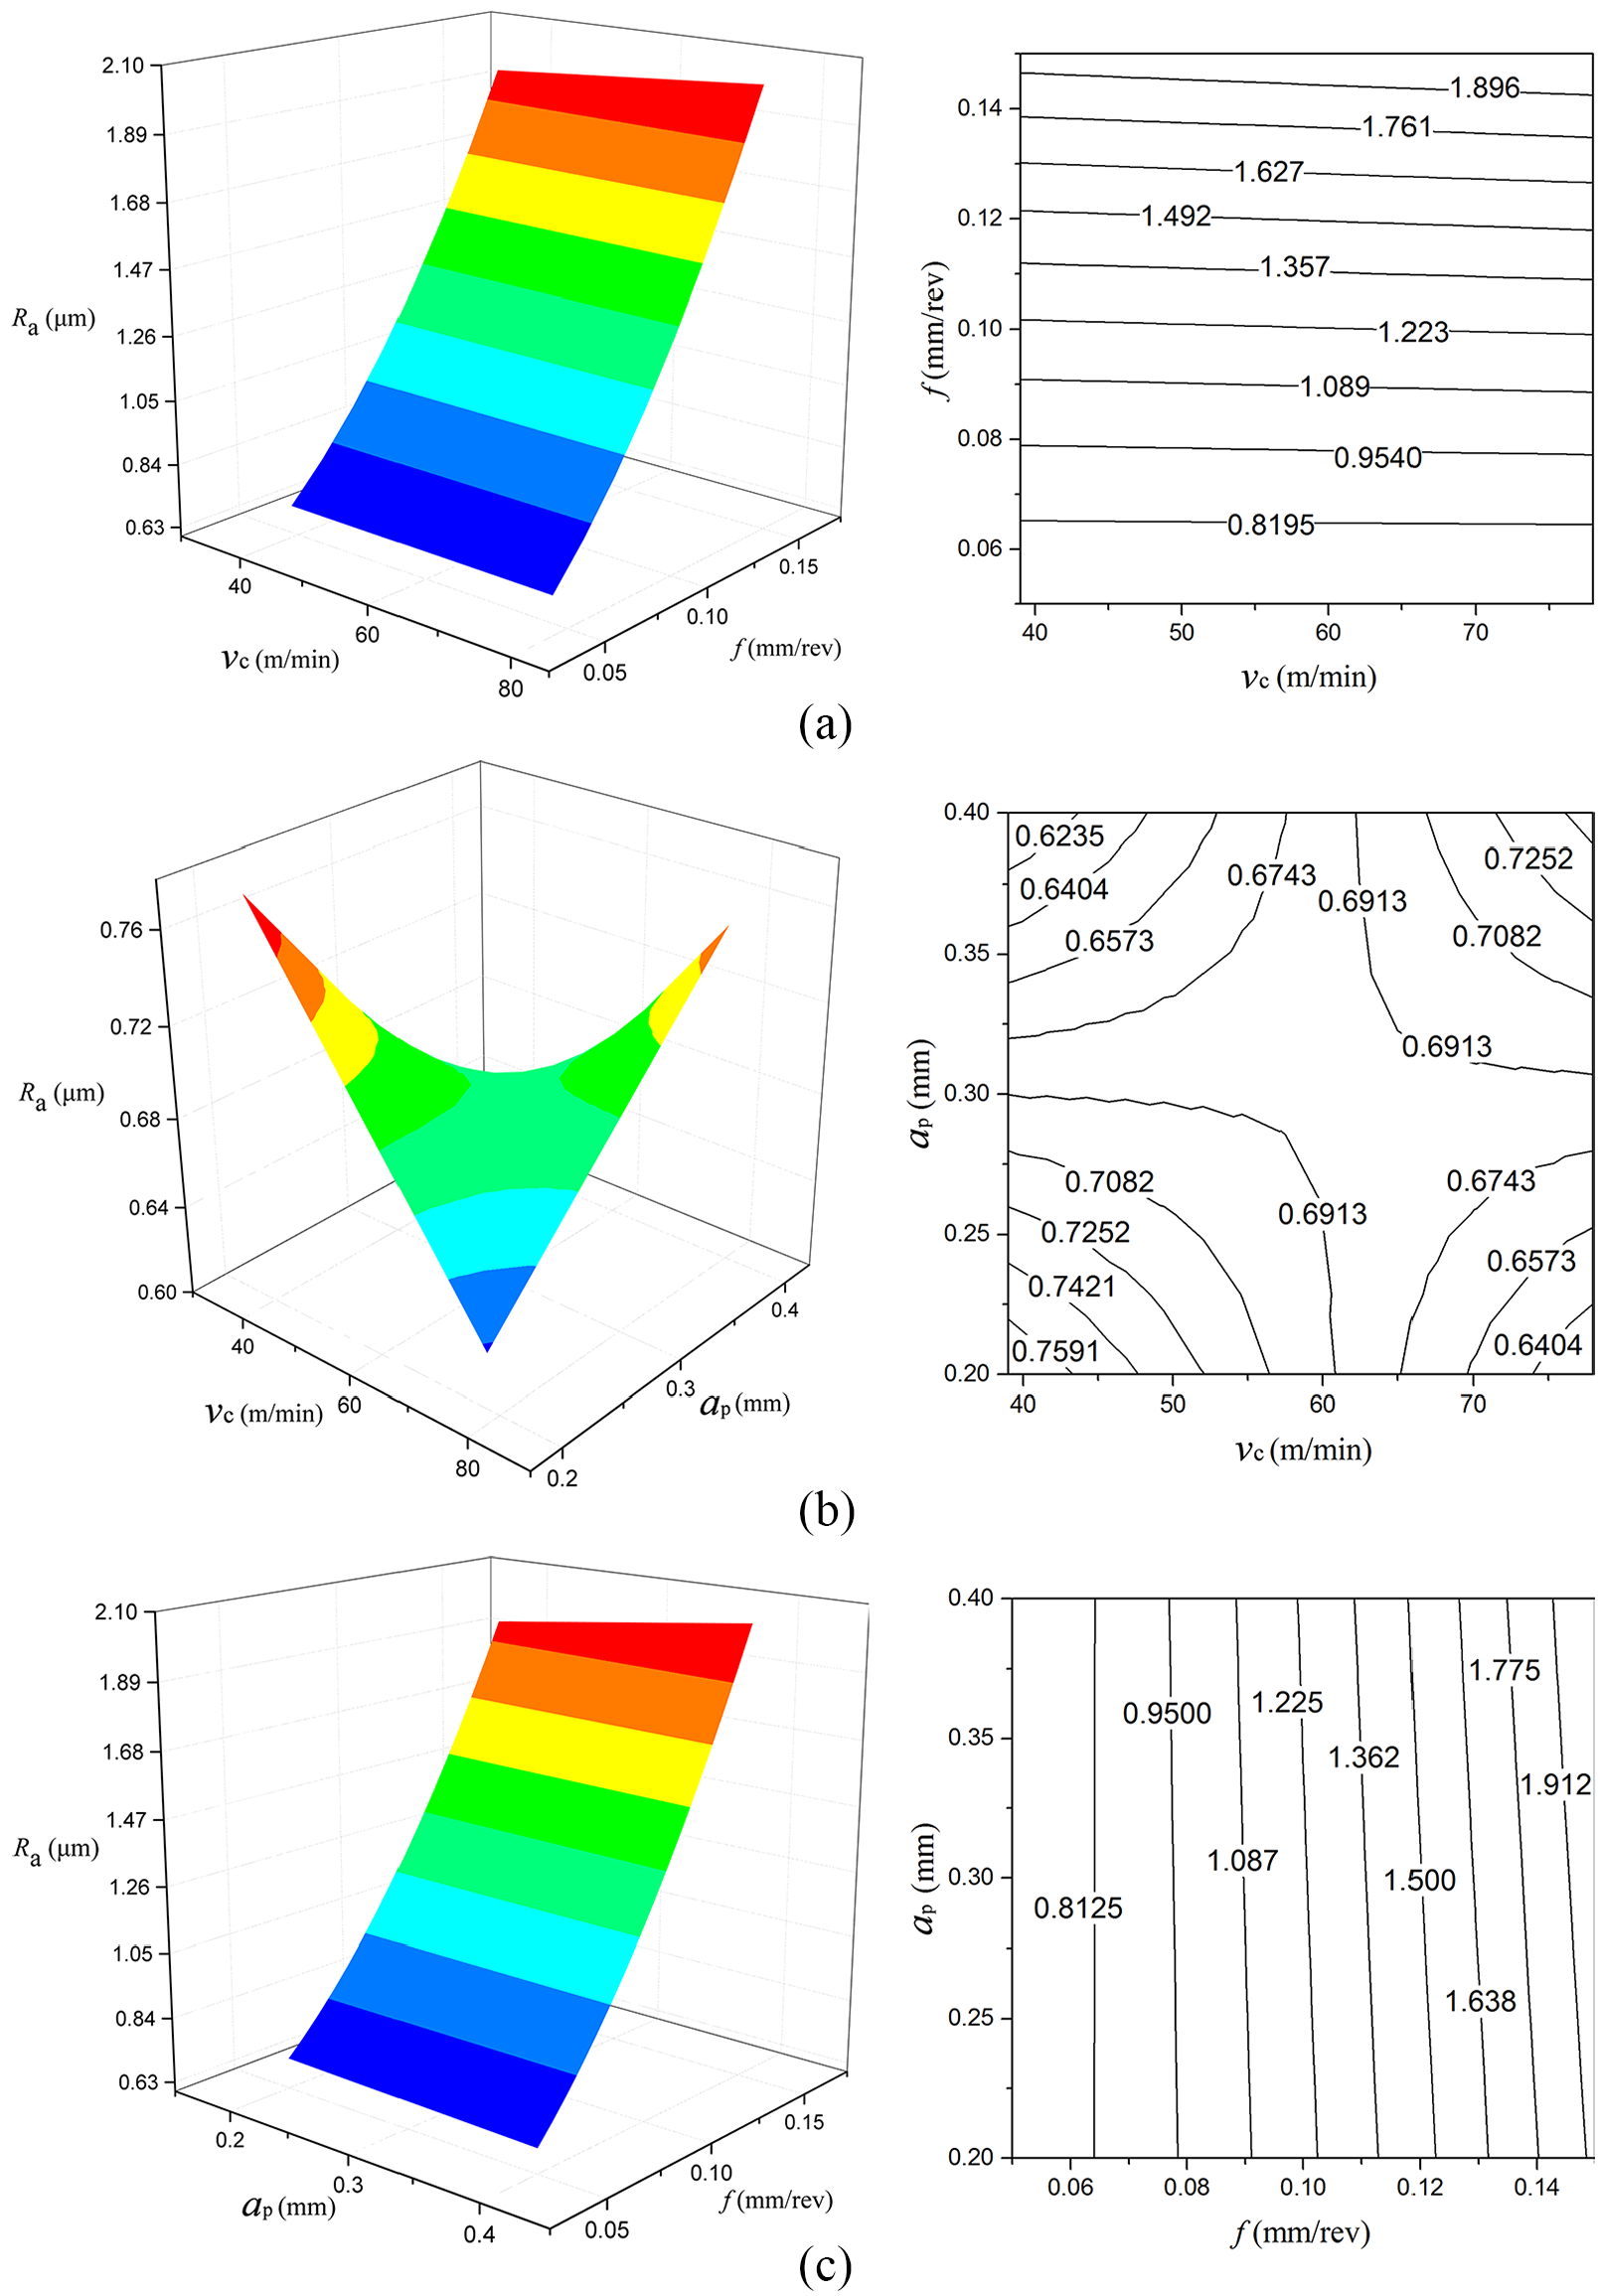
Estimated response surface for Ra depending on (a) vc and f; (b) vc and ap; (c) ap and f.
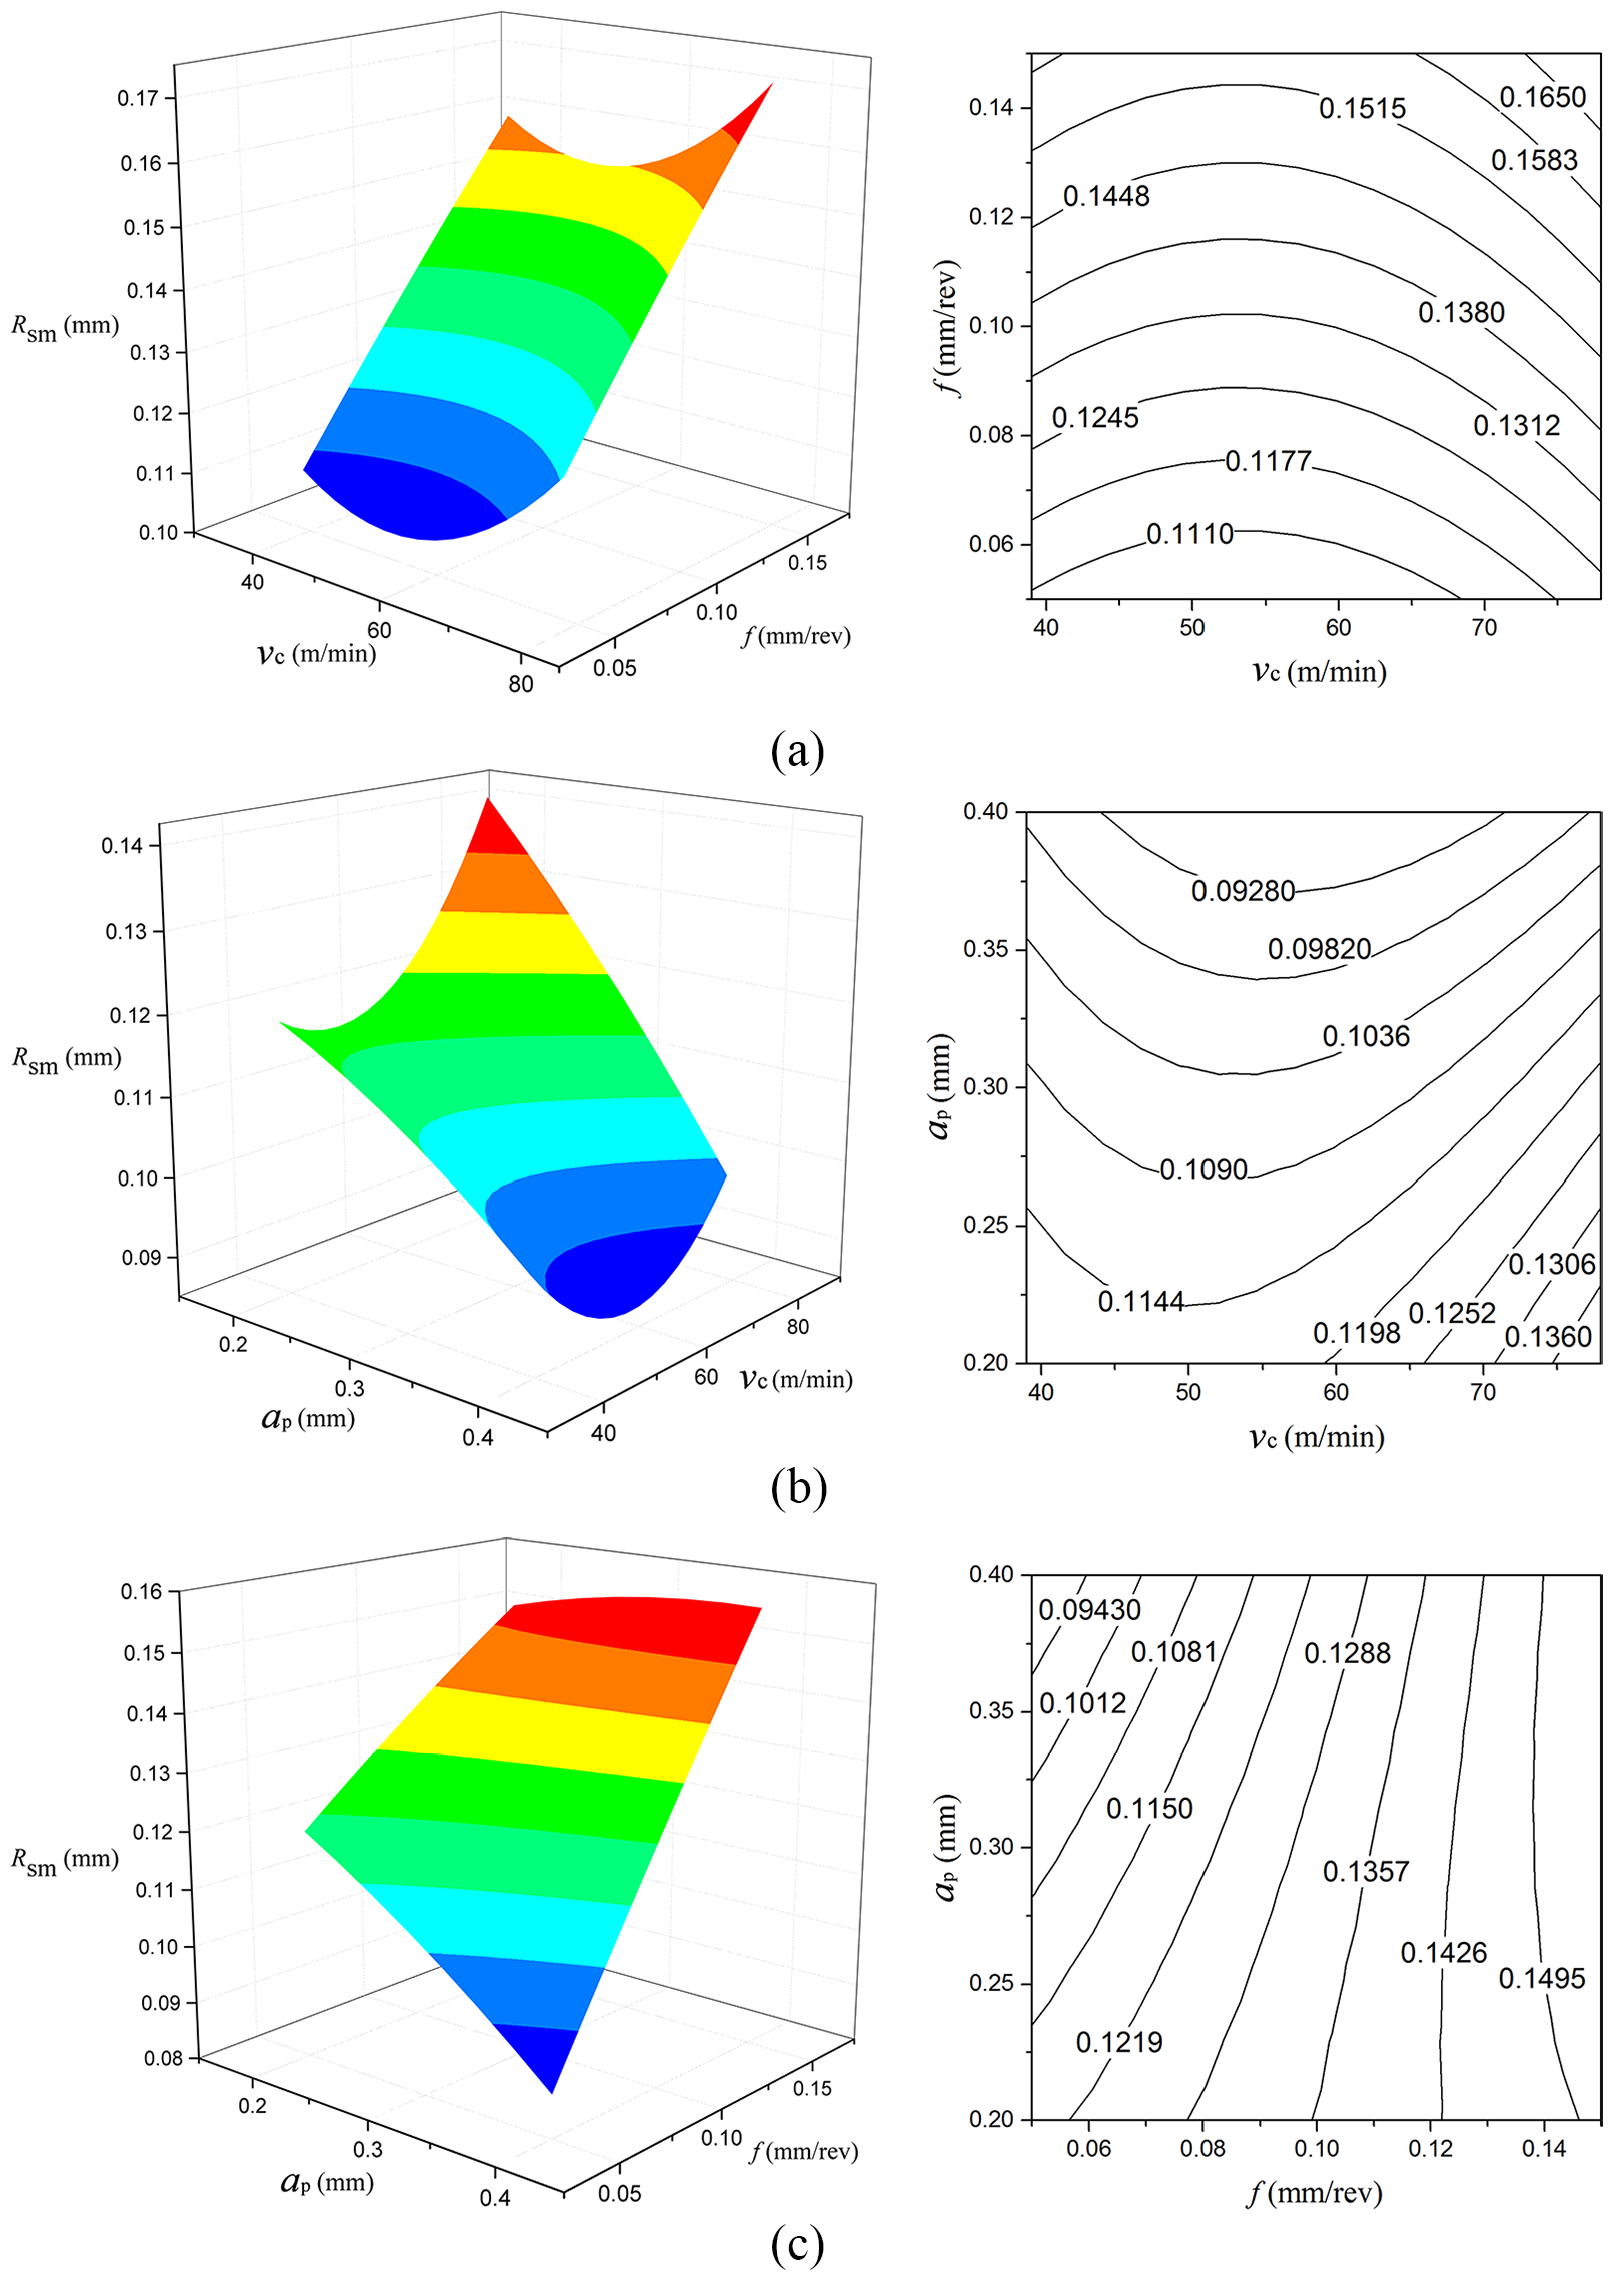
Estimated response surface for Rsm depending on (a) vc and f; (b) vc and ap; (c) ap and f.
From the figures, the surface roughness parameter Ra decreases significantly with the decrease in the feed rate when depth of cut or cutting speed is at middle level (Figure 8(a) and (c)). When feed rate at low level, a lower Ra can be obtained at low cutting speed and high depth of cut, on the contrary, at high cutting speed, it is necessary to reduce depth of cut to obtain lower Ra (Figure 8(b)). For surface roughness parameter Rsm, lower Rsm is achieved with the lower feed rate and lower cutting speed (Figure 9(a)). When feed rate is at a low level, Rsm decreases with the decrease in the depth of cut, and increasing cutting speed will increase Rsm significantly (Figure 9(b)). When cutting speed is at middle level, lower Rsm is achieved under lower feed rate and higher depth of cut (Figure 9(c)).
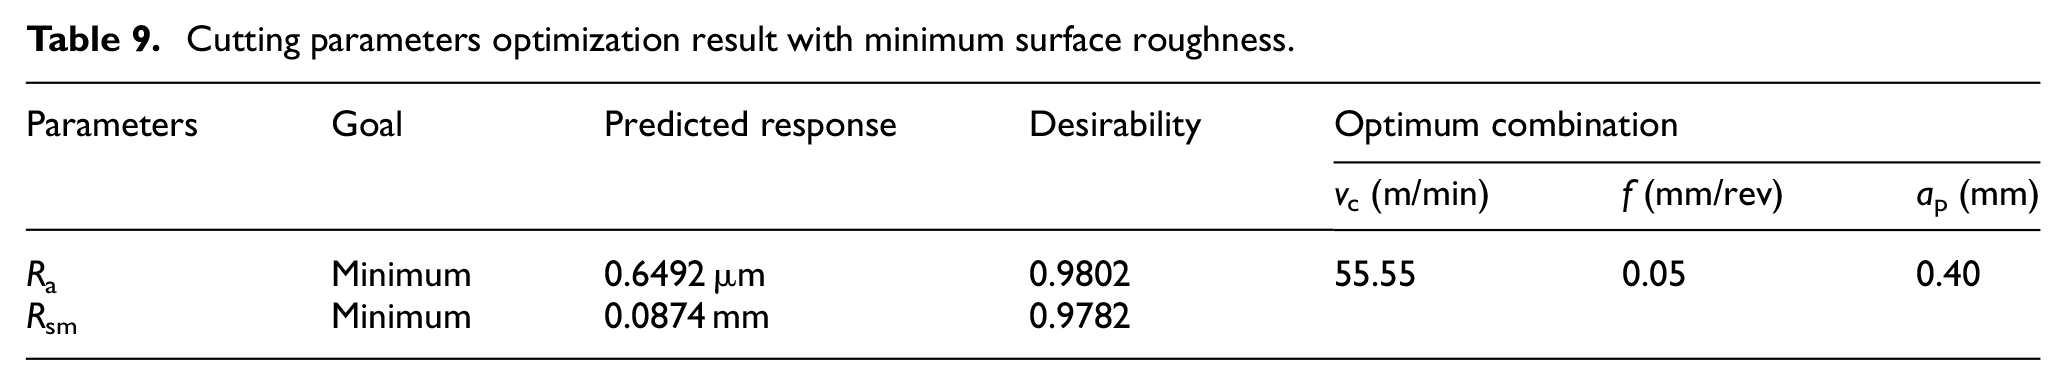
As mentioned in section “Desirability function method,” the desirability function method was applied for multi-objective optimization. The desirability was calculated using equations (7) and (8). The optimized lower and upper limits for surface roughness parameter Ra are 0.617 and 2.245 μm, and for Rsm are 0.0854 and 0.1771 mm, respectively. The objective of optimization is to obtain the minimum surface roughness parameters. Table 9 shows the optimization results calculated by the desirability function method. The best combination of cutting parameters is shown in the right side of Table, that is, cutting speed is 55.55 m/min, feed rate is 0.05 mm/rev and depth of cut is 0.40 mm. The minimum surface roughness parameters are Ra = 0.6492 μm and Rsm = 0.0874 mm under the optimal cutting parameters.
Cutting parameters optimization result with minimum surface roughness.
Conclusion
In this article, the machined surface morphology and roughness of nickel-based superalloy GH4169 after turning were studied by means of experimental and statistical methods. The influence of cutting parameters on surface defects was analyzed, and the surface roughness regression model was established. The optimal cutting parameters under minimum surface roughness were predicted based on response surface. The following conclusions could be drawn:
The machined surface of GH4169 has different surface morphologies and surface defects under different cutting parameters. When the cutting speed is 59 m/min and the feed rate is 0.15 mm/rev, the distance between the strips became wider and the surface tearing formed on the machined surfaces due to scratch of debris.
With the decrease in the feed rate, the distance between feed marks on machined surface also decreases, and the quality of machined surface improves. However, with the increase in the cutting speed (vc = 78 m/min), when the feed rate was as low as 0.03 mm/rev, the machined surfaces were scratched seriously by built-up edges and breaking-off debris in front of tool tip. When the feed rate was greater than 0.05 mm/rev, no significant scratches were caused by built-up edges on the machined surface. The reason is that with the increase in the feed rate, the heat accumulation increases and the thermal softening effect of the material makes the built-up edge difficult to generate.
The surface roughness regression model fitted by least squares method has higher prediction accuracy. By eliminating the insignificant regression variables, the coefficient of multiple determinations of the regression model can be increased by 1%–4%.
According to the RSM analysis, as feed rate decreases, both Ra and Rsm decrease significantly. The lower the cutting speed, the lower the Rsm. However, the Ra is lower when the cutting speed is at middle level. The effect of depth of cut on Rsm was more pronounced, and Rsm decreases as the amount of depth of cut decreases.
The minimum surface roughness of the machined surface under the optimal cutting parameters was obtained by using desirability function method. The minimum surface roughness parameters are Ra = 0.6492 μm and Rsm = 0.0874 mm, and the optimal cutting parameters were found to be cutting speed of 55.55 m/min, feed rate of 0.05 mm/rev and cutting depth of 0.40 mm.
Footnotes
Declaration of conflicting interests
The author(s) declared no potential conflicts of interest with respect to the research, authorship and/or publication of this article.
Funding
The author(s) disclosed receipt of the following financial support for the research, authorship and/or publication of this article: The present research was supported by the Fundamental Research Funds for the Central Universities under Project No. NS2018014.