
Abstract
The surface topography of the workpiece directly affects its service performance. In this study, CLSM and SEM are used to analyze the effects of turning speed, turning feed, and turning depth on the three dimensional topography and surface defects of the machined surface. Amplitude parameters are used to characterize the machined surface topography of hard turning. Twelve groups of single factor experiments are used to analyze the influence of turning parameters on surface topography. Based on analysis of variance (ANOVA) and 15 groups of Box-Behnken Design (BBD), whether cutting parameters have significant influence on arithmetic mean deviation ( S a ) is analyzed. A mathematical statistical model of S a is established by Response Surface Methodology, and the effectiveness of the model is verified by 10 groups of experiments. By analyzing the research results, it can be concluded that: (1) The consistency of the surface topography of hard turning is good; (2) In the turning feed direction, the surface defects of the machined surface by hard turning include turning grooves, material side flow, adhering chips, and material surface tearing; (3) In hard turning, the most significant factor affecting the three dimensional roughness ( S a ) is the turning feed.
Keywords
Introduction
After quenching and tempering, the metallographic structure of alloy tool steel is transformed into martensite and alloy carbide, and the hardness is as high as 50–65HRC. The alloy tool steel after heat treatment not only has the characteristics of high hardness, but also has very high strength and wear resistance. 1 This material is widely used in the processing and manufacturing of key parts of the engine of national defense tank vehicles, however, it is very difficult to process. Hard turning technology is a machining method dedicated to turning high hardness materials, which can replace the commonly used grinding technology. Jang and Hsiao 2 pointed out that the average surface roughness (Ra) of hard turning is 0.2–0.6 μm, moreover, the machining cycle of hard turning is three times faster than that of grinding, and the energy consumption is five times less than grinding, and it is more “green” and environmentally friendly.
The consistency of surface features and the arbitrariness of surface defects are two characteristics of the machined surface topography in hard turning. The surface topography is the micro-geometric morphology of various defects left on the surface of the workpiece due to the comprehensive action of many factors during the machining process.3,4 The machined surface topography of workpieces working under high pressure, high temperature, and corrosive environment is a key factor affecting their service performance.5,6 With the development of manufacturing industries such as aerospace, military marine vehicles, and civilian vehicles, the manufacturing industry has put forward higher requirements for the surface morphology of workpieces. Many scholars have devoted themselves to studying the surface roughness under various machining conditions, and use it as an index to determine the quality of the machined surface. 3
Aouici et al. 7 conducted a hard turning experiment on AISI H11 using CBN tool to explore the influence of turning factors on surface roughness (Ra). The researchers obtained that the main factors affecting surface roughness (Ra) are feed rate and workpiece hardness by ANOVA, and established a mathematical statistical model of Ra. In the hard turning experiment of AISI 420, the research results in literature 8 confirmed that 80.71% is the contribution rate of feed rate to surface roughness (Ra). The influence of the increase of material hardness on the deterioration of Ra was also found in the literature. 9 In the Taguchi orthogonal experiment of CBN tool hard turning AISI M2, Rafighi et al. 10 used ANOVA and regression analysis to investigate the relationship between turning parameters and surface roughness (Ra). The results showed that the feed rate has the closest relationship with the roughness. In the experimental study of hard turning AISI 4340 steel with ceramic tool, Subbaiah et al. 11 explored the relationship between turning speed, material hardness, turning feed, turning depth, and surface roughness (Ra) based on ANOVA and Box-Behnken Design of Response Surface Methodology. The results showed that the hardness of the material and the turning feed are significantly related to the surface roughness (Ra). Bhardwaj et al. 12 studied the influence of cutting parameters on the turning surface roughness of AISI 1019 based on Response Surface Methodology. The results showed that the feed is the main factor affecting the surface roughness, while the cutting depth has no significant effect on the surface roughness. In order to obtain good cutting quality and reduce excessive tool wear, many scholars13–17 are committed to adopting various types of optimization algorithms to reduce the influence of various interference factors on the surface integrity of products, so as to obtain the best cutting strategy. There are also some scholars18–20 who are committed to studying the influence of different coating tools, different texture tools, and different wear degree tools on the machined surface roughness during hard turning.
To sum up, most scholars still focus on the two dimensional roughness parameters in the research process of surface topography. However, the traditional two dimensional surface roughness parameters cannot well reflect the three dimensional topography characteristics of the machined surface. Reviewing the previous literature, it is found that the research on the mapping relationship between turning parameters and the actual topography of the turning surface is still insufficient. In this study, hard turning AISI M2 is used as a cleaner production strategy to achieve three goals: (1) The topography characteristics of hard turning surface and the influence trend of turning parameters on three dimensional surface roughness parameters are analyzed; (2) Based on Box-Behnken Design (BBD) and ANOVA, the significant influence of turning speed, turning feed, and turning depth on three dimensional surface roughness is explored, and the mathematical statistical model of three dimensional surface roughness is established. (3) The accuracy of the mathematical model is verified by comparing the error between the experimental roughness value and the predicted roughness value. This study enriches the research on the surface topography of the workpiece by hard turning technology, which is helpful to improve the service performance of the workpiece.
Materials and methods
Workpiece
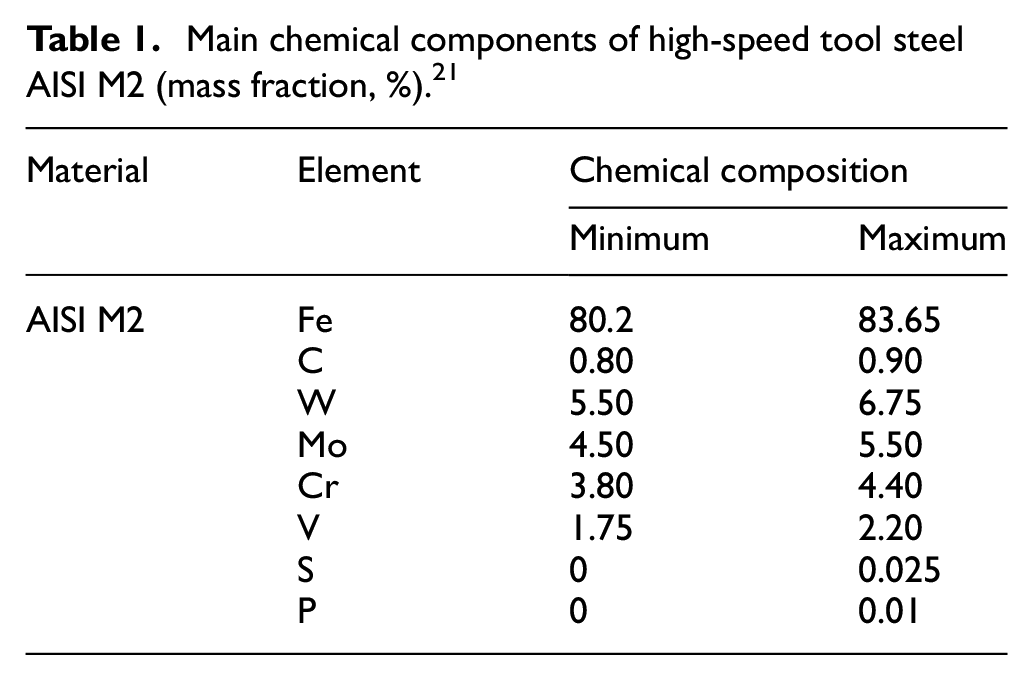
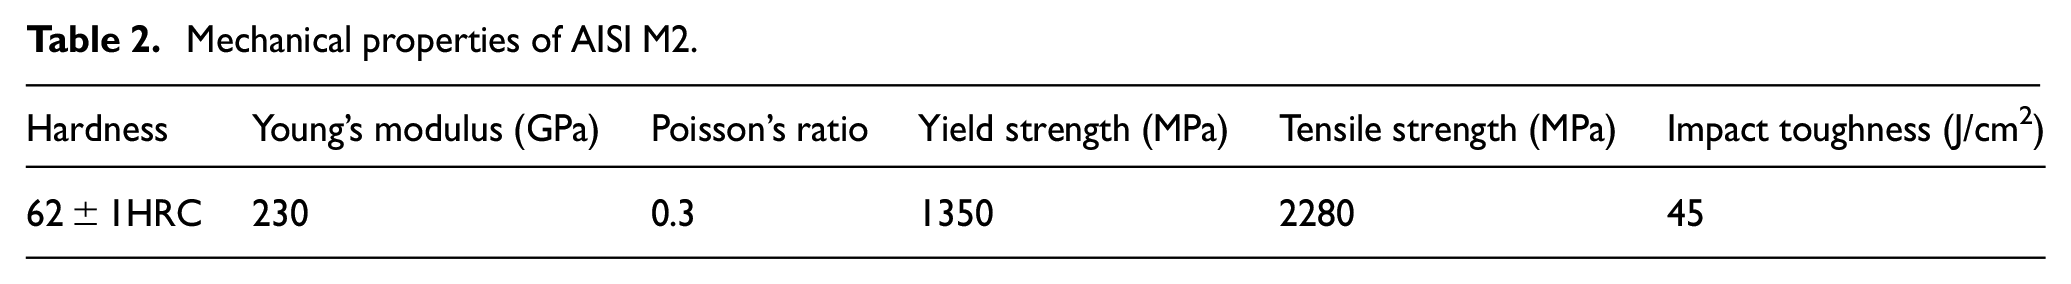
AISI M2 is W-Mo high speed tool steel, which belongs to high alloy ledeburite steel. Table 1 shows the chemical composition of AISI M2. The material is mainly composed of matrix and carbide (α + MC) in the organizational structure. The hardness of AISI M2 bar sample in this research is 62 ± 1HRC after quenching and tempering. The diameter of the sample is 20 mm and the length is 40 mm, and it is mainly used in the processing of the valve core of the high pressure common rail fuel injector of the vehicle fuel engine. After heat treatment of AISI M2, the hardness, strength, and wear resistance of this material are very high, which is a typical difficult to machine material. The mechanical properties of AISI M2 are shown in Table 2.
Main chemical components of high-speed tool steel AISI M2 (mass fraction, %). 21
Mechanical properties of AISI M2.
Experimental equipment
As shown in Figure 1, the AISI M2 is dry hard turned on Hembrug Mikroturn 100 horizontal CNC lathe (Netherlands). CBN insert (SANDVIK, DCGW11T3 02T01020F) mounted on toolholder (SANDVIK, SDJCL-2020K-11). The CBN insert has a negative chamfer of −20° × 0.1 mm, the clearance angle of the CBN insert is 7°, the tip radius of the CBN insert is 0.2 mm, the main declination angle is 93°, and the secondary declination angle is 32°.
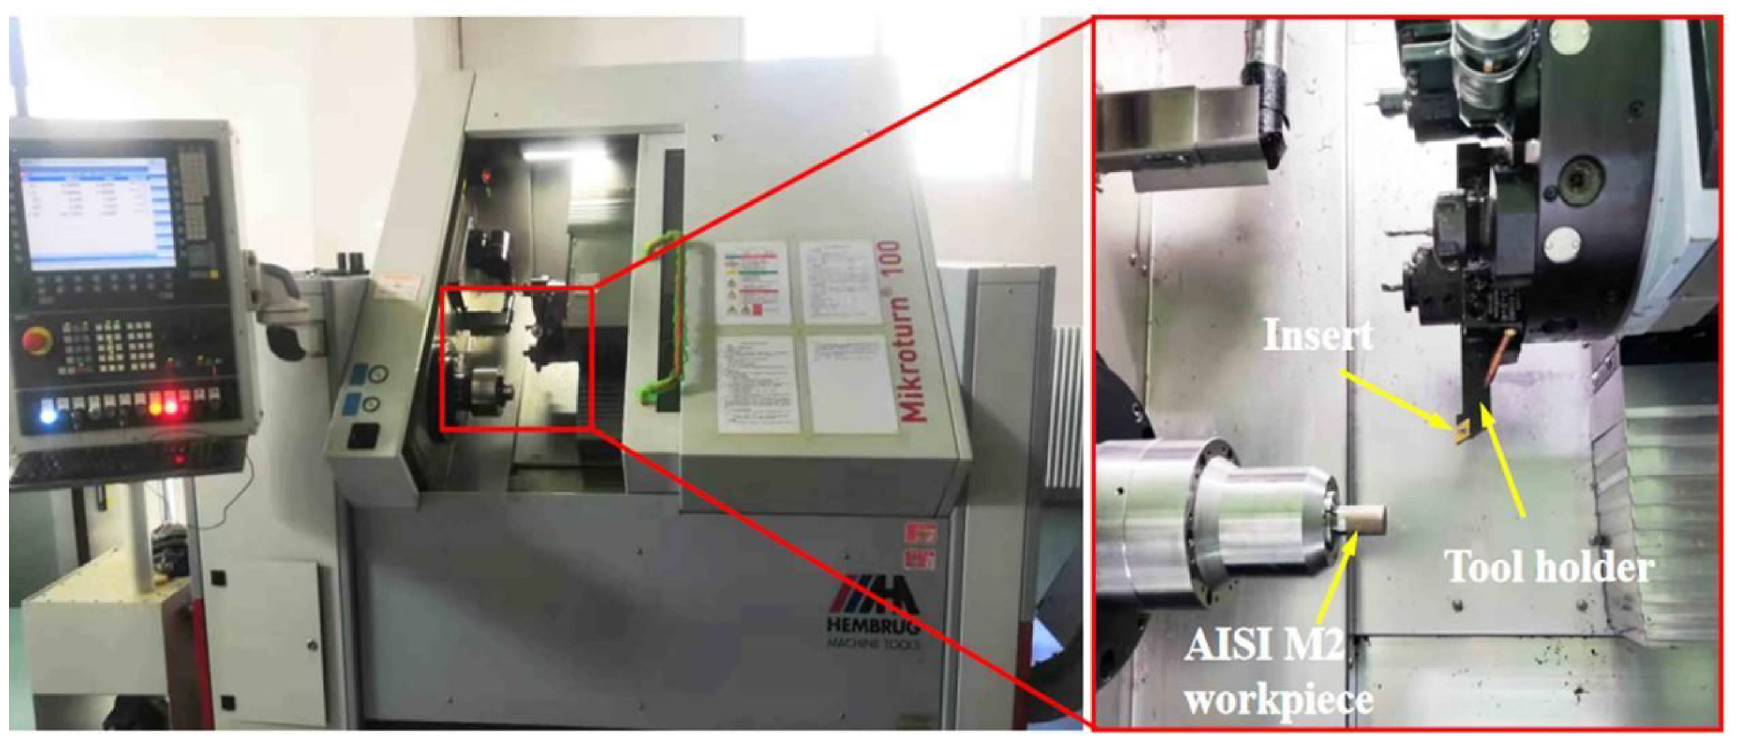
Hembrug Mikroturn 100 horizontal CNC lathe.
Experimental design
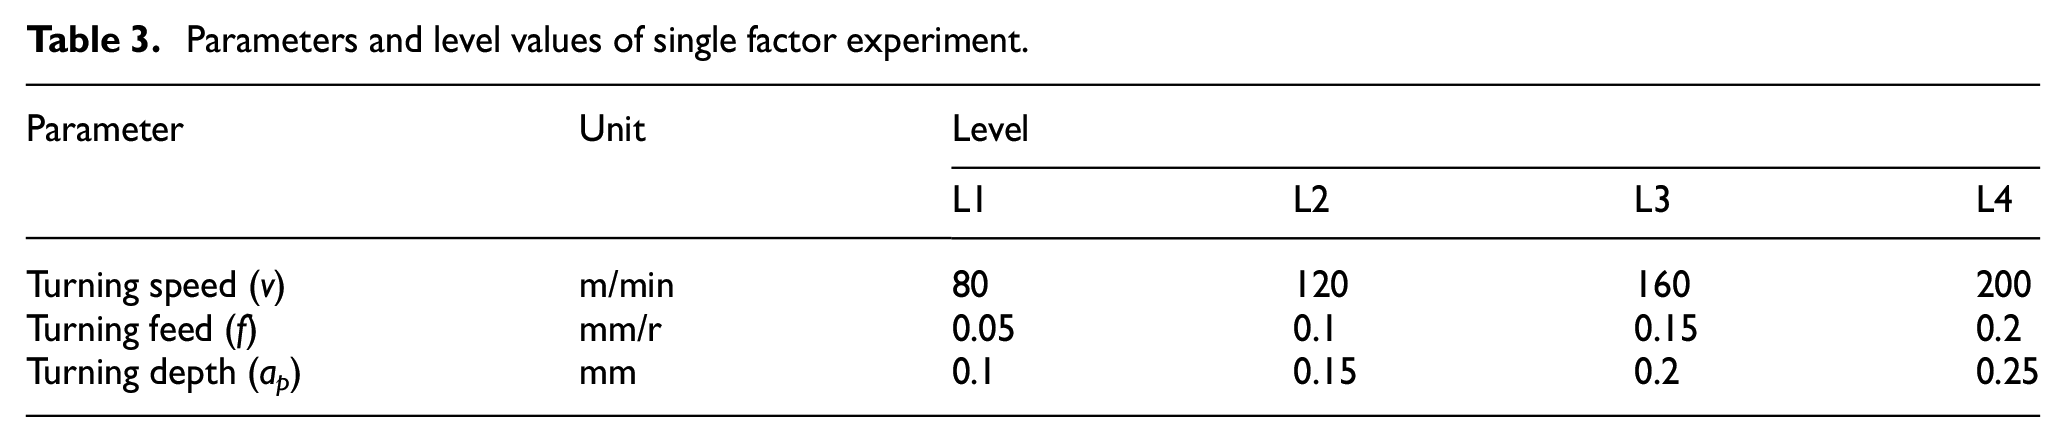
Dry hard turning experiment is carried out by combining single factor design and Response Surface Methodology. The single factor experiment method means that only one factor is tested during the experiment, while other factors are fixed, and the influence trend of a single factor on the experimental results is analyzed. It can provide a reasonable numerical range for the design of response surface experiment. According to the selection range of cutting parameters in the hard turning research of other scholars22–25 and the cutting parameter range recommended by the tool manufacturer, it is finally determined that the turning speed is 80–200 m/min, the turning feed is 0.05–0.2 mm/r, and the turning depth is 0.1–0.25 mm. The specific parameters are shown in Table 3. Response Surface Methodology (RSM) combine mathematical methods and statistical methods. It can establish the mapping relationship between input and output, and can realize the robust design of multivariable problems. Formula (1) is the relationship between multiple input variables and one output variable (y).

RSM includes Central Composite Designs (CCD) and Box-Behnken Design (BBD). CCD is an experimental design method developed on the basis of two level full factor and partial experimental design. BBD is an experimental design method that can evaluate the nonlinear relationship between input variables and response variables. Compared with CCD, BBD does not need to be tested continuously for many times. Under the same number of factors and levels, BBD has fewer test combinations than CCD, and BBD is more economical. By combining fractional factorial and incomplete block design, BBD avoids extreme data points relative to CCD. For the hard turning test of three factors and three levels, 20 groups of tests are required for CCD, while only 15 groups of tests are required for BBD. In view of this, the RSM based on BBD is adopted for the hard turning test in this study. Many scholars11,26 believe that BBD is an effective Response Surface Methodology and an ideal and effective method to replace CCD. The relationship between cutting parameters and machining characteristics is a complex nonlinear relationship. The approximate value of y can be expressed by a quadratic mathematical model. The quadratic response surface model of hard turning is shown in equation (2).
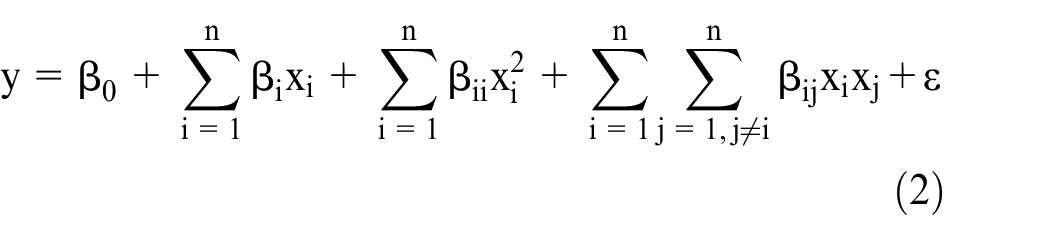
where y is the response variable; x and its related items are input variables; β is the regression coefficient and is an unknown term; ε is the error term of the regression equation.
Parameters and level values of single factor experiment.
Results and analysis
The sampling area for three dimensional surface roughness is a plane, while the sampling area for traditional two dimensional surface roughness is a line. Therefore, two dimensional roughness parameters inevitably lose some important topographic information and cannot fully characterize the surface topography, which cannot meet the requirements of precision and ultra precision machining. Bulaha 27 and Grzesik and Żak28,29 believed that three dimensional roughness parameters can characterize the morphology of the machined surface from multiple dimensions and levels. The standard ISO 25178-2:2012 30 is used for the analysis and research of characterizing the surface topography. The standard includes six categories of parameters, with more than 30 parameters in total. Todhunter et al. 31 compared the use of various surface texture parameters of ISO25178-2 in various industries through an online survey from 179 questionnaires from 34 countries. The questionnaire showed that the most frequently used morphology parameter was amplitude parameter, and 56% of participants used S a parameter to express surface topography. Therefore, the research on the surface topography of hard turning focuses on the amplitude parameter, especially on the S a parameter.
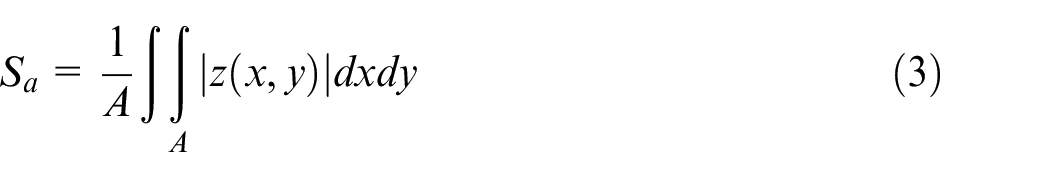
The amplitude parameters mainly include S a , S q , Ssk, Sku, S p , and Sv. Sa is the arithmetic mean deviation, and its mathematical expression is shown in Formula (3). S a represents the arithmetic mean of the absolute values of z coordinates of all points in the sampling area (A) of the machined surface. This parameter can characterize the deviation of machined surface morphology in z direction from the overall perspective.
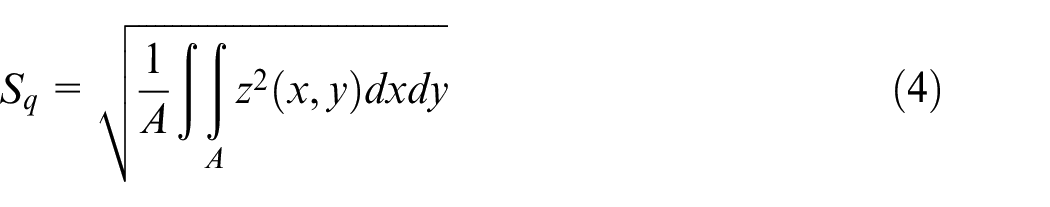
S q is the root mean square height, which represents the root mean square value of the z coordinate of each point based on the datum plane in the sampling area (A) of the machined surface, as shown in Formula (4).
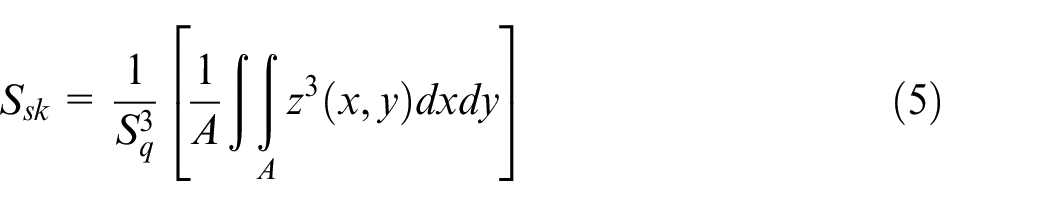
The quotient between the average value of the cubic value of z coordinate of all data points in the sampling area (A) of the machined surface and the cubic value of S q is S k , that is, the skewness of the distribution of the shape height of the machined surface. Ssk 32 represents the asymmetry of the surface deviation with respect to the datum plane. The mathematical expression of Ssk is shown in Formula (5).
S ku is the kurtosis of the highly distributed morphology, which is defined as the quotient of the average fourth power of the ordinate values of all data points in the sampling area (A) and the fourth power of the root mean Square height S q , as shown in Formula (6). This parameter is mainly used to characterize the sharpness of the height distribution of data points in the sampling area.
S p is the maximum peak height, which represents the peak value of the highest point deviating from the reference plane (positive direction) in the sampling area of the machined surface. S v is the depth of the maximum valley, which represents the peak value of the highest point deviating from the reference plane (negative direction) in the sampling area of the machined surface.
Micromorphology of the machined surface
Figure 2 shows the microscopic morphology of the machined surface of AISI M2 dry hard turning observed by SEM. The machined surface morphology is not completely smooth, but there are different degrees and types of surface defect features along the turning feed direction, as shown in Figure 2. These defects are mainly manifested as plowing groove, material side flow, adhered material partical, and surface tearing. The plowing grooves and the feed marks are clearly observed from Figure 2(a). In the process of hard turning, the plowing force exerted by the cutting edge on the material surface and the scratching force exerted by hard particles on the material surface cause grooves on the machined surface. Figure 2(b) is obtained by local magnification of 3000 times of Figure 2(a), and the phenomenon of material side flow and adhering debris can be observed. In the process of hard turning, the main cause for the formation of material side flow is the plastic deformation of the groove on the machined surface caused by the extrusion of the tool flank under the thermal mechanical coupling. The formation of adhered material particals is mainly due to the large amount of cutting heat generated by hard turning, and the broken chips adhere to the machined surface. The energy spectrum analysis of the adhered material particals show that the main elements of the debris are consistent with those of AISI M2, but the contents of carbon and oxygen in the elements are significantly increased, as shown in Figure 2(d). This is mainly due to the oxidation reaction of debris caused by high temperature. When magnifying the part of Figure 2(a) by 500 times, the phenomenon of surface tearing can be observed, as shown in Figure 2(c). In the process of hard turning, the surface tearing is mainly caused by the fact that the tool sometimes bonds and takes away a small part of the material on the workpiece surface under the action of thermal mechanical coupling, thus tearing the machined surface. Many scholars33–35 also found similar characteristics of various surface microscopic defects during the research process of hard turning.
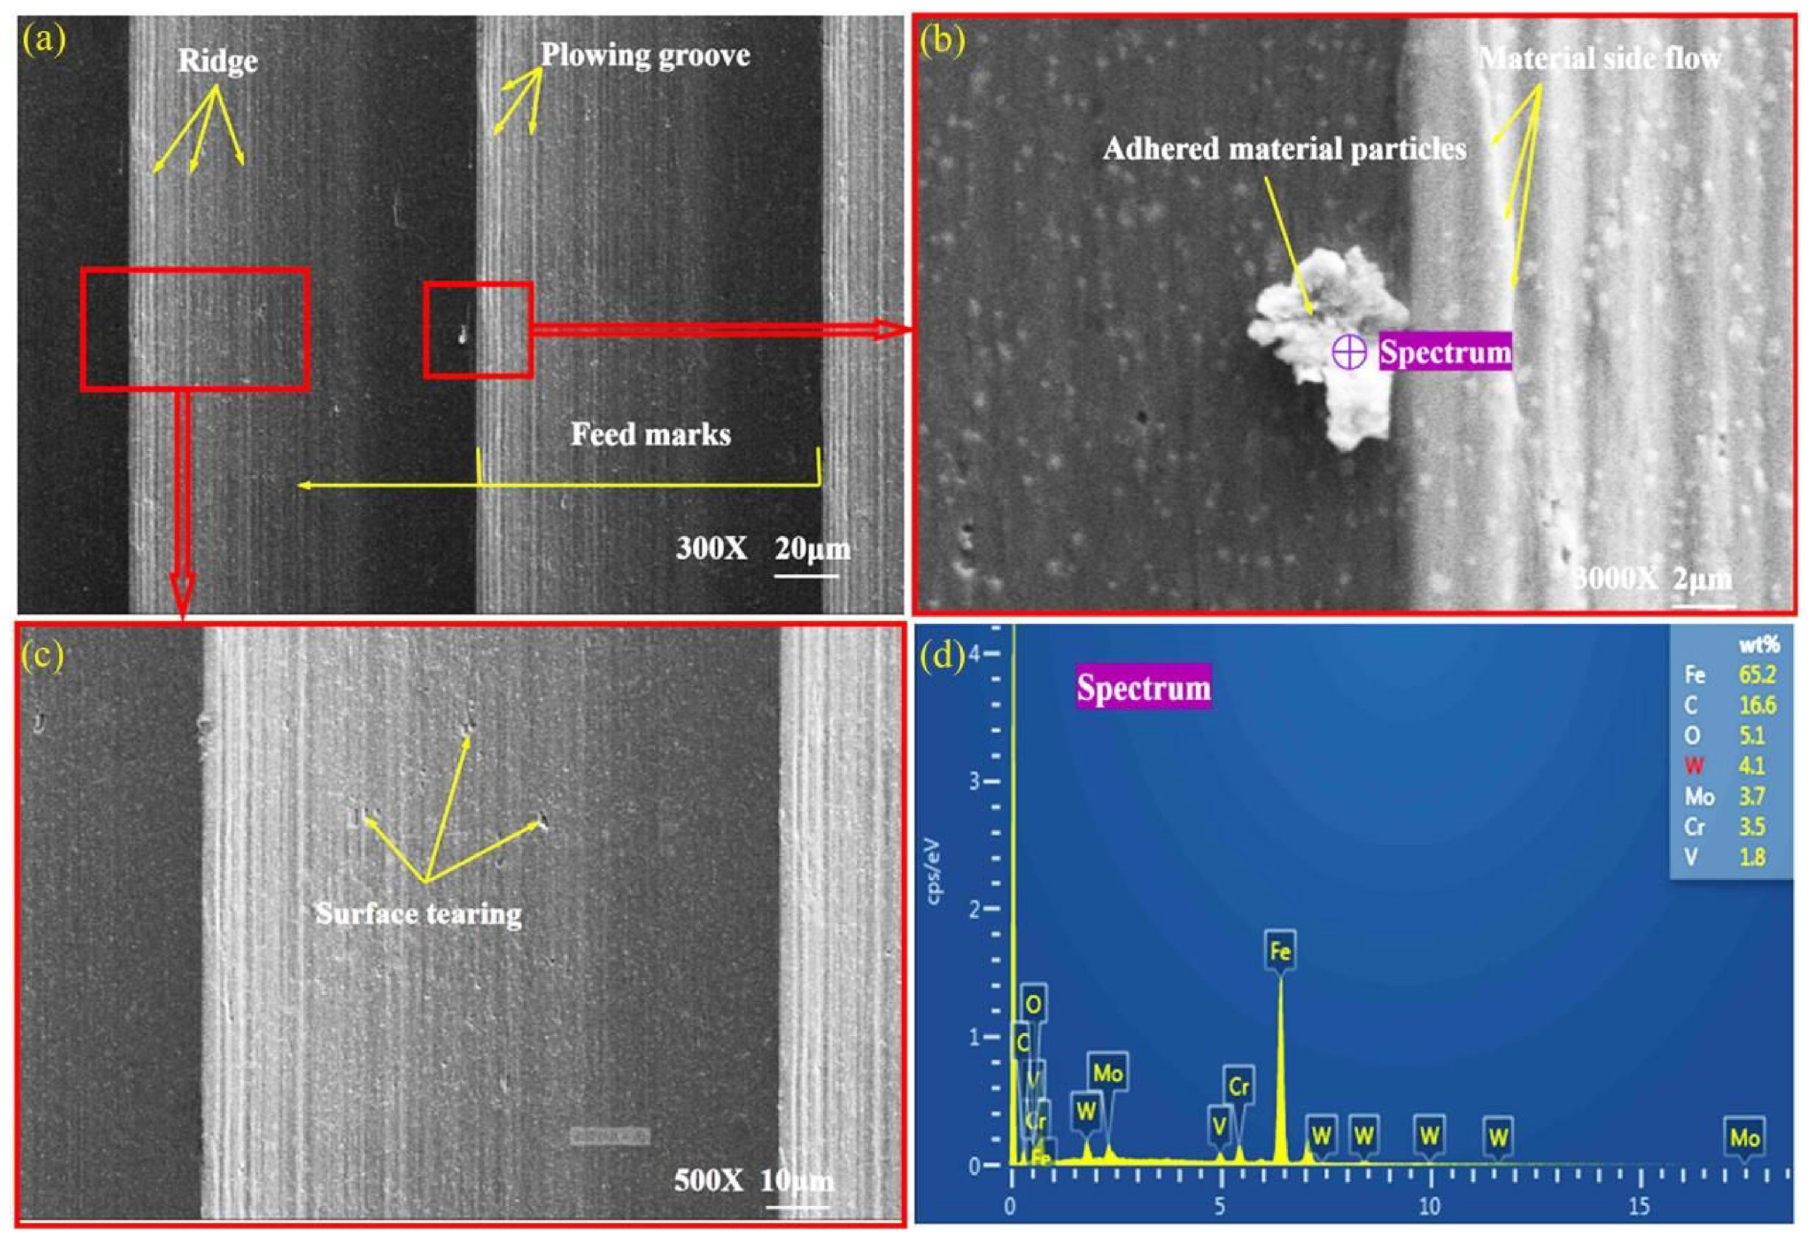
Surface topography and energy spectrum analysis of dry hard turning AISI M2: (a) Microtopography of machined surface, (b) The local surface topography of Figure 2(a) is enlarged by 3000 times, (c) The local surface topography of Figure 2(a) is enlarged by 500 times, and (d) The energy spectrum analysis of Spectrum.
Influence of turning parameters on surface topography
Surface topography analysis based on single factor experiment
Figure 3(a–d) shows the machined surface topography detected by CLSM, and the measured sampling area is 300 μm × 300 μm. Computer technology can realize the digitization of image information and get the influence trend of turning speed on amplitude parameters, as shown in Figure 3(e) and (f). From Figure 3(a–d), it can be observed that the surface topography of the turning process is highly consistent, and the peak and valley features show good regularity, which is similar to the research results of Grzesik and Żak. 28
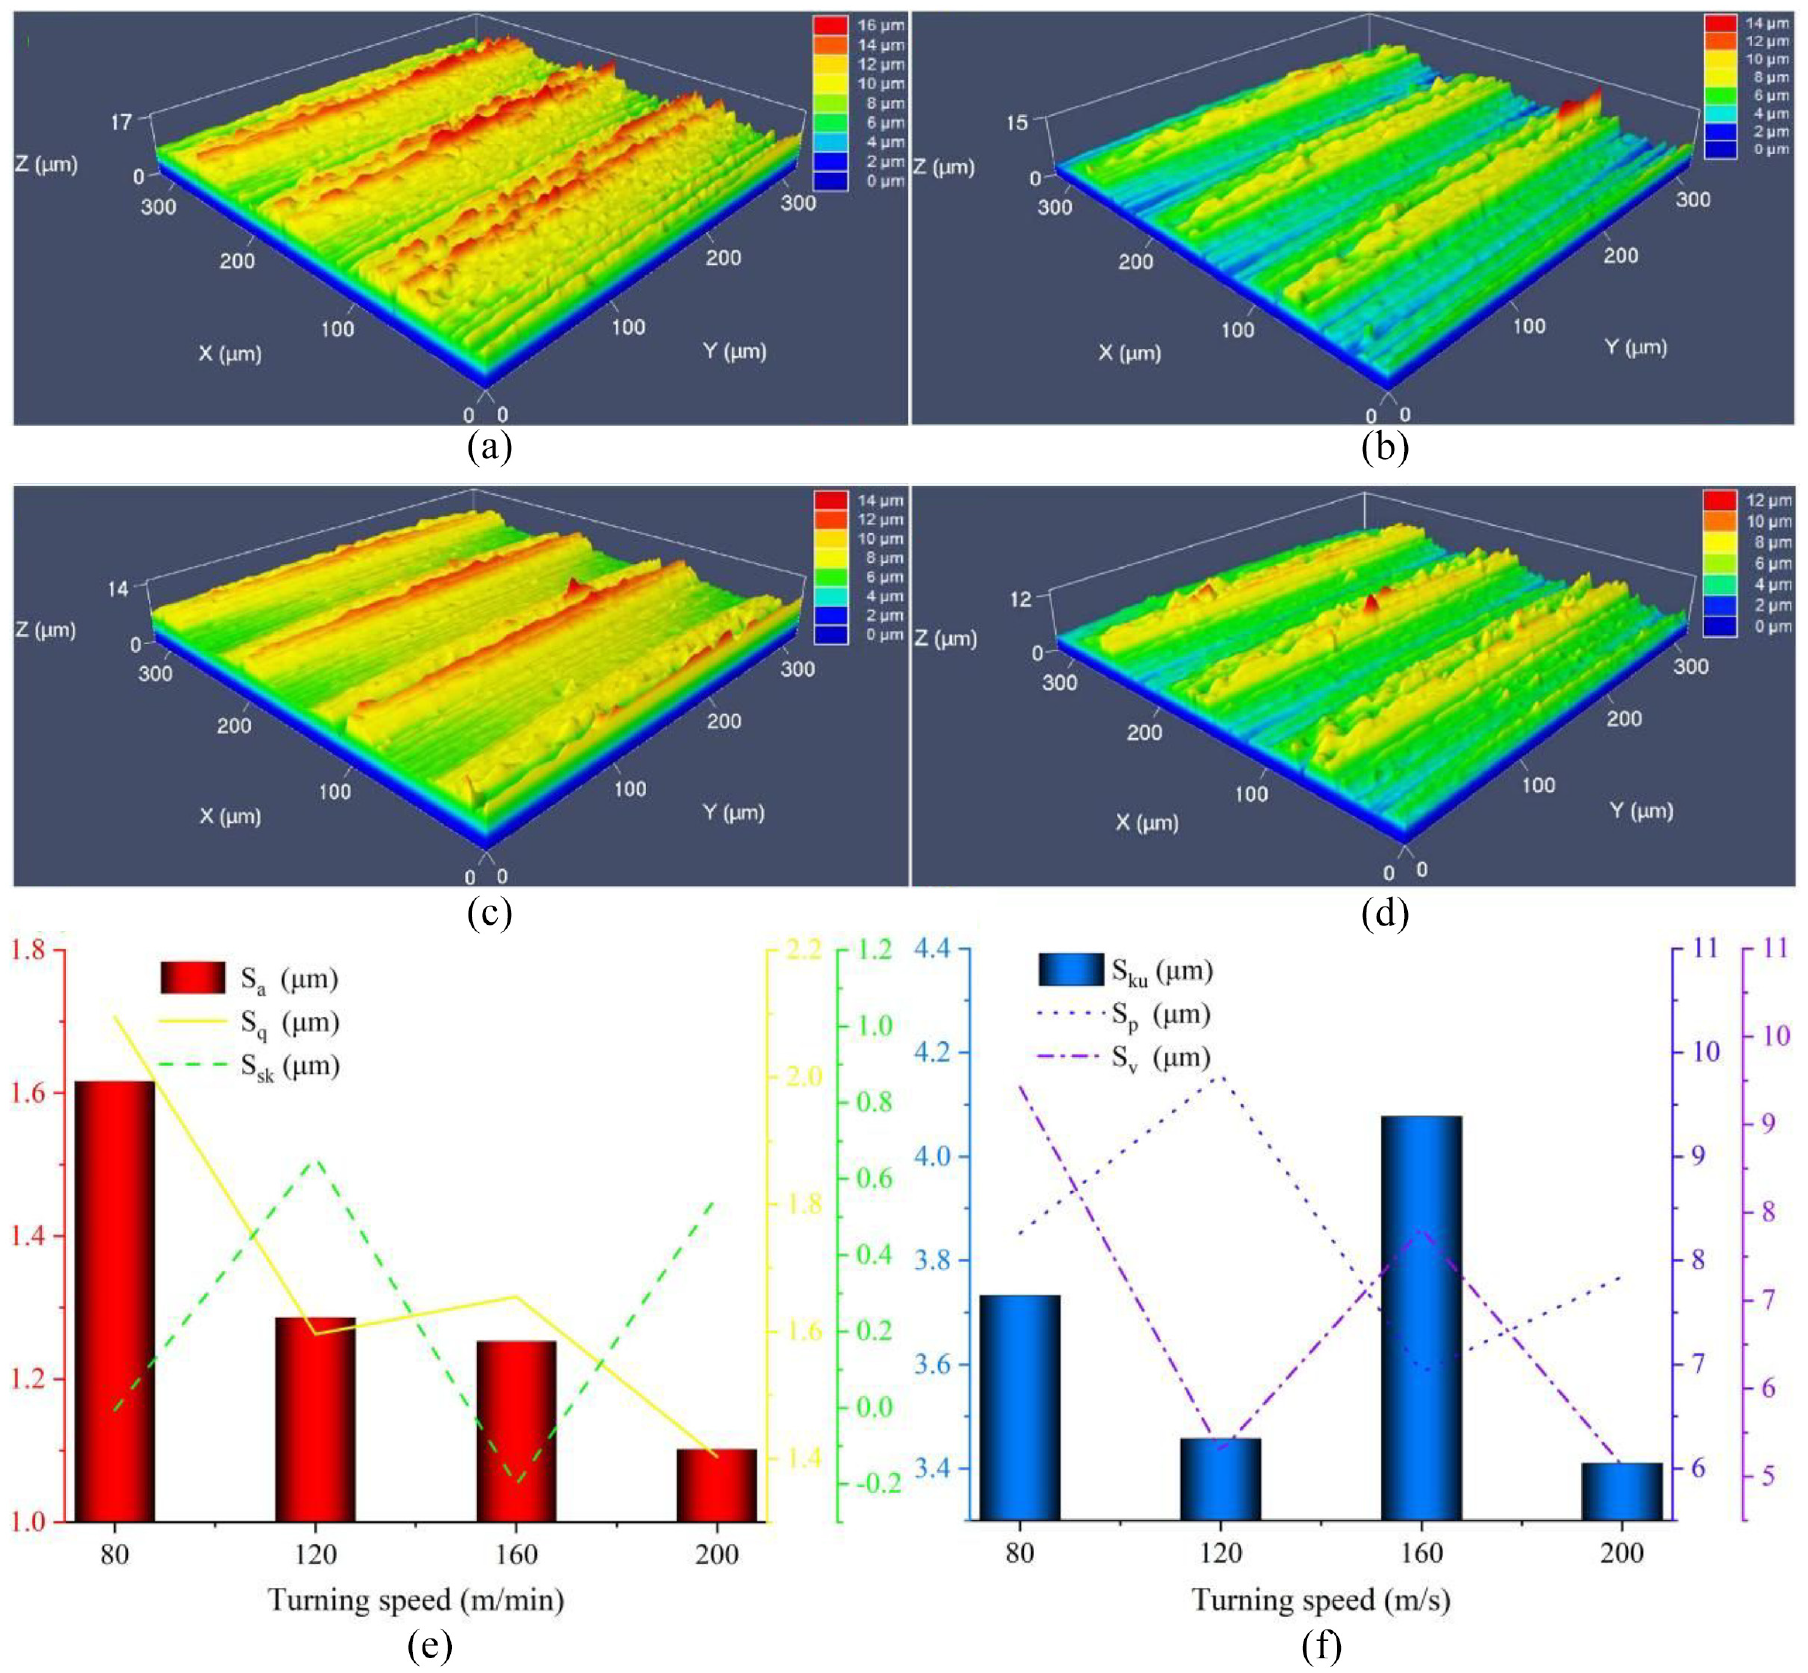
The influence of turning speed on surface topography (turning feed is 0.1 mm/r, turning depth is 0.15 mm): (a) machined surface topography with turning speed of 80 m/min, (b) machined surface topography with turning speed of 120 m/min; (c) machined surface topography with turning speed of 160 m/min, (d) machined surface topography with turning speed of 200 m/min, (e) effect of turning speed on Sa, Sq, and Ssk, and (f) effect of turning speed on Sku, Sp, and Sv.
It can be seen from Figure 3(e) that when the turning speed changes from 80 to 120 m/min, the S a decreases from 1.617 to 1.286 μm, and the accuracy increases by 20.5%. When the turning speed is set to 120 and 200 m/min, the measured values of S a are 1.286 and 1.102 μm, respectively, with a variation of only 14.3%. This shows that low turning speed has a great influence on S a , while high turning speed has a smaller influence on Sa. Sa has a negative correlation with turning speed, which is due to the positive correlation between turning temperature and turning speed. The thermal softening effect of the workpiece material is enhanced and the cutting force is reduced. As a result, the roughness value is also reduced. In the research of Bertolini et al. 36 and Lima et al., 37 the same effect of turning speed on surface roughness was observed. S q represents the standard deviation of the z direction height distribution of the machined surface topography. The value of S q corresponding to the turning speed of 80 m/min is 2.095 μm, that of 120 m/min is 1.596 μm, that of 160 m/min is 1.655 μm, and that of 200 m/min is 1.403 μm. The influence of turning speed on S q is similar to that of turning speed on S a . Although the overall change of S q shows a decreasing trend, the change trend is fluctuating. That is, when the cutting speed is 160 m/min, S q increased by 3% fluctuation. Ssk can be used to judge the shape tendency of roughness. With Ssk < 0, the z direction height distribution of the surface topography is on the upper side relative to the reference plane, and more valleys are distributed on the machined surface, which has a higher fluid retention capacity. With Ssk = 0, the z direction height distribution of the surface topography is symmetrical to the reference plane. With Ssk > 0, the z direction height distribution of the surface topography is lower than the reference plane, and more peaks are distributed on the machined surface. When the turning speed is 80 and 160 m/min, the Ssk is −0.005 and −0.202 μm, respectively, indicating that the height distribution of the topography is higher than the reference plane; When the cutting speed is 120 and 200 m/min, the Ssk is 0.657 and 0.556 μm, respectively, indicating that the height distribution of the topography is lower than the reference plane.
S ku reflects the steepness of the surface topography. When Sku < 3, the height distribution of all points in the measurement area is flat. When Sku = 3, the height distribution of all points in the measurement area is normally distributed. When Sku > 3, the height distribution of data points in the measurement area is sharp. It can be seen from Figure 3(f) that the values of Sku are all greater than 3, which indicates that the machined surface topography is sharply distributed under this machining parameter. S p represents the maximum value of the peak topography of the machined surface. The value of S p corresponding to the turning speed of 80 m/min is 8.262 μm, that of 120 m/min is 9.794 μm, that of 160 m/min is 6.927 μm, and that of 200 m/min is 7.845 μm. The maximum peak is 9.794 μm, and the minimum peak is 6.927 μm. S v represents the maximum pit value of surface topography. When the turning speed is 80, 120, 160, and 200, the S v is 9.424, 5.279, 7.813, and 5.122 μm, respectively. The results show that the cutting speed that makes the maximum pit value of the machined surface topography is 80 m/min.
Figure 4(a–d) shows the machined surface topography at different turning feeds measured by CLSM, and the sampling area is 300 μm × 300 μm. With the increase of turning feed, the distance between peaks and pits of surface topography increases significantly. Figure 4(e) and (f) represent the influence trend of turning feed on the amplitude parameters S a , S q , Ssk, Sku, S p , and S v . As shown in Figure 4(e), the variation of S a is significantly affected by the turning feed. When the turning feed increases from 0.05 to 0.2 mm/r, S a increases approximately linearly from 0.824 to 5.795 μm. The reason for this trend: First, the residual height of the machined surface increases with the increase of the turning feed. Second, as the turning feed increases, the turning force increases, 38 which causes the workpiece to deform and vibrate during machining. The variation trend of S q with the turning feed is the same as that of S a , and it also approximates the law of linear increase. When the turning feed is 0.05 mm/r, the Ssk is −0.084 μm, which indicates that the z direction height distribution of the surface topography is higher than the reference plane; When the turning feed is 0.1, 0.15, and 0.2 mm/r, the Ssk is 0.657, 0.472, and 1.142 μm, respectively, which indicates that the z direction height distribution of the surface topography is lower than the reference plane. As shown in Figure 4(f), when the turning feed is 0.05 mm/r, Sku = 2.765 μm < 3 μm, which indicates that the distribution of the machined surface topography is flat. When the turning feed is 0.1, 0.15, and 0.2 mm/r, the values of the three Sku are approximately equal to 3.5 μm, which indicates that the distribution of the machined surface topography is sharp. The changing trends of S p and S v are consistent, and they are positively correlated with the turning feed. The minimum and maximum values of S p are 3.695 and 25.151 μm, respectively. The minimum and maximum values of S v are 3.384 and 21.191 μm, respectively.
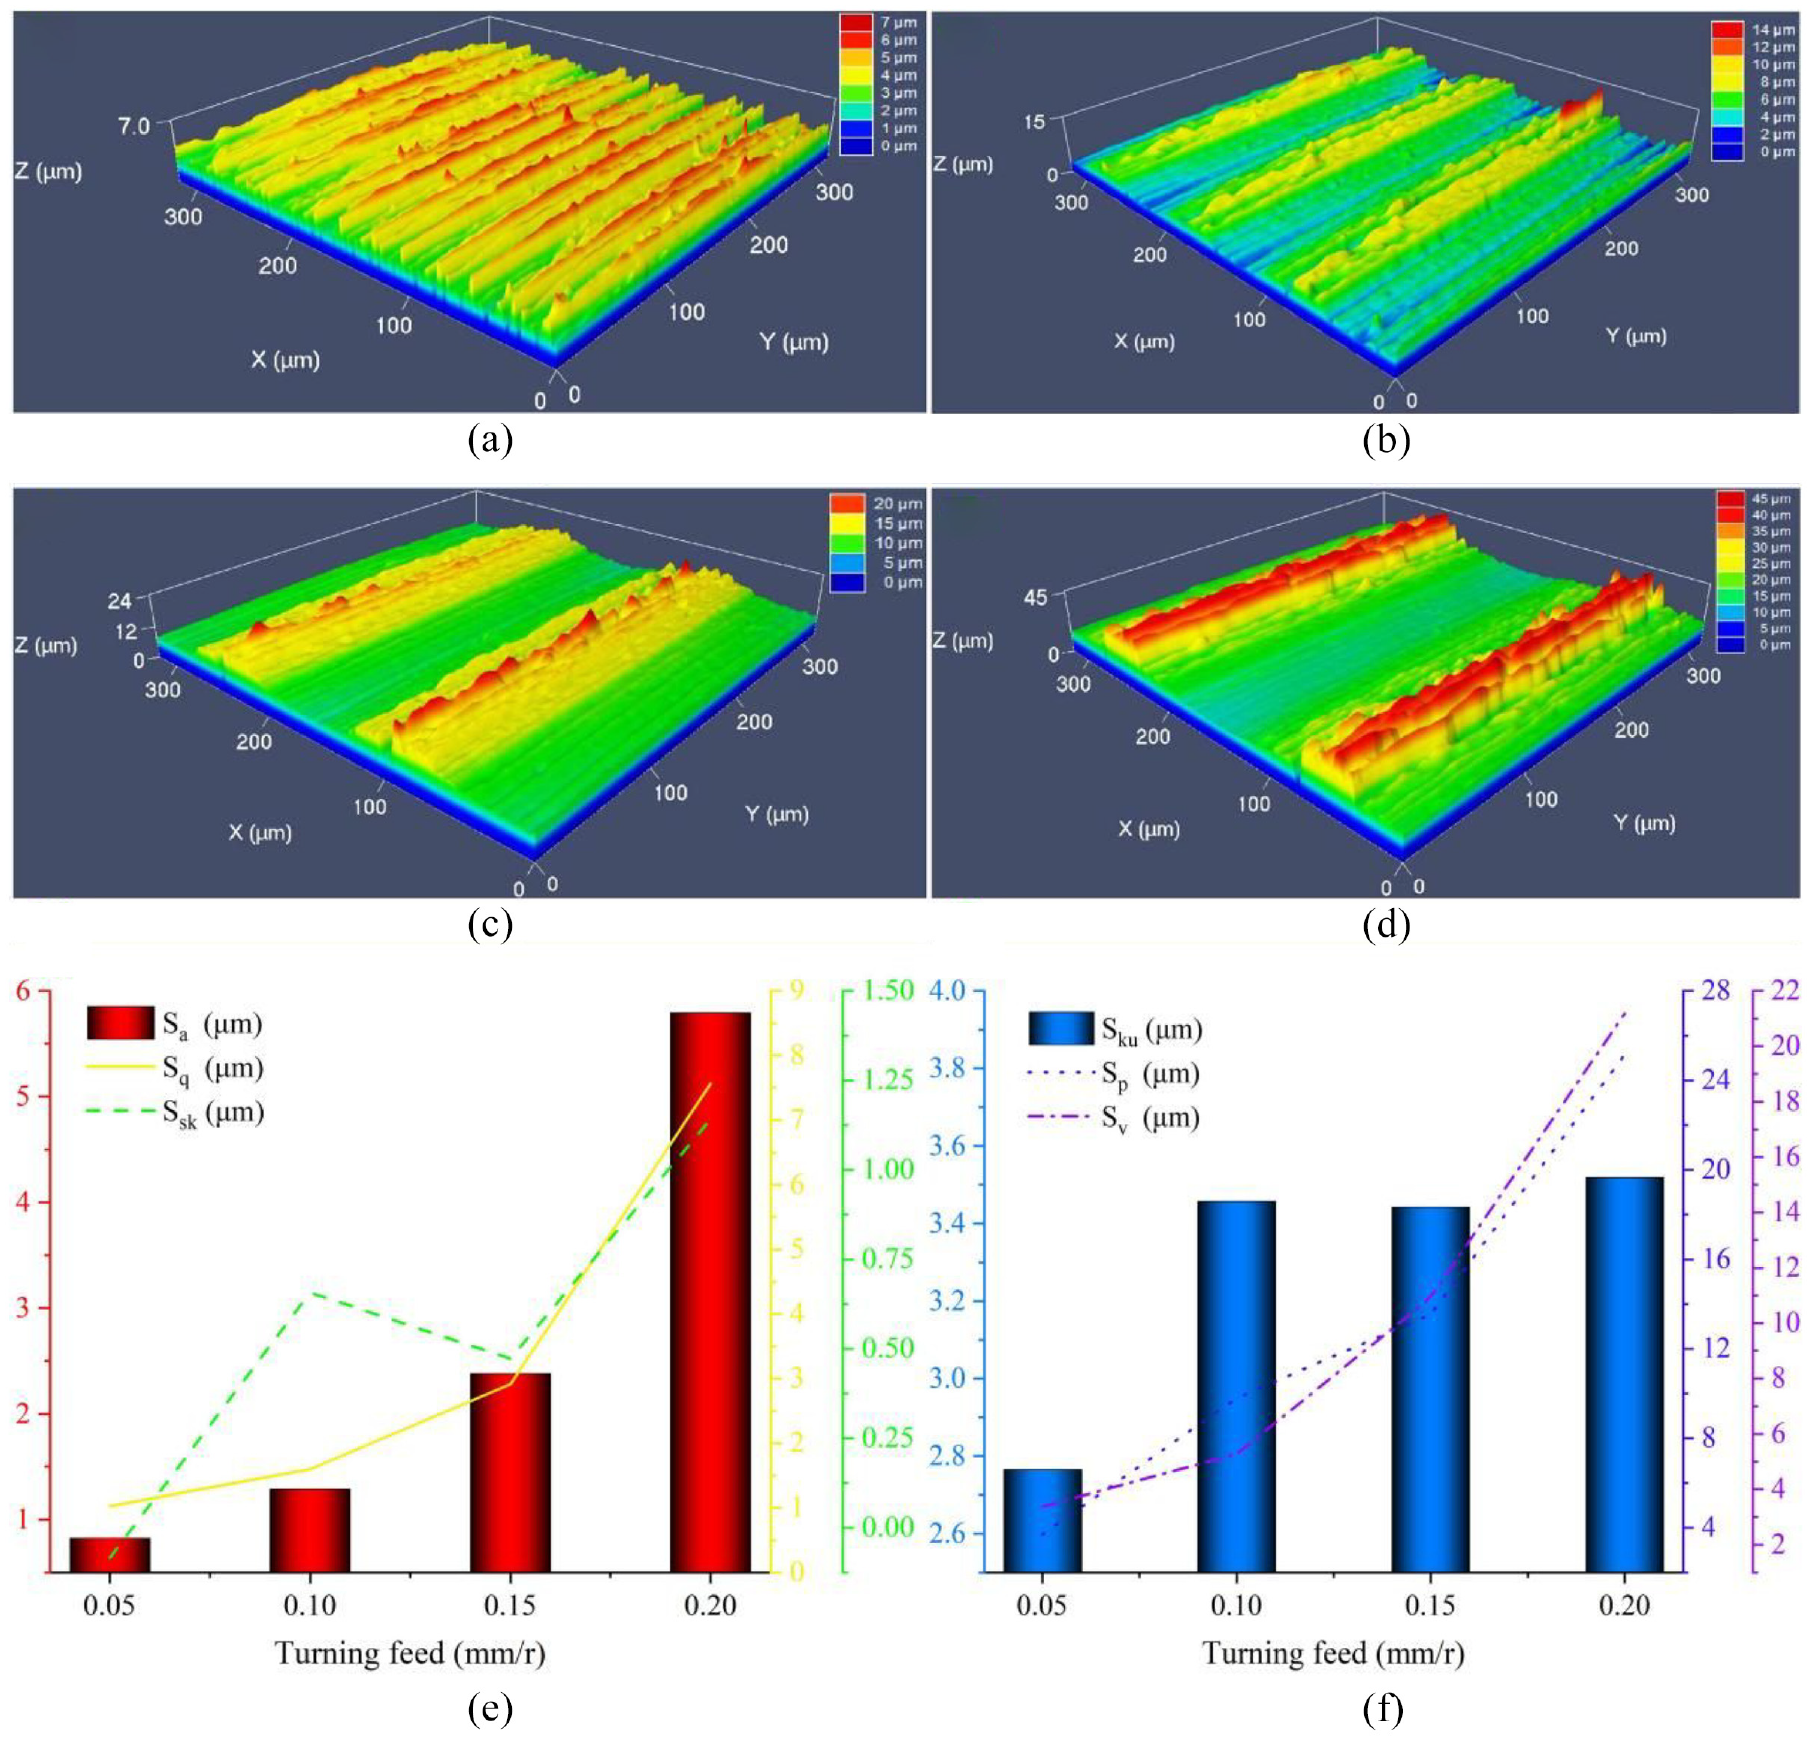
Effect of turning feed on surface topography (turning speed is 120 m/min, turning depth is 0.15 mm): (a) machined surface topography with turning feed of 0.05 mm, (b) machined surface topography with turning feed of 0.1 mm, (c) machined surface topography with turning feed of 0.15 mm, (d) machined surface topography with turning feed of 0.2 mm, (e) effect of turning feed on Sa, Sq, and Ssk, and (f) effect of turning feed on Sku, Sp, and Sv.
Figure 5(a–d) shows the machined surface topography at different turning depths measured by CLSM, and the sampling area is 300 μm × 300 μm. With the increase of turning depth, the change of machining topography is small. Figure 5(e) and (f) show the effect of turning depth on the amplitude parameters S a , S q , Ssk, Sku, S p , and S v . When the turning depth is 0.1, 0.15, 0.2, and 0.25 mm, the S a is 1.231, 1.286, 1.382, and 1.288 μm, respectively, and its maximum variation is 12%, as shown in Figure 5(e). With the increase of turning depth, S a first increases and then decreases. Reasons for this trend: First, the turning force is proportional to the increase of the turning depth, 39 and the increase of the turning force causes the S a to become larger. Second, when the turning depth increases, the turning heat increases sharply, and the high temperature softens the workpiece and reduces the turning force, thereby reducing S a . The variation trend of S q with the turning depth is the same as that of S a . When the turning depth is 0.2 and 0.25 mm, the Ssk is −0.522 and −0.23 μm, respectively, which indicates that the z direction height distribution of the surface topography is on the upper side relative to the reference plane. When the turning depth is 0.1 and 0.15 mm, the Ssk is 0.261 and 0.657 μm, respectively, which indicates that the z direction height distribution of the surface topography is lower relative to the reference plane. As shown in Figure 5(f), within the parameter variation range of the turning depth, Sku > 3 μm, which indicates that the machined surface topography is flat. When the turning depth is 0.1, 0.15, 0.2, and 0.25 mm, the S p is 7.117, 9.794, 8.07, and 7.912 μm, the maximum peak is 9.794 μm, the minimum peak is 7.117 μm, and the S v is 7.228, 5.279, 11.793, and 8.912 μm, the maximum pit depth is 11.793 μm, and the minimum pit depth is 5.279 μm.
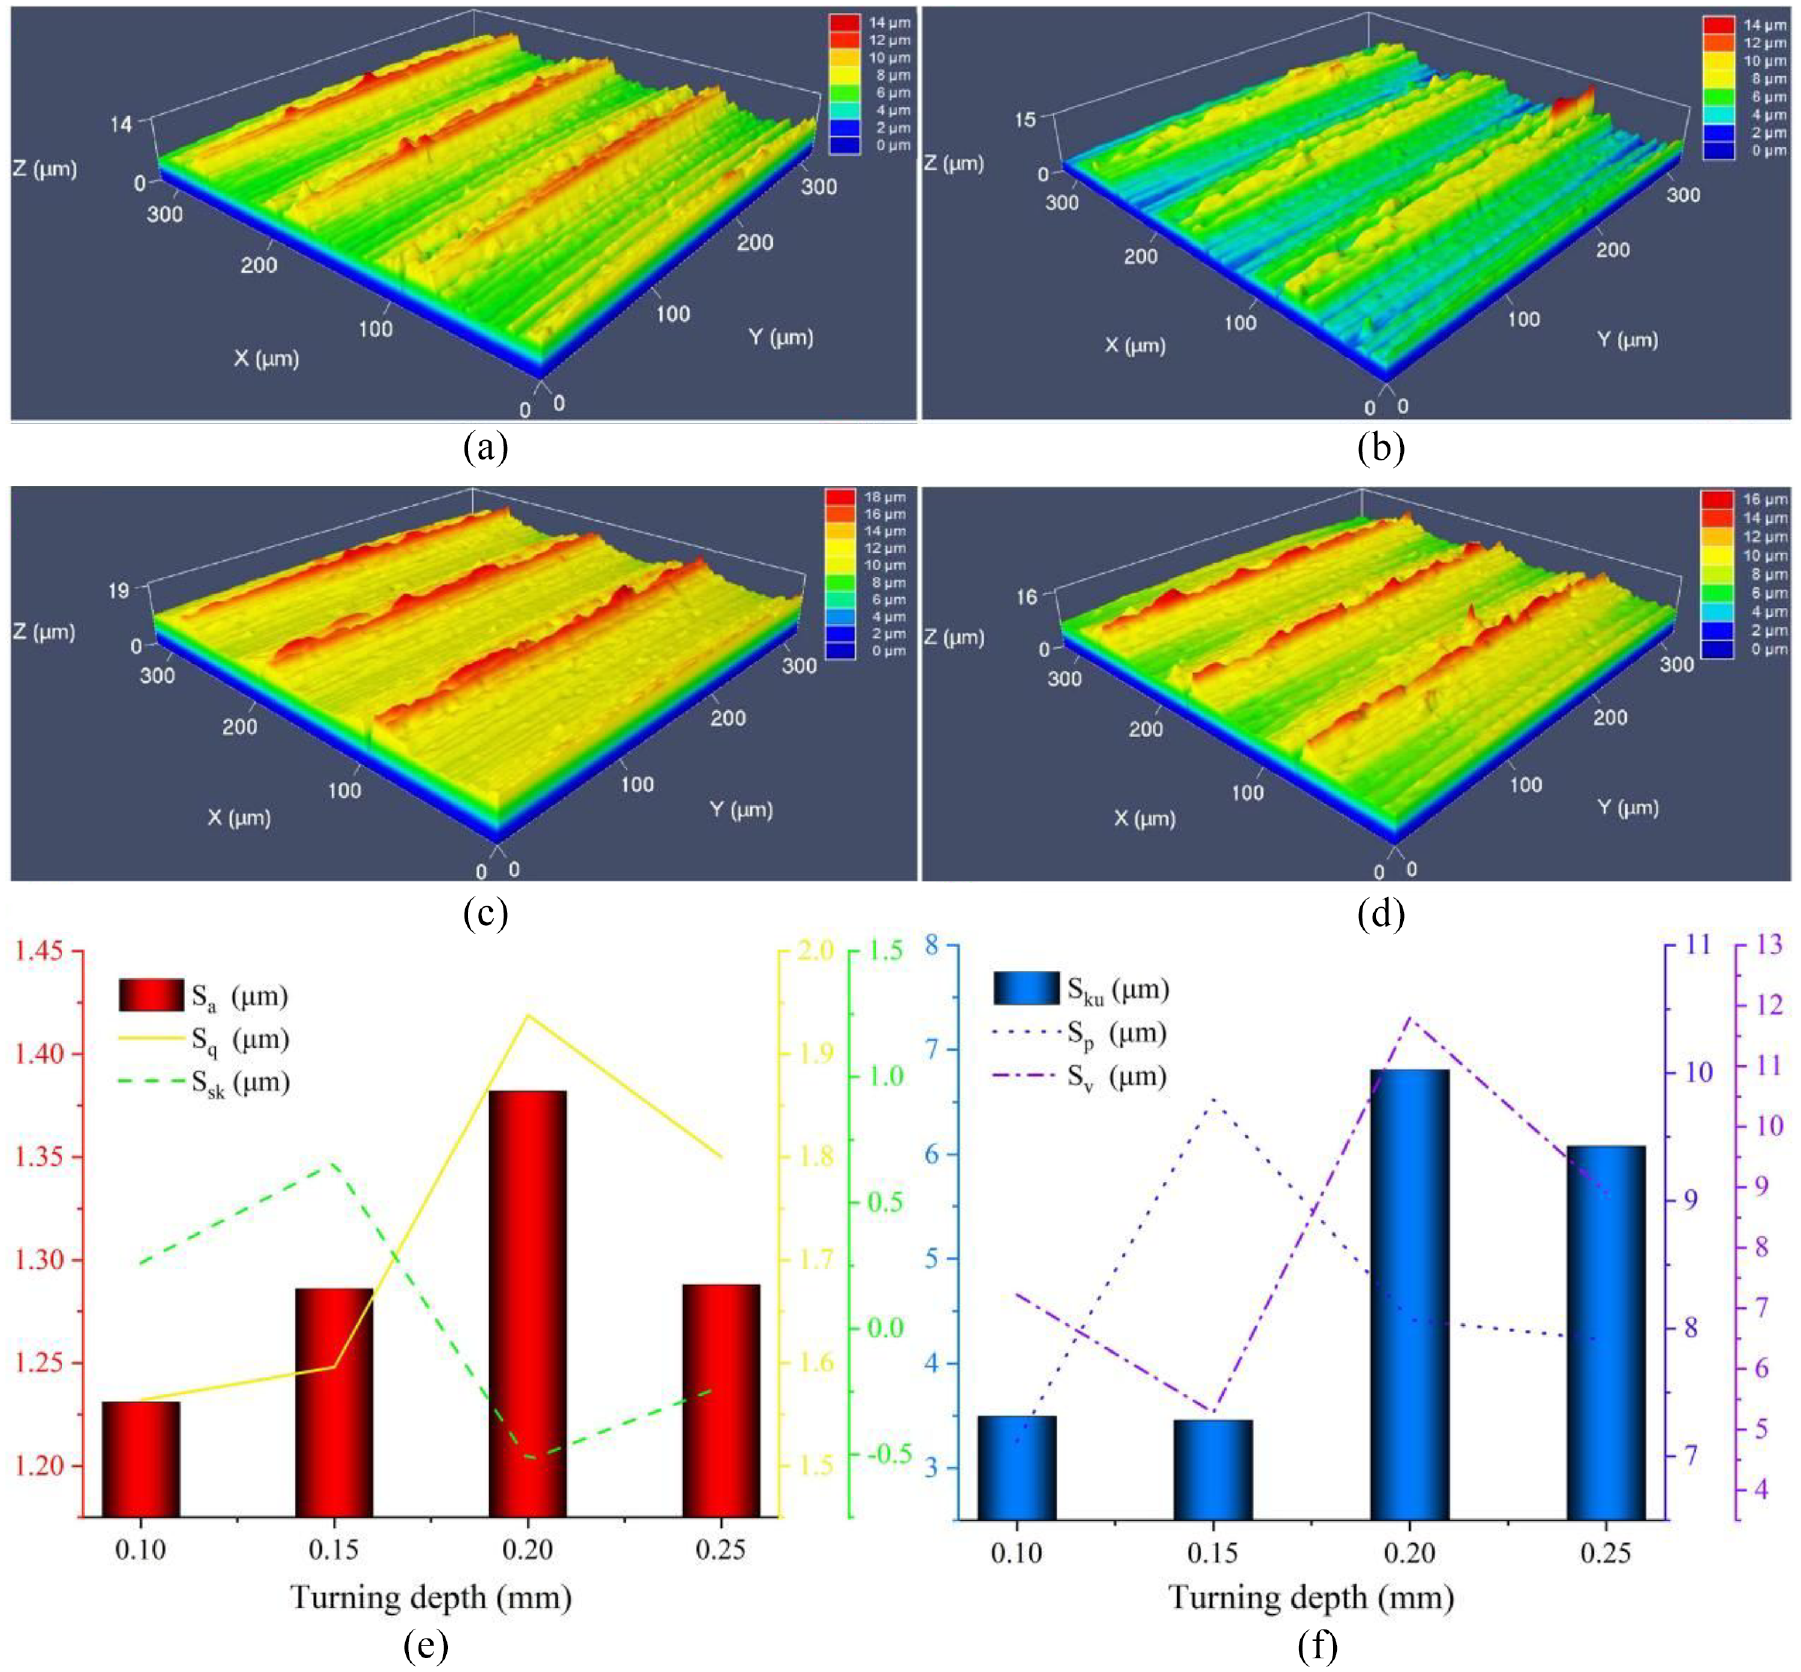
Effect of turning depth on surface topography (turning speed is 120 m/min, turning feed is 0.1 mm/r): (a) machined surface topography corresponding to turning depth of 0.1 mm, (b) machined surface topography with turning depth of 0.15 mm,(c) machined surface topography with turning depth of 0.2 mm, (d) machined surface topography with turning depth of 0.25 mm,(e) effect of turning depth on Sa, Sq, and Ssk, and (f) effect of turning depth on Sku, Sp, and Sv.
Surface topography analysis based on BBD
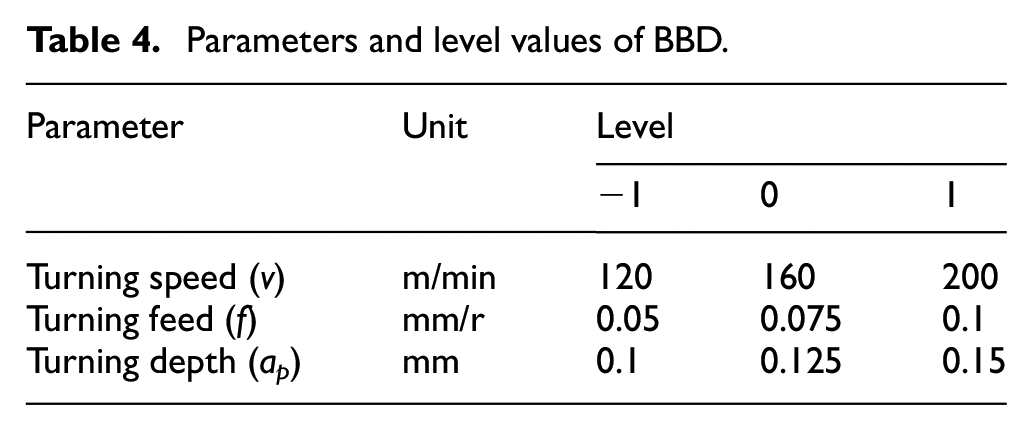
The parameter levels of BBD should be determined according to the single factor test of turning parameters on S a , that is, the climbing performance of parameter levels. By comparing the influence trend of turning parameters on S a , it is determined that the values of low level (−1) and high level (1) of turning speed are 120 and 200 m/min respectively, the values of low level (−1) and high level (1) of turning feed are 0.05 and 0.1 mm respectively, and the values of low level (−1) and high level (1) of turning depth are 0.1 and 0.15 mm respectively. The specific level values of parameters of BBD are shown in Table 4.
Parameters and level values of BBD.
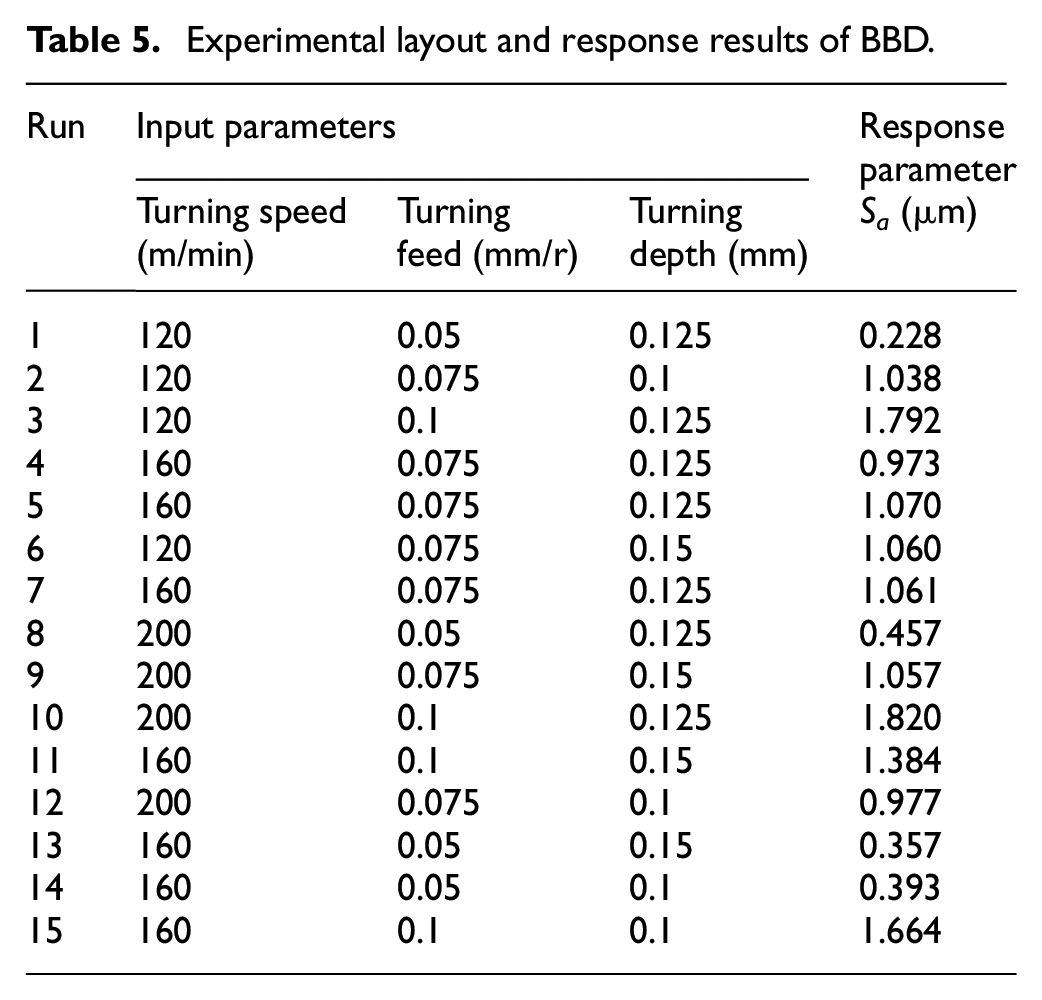
The experimental layout and response results of BBD are shown in Table 5. The ANOVA test at the 95% confidence level is used to analyze the significance of the effect of turning parameters on the response results. The ANOVA of the three dimensional surface roughness ( S a ) is shown in Table 6, which also includes the contribution of each parameter and their interaction (PC%). p = 0.0018 < 0.05 of the ANOVA model, so it is considered that the obtained model has statistical significance. The significant influencing factor of S a is turning feed, while turning speed and turning depth have no significant effect on S a . In addition, ANOVA shows that the interaction of turning parameters has no significant effect on surface roughness S a . Rao et al. 40 also found that the interaction of turning speed, turning feed, and turning depth had no significant effect on surface roughness when hard turning AISI 1050 steel. The turning feed is the most significant input parameter, which contributes about 95.5% to the model. In the hard turning of AISI H11 steel, Dureja et al. 41 also found that the turning feed has the highest significant impact on the surface roughness, while the cutting speed and cutting depth have no significant impact on the surface roughness.
Experimental layout and response results of BBD.
Analysis of variance for Sa.
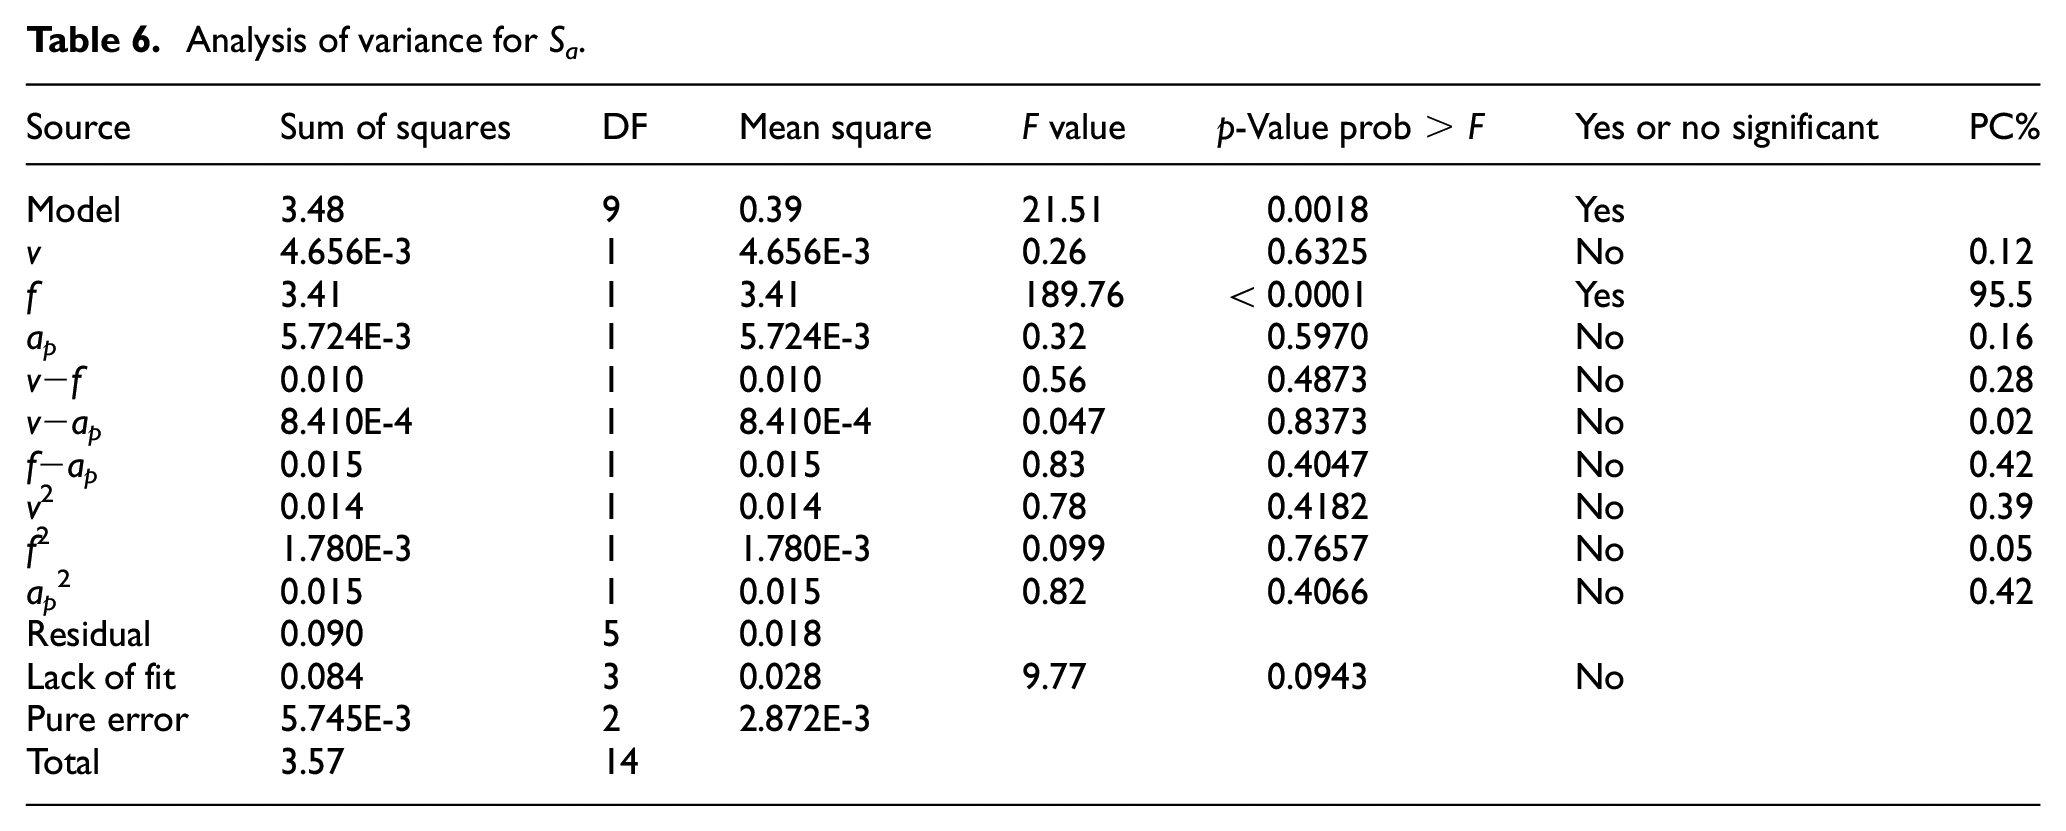
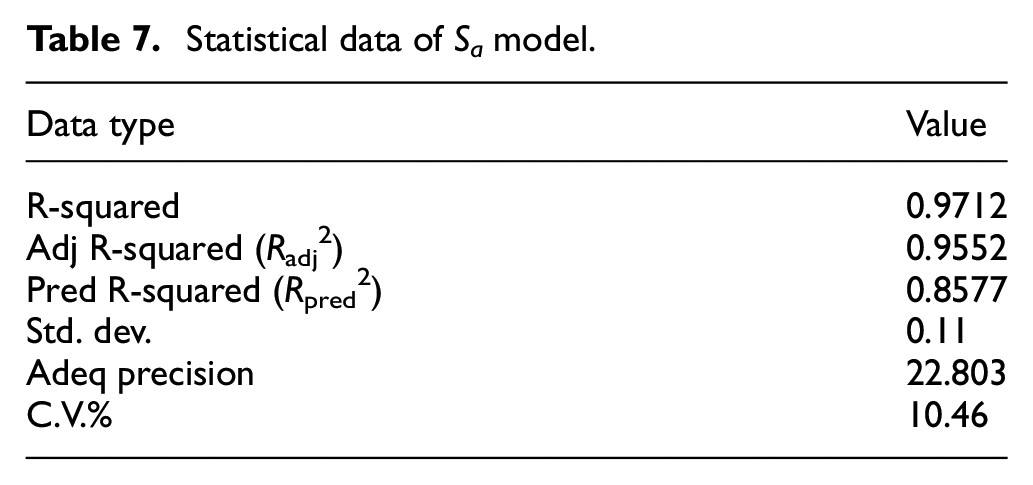
It can be seen from Table 6 that the p value of “lack of fit” is 0.0943 > 0.05. This indicates that “lack of fit” is not significant, that is, the model does not have a lack of fit factor. Therefore, the model is statistically significant. The relationship between turning speed, turning feed, turning depth and surface topography ( S a ) is modeled by quadratic regression equation, as shown in equation (7). Too many insignificant factors in the mathematical statistical model can reduce Radj2 and increase the dispersion of data. 42 Therefore, the model does not consider the insignificant factors v, f, ap, and f2. The statistical data of S a model is shown in Table 7. The correlation coefficient R2 of the model is 97.12%, and the adjusted correlation coefficient Radj2 is 95.52%, which shows that the goodness of fit of the model is good. The predicted correlation coefficient Rpred2 of the model is reasonably consistent with the adjusted correlation coefficient Radj2, which further verifies the suitability of the developed model. “Std. Dev.” is the standard deviation of the model, and its value of 0.11 means that the dispersion of the model data is smaller. “Adeq Precision” is the signal to noise ratio of the data. A signal to noise ratio greater than 4 is ideal. A value of 22.803 indicates that the signal is sufficient. The coefficient of variation (C.V.%) of the model, defined as (standard deviation/mean) × 100%, is the measurement of error. The C.V.% of the model is 10.46%, which shows that the accuracy and reliability of the experiment are good. To sum up, this model can be used to explore the preliminary analysis and prediction of the influence of cutting parameters on surface topography.
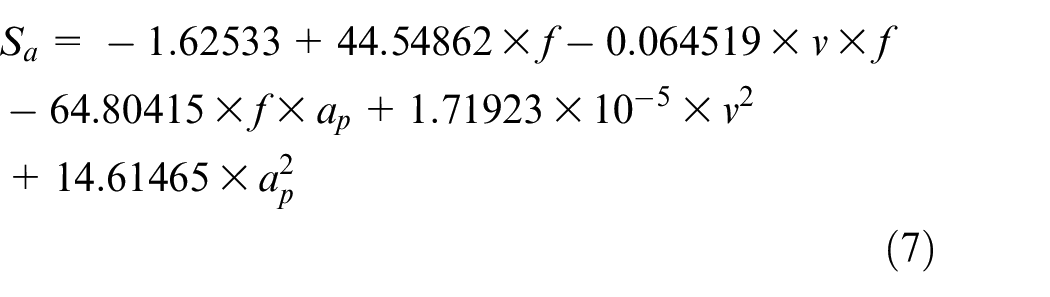
Figure 6(a) shows the comparison between the experimental value S a under different processing parameter combinations reported in Table 5 and the predicted value S a calculated by regression equation (7). It can be observed that the experimental value and the predicted value have good consistency. The sufficiency, normality and independence of the model are diagnosed based on residual analysis. The residual analysis of the response S a is shown in Figure 6(b–d). It can be found from Figure 6(b) that the residuals are closely around the straight line, and they are approximately distributed in a straight line. This shows that the residuals obey normal distribution, and there are good correlation between the experimental values and the predicted values. The residuals versus experimental run analysis of S a is shown in Figure 6(c), and it can be inferred that the experimental run do not follow any residual pattern. Figure 6(d) shows the analysis results of the residuals and predictions of S a . It can be found that the residuals are randomly scattered, indicating that they are independent. Figure 6(e) and (f) show the response surface of the influence of turning parameters on three-dimensional surface roughness S a . Figure 6(e) shows the estimated response surface of S a under the interaction of turning speed and turning feed, and turning depth is 0.125 mm. The ANOVA results in Table 6 show that the interaction between turning speed and turning feed is not statistically significant, and their contribution to surface topography is 0.28%. The cutting speed has a slight significant effect on the observed roughness, while the turning feed has a significant effect on the roughness. Medium turning speed and low turning feed can obtain excellent surface topography. Figure 6(f) shows the estimated response surface of S a under the interaction of turning feed and turning depth, and turning speed is 160 m/min. The ANOVA results in Table 6 show that the interaction between turning feed and turning depth is not statistically significant, and their contribution to surface topography is 0.42%. S a increases with the increase of turning feed, but its increase amplitude changes slightly with the increase of turning depth.
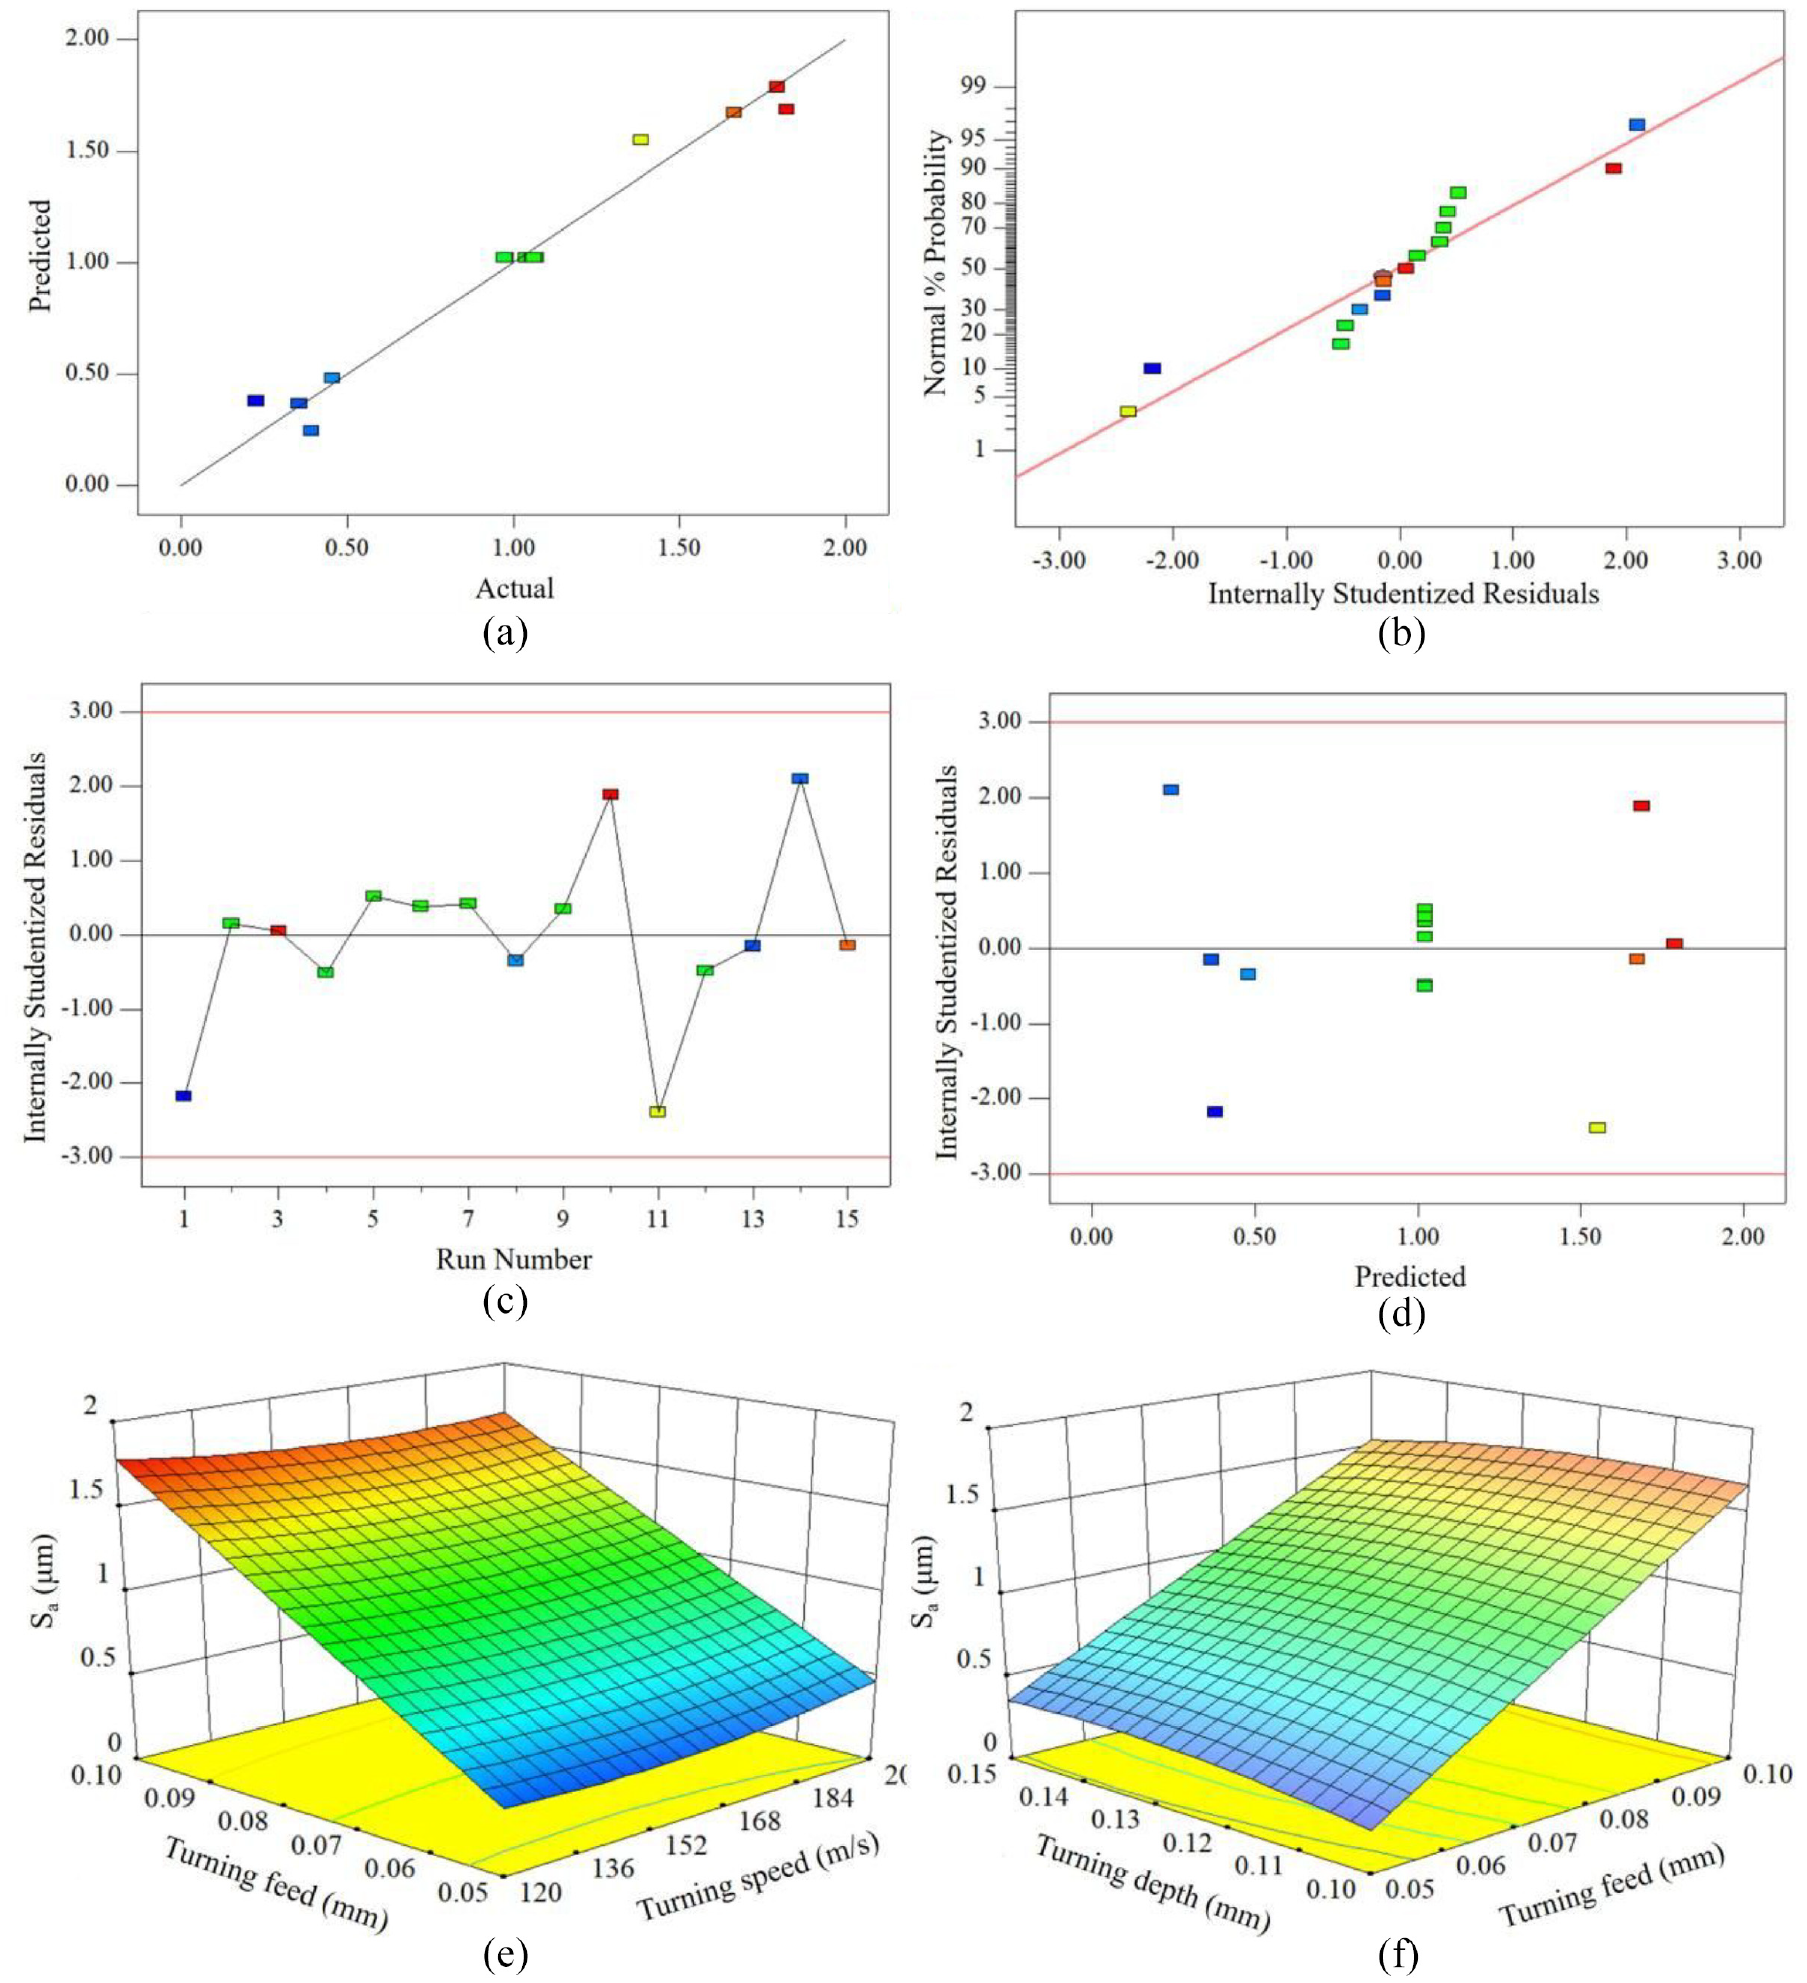
Response analysis of experimental results of BBD: (a) analysis and comparison diagram of experimental value and predicted value of Sa, (b) normal plot of residuals for Sa, (c) residuals versus run for Sa, (d) residuals versus predicted for Sa,(e) effect of turning speed and turning feed on Sa, and (f) effect of turning depth and turning feed on Sa.
Statistical data of Sa model.
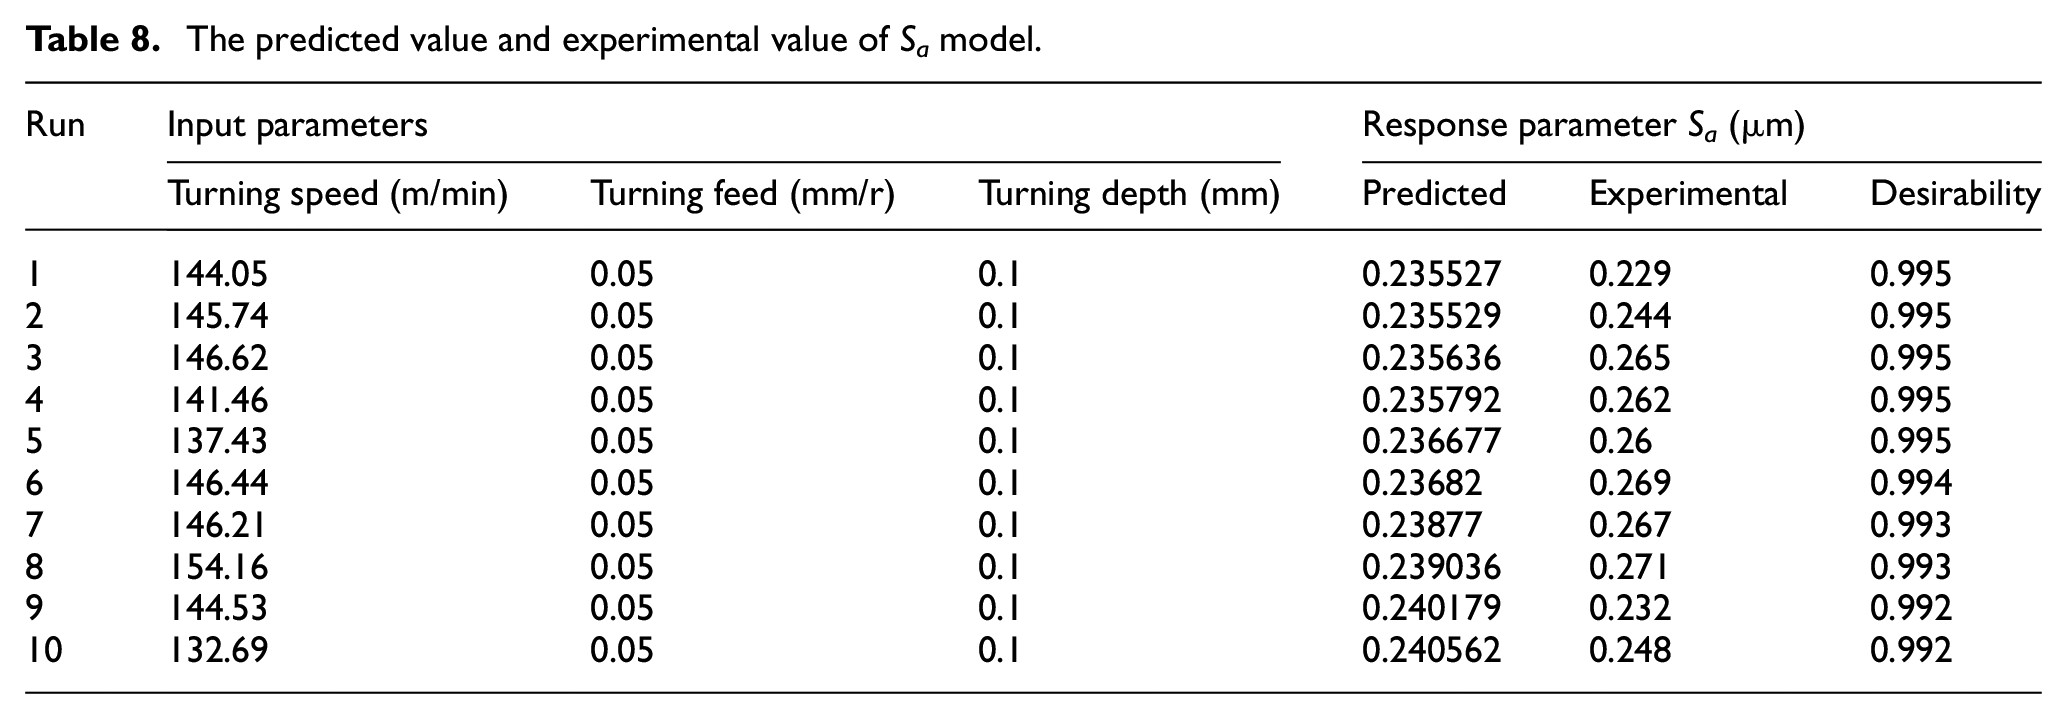
Ten groups of turning parameters are selected according to the decreasing order of Desirability of S a predicted value, and hard turning experiments are carried out to obtain the predicted value and experimental value of S a model as shown in Table 8. The objective of optimization is to obtain the minimum surface roughness. The optimal value of surface roughness S a is 0.235527 μm. The optimal turning parameters are: cutting speed is 144.05 m/min, turning feed is 0.05 mm/r, and turning depth is 0.1 mm. Under the optimal turning parameters, the experimental value of the minimum surface roughness S a is 0.229 μm. Comparing the results in Table 8, it is found that the predicted value of surface roughness S a is very close to the experimental value. Figure 7 shows the error between the predicted value and the experimental value of S a . It can be found from Figure 7 that the error under the optimal turning parameters is 2.85%, and the error under other turning parameters is less than 12%, which indicates that all experimental values are within the prediction level of 88%, which clearly proves the accuracy of the S a model.
The predicted value and experimental value of Sa model.
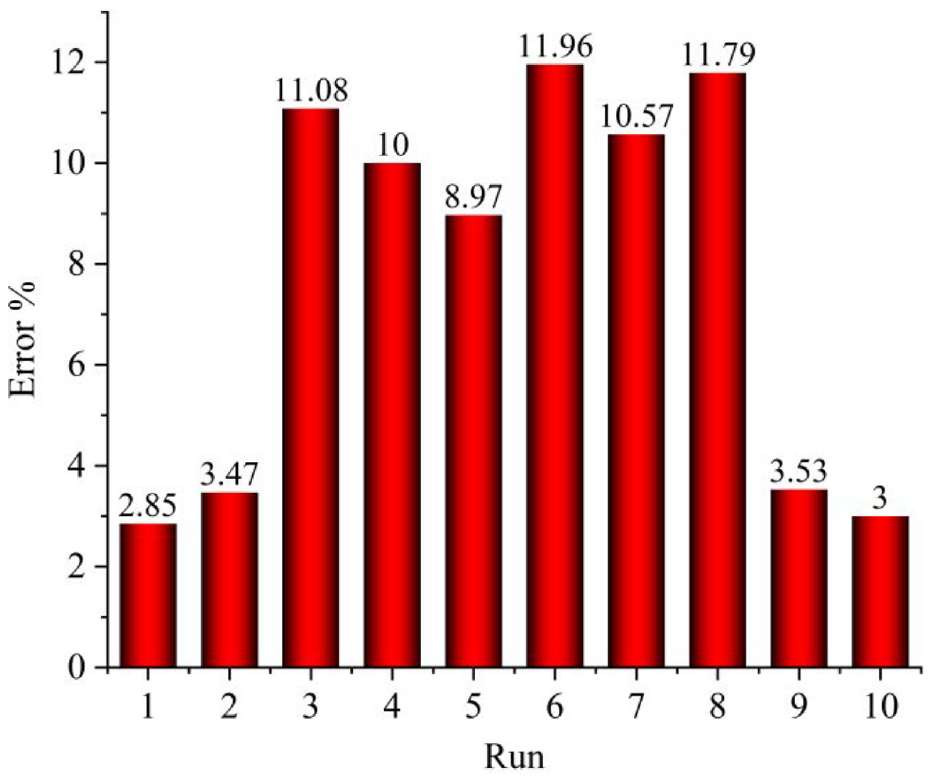
The error between the predicted value and the experimental value of Sa.
Conclusions
In order to investigate the effect of turning parameters of hard turning AISI M2 on the machined surface topography. Based on single factor experiment, BBD and ANOVA, this research aims to evaluate the mapping relationship between turning parameters and three dimensional surface roughness parameters, explore the micro defect characteristics of the machined surface, and analyze the significant influence of turning parameters on three dimensional surface roughness ( S a ). Valuable conclusions are as follows:
There are various types of defects on the machined surface along the turning feed direction. These defects mainly include: turning grooves formed by cutting edges and broken hard particles; Material side flow formed by severe plastic deformation of the machined surface; Adhered material particals formed by broken chips sticking to the machined surface under the action of cutting heat; Tearing of the material by the tool.
Although the effect of turning parameters on S a , S q , Ssk, Sku, S p , and S v is not very regular, the surface topography of hard turning has good consistency. The machined surface topography presents significantly different topographical characteristics with the change of turning feed, while the surface topography changes little with the changes of turning speed and turning depth.
It is obvious from the ANOVA that the most significant factor affecting the three dimensional roughness ( S a ) is the turning feed, which contributes about 95.5% to S a . Turning depth and turning speed have no significant effect on three dimensional roughness ( S a ), and the interaction of turning parameters has no significant effect on S a . The quadratic regression model of S a is established by RSM. The correlation coefficient of the model R2 = 97.48%, and the adjusted correlation coefficient Radj2 = 95.52%.
Footnotes
Declaration of conflicting interests
The author(s) declared no potential conflicts of interest with respect to the research, authorship, and/or publication of this article.
Funding
The author(s) disclosed receipt of the following financial support for the research, authorship, and/or publication of this article: The authors would like to acknowledge the financial support from the Department of Science and Technology of Jilin Provincial of China (20200401133GX).