
Abstract
A scientific understanding of all the factors affecting machinability and machining is essential for tool selection and process planning, particularly in Computer Numerical Control (CNC) machining of difficult-to-cut materials. This article proposed a radar chart–based method to assess material machinability by taking into account of multiple process variables quantitatively and to reveal comparison indexes visually. Key steps of this method included the reference material and indexes selection, normalization process and machinability assessment. Finally, a case study on using this method was given to assess three different types of titanium alloys. The order of machinability from good to poor is TC4, TC11 and TC17 supported with quantitative analysis.
Introduction
Difficult-to-cut materials are widely used in engineering industries such as aerospace, aeronautics, automotive, energy and dies and molds manufacturing. Generally, difficult-to-cut materials are regarded as materials with poor machinability. These materials may have properties of high-temperature strength, high hardness, work hardening, low thermal conductivity and high brittleness. Typical difficult-to-cut materials contain super alloys, 1 titanium alloys, Inconel, metal matrix composites and so on. The scientific understanding of material machinability is fundamental and essential for proper selection of cutting tools, process planning and thus high-quality machining.
There has been growing interest in the assessment methods of material machinability. The term “machinability” is a relative measure of how easily a material can be machined when compared to 160 Brinell AISI B1112 free machining low-carbon steel. The American Iron and Steel Institute (AISI) ran turning tests of this material at 180 surface feet and compared their results for B1112 against several other materials. If B1112 represents a 100% rating, then materials with a rating less than this level would be decidedly more difficult to machine, while those that exceed 100% would be easier to machine. 2 ISO 3685:1993, ISO 8688-1:1989 and ISO 8688-2:1989 focus on tool life testing in single point turning, face milling and end milling rather than machinability of different materials.
This tool life–based method is relatively easy to operate but also has many limits, especially in difficult-to-cut material assessment. First, only one machinability index cannot provide sufficient information before, during and after machining, as shown in Figure 1. Second, it is not reasonable for all materials with same cutting tool as turning AISI B1112, particularly among different types of materials. Finally, in practical metal cutting, there are different operations such as milling, boring and drilling applied obviously different from turning.
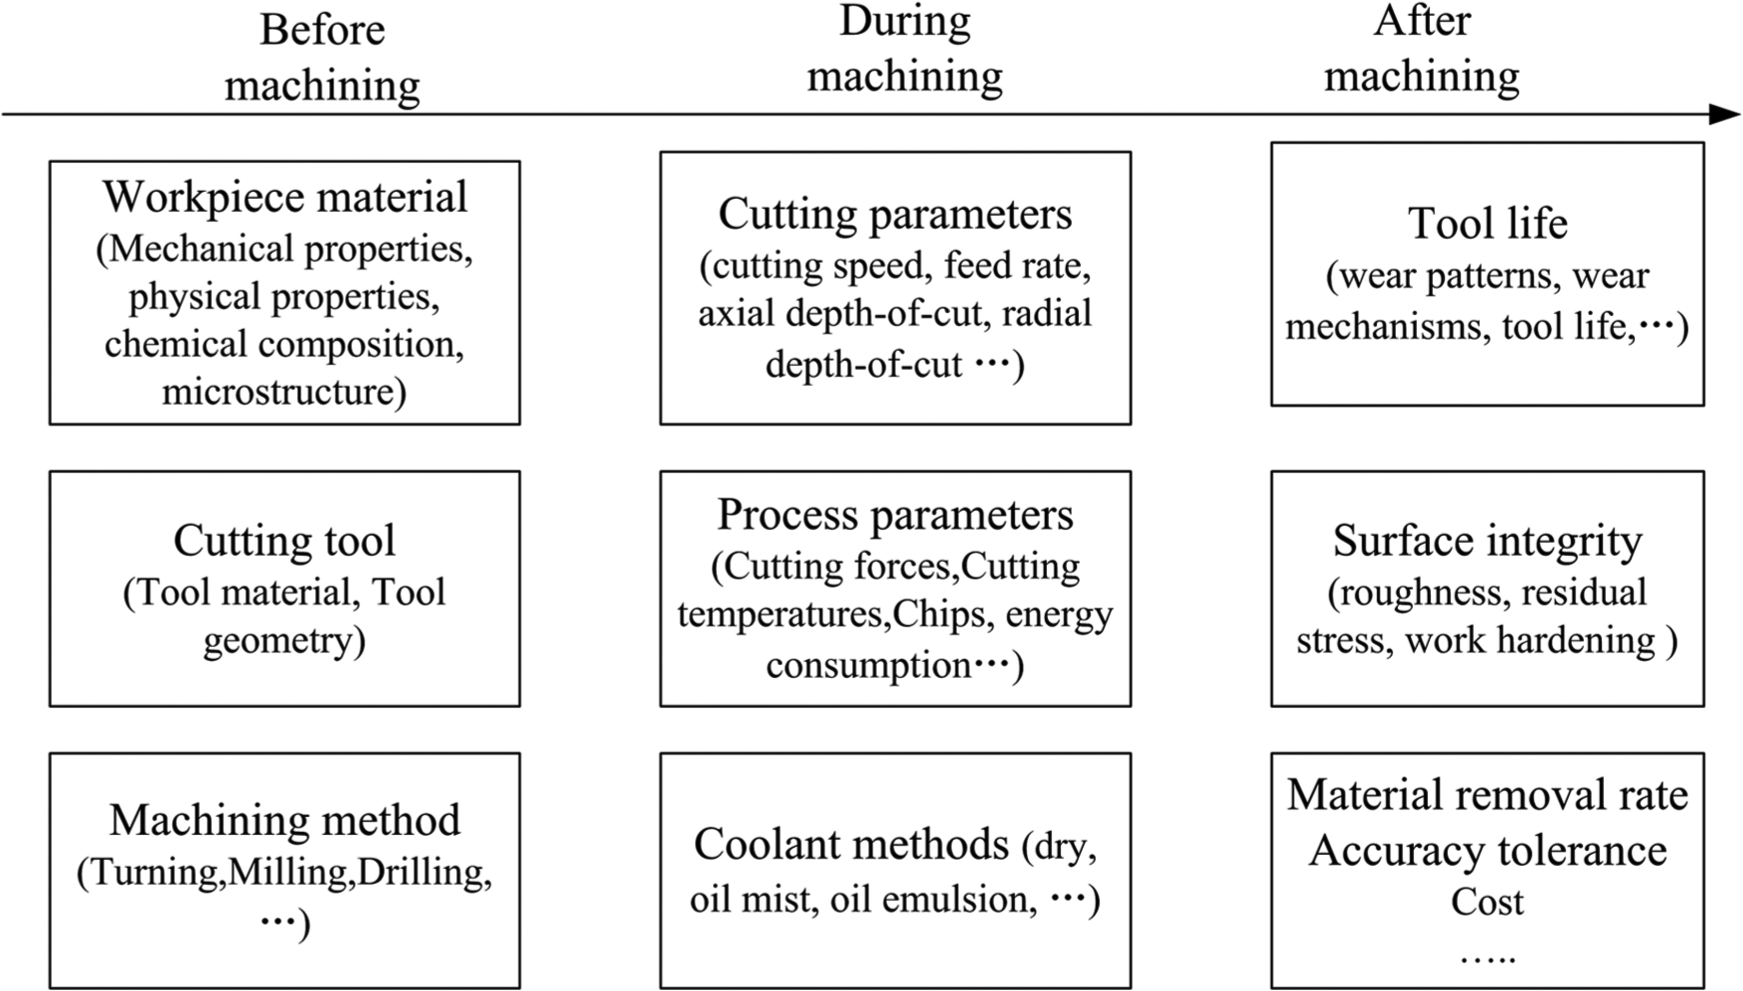
Factors in machinability assessment.
George Schneider 2 reported that condition and physical properties of the work material had direct influence on the machinability, while operating conditions, tooling material and geometry, and the workpiece requirements exercised indirect effects on machinability. Therefore, those factors or variables should be considered when a type of material is evaluated. It was also pointed by many researchers that material microstructure, 3 process parameters,4,5 chip formation, 6 surface finish, 7 tool wear patterns and wear mechanisms should be considered in machinability assessment.
Therefore, an industrial-feasible robust method is essential and much needed so as to assess the material machinability quantitatively, comprehensively and perceptibly. This article presents a radar chart–based assessment method on material machinability supported with a comprehensive case study and in-depth analysis. The research presented aims to fill the knowledge gap as identified and provide a robust quantitative means for material machinability assessment.
Machinability assessment based on the radar chart
Radar chart analysis
Radar chart, also known as spider chart, is a graphical method of displaying multivariate data in the form of a two-dimensional chart of three or more quantitative variables represented on axes starting from the same point. Relative position and angle of the axes in radar chart provides the deviation degree of the actual value and the reference value of each index. The advantages of this method are (1) multiple variables are considered, (2) most factors are assessed quantitatively and (3) it is easy to be applied.
There are several key steps to draw a radar chart, which are reference material selection, normalization and radar chart analysis. In radar chart, there are two kinds of value to be established. One is positive value, such as thermal conductivity, elongation ratio and tool life. The larger the positive value, the better the machinability. The other is negative value, such as hardness, strength, toughness, cutting force, cutting temperature and roughness. The larger the negative value, the poorer the machinability. As illustrated in Figure 2, material A has larger negative values and smaller positive values, while material B is opposite to material A. Therefore, the machinability order of from poor to good is A, reference material and B. The reasons that result in poor machinability are also clearly shown. For example, larger hardness and strength result in larger cutting force and shorter tool life. Sometimes, the area that enclosed with positive values or negative values can also be used to evaluate machinability.
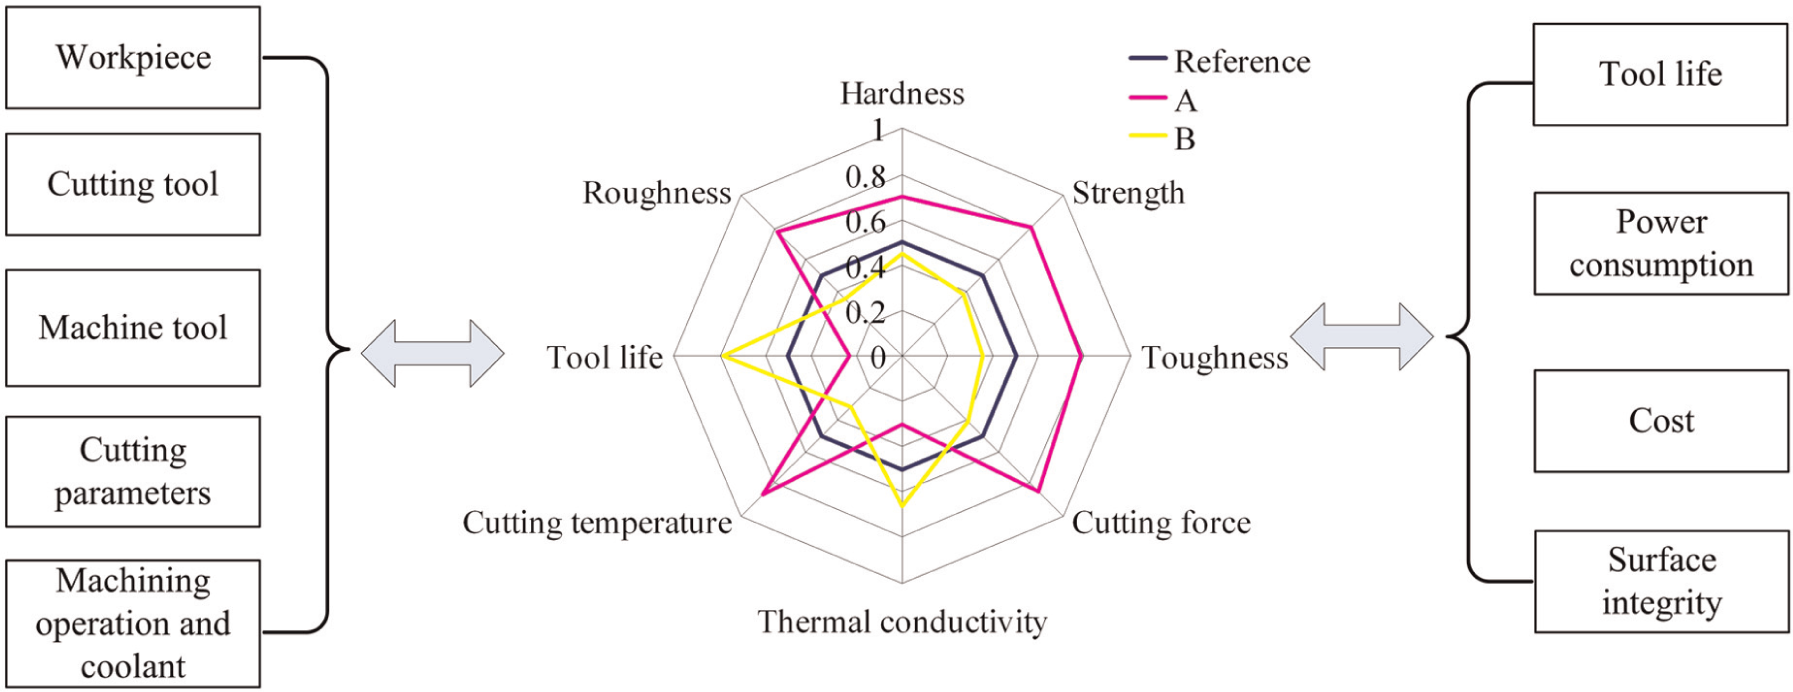
Semantic illustration of the radar chart and material machinability assessment.
Reference material selection
Reference material should be selected by its wide application and well-known properties in a certain category. For instance, in nickel-based super alloy classification, Inconel 718 is widely used in aero engine manufacturing. Operators in workshop are familiar with this material, and it is more convenient for them to compare other nickel-based alloy with Inconel 718 than with AISI B1112 carbon steel.
Normalization process
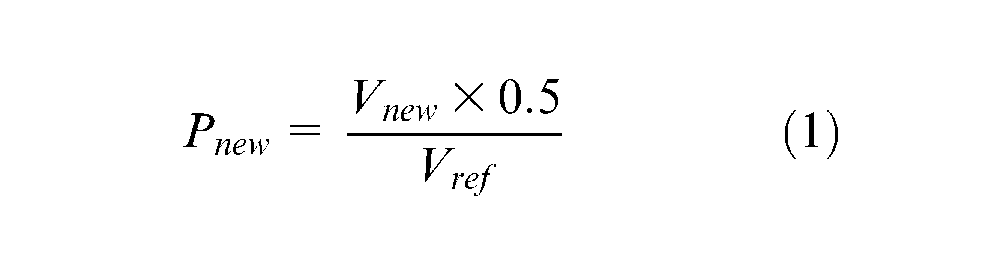
The radar chart usually consists of a set of axes and several concentric circles. Each axis represents an indicator or variable. In Figure 2, the variables of reference material are set as standard levels and variables of other materials are compared with them. Except variables, machining conditions, such as cutting tool material, tool geometry, cutting parameters, coolant method and machine tool, should be stated. In practice, the ratio of actual value to reference is used to draw radar chart and is analyzed according to their positions in the chart. The standard value of reference is usually set as 0.5. The ratio can be calculated according to the following equation
Case study
Experimental cutting trial setup
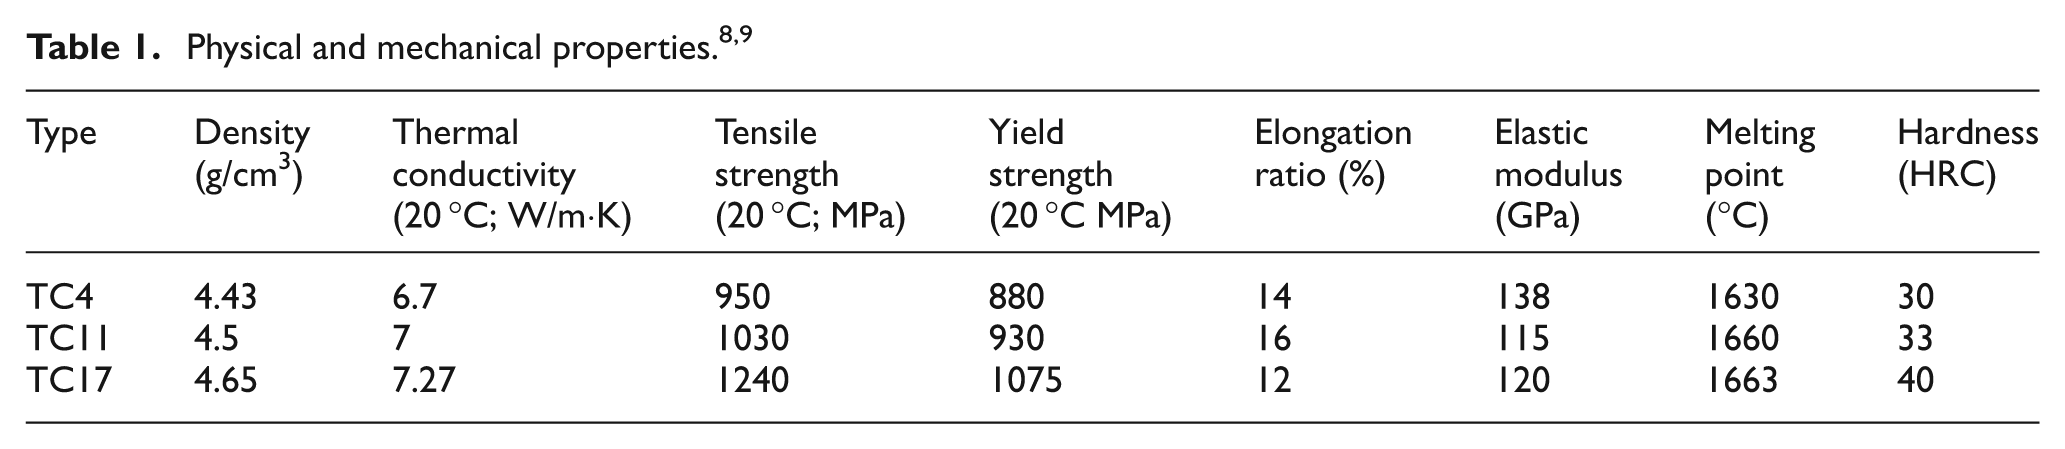
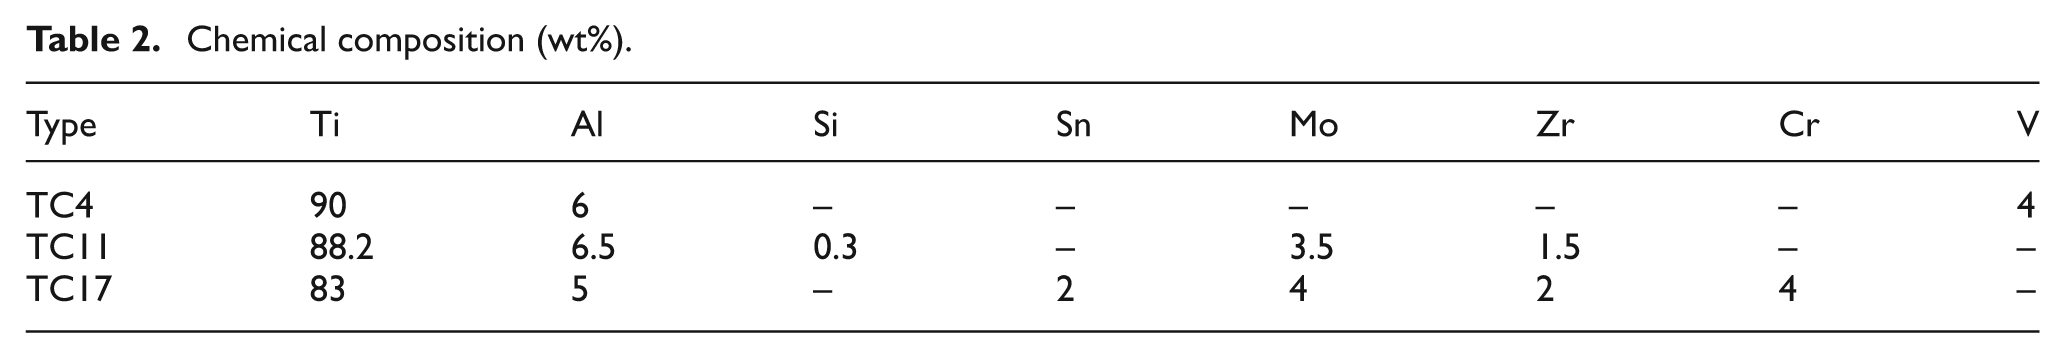
Titanium alloys are studied experimentally and their machinability are compared in radar charts. Wrought TC4 (Ti-6Al-4V) is a widely used material in aero engine, which is regarded as reference material. Two other titanium alloys are wrought TC11 (Ti-6.5Al-3.5Mo-1.5Zr-0.3Si, also Ti-11) and TC17 (Ti-5Al-2Sn-2Zr-4Mo-4Cr, also Ti-17), which belong to the same subcategory (α+β titanium alloy) with TC4. The properties and chemical composition of them are shown in Tables 1 and 2.
Chemical composition (wt%).
Cutting trial experiments were conducted on vertical milling tool with coated carbide end milling cutter. Experimental setup and cutting parameters were shown in Figure 3. The operation was flank down milling without coolant. Cutting forces and cutting temperature were measured during milling, and cutting temperature was estimated by combining chip temperature with simulation. Tool wear and surface roughness were measured after milling.
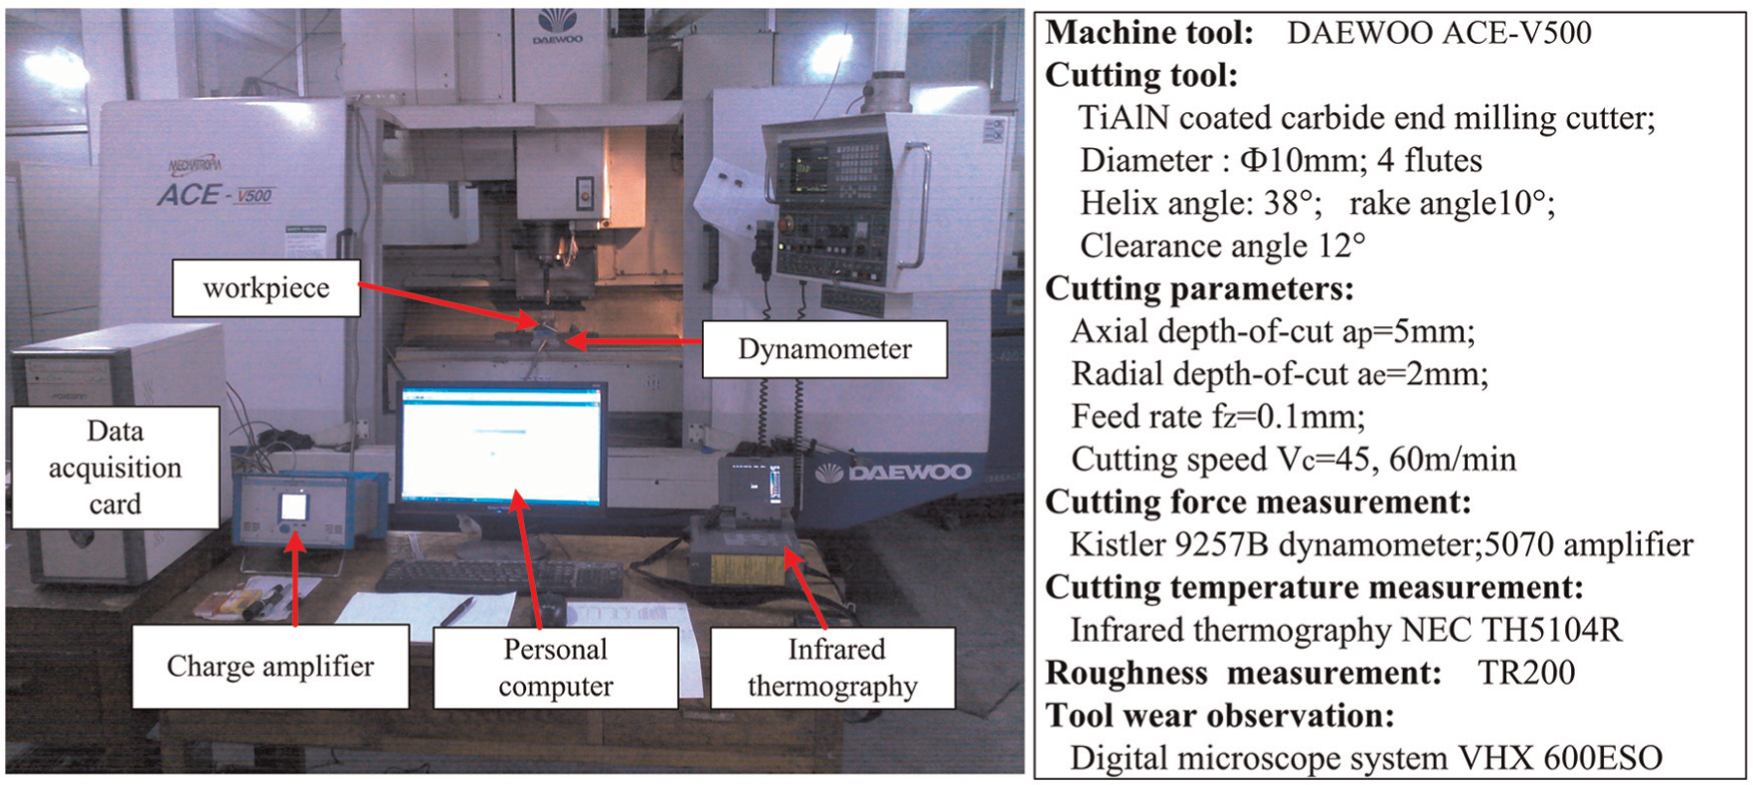
Experimental cutting trial setup.
Radar chart plotting and machinability analysis
According to the above process, radar charts were plotted, which depict physical and mechanical properties, cutting forces, cutting temperatures and cutting results. In the normalization of chemical composition of three types of titanium alloys, some chemical elements of reference material was set 0 if they do not exist, and the smaller one of the others was set 0.5.
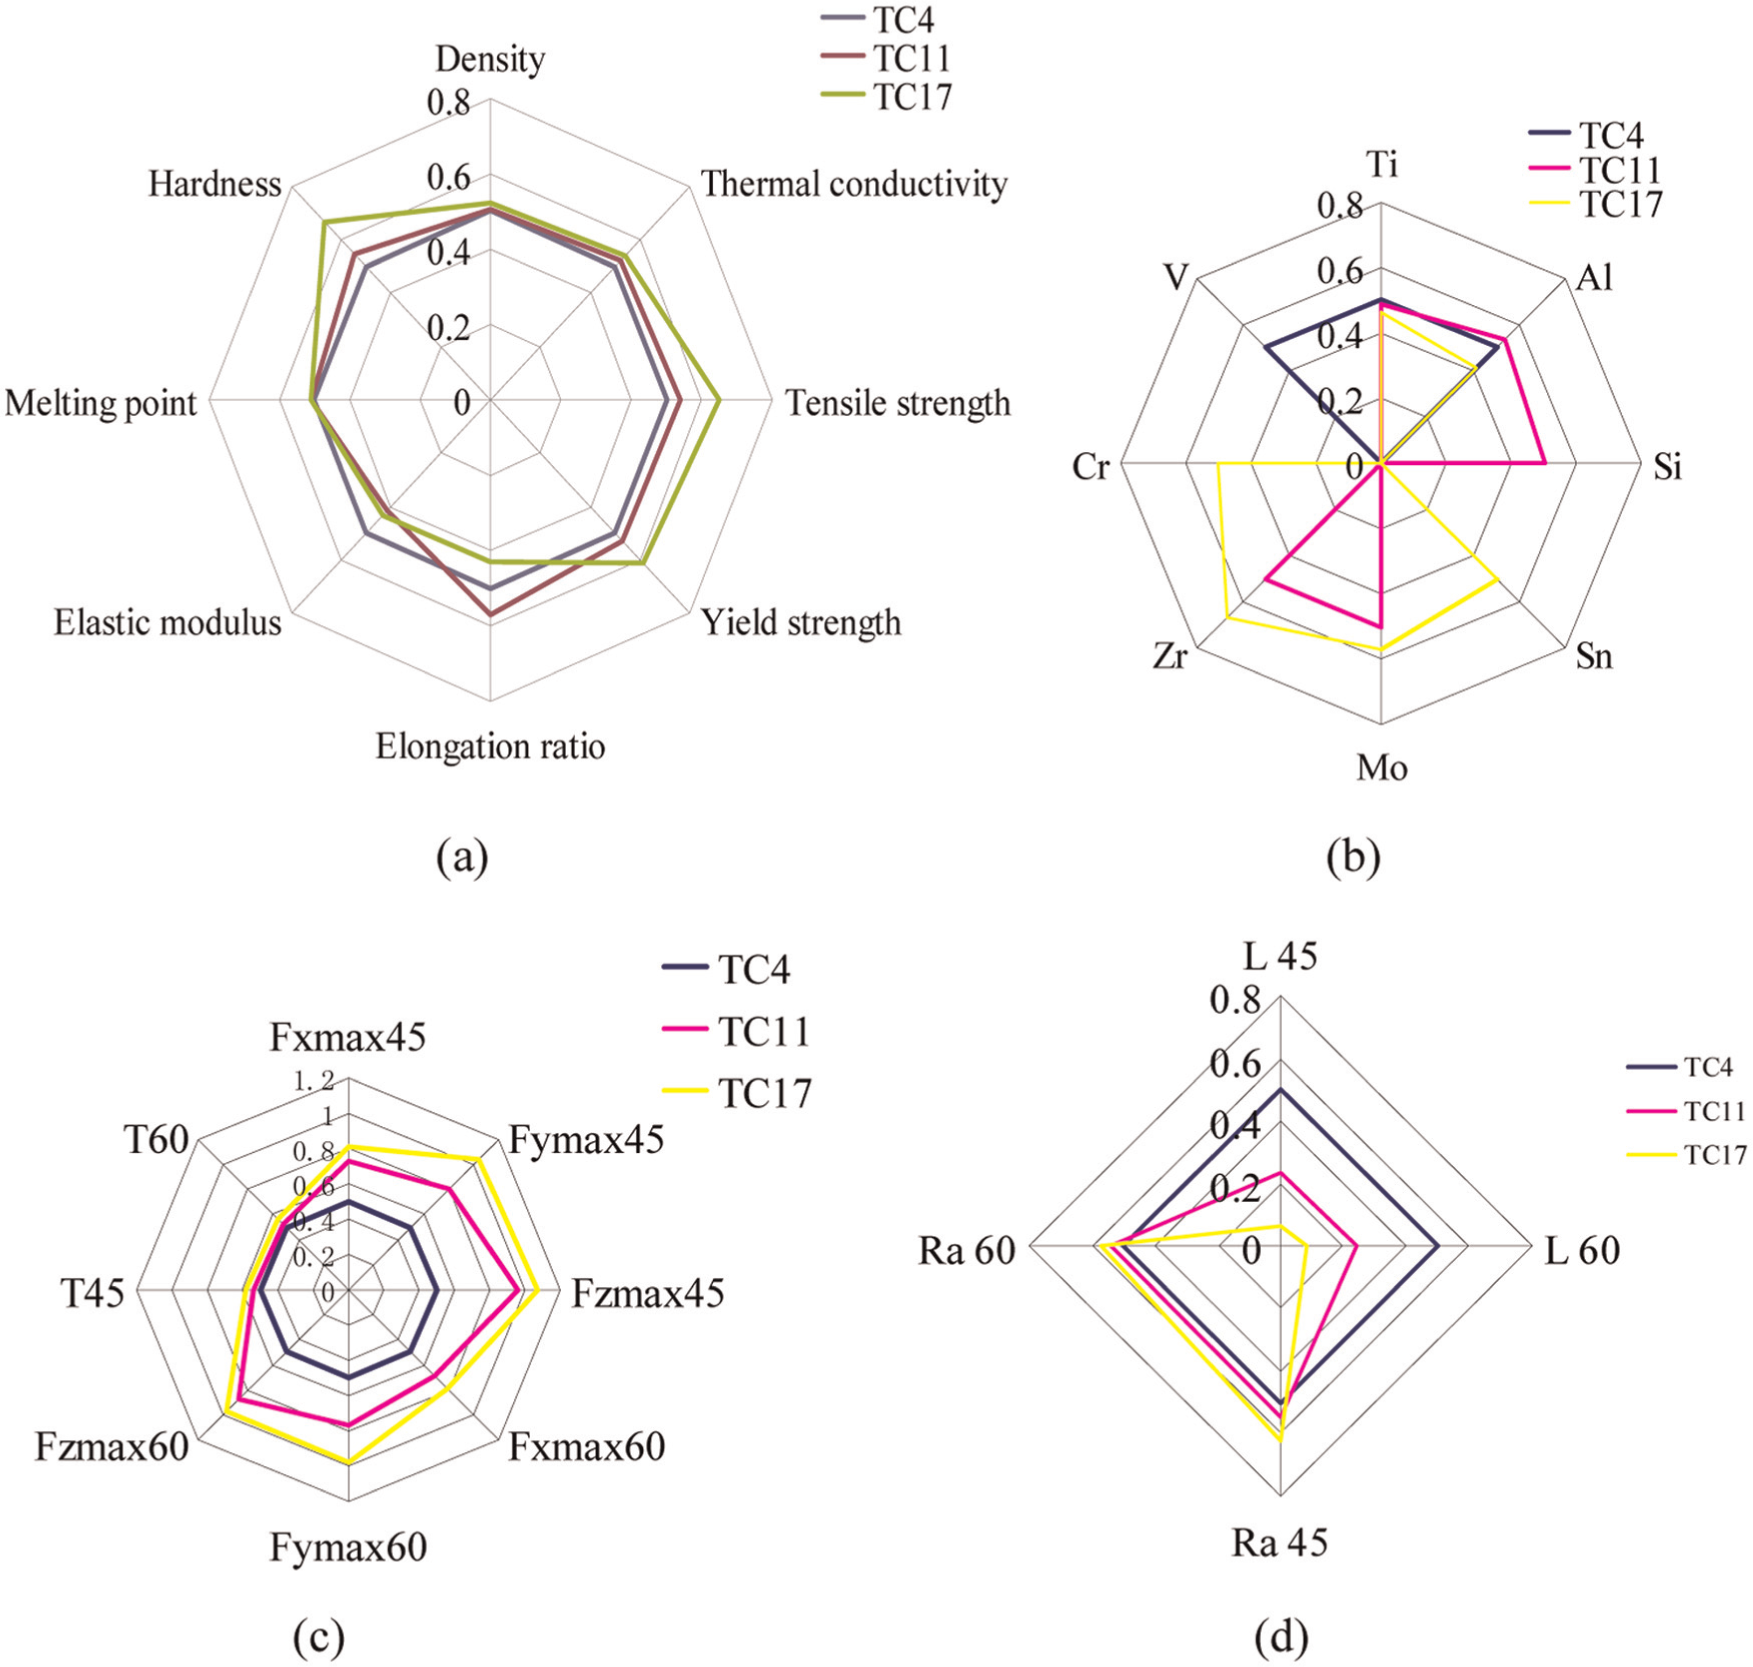
It is shown in Figure 4 that key indexes are depicted in several radar charts. Fxmax is the maximum cutting force vertical to feed direction, Fymax is the maximum cutting force along feed direction and Fzmax is the maximum cutting force along axial direction. Two numbers 45 and 60 that followed cutting forces F, cutting temperature T, roughness Ra and tool life L denote two cutting speeds 45 and 60 m/min, respectively.
Radar charts of three types of titanium alloys (TC4,TC11 and TC17)
The machinability assessments may start from material properties or in a reverse sequence in order to find tool wear reasons. Figure 4 shows that the comparison of several critical indexes such as yield strength, tensile strength and hardness is TC17 > TC11 > TC4, which affect cutting forces remarkably. The order of cutting forces is TC17 > TC11 > TC4. Similarly, the combination of thermal conductivity and strength determines cutting temperature. This means that higher strength and lower thermal conductivity lead to higher cutting temperature. The order of cutting temperature is TC17 > TC11 > TC4. Cutting forces and cutting temperature determine tool life order together, which is TC4> TC11 > TC17 here. The machinability indexes in this experimental condition are 1:0.47:0.12 (TC4:TC11:TC17) when cutting speed is 45 m/min, while 1:0.48:0.16 (TC4:TC11:TC17) when cutting speed is 60 m/min. The different machinability indexes also prove that different conditions affect machinability greatly. Further analysis about tool wear mechanism also involves microstructure (grain size), affinity with tool, chip breaking and tool properties. Roughness comparison can also be analyzed from tool wear, work hardening and toughness.
Conclusion
This article presents an analytical assessment method on material machinability based on radar charts. Conclusions of the investigation are drawn as follows:
The radar chart–based assessment method proposed in this article provides the comprehensive, quantitative, visual and traceable abilities on material machinability assessment. Most indexes of original properties, process variables and results can be quantitatively depicted in graphs visually. It is easier to find the reasons behind the machining results.
The key steps to establish radar charts are reference material selection, indexes selection, normalization process and machinability assessment. Most indexes can be quantitatively described and some other phenomena such as microstructure, wear patterns and wear mechanisms can be figured with the charts.
The case study shows that the machinability order of three types of titanium alloy is TC4, TC11, and TC17, that is, from easy to difficult. The original material properties to process parameters provide sufficient data to reveal the reasons.
The proposed method should be applied particularly when a new cutting tool material or tooling geometries are introduced.
Footnotes
Acknowledgements
The authors would like to thank China Scholarships Council (CSC) for the academic visit support at Brunel University.
Declaration of conflicting interests
The authors declare that there is no conflict of interest.
Funding
This project was supported by National Natural Science Foundation of China (51175306) and Program for New Century Excellent Talents in University (NCET-11-0310).