
Abstract
In oil and gas industries, submerged arc welding is the only primarily used process to weld high thickness, large distance structural oil pipes. Welding process parameters play a significant role in determining the quality of a weld joint in submerged arc welding. In the present work, an attempt has been made to optimize the weld bead parameters: weld bead form factor, dilution, microhardness and diffusible hydrogen content for welding of structural pipe steel (API 5L X65 grade) by desirability function approach used by Derringer and Harrington. For design of experiments, response surface methodology had been used. Mathematical models for output responses had been developed in terms of welding parameters and checked for adequacy using t-test and analysis of variance (F-test). It was found that welding current was the most significant parameter controlling all the responses, and arc voltage had increasing effect on all the responses except microhardness.
Introduction
Submerged arc welding (SAW) is used due to its inherent qualities like easy control of process variables, high quality, smooth finish, prevention of atmospheric contamination of weld pool, leak proof joints and ease of automation in welding of pipes.1–3 The material of large distance structural oil pipes should have good mechanical properties and excellent weldabilty ensuring crack-free strong joints. In SAW, process parameters play a significant role in determining the quality of a weld. So for such applications, optimum welding process parameters must be selected providing optimum weld properties. 4
Prasad and Dwivedi 5 investigated the effect of welding current and welding speed at high heat input on toughness, hardness and microstructures of high-strength low-alloy (HSLA) steel weld joints. The study revealed that toughness increased and hardness was seen to increase in fusion zone as well as in heat-affected zone (HAZ) with increase of welding current. Also, lower values of hardness near fusion center whereas higher values of hardness at distance away from weld center in HAZ had been observed. Gunaraj and Murugan 6 developed mathematical models for penetration, reinforcement, bead width and dilution in terms of input process parameters: voltage, speed, wire feed rate and nozzle-to-tip distance on IS 2062 steel using response surface methodology (RSM) technique.
Murugan and Gunaraj 2 studied the effect of weld parameters, namely, voltage, speed, wire feed rate and nozzle-to-tip distance penetration (P), reinforcement (R), bead width (W), penetration size factor (PSF) (W/P) and reinforcement form factor (RFF) (W/R) on IS 2062 steel. Prediction equations were developed for these parameters using RSM technique. Chandel et al. 7 suggested that in high-strength and higher toughness materials, it is very important that the lowest possible heat input should be maintained during welding. Datta et al. 8 optimized bead geometry (bead width, reinforcement, depth of penetration and depth of HAZ) using gray relational analysis. Welding parameters are determined for bead width, reinforcement and depth of HAZ with lower-the-better criterion and for depth of penetration with larger-the-better criterion.
Singh et al. 9 proposed fuzzy expert system for the optimization of weld bead geometry parameters in terms of input parameters: voltage, wire feed rate, traverse speed and stick-out. In the methodology, desirability function had been used to assign individual desirability values to responses: for bead width, reinforcement, area of reinforcement and bead volume (lower-the-better criterion) and for depth of penetration, area of penetration and dilution percentage (higher-the-better criterion).
Narang et al. 10 developed mapping technique for graphical representation of weld bead profile. The authors formed prediction equations for depth of penetration, bead height, HAZ width, bead width, bead contact angle, depth of HAZ and dilution. It was suggested that bead contact angle was an important output response among weld bead shape parameters.
From the start of development of welding techniques, hydrogen-assisted/cold cracking remains prevalent issue in almost all of the welding processes especially in higher-strength steel welds.11,12 Possible methods to reduce hydrogen-assisted cracking/diffusible hydrogen content are discussed by Jindal et al. 13 Bracarense et al. 14 measured diffusible hydrogen content in flux-cored arc welding (FCAW) of American Society for Testing and Materials (ASTM) A36 steel. It was observed that diffusible hydrogen content increased with increase in welding current.
Harwig et al. 12 in their study found the increase of diffusible hydrogen content from 2.3 to 11.6 mL with increase in current from 140 to 345 A. A correlation between atmospheric exposure/moisture content and diffusible hydrogen content had been developed by the authors. The diffusible hydrogen content increased with increasing welding current and voltage in FCAW of high-strength hull steel. 15 For determination of cracking, a root cracking parameter had been defined in terms of intensity of tensile restraint and diffusible hydrogen content in the work. Jindal et al. 16 used extreme vertices design method to study the effect of flux constituents on diffusible H2 content. It was observed during the study that CaF2 was the most important flux constituent decreasing H2 content.
It had been observed that welds having high form factor (1.5), that is, wide width and shallow depth, have maximum resistance to centerline cracking. 17 The effect of welding parameters in different welding processes had been studied by a number of authors. It may be observed from the literature that effect of welding parameters on H2 content is not considered in any work on SAW, and in most of the cases, the optimization has been performed using single-objective function except work carried by Datta et al. 8 and Singh et al. 9 However, optimization of welding parameters by selected criterion 8 may not give accurate optimal results as lower the bead width, and reinforcement will give smaller bead size, which may not be acceptable. So, in the present investigations, optimization of penetration area (Ap), weld bead form factor (width/height = 1.5), maximized dilution, minimized H2 content and VHN (215) close to that base metal have been done.
Design of experiment and experimentation
Experimental design
For design of experiment, three factor-5-level central composite design (CCD) of RSM had been used (Figure 1).
18
RSM is a collection of mathematical and statistical techniques that are useful for the modeling and analysis of problems in which a response of interest is influenced by several variables and the objective is to optimize this response. The CCD is a very efficient design for fitting the second-order model. Generally, the CCD consists of a 2k factorial runs (or fractional factorial) augmented with a group of 2k axial or star runs, which allow estimation of curvature and nc center runs. For a rotatable CCD, star runs are placed at a distance ±α, such that α = [2k, number of factorial runs]1/4 and
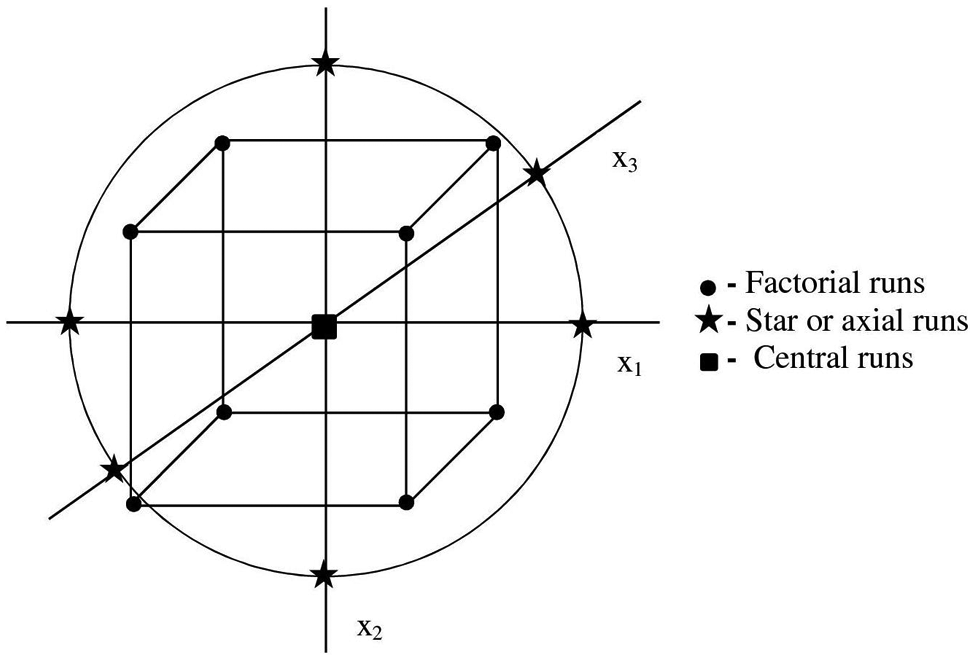
Central composite design with three factors represented graphically.
The bead parameters, form factor and dilution, diffusible hydrogen content and microhardness properties, may be optimized simultaneously using composite desirability optimization method. 19 In this method, an objective function D(x), called desirability function, is used, which transforms an estimated response into a value called desirability. Composite desirability is the weighted geometric mean of individual desirability for the responses given by equations (1) and (2). The factor settings with maximum total desirability are considered to be the optimal parameter combinations. 20 Weights may be assigned according to the importance of a response/objective in the multiobjective optimization
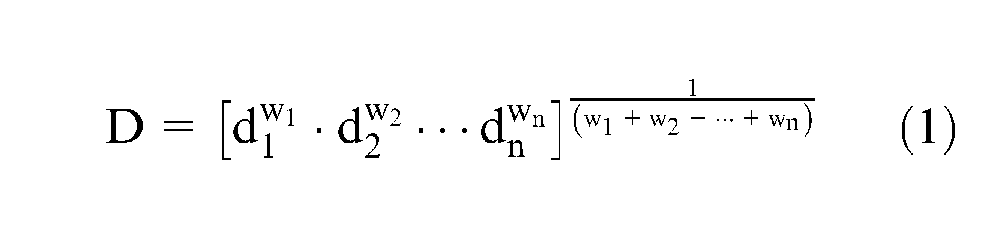
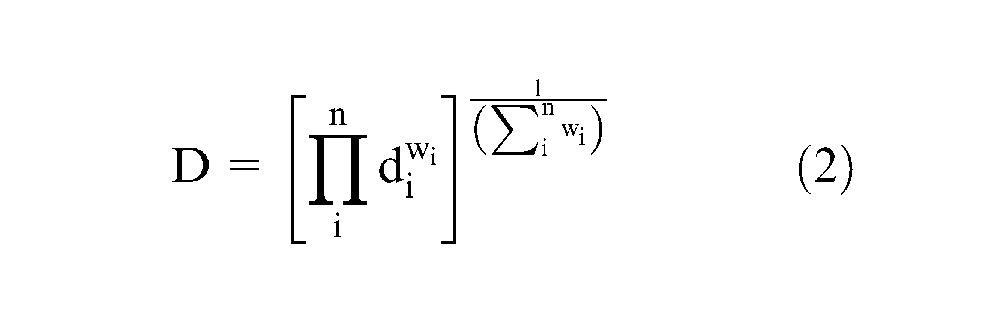
where n is number of responses,
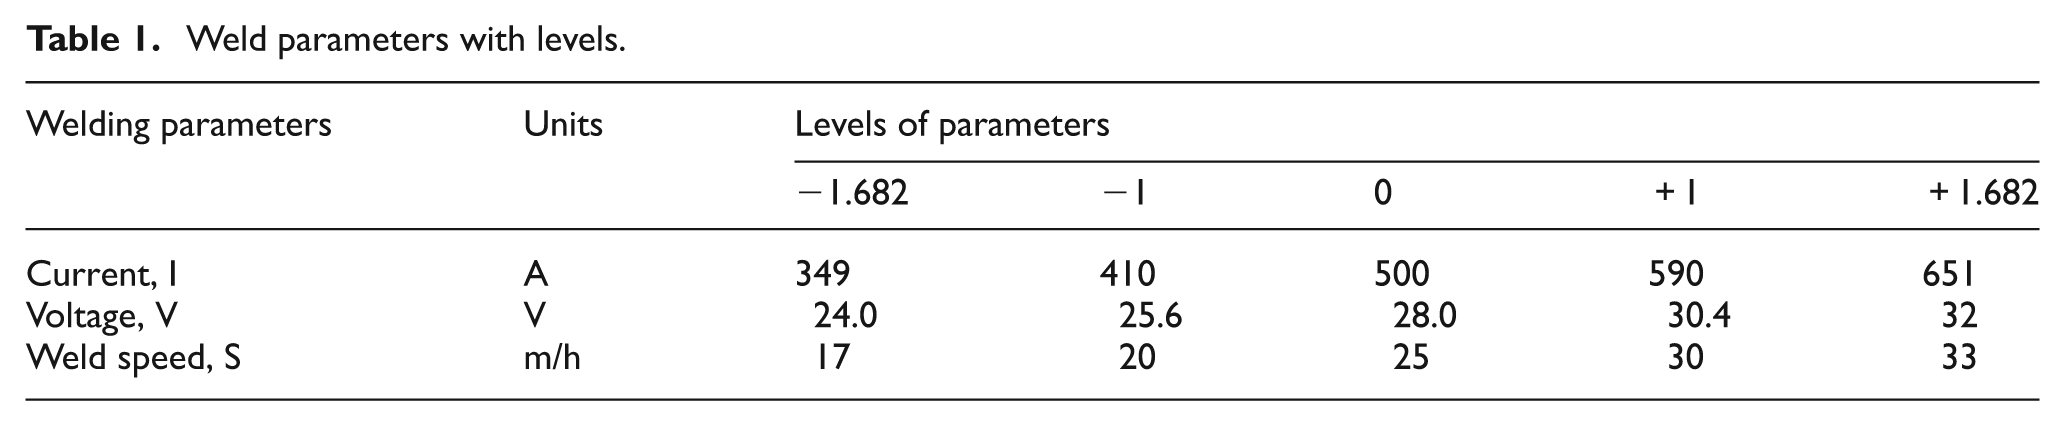
Three independently controllable process parameters, welding current (I), arc voltage (V) and weld speed (S), were selected on the basis of the importance of their effect on weld bead geometry and ease of control of being maintained at the desired level. Range of these parameters was decided by conducting the trial runs by varying one factor at a time while keeping the rest of them at constant value (One factor at a time, OFAT technique). Upper and lower levels of these parameters were fixed to get continuous and smooth bead appearance. The upper and lower levels of these parameters are designated in terms of coded values as +1.682 and −1.682 levels (α = ±[23]1/4). The actual values of the welding parameters are called uncoded values,
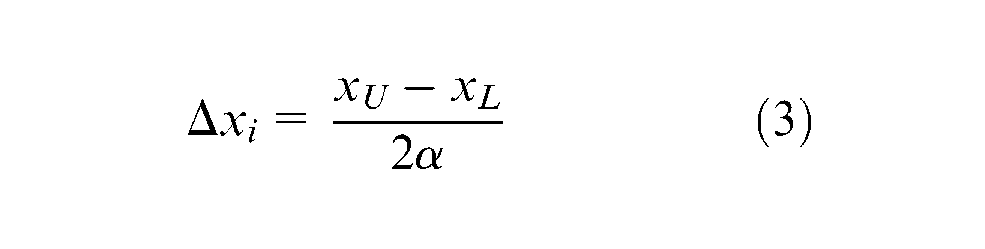
where
Coded value at jth level,
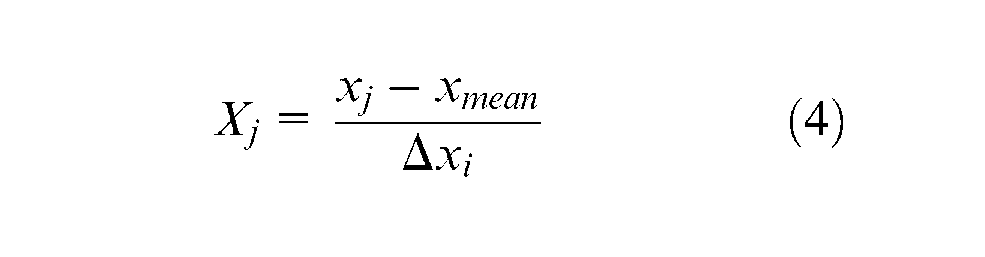
where
In the presented work, levels, units and notations of the selected parameters are presented in Table 1.
Weld parameters with levels.
Bead on plate
Weld beads were made on 18-mm-thick HSLA steel (API 5L X65) plate with size of 250 × 150 mm. Twenty beads were taken using 3.2-mm-diameter wire electrode (EH-14) with direct current reverse polarity (DCRP) keeping nozzle-to-tip distance constant at 25 mm on SAW setup (ADOR Tornado SAW M-800).
Measurement of responses
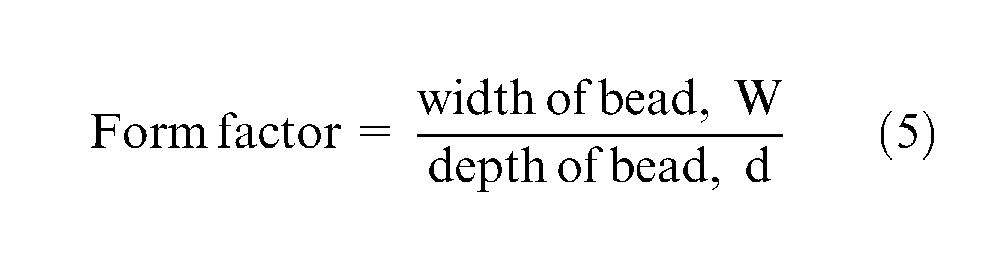
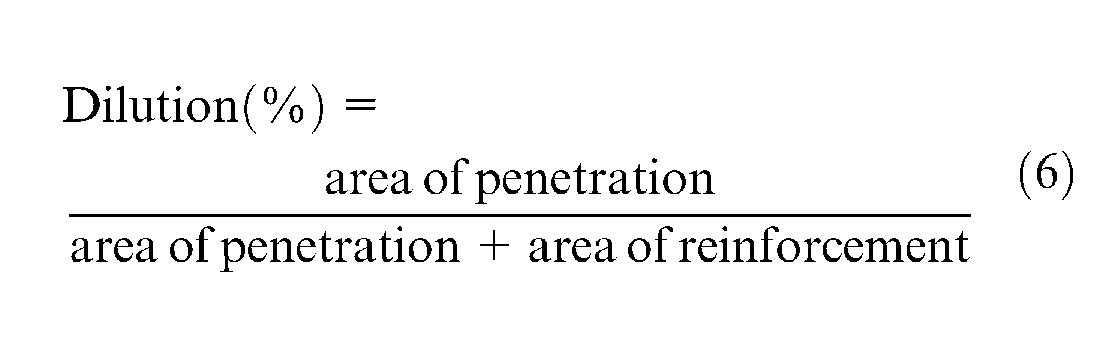
The welded plates were cut transversely to observe the bead profiles by performing the common metallurgical polishing operations and then etching with 5% nital solution. The weld bead geometry parameters (Figure 2(a)), width of bead (W), height of bead (h), area of reinforcement (Ar) and area of penetration (Ap), were measured using a profile projector and digital planimeter. Figure 2(b) shows actual bead after cutting transversely and polishing. Diffusible H2 content of the weld samples was measured by gas chromatograph. The specimen was transferred to leak-tight chamber immediately after welding, which was heated to 45 °C to accelerate the hydrogen evolution from the specimen. Hydrogen evolved from the specimen was collected inside the chamber for 72 h, and then the chamber was connected to a gas chromatograph analyzer. Diffusible amount of hydrogen was calculated by knowing the initial and final weights of the specimen and volume of the hydrogen collected. Microhardness of all beads was determined at the center of weld bead (fusion zone) at a load of 0.5 kg on Banbross Microhardness tester at Central Tool Room (CTR), Ludhiana. Form factor and dilution1,6,17 are calculated from equations (5) and (6)
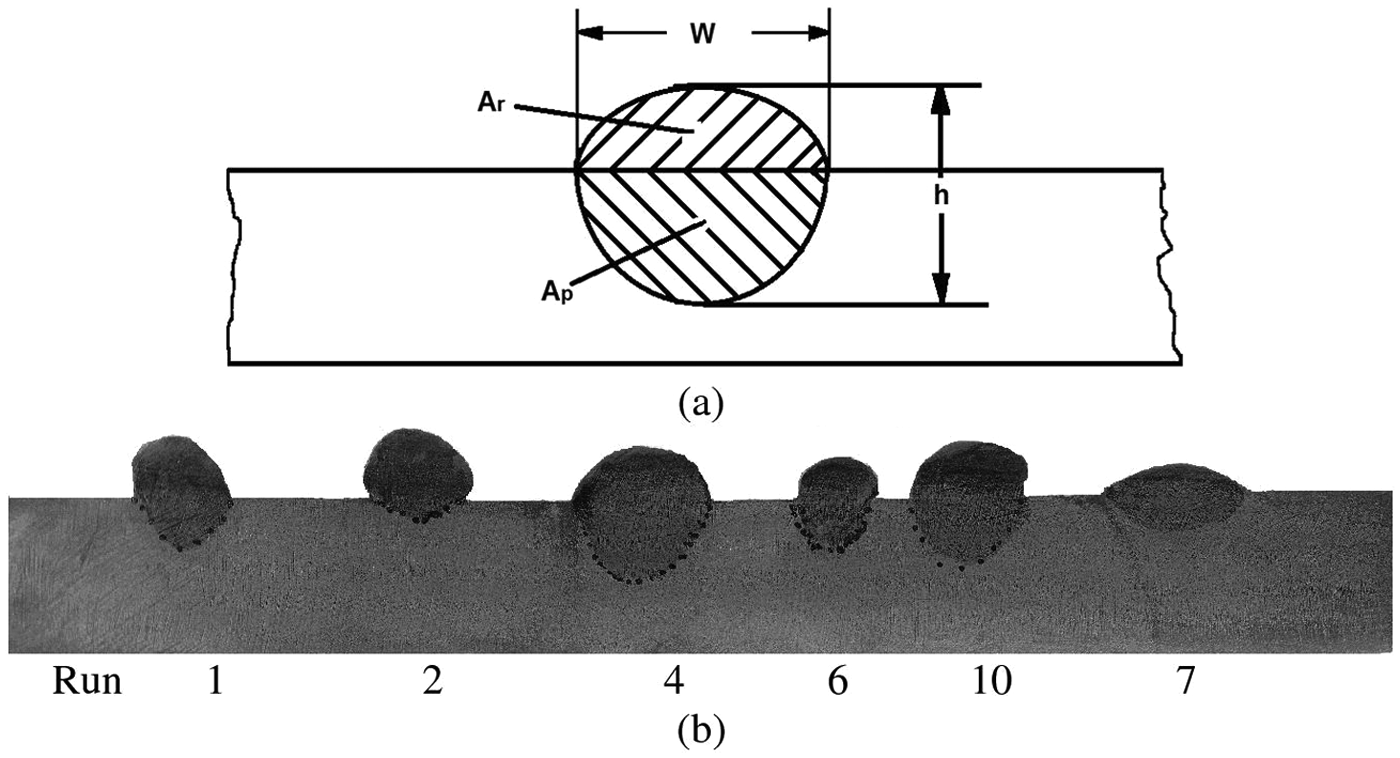
(a) Weld bead geometry and (b) actual bead for respective runs.
Results
Results of width of bead (W), height of bead (h), area of reinforcement (Ar), area of penetration (Ap), form factor, dilution, diffusible H2 content and microhardness (VHN) are presented in Table 2. The weld bead parameters, namely, form factor, dilution, diffusible hydrogen content and microhardness, are taken as output responses for optimization.
Design matrix with response values.
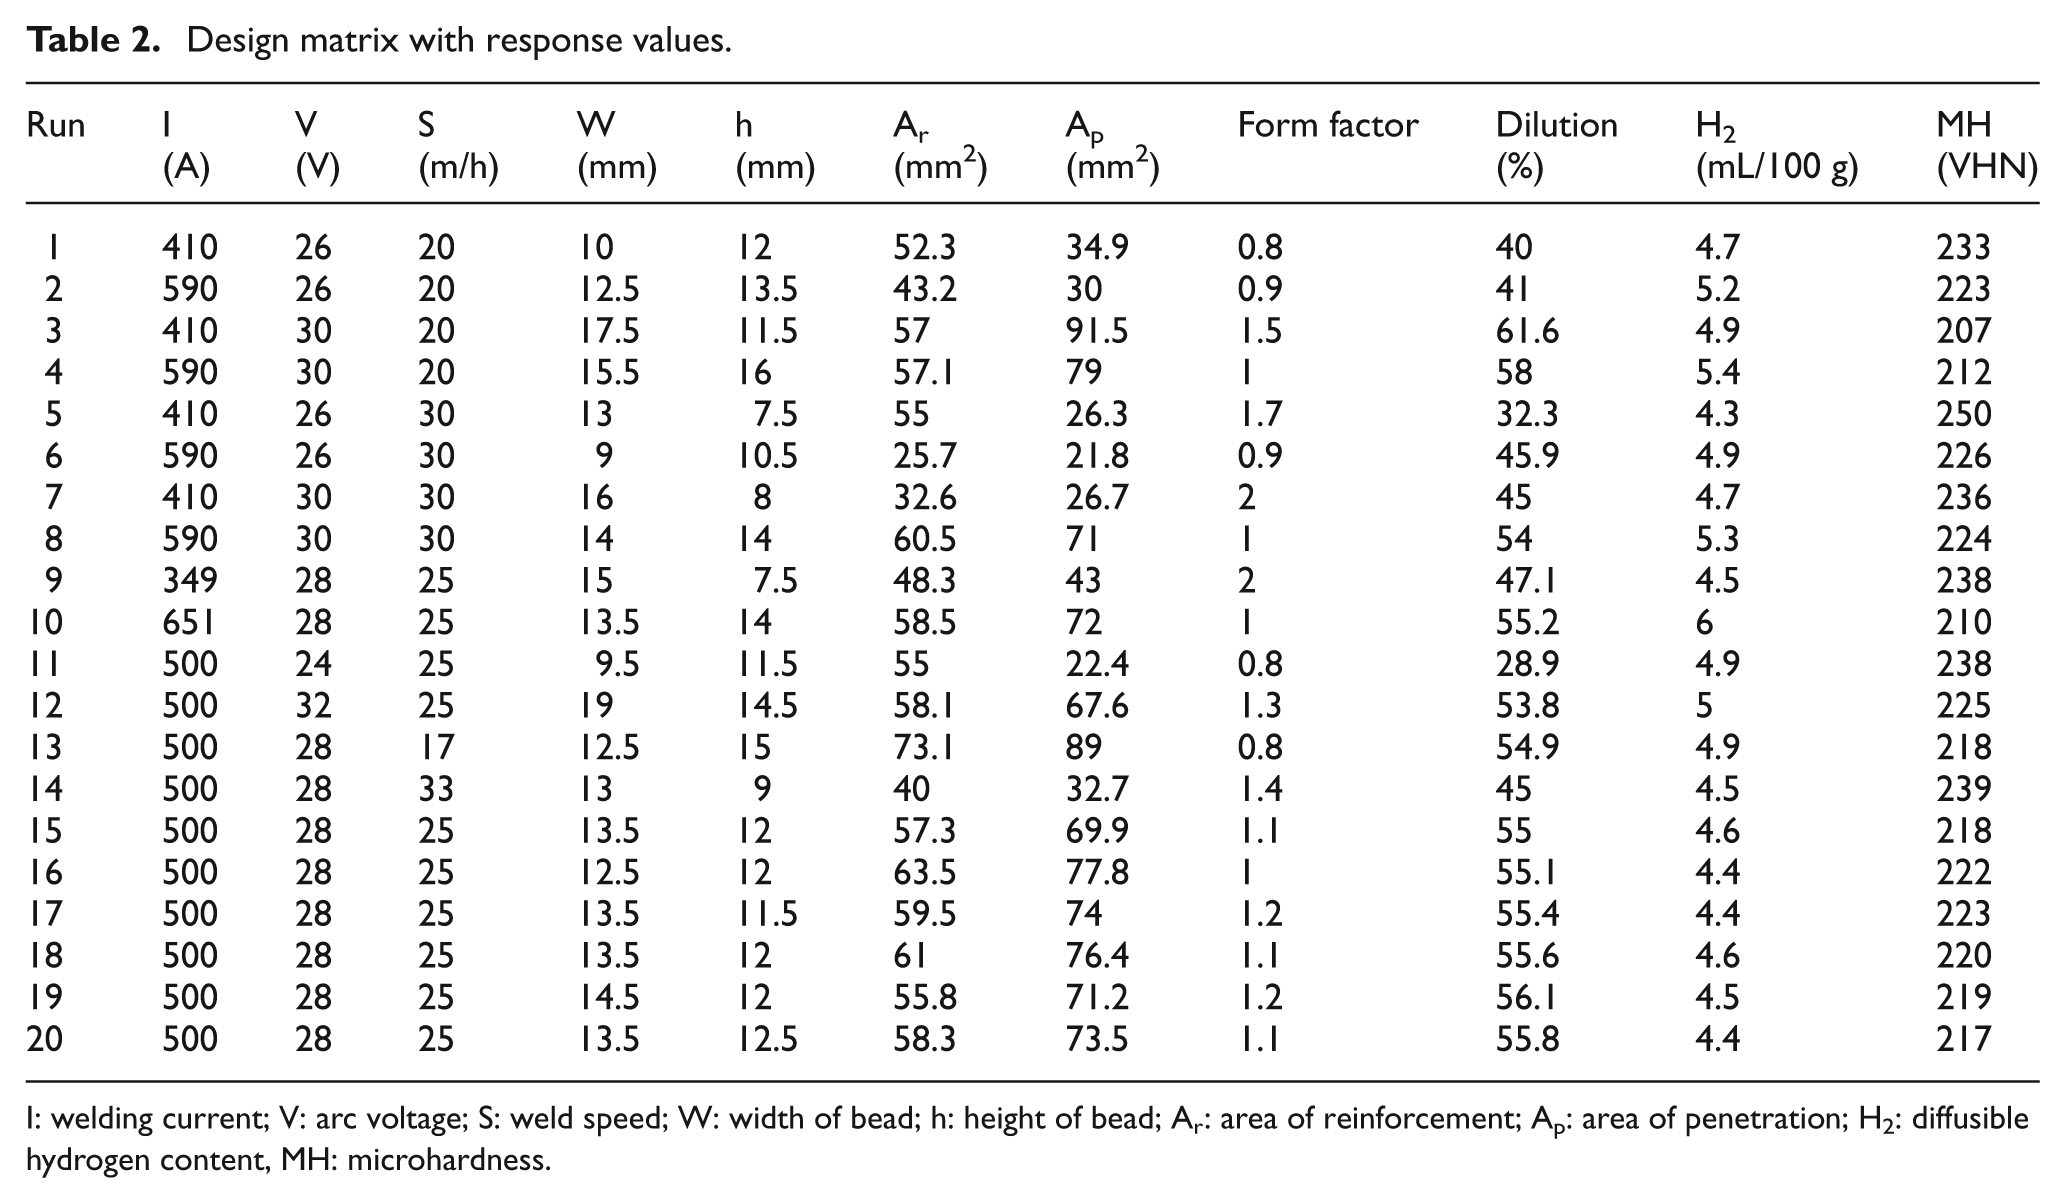
I: welding current; V: arc voltage; S: weld speed; W: width of bead; h: height of bead; Ar: area of reinforcement; Ap: area of penetration; H2: diffusible hydrogen content, MH: microhardness.
Development of mathematical models
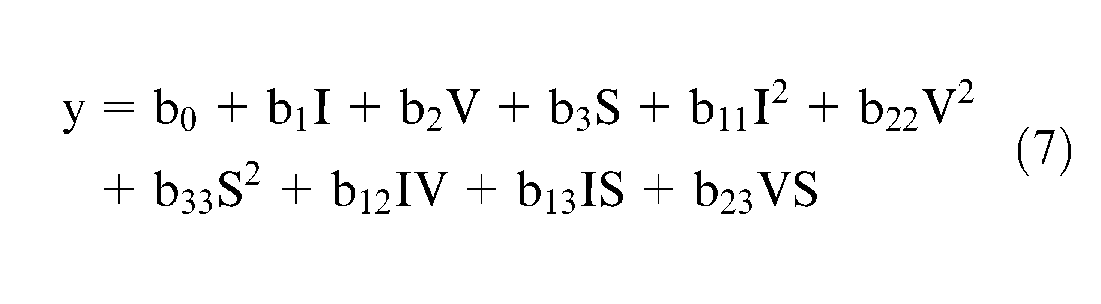
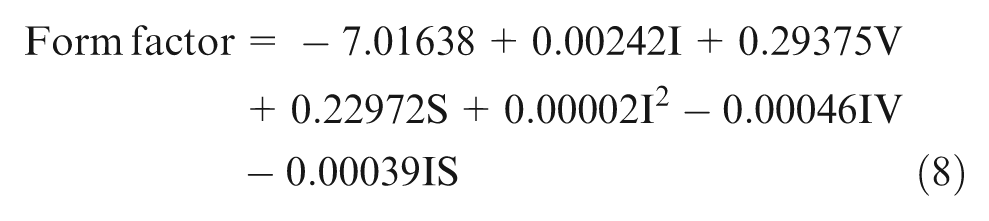
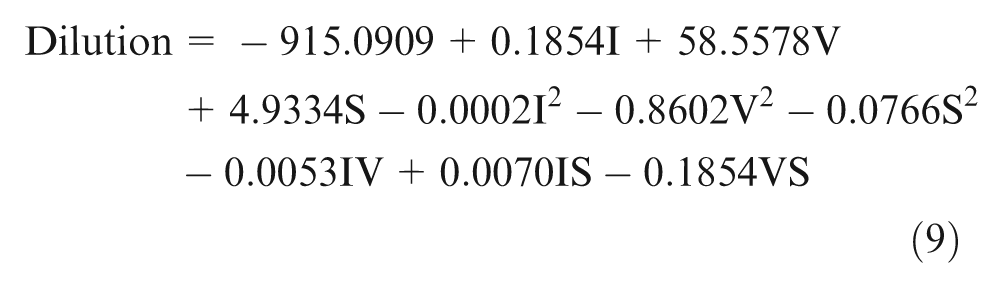
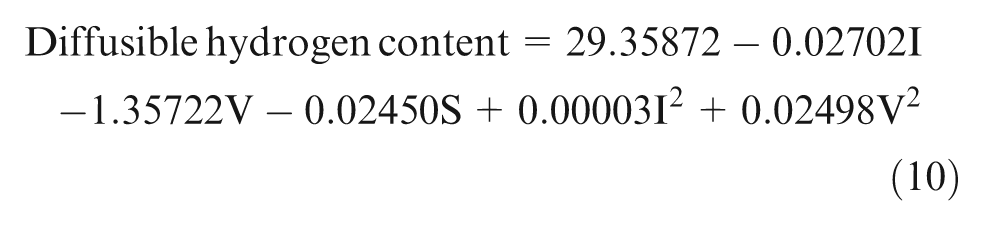
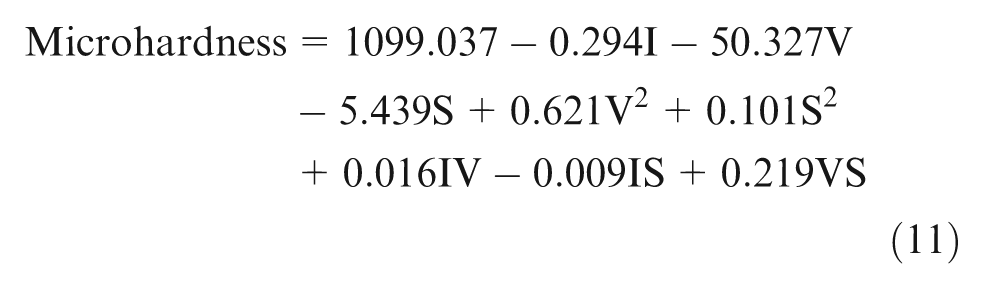
Using the observed values of output responses from experimentation, least square regression equations have been developed in terms of input weld parameters. Second-order response surface models are formed, which are expressed in terms of welding parameters, current I, voltage V and weld speed S as
Analysis of regression models
Regression model has been analyzed using Student’s t-test and analysis of variance (ANOVA) (F-test). Values of regression coefficients for all mathematical models have been represented in Table 3. Individual regression coefficients (
Regression coefficients for different models.
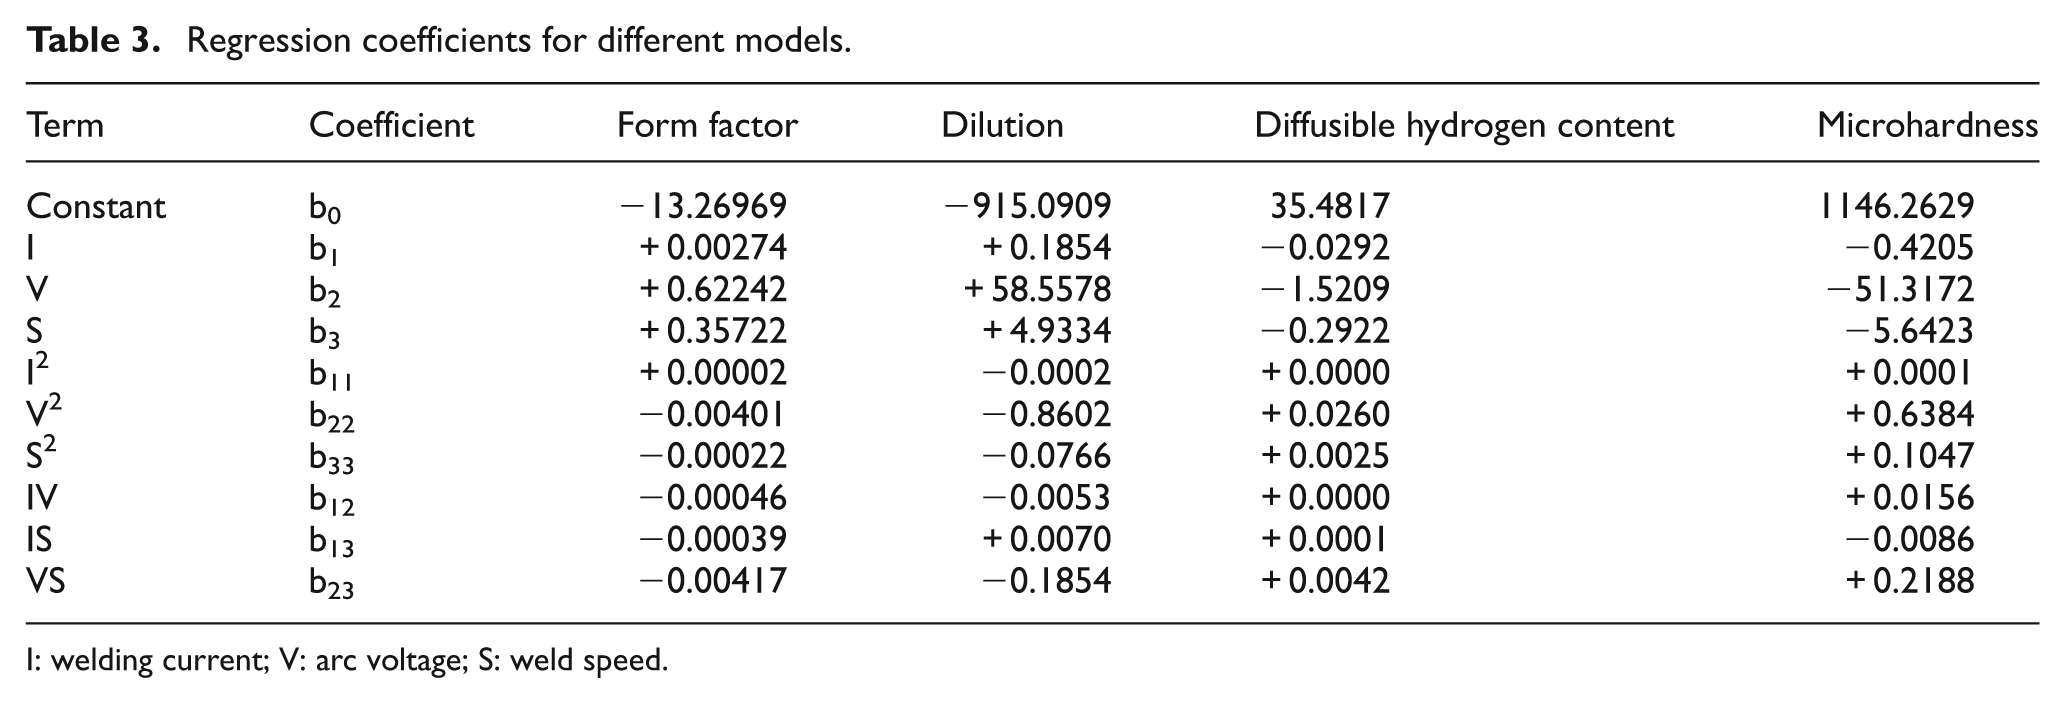
I: welding current; V: arc voltage; S: weld speed.
Full mathematical model has been checked by calculating F value and p value at 95% of significance level (Table 4). 18 R2 values for all of the prediction models are greater than 0.95 and indicate that predicted values are in close agreement with the observed values of weld properties, as shown in Figure 3.
ANOVA test for form factor, dilution, microhardness and diffusible H2 content
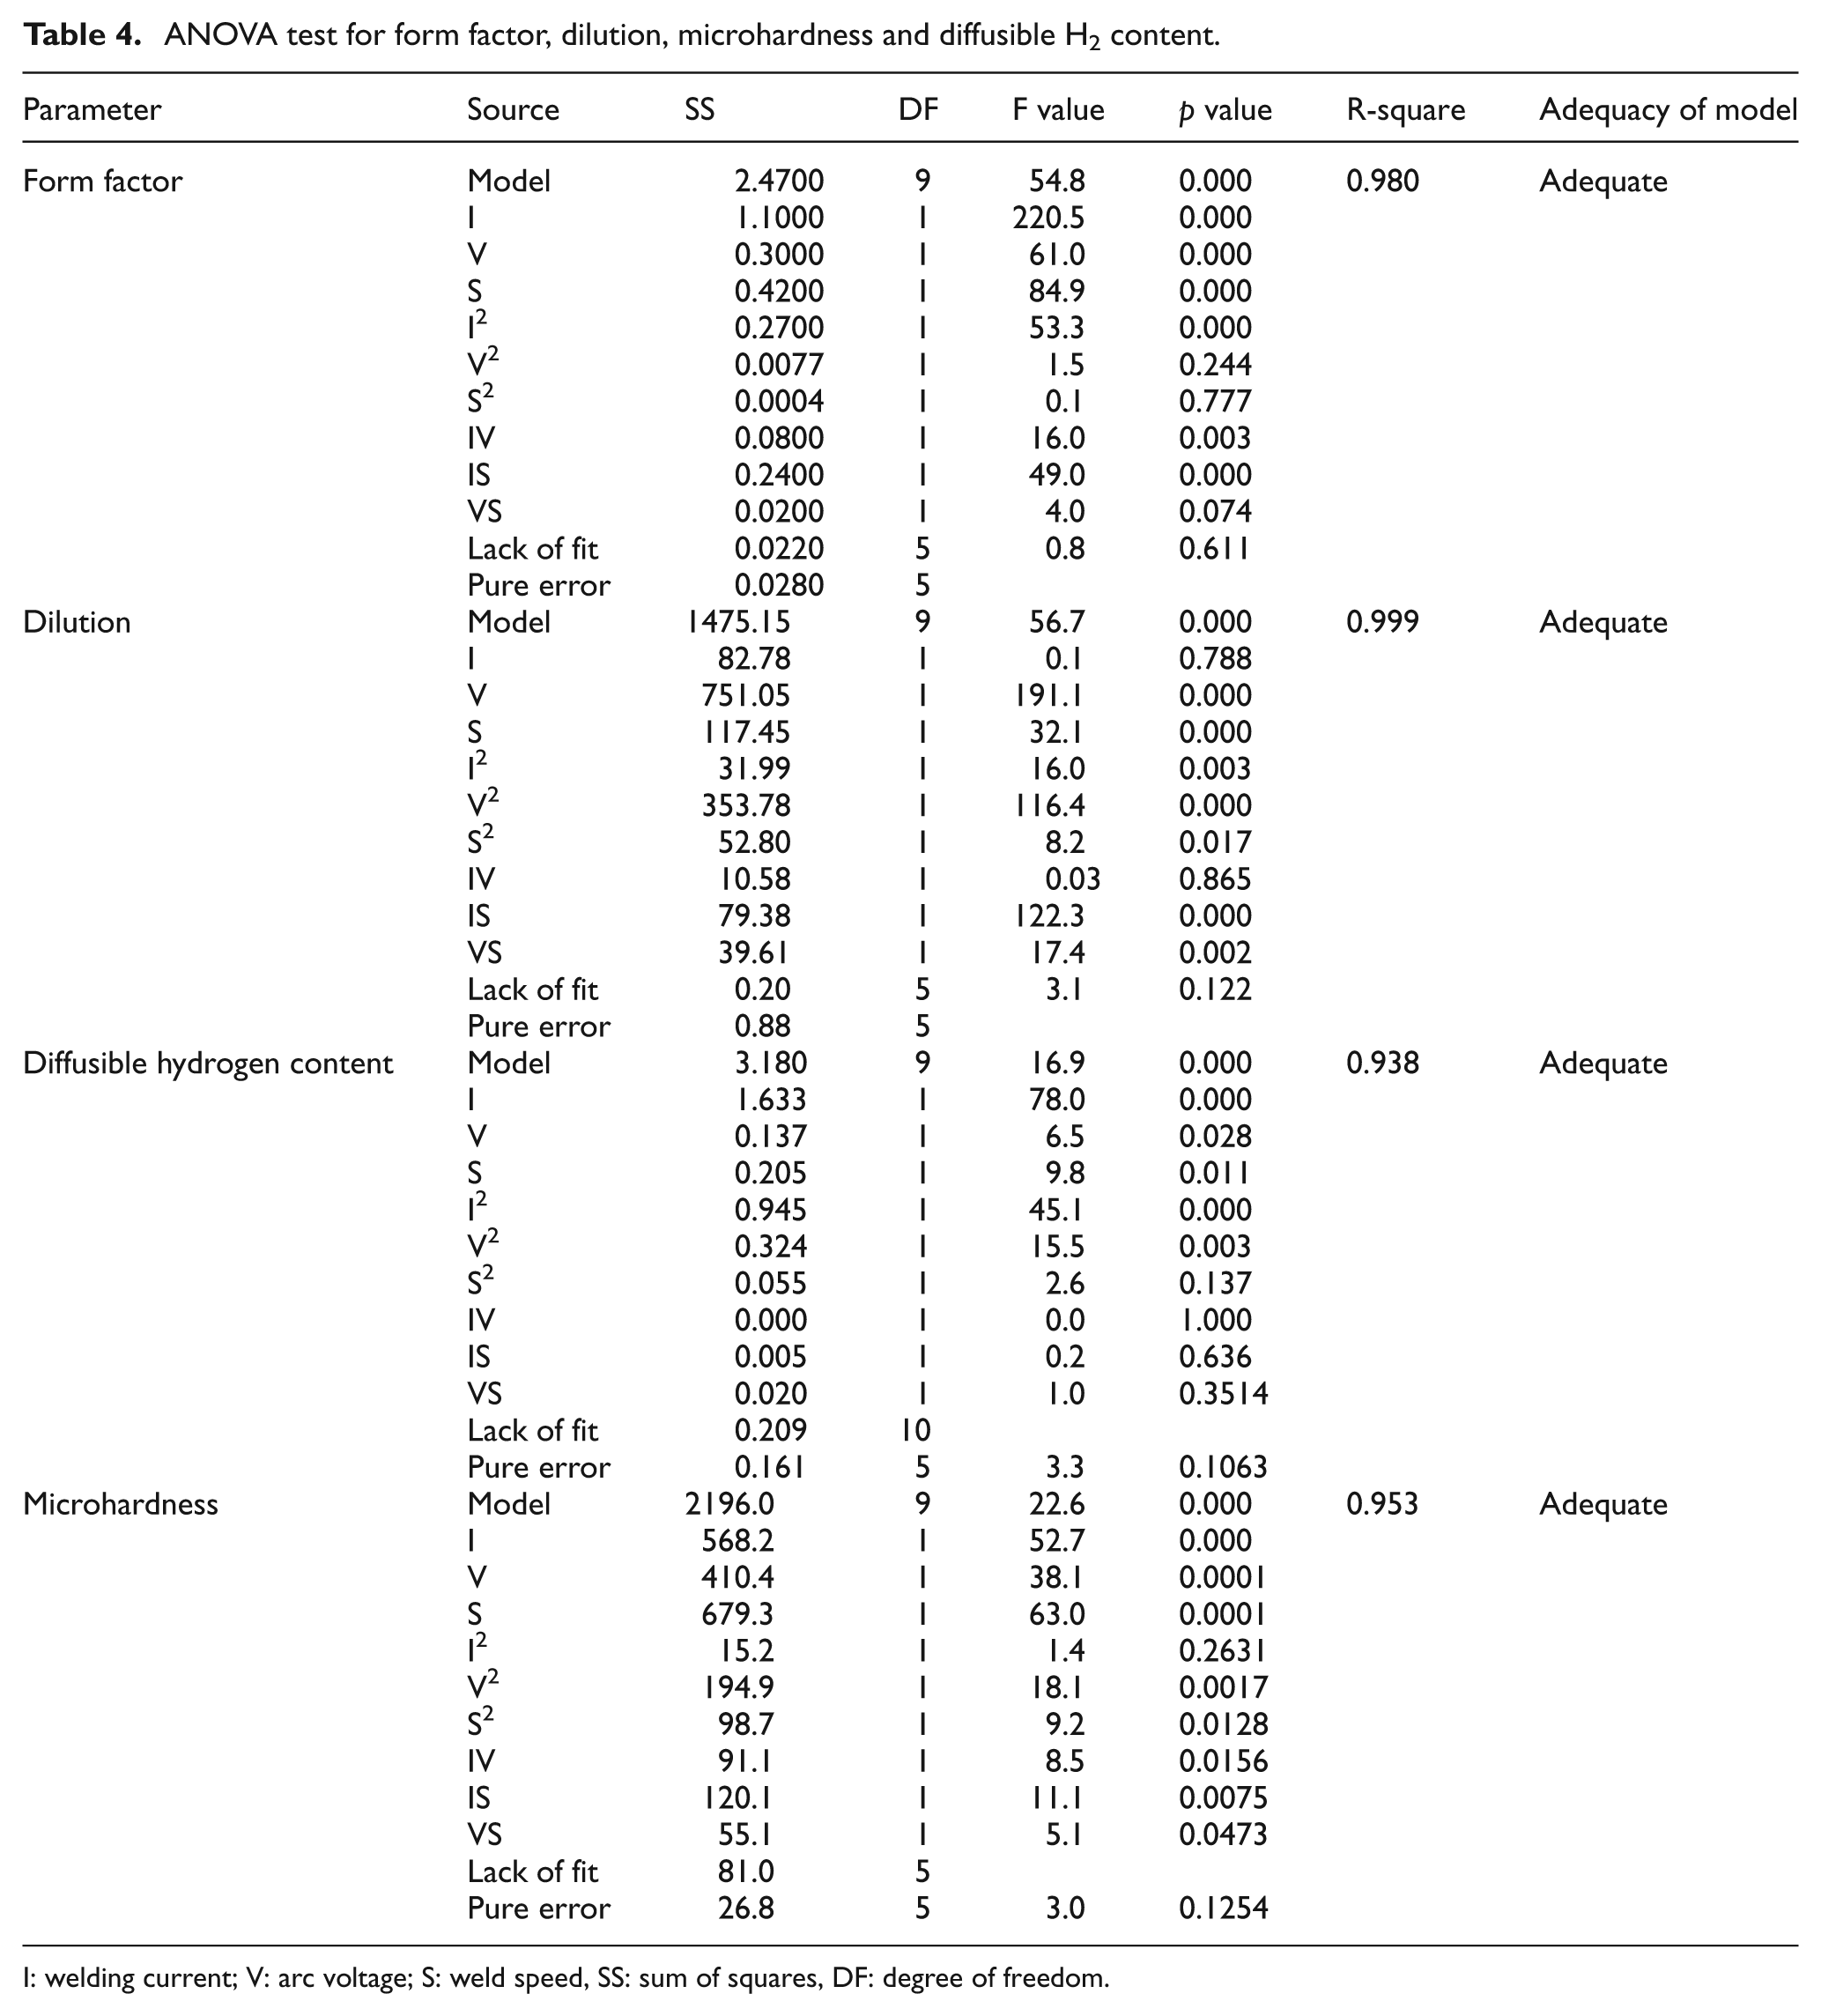
I: welding current; V: arc voltage; S: weld speed, SS: sum of squares, DF: degree of freedom.
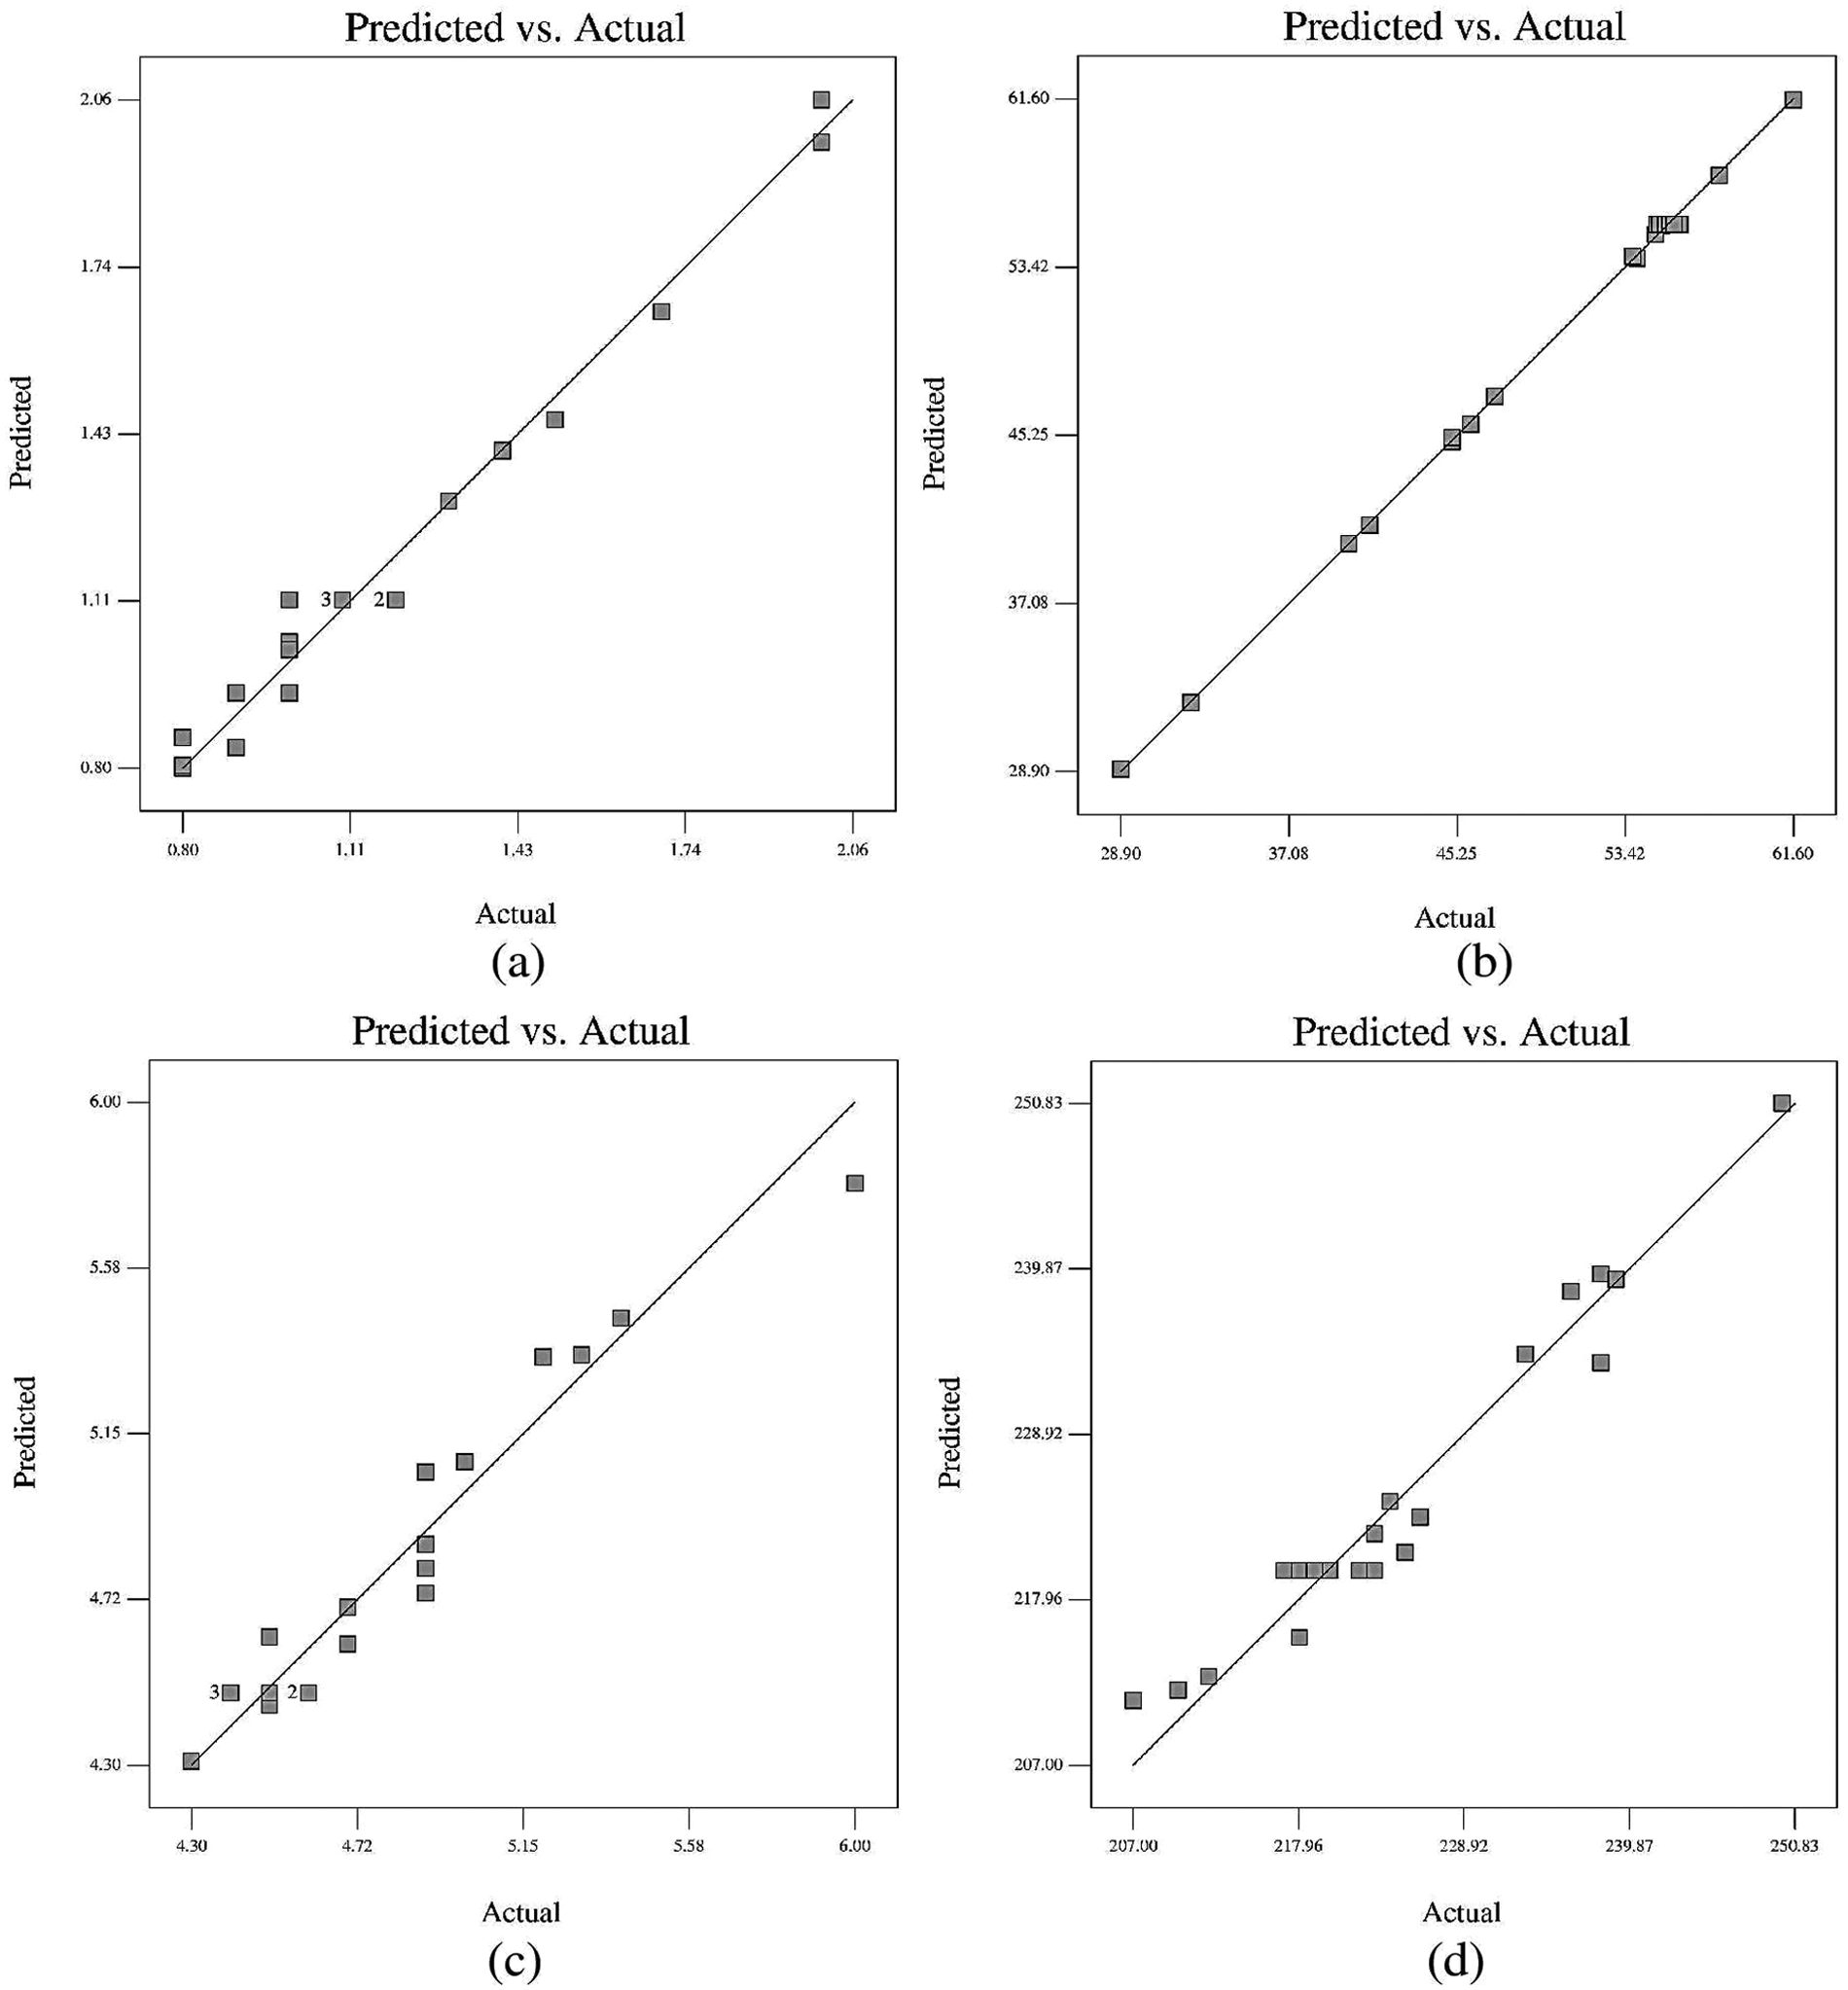
Predicted versus actual values of (a) form factor, (b) dilution, (c) diffusible hydrogen content and (d) microhardness.
The regression coefficients were recalculated with dropped coefficients and final mathematical model formed is given in the following
Multiresponse optimization of bead parameters
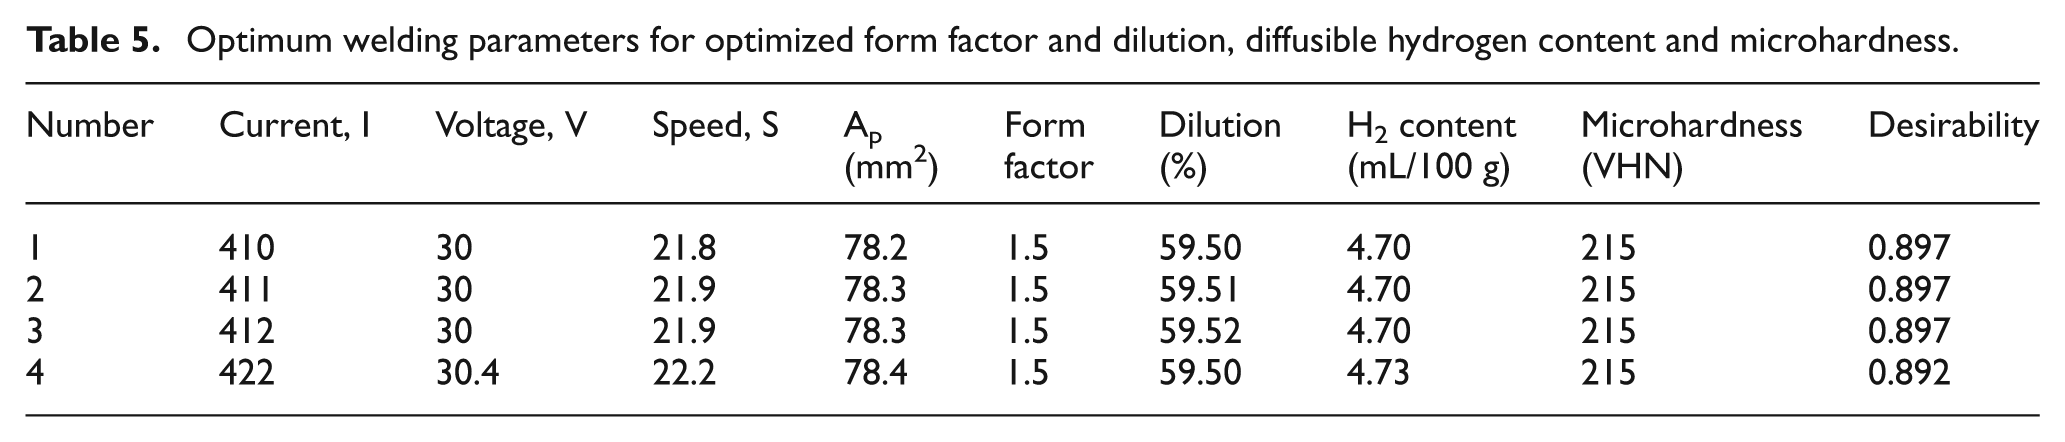
In the work, welding parameters are optimized to maximize area of penetration, maximize dilution, minimize diffusible hydrogen content, target value of form factor (1.5) and microhardness (VHN = 215). Four solutions are with equal weights; for all, responses were found at different levels of desirability, as presented in Table 5.
Optimum welding parameters for optimized form factor and dilution, diffusible hydrogen content and microhardness.
Discussion
Direct effect of welding parameters on weld properties
Effect of welding current on form factor and dilution of weld bead
Form factor decreases with increase of weld current from lowest value of 349 A to highest value of 651 A (Figure 4(a)). As form factor is the ratio of bead width to bead height, it means bead width decreases and bead height increases relatively with the increase of current, which are contrary to the literature (Figure 4(b)). 10 This is due to the fact that the weld current increases the power input to electrode wire and base metal causing larger volume of the base metal and wire to melt. Moreover, more heat increases the momentum of the molten droplets, which on striking the weld pool causes deeper penetration, thereby increasing the weld bead height as compared to bead width.
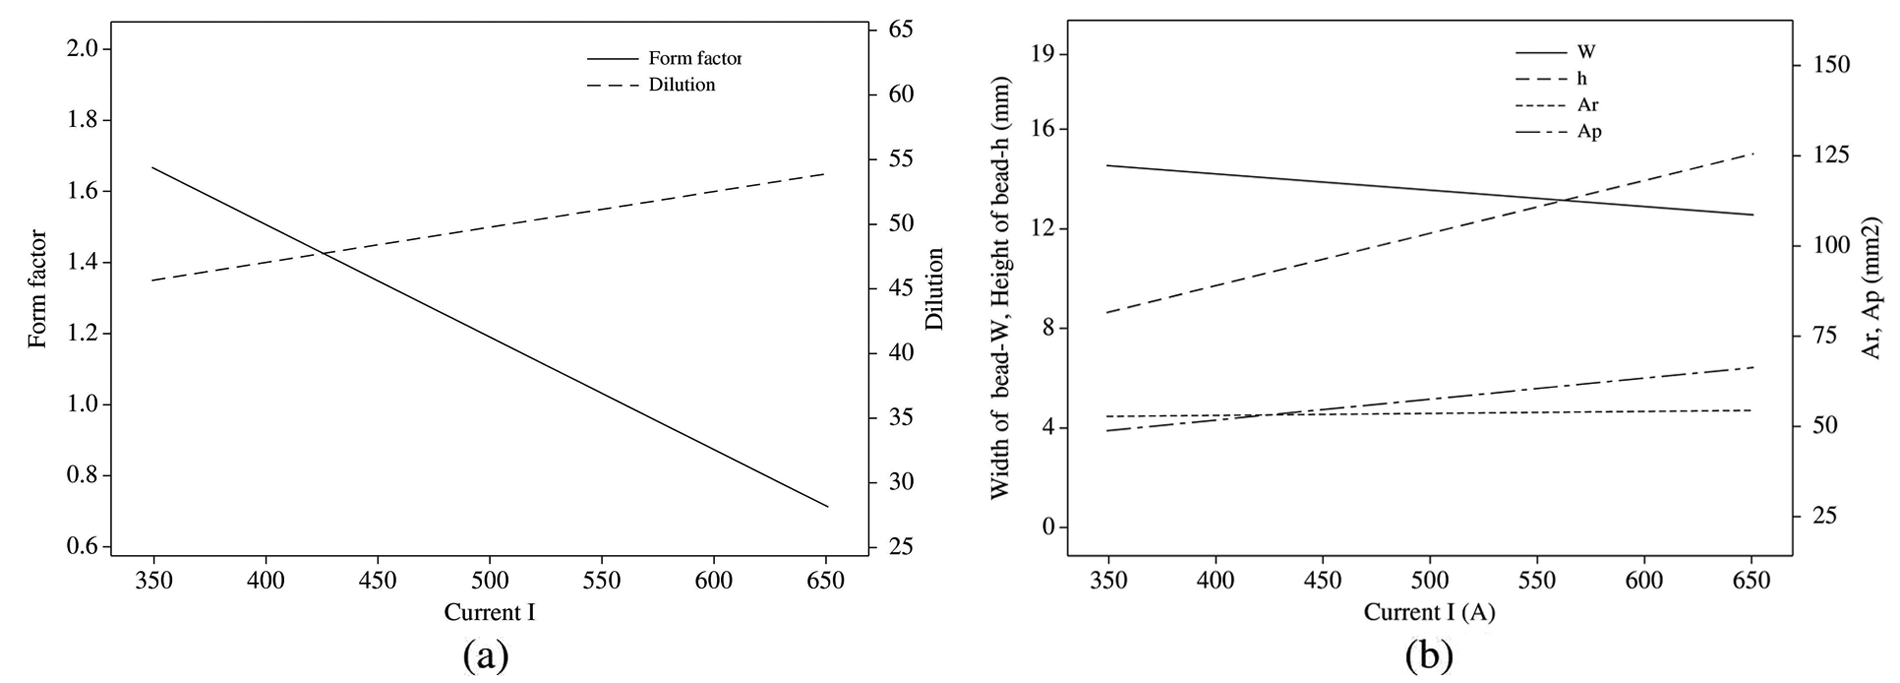
Direct effect of welding current on (a) form factor and dilution and (b) width, height, Ar and Ap.
With the increase of current from 349 to 651 A, dilution increases slightly, as shown in Figure 4(a). As dilution is further dependent on the area of reinforcement (Ar) and area of penetration (Ap), Ap increases gradually and linearly with increase in welding current for all ranges but Ar remains constant for an increase in current (Figure 4(b)). This may be due to the fact that current increases the heat input and hence the heat content and momentum of the molten droplets, which causes more of base metal to melt and deeper penetration, thereby increasing penetration area as compared to Ar.
Effect of arc voltage on form factor and dilution of weld bead
Form factor increases gradually with increase of arc voltage from 24 V (at −1.682 level) to 32 V (at +1.682 level) (Figure 5(a)). Both bead width and bead height increase with increase of voltage but increase in width is much sharper than increase in height (Figure 5(b)). Voltage in SAW increases arc length and spreading of the arc on more area, which results in much increase in bead width as compared to bead height, thereby results an increase in form factor.
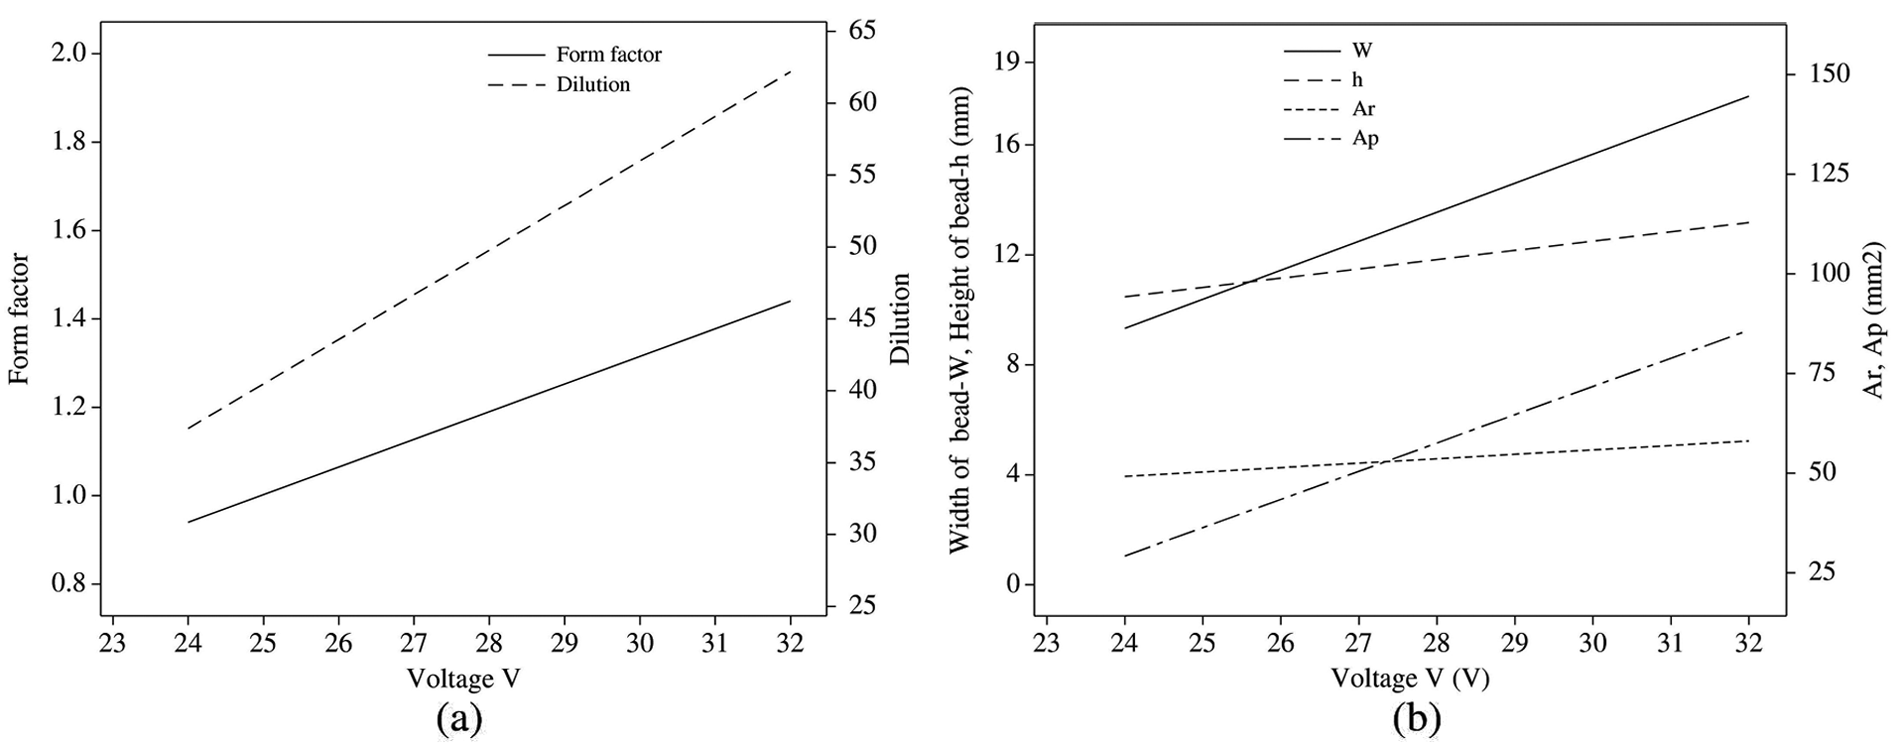
Direct effect of arc voltage on (a) form factor and dilution and (b) width, height, Ar and Ap.
With the increase of voltage from 24 V (at −1.682 level) to 32 V (at +1.682 level); dilution increases sharply, which is in agreement with the previous literature (Figure 5(a)). 6 Ap increases with increase in arc voltage from 24 V (at −1.682 level) to 32 V (at +1.682 level), but Ar slightly increases for all ranges of voltage increase (Figure 5(b)). Increase in arc voltage results in widening of arc cone, thereby increasing the surface area of molten pool on the base metal, which is also shown by the increasing trend of bead width and hence the area of penetration Ap. Area of reinforcement Ar also increases with the widening of weld bead to some extent.
Effect of welding speed on form factor and dilution of weld bead
Form factor increases gradually and constantly with increase of welding speed from 17 m/h (at −1.682 level) to 33 m/h (at 1.682 level), as shown in Figure 6(a). Both width of bead and bead height decrease with increase of voltage but decrease in height is much steeper than decrease in width, as shown in Figure 6(b). As heat input in welding process is inversely proportional to the weld speed so with the increase in speed, heat input to melt electrode wire and base metal decreases. At higher speeds, welding head covers more distance for the same time, and hence, electrode wire gets lesser time to melt. Both lesser melting time and lesser heat input tend to reduce bead width and bead height.
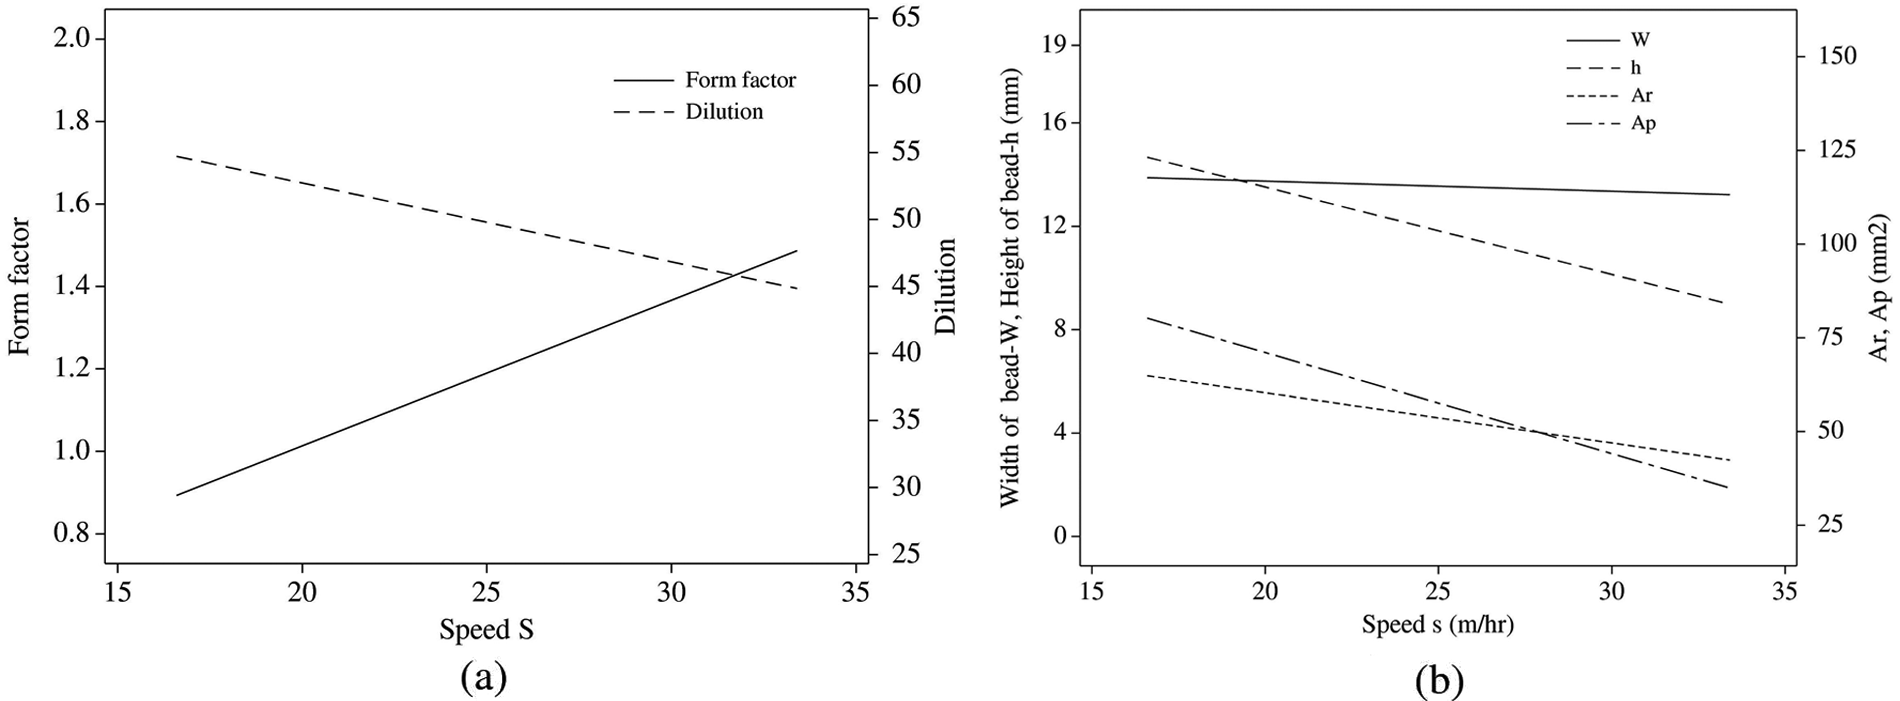
Direct effect of welding speed on (a) form factor and dilution and (b) width, height, Ar and Ap.
Dilution decreases with the increase of speed for the entire range showing same trend as in the work by Gunaraj and Murugan 6 (Figure 6(a)). Both Ap and Ar decrease gradually with increase in weld speed from 17 m/h (at −1.682 level) to 33 m/h (at 1.682 level) but Ap decreases more slowly than Ar (Figure 6(b)). Area of penetration Ap and area of reinforcement Ar reduce due to decrease of width and height of bead, which have been explained earlier.
Effect of welding current and arc voltage on diffusible hydrogen content
Diffusible hydrogen content increases with increases of current, as shown in Figure 7(a). This is due to the fact that higher current decreases the viscosity of the molten droplets due to which droplets attain smaller diameters, thereby increasing surface area-to-volume ratio of molten metal. The hydrogen content increases in tiny drops due to the larger surface area of droplets. Increased momentum of the molten droplets gives lesser time for the heat to evaporate hydrogen and hydrogen-containing compounds from the wire surface. Therefore, increase of hydrogen atoms in larger surface area and less number of hydrogen atoms escaped from wire surface increase hydrogen content.
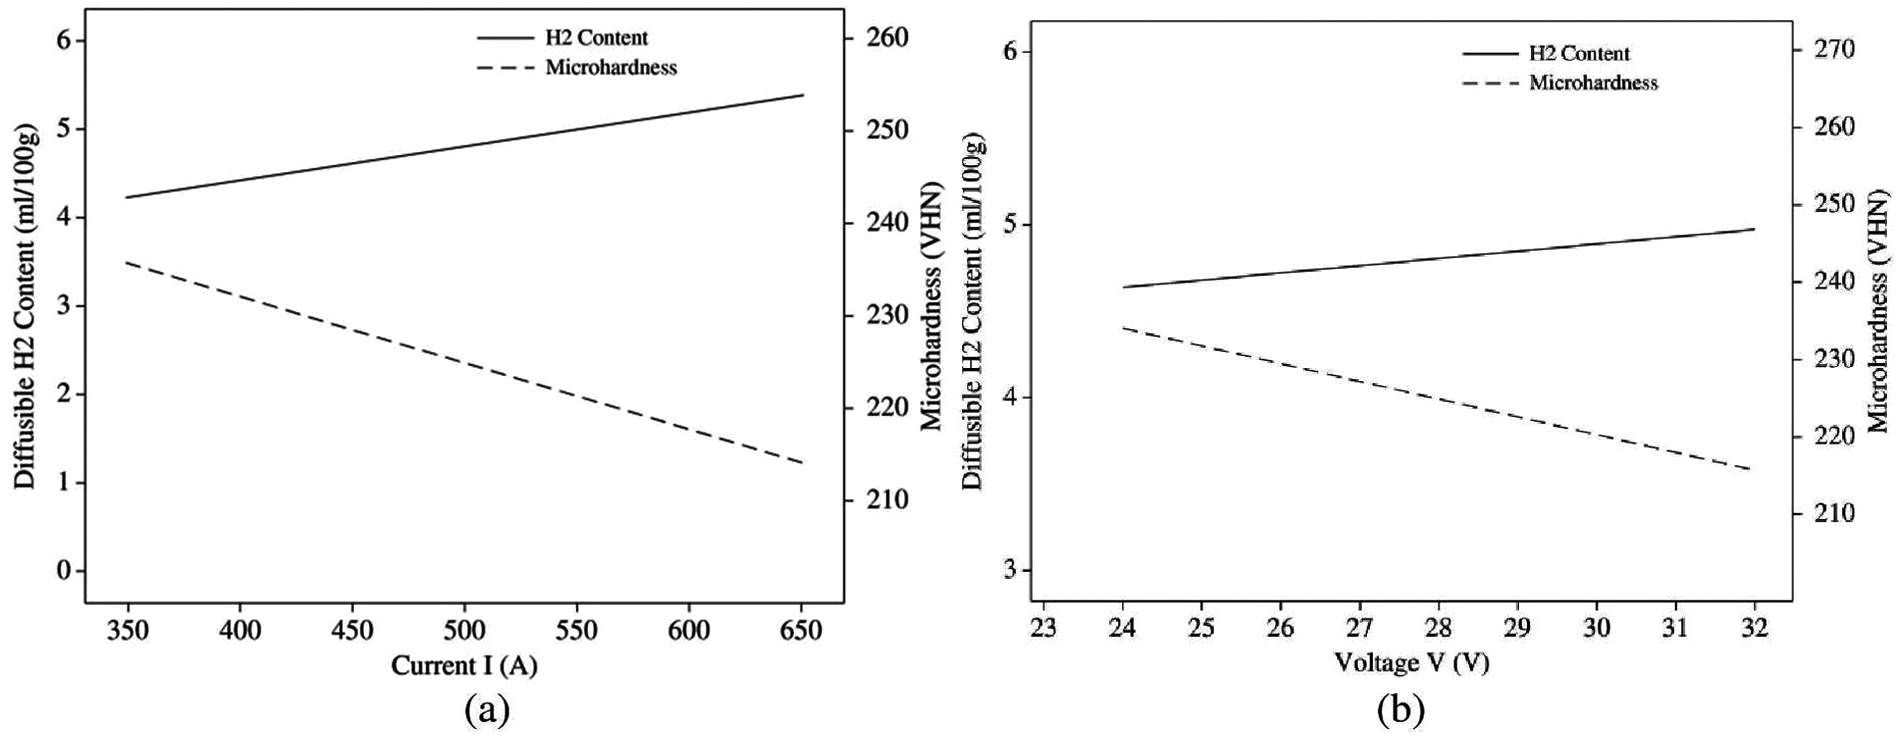
Direct effect of (a) welding current and (b) arc voltage on diffusible hydrogen content and microhardness.
Diffusible hydrogen content increases with increases of arc voltage but slope of curve is less as compared to increase in current (Figure 7(b)). Higher arc voltage increases heat input to the electrode, hence decreasing the viscosity of the molten droplets. So increase of hydrogen content may be explained, as discussed, by increase in hydrogen content with an increase in current. Increase in arc voltage results in an increase in arc length, so more of the molten droplets may evaporate hydrogen-containing compounds from the wire surface. Increase of hydrogen atoms in larger surface area and decrease of hydrogen content with more number of atoms escaped from wire surface resulted in lesser rate of increase in H2 content due to increase in arc voltage.
Effect of welding current and arc voltage on microhardness of weld bead
Microhardness of weld bead decreases and seems to vary from 250 to 207 VHN with increase of current or voltage (Figure 7(a) and (b)), which is in agreement with the previous literature. 5 The decrease in microhardness with the increase of current or voltage may be caused by slow cooling of the molten weld metal due to much more heat generated at higher current densities/high arc voltage. Slow cooling of molten metal produces more number of soft phases in the solidified metal, thereby reducing microhardness with increase in current or voltage.
Effect of welding speed on diffusible hydrogen content and microhardness
Diffusible hydrogen content decreases slightly as weld speed increases (Figure 8). Increase in speed decreases heat input, which increases the viscosity of the molten droplets due to which size of droplets increases thereby decreasing surface area-to-volume ratio of molten metal. Less number of hydrogen atoms can be developed in smaller surface area of molten droplets. Also, decrease in momentum of the molten droplets extends the time for the heat to evaporate more hydrogen and hydrogen-containing compounds from the wire surface. Both phenomena result in decrease of diffusible hydrogen content.
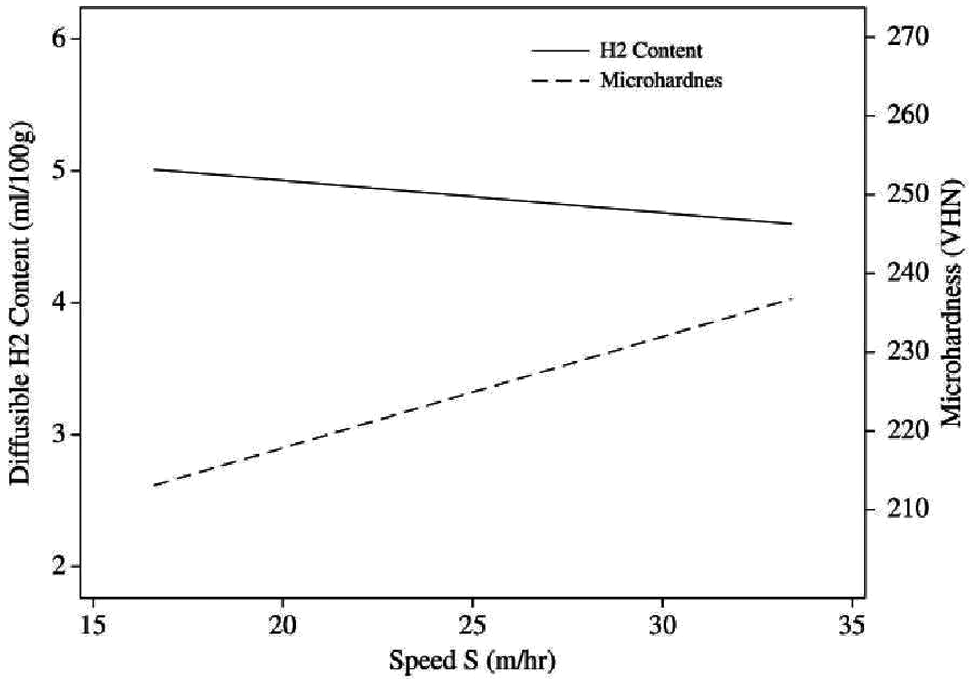
Direct effect of welding speed on diffusible hydrogen content and microhardness.
Microhardness of weld bead increases with increase in welding speed showing same trend as in the previous study (Figure 8). 5 Increase in welding speed decreases heat input, which decreases the heat generated at the base metal, which causes faster cooling of the molten metal. Faster cooling of the solidified metal moves the microstructure toward martensitic grain structure.
Interaction effect of welding parameters on weld properties
Interaction effect of welding current and arc voltage on form factor
From Figure 9(a), it is clear that form factor decreases with increase in weld current for all values of arc voltage but it increases with increase in arc voltage from 24 to 32 V at lowest level (−1.682 level) of current and remains constant for highest value (+1.682 level) of welding current, indicating interaction between parameters I and V. Response surface plot also indicates that highest value of form factor is obtained at highest value of 32 V (+1.682 level) arc voltage and at lowest value of 349 A (−1.682 level) of current.
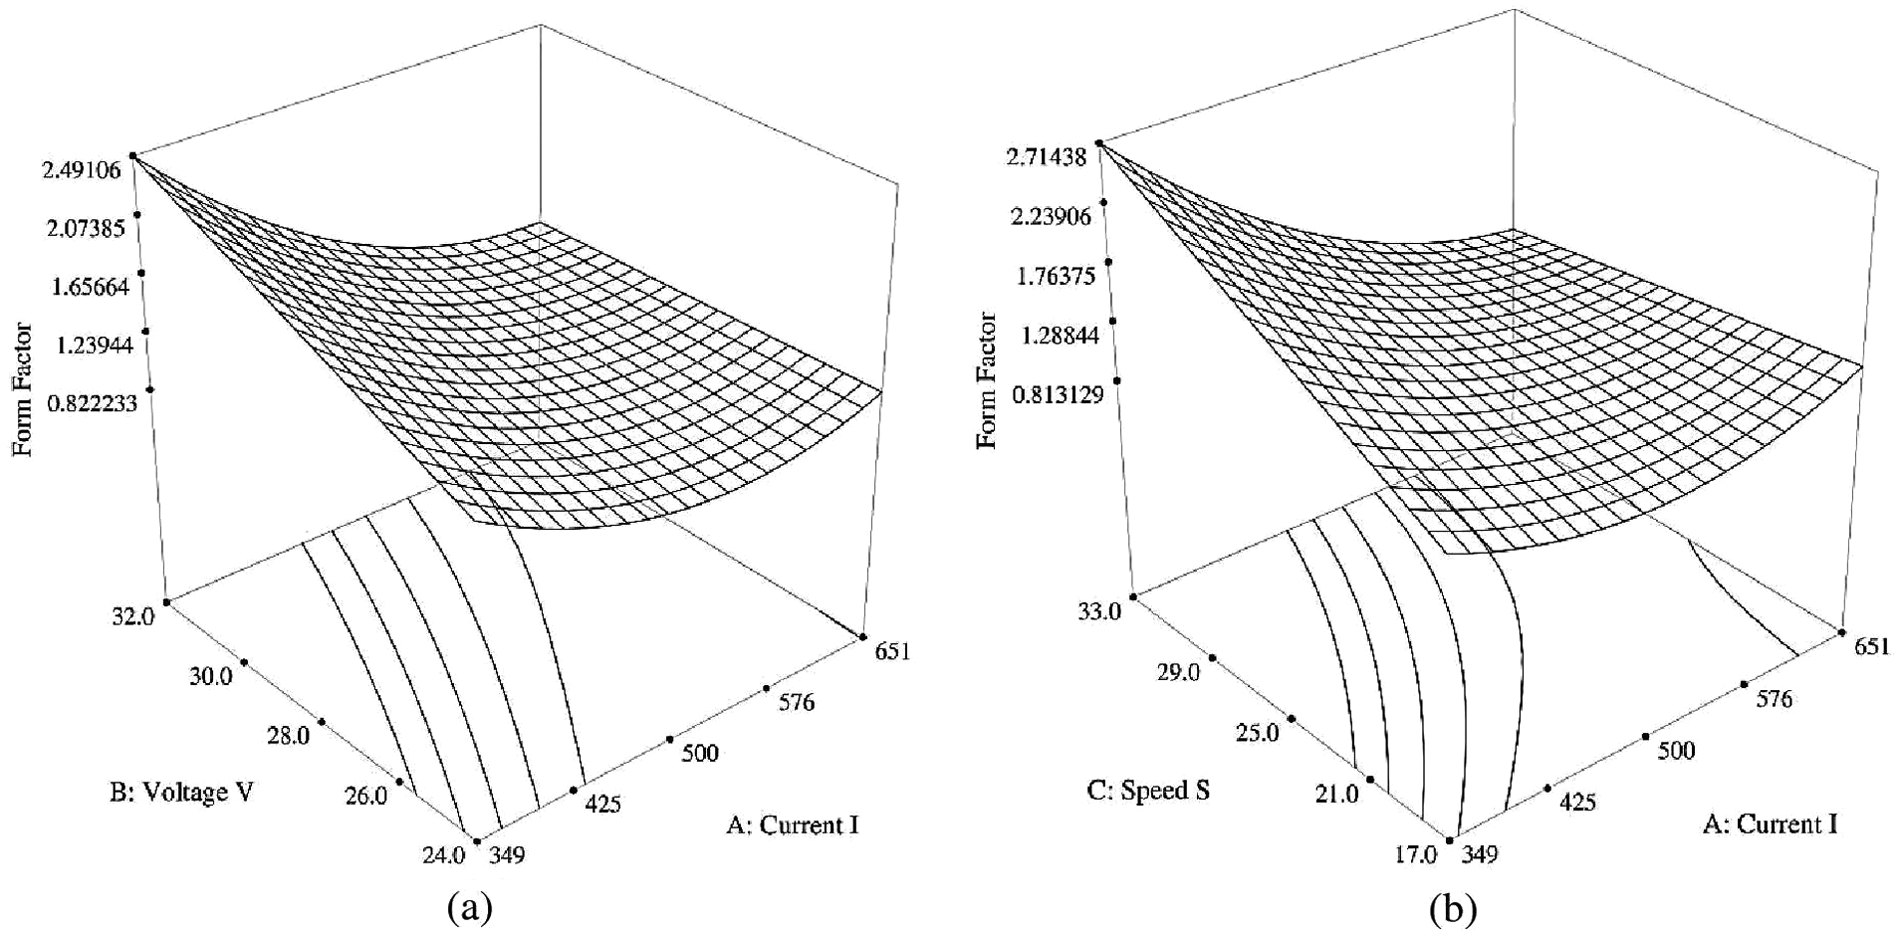
Interaction effect of (a) welding current and voltage and (b) welding current and speed on form factor.
Interaction effect of welding current and weld speed on form factor
Response surface plot (Figure 9(b)) shows that bead form factor decreases with increase in weld current for all values but it increases sharply at highest level of weld speed (+1.682 level) and decreases gradually at the lowest level of weld speed (−1.682 level). In the same manner, form factor increases gradually at the lowest current level (−1.682 level) but remains constant at highest level of current (+1.682 level) with increase in speed, thus indicating significant interaction between parameters I and S.
Interaction effect of welding current and arc voltage on dilution
From Figure 10(a), it is clear that dilution increases with increase in arc voltage from 24 to 30 V and slightly decreases from 30 to 32 V for all values of welding current. Also, it increases with increase in current for the lowest value of arc voltage but remains constant with current at the highest value (+1.682 level) of arc voltage. A three-dimensional (3D) peak is observed on the response surface at 30 V, so the highest value of dilution can be obtained at this level of voltage.
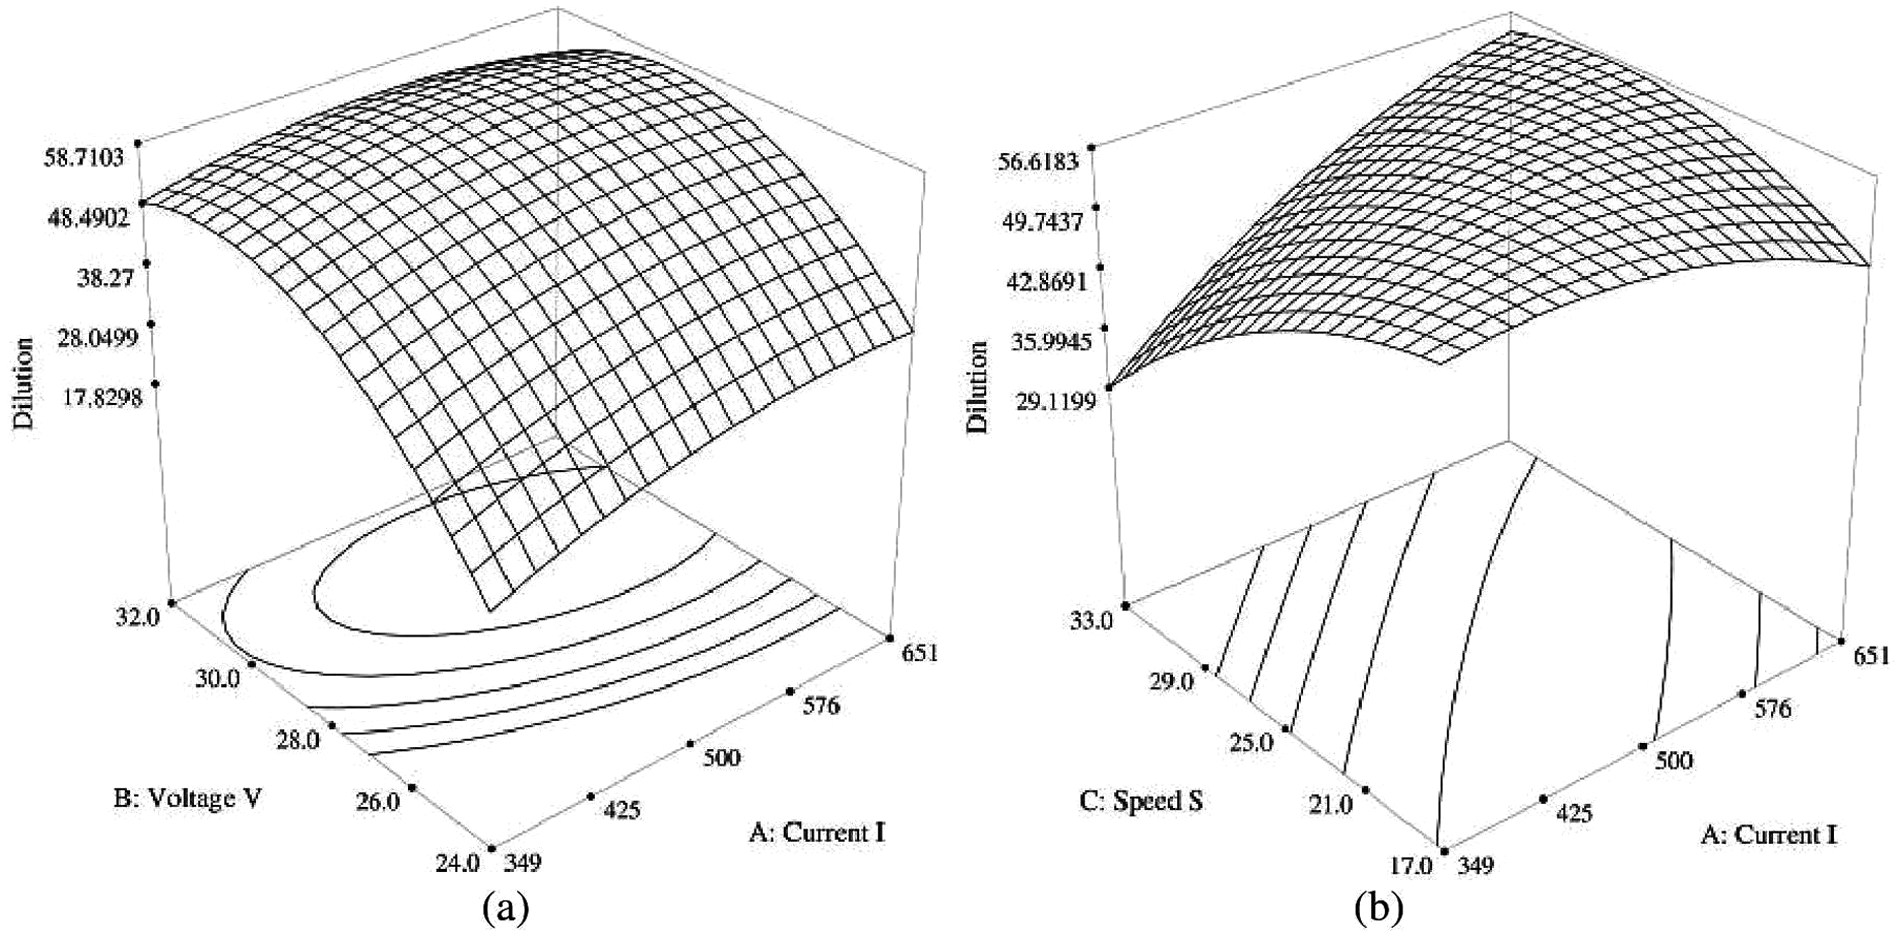
Interaction effect of (a) welding current and voltage and (b) welding current and speed on dilution.
Interaction effect of welding current and weld speed on dilution
Response surface diagram (Figure 10(b)) shows that dilution decreases with increase in welding speed at the lowest value of current (−1.682 level) but do not vary much at the highest value of 651 A (+1.682 level) of current. Similarly, it increases with increase in current for the highest value of welding current but remains constant at the lowest value (−1.682 level) of welding current.
Interaction effect of arc voltage and welding speed on dilution
Interaction plot (Figure 11(a)) between arc voltage and weld speed for dilution shows that dilution increases with increase in arc voltage from 24 to 30 V for values of weld speed from 17 to 25 m/h but slightly decreases from 30 to 32 V for values of weld speed from 25 to 33 m/h. Also, it does not vary much with welding speed except for high values of arc voltage, where it decreases with increase in speed.
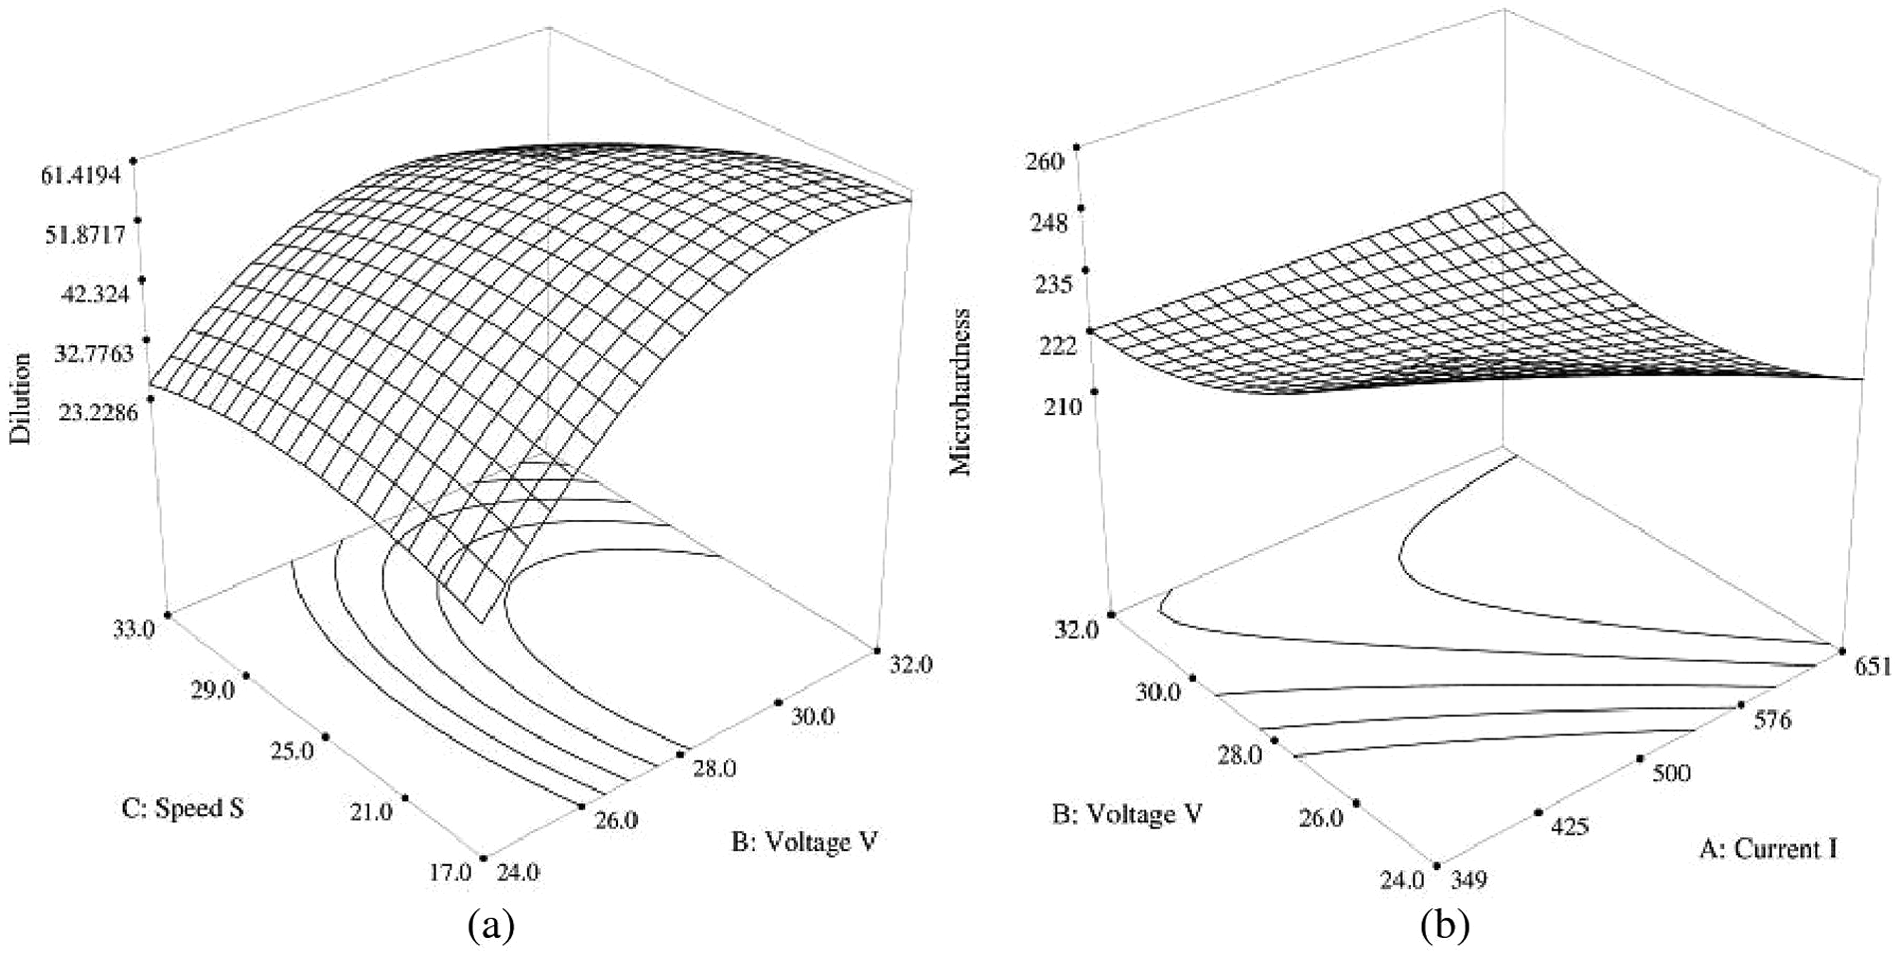
Interaction effect of (a) arc voltage and welding speed and (b) welding current and voltage on microhardness.
Interaction effect of welding current and arc voltage on microhardness
Response surface plot (Figure 11(b)) for microhardness between welding current and arc voltage shows that microhardness decreases with increase in welding current for all values of arc voltage except at 32 V (+1.682 level), where it remains constant with welding current. It varies in the same manner with arc voltage as with welding current. The lowest value of microhardness will be obtained at the highest values of welding current and arc voltage, that is, at 651 A (+1.682 level) and 32 V (+1.682 level), respectively.
Interaction effect of welding current and weld speed on microhardness
Response surface diagram (Figure 12(a)) shows that microhardness increases sharply with increase in welding speed but rate of increase gradually decreases with increase in current from the lowest value of 349 A (−1.682 level) to the highest value of 651 A (+1.682 level). Similarly, it decreases with increase in current for the highest value of welding speed, but remains constant at the lowest value (−1.682 level) of welding speed, showing significant interaction between I and S.
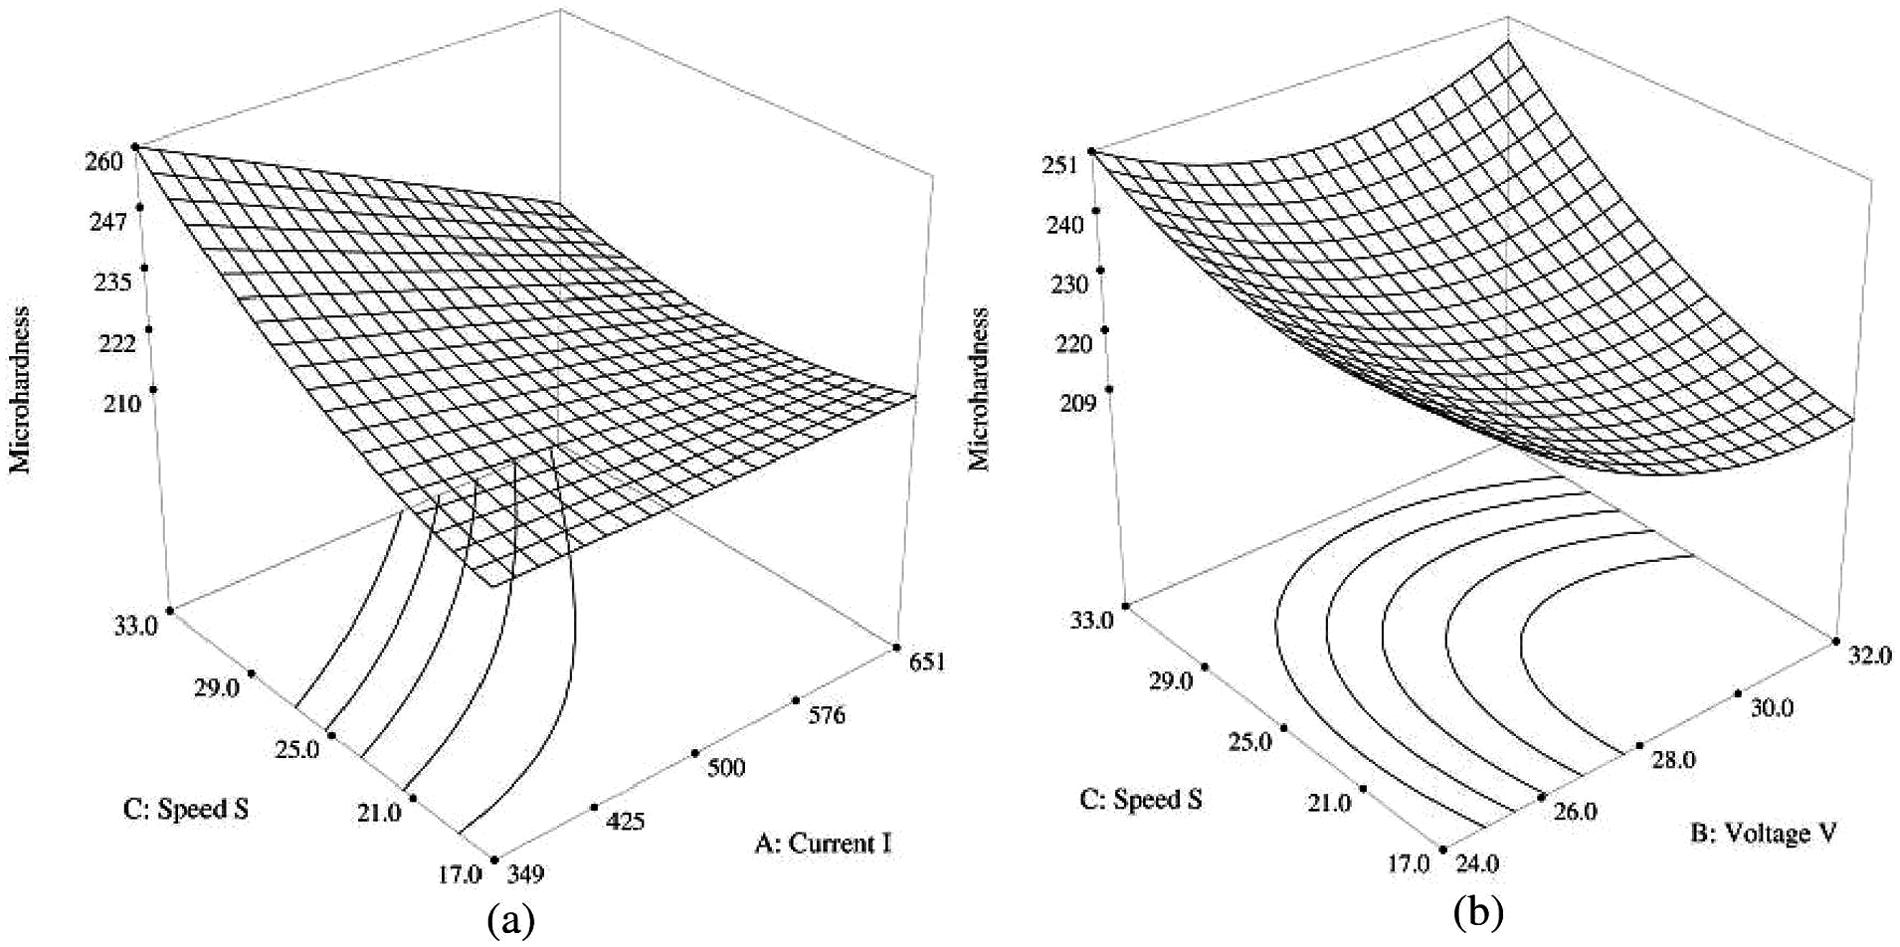
Interaction effect of (a) welding current and speed and (b) arc voltage and welding speed on microhardness.
Interaction effect of arc voltage and welding speed on microhardness
Interaction plot (Figure 12(b)) between arc voltage and weld speed for microhardness shows that microhardness decreases with increase in arc voltage at the lowest value of weld speed of 17 m/h (−1.682 level) but does not vary at the highest value of weld speed of 33 m/h (+1.682 level). Also, it increases with welding speed for all values of arc voltage.
Model validation
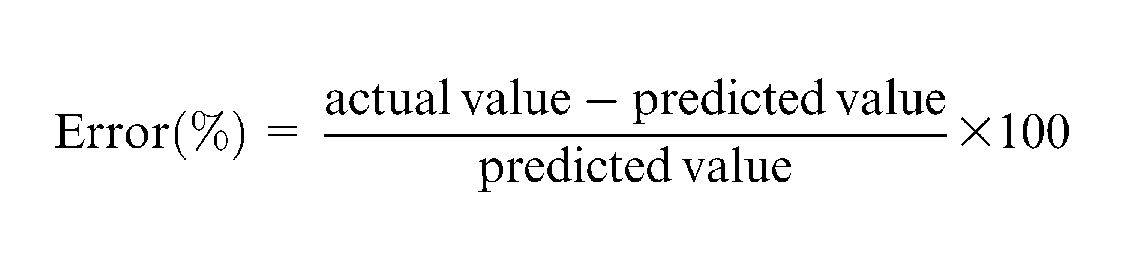
Confirmatory experiments were conducted using randomly selected welding parameters to validate the regression model and to ensure the repeatability and reliability of the predicted values (Table 6). Six random sets of weld parameters were selected and tested, as described earlier. From the experimental values, it has been observed that error (%) for each response is nearly 5% in almost all the experiments
Percentage error of predicted values and experimental values.
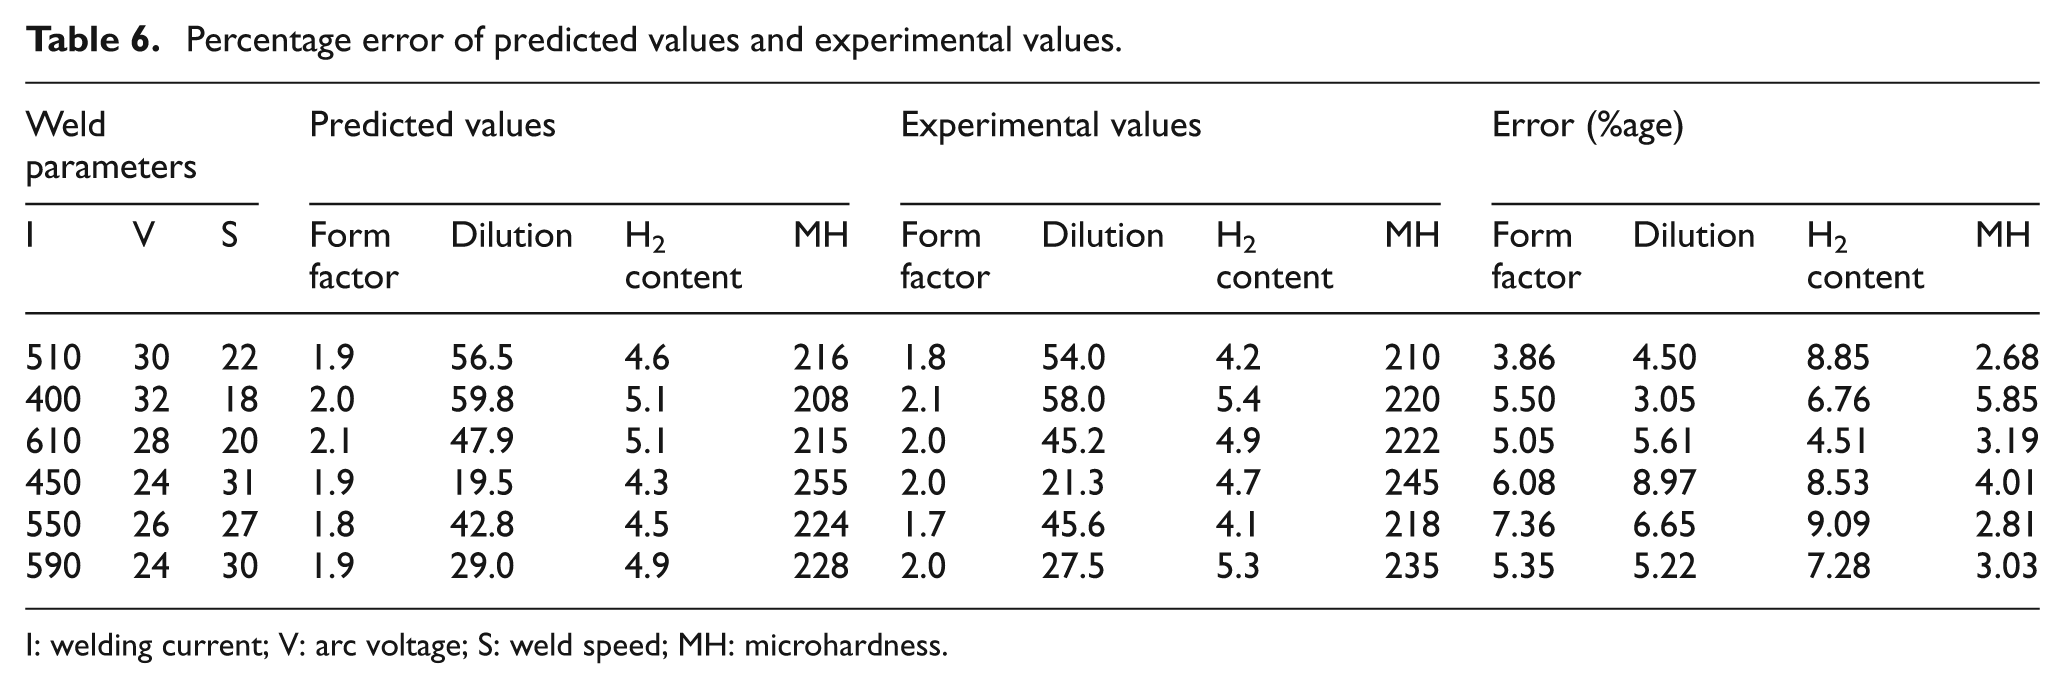
I: welding current; V: arc voltage; S: weld speed; MH: microhardness.
Conclusion
The following conclusions are drawn:
The prediction equations for weld bead form factor, dilution, microhardness and diffusible H2 content in terms of weld parameters, namely, current, voltage and weld speed, have been developed. These prediction equations may be readily used for getting desired weld properties in SAW of HSLA steel and other HSLA steels.
Difference between predicted values and experimental values of all the responses for weld metal is within significant range.
Among the selected parameters, welding current is the most significant parameter controlling all the responses.
Diffusible hydrogen content is affected by welding current significantly, whereas arc voltage and weld speed have little effect or no effect on this response.
Welding current has positive significant effect on dilution and diffusible hydrogen content, whereas it has negative significant effect on form factor and microhardness. Arc voltage has increasing effect on all the responses, namely, form factor, dilution and diffusible hydrogen except microhardness on which it has decreasing affect. Welding speed has significant positive effect on form factor and microhardness, whereas it has negative significant effect on dilution, and diffusible hydrogen content is not affected by this parameter.
Dilution and microhardness are affected by all the interaction terms but form factor is affected by interaction between current and voltage and interaction between current and speed.
Diffusible hydrogen content is affected by direct weld parameters but independent of interaction of welding parameters.
Footnotes
Appendix 1
The t-value and significance testing of regression coefficients for weld bead responses
| Coefficient | Term | Form Factor |
Dilution |
Diffusible H2 content |
Microhardness |
||||
|---|---|---|---|---|---|---|---|---|---|
| t0 | Significant or Not significant | t0 | Significant or Not significant | t0 | Significant or Not significant | t0 | Significant or Not significant | ||
|
|
I | −3.701 | Significant | −51.231 | Significant | 4.827 | Significant | 6.886 | Significant |
|
|
V | 0.629 | Not significant | 8.673 | Significant | −3.364 | Significant | −2.133 | Significant |
|
|
S | 3.137 | Significant | 59.135 | Significant | −3.741 | Significant | −5.569 | Significant |
|
|
I2 | 4.777 | Significant | 13.070 | Significant | −1.892 | Not significant | −1.616 | Not significant |
|
|
V2 | 7.300 | Significant | −15.733 | Significant | 6.670 | Significant | 1.163 | Not significant |
|
|
S2 | −1.245 | Not significant | −52.994 | Significant | 3.901 | Significant | 4.231 | Significant |
|
|
IV | −0.293 | Not significant | −20.272 | Significant | 1.586 | Not significant | 3.001 | Significant |
|
|
IS | −3.994 | Significant | −9.170 | Significant | −0.000 | Not significant | 2.902 | Significant |
|
|
VS | −6.990 | Significant | 25.117 | Significant | 0.486 | Not significant | −3.331 | Significant |
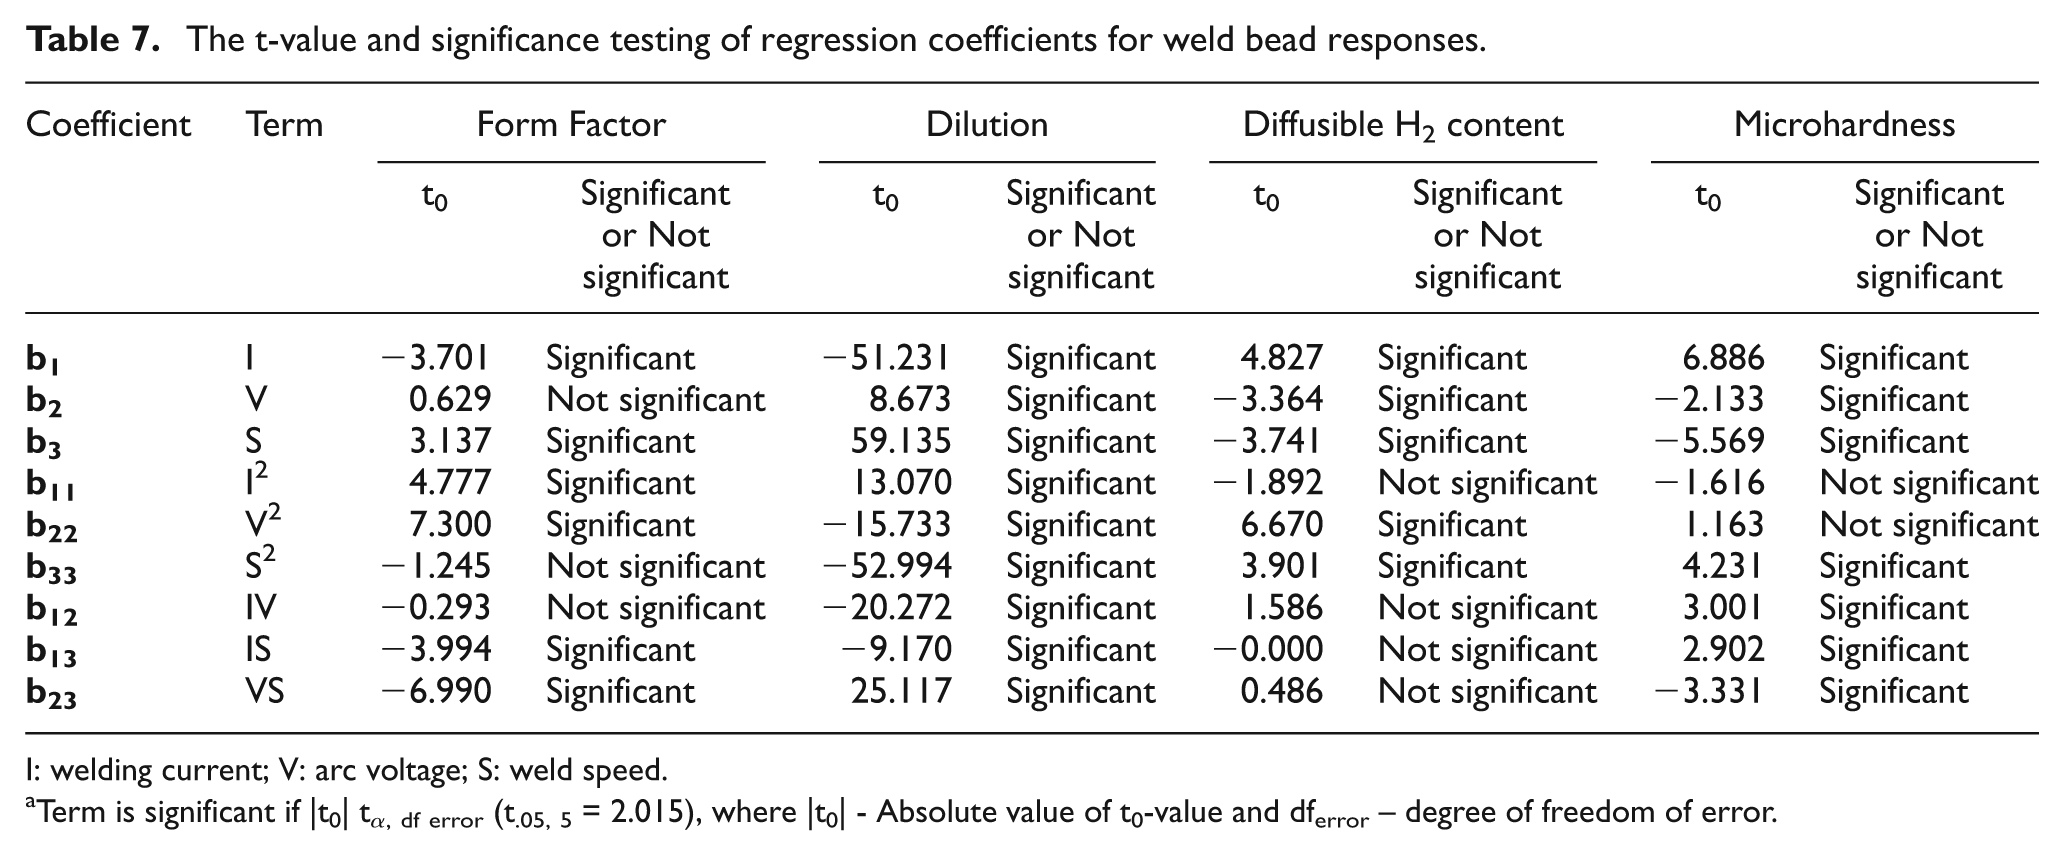
I: welding current; V: arc voltage; S: weld speed.
Term is significant if |t0| tα, df error (t.05, 5 = 2.015), where |t0| - Absolute value of t0-value and dferror– degree of freedom of error
Declaration of conflicting interests
The authors declare that there is no conflict of interest.
Funding
This research received no specific grant from any funding agency in the public, commercial or not-for-profit sectors.