
Abstract
For any welded component, the weld geometry is a determinative criterion that has a strong influence on the mechanical integrity of the joint. It is therefore important that the weld geometry is adequately considered when establishing the design of the component being welded. Based on the tandem submerged arc welding process, this study reports on an experimental and optimization investigation of the weld geometry characteristics such as bead width, reinforcement form factor and penetration shape factor. The selected process parameters were welding amperage and welding voltage, and these were initially investigated to determine their effect on weld geometry. From this, the results indicated that all developed models for these outputs predicted the behavior of the inputs with high precision. Thus, an optimal condition was established in which the penetration depth was maximized, and hence, a multi-response optimization was determined. Also, the conditions in which the weld reinforcement form factor (W/R) and penetration shape factor (W/P) were minimized are determined and validated.
Keywords
Introduction
In recent decades, longitudinally welded pipes have generally been used in different industries such as gas and water pipeline applications. However, the limitations in the production and forming procedures of large-diameter pipes (up to 1.4 m) have been restricted by the availability of certain manufacturing processes. Hence, for the successful manufacture of such pipes, a continuous spiral process of metal plate has been used for the formation of the pipe, allowing the spirally wound plate edges to be welded by submerged arc welding (SAW).1,2
SAW is regarded as a high-quality welding process in pipe mill technology due to several advantages including high deposition rate, deep weld penetration, high traverse speed and the non-dependency for highly skilled operators.3,4
The mechanical properties of the weld deposit depend, to a large extent, on a number of factors including weld geometry, and this is dictated by the weld bead width, depth of penetration and reinforcement form factor. 5 The weld geometry is essentially controlled by the normal welding parameters.6,7
Narang et al. 8 used multi-factor analysis for the prediction of the tandem SAW performance. They observed that bead width was more dependent on the values of voltage and traveling speed than other input parameters. Narang et al. 8 also established that the heat-affected zone (HAZ) was more sensitive to the welding speed and only slightly affected by the weld current variation. Furthermore, it was also observed that the depth of penetration, bead reinforcement and width of the HAZ were based on the variation in plate thickness.
In general terms, increasing the penetration depth, bead width and weld reinforcement is related to the magnitude of heat input to the weld zone. For example, a high heat input generally results in a large molten metal pool in which the fusion zone and penetration area will increase. Nevertheless, the penetration efficiency in tandem SAW, where there is a high heat input level, is smaller than the single-wire process. 9
Murugan and Gunaraj investigated the effect of the arc voltage, wire feed rate, welding speed and nozzle-to-plate distance on the weld geometry in a single-wire SAW study. Their findings indicated that the voltage does not influence penetration and negatively diminishes the reinforcement. In contrast, however, it positively affects the bead width and penetration size factor. 7
Datta et al. studied the influence of the weld current, the mixture of fresh flux and fused flux and basicity index upon HAZ and bead geometry. They demonstrated that the welding current has a positive role in the overall weld reinforcement area and penetration. 10
In industrial applications of SAW, two feed wires are often used in tandem as this arrangement yields greater deposition rates than the single-wire arrangement. The tandem wires are independently controlled so that the lead wire is connected to a direct current (DC) +ve power supply and the trail wire is connected to an alternating current (AC) power supply. Because of simultaneous depositions of the wires in one weld pool, the tandem SAW brings the ability of more volume of joint filling and reduction of overall heat input. In a recent study by Kiran et al., it was reported that the nominal geometric features of the weld (width and height) are affected by the trail wire current, more so than the other parameters. In addition, the lead wire was found to control the penetration depth. 11
In tandem SAW, the final bead width and reinforcement height are primarily influenced by the trail wire current; by expanding the weld pool size and tends to decrease the cooling rate. Also, the penetration depth is affected by the lead wire amperage with the other conditions remaining fixed. 12
This study aims to consider the influence of weld parameters, such as the lead and trail wire amperage and voltage, on the weld geometry. This will be achieved by conducting a series of experimental tests in real industrial conditions. An optimization study will then be performed on the weld features allowing the most desirable and optimal parametric settings to be determined.
Experimental procedure
One of the pipe mill technologies is the online spiral method. In this process, steel coils are simultaneously spirally welded (internally and externally) to form a large-diameter cylinder. Figure 1 details how the SAW torches are positioned relative to the cylinder, where the angular positioning of the torch is directly measured from the machine setting.
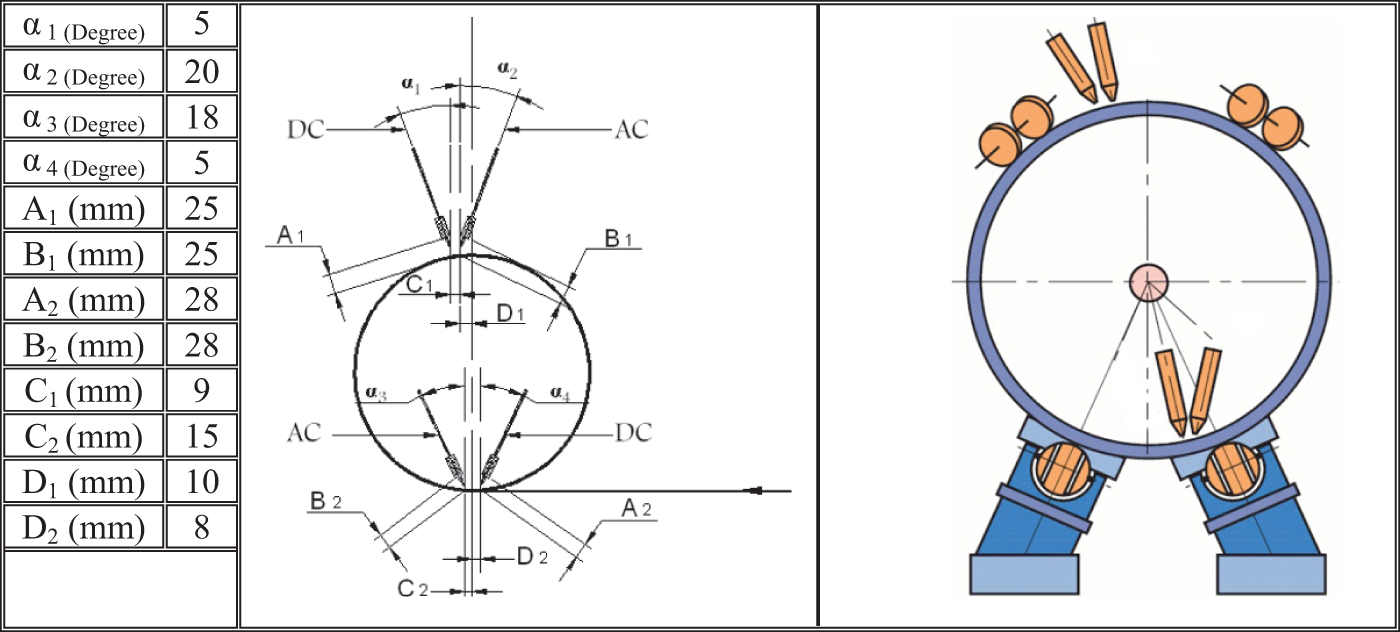
Details of arrangement for lead and trail wires.
In this research, an online spiral machine made by HOESCH Co. (Germany) was used throughout the experimental program. This equipment is able to produce the spiral-welded pipes with various diameters from 460 to 2000 mm with widespread grades of material within St37–X60.
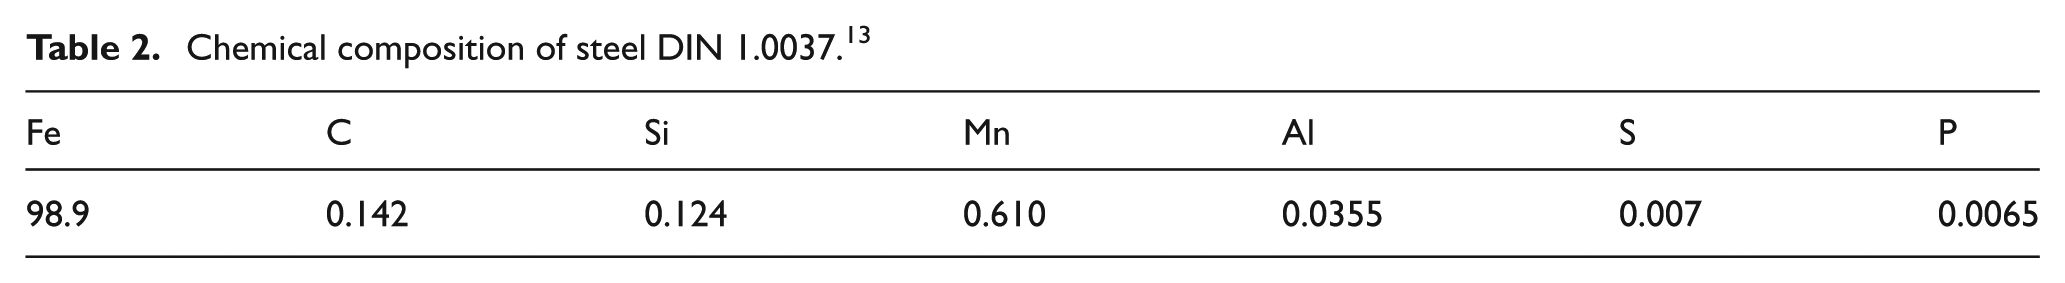
Table 1 shows the weld parameters used on the outer circumference of the pipes. These parameters are the controllable factors of the machine that were used during the experimentation. The actual levels of the parameters were transformed as −1, 0 and +1, so that they refer to low, intermediate and high levels of the real parameters, respectively. The −2 and +2 values denote the star points of response surface design. Table 2 shows the chemical composition of the parent material, 13 which was 10 mm thick and 1.4 m in diameter. The external weld consisted of a single-V-groove butt joint with a 1 mm root gap. Table 3 details the specification of the weld filler material and flux.
Input parameters and their limits.
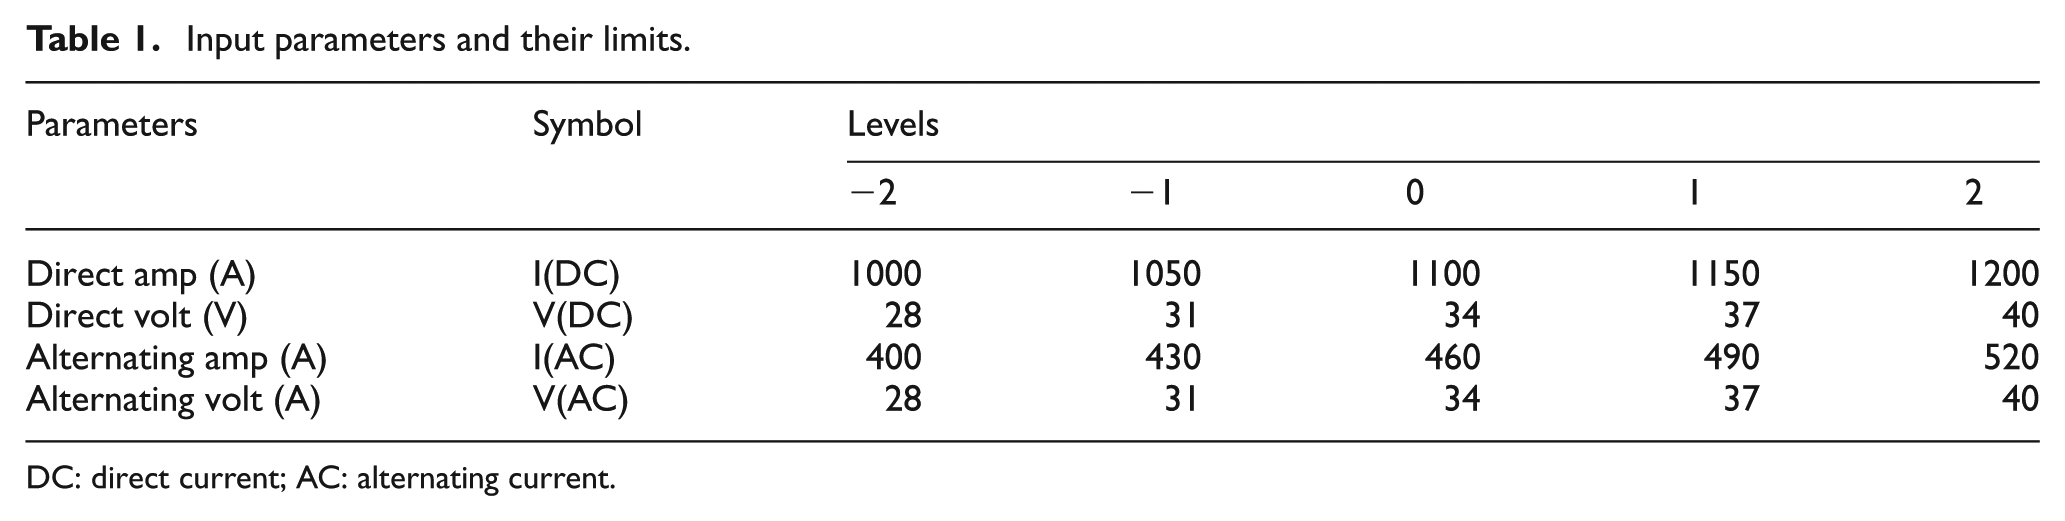
DC: direct current; AC: alternating current.
Chemical composition of steel DIN 1.0037. 13
Specification of the wire and flux used inside and outside welding.

SFA: specification of filler analysis; AWS: American Welding Society.
Here, the selected variables for the process are the current and voltage of the wires that they could change as AC and DC. The values of these parameters were adjusted on the machine according to the parameter treatments expressed in Table 4. These treatments are provided by the standard response surface methodology (RSM). This experimental technique offers 31 parameter combinations as outlined in Table 4. The parameter combination used in this study is a central composite design (CCD) plan in which all parameters are symmetrical over three levels. The parameter boundaries are positioned out of their nominal limits that are called star points idiomatically. The existence of star points leads to spherical property of design space that brings high quality of model prediction within experiment boundaries. 14
The values of experimentations.
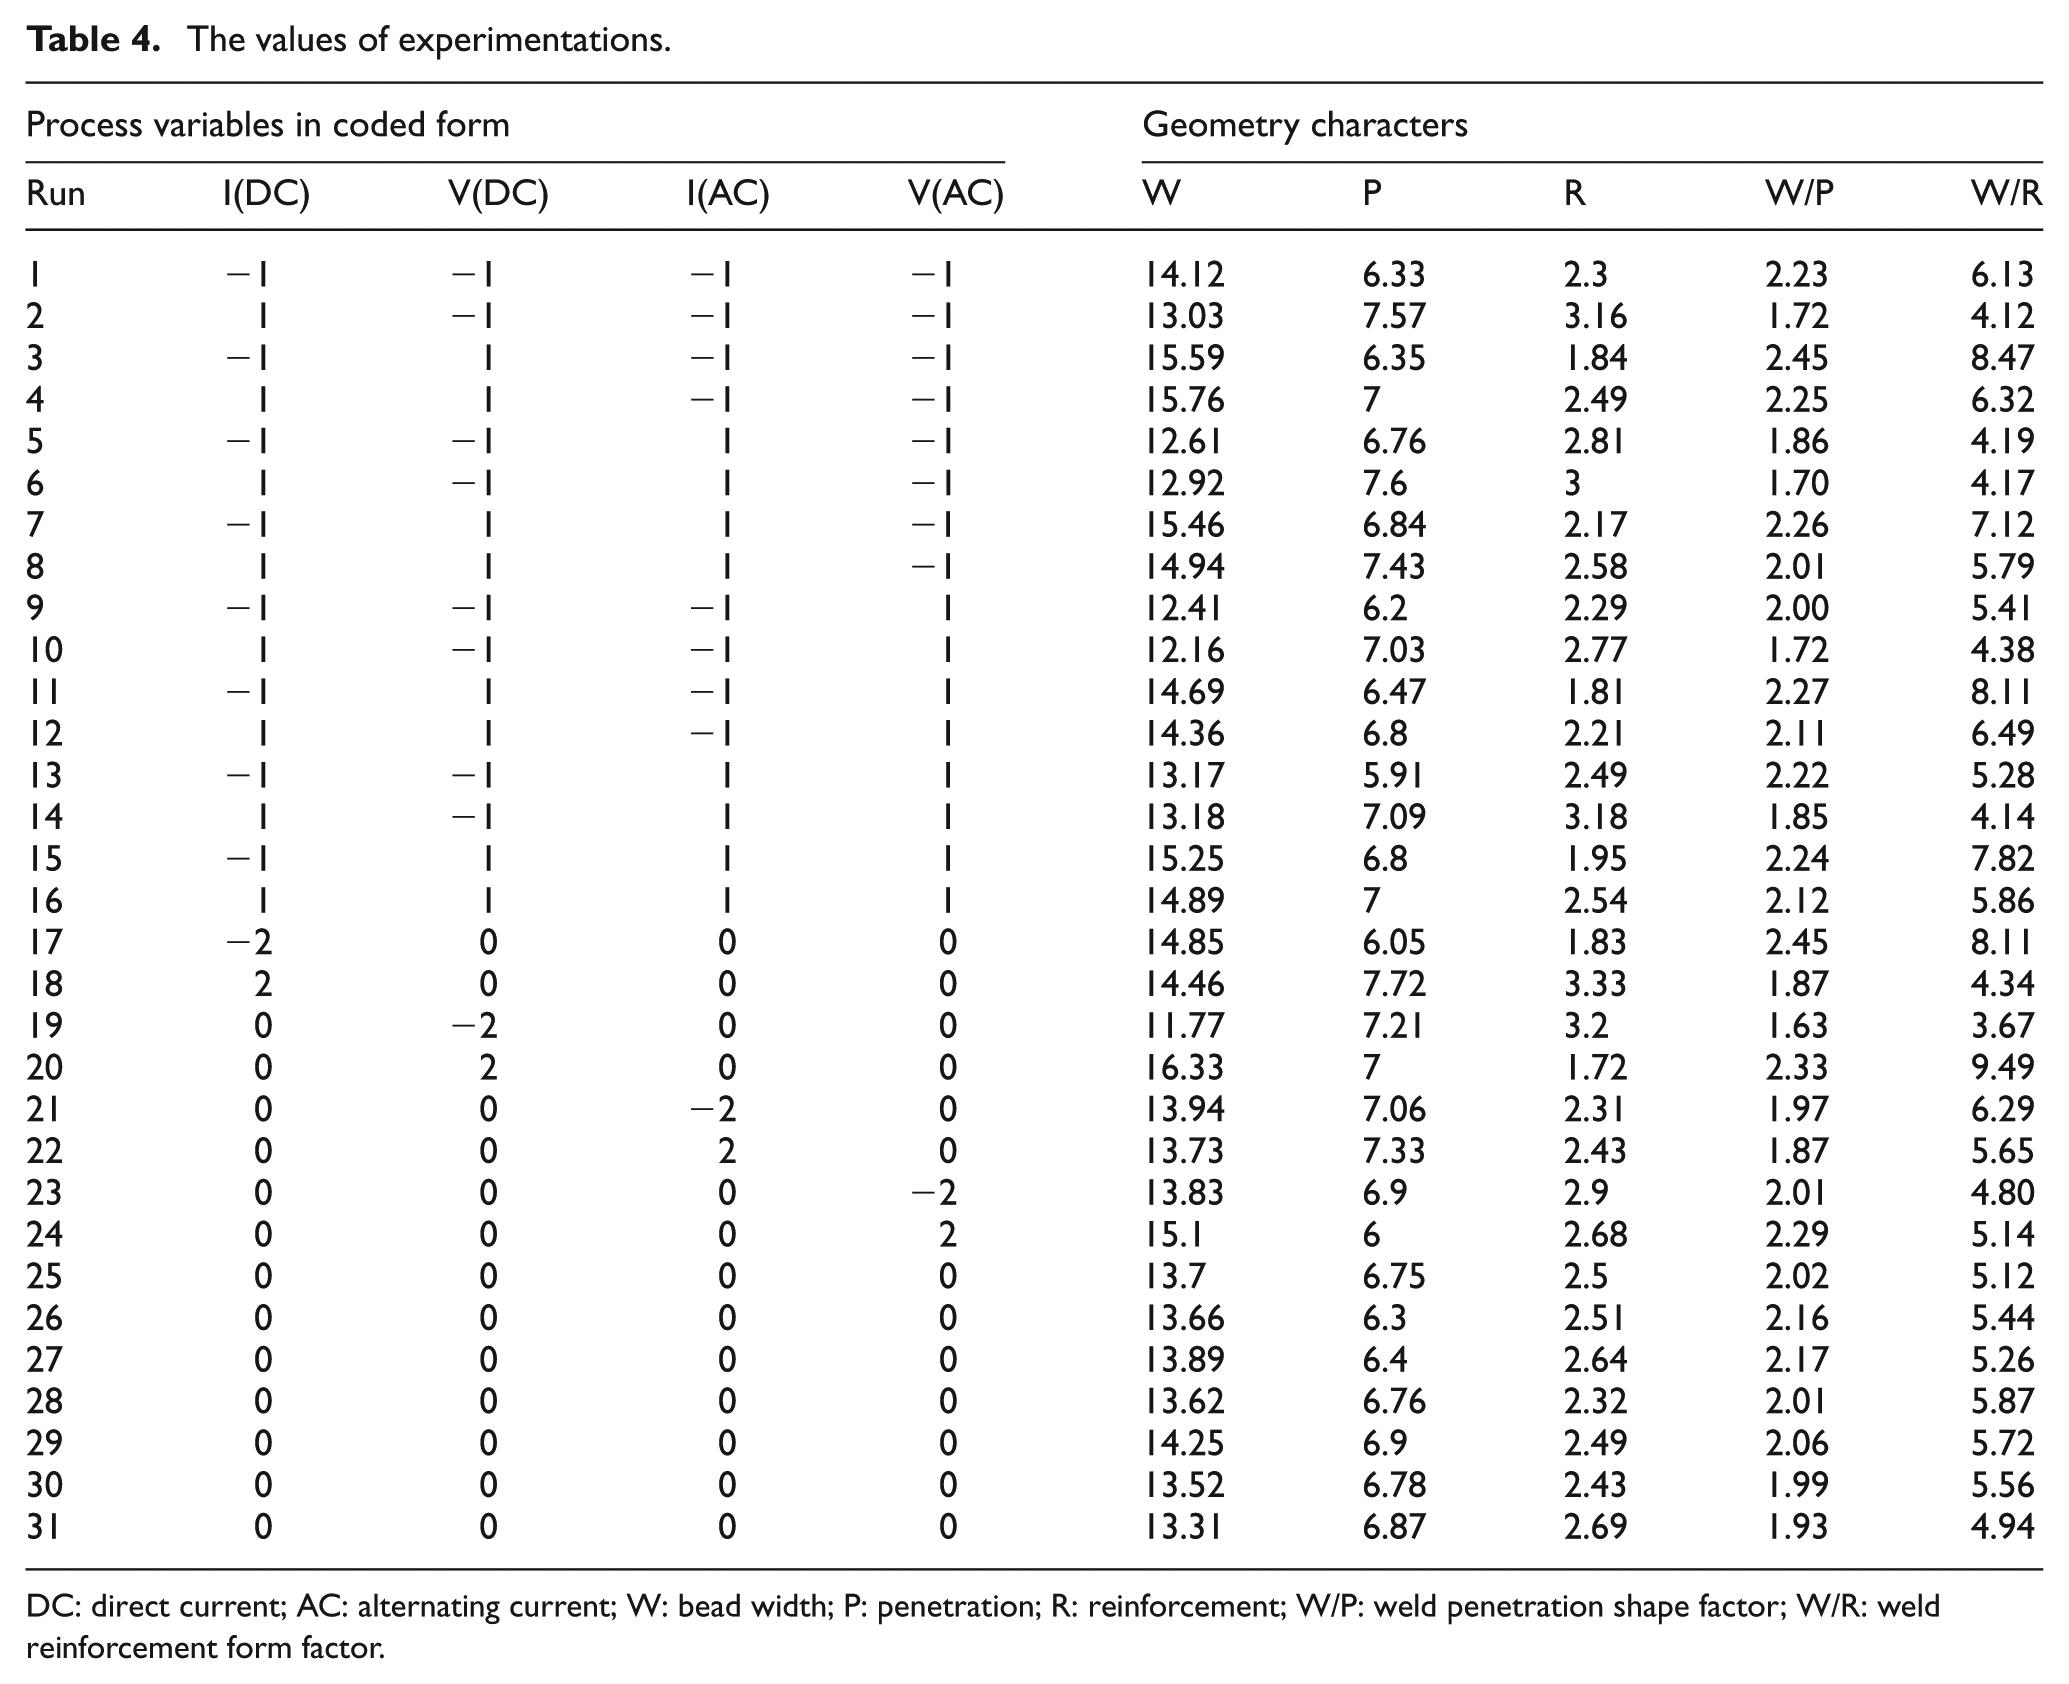
DC: direct current; AC: alternating current; W: bead width; P: penetration; R: reinforcement; W/P: weld penetration shape factor; W/R: weld reinforcement form factor.
In all of the tested samples, the travel speed remained constant at 1.75 m/min. The current values for tandem wires were fixed during welding and (lead and trail) they were equal to 800 and 700 A, respectively. Also, the voltage values were (lead and trail) equal to 35 and 32 V, respectively. The specimens shown in Figure 2 represent cut-off segments from the welded pipes. These were used to allow the related weld geometries to be measured for each sample. The measurement values obtained from bead width (W), penetration (P) and reinforcement (R) as primary responses are shown in Table 4. These data were obtained with the aid of optical microscopy. The pattern used for data measurement is shown in Figure 2(b). The image analyzer package was utilized to measure the geometry features from micrographic images with a high level of accuracy.
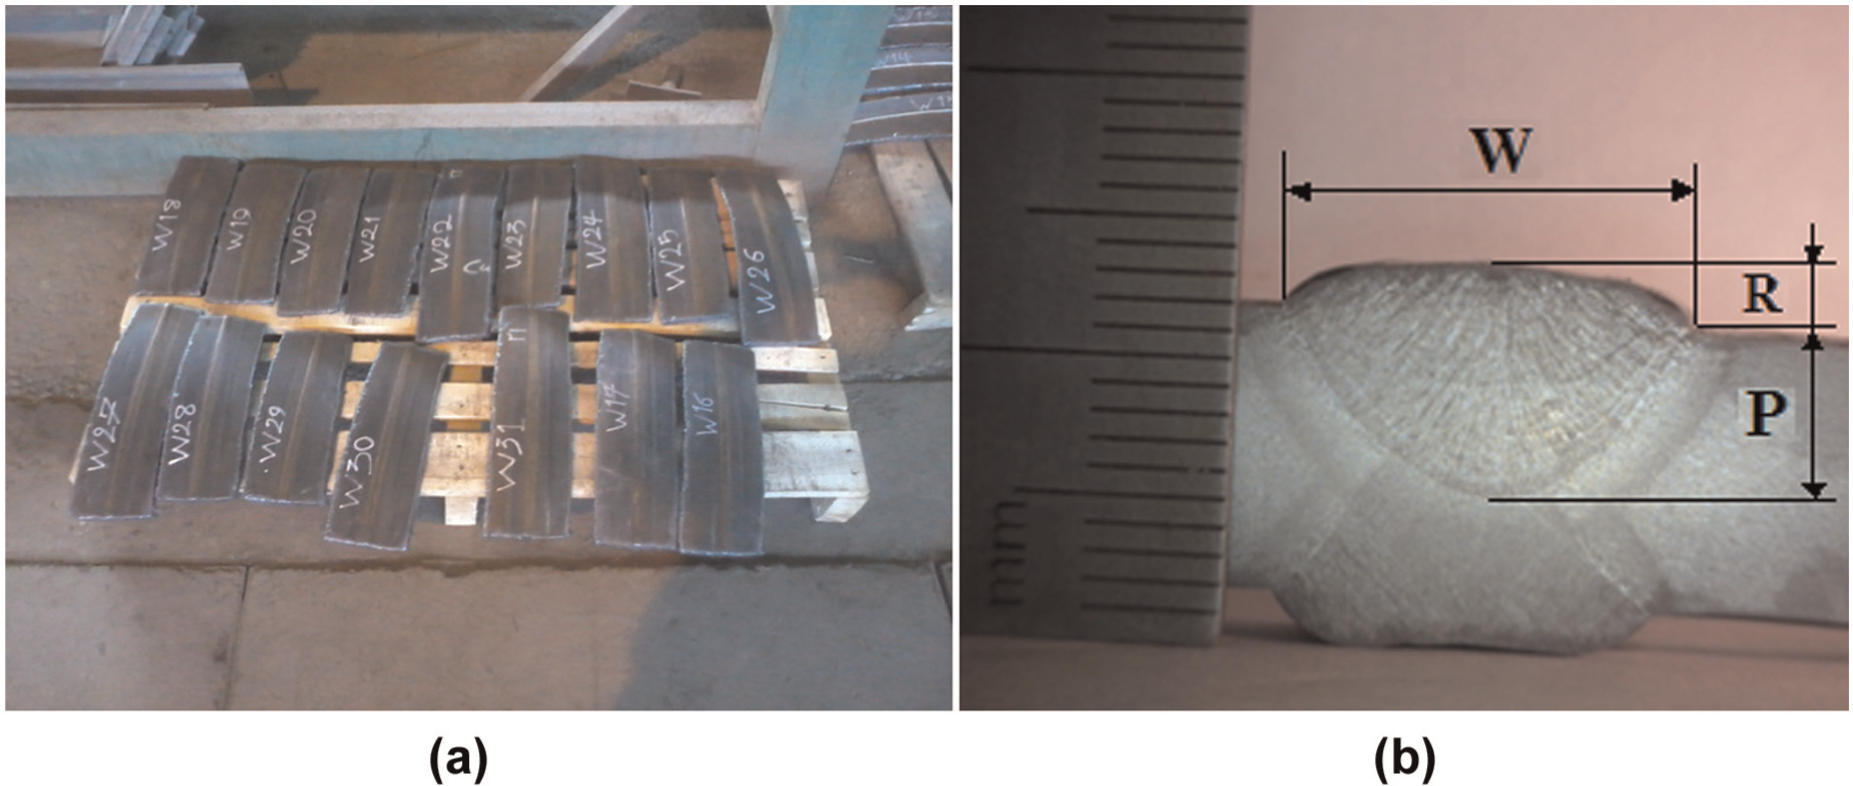
(a) Sectioned samples and (b) typical weld cross section.
The weld bead width was measured as the width of the fusion zone on the top surface of the sample. The penetration was measured as the depth of the fusion zone from the top surface of the specimen. The reinforcement height was measured as the height of the weld deposition above the top surface of the base plate. 12
Data processing
Direct effects of process variables on the responses
To evaluate the influence of the process parameters, the main effect diagrams were used (Figures 3–6). These diagrams show the output variation with changing input values. In the single-wire process, the weld width, reinforcement and penetration are seen to increase when I(DC) increases. 15 For tandem SAW, at first, the increase in I(DC) decreases the bead width, but when the values of this parameter increase, the bead width slightly increases (Figure 3). In fact, there is a critical point for the amperage effect (approximately 1100 A), in which as the amperage increases, the delivered deposition rate is slightly greater than before. This effect was also identified by previous work. 16
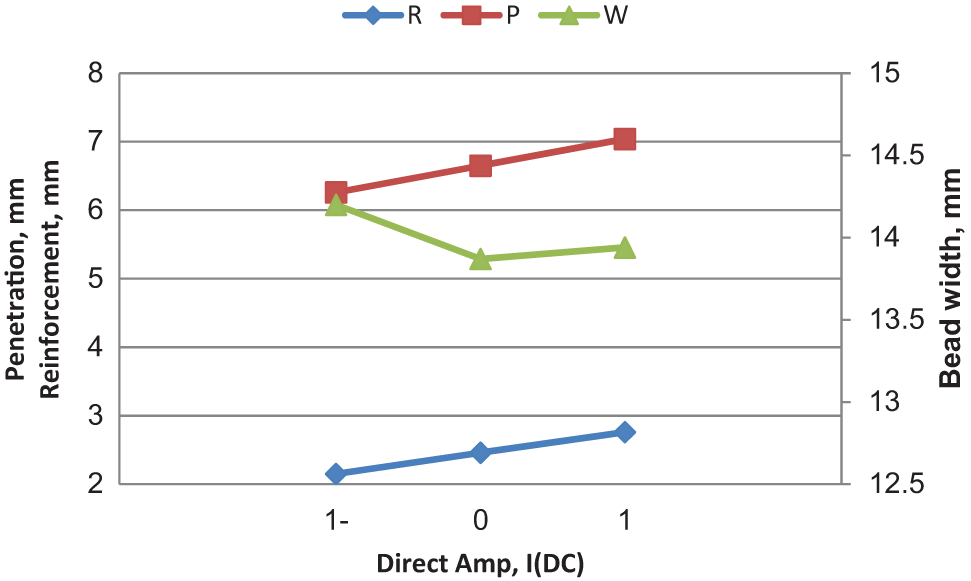
Effect of I(DC) on penetration, reinforcement and width.
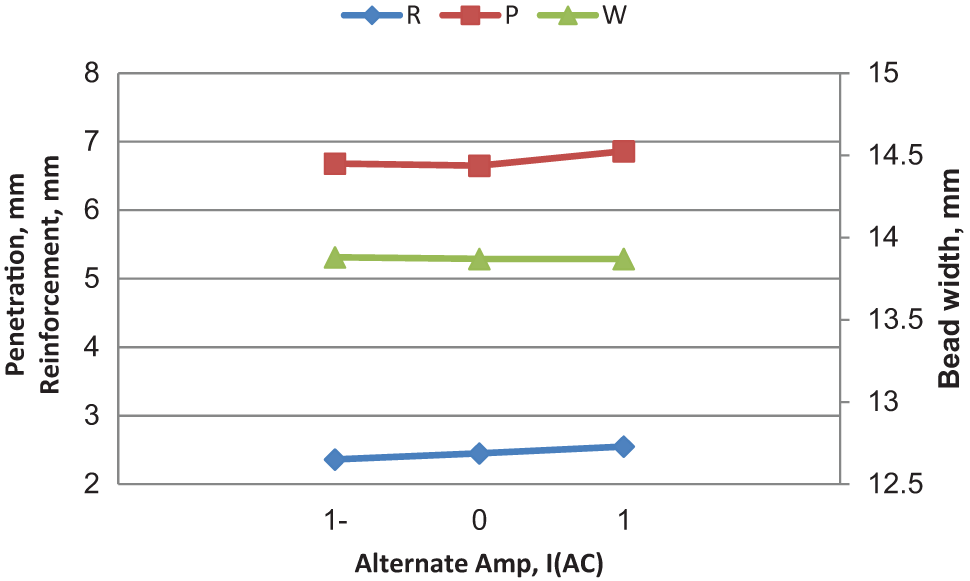
Effect of I(AC) on penetration, reinforcement and width.
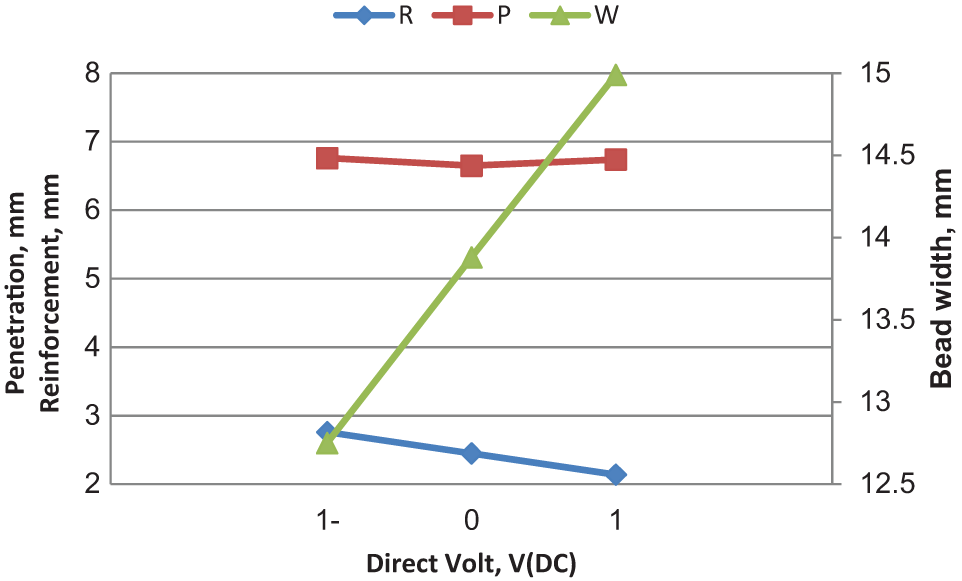
Effect of V(DC) on penetration, reinforcement and width.
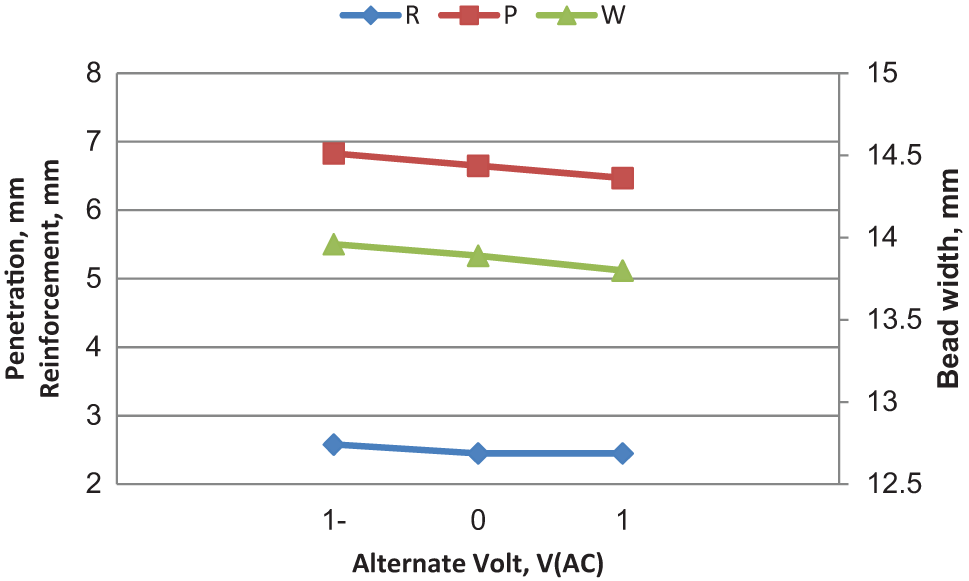
Effect of V(AC) on penetration, reinforcement and width.
Figure 4 displays the effect of I(AC) on bead width, penetration and reinforcement. Here, there is an obvious difference between the I(AC) diagrams and I(DC). In Figure 4, the increasing rates for the penetration and reinforcement related to I(AC) are far less than I(DC) diagrams in Figure 3. This indicates that the lead wire performs a vital role in penetration and reinforcement in tandem SAW. As before, this effect has previously been verified. 17 On the other hand, the variation of I(AC) did not improve the width output which remained constant.
It can be seen from Figure 5 that V(DC) has the greatest impact on the bead width response. In fact, it is possible to manipulate the bead width by modifying the arc voltage. The control of the arc voltage administers the arc formation. With increasing V(DC), the weld geometry experiences low reinforcement and increase in bead width, whereas the penetration nearly remained steady.
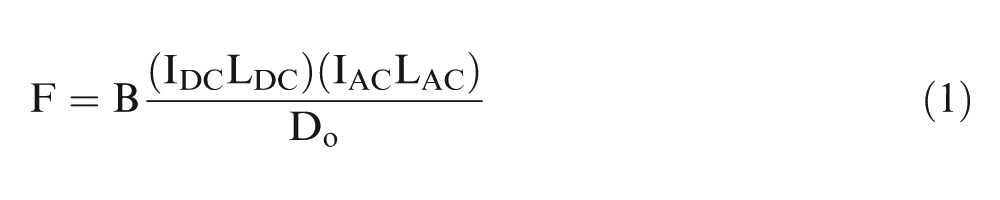
In a profound inspection of the tandem wire process, it is very important to consider the interaction between I(DC) and I(AC). In tandem SAW, the existence of two arcs in close proximity to each other, one with DC and another with AC, generates a reciprocating external force which is explained in Figure 7. This force F is generated by magnetic fields that surround the wires. Its magnitude can be calculated by equation (1) as follows 3
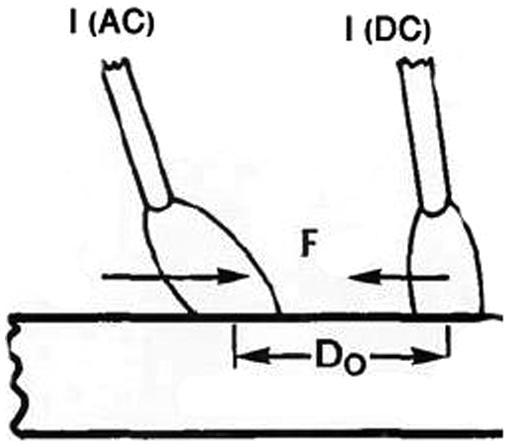
Forces resulted from the interaction between magnetic fields.
where B is a constant and LDC and LAC are the arc distance for lead and trial wires, respectively.
To determine the effect of this force on welding arc, it is possible to apply the comparison used by Uttrachi and Messina 3 in which the F behavior was considered as an external force of a spring. This correlation can be expressed as follows
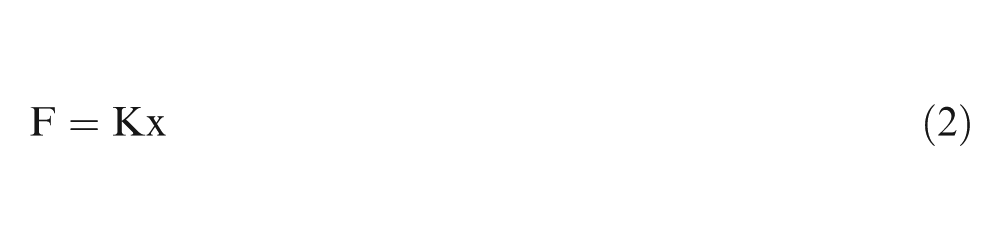
Bachelies found out that K coefficient will be calculated based on relation (3)
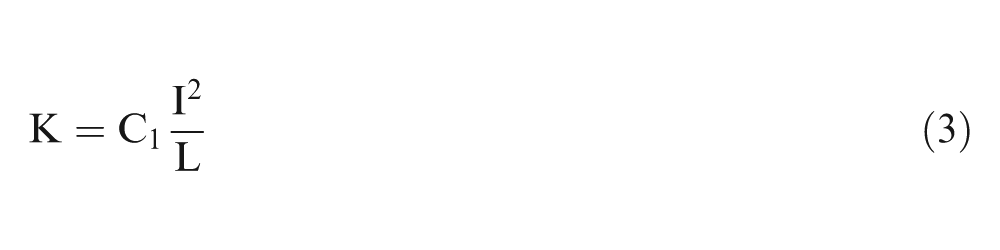
Therefore, the arc stiffness is proportional to square of the ampere divided to arc length. The arc produced by the AC wire is more unstable than that produced by DC wire, and this instability exacerbates when I(AC) is lower. With respect to equation (3), the arc stiffness weakens when the arc length increases. So, in such low-current and high-voltage conditions, the arc is inclining to rear and the surface adhesion phenomenon occurs in melting pool that a bulk of the melt will be moved back. This causes the weld bead to form with smaller dimensions with increase in V(AC) (low-level I(AC) and high-level V(AC) as shown in Figure 6). However, as seen in Figure 8, at high levels of I(AC) in which arc force is suitable to propel the melt by direct wire, 3 the development of alternating voltage extends the bead width.
The effect of I(AC) × V(AC) on bead width.
The arc length growth relative to the voltage increase does not provide a strength arc, and finally, it makes penetration lesser in size. 18 Although this phenomenon can be obviously seen about the trail wire, the voltage variations in lead wire have no negative power on weld penetration because of high ampere levels and arc stiffness.
Model development
Statistical analysis was performed on two welding qualities, namely, the weld penetration shape factor (W/P) and the weld reinforcement form factor (W/R). The data of Table 4 were used for the analyses, and the results are presented quantitatively and graphically. To ensure proximate fitting by a quadratic model, the effectiveness of regression, testing of model coefficients and evaluation of lack of fit (LOF), analysis of variance (ANOVA) method was used. The principles of this method are constructed on the independence and uniform distribution of errors. 14
Tables 5 and 6 show the analysis results for W/R and W/P responses, respectively. The “p” statistics signifies that the terms with p < 0.05 are effective in process output with more than 95% probability, and these terms can appear in the regression relation of relevant output. To eliminate insignificant terms with p > 0.05 from ANOVA, the backward elimination process is used here.
ANOVA results for W/R.
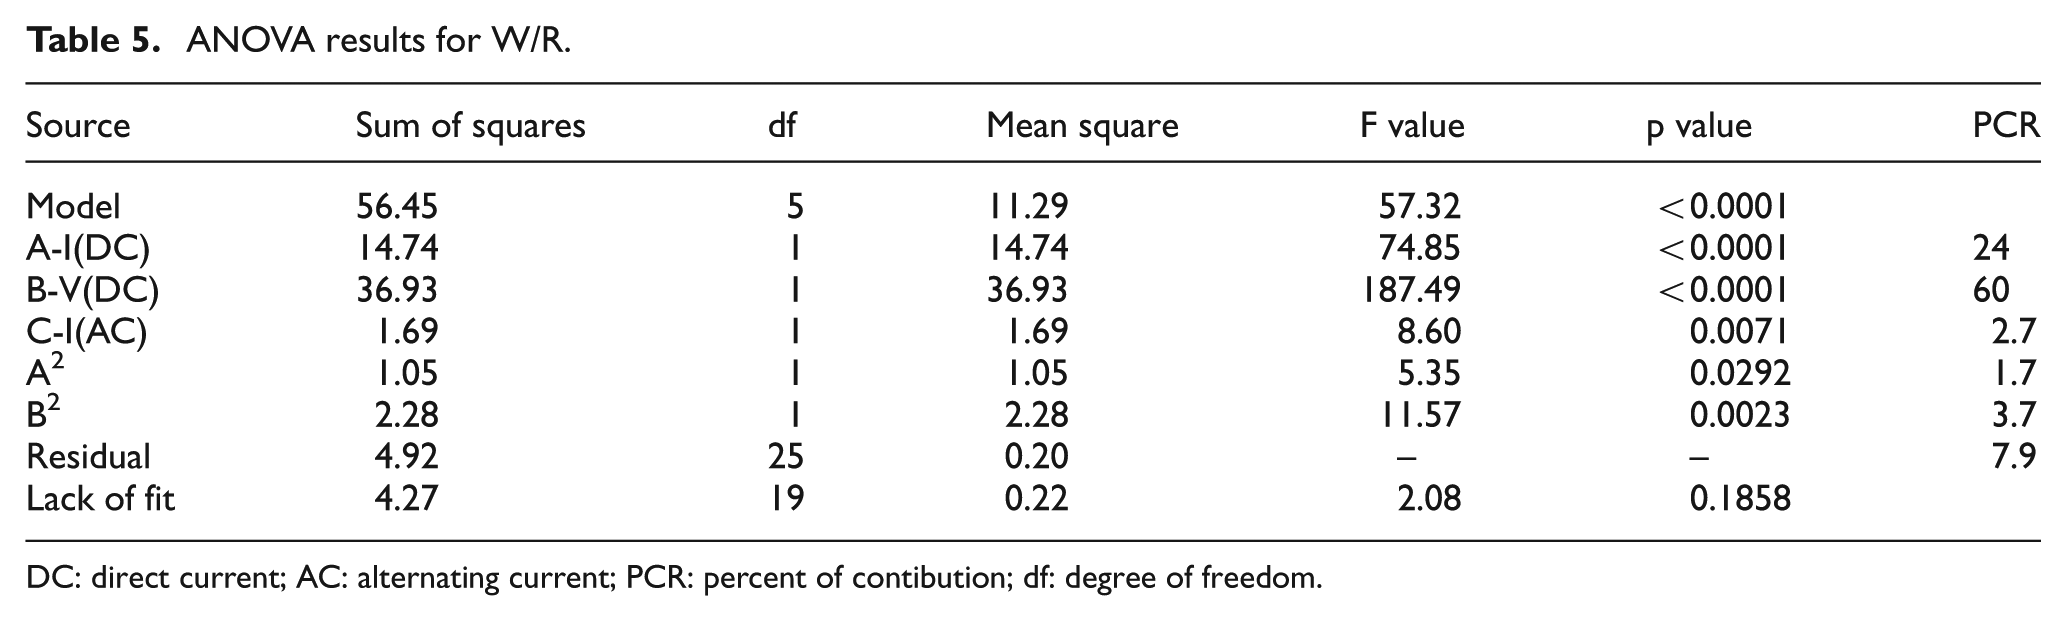
DC: direct current; AC: alternating current; PCR: percent of contibution; df: degree of freedom.
ANOVA results for W/P.
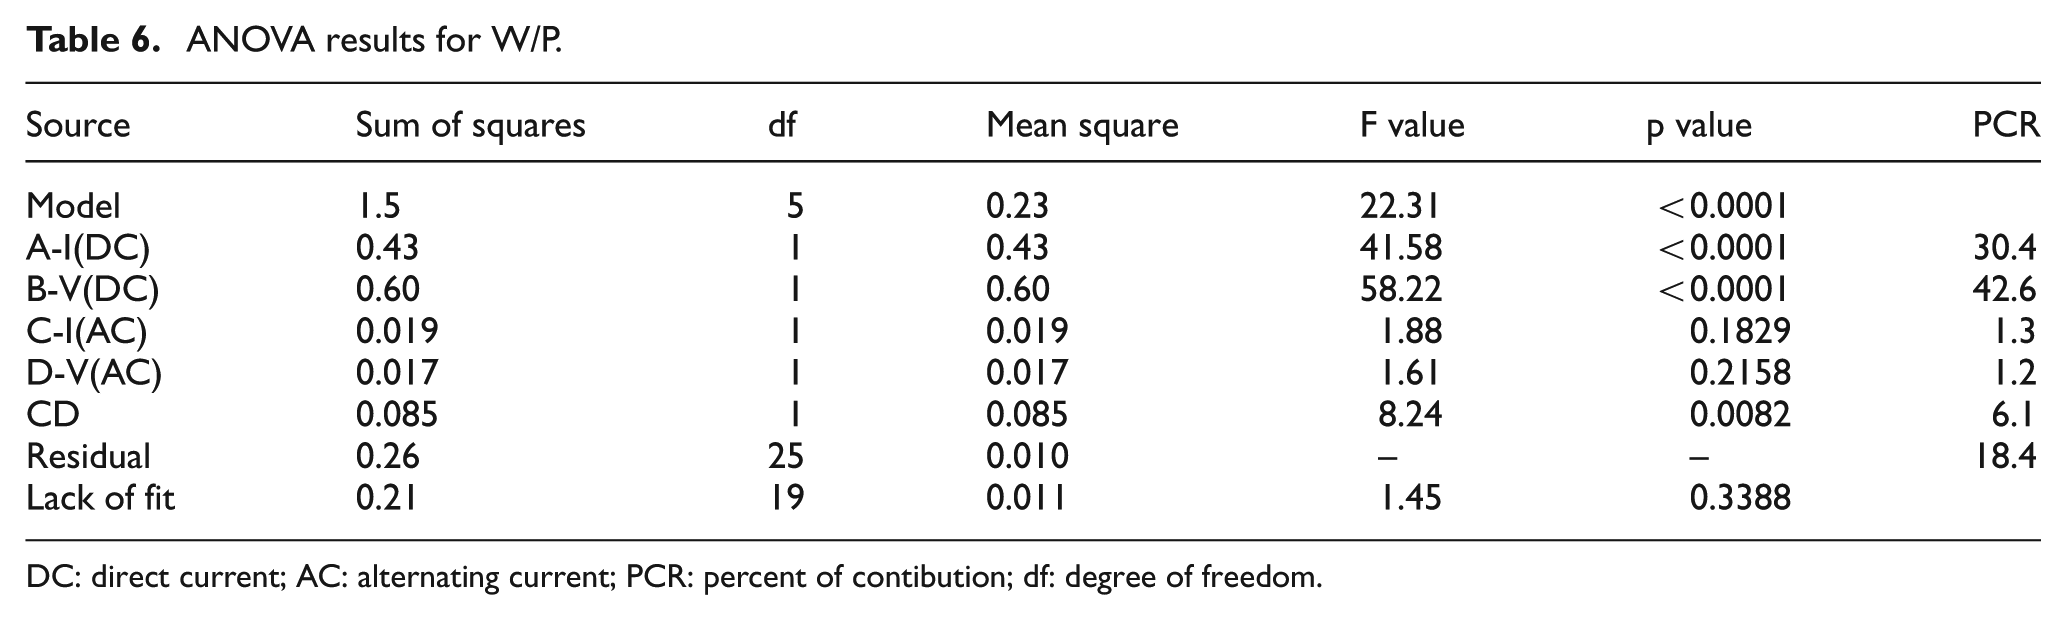
DC: direct current; AC: alternating current; PCR: percent of contibution; df: degree of freedom.
According to percentage of contribution (PCR), the largest portion in W/R is related to I(DC) and V(DC). The effects of these parameters are shown in Figure 9 as graphic art. As it is mentioned before, development of DC accompanied by greater deposition rate makes weld reinforcement greater although it does not influence bead width. This means that by the increase in the current, the W/R ratio decreases (Figure 9). Otherwise, W/R increases with reference to the increase in bead width and decrease in reinforcement that are resulted from V(DC) development.
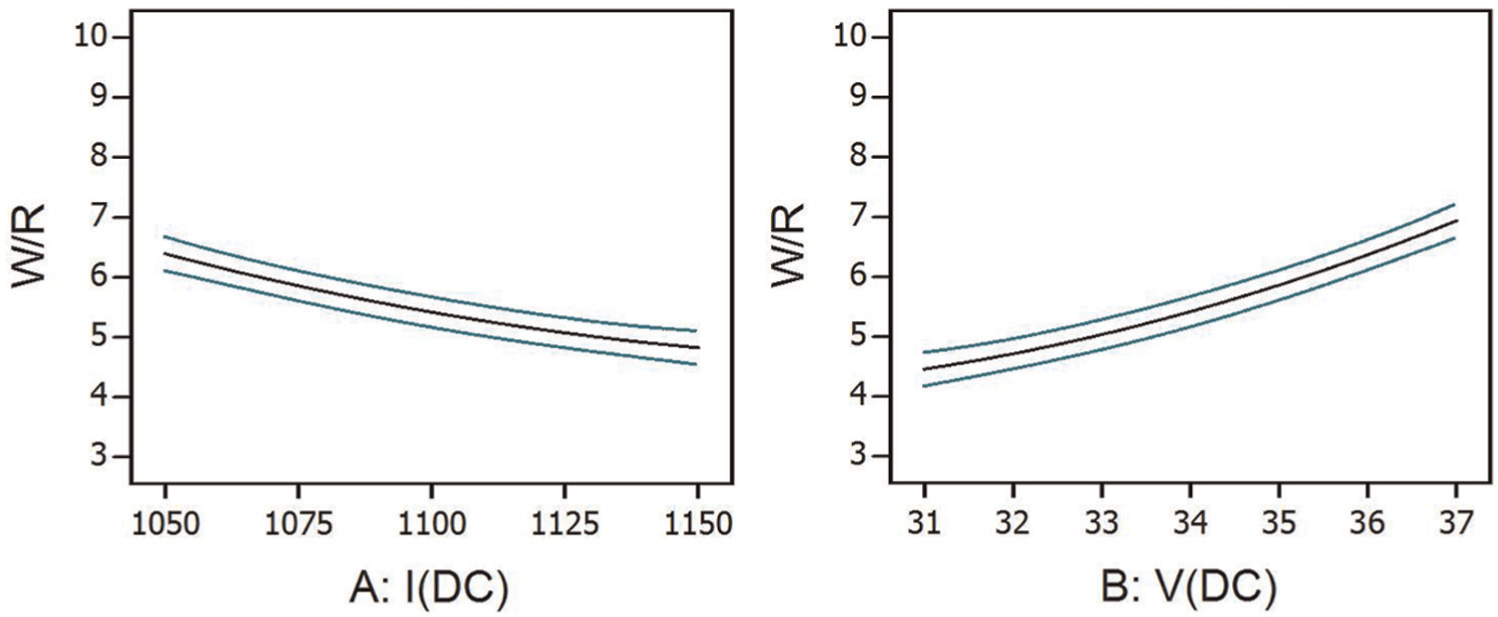
The effect of inputs on W/R.
By considering p values in Table 6 and also Figure 10, it is observed that V(DC) and I(DC) have the greater effect on weld penetration shape factor. The high levels of V(DC) have led to higher W/P because in this situation, the generated weld has insufficient penetration and high amount of bead width. The effects of I(AC) and V(AC) parameters are similar to I(DC) and V(DC) but with a slight difference such that the former parameters affect W/P with gentle gradient. The rise in I(DC) leads to expansion of penetration, while bead width does not experience any significant change. So, W/P has reduced.
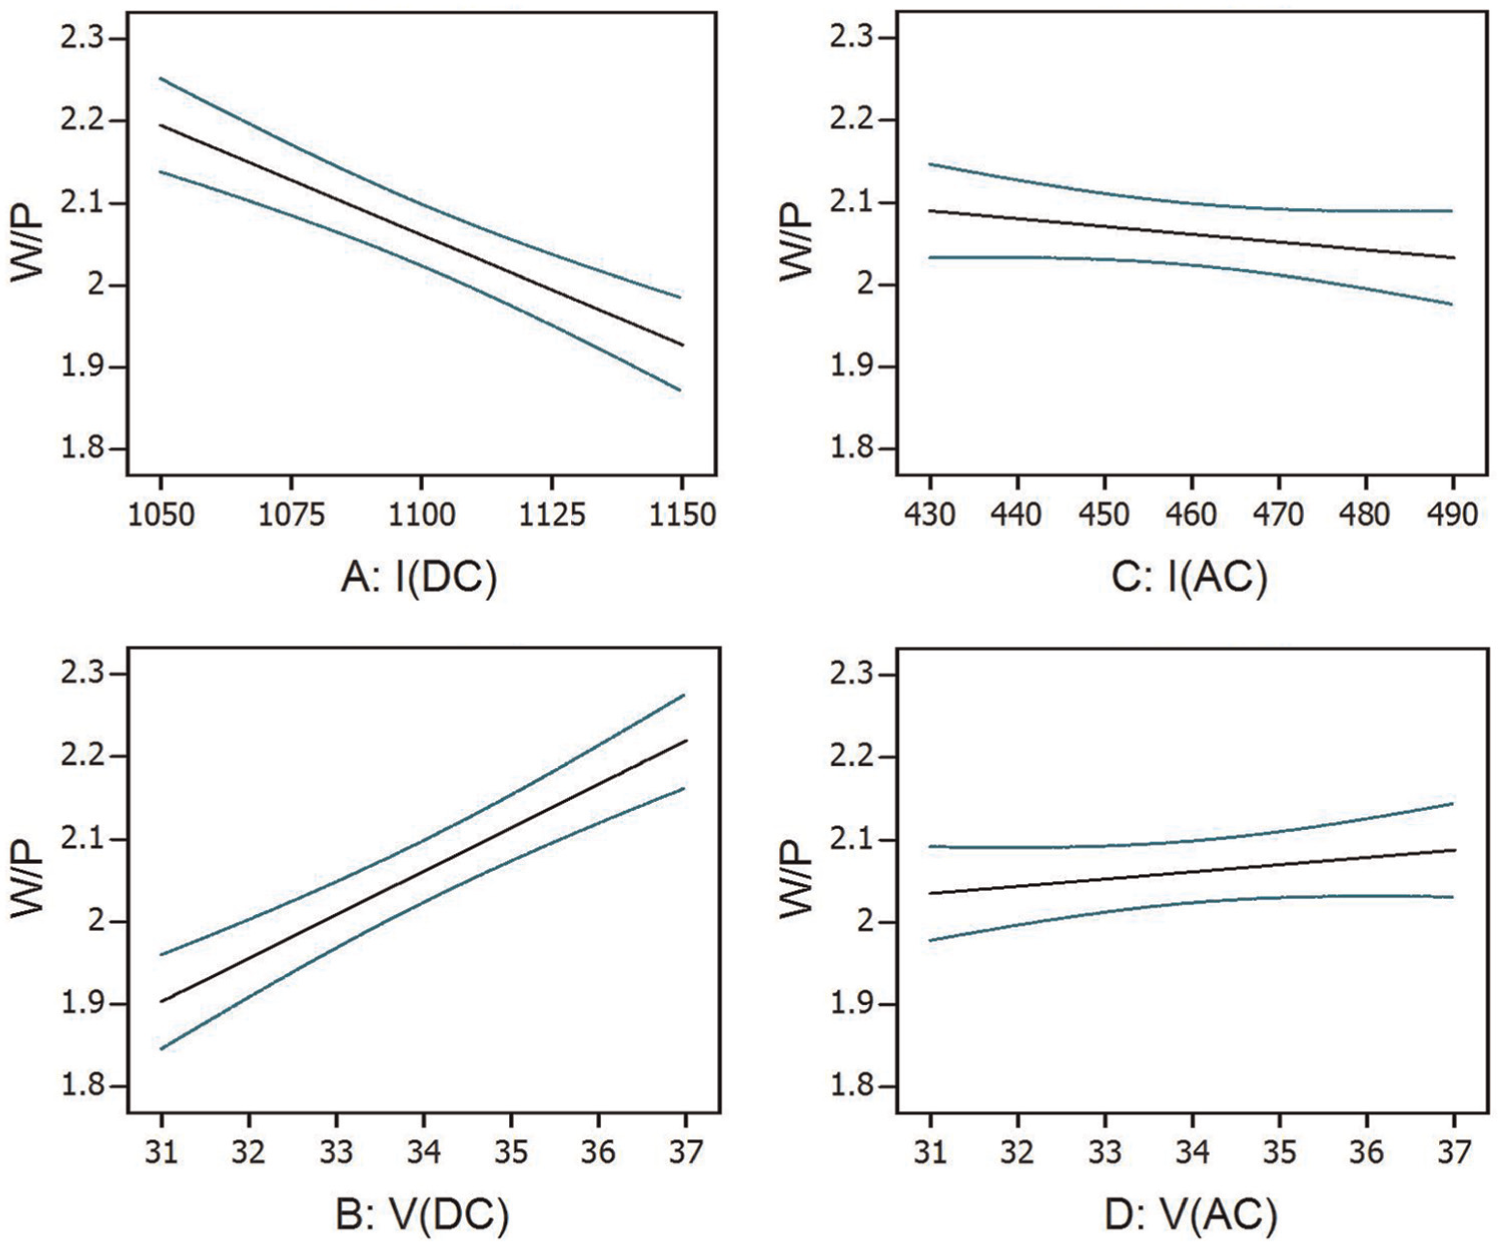
The effect of inputs on W/P.
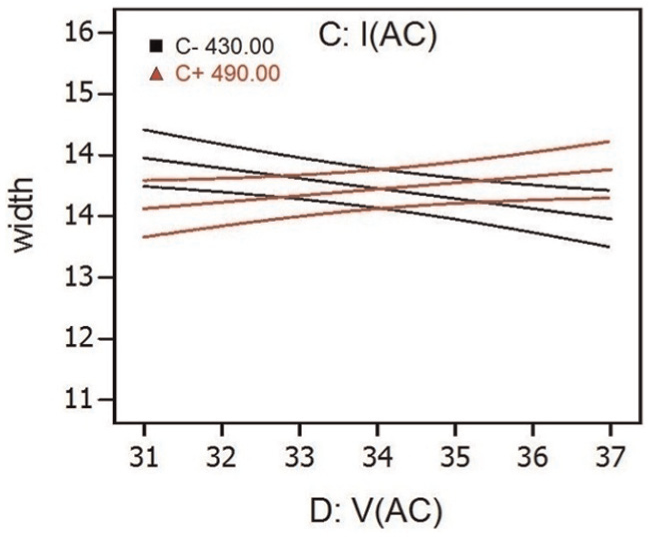
In Figure 11, it is clear that W/P is completely affected by interaction terms of I(AC) and V(AC). In fact, because of short produced arc and minimum heat concentration caused in low levels of V(DC), the increase in I(AC) leads to more penetration depth. Meanwhile, at the high level of V(AC), the weld width increases when I(AC) increases.
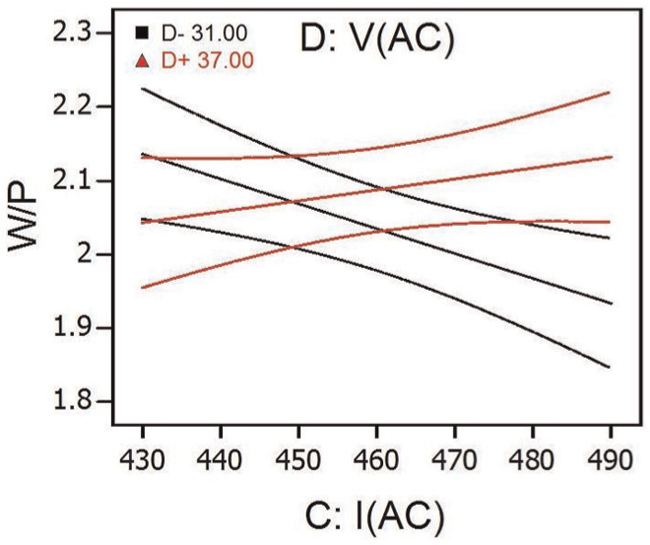
The interaction effect of I(AC) × V(DC) terms on W/P.
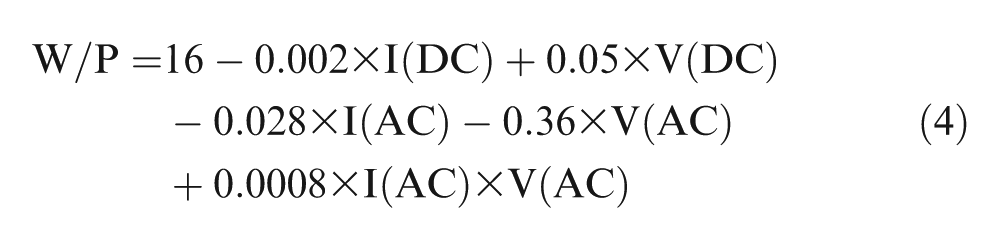
When the LOF statistics in ANOVA tables becomes insignificant, it means that the related model is trying to fit data completely. The models of W/P and W/R characters are expressed by equations (4) and (5), respectively. These relations are obtained after the elimination of insignificant terms from the analyses.
The ability of a model for covering all considered parameters is defined by mean
Model adequacy statistics.
W/P: weld penetration shape factor; W/R: weld reinforcement form factor.
Optimization
A multi-response optimization problem leads to provide a set of solutions proportional to the experiment goals. This section is an optimization solution which has concentrated on three responses W/P, W/R and R to access a satisfactory geometry in practical tandem SAW. The final attractive achievement is the suggestion of the best parameter setting in order to achieve a certain range of R and minimum W/R and W/P. The limits of R response are suggested based on AWSD1.1 Standard 19 which says it is necessary to keep the reinforcement under 3 mm in the upper dimension.
Desirability function is an efficient method in solving RSM multi-characteristics. It uses a transform function D(x) that converts values of real observations to a non-dimension scalar di. The values of di generally alter from 0 to 1 where 0 denotes unacceptable case and 1 represents the ideal state. Composite desirability is the weighted geometrical mean of single desirability for each response in multi-response problems. When the total desirability is maximized, optimal conditions are reached. 14
Whenever the importance for all responses presented in optimization is comparable, the function of overall desirability expresses as equation (6)
where n is the number of responses, wi is the importance of each response, di is the desirability for ith response and
It is necessary to introduce the proposed constraints upon optimization. Table 8 describes the conditional statements that have adjusted to minimize W/P and W/R. In these proposed situations, none of the inputs or the outputs is preferred to the other.
Constraints of input parameters and response.
DC: direct current; AC: alternating current; R: reinforcement; W/P: weld penetration shape factor; W/R: weld reinforcement form factor; W: bead width.
After optimization, the optimal parameter solution for three responses R, W/R and W/P is provided as follows
Accordingly, the value of composite desirability is taken as 0.855. The reinforcement, weld penetration shape factor and weld reinforcement form factor are simultaneously controlled in consequence of this parametric setting.
Model validation
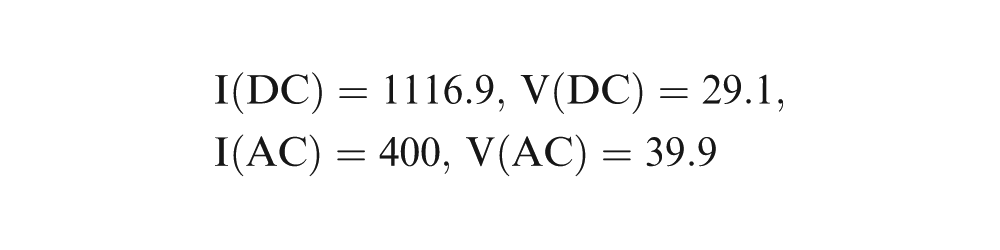
Validation tests based on the results that are previously obtained from optimization were performed. The percentage error is the difference between retested values and the predicted values by the regression model. It means when the errors were diminished, the process and its relative response surfaces were reliable to implement a good reproducibility. The errors shown in Table 9 for the all responses are slight, and desirability values are close to ideal (di = 1). All these results confirm the obtained achievements. Also, the cross section of the weld bead obtained by optimal welding parameters is shown in Figure 12.
Comparision between actual and optimized results.
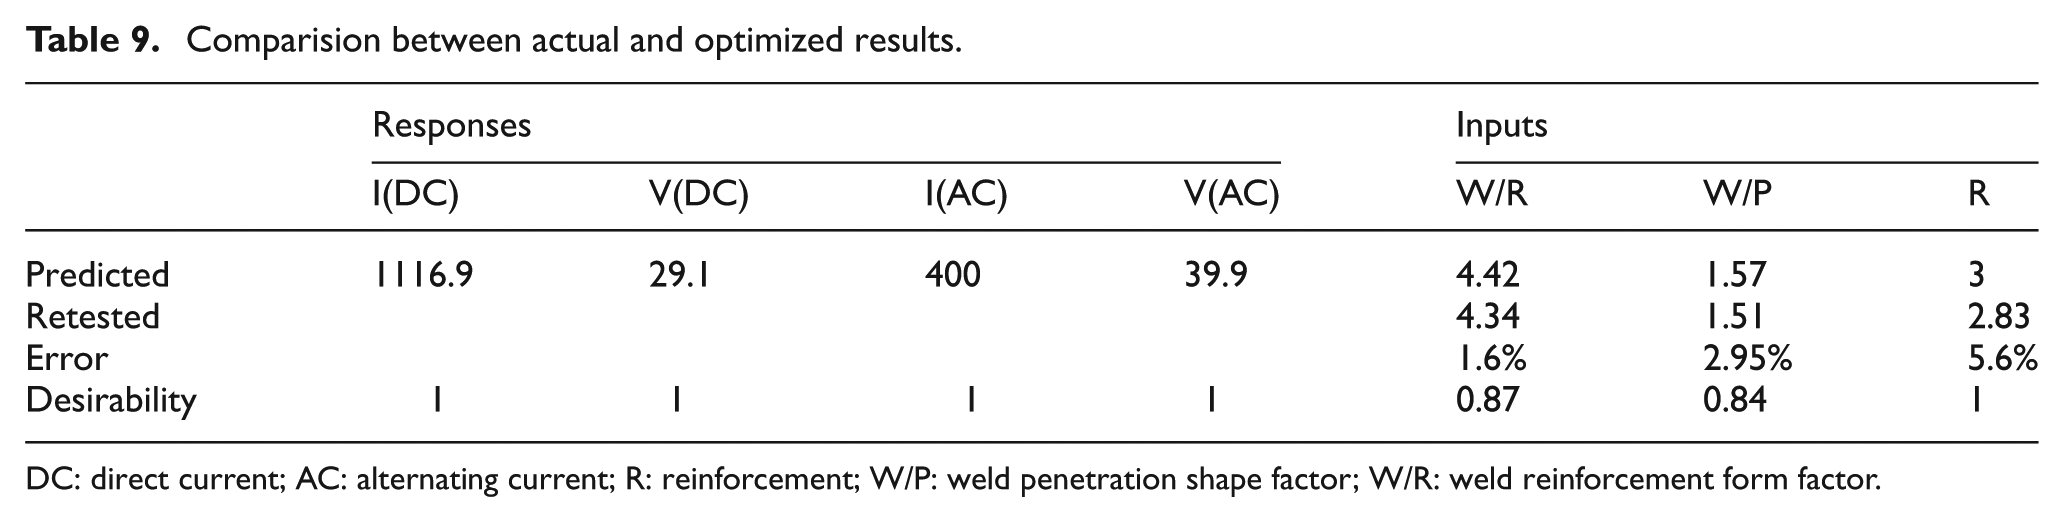
DC: direct current; AC: alternating current; R: reinforcement; W/P: weld penetration shape factor; W/R: weld reinforcement form factor.
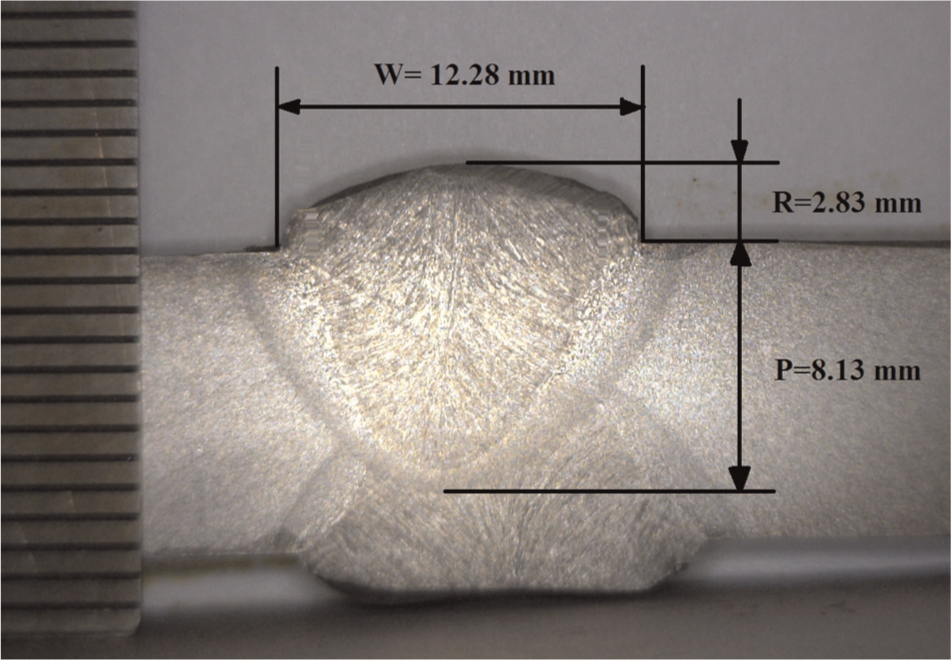
The details of the cross section for the optimal welding.
Conclusion
This research has experimentally investigated the weld penetration shape factor (W/P), the weld reinforcement form factor (W/R) and the weld penetration (R) as geometry characteristics of a weld pass in tandem SAW. The direct voltage V(DC), alternating voltage V(AC), direct amp I(DC) and alternating amp I(AC) were considered as input parameters during the external welding of a spiral steel pipe. The experimental quantities have been analyzed via RSM, and a multi-response optimization study was conducted to maintain R in standard range in order to minimize W/R and W/P outputs. The following conclusions are drawn from this study:
I(DC) is one of the most important parameters that significantly affects W/P and W/R; by increasing I(DC), both of these outputs considerably decrease.
The weld amperage has a dual effect on bead width. Below 1100 A, it makes the bead width size shrink, and then, the width becomes slightly larger due to higher deposition rates.
The trail wire plays a pretty fundamental role in tandem SAW because the penetration and reinforcement increase when I(AC) increases. It should be noted that this improvement is considerably less than the impact of I(DC) on these two responses.
When compared to the other parameters, V(DC) significantly increases the bead width. In fact, it is possible to control the weld width by manipulating the arc voltage.
According to desirability optimization, the optimal parameter combinations are suggested to satisfy the required demands from the process. Hence, based on the experimental variable limits of the process, DC has high levels (1116 A) in order to intermediate values for alternating voltage (39 V) and amp (400 A). Also, the V(DC) should remain in its low value about 29 V.
Footnotes
Acknowledgements
The authors would like to thank Iran Spiral Pipe Mill Company for hosting this research which supported and provided all conditions for the research. The authors especially thank Mr H. Yusefian, plant manager.
Declaration of conflicting interests
The authors declare that there is no conflict of interest.
Funding
This research received no specific grant from any funding agency in the public, commercial or not-for-profit sectors.