
Abstract
The prediction of thrust force and torque in drilling remains a key issue. There are three main ways to determine these forces based on experimental, numerical and finally analytical approaches. The major drawback with numerical and analytical methods concerns their reliability compared to phenomenological models. As a consequence, several studies use a resetting method in order to correct parameters of their analytical or numerical models so that they correspond to experimental results. The goal of this article is to introduce a new analytical model in drilling based on the discretization of the cutting edge. Local forces are estimated with a semiorthogonal analytical model based on a modified Merchant’s model. Parameters have been identified by a basic semiorthogonal cutting test for a large range of cutting speed and feed rates, by friction tests for a range of sliding velocities and by a variable shear angle model. The macroscopic feed force and torque are estimated by the sum of each local force along the cutting edge. Two drills applied in a large range of cutting conditions are investigated to validate this approach.
Introduction
Context
In the context of global competition, the industry requires rapid methods in order to predict forces in drilling without making experimental tests on real costly prototype tools. In order to optimize the machining operations, it is important to predict the forces produced by cutting processes. Three main ways are commonly used.
The first approach consists in identifying a phenomenological model based on experimental measurements. This model provides a feed force and torque depending on the cutting speed and feed rate for a specific cutting tool and work material. For instance, the standard tool material pair (TMP) 1 is a way to optimize the cutting configuration by chip fragmentation control. Stephenson and Agapiou, 2 Altintas 3 or Audy 4 exposed the advantages and limits of phenomenological models, which give accurate values, but poor extensibility. Additionally, any modification of the tool design or manufacturing process requires at least 2 months before machining any experimental validation. As a consequence, the industry is keen to develop virtual models to predict rapidly the forces for a large range of tool designs. Two approaches can be used: numerical and analytical models. Numerical cutting models become even more popular, thanks to the improvement of computer and computational mechanics. Most of the studies were concerned by orthogonal cutting.5,6 Concerning numerical drilling models, few studies have been published7,8 even if a lot of advertisement can be found on the websites of software dealers. The major limitation of these drilling models is related to the geometrical complexity of the cutting operation, which increases the computational duration (several days) to simulate not more than two revolutions of the tool. Additionally, these models use constitutive mechanical models identified for a very limited number of work materials. The identification of each new one is a tough and costly job. 9 Finally, these models do not consider any variation of the friction coefficient over the cutting configuration (velocity and pressure), even if the authors have shown a strategic influence of this parameter10–13 on chip formations and forces. As a consequence, the application of numerical models is limited to some research laboratories to predict qualitative results.
The third approach consists in using analytical models. Most articles use the discretization of cutting edges,14–22 as illustrated in Figure 1. The macroscopic feed force and torque are calculated by the sum of each local force along the cutting edge. Local forces depend on the rake angle
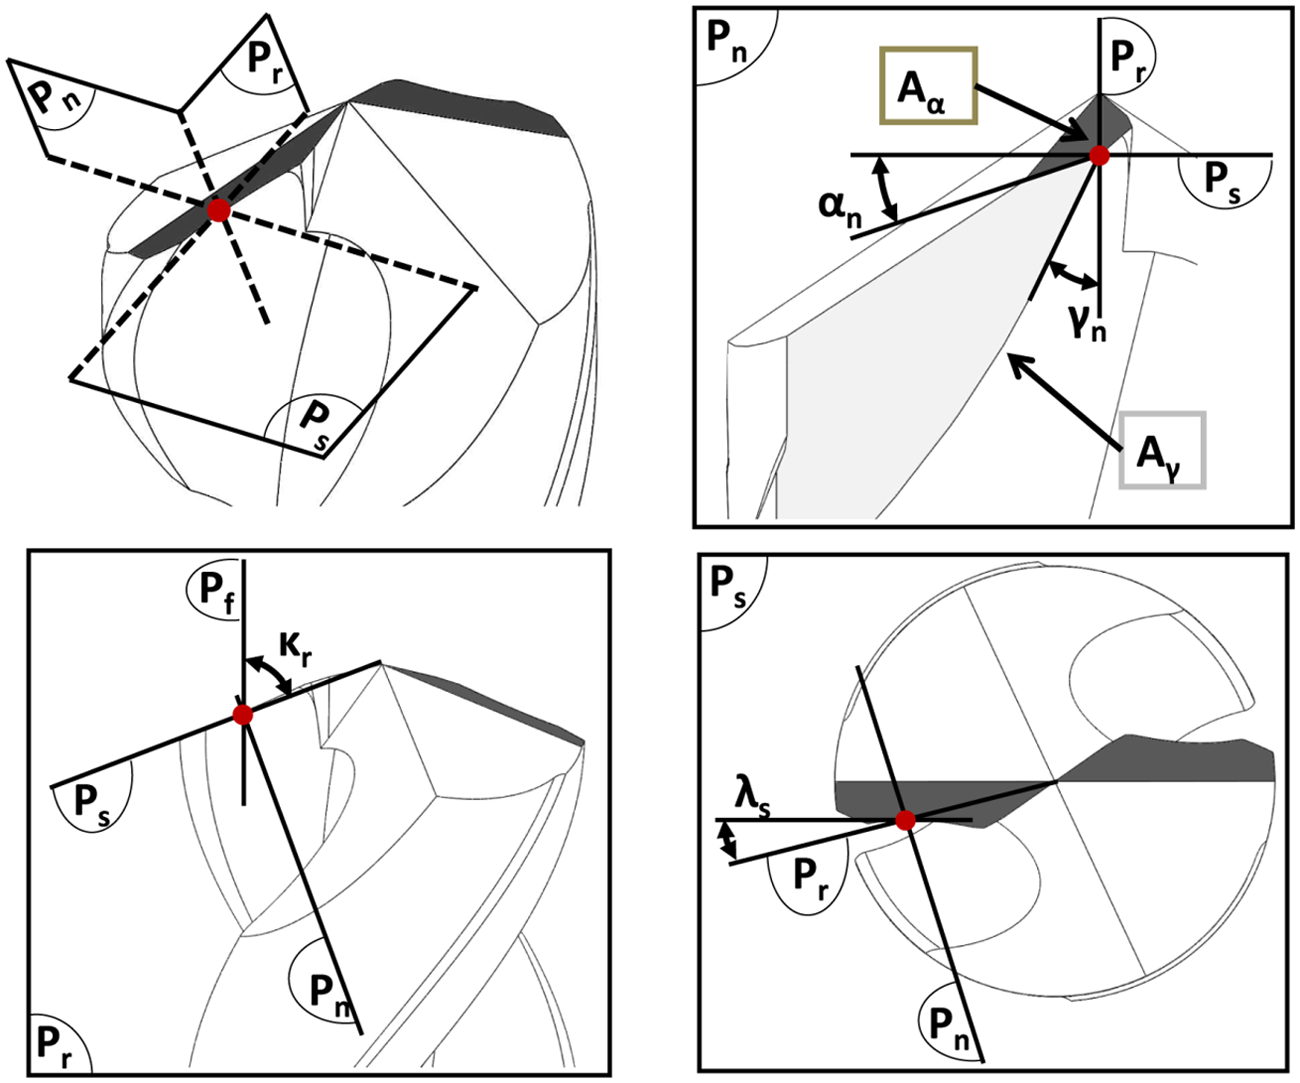
Plane orientation for measuring angle on a drill. 23
Various methods have been used to predict all the local forces. Some authors use drilling tests with one specific investigated tool and one specific work material.14–22 In this case, the local forces are estimated after tests with specific geometric and decomposition models. The main disadvantage of this method is that these specific drills have to be ground before any experimental identification of the model parameters (as mentioned earlier, almost 2 months are required for manufacturing and control). So, this limits its interest compared to phenomenological models that would be more accurate.
The second way consists in using generic cutting tests in order to identify the analytical flow stress model of the work material. For instance, Elhachimi et al.18,24 and Dargnat et al. 20 use the Oxley model, whereas Jrad et al. 19 have chosen a Johnson–Cook model. Elhachimi and Jrad use model parameters from the literature, which are limited to few work materials. Based on this status, Dargnat has developed a strategy to identify the parameters from orthogonal cutting tests (mainly with a high-speed camera). This approach is efficient, but its replication for a large-scale application is limited.
Finally, all models consider a constant friction coefficient along the cutting edge but it has not been quantified by any tribological tests. In particular, Zemzemi et al. 25 have highlighted the fact that the friction coefficient can vary from 0.2 to 0.6 when the cutting speed decreases from 200 to 10 m min−1, which is consistent with the variation of the cutting speed along the edge of a drill for steel.
As a consequence, it became necessary to develop a new methodology capable of defining a local force model that can be easily identified through basic cutting and tribological tests. Thereby, this model will not be dependent on specific tool geometry and can therefore be used for complex tools. This force model will be validated for orthogonal and oblique cutting in the context of an AISI 4142 steel (300 HB) machined with TiN-coated solid carbide tool. Next, it will be applied to complex tools, such as drills. Two modern carbide drills with web thinning, instead of conventional high-speed steel (HSS) drills with chisel edge commonly used in the literature, will be used for validation. The objective of this article is to present this new methodology.
Description of the proposed methodology
As has been shown earlier, three main factors have to be closely studied: tool geometry, orthogonal cutting experiments and friction law. The following Figure 2 exposes this methodology. From a defined tool and work material, two major consequences can be estimated by experience or previous knowledge: the a priori accurate tool geometry (defined by the tool manufacturer) and conventional cutting conditions. The latter give the framework for cutting and friction tests, mainly the cutting speed and feed rate. From tool grinding (or directly from a virtual tool, as in this article), the local cutting configuration can be determined. Coupled with a cutting force model identified from cutting and tribological tests, the local forces can be calculated. Finally, by a sum of each local element, the global forces can be computed. In the next part, each factor (geometry, cutting and friction) will be studied in order to feed the model.
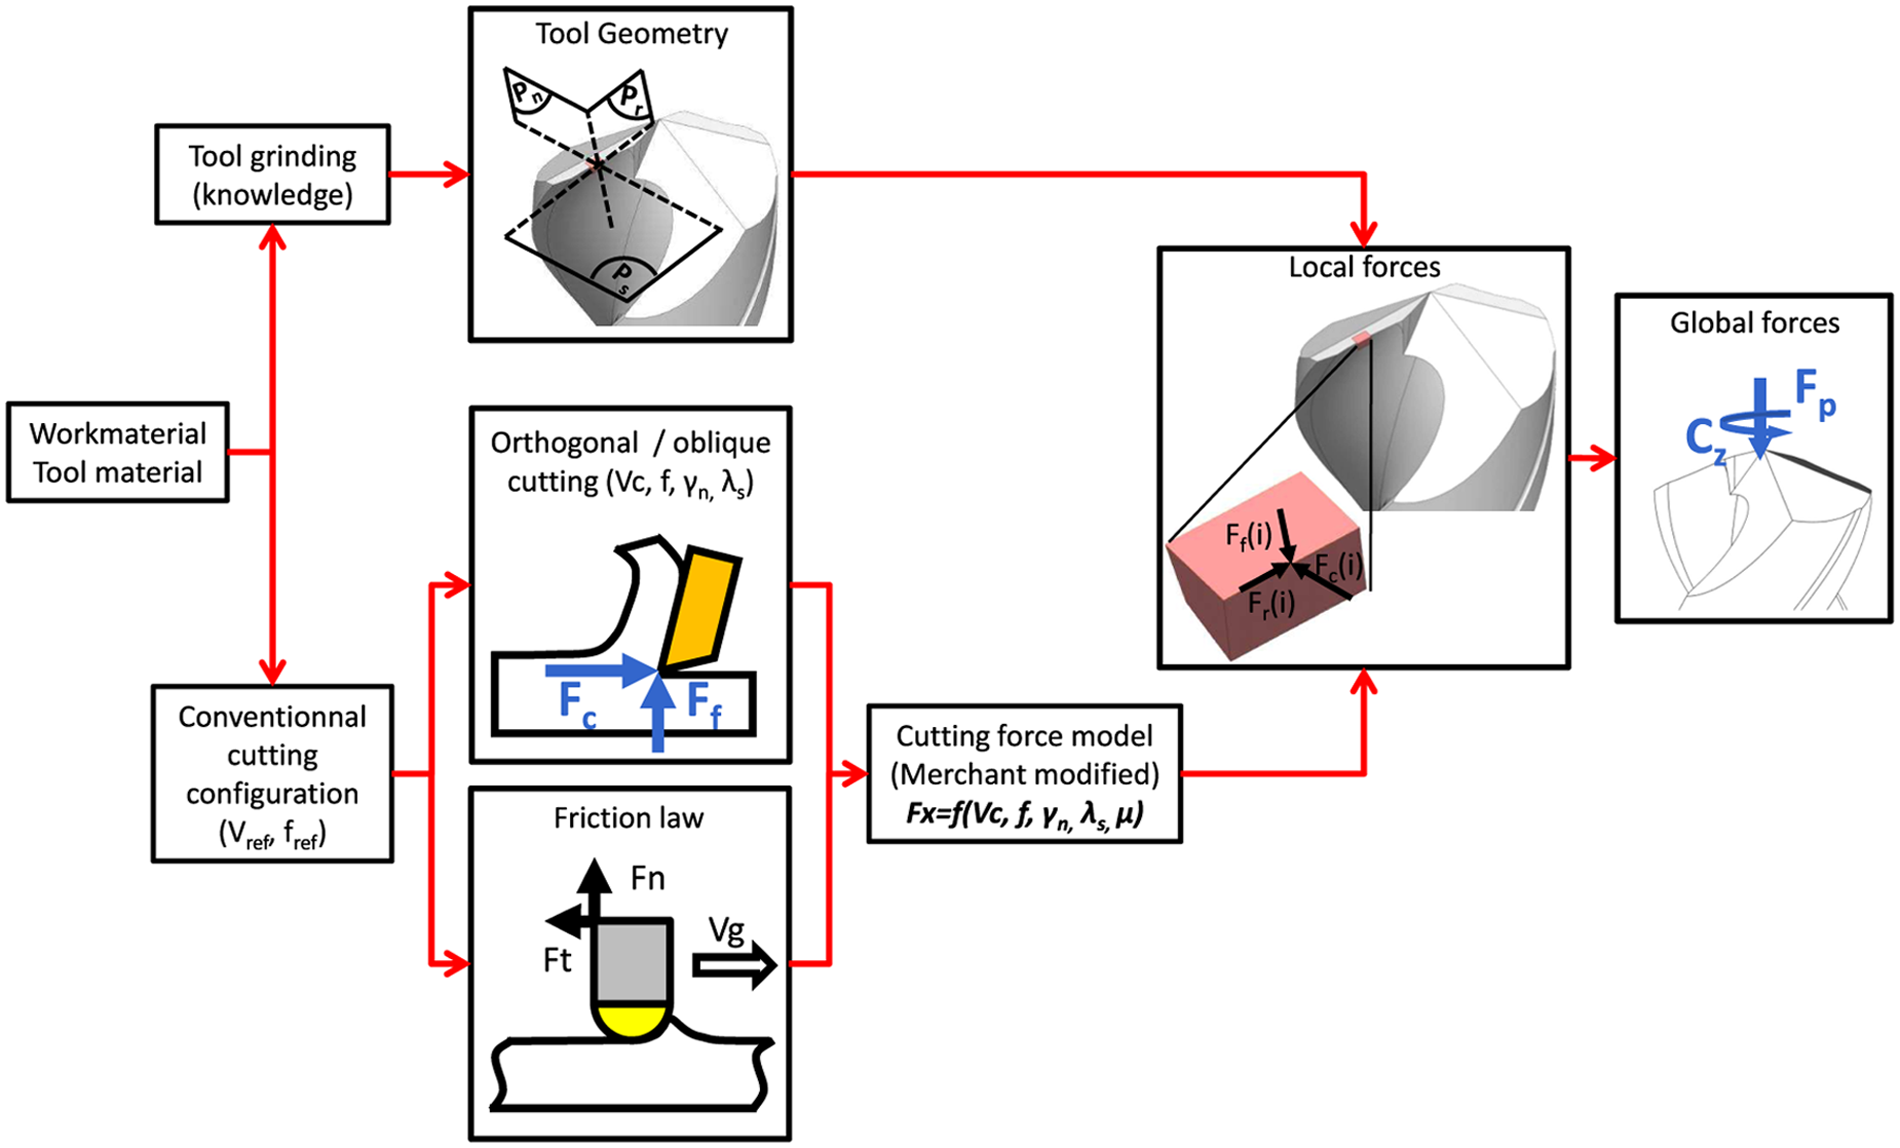
Synoptic survey of the proposed method.
Analytical force model
Drill geometry
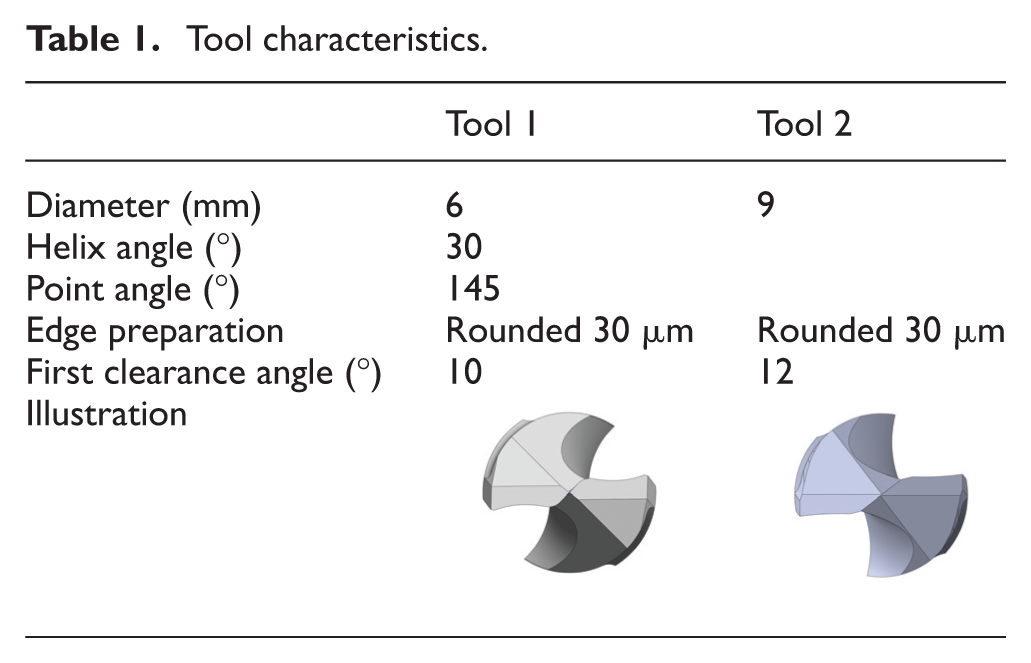
In this study, two geometries of TiN-coated solid carbide drills (K40 grade, with 10% of cobalt) are used. The main characteristics of these tools are listed in Table 1. Tool 1 exposed a wavy main cutting edge, a corner edge chamfer, two relief faces, a thinning face and a special flute section in order to promote smooth chip fragmentation and evacuation. Tool 2 has a straight main cutting edge and a wide flute opening.
Tool characteristics.
The first step is to identify the local geometry at each point of the drill edge. The cutting edge of the drill is splitted into a finite number of elementary edges. For each of them, it is possible to define the local cutting configuration of the point considered. The French standard 23 has been chosen in order to measure the cutting edge geometry and its evolution with the radial position.
It is therefore possible to apply this method to each elementary cutting edge. The evolution of angles is shown in Figure 3 for both tools, expressed as a radius function. The Zone 1 corresponds to the main cutting edge, while Zone 2 stands for the chisel edge. The oblique configuration is defined by a nonzero
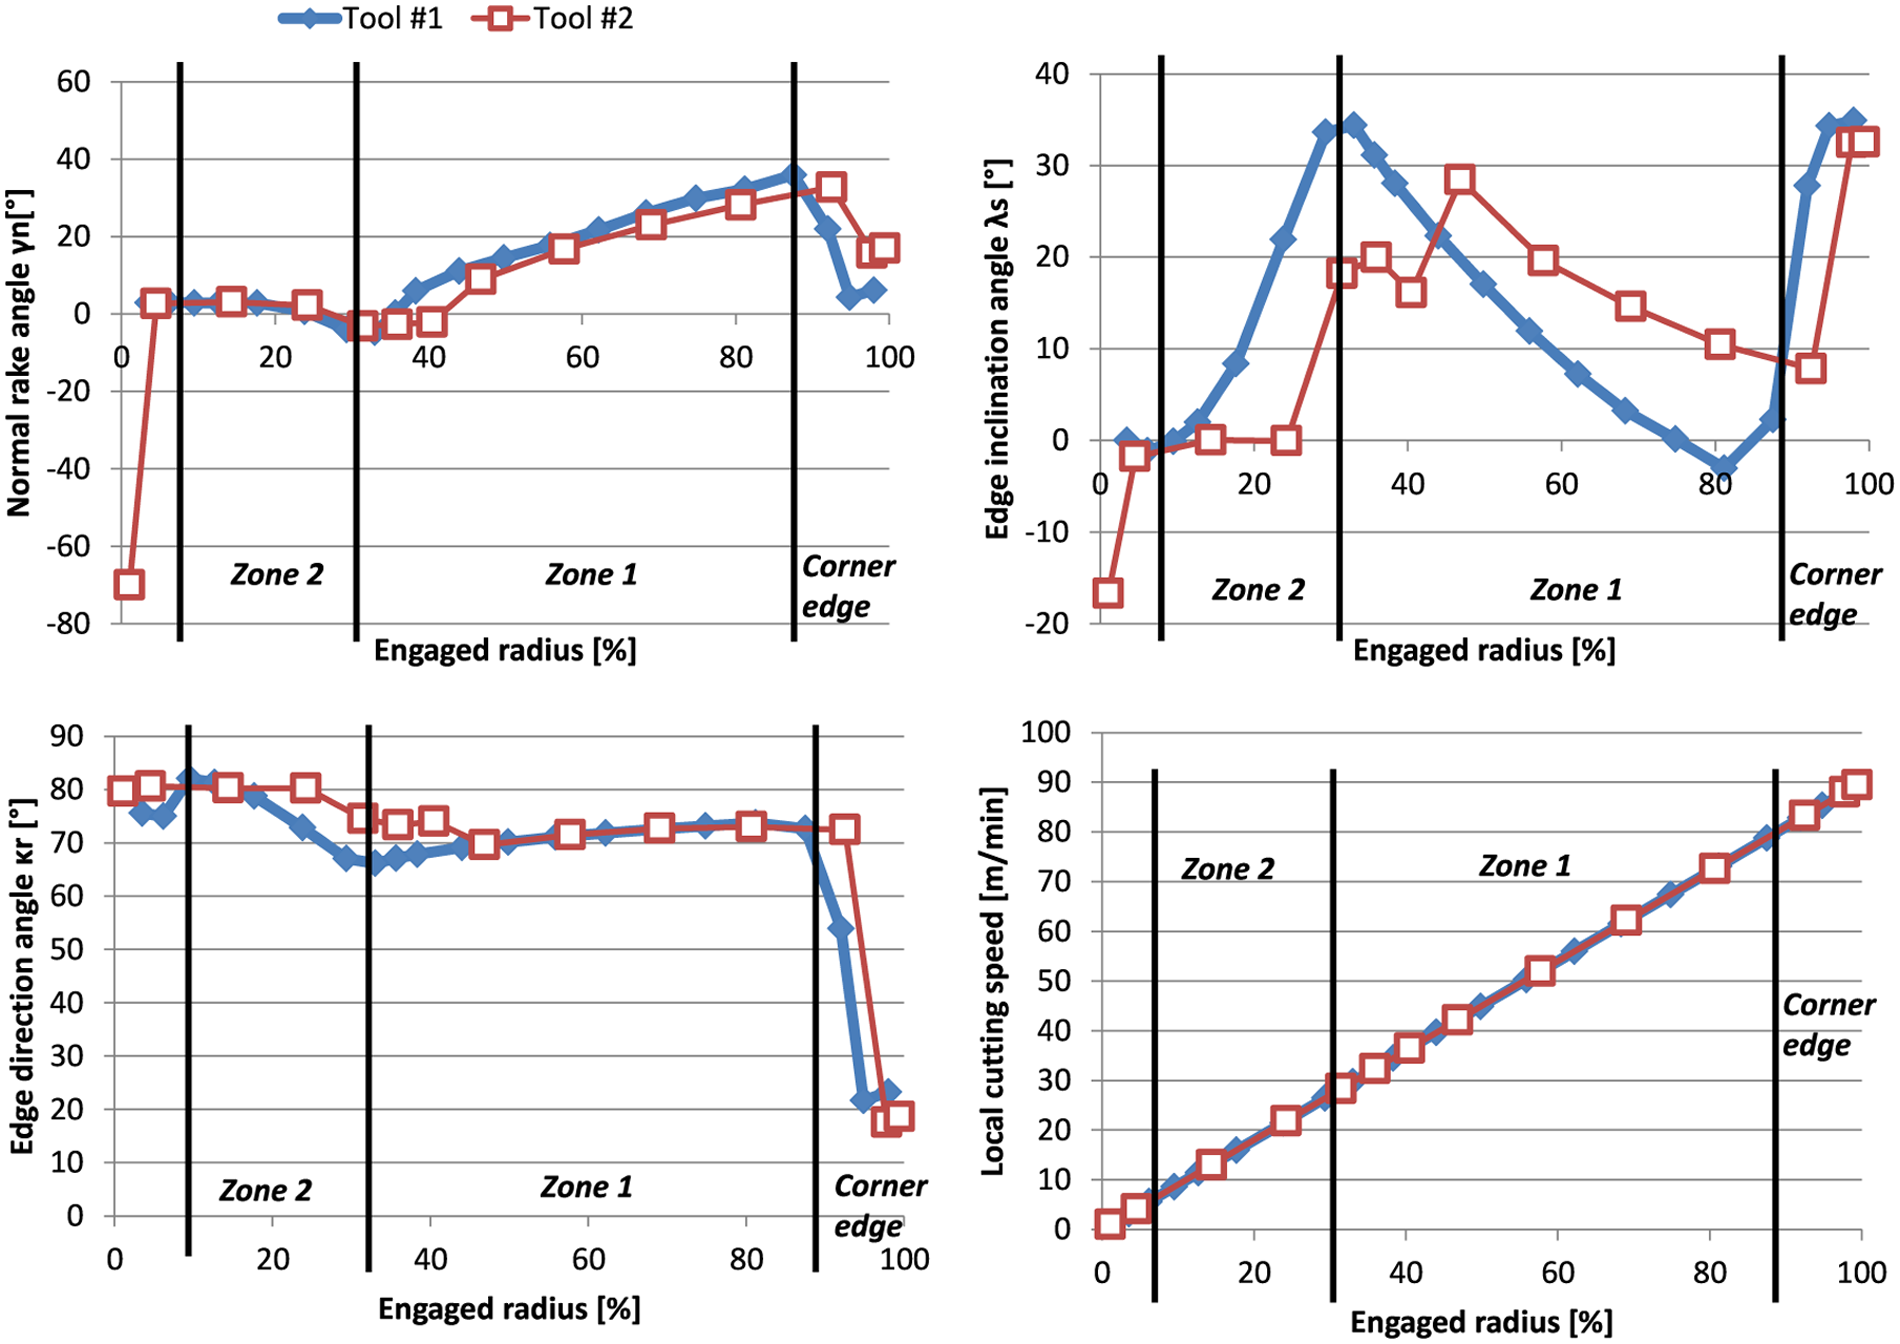
Angle evolution for both Sirius and Polaris geometry types, expressed as a function of the radius.
Cutting configuration
According to Figure 3, it is possible to determine the cutting configuration on each elementary edge of the tool. This leads to Figure 4, which represents the cutting conditions retained for our orthogonal and oblique cutting test. In fact, we choose a complete range of cutting speeds and feed rates for the orthogonal cutting (1) because of the real cutting configuration on the drill and (2) in order to be in line with Merchant’s model hypothesis. For the rake angle,
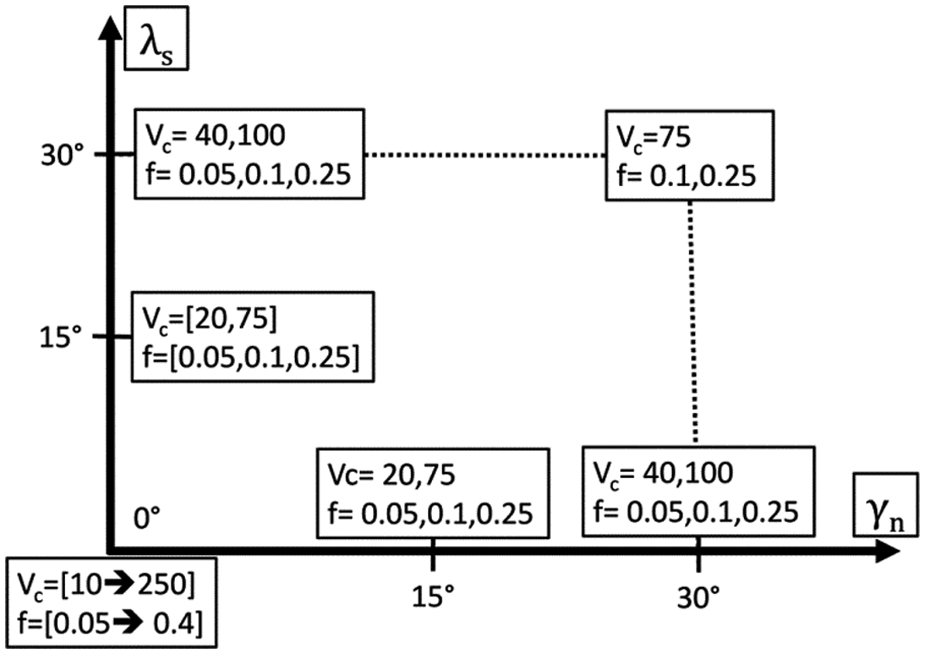
Cutting configurations for the elementary cutting test.
Friction coefficient
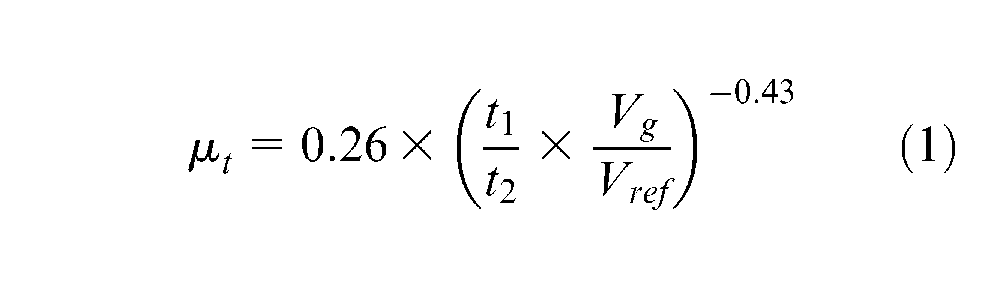
While Merchant retains a constant friction coefficient and does not include the cutting speed, this approach uses a friction coefficient that depends on the sliding velocity
Furthermore, linking the overall cutting speed
Cutting force models based on Merchant’s approach
The cutting model from Merchant28,29 is chosen. It is a model in which three physical phenomena are taken into account. The first one concerns the behavior law for shearing the work material. Merchant uses a Bridgman-type model
30
with two parameters

The model gives access to cutting forces and advances in orthogonal cutting. The cutting conditions (speed and angle) are identified in the plane
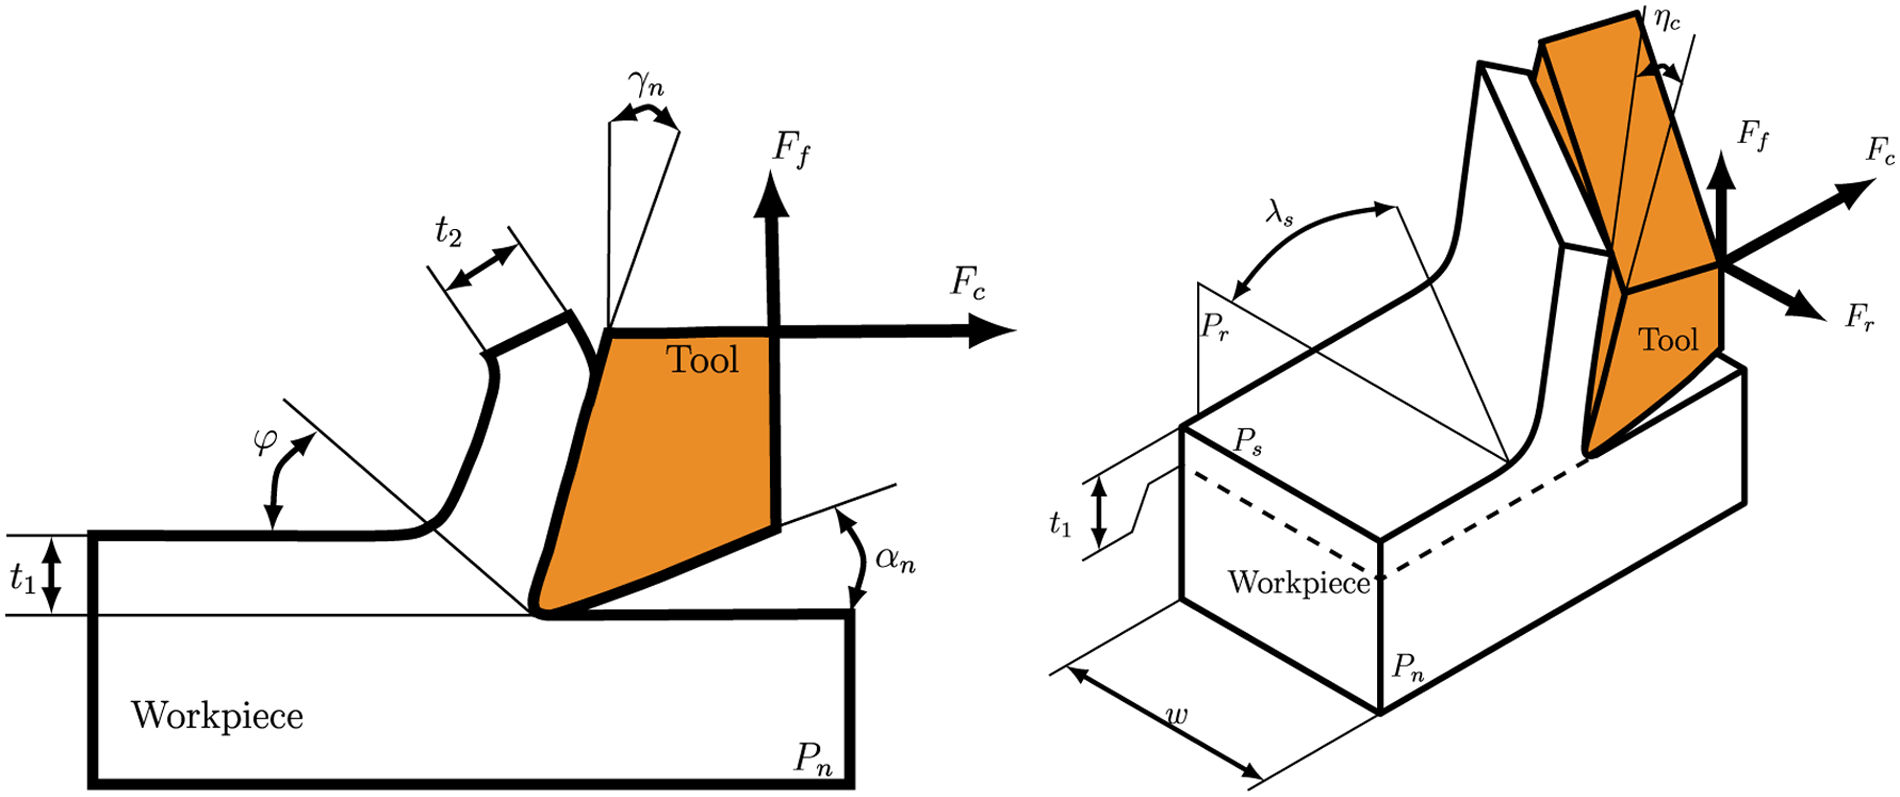
Orthogonal and oblique cutting configuration and notation.
The principle for determining the primary shear angle

where
However, Moufki et al. 10 and Molinari and Moufki 31 have shown that Merchant’s hypotheses are not consistent with experimental measurements of the shear angle. They have introduced the following formulation

where
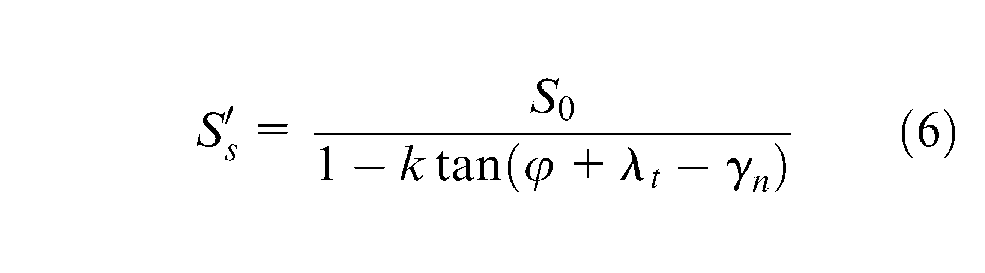
A geometric relationship (5) gives the chip thickness

The perfect plastic behavior requires the knowledge of two parameters related to the material,

Finally, with these parameters, it is possible to determine the cutting and feed forces
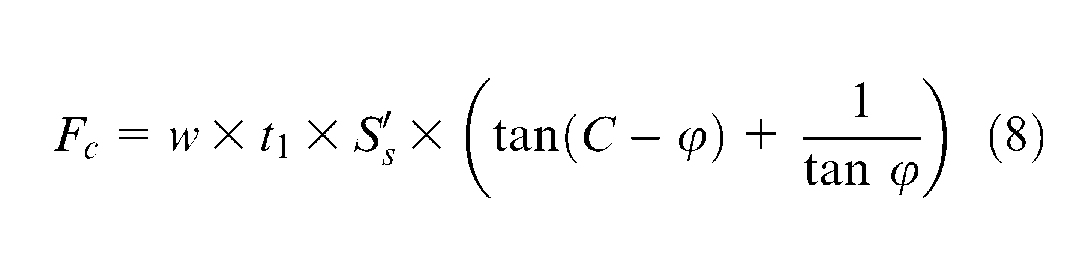
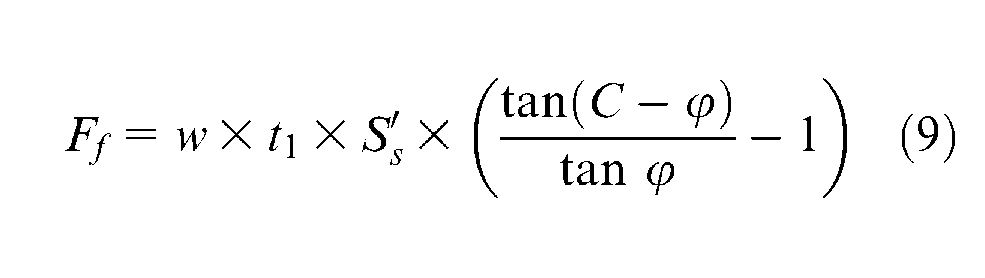
where
Oxley
32
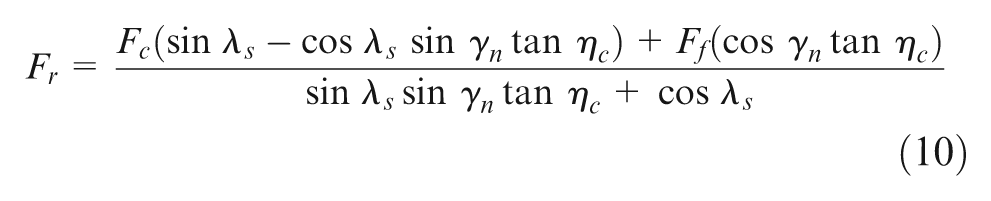
has shown that it is possible to obtain coherent radial cutting forces in the case of the oblique cut (with a small error) by taking an orthogonal cutting model for the cutting and penetration forces, while the radial stress in relation (10) is obtained from these efforts and the flow angle of the chip
The chip flow angle

In the present case, the parameters to identify are
Experimental resetting procedure
Cutting test
The effort pattern is readjusted over a wide range of cutting conditions, in terms of both speed and configuration angle (rake and inclination angle). These cutting configurations are chosen according to the ones observed on the selected drills presented earlier (Figure 4). To make the test feed the model, it is necessary to design devices for placing the cutting edge in the correct position. The real cutting edge of the drill exposes various cutting configurations. The developed mounting has to reproduce these configurations; 3-mm-thick and 80-mm-diameter disks of AISI 4142 (300 HB) were used. Efforts in the three directions were recorded by a Kistler dynamometer with a sampling frequency up to 2 kHz. The efforts of the stabilized machining operation are selected thereafter. It is possible to perform tests with configurations of rake angle
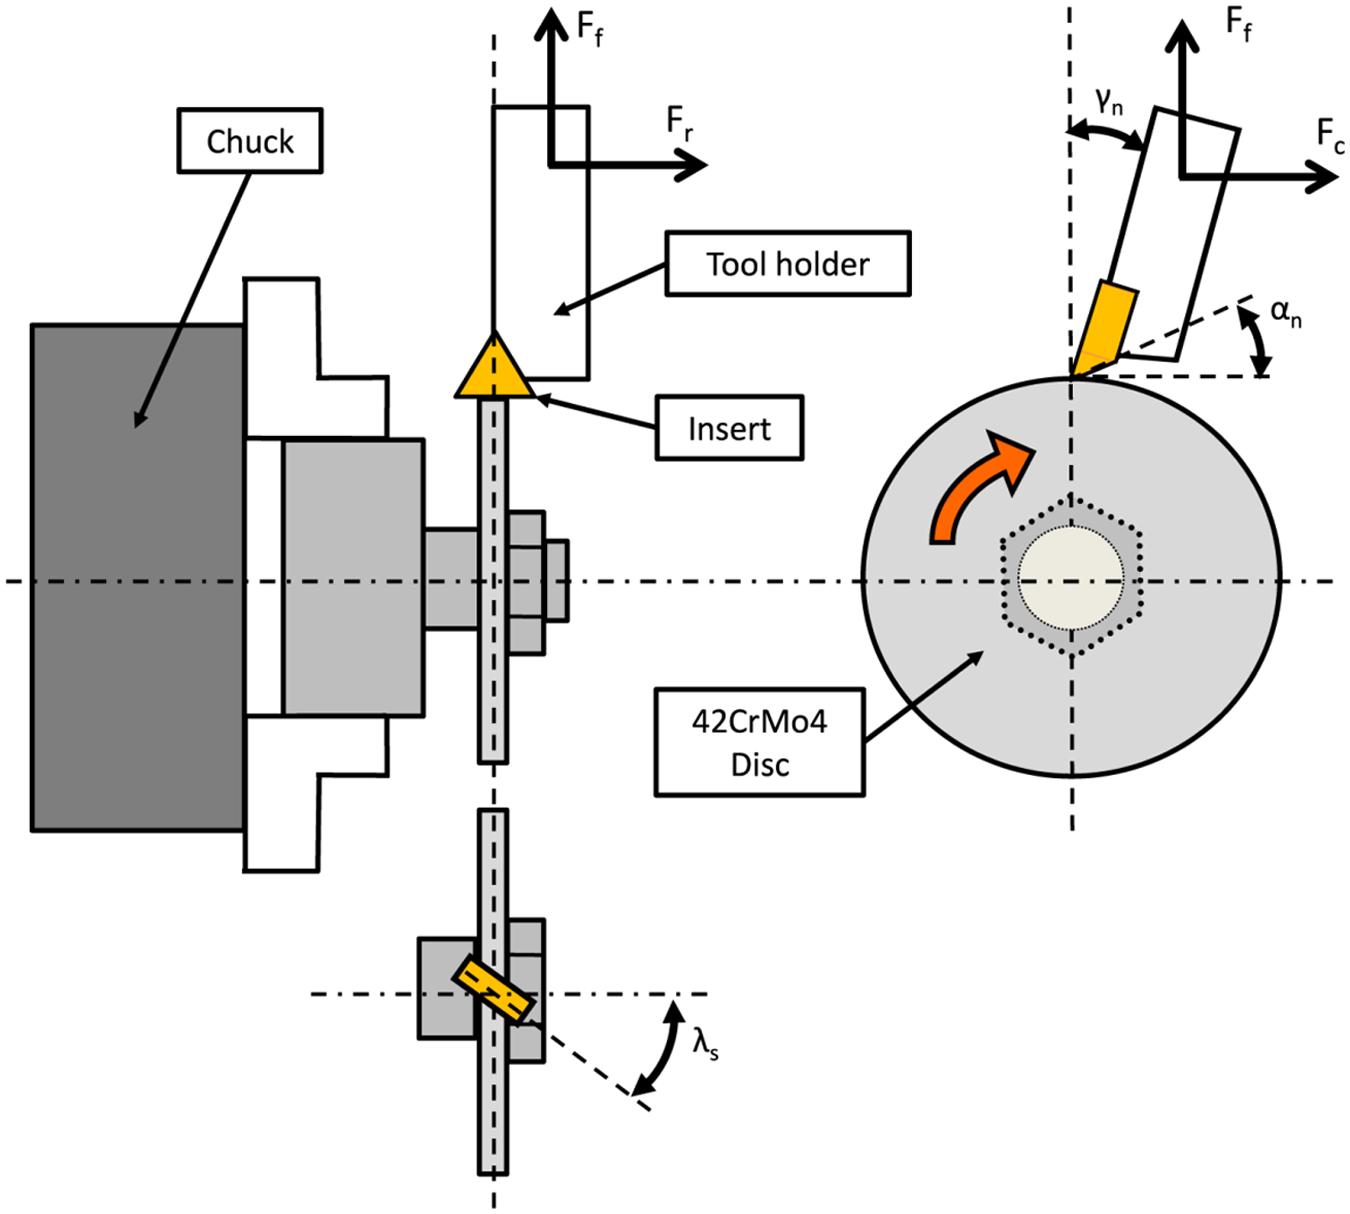
Cutting test setup.
The tests were conducted on a computer numerical controlled (CNC) lathe. Solid carbide (10% Co) TPKN 1603 PPR inserts without chip breaker coated with TiN are used to machine the disk. These inserts have undergone a special sharpening operation not only to improve and stabilize the edge preparation
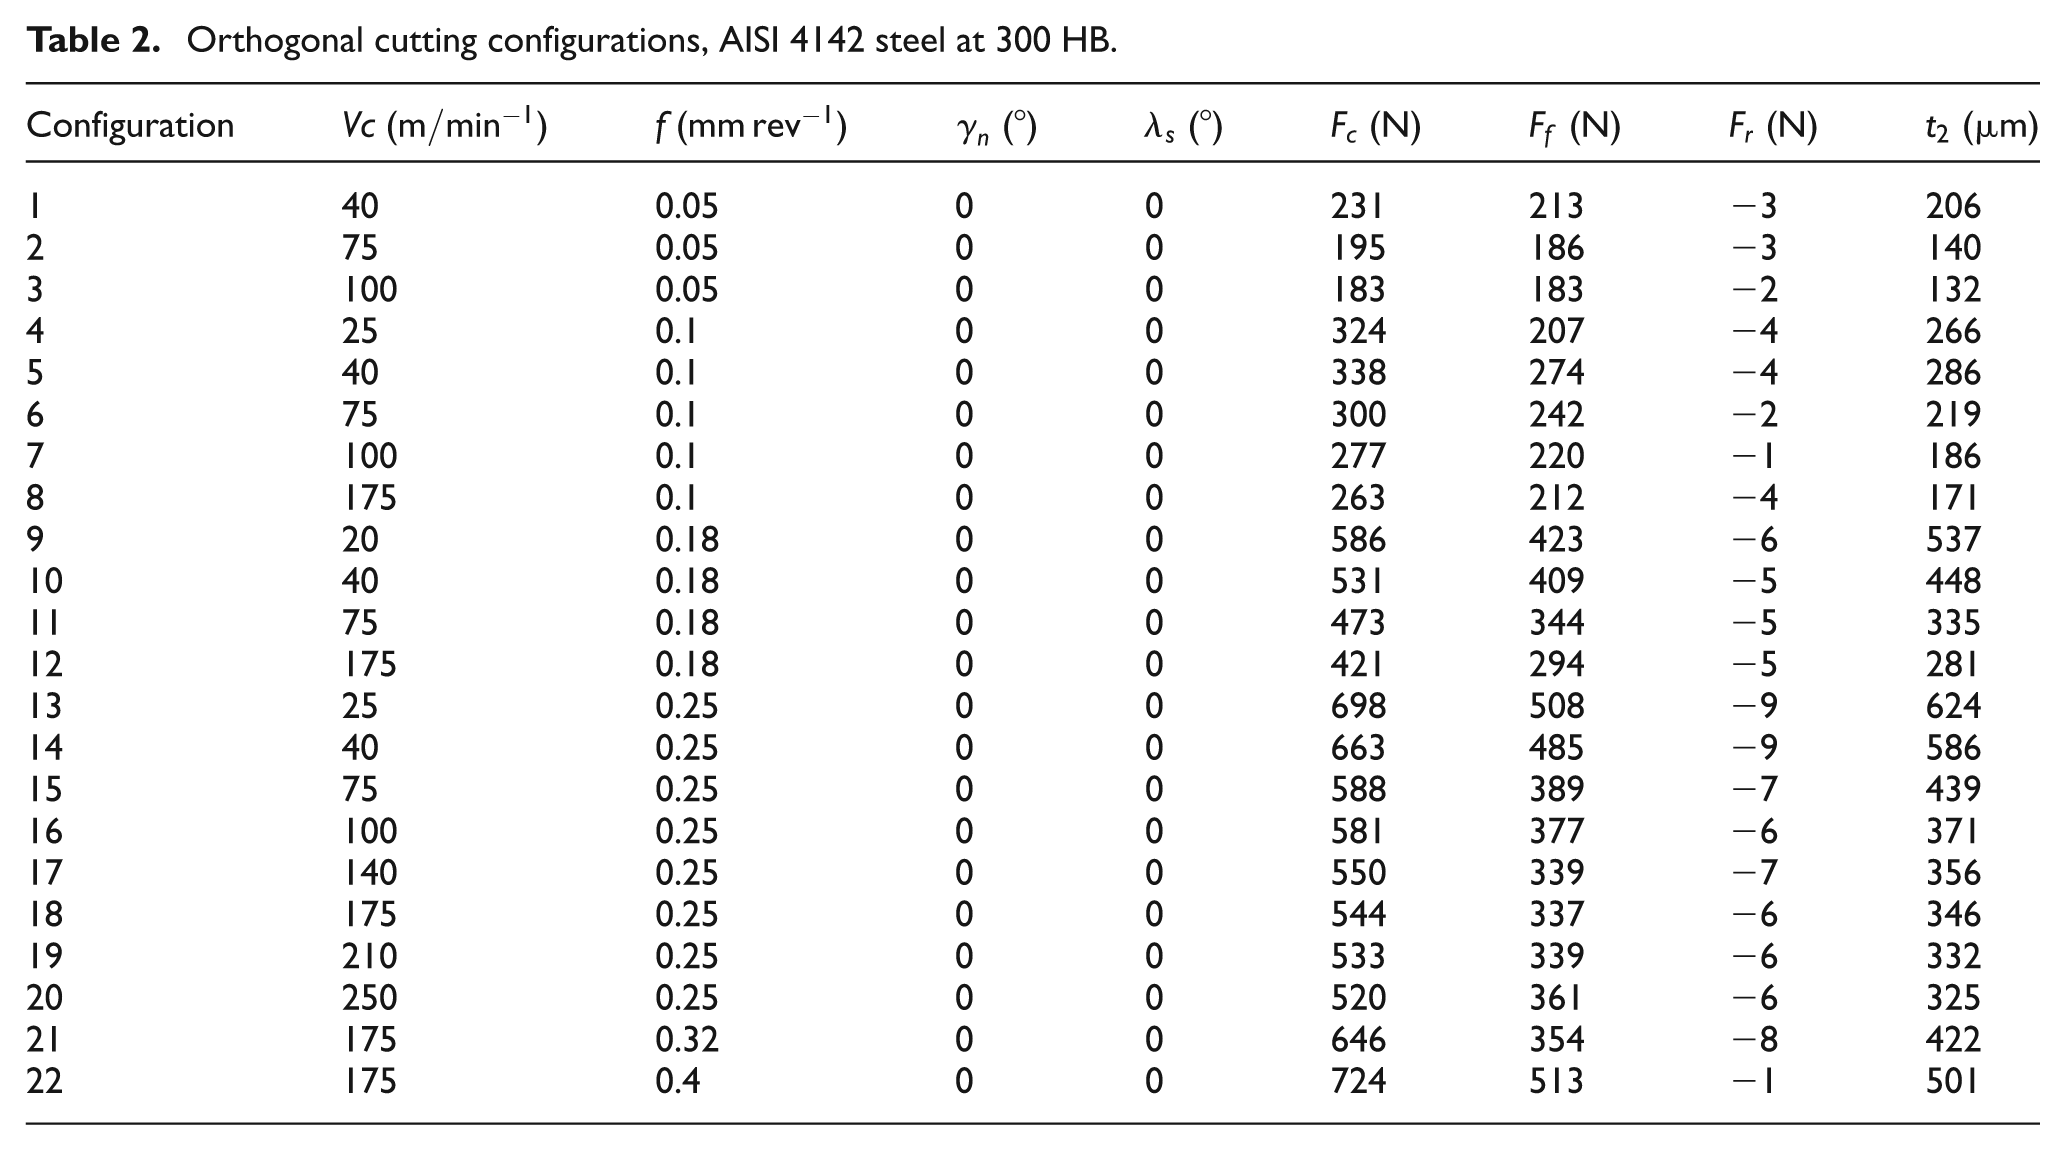
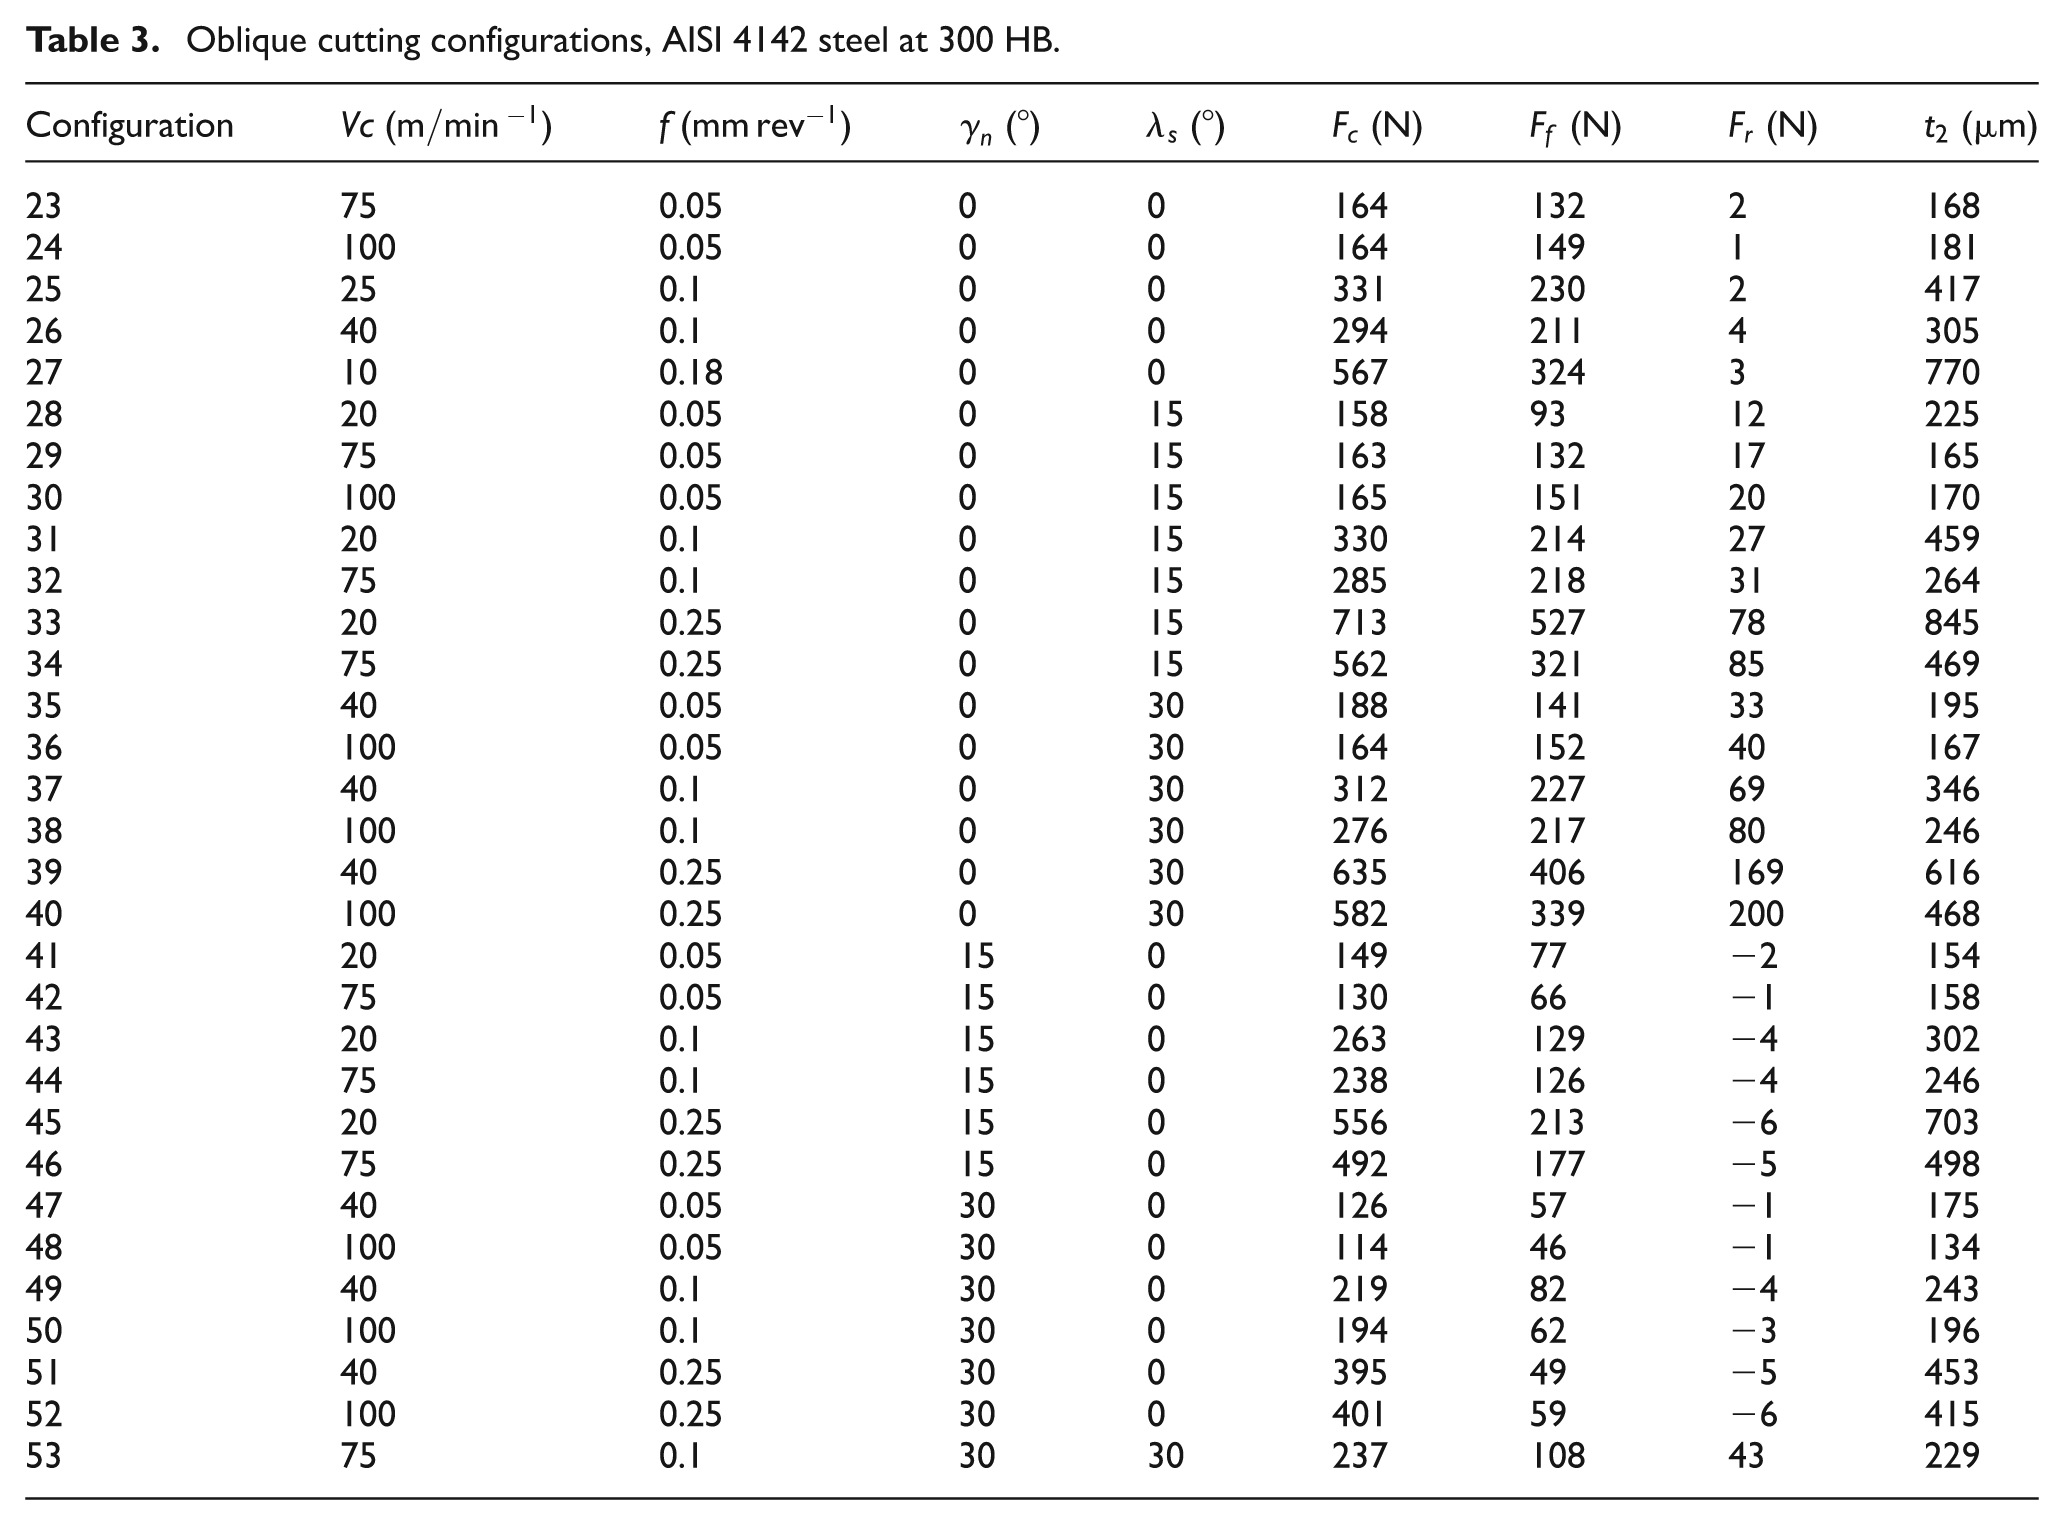
The cutting tests provide a great amount of data. First, forces in all directions are posttreated (divided by the disk width). Moreover, as shown earlier, it is necessary to know the thickness of the chips to solve the equations of Merchant (among others to find the shear angle
Orthogonal cutting configurations, AISI 4142 steel at 300 HB.
Oblique cutting configurations, AISI 4142 steel at 300 HB.
Resetting
These tests provide the cutting forces and chip thickness, while the friction coefficient is a variable depending on the cutting speed. For each test,
The validity limits of our model are based on Merchant’s model. We have therefore chosen experimental conditions to readjust the model of material plastic behavior over a wide range. The objective is to estimate the error of the cutting force with operating configurations that are far from optimal conditions but are found all along the cutting edge in many machining operations such as end milling or drilling.
Comparison between model and experimental results
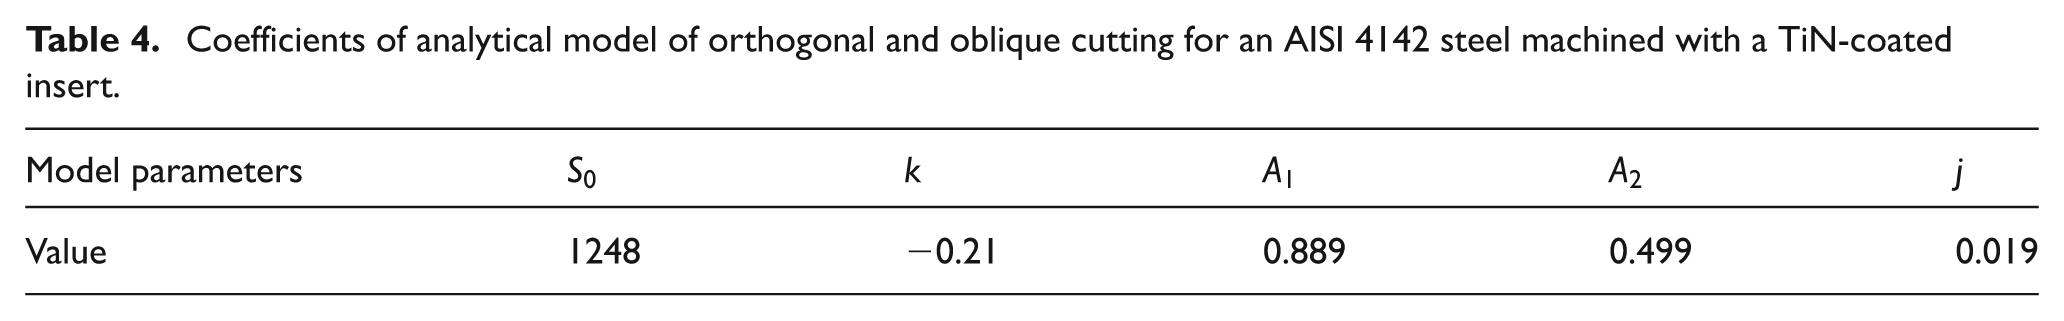
In order to validate the model, the experimental values are compared with the ones calculated in the corresponding cutting conditions (Table 4).Figure 7 shows the evolution of the predicted forces versus the experimental ones. Moreover, an identification of Merchant’s original model is performed (with a fixed friction coefficient of 0.45 and shear angle defined as relation (3)) on the same set of data, in order to measure the benefits of the proposed optimization (friction coefficient function of cutting speed, variable shear angle and optimized chip flow angle). It appears that the present model gave better results than the old one, especially on the feed force. Moreover, it appears that the friction law makes it possible to reproduce the decrease of forces with the increase of the cutting speed. Nevertheless, the cutting force is better predicted than the feed force in every cutting model. In this case, with a simple Merchant’s model, the accuracy is consistent with his hypothesis. The feed force is mainly driven by the thermal aspect in the material behavior law,6,34 which is not taken into account in this simple model. Edge preparation is not included in the model and generates an additional feed force due to the plowing effect.
Coefficients of analytical model of orthogonal and oblique cutting for an AISI 4142 steel machined with a TiN-coated insert.
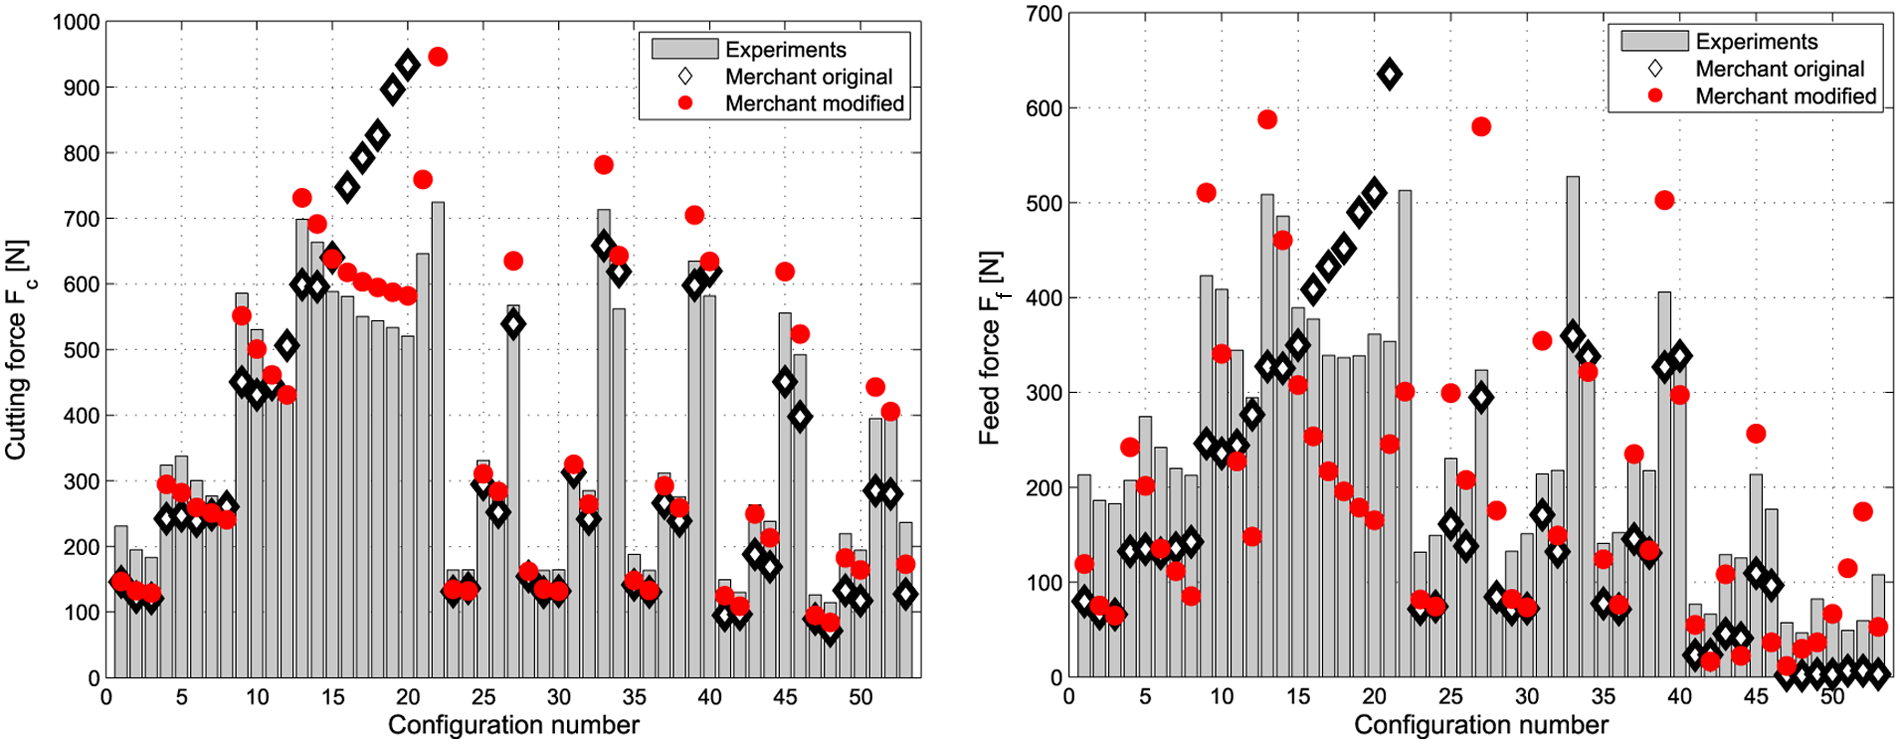
Comparison between experiments, the original Merchant model and the modified one.
Application to drilling
Drilling tests have been performed in order to compare force and torque with the simulated ones. As was shown in the previous part, the cutting model can fit with experiments under a relative wide range of cutting conditions. This model is applied to predict the drilling thrust force and torque in Zone 1, the main cutting edge. The drills used in this study have been presented earlier. As mentioned previously, the present model is purely about cutting, so it cannot be applied to model the indentation phenomenon occurring in the chisel edge. That is why predrilled holes of Ø
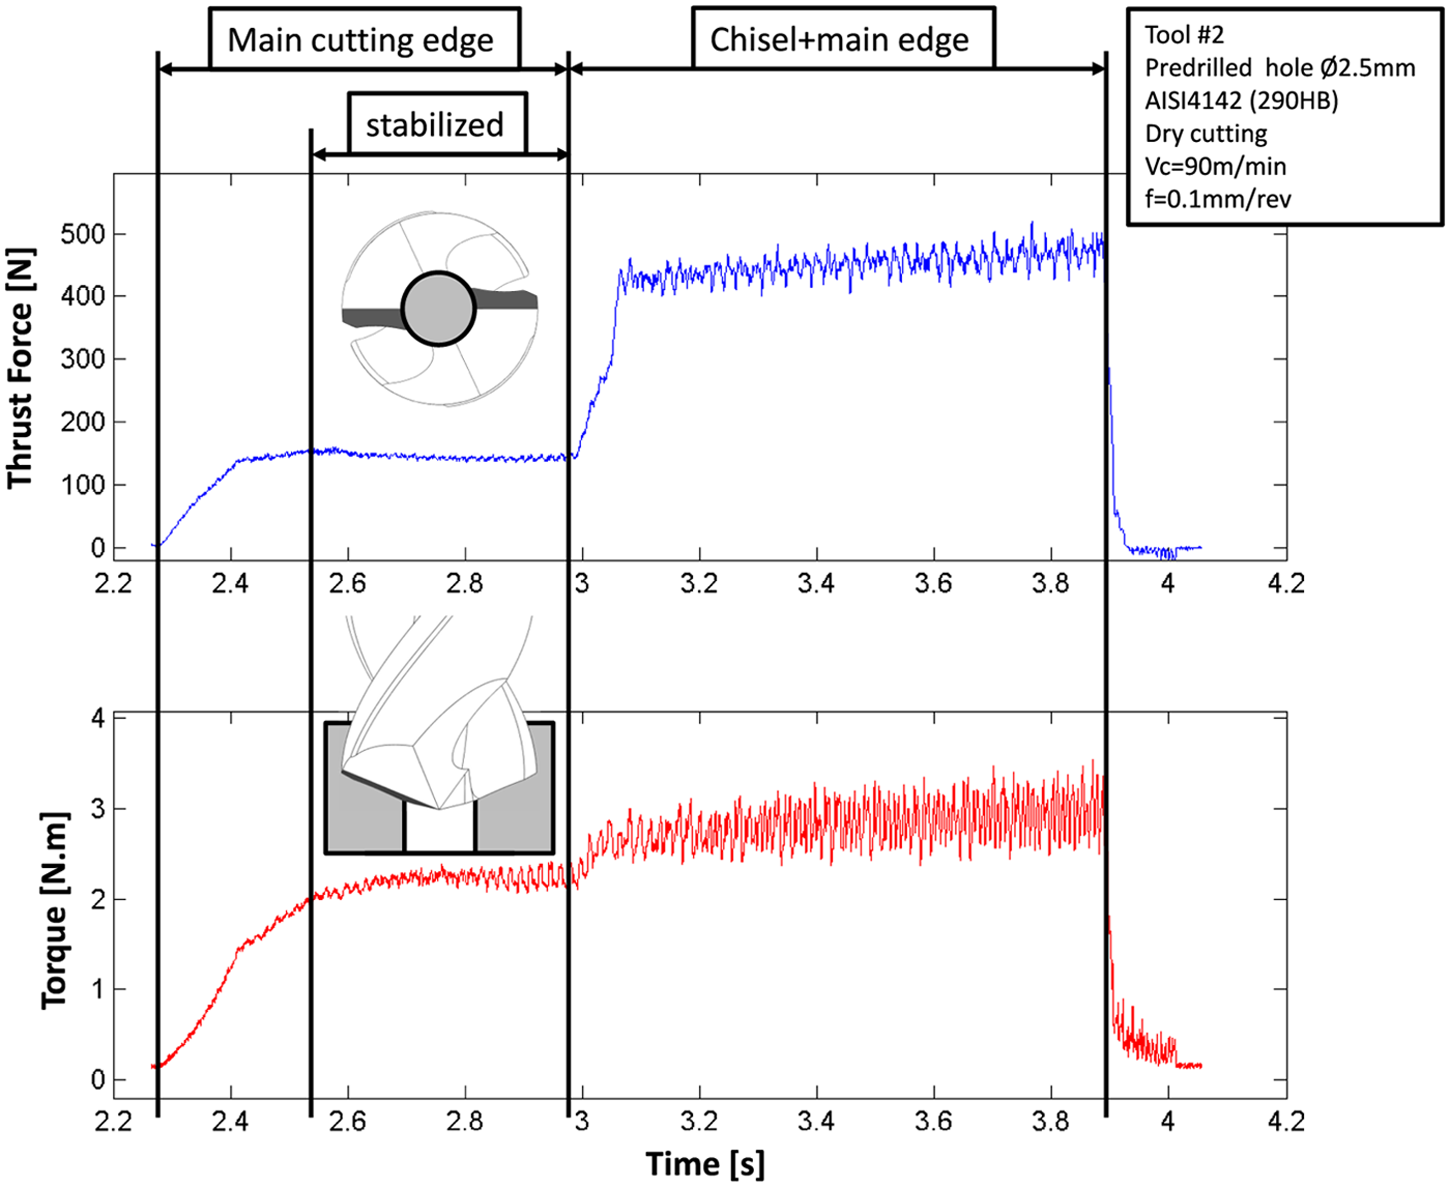
Thrust force and torque for Tool 2 with a Ø
With the previous model, it is possible to calculate the forces for any local cutting configuration along the cutting edge, which has been defined previously for the two types of drill. Figure 9 shows how the cutting, penetration and radial forces are oriented in the drill reference coordinate system. In order to have the total thrust force
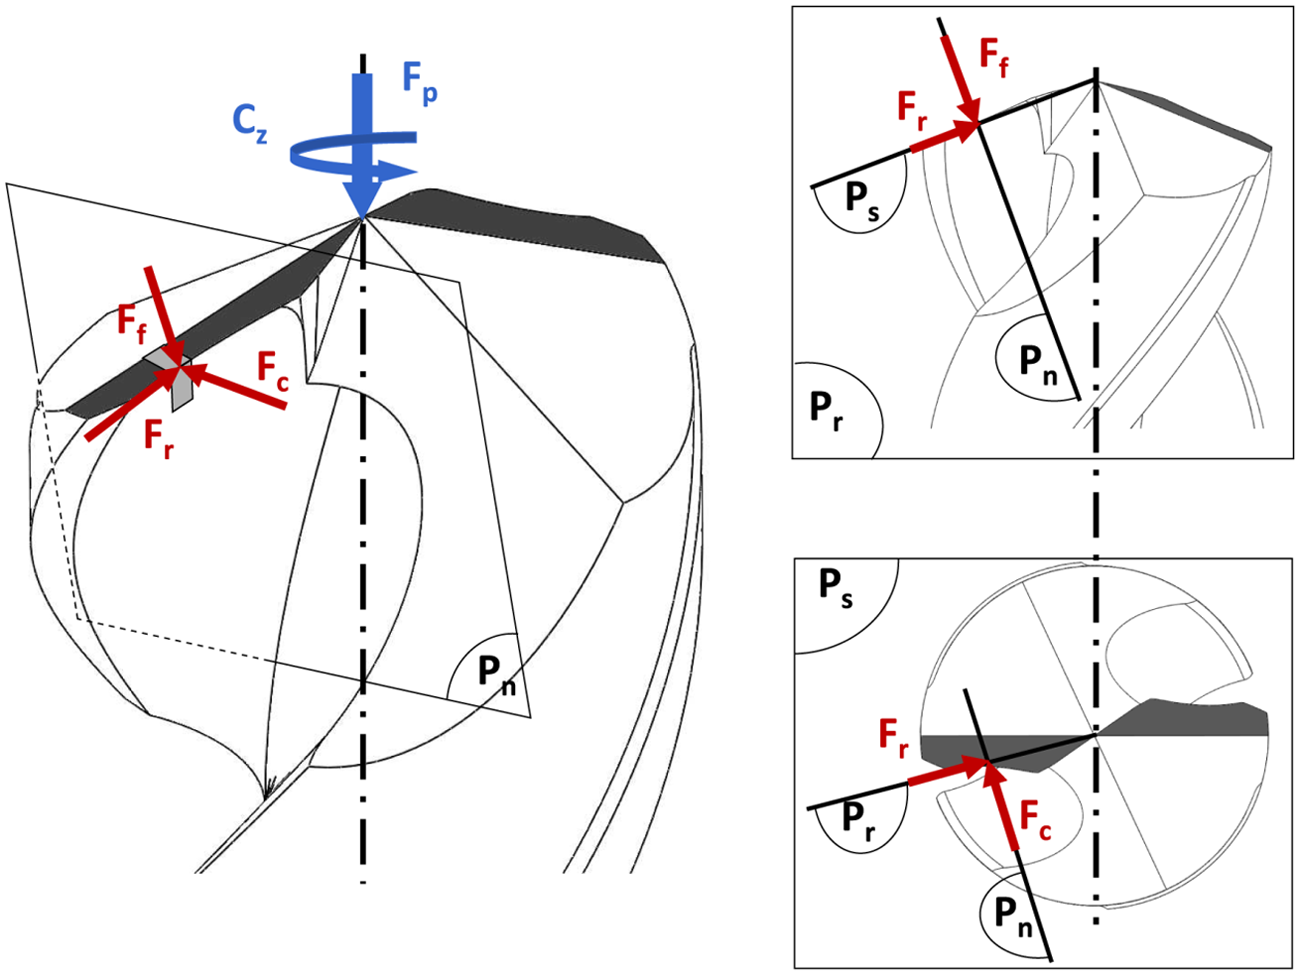
Forces on a local edge of the tool, according to the reference plane.
Figure 10 compares modeled and experimental forces for Tool 1. The torque is well represented by the present approach. Thrust force and torque increase when the feed rate increases. The thrust force is mainly dependent on the penetration force and radial force, which expose a more significant error than the cutting force. Since the model underestimates the feed force, the global thrust force is lower than the experimental one.
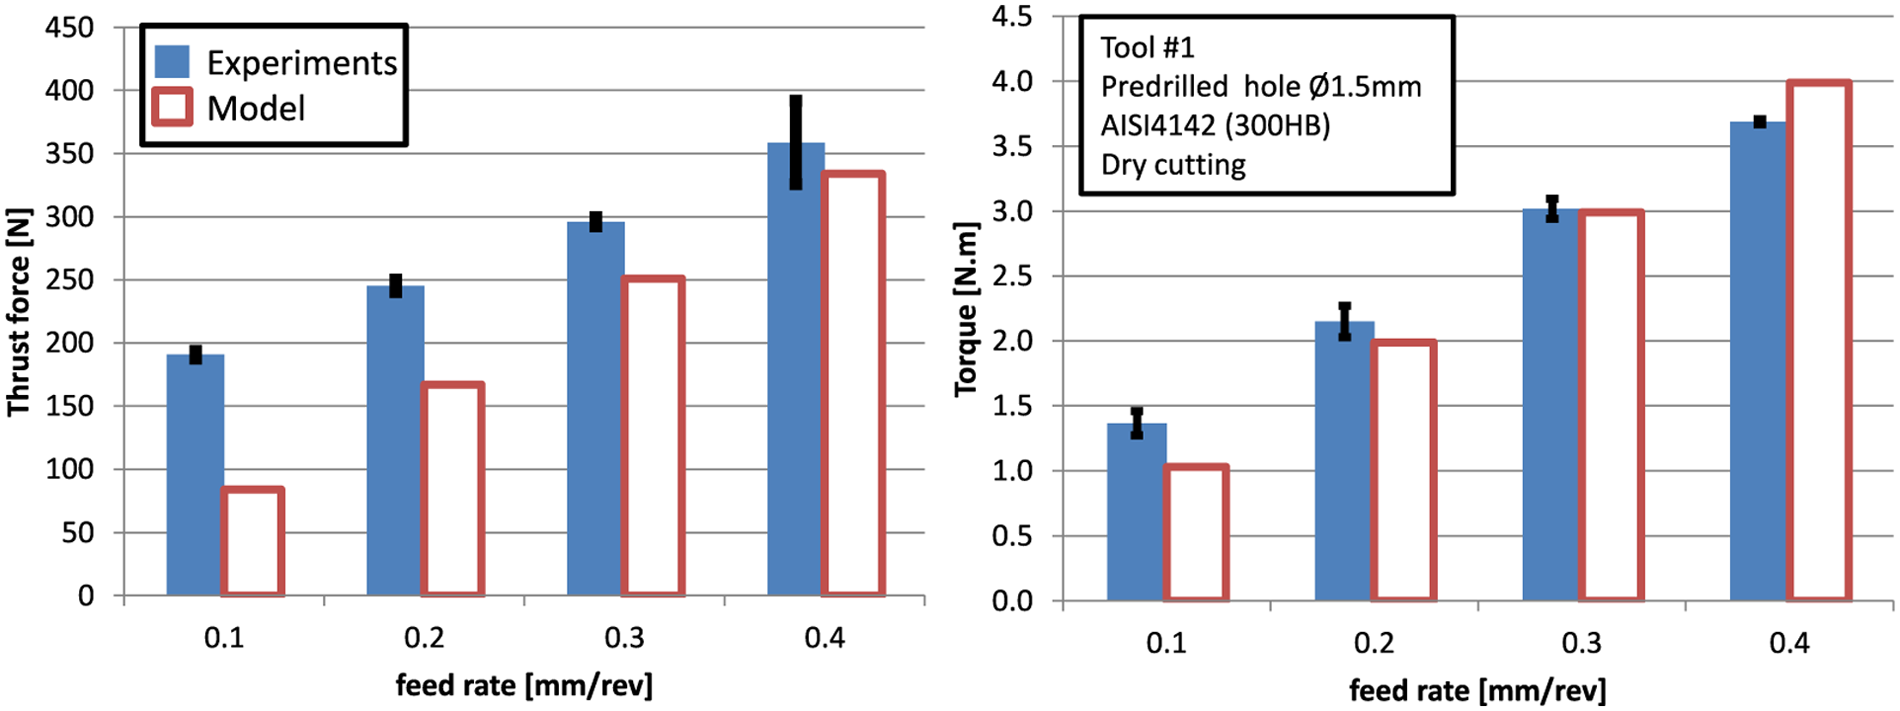
Thrust force and torque for main cutting edge with Ø
For Tool 2 geometry, the thrust force is always underestimated, as can be seen in Figure 11. In the
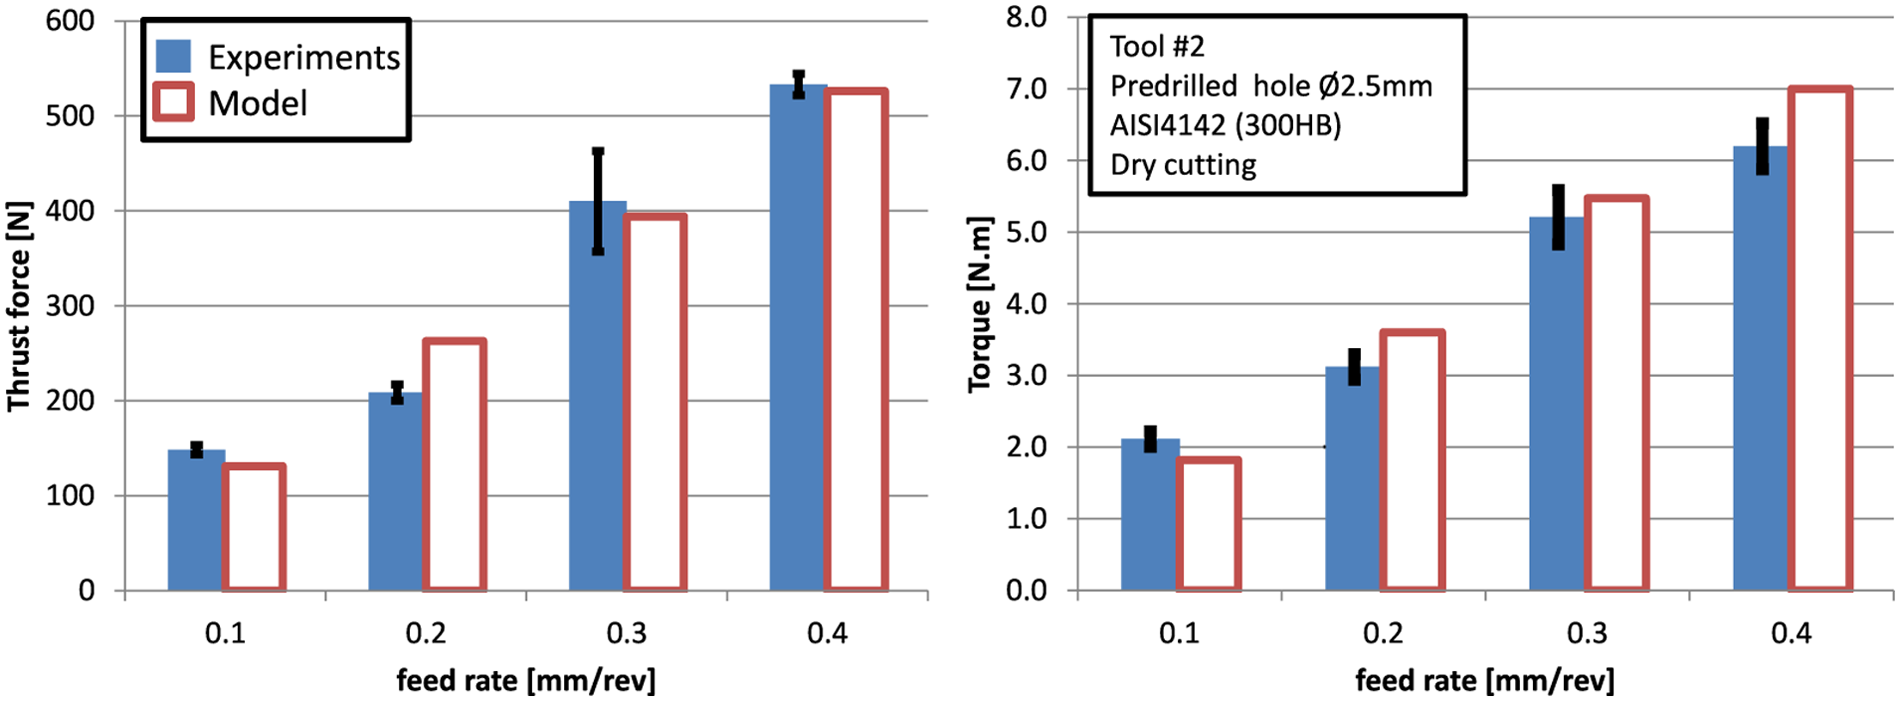
Thrust force and torque for main cutting edge with Ø
So, as one can see, the model presented, applied to the modeling of thrust force and torque in the case of two drill geometries, allows to predict the working of the tool with good accuracy. The feed rate is the main parameter in this case, while we also find a slight diminution of forces with the increase of the cutting speed. The torque is better modeled than the thrust force and for feed rates higher than
Two limits have been exposed in our approach. First, by discretization, the chip formation is assumed to be independent in each subedge, which is false in the case of drilling. The chip size evolution is much more complex and has to be more closely studied. Another limit is related to the partial simulation of thrust force and torque. In fact, it does not take into account the extrusion phenomenon occurring in the center of the drill. This zone of the tool drives about 60%–80% of the total thrust force and 10%–25% of the torque. The next step will be to add an analytical model, based on indentation theories, for example, and linked with a material behavior law.
Conclusion
The main interest of the approach presented in this article consists in a general cutting force model applied to a particular cutting edge. A really simple analytical force model has been used, coupled with three optimizations: variable friction coefficient, variable shear angle and a more realistic value for the chip flow angle. These ploys allow to find better results in the case of a pure cutting test, both in orthogonal and in oblique cutting configurations. The parameters of Merchant’s model are fitted on various cutting conditions (rake and inclination angles, cutting speed and feed rate) for a simple cutting edge. In this context, it is necessary to readjust the parameters of the plastic behavior of the material. To do so, a strategy has been defined, and an experimental device has been designed for varying operating conditions over a wide area. The results obtained show that the model predicts efforts with a reasonable error on a wide range of cutting conditions. This simple model has been applied to two complex tool geometries. The main cutting edge of the tool has been discretized, in order to analyze the evolution of the cutting configuration along the edge. Then, the local forces have been computed for each subedge. The model proposed in this article applied to drilling gives good results. Predicted forces compared to experimental results show good accuracy. Moreover, trends are respected, and the thrust force is underestimated by about 15%, while torque prediction has less than 10% error. Considering a simple Merchant’s model, and restrictive hypothesis, this result is acceptable. Moreover, this approach allows to predict forces for a virtual tool, which does not have to be ground already. Drills have been used here, but the analytical model is not restrictive, and it can be applied to other complex tool such as reamers or mills.
Footnotes
Acknowledgements
The authors wish to thank all the partners of this project, especially the Tivoly Group for drill supplying.
Declaration of conflicting interests
The authors declare that there is no conflict of interest.
Funding
This study has been carried out in the framework of Forage à grande vitesse vibratoire—FGVV project, which is supported by Viameca and Arve Industries group.