
Abstract
Robotic machining is one of the most versatile manufacturing technologies around, whose emergence helped reduce the machining cost of complex parts. However, its application is sometimes limited due to the low rigidity of the robot, whose stiffness leads to high vibration levels, which limit the quality and the precision of machined parts. In this study, the vibration response of a robotic machining system was investigated. To that end, a new method based on the variation of spindle speed was introduced for finishing the aluminum aerospace grade alloy (7075-T6) blocks. With the proposed method, the vibrations and the cutting force signal were collected and analyzed to find a reliable dynamic stability criterion, and the proposed criterion was validated using the machined surface roughness obtained. It was found that the directional root mean square (RMSdirectional) of the vibration signal is a good indicator for defining the degree of stability of the machining process. Moreover, it was observed that the spindle speed with the lowest RMSdirectional is the one that has the highest probability of generating the best surface finish. It was further demonstrated that the sensors are more efficient when positioned on the spindle. The proposed method is rapid and makes it possible to avoid trial and error tests during robot programming.
Keywords
Introduction
Robotic machining is one of the emerging technologies allowing cost reduction in manufacturing processes. Robots are flexible and can be used for versatile tasks. They offer a high degree of freedom and allow the shaping of complex parts. Nevertheless, they have two major limitations: their limited accuracy and their low rigidity. These two disadvantages limit the extent to which robots can be applied to high precision machining. For such applications, the companies prefer computer numerical control (CNC) machine tools, which provide recognized rigidity and accuracy. However, the low cost of robotic cells, when compared to that of CNC machine tools, has encouraged many companies to explore the use of robots for advanced machining operations. Many companies have successfully implemented their own robotic cells in machining, deburring and polishing processes, 1 while others sell packaged solutions for robotic machining cells. Most existing robotic machining cells are used to fill current company needs. However, these cells are not being used at their optimal efficiency levels, 2 with their programming requiring long setup times. The selection of cutting conditions is based mostly on the programmer’s experience and on trial and error tests. During the last few years, much research has been conducted to attempt to develop these tasks related to robotic machining.
Pan et al. 2 proposed a method for chatter detection during robotic machining. The authors studied high metal removal rates and demonstrated that the coupling mode is the main cause of chatter during robotic machining. Abele et al. 3 proposed an analytical method for predicting the compliance of robotic machining systems. The authors analyzed stiffness behavior during the milling process; the experiments were carried out for high material removal rates. Matsuoka et al. 4 presented an exhaustive study on the end-milling method using an articulated robot. To accommodate the low stiffness of the robot, the authors used a high spindle speed to reduce the cutting forces by 50%–70% during the machining of the 6063S-T5. The authors considered a roughing operation with a 1-mm depth of cut. It was observed that many researchers were interested in roughing operations using robotic machining systems as a result of the robot’s performance limitations in terms of accuracy and stiffness.
This study analyzed a finishing operation with a low material removal rate. Finishing operations of low-hardness materials (such as aluminum alloys) do not require high rigidity, making the application of the robot an adequate choice. The choice is acceptable if cutting conditions are properly selected, otherwise the produced part is unacceptable because of either its resulting poor surface or the high level of vibration marks present. To limit these two factors (surface roughness and vibration level), a new method is proposed in this article, with a variation of the spindle speed. The article begins by presenting details on the robotic machining problem, followed by the proposed methodology for overcoming this problem in section “Methodology.” Section “Results and discussion” presents the analysis and discussion of the results, while section “Conclusion” presents the conclusions and recommendations.
Problem of robotic machining for finishing operations
Robotic machining systems are characterized by low rigidity, as compared to machine tool systems. To overcome this limitation, machinists use low depths of cut and low feed rates, which help to significantly reduce the cutting forces, and the reduction of cutting forces can in turn reduce the vibration amplitude as well as produce a low chip load. The reduction in the chip load will in turn help avoid regenerative chatter. In fact, for finishing operations, there is no chip formation at low chip loads (2.5–5 µm) and low depths of cut (less than 0.5 mm). The “chip” obtained is sort of dusty, and as a result, regenerative chatter will be unlikely to occur because it does not generally occur at low depths of cut. 5
However, this strategy of reducing the chip load and the depth of cut will significantly increase the cycle time. Furthermore, this strategy will not allow the avoidance of chatter problems that can be caused by mode coupling or spindle speed modulation.
In addition, in finishing operations, machined surfaces must have an acceptable roughness. If the surface roughness is relatively high, it will result in a long cycle time for upcoming finishing operations (such as polishing). Therefore, it can be concluded that during the finishing operation, adequate machining parameters need to be selected in order to
Reduce the cycle time of the machining operation.
Avoid chatter problems (regenerative, coupled mode, modulation).
Obtain an acceptable surface roughness.
The first goal (in the above list) can be achieved by increasing the feed rate and the depth of cut to the maximum permissible values, which are essentially limited by the robot’s maximum load in each direction. For their part, the last two goals can be achieved by selecting stable machining conditions. To that end, a stability criterion must first be defined. A detailed list of criteria for detecting dynamic instabilities was proposed by Sims 6 in Machining Dynamics. There are many indicators that have been used for chatter detection, particularly for milling simulations. Smith and Tlusty 7 proposed the peak-to-peak forces method. This criterion showed that a drastic increase of the simulated cutting forces is observed when the limit of stability is reached. 8 Another approach based on chip thickness variation was introduced by Campomanes and Altintas. 9 The onset of chatter is indicated with a suitable threshold value. This method has been implemented successfully in a commercial program; nevertheless, it is not suitable for nonsimulated processes, since it requires chip thickness measurement. Other techniques in the frequency domain were introduced. These methods were based on the idea that the self-excited chatter vibration will occur at frequencies different from the force frequencies caused by the cutting process. The most straightforward method is using the fast Fourier transformation of the measured signal. 10 Other sophisticated techniques were introduced such as the power spectral density 11 or the cross-coherence method. 12 A major drawback of frequency domain techniques is that the magnitude of vibrations may be diluted due to stable region of cut. To overcome similar drawbacks, some authors introduced the use of spectrogram to detect the chatter. For the latter, results interpretation is difficult and automation cannot be achieved.
Most existing methods for stability detection characterize a machining operation as “stable” if it is not an “unstable operation.” (A detection method is a combination of the instability criterion and detection technique for the considered criterion.) However, for a finishing operation, it is more interesting to detect “the most stable operation” rather than the “unstable operation.” The authors of this article propose the use of the notion of degree of stability rather than an instability criterion. The new criterion is based on time domain that will avoid the problem of vibration dilution. This new method will indicate when the instability occurs, which will help to avoid undesirable robot configurations to achieve better stability. Finally, the introduced criterion can be automated as the interpretation is not complex as other sophisticated existing indicators.
Using the degree of stability, it is possible to find the most stable operation among several operations, and to that end, an experimental methodology was proposed to associate a degree of stability to a given combination of cutting parameters. The adopted methodology is explained in the following section.
Methodology
A new method with a variable spindle speed is proposed, allowing the vibration response for seven spindle speeds to be obtained in a single test lasting less than 30 s. A multiaxis contouring test with a variable spindle speed was designed and tested. Figure 1 presents the concept applied in testing several spindle speeds varying from 30 to 60 kilo revolution per minute (kr/min), with a step of 5 kr/min.
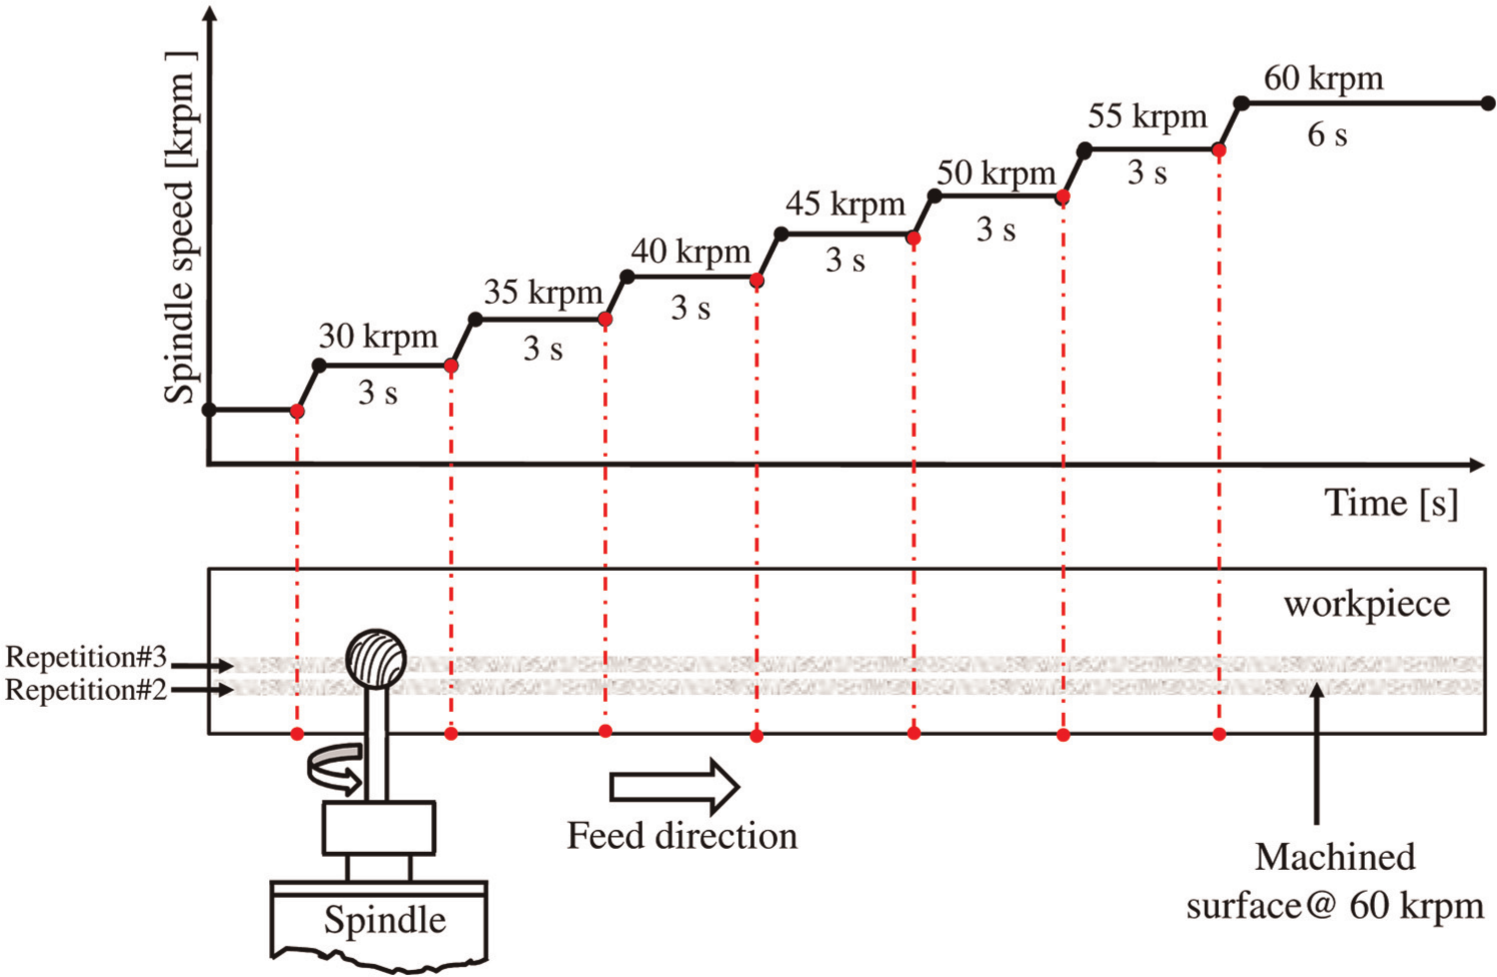
Proposed approach for testing several spindle speeds in a single machining test at a constant feed rate.
The proposed approach was programmed in Catia V5® to generate the APT program, which was postprocessed using a C++ code and then tested offline on a simulation platform (robot-studio®). The experimental setup used to test the final program is described in the following section.
Experimental setup
The experimental setup presented in Figure 2 shows the ABB-IRB1600 robot (1) used on which an aluminum bracket (2) was screwed for handling the high-speed spindle SLF FS33-60/0.15 (3). A solid carbide cutting tool (4) was manually attached to the spindle and would be used to machine the surface of an aluminum alloy block (AA 7075-T6) (5). The block (127 × 177.8 × 76.2 mm) was set on a three-axis dynamometer, Kistler table 9255B (6), using a three-metric screw, with a tightening torque of 20 N m. The assembly (block + screws + dynamometer) was mounted on a T-slotted table, which was leveled before the assembly was installed. The dynamometer was used to estimate the cutting forces during the machining operation. In addition, a triaxial accelerometer (ENDEVCO, Model 63B-100, SN10526) was screwed on to the workpiece for use in measuring its vibrations. Another accelerometer of the same model was screwed on the spindle bracket to measure the vibration on the spindle. A third “watchdog” uniaxial accelerometer was used for controlling and checking the results obtained and was attached to the workpiece using wax. The coordinate system and the accelerometer positions used are presented in Figure 3. The same coordinate system and the same robot configuration were kept for all machining tests. For all cutting tests, the direction of cutting was in Y direction, as shown in Figure 3.
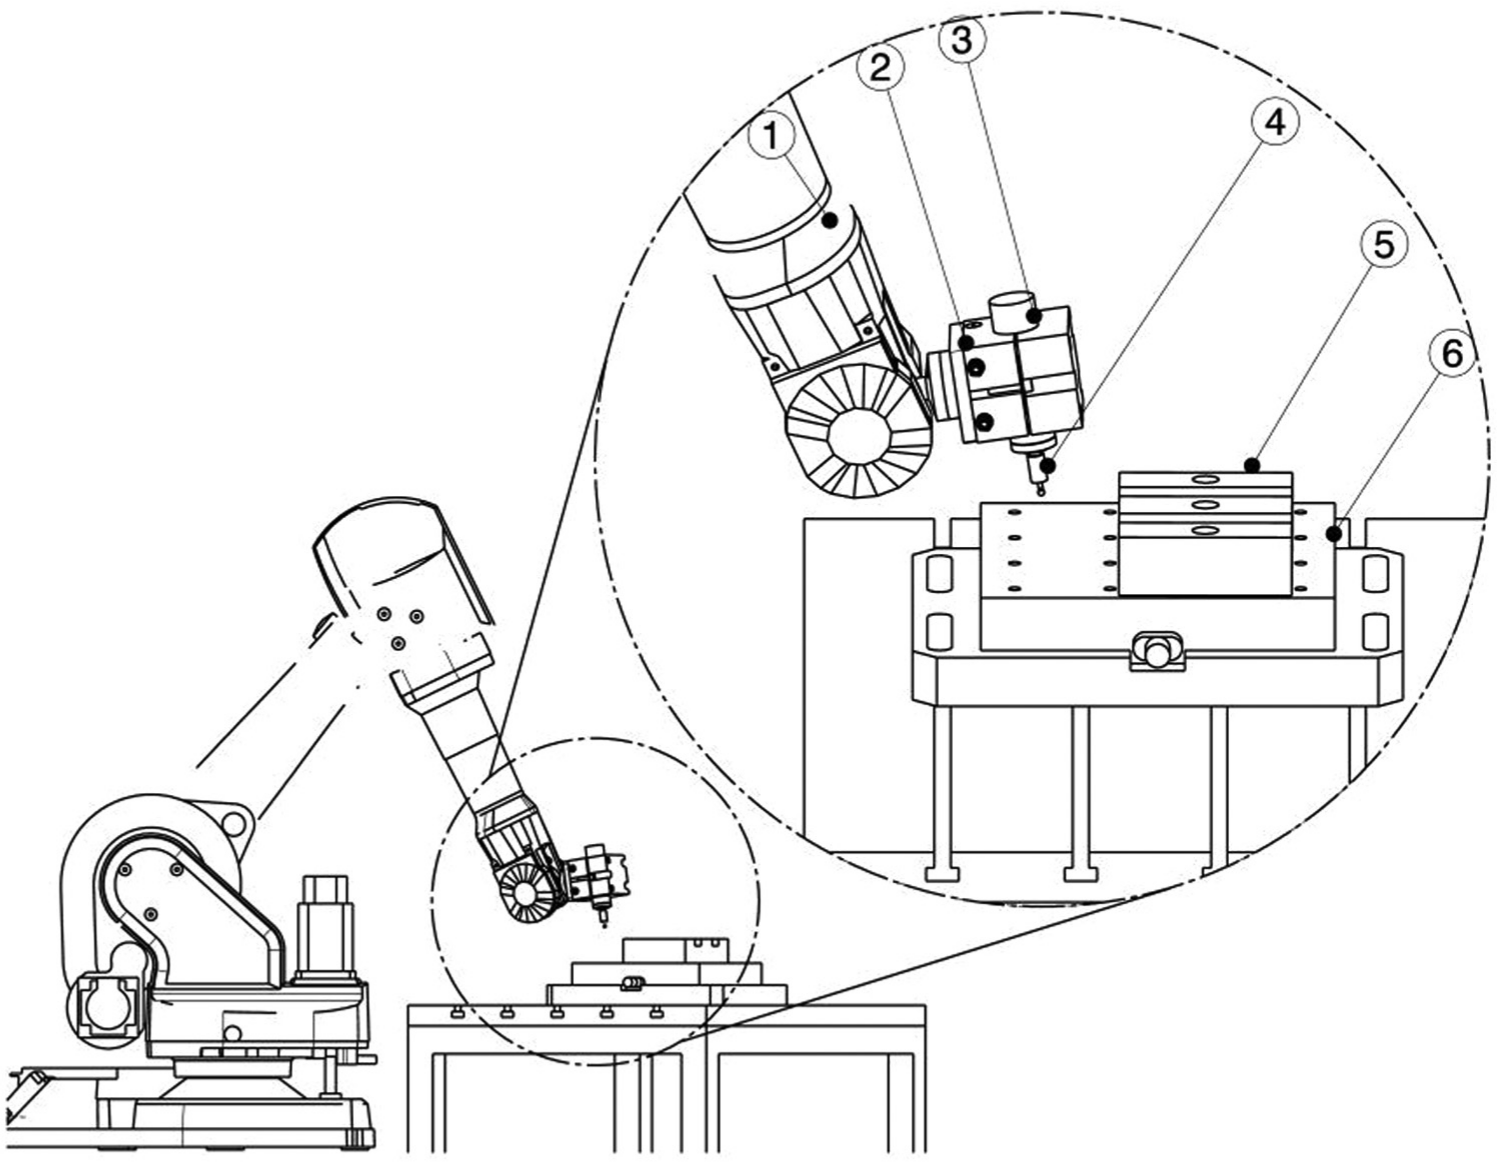
Experimental setup used during the machining tests (1) ABB-IRB 1600 robot, (2) aluminum bracket, (3) SLF FS33-60/0.15 spindle, (4) solid carbide tool, (5) workpiece (AA 7075-T6), and (6) three-axis dynamometer Kistler table, 9255B.
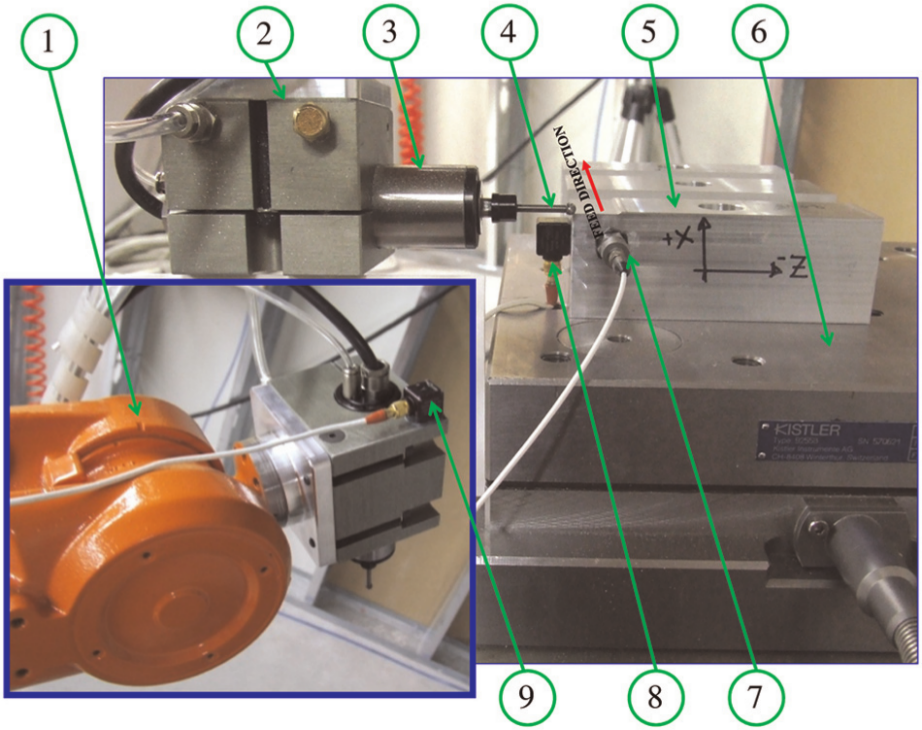
Two photos of the experimental setup, showing the coordinate system and the position of the accelerometers. (1) ABB-IRB 1600 robot, (2) aluminum bracket, (3) SLF FS33-60/0.15 spindle, (4) solid carbide tool and tool holder, (5) workpiece (AA 7075-T6), (6) three-axis dynamometer (Kistler table 9255B), (7) uniaxial accelerometer PCB, (8) triaxial accelerometer (ENDEVCO, Model 63B-100) attached to the part, and (9) triaxial accelerometer (ENDEVCO, Model 63B-100, SN10526) attached to the spindle.
Data acquisition
Two systems were used to acquire the data generated during these tests. First, a MATLAB-based data acquisition system for force measuring was used with a data translation (DT) acquisition card (Data Translation 3000). The sampling frequency was set at 48 kHz, for an acquisition time of 30 s. No filtering was applied on the signals in order to allow the detection of the slightest chatter signals. The second acquisition system was an LMS Scada III system for vibration measures. Seven of the system’s eight channels were used for acquiring the vibration signals. The system was set at a sampling frequency of 40,960 Hz, for an acquisition time of 30 s. The cutting force signals obtained and the signals of the vibrations were exported to MATLAB for further analysis.
Results and discussion
It is known that the vibration response of a machining system is random, and so repeatability of results obtained must therefore be verified. To that end, the machining tests were repeated at least four times under the same machining conditions, and the results obtained exhibited a good repeatability of the vibration response in terms of form and amplitude, as shown in Figure 4.
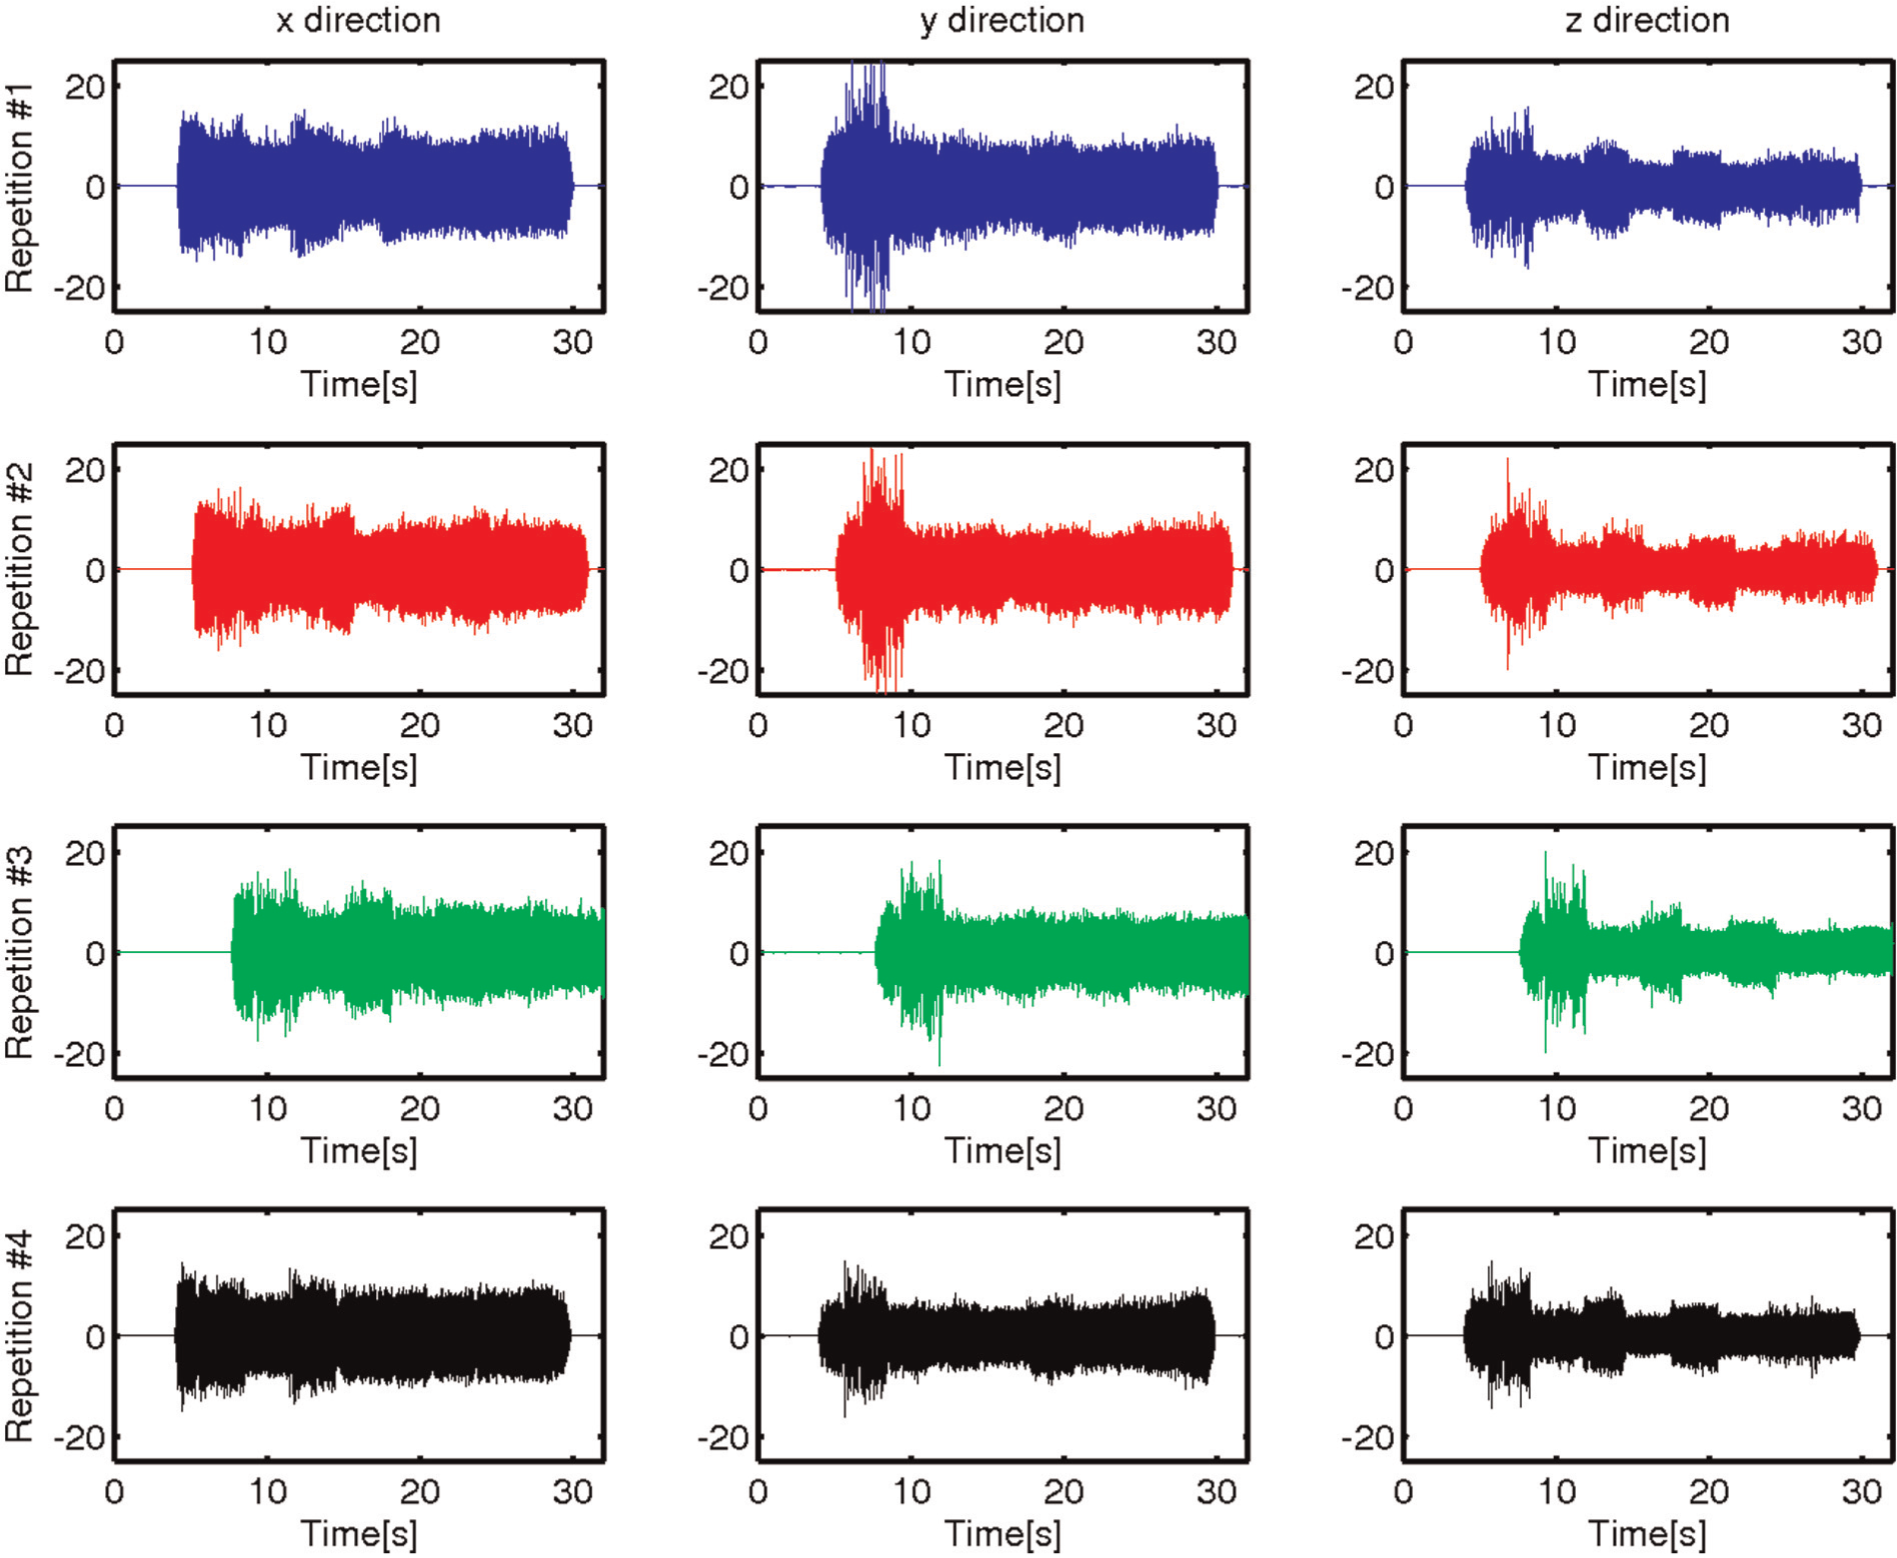
Testing of the repeatability of the vibration response during robotic machining. Each row presents a repetition and each column corresponds to one of the three directions, x, y and z.
In Figure 4, each row presents the vibration signals obtained in the three directions (x, y and z) during one of the four repetitions. When observing one column of Figure 4, it can be concluded that the form and the amplitude of the vibration response are similar from one repetition to the next. Nevertheless, this “visual inspection” cannot be used to further analyze the results obtained. Moreover, in practical terms, the user needs numerical values to characterize the vibration response obtained. One powerful tool available for characterizing the vibration signal is statistical indicator implementation. The following statistical indicators were considered during this study in order to characterize the vibration response of the robotic machining system:
Kurtosis factor
Root mean square (RMS) factor
Peak-to-peak (pk2pk) factor
Crete factor (CF)
Skewness
Variance
The procedure proposed for estimating the above statistical indicators is schematized in Figure 5. Figure 5 shows a typical vibration signal presented in the time domain in the upper subplot, with a spectrogram presented in the lower subplot. The spectrogram can be obtained through the application of a short-time Fourier transform (STFT) on the temporal response, as shown in Figure 6(b).
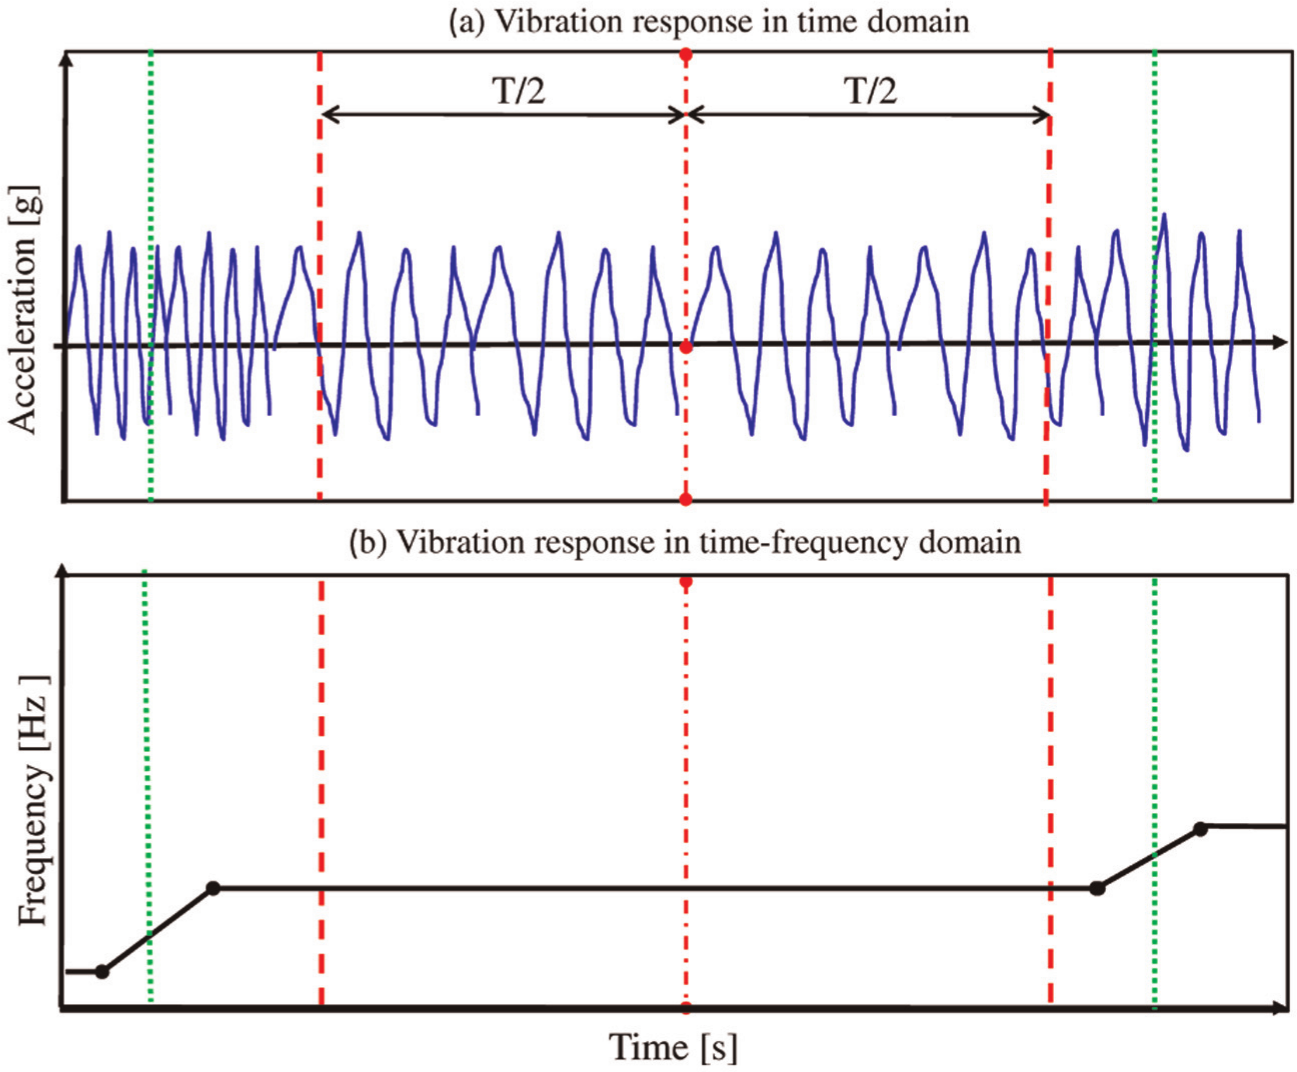
Procedure used to estimate the statistical indicators during variable machining tests: (a) the statistical indicator of the temporal signal is estimated over the time period (T) and (b) this subplot allows the determination of the permanent regime and its middle point.
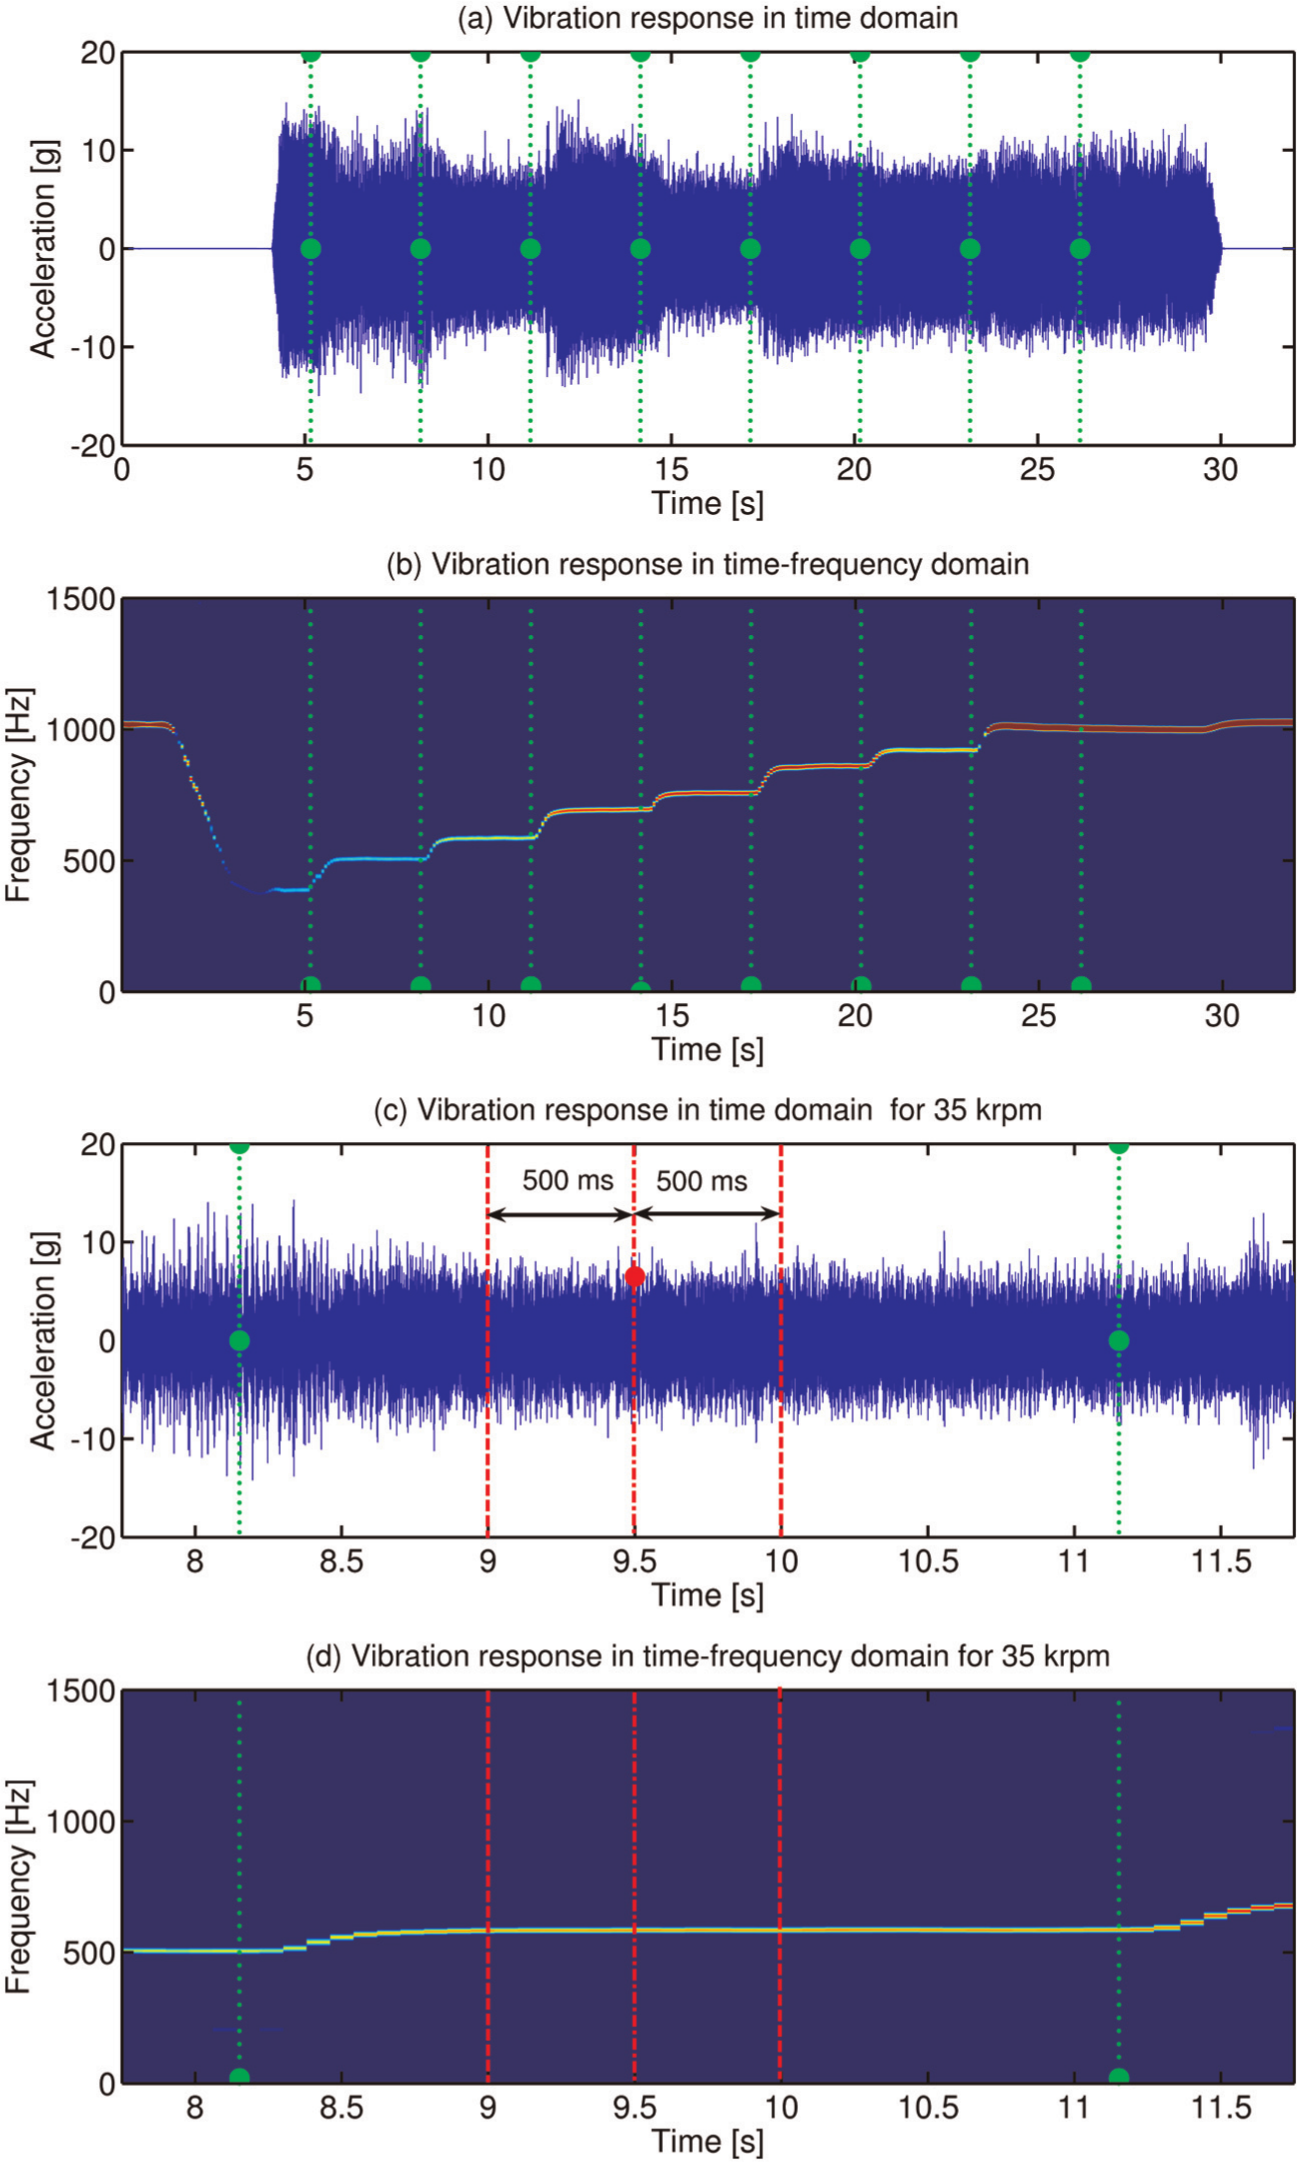
The procedure presented in Figure 5 was applied to the signal obtained in the z direction during one of the machining tests: (a) vibration response in the time domain, (b) spectrogram of the same signal, (c) one portion of the signal corresponding to the second spindle speed, 35 kr/min, with T = 500 ms, and (d) corresponding spectrogram of the portion presented in (c). Cutting conditions—tool: solid carbide ball nose (Ø 4.76 mm); feed: 2 mm/s; doc: 0.254 mm; dry machining of the AA7075-T6; machining system: ABB robot IRB-1600. The acceleration signals were collected on the spindle using a triaxial accelerometer (ENDEVCO, Model 63B-100, SN10526).
The spectrogram allows the determination of the start and finish points of the permanent regime, and once the two points are known, the middle point of the regime can be determined: Middle point = start point + (cutting time)/2. The statistical indicator is then estimated over the time interval: (middle point − T/2, middle point + T/2). The procedure described (presented in Figure 5) was applied on the vibration signal on the spindle in the z direction. The results obtained are presented in Figure 6(a) for the whole signal and in Figure 6(b) for a single speed. The results presented were estimated over a period of 1000 ms as each statistical indicator needs a defined time period for being estimated. To scrupulously define the time period estimation of the statistical indicator, two major factors should be considered:
Avoidance of boundary effects. This factor can be satisfied by choosing a time period estimation in the permanent regime of the machining process. Therefore, the transitional period will not be included in the estimation of the statistical indicator.
Choice of a time period estimation having a representative length of the machining process. This factor can be satisfied by avoiding period estimation with lengths that can significantly affect the statistical indicators. To find the adequate period estimation length of the statistical indicators, different time period estimation values were chosen (125, 250, 1000 and 1500 ms), and the statistical indicators were estimated for each of these chosen values.
The results found are presented in Figure 7. Each subplot in the figure presents a statistical indicator (Figure 7(a), the kurtosis factor; Figure 7(b), the RMS factor; Figure 7(c), the skewness factor; Figure 7(d), the CF; Figure 7(e), the peak-to-peak factor and Figure 7(f), variance). Each subplot of Figure 7 presents a statistical indicator at different spindle speeds for different estimation periods: 125, 250, 1000 and 1500 ms. If an indicator is not significantly affected by the duration of the estimation period, the indicator will stay unchanged for different estimation periods. The constancy of an indicator can be visualized graphically by superposed curves (as in Figure 7(a), (b) and (f)). From the results presented in Figure 7, it can be concluded that kurtosis, RMS and the variance factors are the statistical indicators that do not depend significantly on the duration of the period estimation. In fact, Figure 7(a), (b) and (f) shows a good superposition of the curves obtained for time intervals greater than 125 ms, for the majority of the spindle speeds tested. In addition, it should be noted that the mathematical definitions of the RMS factor and the variance are very similar. The RMS and the variance factors (Figure 7(c) and (f)) thus demonstrate the same tendency with respect to the machining process vibration response, and as a result, using the RMS or variance will provide the same results (concerning the process stability). Given all these observations, only the RMS and the kurtosis factors were retained from the six statistical indicators to characterize the vibration response of the robotic machining system.
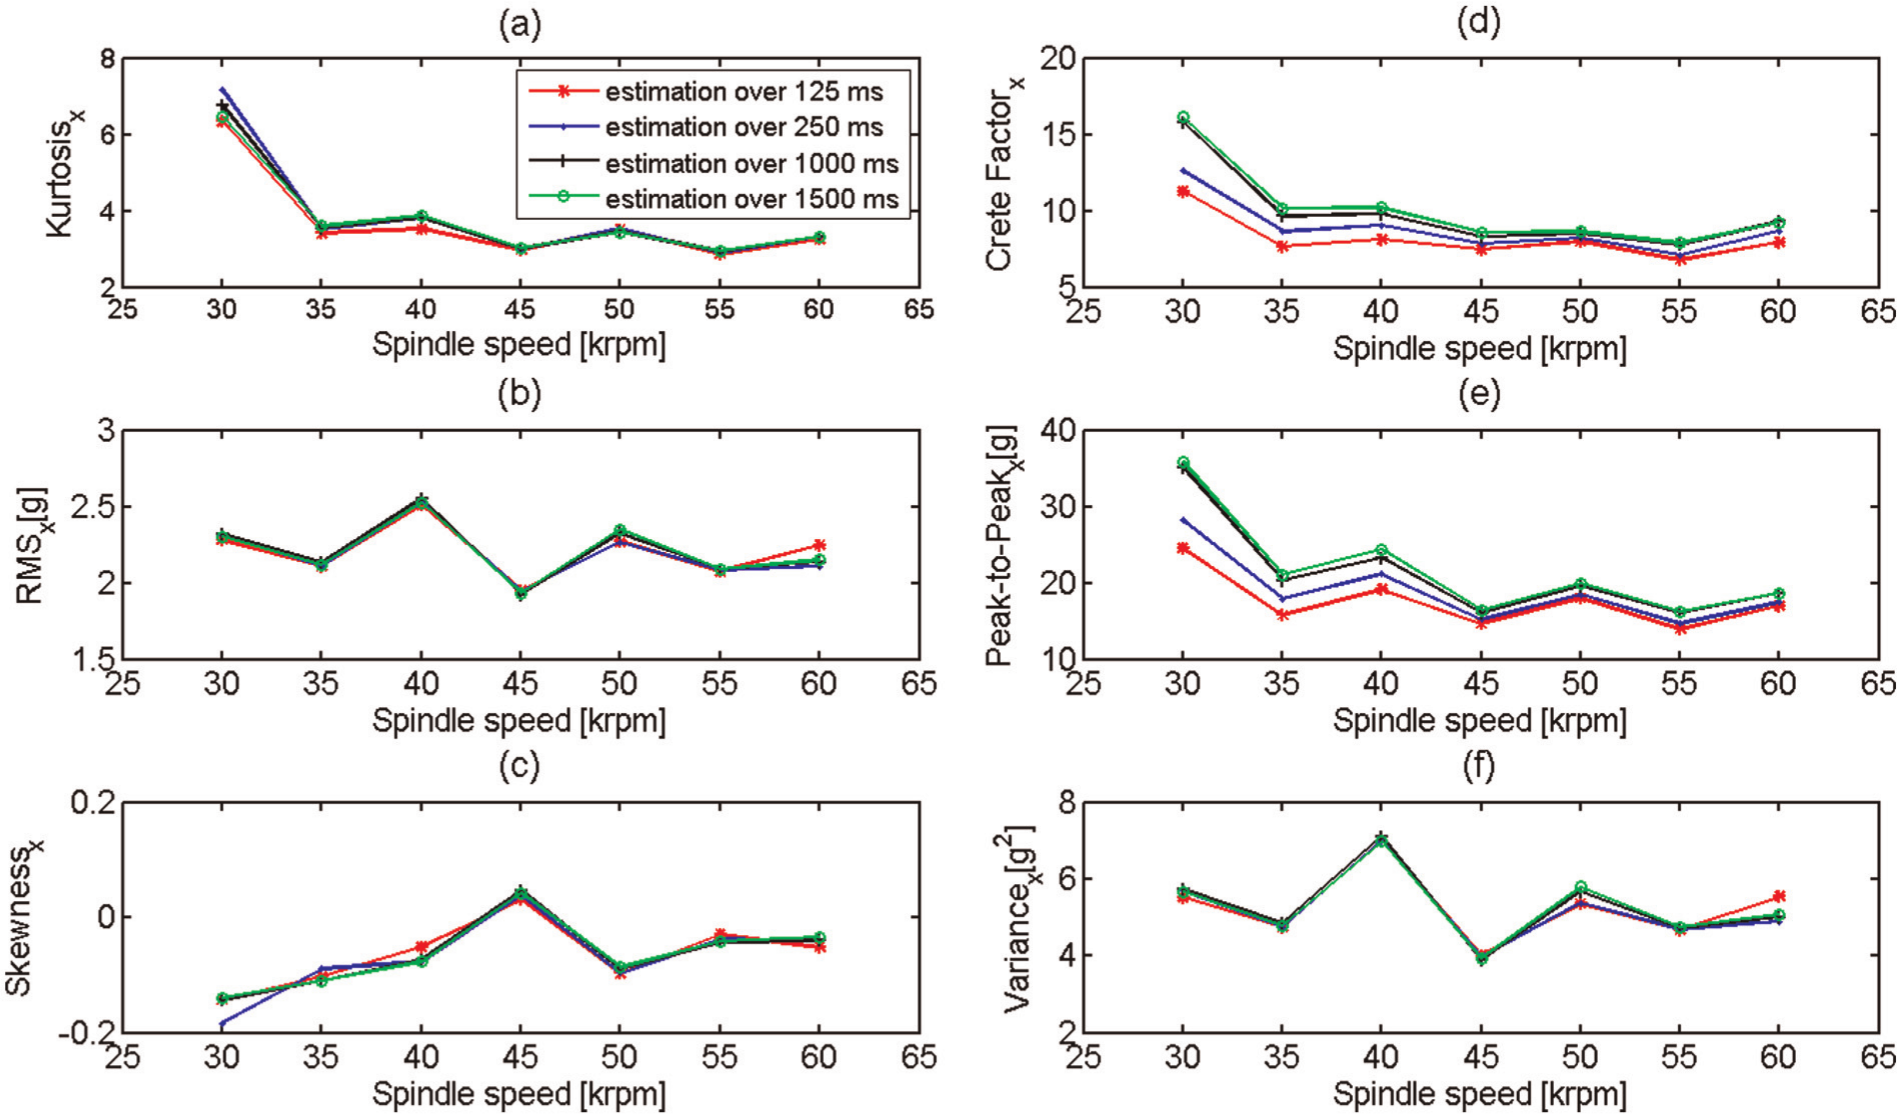
Effect of the period estimation length on the six statistical indicators: (a) kurtosis factor, (b) RMS factor, (c) skewness factor, (d) crete factor, (e) peak-to-peak factor and (f) variance. The statistical indicators were calculated on the same vibration signal generated during the same machining test.
Once the useful statistical indicators are identified (useful for studying the process stability), the direction to be studied will need to be chosen: a decision should be made as to whether it is the x direction, the y direction or the z direction. Many authors suggest that the most interesting direction is the feed direction (the y direction, in this case). When observing the temporal vibration signals in the three directions, x, y and z, a similarity can be seen between the three temporal vibration signals, as shown in Figure 8.
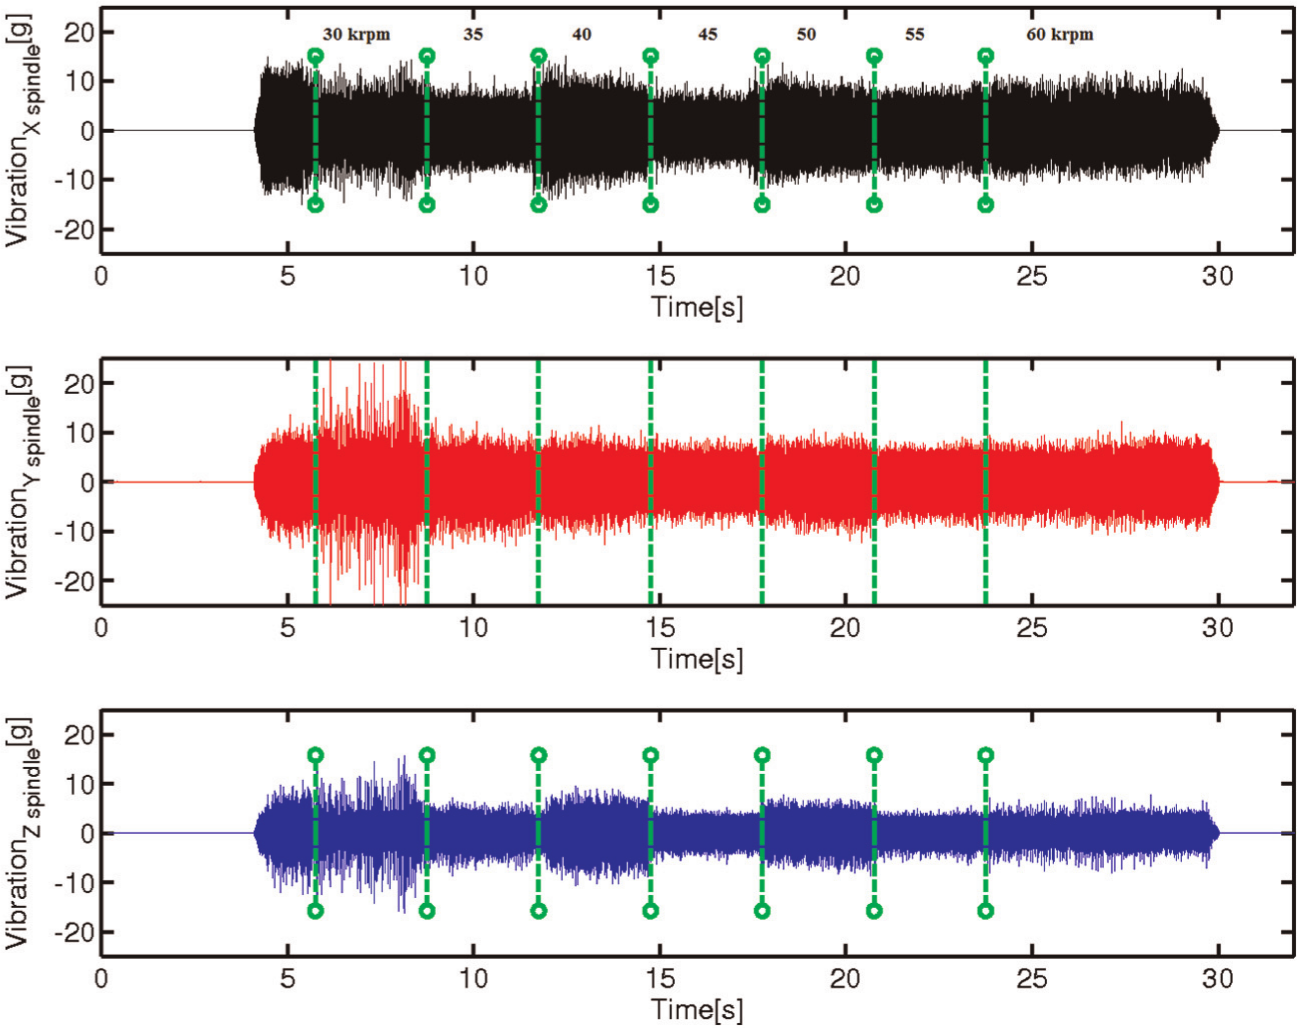
Comparison of the vibration response in three different directions. The dashed lines indicate a spindle speed change. Cutting conditions—tool: solid carbide ball nose (Ø 4.76 mm); feed: 2 mm/s; doc: 0.254 mm; dry machining of AA7075-T6; machining system: ABB robot IRB-1600. The acceleration signals were collected on the spindle using a triaxial accelerometer (ENDEVCO, Model 63B-100, SN10526).
Figure 8 shows the vibration response of the robotic machining system for different spindle speeds in the three directions, x, y and z. The signals presented were collected out of the accelerometer attached to the spindle. In Figure 8, it can be observed that the three signals are similar in form. As for the signal amplitude, the signal in z direction seems to have an amplitude vibration that is weaker than that of the x and y directions. This behavior may be due to a low cutting force in the z direction or a high rigidity of the robot in the z direction. To explain this behavior, the cutting forces collected during this test are presented in Figure 9 for the three directions, x, y and z. This figure shows that the direction which, relatively speaking, has the lowest amplitude vibration (the z direction, in the present case) is not the one with the lowest cutting force (which is the x direction, in this case). This means that the cutting force in the z direction was high, but the amplitude vibration level was low. Therefore, the low-amplitude vibration in the z direction, for the seven spindle speeds, is probably due to the high rigidity of the robot in the same direction.
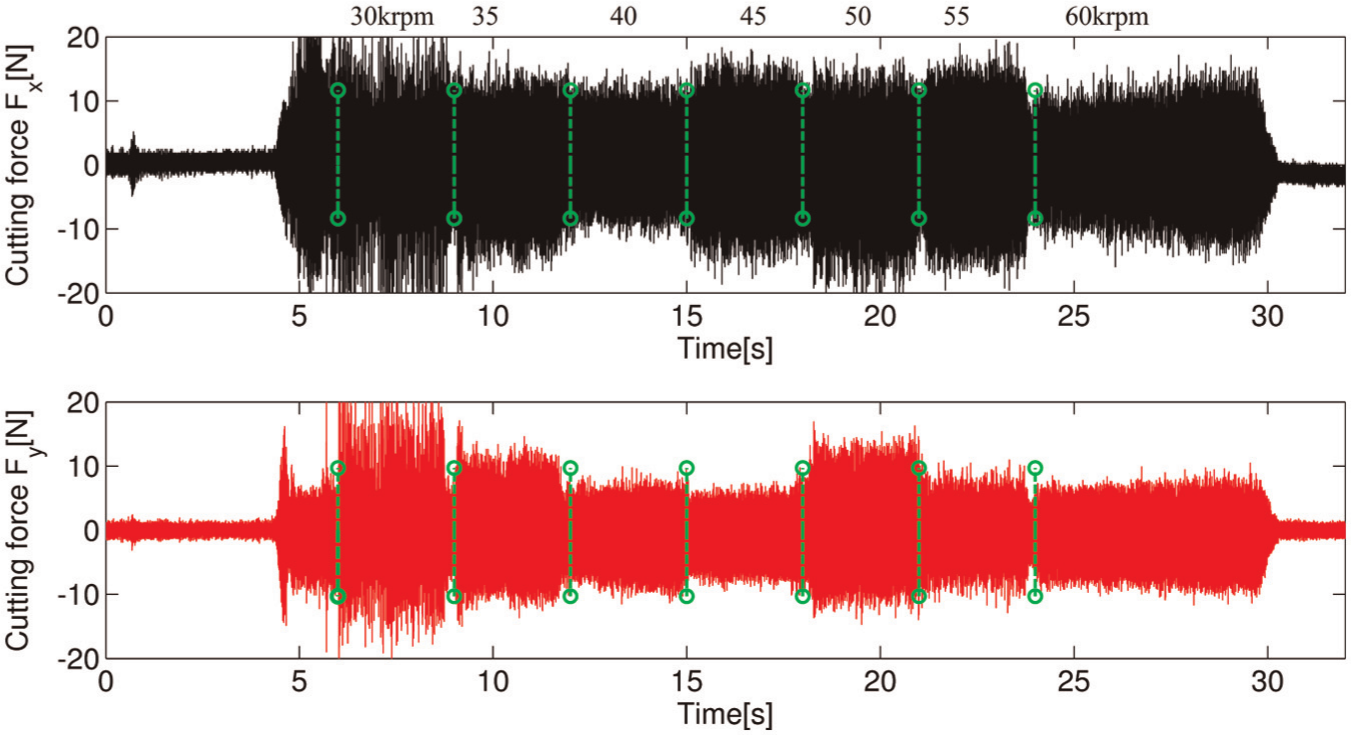
Comparison of the cutting forces in two different directions. The dashed lines indicate a spindle speed change. Cutting conditions—tool: solid carbide ball nose (Ø 4.76 mm); feed: 2 mm/s; doc: 0.254 mm, dry machining of 7075-T6; machining system: ABB robot IRB-1600. The cutting forces were collected using a three-axis dynamometer (Kistler 9255B).
From the analysis above, it can be concluded that the difference between the robot stiffnesses in the three directions can cause significant difference in the vibration amplitudes. Therefore, it is inadequate to use the amplitude of the cutting forces only to study the robotic machining system stability. This is because in a given direction the vibration response depends on both the cutting force and the robot stiffness in that direction.
In addition, it is inadequate to use the amplitude vibration of a single direction to study the robotic machining system stability as the rigidity of the robot largely depends on the considered direction.
To confirm that it is inadequate to use a single direction to study the process stability, the vibration results (RMS and kurtosis) in the three directions for different spindle speeds were plotted (Figure 10). For a given statistical indicator, if the curves (of the three directions) were perfectly parallel, it meant that the obtained signal in the three directions could provide the same information (concerning the machining process). That is not the case for the analyzed results, as shown in Figure 10.
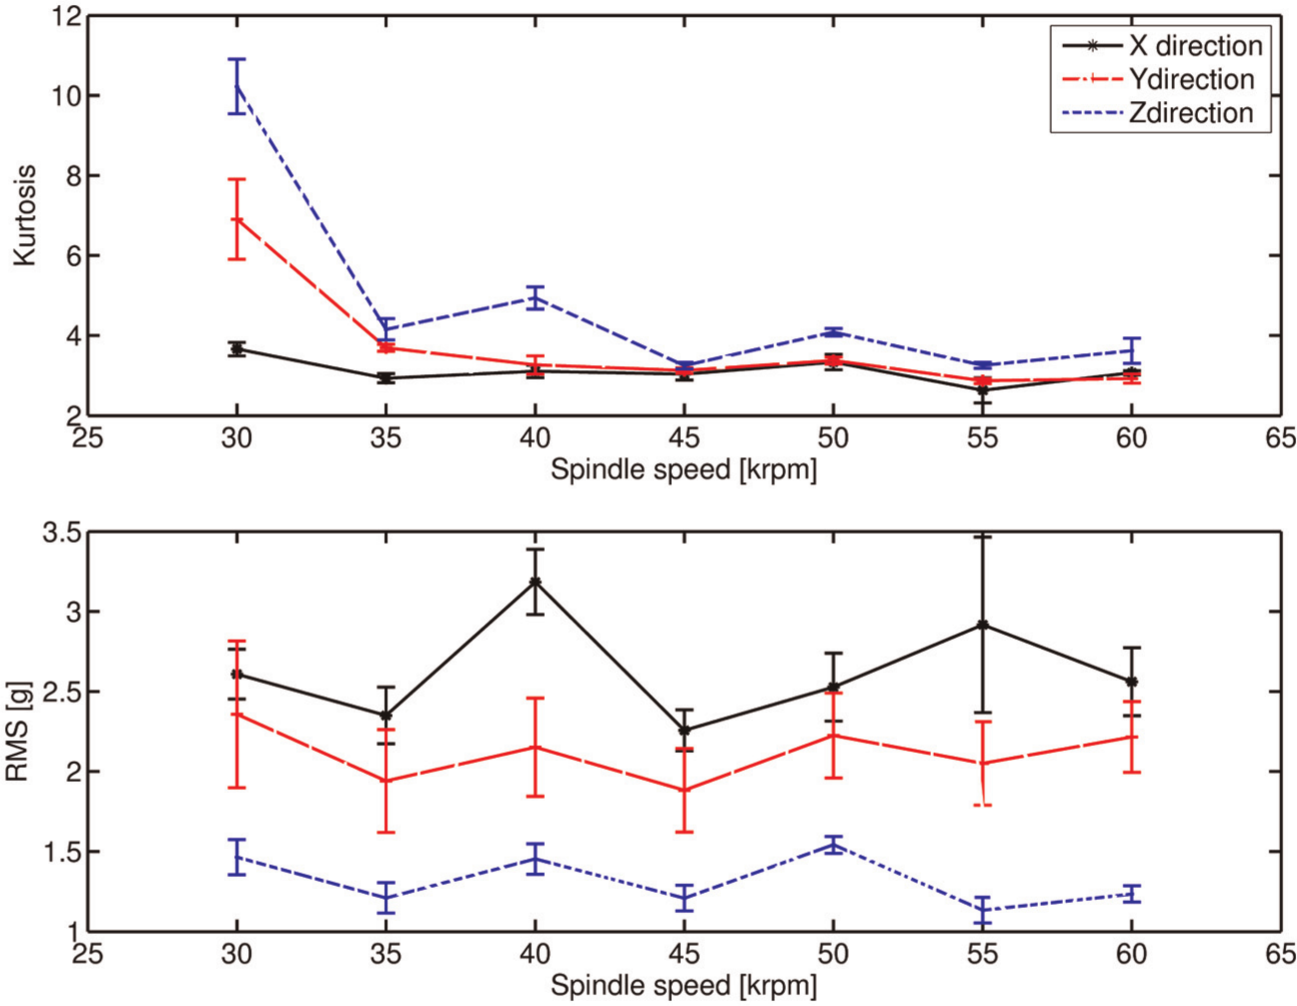
Variation of the RMS factor and the kurtosis factor of the vibration signal in the different directions at different spindle speeds. Cutting conditions—tool: carbide ball nose 3/16; feed: 2 mm/s; doc: 0.254 mm, dry machining of AA7075-T6; machining system: ABB robot IRB-1600.
Each point of the curves, presented in Figure 10, is the average value of four to eight repetitions. The confidence intervals in the same figure were estimated at a 5% risk error. It can be observed in Figure 10 that the kurtosis and the RMS do not tend in the same direction with respect to the machining process when the spindle speed is altered. Therefore, it is preferable to use indicators that give a noncontradictory and reliable result. The authors preferred to waive the kurtosis and retain the RMS for the rest of the study.
Since three RMS factors (RMS x , RMS y and RMS z (one factor in each direction)) are available, a mathematical formulation should be proposed for studying the process stability, and the formulation must depend on the three factors. To that end, it is possible to use a summative or a multiplicative formulation between RMS x , RMS y and RMS z . Figure 11 presents the results obtained for two different mathematical formulations—the first being a summative relation and the second a multiplicative relation.
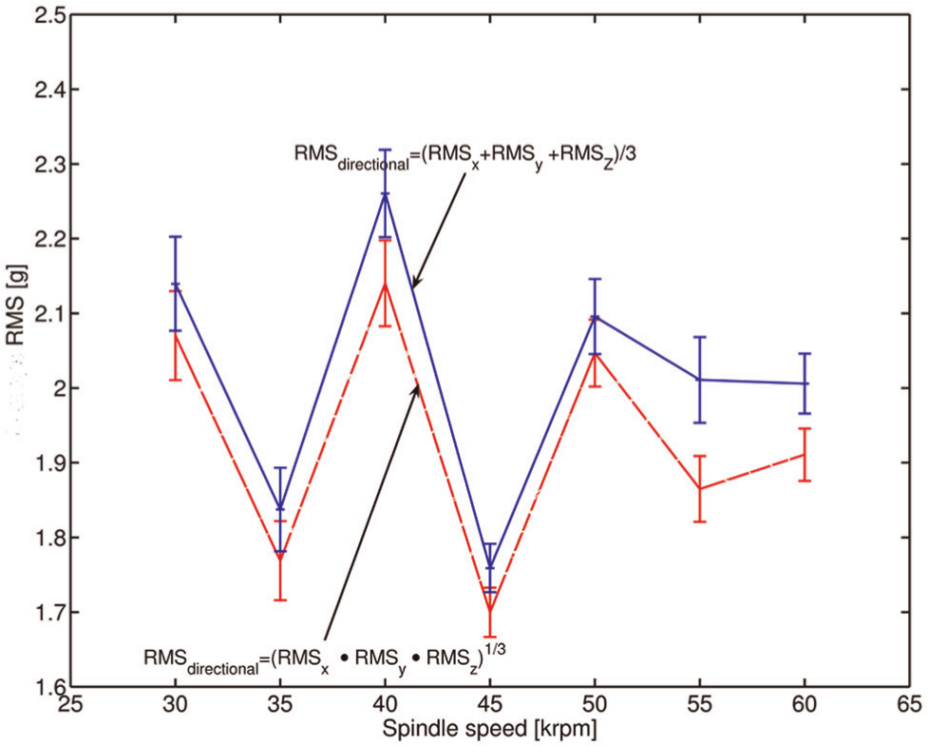
Comparison of a summative and a multiplicative mathematical formulation on the three RMS factors: RMS x , RMS y and RMS z .
Figure 11 shows that both formulations, the summative relation and the multiplicative relation, mainly tend in the same direction with respect to the machining process. The authors preferred to retain the summative relation because the proposed indicator in the summative formulation is physically interpretable. The indicator obtained from the summative relation is the average RMS of the three directions (this indicator will be known as RMSdirectional for the rest of this analysis). This statistical indicator, the RMSdirectional, can be interpreted physically as “the average vibration energy perceived by each direction during the machining process.” It should be underlined that the RMSdirectional presents only a portion of the total vibration energy generated during the machining operation. In fact, the accelerometer placed on the spindle will perceive only a part of the total generated vibration energy during the machining process. The RMSdirectional will be used to decide on the “relative dynamic stability” of the robotic machining process. The “relative dynamic stability” can be paraphrased as “Associate a degree of stability to a given combination of cutting conditions (speed, feed, depth of cut, etc.).” It is known that the averaged signal power of a stable cutting process is lower than the averaged signal power of an unstable cutting process.13,14 Many authors in the field of machine tool dynamics15,16 used this criterion to detect regenerative chatter. Generally, the authors consider the squared value of averaged power of the vibrational response in the feeding direction. This criterion succeeded to detect the regenerative chatter for three main reasons:
First, the machine tools have, generally, a symmetric structure.
In addition, the machine tool dynamic parameters are considered time independent, especially in the case of low spindle speeds.
Finally, in the case of machine tool regenerative, the vibrations are generally occurring in one plane.
In the case of robotic machining, the robot structure is not symmetric; the dynamic parameters of the robot are time dependent especially when operating at high spindle speeds. Finally, the chattering may occur simultaneously in more than one plane. Due to these reasons, it will be interesting to consider the vibrational response of the robot in the three directions simultaneously. Then, the defined physical criterion for estimating the degree of the process stability will be defined as RMSdirectional
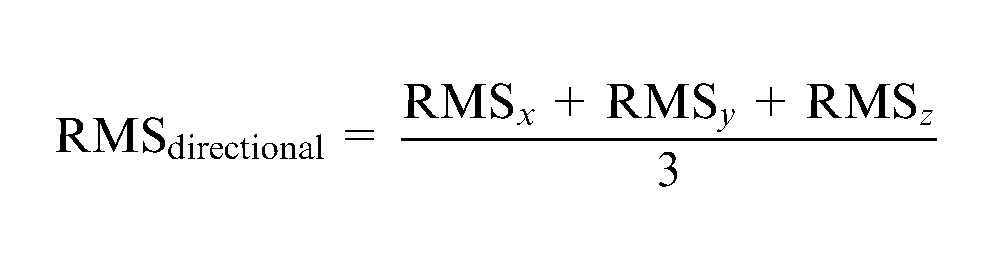
where RMS x , RMS y and RMS z represent the RMS factor of the signal in the x direction, the y direction and the z direction, respectively. The RMSdirectional criterion will be used to classify different combinations of cutting parameters. To prove that this criterion is practically valuable, field verification will be done by checking the roughness of the machined surface. In fact, it is expected that the combination of cutting parameters with the highest degree of relative stability will generate the best surface finish for a given criterion o such as Ra or Rq.
The proposed approach was applied to the vibration signals obtained under the following machining conditions:
Tool: carbide ball nose with a diameter of 4.76 mm (3/16 inch)
Workpiece material: aluminum alloy AA7075-T6
Feed: 2 mm/s
Depth of cut: 0.254 mm
Spindle speed: 30, 35, 40, 45, 50, 55 and 60 kr/min
Lubrication: dry machining
Machining system: ABB robot IRB-1600
Test repetition: four times
Figure 12(a) presents a variation of the RMSdirectional at seven spindle speeds changing from 30 to 60 kr/min, with a step of 5 kr/min. The results presented in Figure 10(a) were estimated on the signals of acceleration collected on the spindle. In addition, the vibration signals were collected during the tests on the machined part. The estimated RMSdirectional for these results is presented in Figure 12(b). Figure 12(a) and (b) shows, on the one hand, that for several repetitions of the same test, the tendency is the same, either on the workpiece or on the spindle; on the other hand, when comparing the scale of Figure 12(c) to that of Figure 12(d), it can be observed that the vibration amplitude is higher on the part (Figure 12(c)) than on the spindle (Figure 12(d)). This may be explained by the fact that the accelerometer attached to the part is much closer to the vibration source. Therefore, the vibration signal perceived by the accelerometer attached to the part is probably not as damped as compared to the signal perceived by the accelerometer on the spindle.
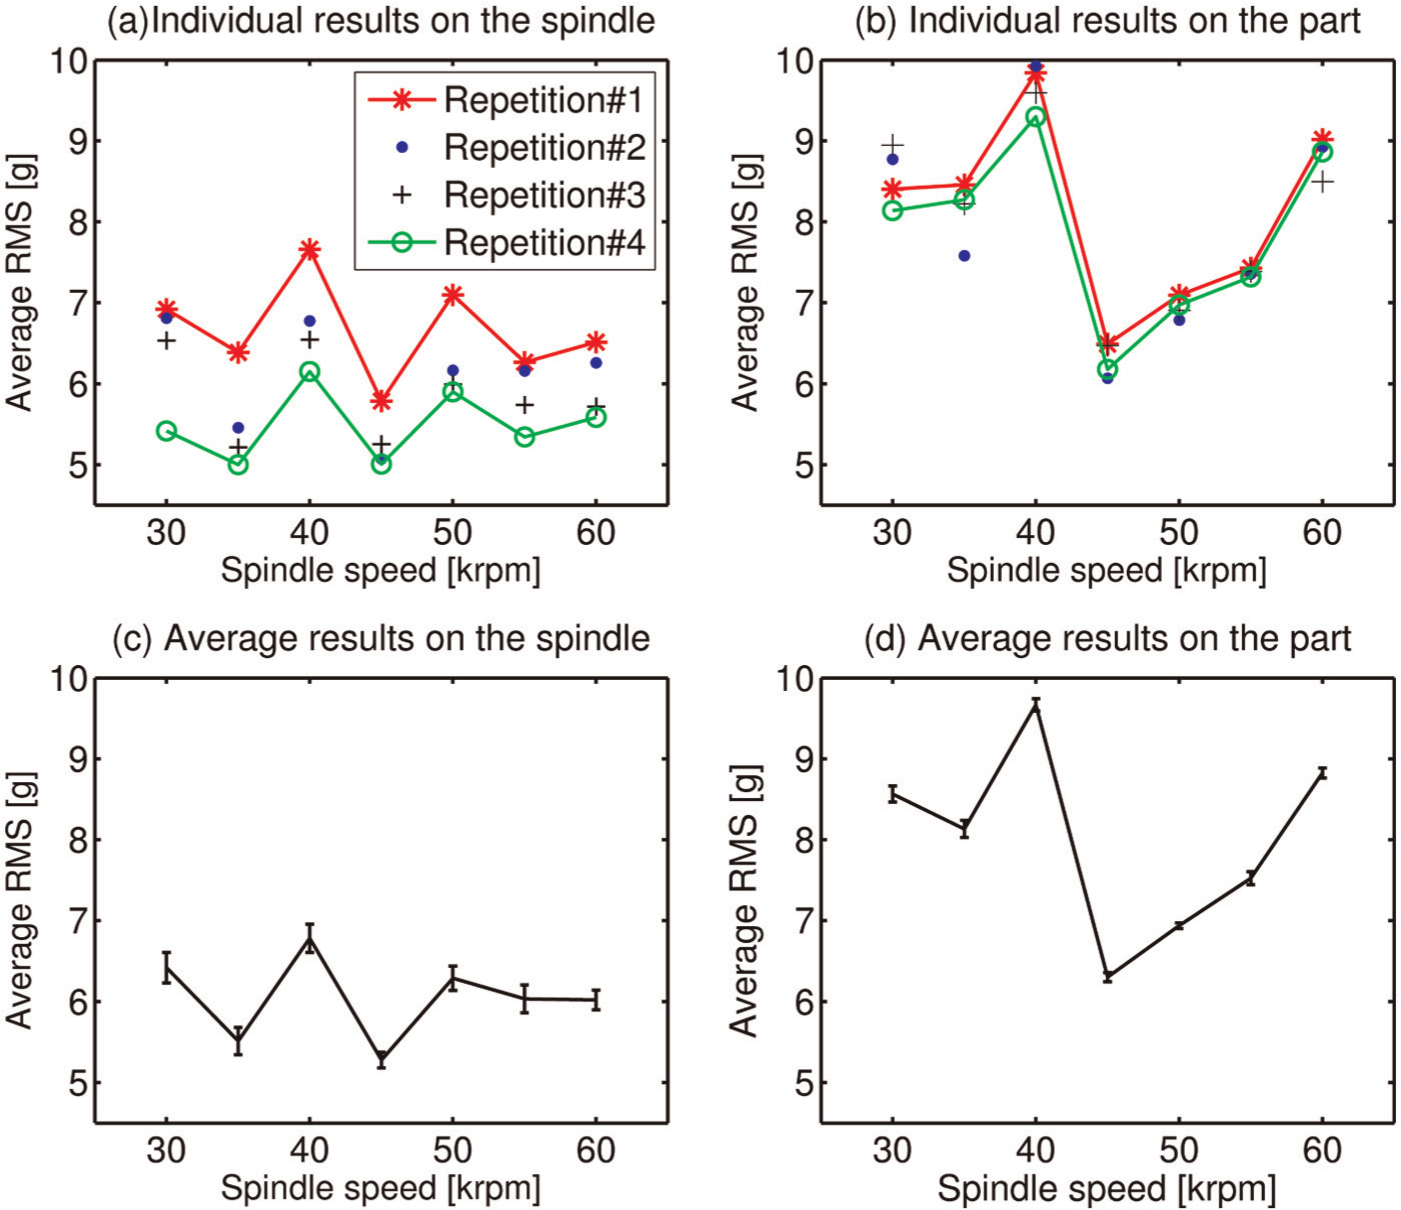
Variation of the average of the vibration signal at different spindle speeds for two positions of the accelerometer: (a) individual results for different repetitions under the same conditions (on the spindle); (b) individual results for several repetitions under the same conditions (on the part); (c) average results obtained from several repetitions (on the spindle); (d) average results obtained from several repetitions (on the spindle). Cutting conditions—tool: solid carbide ball nose (Ø 4.76 mm); feed: 2 mm/s; doc: 0.254 mm; dry machining of 7075-T6; machining system: ABB robot IRB-1600. The period estimation was 1.5 s, in the permanent regime of the machining process.
A second observation can be made concerning the amplitude of the variability during several repetitions of the same test (Figure 12): The variability of the amplitude of the vibration signal collected on the spindle is relatively higher than the variability of the vibration signal collected on the workpiece. (The variability is proportional to the standard deviation of the different repetitions. Graphically, it represents the width of the confidence interval.) This relatively high variability (of the vibration signal collected on the spindle) may be due to the robot rigidity change from one repetition to another. In fact, from one repetition to another, the cutting tool was advanced by 1 mm in the z direction, as explained in Figure 1.
However, the variability observed did not exceed 10% (of the average value) in all repetitions, meaning that the average value of several repetitions is statistically representative of the observed phenomena. Therefore, the individual results were averaged and presented with a confidence interval, at 5% of error risk, in Figure 12(c) for the spindle and in Figure 12(d) for the part. It can be observed that the results on the part and on the spindle tend in the same direction for five of seven spindle speeds. The vibration response is different for two spindle speeds, 55 and 60 kr/min. This result (the difference in the RMS tendency for the two last speeds, 55 and 60 kr/min) was observed many times, meaning that it was not due to a specific cause. The most probable cause of this disparity is the accelerometer positions. In fact, the accelerometer attached to the spindle “follows” the vibration source, but the fixed accelerometer on the part is not “following” the vibration source. Therefore, the first five spindle speeds give similar results both for the part and for the spindle, but the results become different for the two last spindle speeds. This is, probably, because for the localizations corresponding to these two spindle speeds, the vibration source is relatively far away from the accelerometer fixed on the part. These results show that to obtain reliable process stability results:
The accelerometer (or any other measuring equipment) should be near enough to the vibration source (the machining zone).
It is better to have an accelerometer (or any measuring equipment) that follows the vibration source. This means it is better to attach the accelerometer to the spindle and to have it as close to the machining zone as possible.
Following these recommendations, only the vibration signals collected on the spindle were retained for further analysis. When analyzing the signals obtained, it was observed that the RMSdirectional changes with the spindle speed change. The first question to be answered is therefore, “is there a statistically significant difference between the RMSdirectional at the different spindle speeds?” To answer this question, the data normality was tested, followed by Bertlett’s test for verifying the homogeneity of variances. The Bertlett’s test was positive as well. Therefore, the analysis of variance (ANOVA) test can be conducted to verify whether there is a statistically significant difference between the different spindle speeds. The ANOVA conducted gave a P-value of 3.3%, meaning that there is a statistically significant difference between the RMSdirectional at different spindle speeds, with a 95% confidence level.
It is expected that the difference observed in the average RMSdirectional will result in different surface finishes of the machined surfaces. To confirm this, the roughness of the machined surface was controlled using a profile meter (Mitutoyo Surface Measuring instrument SUFTEST SV 600). The roughness was measured using ISO1997 conditions, with a range of 32,000 points, and at three randomly chosen locations. A sample of the different measurements of the machined surface roughness is presented in Figure 13, where the variation of the arithmetic roughness, Ra, for different spindle speeds is presented with a 95% confidence interval.
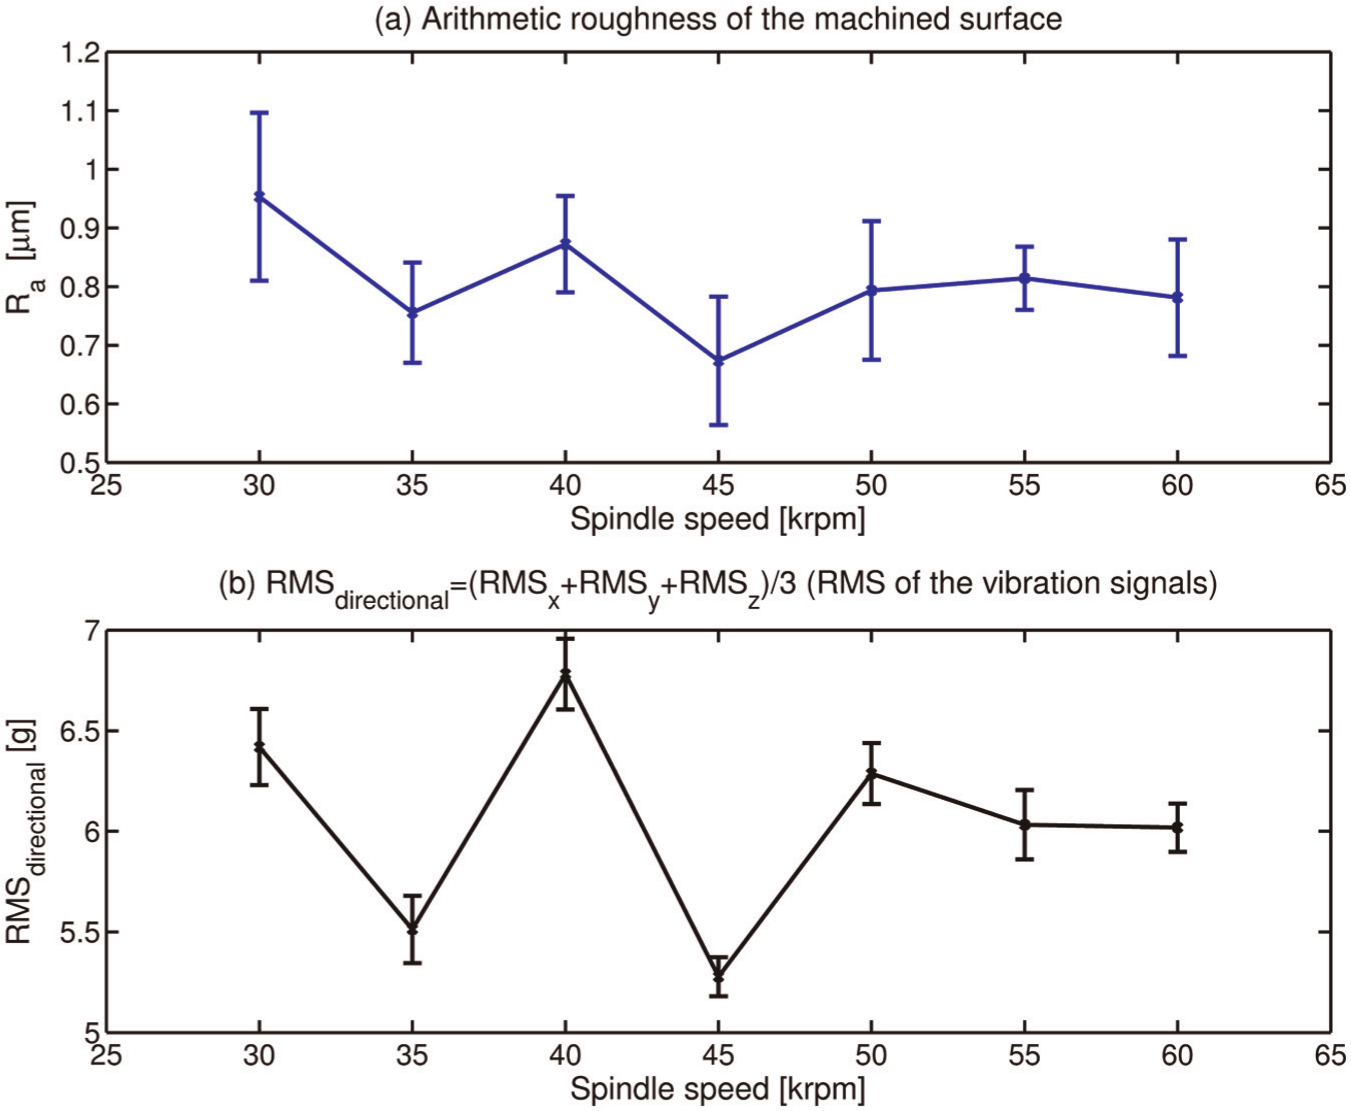
Similarity between the tendencies of the arithmetic roughness Ra and the RMSdirectional for different spindle speeds: (a) arithmetic roughness of the machined surface and (b) RMSdirectional = (RMS x + RMS y + RMS z )/3(RMS of the vibration signals). For cutting conditions, see Figure 12.
The large confidence intervals observed in Figure 13(a) are most probably due to many noise factors that affect the measurement of the surface finish. Such factors include the material homogeneity, the location measurement, the operator and so on. Because of these nonavoidable limitations, it is wise to not consider the mean roughness value. In fact, the mean roughness value cannot be statistically representative of the real surface finish. It was observed that the coefficient of variation (the ratio of the standard deviation to the average value) ranged between 12% and 30%, which indicates that the use of the average value of the surface finish is not statistically reliable. Thus, a different approach was proposed to replace the average roughness values in three locations.
In the proposed approach, for each repetition, the spindle speed having the minimum Ra was found among the seven tested speeds, and then the number of occurrences is calculated. This number of occurrences of a spindle speed is the number of times this spindle speed generates the lowest roughness for the Ra criterion. Figure 14 shows the compilation of the results obtained using this criterion, the normalized number of occurrences. The spindle speed that has the highest number of occurrences (ON) is 45 kr/min, with ON = 58% (meaning that 7 times of 12, the spindle speed 45 kr/min was the speed that generated the lowest Ra). The same procedure was applied for other surface finish criteria such as Rv, Rp, Rq and Rz, and the results obtained show that, for the realized tests, the speed that corresponds to the lowest of the other surface finish criteria is also the one that corresponds to the lowest RMSdirectional.
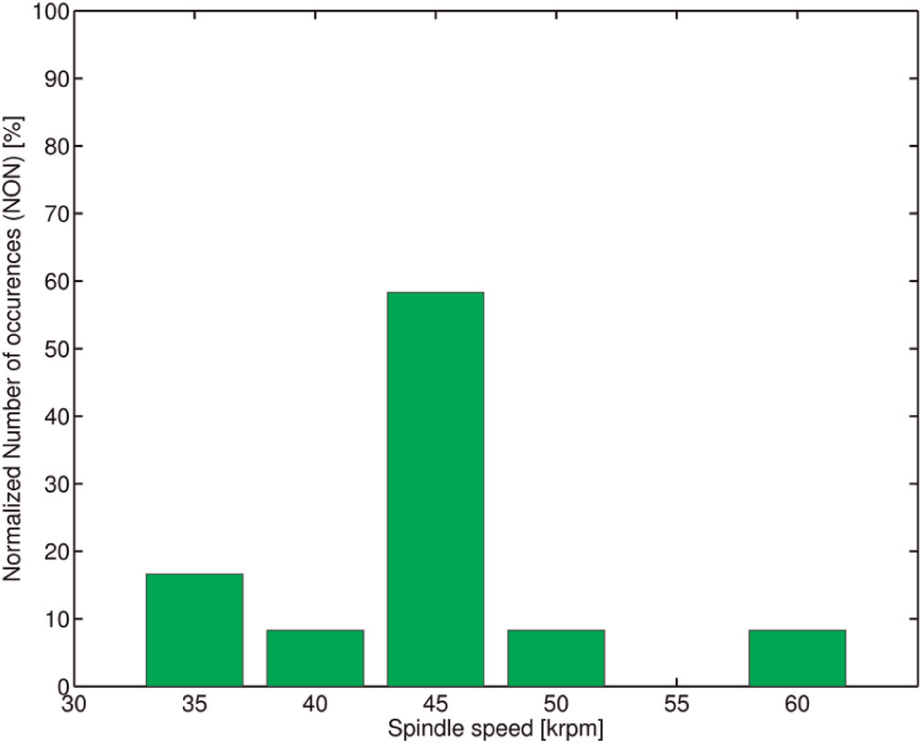
Presentation of the number of occurrences (ON) for different spindle speeds. For the cutting conditions, see Figure 12.
In spite of the probabilistic factor governing the two quantities studied, the vibration and the surface finish, it is possible to find a correlation between these two quantities. Therefore, it is possible to rely on the RMSdirectional of the vibration signal of the spindle to predict the spindle speed that generates the best surface finish. It can therefore be stated that the spindle speed with the lowest RMS factor has the highest probability of generating the best surface finish. However, this observation is not indispensible for obtaining the best surface finish. In fact, the authors noted that this observation is not respected in some cases.
To validate the concept “the combination of cutting conditions that generates the lowest RMSdirectional has the highest probability of generating the best surface finish,” other machining conditions were tested on the same robotic machining system. The results obtained are presented in the following section.
Application #1: automated cutting conditions selection
In this application, a solid carbide ball nose tool was used for machining a 7075-T6 workpiece. The goal was to define the most suitable cutting parameters, where “suitable cutting parameters” means:
Avoiding dynamically unstable zones, characterized by relatively high RMSdirectional
Selecting the cutting parameters that are expected to provide the best surface finish
The solid carbide ball nose tool was used to machine a 7075-T6 part, with a depth of cut of 0.254 mm and 3 mm/s feed. The results obtained for the RMSdirectional are presented in Figure 15(a). After that, the depth of cut was doubled to 0.508 mm, and the corresponding results were presented in Figure 15(c).
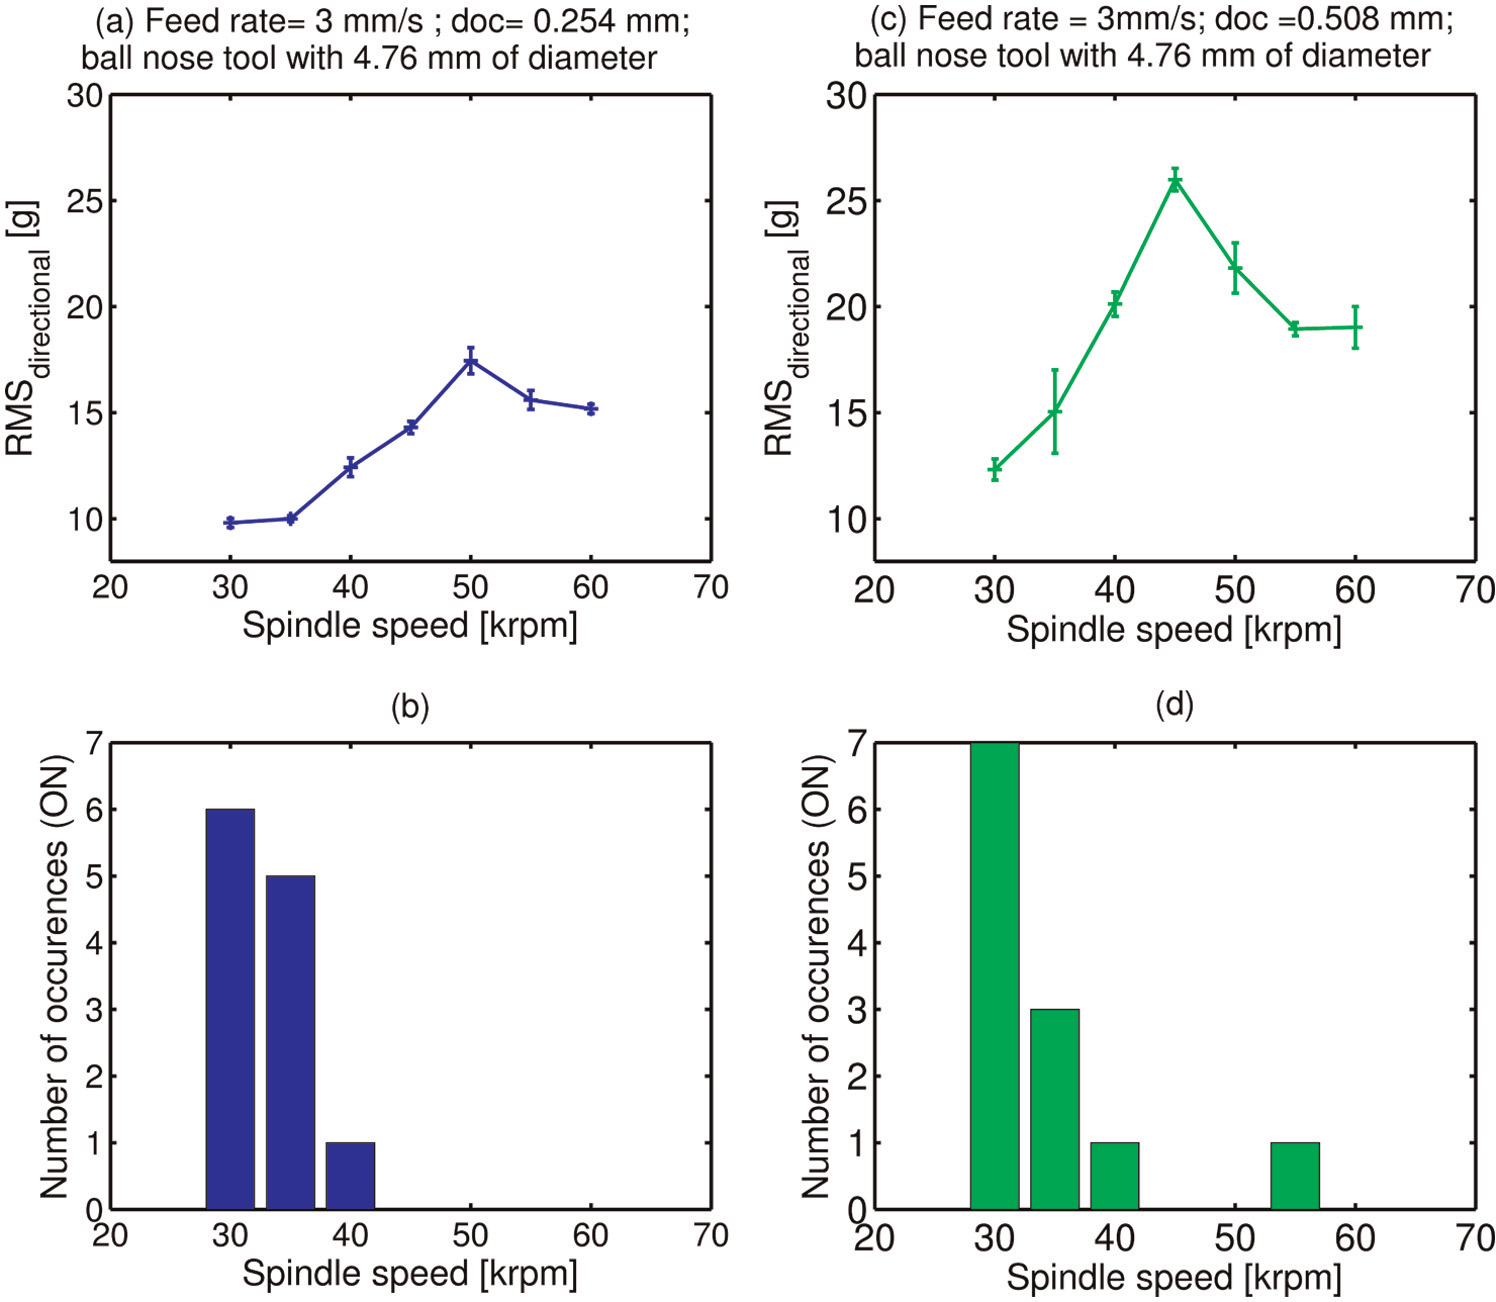
Results of the application #1 with carbide ball nose tool (Ø 4.76 mm). (a) Feed rate of 3 mm/s with doc of 0.254 mm (four repetitions); (b) the number of occurrences of each spindle speed for the conditions in (a); (c) feed rate of 3 mm/s with doc of 0.508 mm (six repetitions); and (d) the number of occurrences of each spindle speed for the conditions in (c).
The roughness of the machined surfaces was measured in three locations. It was observed that the highest ON was obtained for the spindle speed of 30 kr/min (50%, Figure 15(b)). The 30 kr/min spindle speed was followed by the 35 kr/min spindle speed, with an ON of 46%. When the axial depth of cut was doubled (doc = 0.508 mm), it was observed that the RMSdirectional increased with the increased depth of cut for all speeds, as shown in Figure 15(c). This result was expected, as a high depth will in fact cause a high vibration level. However, for this case, the most stable cutting spindle speed remained the same, at 30 kr/min. The number of occurrences (which is the number of times this spindle speed generates the lowest roughness for the Ra criterion) for this case (carbide ball nose tool (Ø 4.76 mm) and feed rate of 3 mm/s with doc of 0.508 mm) are presented in Figure 15(d), which shows that the spindle speed of 30 kr/min was the one that most frequently generated the best surface finish.
Application #2: cylinder ball tool
In the second application, a machining test with a cylinder ball tool (measuring Ø 4.76 mm) was employed to machine a 7075-T6 workpiece. The same setup described in the previous paragraphs was used to test this tool, with a feed of 3 mm/s and a depth of cut of 0.254 mm, and the test was repeated five times. The same procedure (explained in Figure 5) for estimating the statistical RMSdirectional was applied. The results obtained for the RMSdirectional are presented in Table 1.
Average RMS of the vibration signal on the spindle for the cutting conditions in application #2 for a carbide cylinder ball tool.
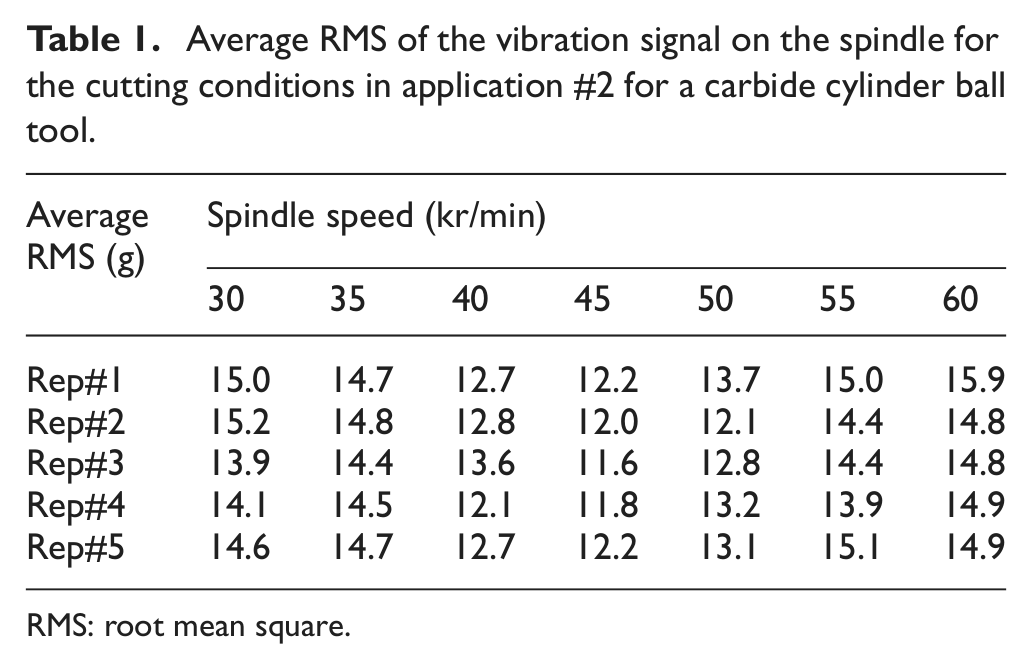
RMS: root mean square.
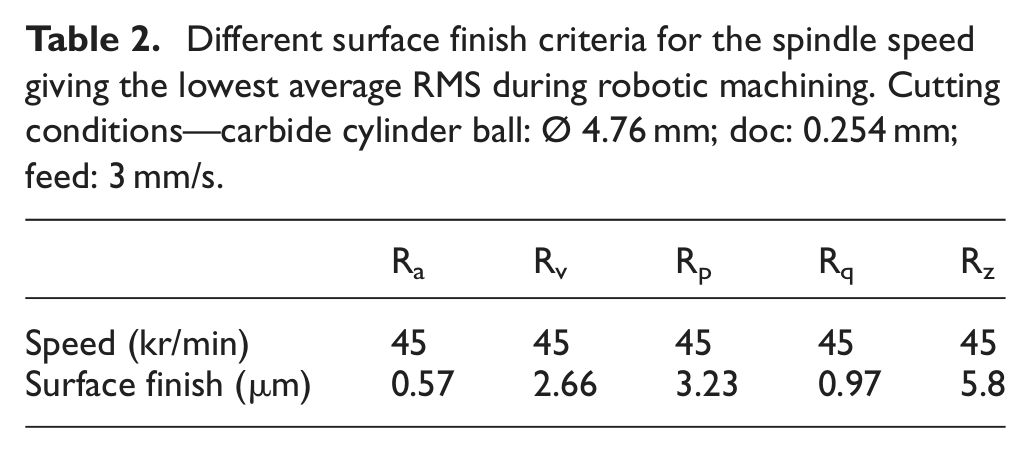
The results presented in Table 1 show that the spindle speed with the lowest RMSdirectional is 45 kr/min. It was also found that the spindle speed that has the highest number of occurrences is indeed 45 kr/min. Table 2 summarizes the results obtained for this spindle speed.
Different surface finish criteria for the spindle speed giving the lowest average RMS during robotic machining. Cutting conditions—carbide cylinder ball: Ø 4.76 mm; doc: 0.254 mm; feed: 3 mm/s.
Conclusion
The proposed methodology demonstrates its efficiency in predicting the cutting conditions that have the highest probability of generating the best surface finish. The applied approach is relative, meaning that it is an approach that retrieves the best cutting condition among those tested. The applied concept involves finding the spindle speed that corresponds to the lowest RMSdirectional. This concept can be applied in finding the degree of stability of a given cutting parameter combination. The proposed approach can be used in two ways: to find the most stable operation and to avoid dynamically unstable cutting parameters. Unstable cutting parameters will be characterized by relatively low degrees of stability (or high RMSdirectional). In this study, only time domain statistical indicators were used, and another study based on the frequency indicator is in progress.
Footnotes
Funding
The authors acknowledge the support of the Consortium for Research and Innovation in Aerospace in Québec (CRIAQ) and local industry partners (Pratt & Whitney Canada, L-3 MAS, AV&R vision and robotics, and Groupe Meloche) which funded part of this research under the project CRIAQ MANU-409C: Automated Deburring & Part Finishing. They also thank Mr David Tousignant for helping during the experiments.