
Abstract
Formation mechanism and influence of cutting parameters on residual stress in flank milling of TB6 are investigated through orthogonal experiments. The thermal–mechanical coupling effect on forming residual stress is studied by analyzing the microstructure of metamorphic layer. Experiment results show that cutting temperature varies between 300 °C and 518 °C under experiment conditions, while residual compressive stress on machined surface is −199.8 to −41.7 MPa. Tensile residual stress occurs on subsurface when increasing milling parameters excessively. When cutting TB6 with parameters of fz = 0.02 mm/z, vc = 60 m/min, ae = 0.2 mm and ap = 10 mm, only the compressive residual stress can be detected, which is good for its fatigue life. The depth of compressive residual stress layer is 10–20 µm.
Introduction
The TB6 titanium alloy is widely used in aerospace industries because of its high specific strength, small anisotropy, low forging temperature and strong resistance to stress corrosion. When using TB6 instead of equal strength 20CrMnSiA and TC4 in aircraft fuselage, wing and landing gear structures, the weight of structural parts can be reduced about 40% and 20%, respectively. So TB6 titanium alloy has a broad application space in aerospace industries. 1
Residual stress on machined surface has an important effect on its static strength, fatigue strength and stress corrosion cracking. Residual stress and its instability will cause stress relaxation and redistribution in machining of thin-walled parts, which will cause unpredictable part deformation. So it is of great importance to research the formation mechanism of surface residual stress. The nature, value, distribution and formation mechanism of residual stress get more and more attention of scholars in various countries. Scholars did active study on surface integrity of high-speed milling titanium alloy. Residual stress is an important index of surface integrity. Jawahir et al. 2 investigated the surface/subsurface properties involving hardness and residual stress profiles. They concluded that milling processes carry the potential to induce high compressive stress with high depth effect. Thomas et al. 3 studied the microstructure damage behavior of high-speed milling titanium alloy TC4. They found that the near-surface microstructure has a direct effect on slip band characteristics of alpha phase. The surface integrity of high-speed milled γ-TiAl alloy was studied by Mantle and Aspinwall. 4 The depth of hardened layer reaches 300 µm, and the contained compressive stress under the surface is less than 500 MPa. Milling speed has great influence on residual stress. Sridhar et al. 5 found that material properties and process parameters can affect residual stress on machined surface, which can be alleviated or eliminated by conducting appropriate heat treatment processes. Che-Haron 6 and Che-Haron and Jawaid 7 studied the tool life, tool wear, surface roughness, microhardness and metallurgical alterations systematically when cutting TC4. Sun and Guo 8 investigated the surface integrity of end milling TC4. Compressive residual normal stress can be detected in both cutting and feed directions. Cutting speed and feed speed have different effects on residual stress. Microstructure analysis showed that surface layer grain becomes smaller and distortion appears when the cutting speed is increasing. Puerta Velasqueza et al. 9 found that the crystallographic texture has negligible effect on residual stress value. The residual stress is tensile in nature for high cutting speed while compressive for lower speed. Du et al. 10 and Yang et al.11,12 investigated the effects of cutting parameters on surface integrity in high-speed milling. They found that the higher the spindle speed increases from 3000 to 10,000 r/min, the smoother the machined surface becomes. Chen et al. 13 found that compressive residual stress appears on machined surface when down milling of titanium alloy TC4 due to the burnishing effect between flank and machined surfaces. They also compared the different effects of cutting parameters on residual stress in cutting and feeding directions. Yu et al. 14 found that a higher compressive residual stress can improve fatigue life when stress ratio is constant. When stress ratio increases gradually, the effect of compressive residual stress on fatigue life decreases accordingly. But almost no effect can be found when stress ratio increases to 0.6. John et al. 15 found that 80% of residual stress is reserved in the workpiece when the specimen is exposed in a thermal environment of 399 °C for 100 h. When fatigue loading is close to yield stress, reserved residual stress is 85%, 70% and 50% when the exposing temperature is 260 °C, 316 °C and 399 °C, respectively. Rao et al. 16 focused on the experimental and numerical study of face milling of Ti–6Al–4V titanium alloy. They found that subsurface stress is compressive in nature and the depth extends to around 40 µm below the machined surface. Daymin et al. 17 concluded that mean compressive stress decreases slightly at a higher workpiece angle due to the absence of rubbing effect.
There is little research on the thermal–mechanical coupling effect on residual stress. Current retrieved research focuses on α+β-phase titanium alloy TC4. But the β-phase titanium alloy TB6 is still rarely studied. TB6 gets an increasing application to reduce aircraft weight, which requires more research focus on surface integrity of components about this material. Surface quality and machining accuracy are mainly determined by finish machining parameters. So the objective of this study is to analyze the effect of milling parameters on milling force, temperature and residual stress and to reveal formation mechanism of residual stress when finish machining TB6. It could be a theoretical basis for surface integrity control and parameter optimization to cut TB6 in high-speed milling.
Plastic bulge deformation effect and surface burnishing effect in milling
Residual stress appears when material is elasto plastic anisotropic or inhomogeneous plastic deformation generation. Residual stress produced by cutting process is related to many factors, such as milling force, thermal load, microstructure transformation and so on. As shown in Figure 1, the tensile and compressive residual stresses on machined surface are induced by plastic bulge deformation effect and surface burnishing effect, respectively.
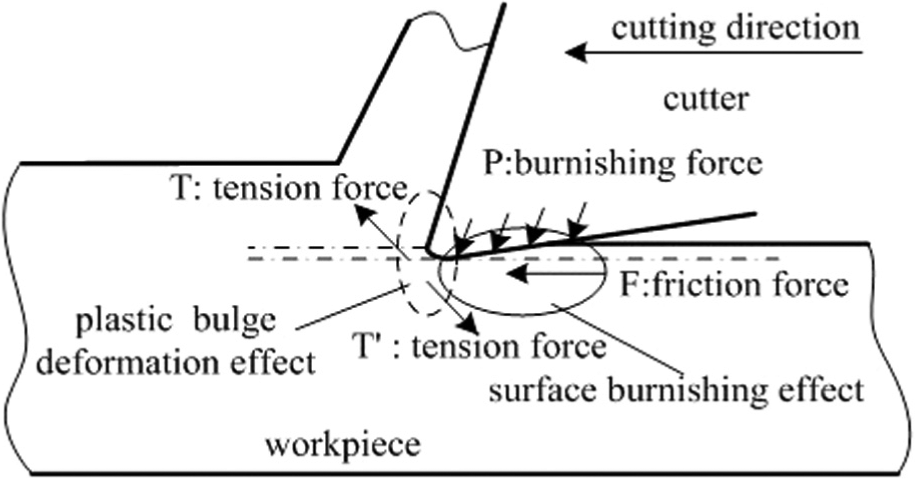
Plastic bulge deformation effect and surface burnishing effect.
The plastic bulge deformation effect is the combined effect of thermal load and milling force in the contact region between the cutter and workpiece. On the one hand, compressive plastic deformation occurs due to the constraints of internal material, while surface material is expanding and temperature is rising under a thermal load. Plastic bulge deformation occurs because surface material cannot turn back freely when workpiece surface is cooling down. On the other hand, plastic shrinkage along machined surface and plastic expansion along the vertical direction of machined surface under tension forces
Cutting experiments are designed and conducted in this research to reveal the influence of cutting parameters on cutting force and temperature. The thermal–mechanical coupling effect on residual stress formation is also investigated. Symbols adopted in this research are listed in Table 1.
List of symbols.
Experiment material and procedure
Workpiece material
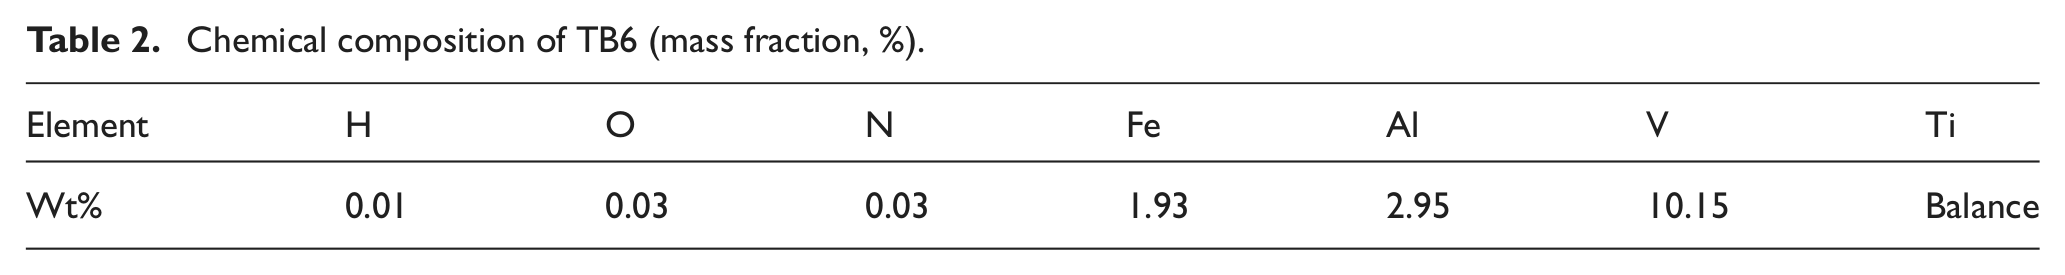
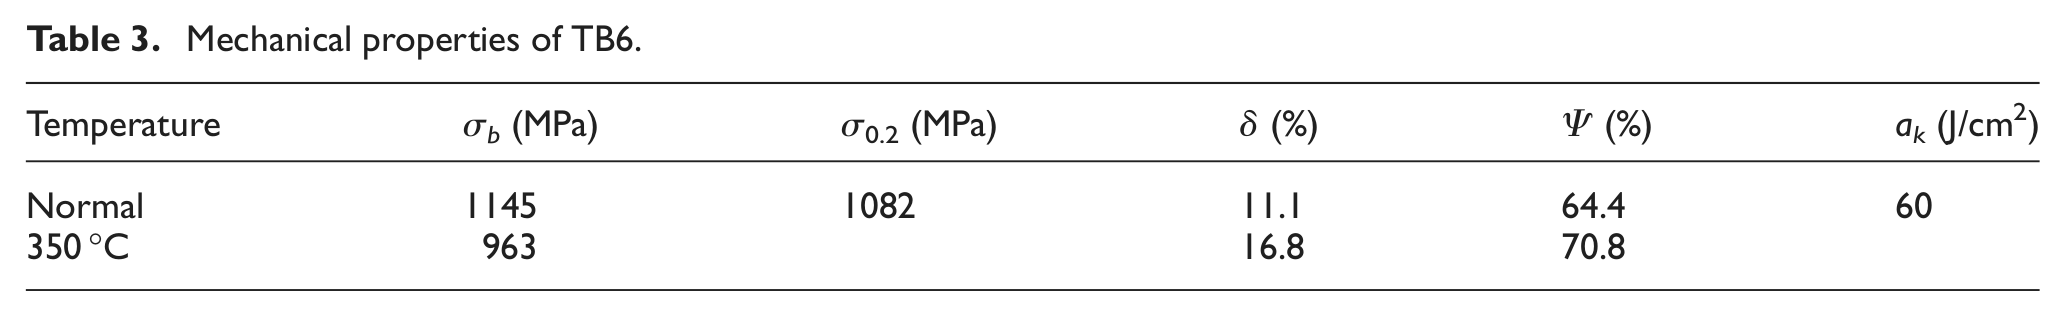
The workpiece material used in all experiments is TB6 alloy (Ti–10V–2Fe–3Al), one kind of β-phase titanium alloy with high strength and high toughness. Chemical composition of TB6 is shown in Table 2. Mechanical properties in normal and high temperatures are shown in Table 3.
Chemical composition of TB6 (mass fraction, %).
Mechanical properties of TB6.
The measurement of milling force and temperature in high-speed milling
A semi-artificial thermocouple composed by TB6 and constantan (Φ = 0.3 mm) is used to measure milling temperature. It has small heat inertia and a wide temperature measurement range. Linear expansion coefficient of TB6 titanium is 10.2 × 10⁻⁶ when temperature increases from 20 °C to 500 °C. Temperature error measured with this method has little influence on thermal stresses. The fabricating procedure of a TB6–constantan thermocouple, as shown in Figure 2, can be briefly described as follows: machine two pieces of TB6 specimen with the size of 20 mm × 15 mm × 6 mm; carve a groove with the width and depth both close to 0.3 mm (the diameter of constantan wire) on one surface of one specimen; squeeze the constantan wire with insulation paint layer about 0.01 mm into the groove; coat a layer of glue on one surface for another specimen; bind two specimens together to make the constantan wire be clamped by two workpieces; stay this sample being clamped by vise moderately for 8–12 h in room temperature; and get off the sample from vise and check the insulativity of constantan wire and uncarved TB6 workpiece. This TB6–constantan thermocouple is fixed on a computer numerical control (CNC) machine worktable with vise to measure the cutting temperature.
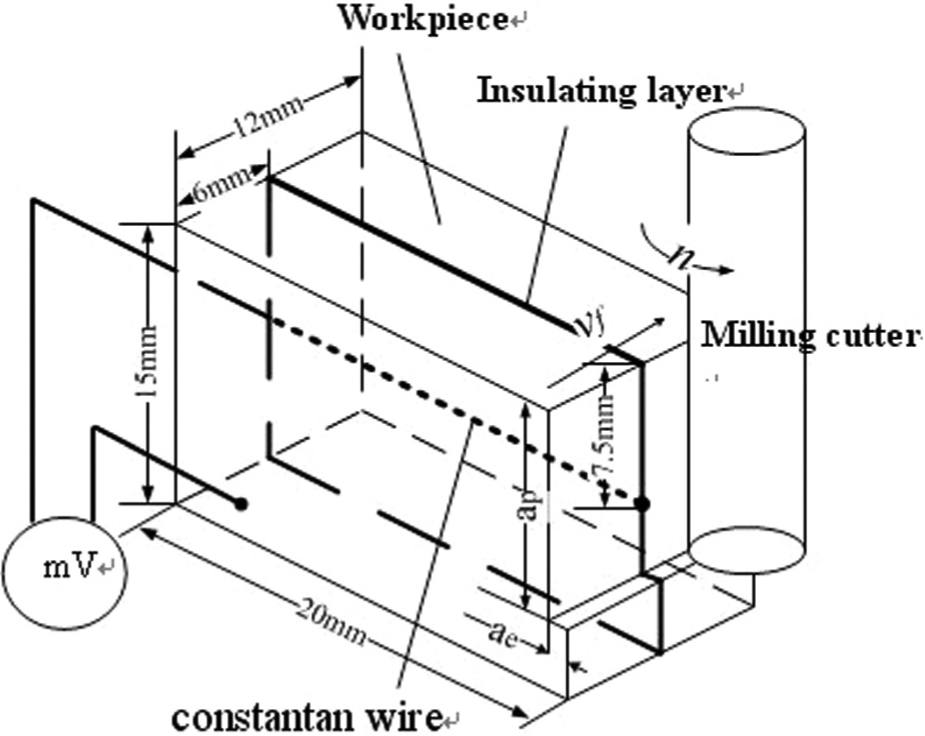
Temperature measurement system of semi-artificial thermocouple.
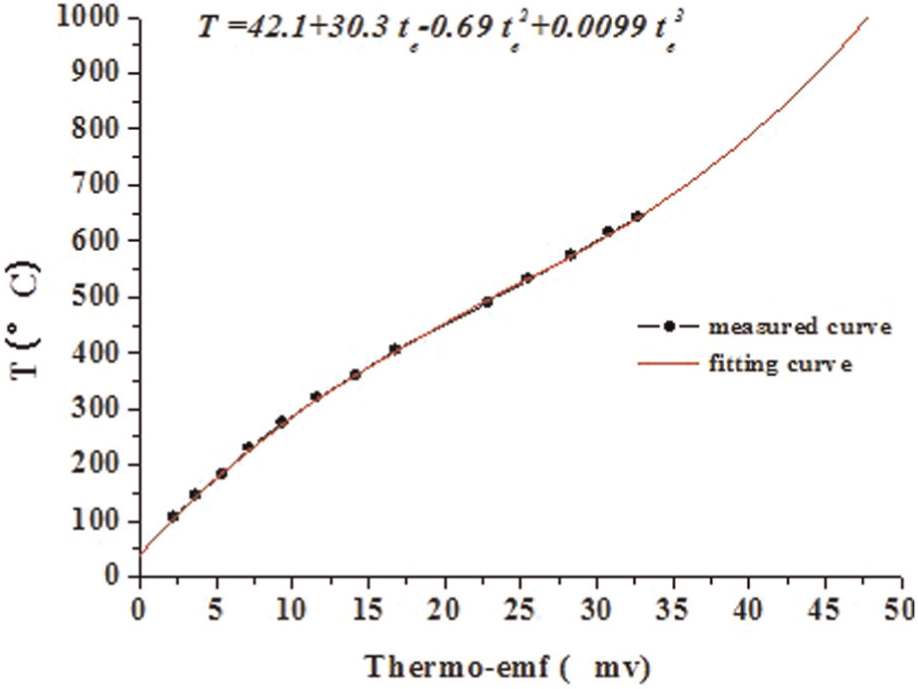
Because TB6–constantan thermocouple is a nonstandard thermocouple, a calibration needs to be conducted to get the correspondence between temperature and thermoelectric potential. A comparative method is adopted to calibrate the TB6–constantan thermocouple, which is described as follows: place a standard S type thermocouple and this TB6–constantan thermocouple in a same temperature environment; change the temperature and record different thermoelectric potentials of each thermocouple at some sample times; transfer thermoelectric potentials of standard thermocouple to actual temperatures directly with a temperature controller, so the actual temperature at these sample times can be exactly obtained; and find the correlation curve (calibration curve) between actual temperatures and thermoelectric potentials of TB6–constantan thermocouple. This calibration curve, as shown in Figure 3, can be used to predict cutting temperature by measuring thermoelectric potential in cutting experiments.
Calibration curve of TB6–constantan thermocouple.
The calibration curve is fitted to be a polynomial
where
Orthogonal experiments with three factors and three levels are designed and conducted to get the cutting force, temperature and residual stress. The cutting experiments are carried out with emulsified liquid in JOHNFORD VMC 850. The cutting tool is a 4-flute uncoated cemented carbide end mill. Rake angle, relief angle, helix angle and diameter of this tool are 12°, 12°, 35° and 10 mm, respectively. Three levels of milling speed, feed per tooth and milling width are selected to compare the different influence when the milling depth ap is kept constant at 10 mm. Milling parameters are given in Table 4.
Measurement results of milling force and temperature for milling TB6 titanium alloy.
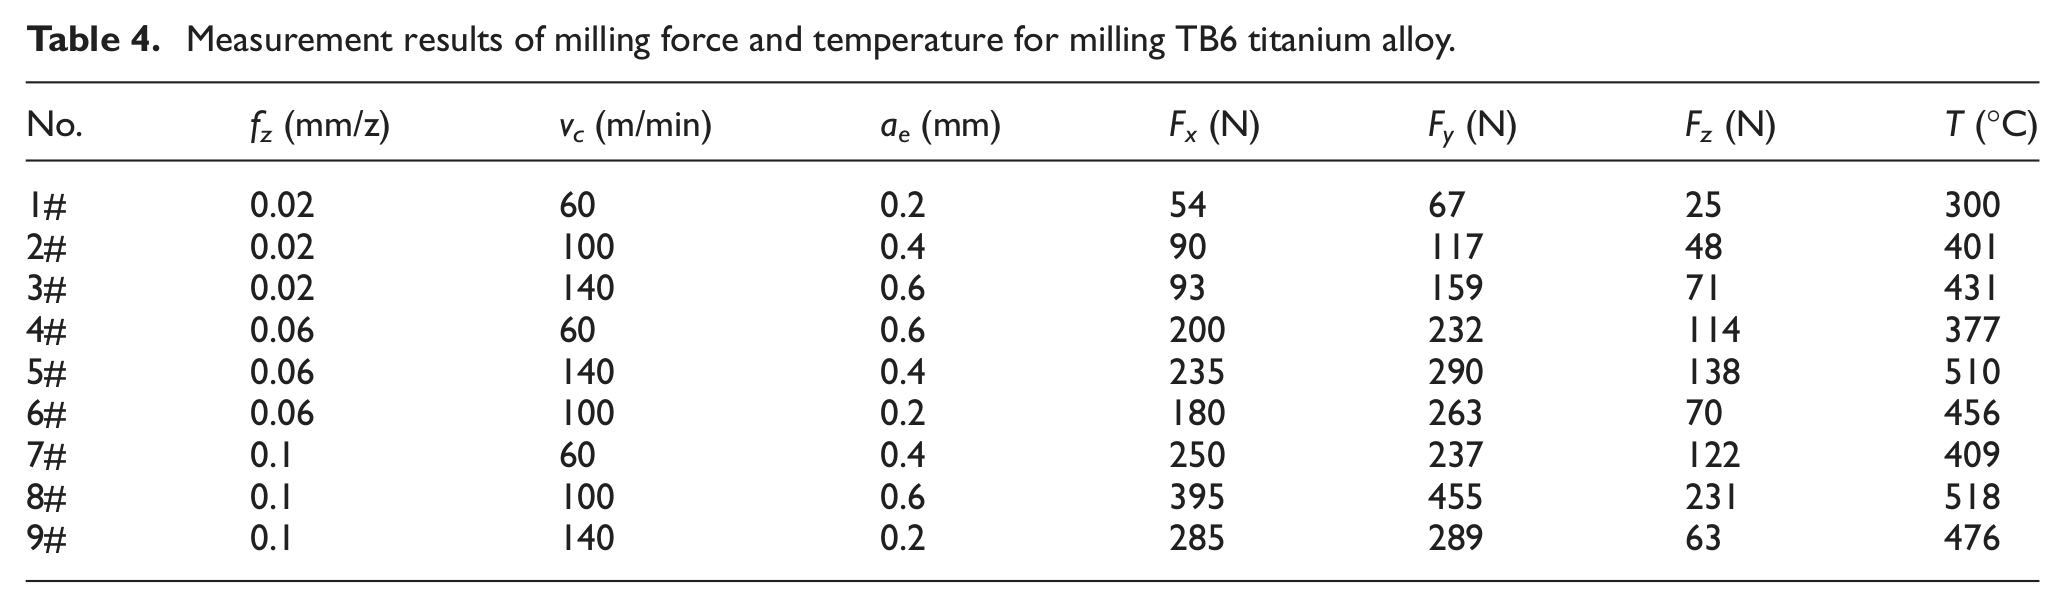
The measurement system of cutting force consists of a Kistler 9255B dynamic piezoelectric dynamometer, a Kistler 5017A charge amplifier and a recorder. Milling forces in three directions are represented as Fx, Fy and Fz, respectively, as shown in Figure 5. Mean force by averaging 50 peak values of continuous transient cutting force is used as the experiment result of cutting force, as shown in Table 4.
The measurement system of cutting temperature is constructed by a semi-artificial TB6–constantan thermocouple, an A11S11 signal disposal module, a UA305 high-speed USB data collector and a computer, as shown in Figure 2. Potential signals are recorded during milling experiments. Figure 4 shows the potential signal of No. 1#. It can be transformed to an actual milling temperature with the assistance of the calibration curve obtained above. The milling temperature of No. 1# is about 300 °C as a mean value of several tests. Milling temperatures of nine samples can be obtained with same method, as shown in Table 4.
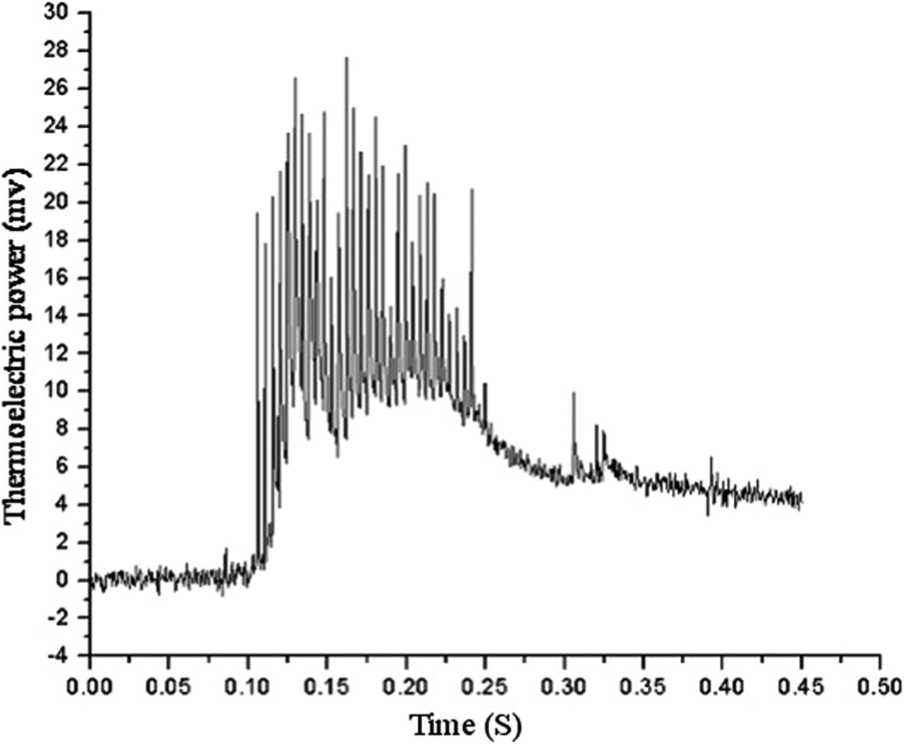
Potential signal of first milling.
Specimen preparation, measurement of residual stress and microstructure
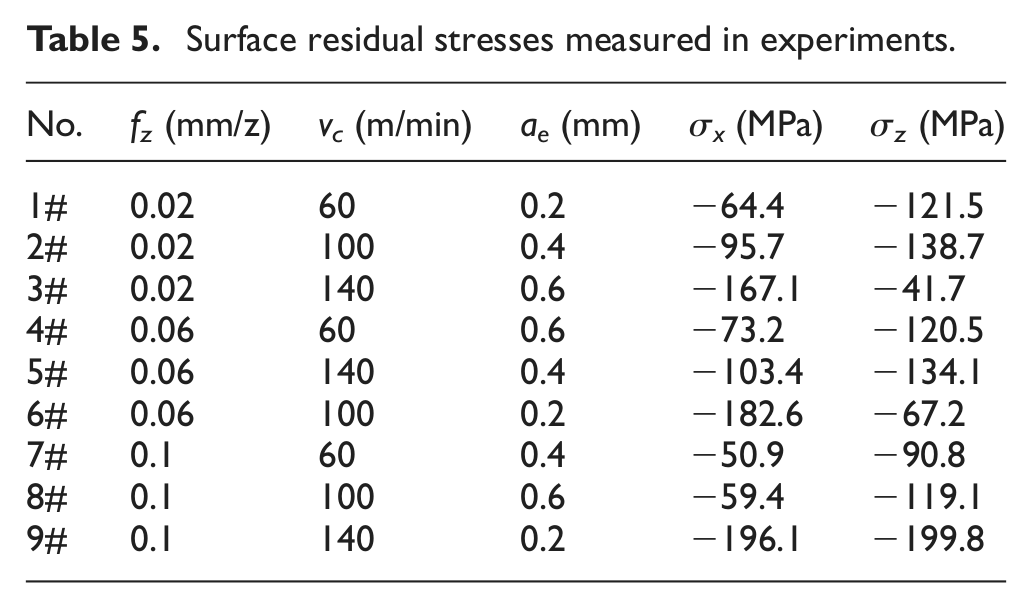
In order to investigate the influence of milling parameters on residual stress, another nine specimens are prepared. The size of specimen is 55 mm × 50 mm × 30 mm, as shown in Figure 5. Surface residual stresses measured in experiments are listed in Table 5.
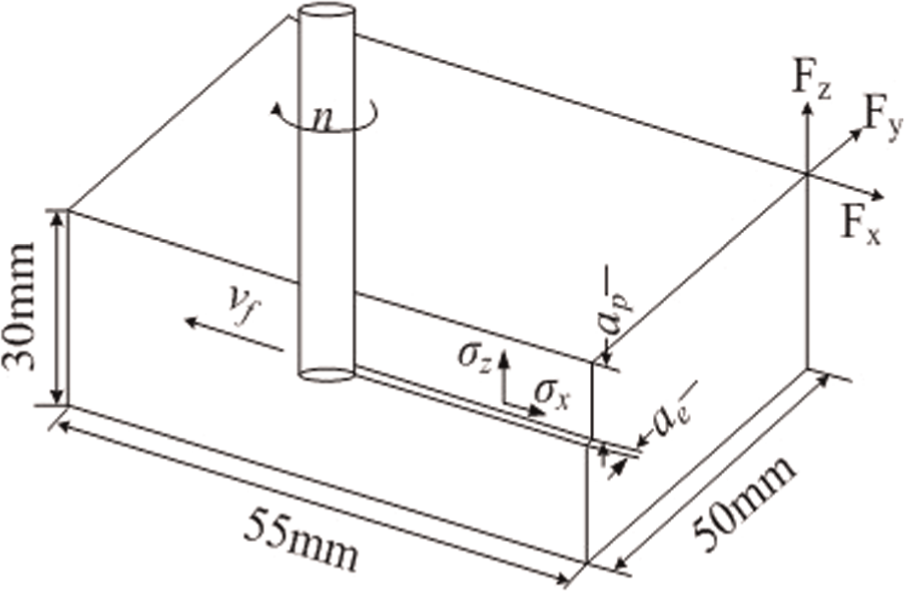
Schematic diagram of flank milling.
Surface residual stresses measured in experiments.
Residual stresses are measured in XStress 3000 with Cu-Kα radiation using the Ψ-tilt X-ray method. In fact, the measured result is residual strain. But it can be transferred to residual stress after a calculation based on Hooke’s law. When residual stress exists in the sample, the change of interatomic spacing causes a shift in the diffracted X-ray peak position. An X-ray with wavelength of
The residual stress measurement parameters.
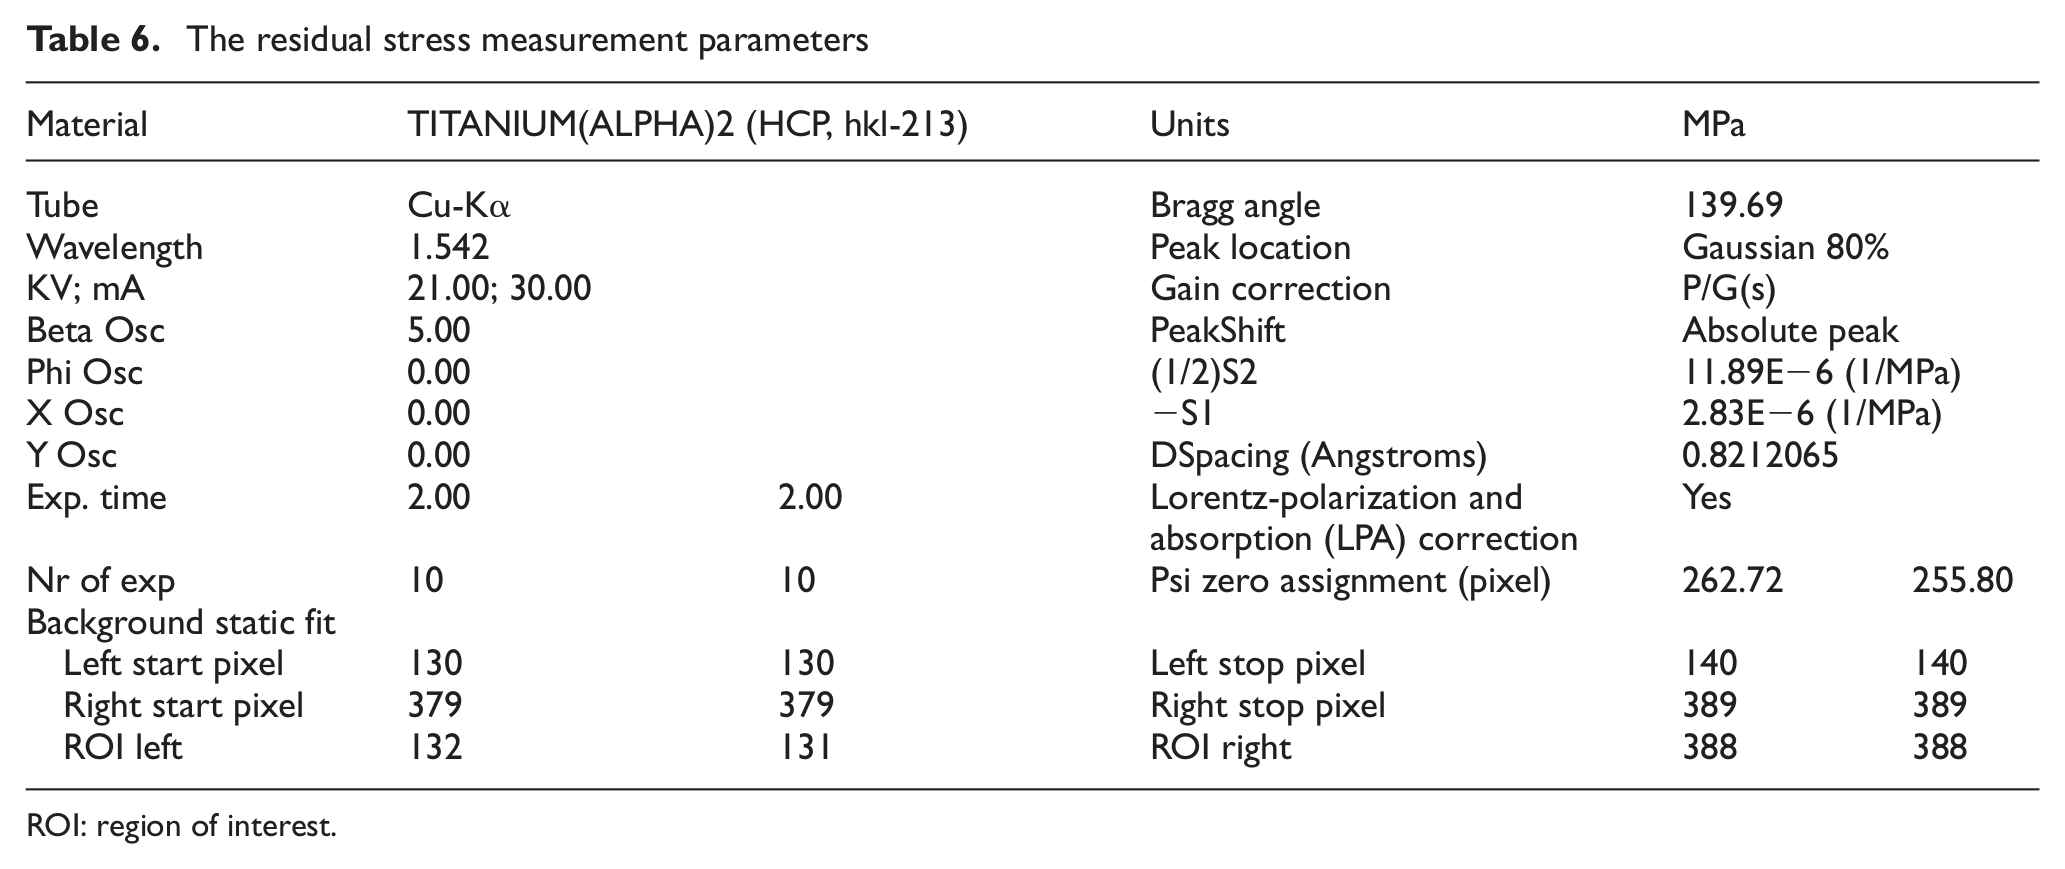
ROI: region of interest.
The microstructure of specimen’s crossing section was observed using a DMI 5000M inverted optical microscope. The metallographic test sample is made by cutting the machined specimen along feed direction. The cutting section is corroded after abrading and polishing in a corrodent matched by HNO3:HF:H2O = 1:1:10.
Formation mechanism of residual stress
Effect of milling parameters on surface residual stress
1. Effect of milling parameters on residual stress
Mathematical model of residual stress is built using multiple linear regression analysis based on the data in Table 5
With this mathematic model, the changing sensitivity of residual stress by the change of cutting parameters can be obtained. σx is most sensitive to milling speed, while least sensitive to feed per tooth. σz is most sensitive to milling width, while least sensitive to milling speed.
The effect of milling parameters on surface residual stress is studied by extremum difference analysis. As shown in Figure 6, compressive residual stress is observed in both directions on machined surface. The effect of feed per tooth on surface residual stress is shown in Figure 6(a). It can be seen that σx increases with increase of fz from 0.02 to 0.06 mm/z and decreases when fz is from 0.06 to 0.10 mm/z. σz keeps decreasing when fz increases from 0.02 to 0.10 mm/z. σz is a little larger than σx at a relatively low feed per tooth. The changing range of residual stress in both directions is within [−140 MPa, −100 MPa]. As for the effect of vc in Figure 6(b), residual stress almost increases linearly with increase of vc in both directions. This is mainly because higher milling speed leads to a higher temperature that tends to induce thermal plastic deformation. The effect of vc on residual stress is greater than that of fz when comparing Figure 6(b) with Figure 6(a). Figure 6(c) shows that residual stress decreases with increase of ae, and the changing range of residual stress in both directions is [−150 MPa, −80 MPa]. The effect of ae on residual stress is between that of vc and fz.
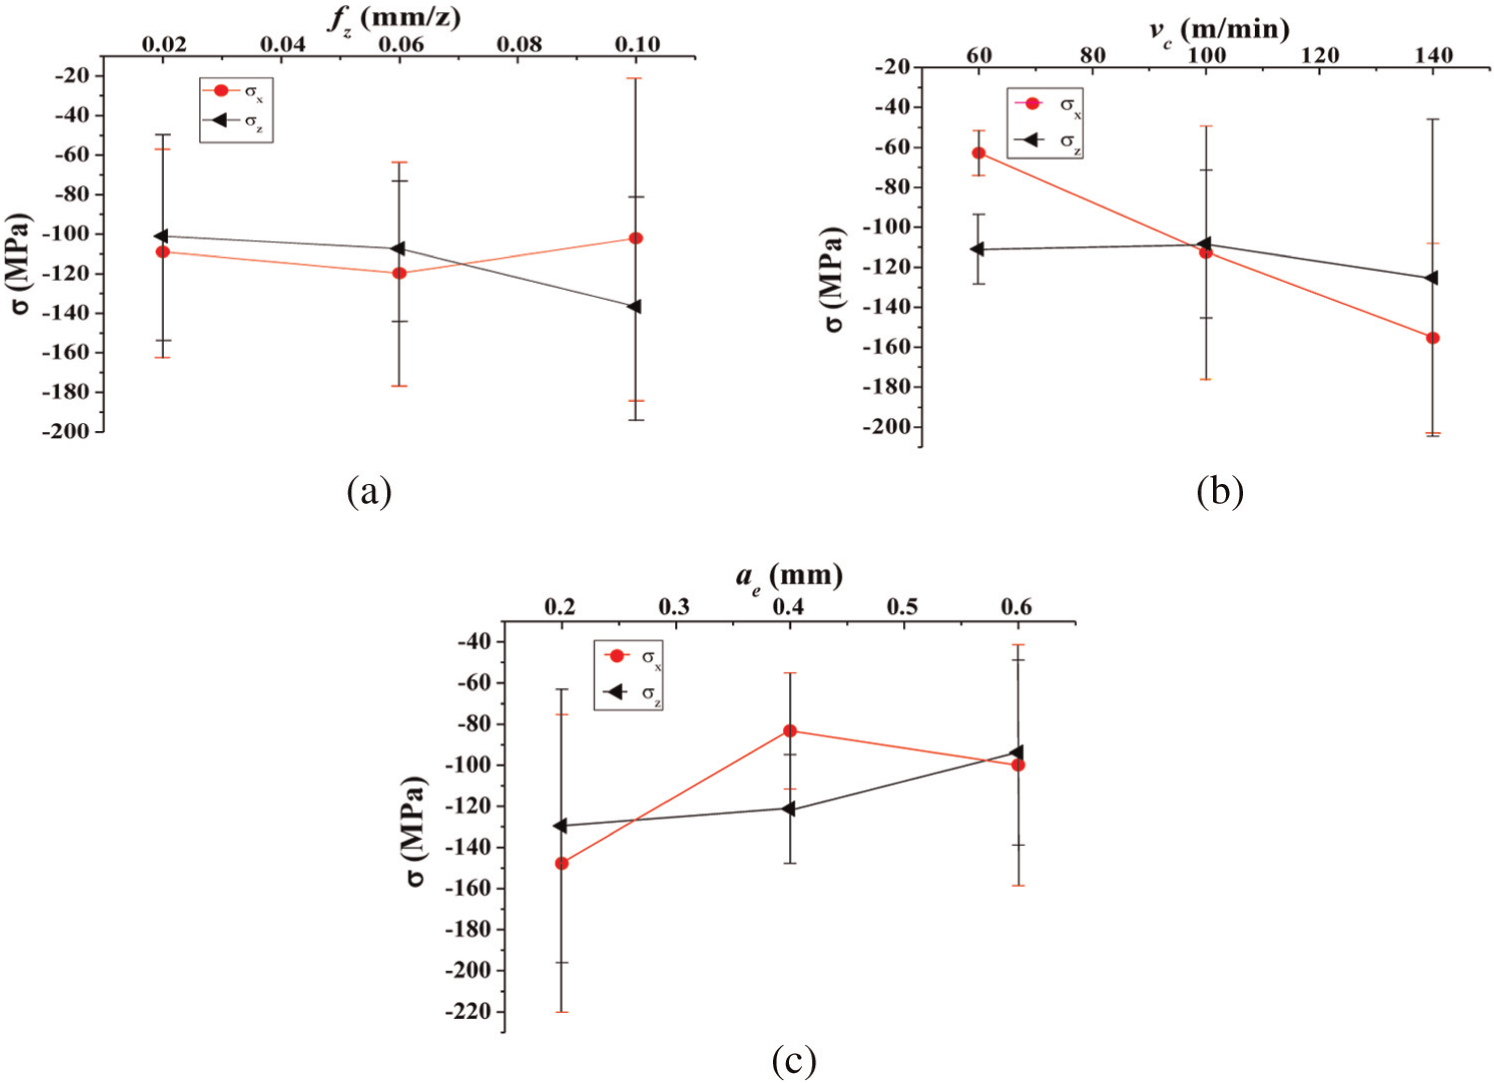
Effect of milling parameters on surface residual stress. (a) Effect of fz on residual stress, (b) effect of vc on residual stress and (c) effect of ae on residual stress.
2. Interaction effects of milling parameters on residual stress
In order to choose a better combination of milling parameters, the interaction effect of milling parameters on residual stress must be investigated. The interaction effect of fz and vc on residual stress is shown in Figure 7. Figure 7(a) shows that σx higher than −180 MPa appears in the region of “high milling speed and low feed per tooth” (region A). This is because a large thermal plastic deformation is prone to occur near the surface layer of workpiece under this milling condition. σx lower than −100 MPa appears in the region of “low milling speed and high feed per tooth” (region C). The thermal plastic deformation is small under this cutting condition. The range of σx under other experiment cutting conditions, as signed with region B, is [−100 MPa, −180 MPa]. Figure 7(b) shows that σz higher than −140 MPa appears in the region of “low milling speed and high feed per tooth” (region D). This is because the increase of feed per tooth induces higher milling temperature that tends to produce a large thermal plastic deformation on machined surface. σz lower than −110 MPa appears in the region of “high milling speed and low feed per tooth” (region F). The range of σz under other experiment cutting conditions, as signed with region E, is [−110 MPa, −140 MPa].
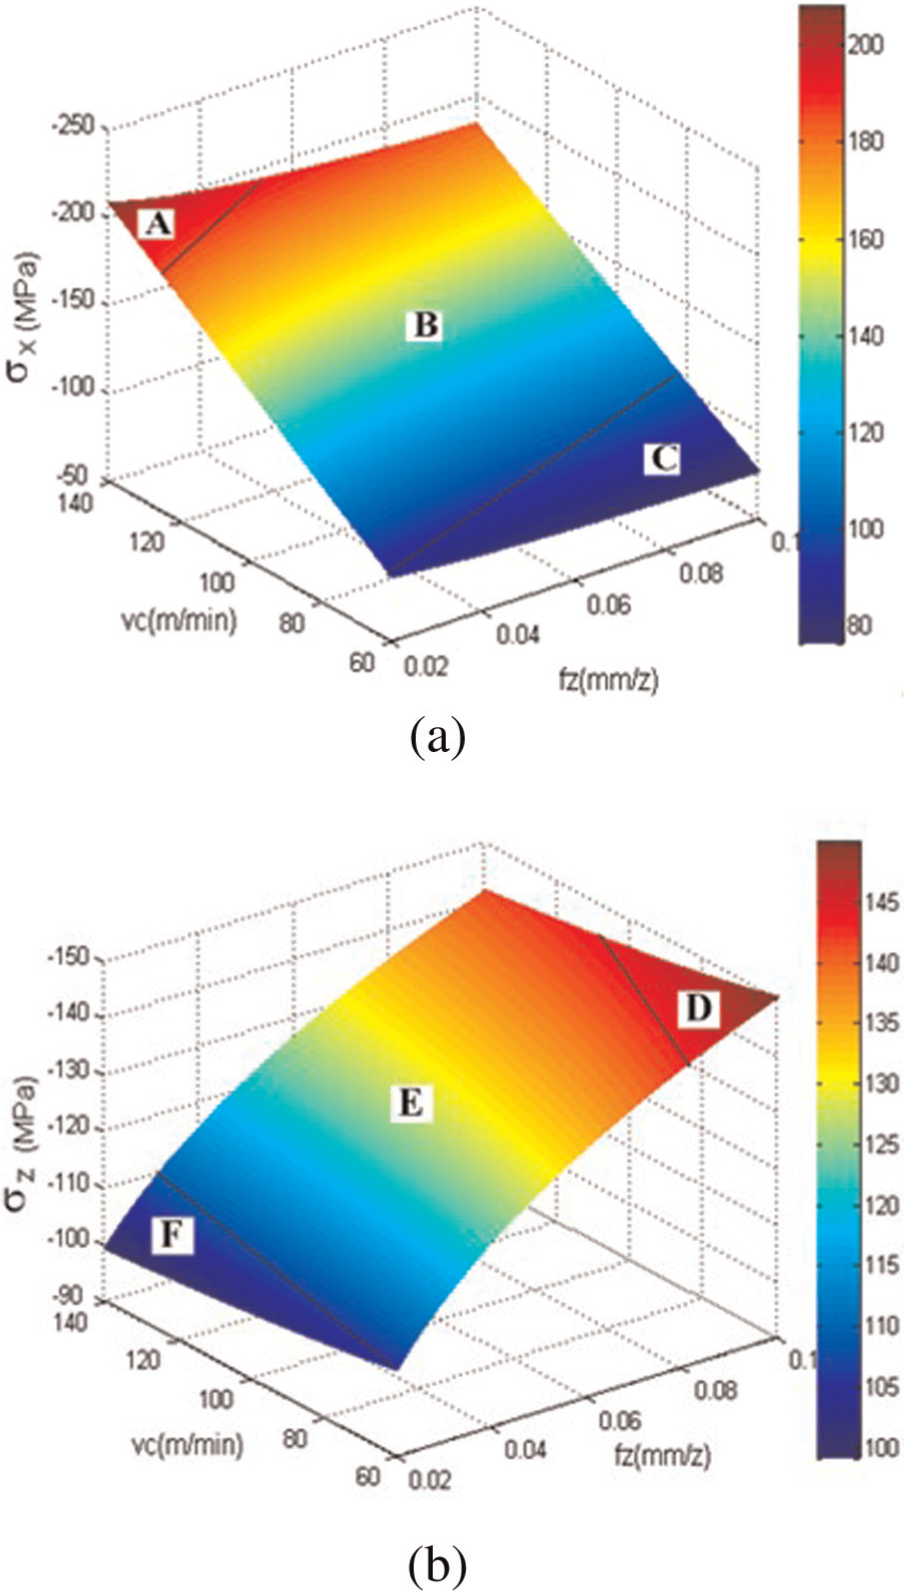
The interaction effect of fz and vc on residual stress. (a) Interaction effect of fz and vc on σx and (b) interaction effect of fz and vc on σz.
The interaction effect of ae and vc on residual stress is shown in Figure 8. Figure 8(a) shows that σx higher than −160 MPa appears in the region of “high milling speed and low milling width” (region G). σx lower than −100 MPa appears in the region of “low milling speed and high milling width” (region I). The range of σx under other experiment cutting conditions, as signed with region H, is [−100 MPa, −160 MPa]. Figure 8(b) shows that σz higher than −100 MPa appears in the region of “low milling speed and low milling width” (region J). σz lower than −80 MPa appears in the region of “high milling speed and high milling width” (region L).
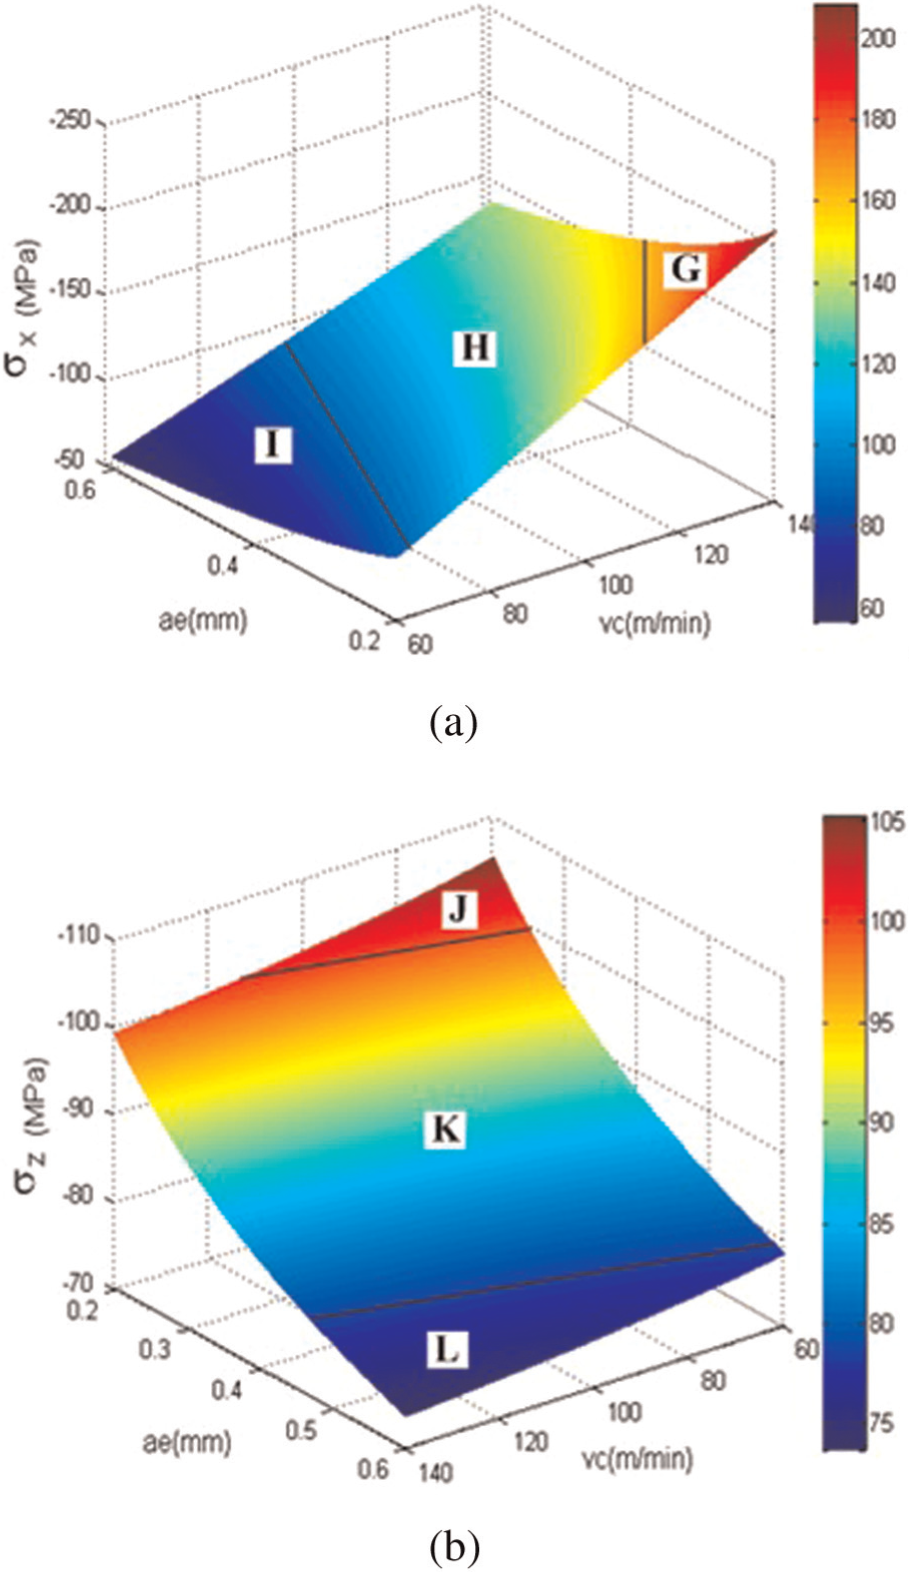
The interaction effect of ae and vc on residual stress. (a) Interaction effect of ae and vc on σx and (b) interaction effect of ae and vc on σz.
The interaction effect of ae and fz on residual stress is shown in Figure 9. Figure 9(a) shows that σx higher than −190 MPa appears in the region of “low milling width and low feed per tooth” (region M). σx lower than −130 MPa appears in the region of “high milling width and high feed per tooth” (region O). The range of σx under other experiment cutting conditions, as signed with region N, is [−130 MPa, −190 MPa]. Figure 9(b) shows that σz higher than −120 MPa appears in the region of “low milling width and high feed per tooth” (region P). This is because the increase of feed per tooth induces a large thermal plastic deformation on machined surface. σz lower than −90 MPa appears in the region of “high milling width and low feed per tooth” (region R). The range of σz under other experiment cutting conditions, as signed with region Q, is [−90 MPa, −120 MPa].
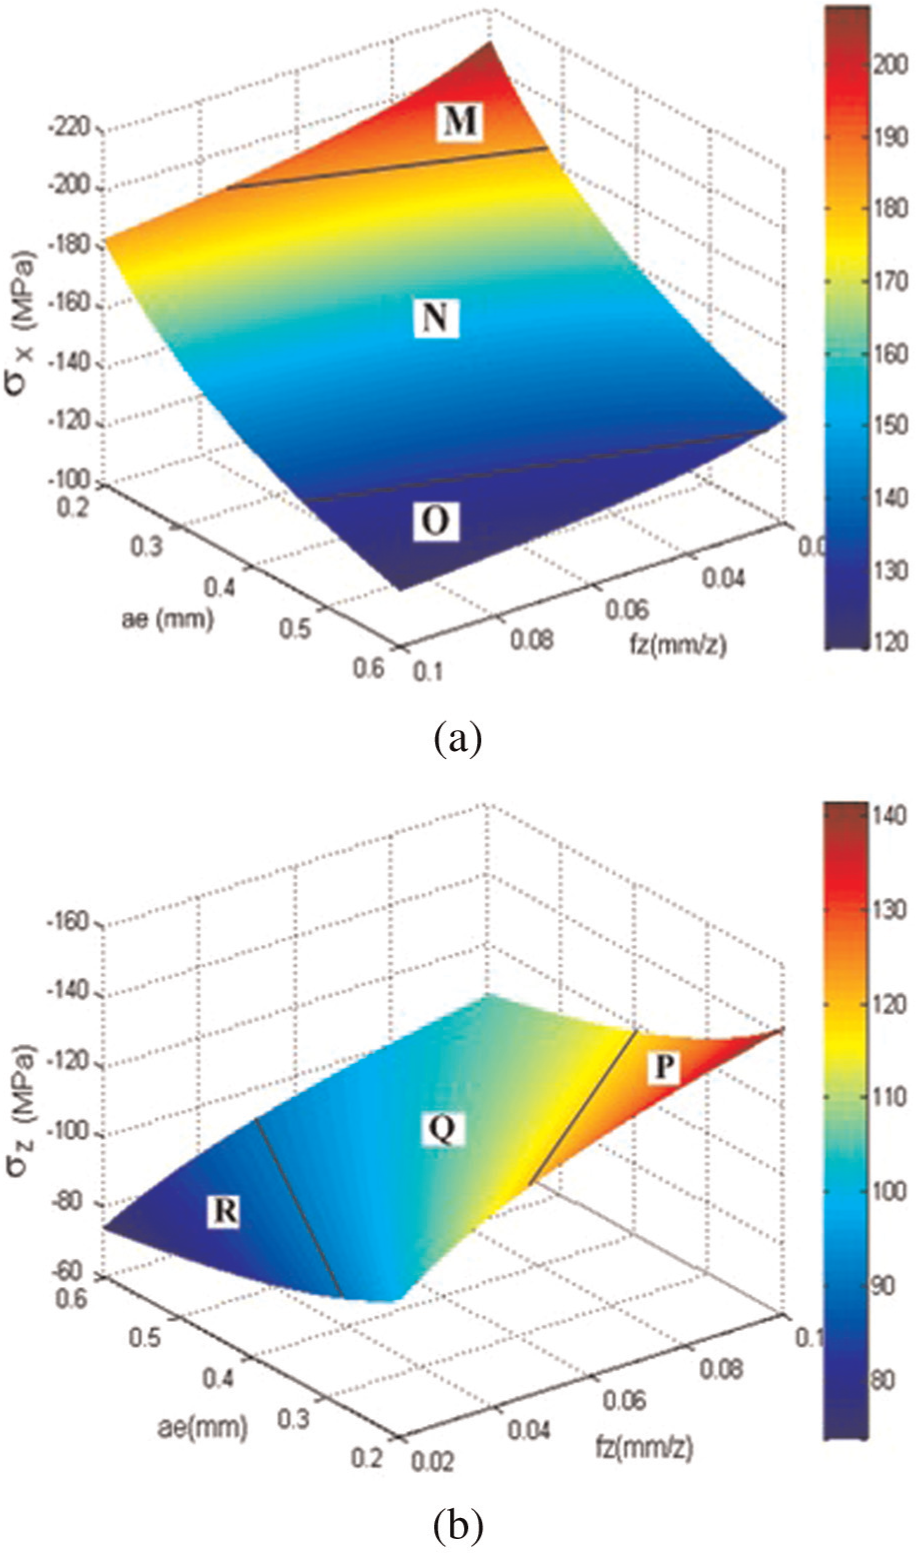
The interaction effect of ae and fz on residual stress: (a) Interaction effect of ae and fz on σx and (b) interaction effect of ae and fz on σz.
3. Selection of milling speed and feed per tooth
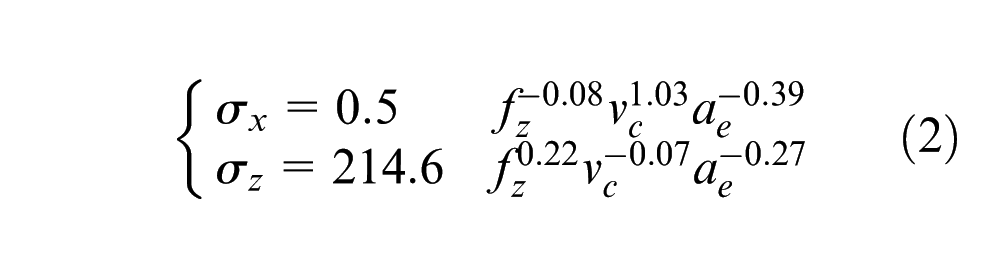
Compressive residual stresses with the range of [−199.8 MPa, −41.7 MPa] appear on all machined surfaces typically. When surface roughness and tool wear are under cutting requirements, milling parameters should be selected properly to obtain a higher compressive residual stress. Figure 6 shows that the changing range of σx is larger than that of σz. This means milling parameters should be selected mainly based on σx, which is easier to be affected by milling parameters. As demonstrated in equation (2), milling speed has the most significant influence on σx, while feed per tooth has the least. So cutting speed should be selected first as high as possible. After the cutting speed has been selected, a higher feed per tooth is recommended to improve machining efficiency.
Effect of milling parameters on milling force and milling temperature
1. Milling force and temperature model based on milling parameters
Mathematical model of milling force and temperature is built using multiple linear regression analysis based on the data in Table 4, as shown in equations (3) and (4), respectively
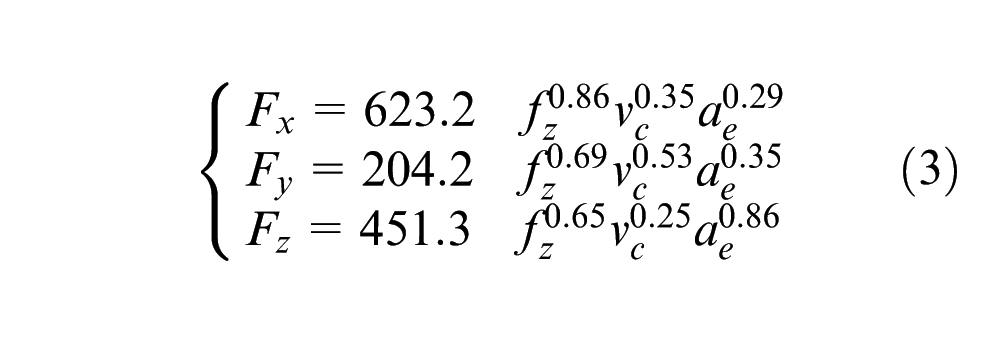
As shown in equation (3), feed per tooth and milling speed both have a significant effect on milling force. The effect of milling width on milling force is insignificant under experiment conditions

Milling temperature is most sensitive to the variation of milling speed and least sensitive to milling width. Table 4 shows that the range of milling forces Fx, Fy, and Fz is [54 N, 395 N], [67 N, 455 N] and [25 N, 231 N], respectively. The effect of milling parameters on milling force and milling temperature is studied by extremum difference analysis. The result is shown in Figure 10.
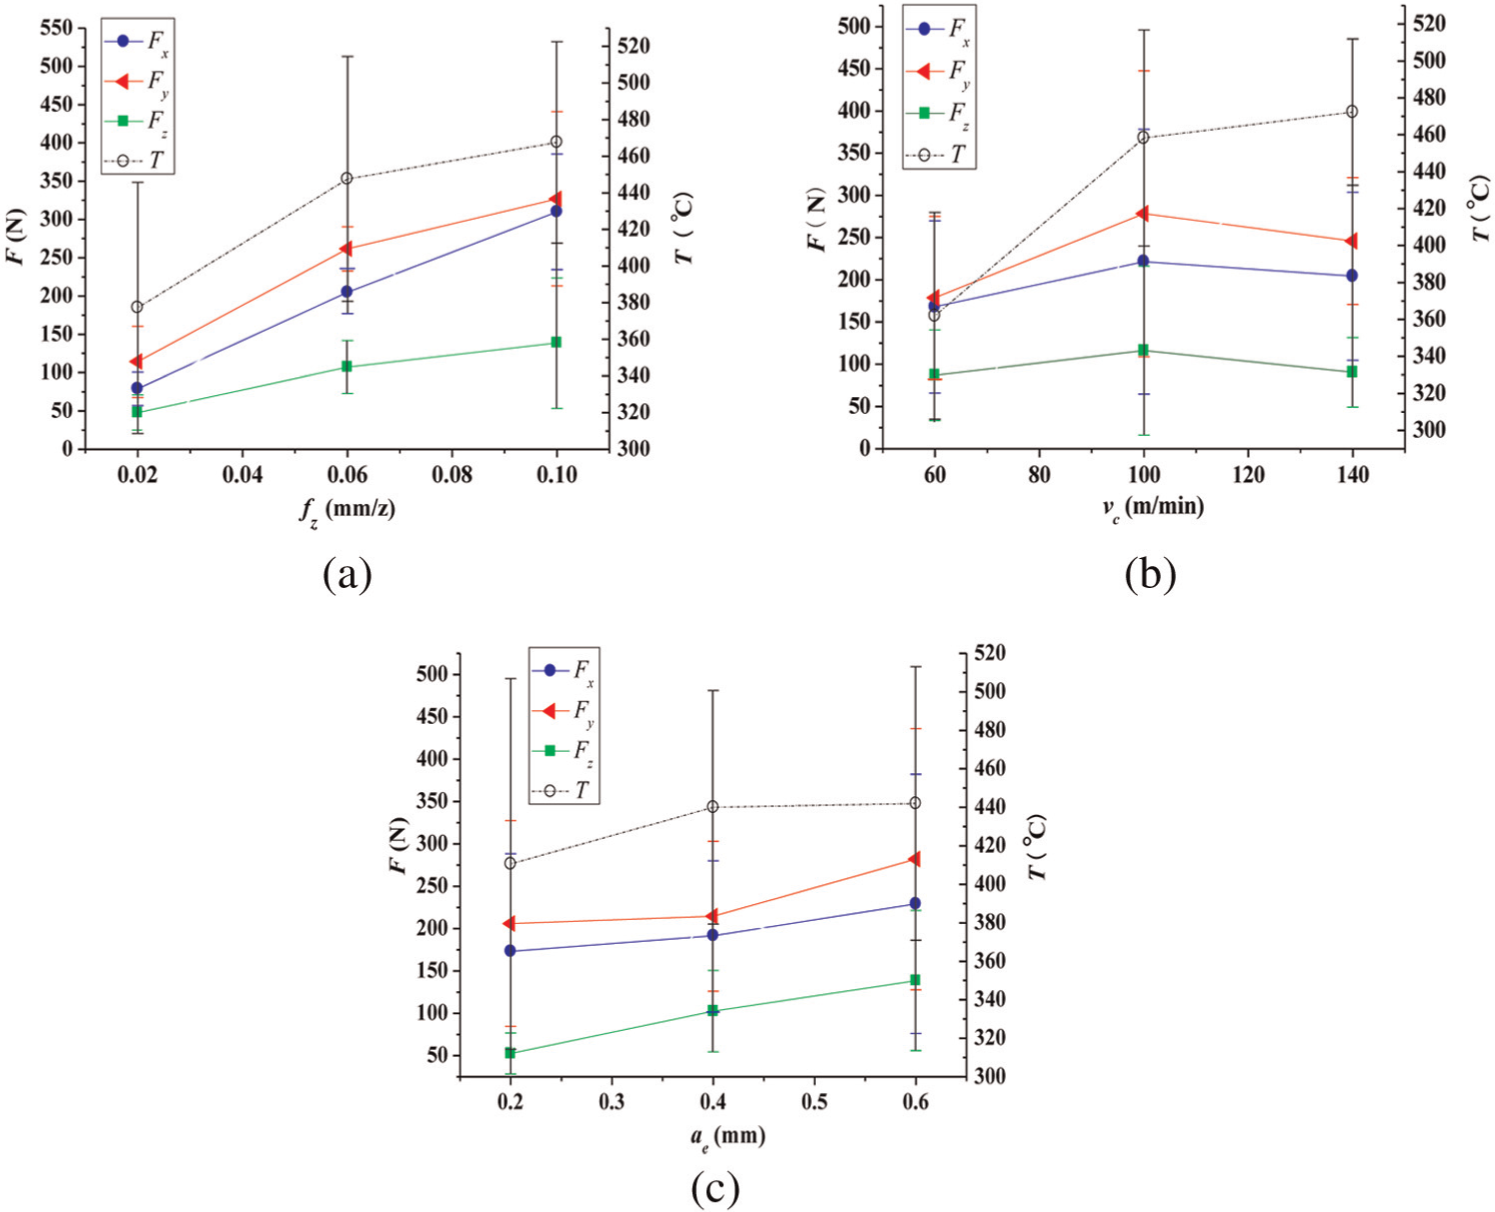
Effect of milling parameters on milling force and temperature. (a) Effect of fz on milling force and temperature, (b) effect of vc on milling force and temperature and (c) effect of ae on milling force and temperature.
2. Effect of milling parameters on milling force
The effect of feed per tooth on average milling force is shown in Figure 10(a). It can be seen that milling forces increase with increase of fz in three directions. As shown in Figure 10(b), milling force increases with increase of vc from 60 to 100 m/min and decreases when vc is from 100 to 140 m/min. This may be explained as follows. First, milling temperature increases with the increase of milling speed. The increasing temperature decreases friction coefficient and material deformation coefficient, which finally leads to a decrease of milling force. Second, with increase of milling speed, shear angle increases and shear plane becomes smaller. The shear force decreases by the change of shear plane under a constant shear strength. The increase of high-frequency impact force is less than the decrease of milling force at the meantime. As a consequence, the milling force shows a decreasing tendency. As shown in Figure 10(c), when ae changes from 0.2 to 0.6 mm, average milling force only increases slightly. The range of milling forces Fx, Fy and Fz are [173 N, 229 N], [200 N, 280 N] and [53 N, 139 N], respectively.
3. Effect of milling parameters on milling temperature
Figure 10 shows that average temperatures increase with the increase of all milling parameters. The range of milling temperature is about [300 °C, 518 °C]. Such a high milling temperature causes the following effects. On the one hand, due to the uneven distribution of temperature on workpiece surface, thermal stress appears on machined surface when the subsurface restricts the expansion of workpiece volume. When thermal stress exceeds the yield limit of material, compression plastic deformation appears on machined surface. Because surface material cannot turn back freely with the constraint of subsurface, tensile residual stress occurs when workpiece surface is cooling down. On the other hand, surface tempering temperature is close to or even more than the critical temperature to lead the phase transition. Residual stress is produced due to the volume change of microstructure.
Formation mechanism of residual stress on machined surface
In order to improve fatigue life of part, the consideration of residual stress value on machined surface is not enough. Distribution of residual stresses on subsurface plays a more significant role on the fatigue life. Specimens machined with cutting parameters of No.1# and 9# are selected to study residual stresses distribution. Milling speed and feed per tooth in machining specimen 1# are both lower than that of specimen 9#. Surface roughness of specimens 1# and 9# are 0.36 and 0.91 µm, respectively.
The residual stress distribution on machined surface and subsurface of specimens 1# and 9# are shown in Figure 11, where h is the distance below machined surface. Figure 11(a) shows that compressive residual stresses appears in both directions on machined surface with a depth about 10~20 µm. σx and σz on machined surface are −70 and −120 MPa, respectively. Residual stress tends to be close to zero gradually with the increase of h. Figure 11(b) shows that σx and σz on surface are −200 and −190 MPa, respectively. The maximum tensile stress is about 100 MPa, which appears 10 µm beneath the machined surface. Tensile residual stress reduces gradually with increase of h. The depth of residual stress layer is about 30~40 µm.
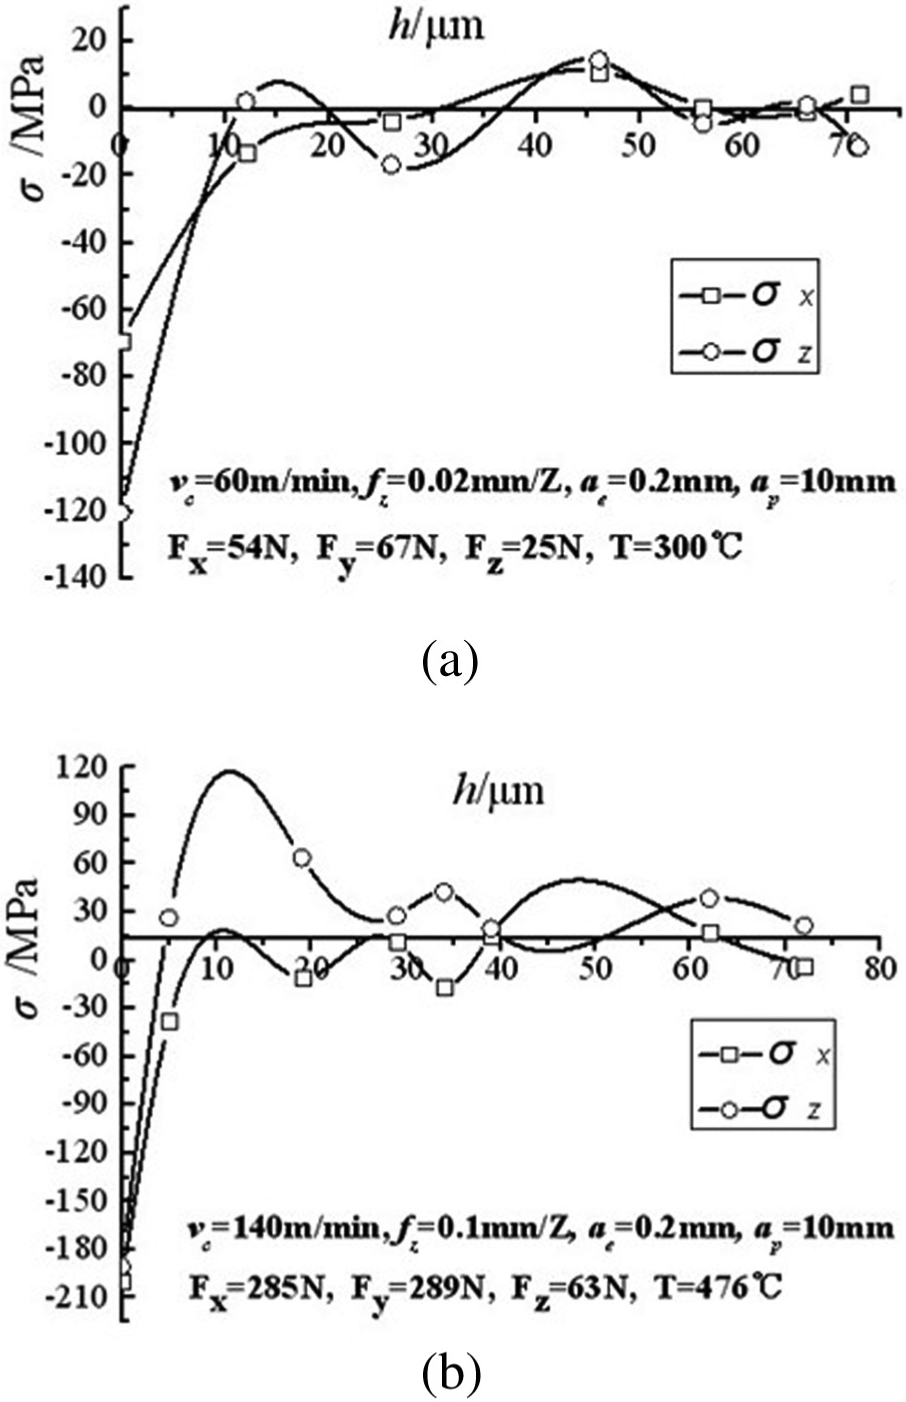
Distribution of residual stresses in subsurface. (a) Residual stresses distribution of 1# and (b) residual stresses distribution of 9#.
Figure 10 shows that milling temperature range is [360 °C, 470 °C], which does not exceed the phase transition temperature of 817 °C. The range of Fx and Fy is [75 N, 300 N] and [120 N, 330 N], respectively. This is because severe plastic deformation and shear effect induce separation grain bear tension, which leads to larger tensile stress in the first deformation zone. In the third deformation zone, tensile plastic deformation occurs under the severe friction and squeeze between cutting tool flank and workpiece. Small elastic modulus of titanium alloy induces larger rebound on machined surface that leads to strong surface burnishing effect on tool flank surface. Compared with the plastic bulge deformation effect by milling force and heat, surface burnishing effect by milling force is more significant. Both effects result in compressive residual stresses on machined surface.
Figure 11(a) shows that almost only compressive residual stress appears on subsurface. Figure 12(a) shows that plastic deformation near the machined surface is not obvious with a depth less than 10 µm. This is mainly because strain hardening on subsurface caused by thermal–mechanical coupling effect is not obvious when Fx, Fy and Fz and milling temperature are 54, 67 and 25 N and 300 °C, respectively. Figure 11(b) shows that the maximum tensile residual stress appears at h = 10 µm on specimen 9#. Figure 12(b) shows that plastic deformation of specimen 9# is larger than that of specimen 1# along the feeding direction. The depth of deteriorative layer is about 25 µm. This is mainly because strain hardening on subsurface is significant when Fx, Fy and Fz and milling temperature are 285, 289 and 63 N and 476 °C, respectively.
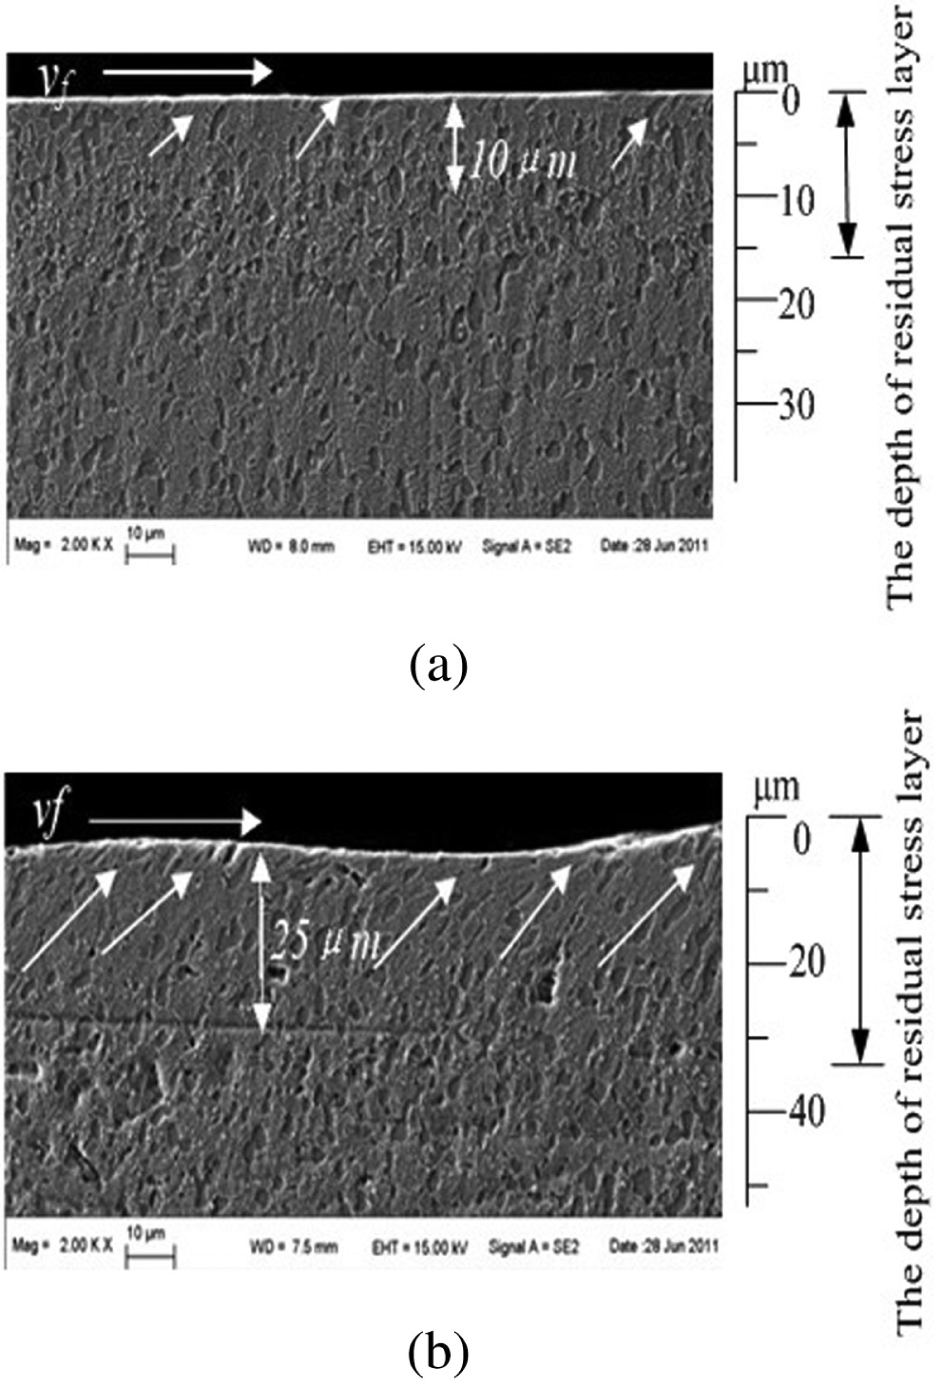
Variation of surface microstructure: (a) specimen 1# (fz = 0.02 mm/z, vc = 60 m/s, ae = 0.2 mm, ap = 10 mm) and (b) specimen 9# (fz = 0.1 mm/z, vc = 100 m/s, ae = 0.6 mm, ap = 10 mm).
With the increase of milling parameters, milling force increases rapidly, while milling temperature increases slowly. Plastic deformation layer becomes deeper, and grain fibrosis increases aggravatingly along feed direction. The thermal–mechanical coupling effect leads to residual stress, which increases with increase of milling parameters. However, when milling parameters increases too largely, tensile residual stress appears on the subsurface. It is because the maximum of plastic deformation caused by thermal–mechanical coupling effect appears on the subsurface, which leads to large strain hardening effect in this region.
Conclusion
All machined surfaces perform compressive residual stress under experiment conditions. The range of surface compressive residual stress is [−199.8 MPa, −41.7 MPa]. Milling speed has the most significant influence on residual stress. With increase of milling parameters, surface compressive residual stress increases and tensile residual stress appears on the subsurface.
The range of milling temperature is [300 °C, 518 °C], which is below the phase transition temperature. With increase of milling parameters, milling force increases rapidly, while milling temperature increases slowly. Larger strain hardening effect on the subsurface is the main cause for tensile residual stress.
When fz = 0.02 mm/z, vc = 60 m/min, ae = 0.2 mm and ap = 10 mm, surface residual stress is about −100 MPa. Compressive residual stress appears on machined surface and subsurface. The depth of compressive residual stress layer is 1020 µm.
Footnotes
Funding
The authors wish to thank the support of the National Natural Science Foundation of China (grant numbers 50975237 and 51005184) and National Science and Technology Major Project of the Ministry of Science and Technology of China (grant number 2013ZX04011031) and graduate starting seed fund of Northwestern Polytechnical University (grant number Z2013048).