
Abstract
In this work, the effect of process parameters, namely, discharge current, pulse on time, duty cycle and gap voltage, on electrode wear ratio, material removal rate and surface roughness has been studied in electrical discharge machining process using ultrasonic-assisted cryogenically cooled electrode. Analysis of variance and regression analysis have been used to model electrode wear ratio, material removal rate and surface roughness. The analysis reveals that discharge current, pulse on time and duty cycle have significant effect on electrode wear ratio and material removal rate. Discharge current and pulse on time were found to be significant in effecting surface roughness. Confirmation experiments established that predicted values from models were in agreement with experimental findings, and optimal processing conditions have been determined for the responses. A comparative study of electrical discharge machining process using ultrasonic-assisted cryogenically cooled electrode and conventional electrical discharge machining process has been done to establish the efficacy of the new process.
Keywords
Introduction
Electrical discharge machining (EDM) is a process that is based on removing material from a conducting workpiece by means of a series of repeated electrical discharges between tool electrode (cathode) and the workpiece (anode) in the presence of a dielectric fluid. The electrode is moved toward the workpiece by servo-controlled feed until the gap is small enough in the range of 25–50 µm 1 so that the applied voltage ionizes the dielectric fluid. Short duration discharges of the order of 0.5–4000 µs 2 are generated in the inter electrode gap. The material is removed with the erosive effect of the electrical discharges from tool and workpiece. Thermal energy generates a channel of plasma between the cathode and anode at a temperature in the range of 8000 °C–20,000 °C 3 initializing a substantial amount of heating and melting of material at the surface of each pole. When the pulsating direct current supply of approximately 20,000–30,000 Hz 4 is turned off, the plasma channel breaks down. This causes a sudden reduction in the temperature allowing the circulating dielectric fluid to implore the plasma channel and flush the molten material from the pole surfaces in the form of microscopic debris. EDM does not make direct contact between the electrode and the workpiece whereby it can eliminate mechanical stresses needed for shearing metal, chatter and vibration problems during conventional machining processes like turning, milling and so on.
Despite all the advantages, the EDM process is not free from drawbacks. One of the major drawbacks is the slow rate of material removal, which is of the order of 2–100 mm3/min. 5 Other drawback includes difficulty in reproducing sharp corners on the workpiece due to electrode wear, surface and subsurface damage, creation of thin and brittle heat-affected zone and high rate of electrode wear. In light of these defects, researchers6–8 have developed new techniques using ultrasonics, gas-based method, dry EDM and so on, where they tried to overcome the above limitations. Introduction of ultrasonic vibration to the electrode 6 is one of the methods used to expand the application of EDM. The higher efficiency gained by the employment of ultrasonic vibration is mainly attributed to the improvement in dielectric circulation that facilitates the debris removal and the creation of a large pressure change between the electrode and the workpiece.
The study of the effects on ultrasonic vibration of the electrode on EDM has been undertaken since mid-1980s. It was observed that the vibrating surface of the electrode accelerates the dielectric circulation, giving smaller machining times. Furthermore, it was observed that great pressure variations in the gap lead to more efficient discharges, which removed more melted metal from every crater. The affected layer was reduced, thermal residual stresses were modified and less microcracks were observed.6,9 The introduction of ultrasonic vibration to the electrode during EDM of different metals and ceramics also resulted in better machining efficiency, surface finish and reduced recast layer on the workpiece.10–20
Jia et al. 21 studied the mechanisms of ultrasonic machining (USM) and EDM, and a technology, which combined the advantages of both, has been proposed. The new technology could be used to machine all conductive hard and brittle materials with high efficiency and better surface integrity. The experimental results showed that the efficiency of this combined technology was over three times greater than that of USM, and the surface integrity was found to be similar. Ghoreishi and Atkinson 22 compared the effects of high- and low-frequency forced axial vibration of the electrode, rotation of the electrode and combinations of the methods (vibro-rotary) in respect of material removal rate (MRR), tool wear ratio (TWR) and surface quality (SQ) in EDM die sinking and found that vibro-rotary increased MRR up to 35% in comparison with vibratory EDM and by up to 100% as compared to rotary EDM in semifinishing. Yu et al. 23 studied the effects of ultrasonic waves on EDM process. They reported on the productivity of steel induced by ultrasonic-assisted EDM. Results indicated that ultrasonic waves and cavitation played an important role in improving the flushing and machining efficiency during ultrasonic-assisted EDM. They further reported that the MRR of EDM assisted by ultrasonic waves was improved greatly. Abdullah et al. 24 studied the effects of tool electrode ultrasonic vibration on some surface integrity properties of cemented tungsten carbide (WC–10%Co) in the EDM process. They studied the topography of the machined surface, the size and amount of cracks on the surface layer, hardness variation in the depth and the composition of the defective layer, when machining with and without ultrasonic vibration of the copper electrode under different machining conditions. It was observed that there were no or very small cracks in the ultrasonic-assisted EDM samples, while on conventionally ED machined surfaces, the cracks were severe, and in some cases, the length of normal and transverses cracks could exceed 420 and 800 µm, respectively.
From the review of literature, it was found that the use of ultrasonic assistance in EDM and micro-EDM resulted in not only increased MRR but also higher tool wear and surface roughness (SR).6,9 It has also been observed that cryogenic cooling of the electrodes in EDM results in reduction of electrode wear ratio (EWR) and SR in comparison with conventional EDM;25,26,27 however, it was also observed that MRR also decreased significantly. In view of the above observations, therefore, an attempt has been made to integrate the cryogenic cooling of electrode with ultrasonic assistance to utilize the positive aspects of both the processes in EDM.
Therefore, in this work, the effect of process parameters, namely, discharge current, pulse on time, duty cycle and gap voltage on EWR, MRR and SR has been studied in EDM process using ultrasonic-assisted cryogenically cooled tool electrode (UACEDM). M2-grade high-speed steel (HSS) has been chosen as workpiece material, and response surface methodology has been used to plan the experiments. Analysis of variance (ANOVA) and regression analysis have been used to model EWR, MRR and SR. The analysis revealed that discharge current, pulse on time and duty cycle have significant effect on EWR and MRR. Discharge current and pulse on time were found to be significant in effecting SR. Confirmation experiments established that predicted values from models were in good agreement with experimental findings, and optimal processing conditions have been determined for the responses. A comparative study of UACEDM process and conventional EDM process has been done to establish the efficacy of the new process.
Planning of experiments
Tool design to include cryogenic cooling and ultrasonic vibrations
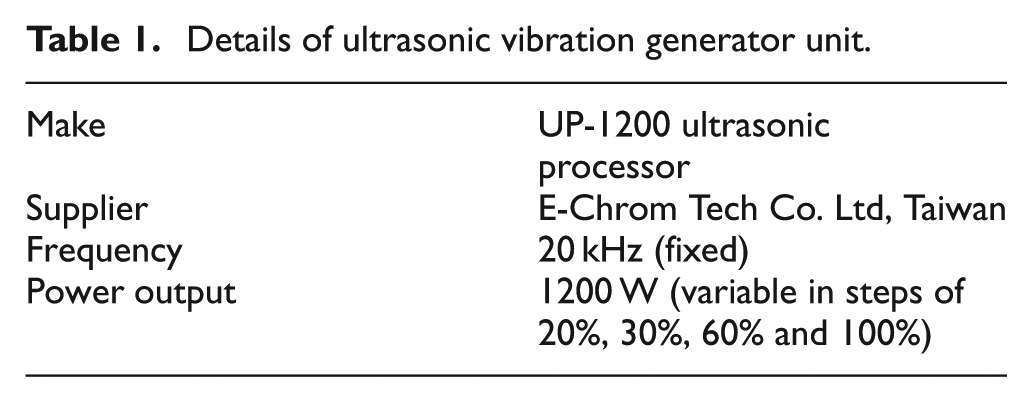
Figure 1 shows the schematic diagram of the electrode fixture assembly. The ultrasonic generator (Table 1) was attached to the EDM machine head using a holding fixture. A collar has been designed to fit the size of the horn. The collar supports a spring-loaded system that transmits the ultrasonic vibrations to the electrode tip. A holding attachment has been designed to hold the container where cryogenic cooling of the electrode takes place. This holding attachment is connected to the generator unit with the help of springs. Insulation has been provided between the end of concentrator and shank of container to prevent electrical malfunction.
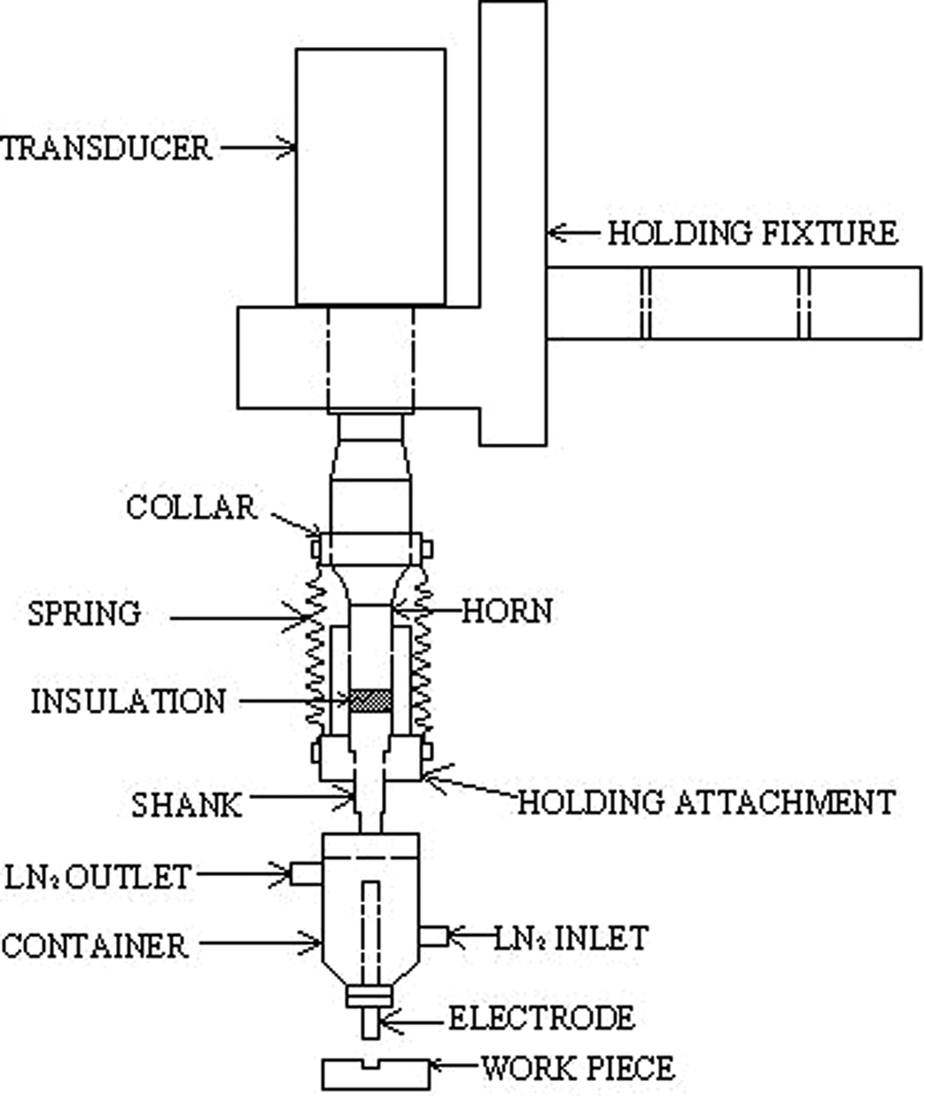
Schematic diagram of the UACEDM setup.
Details of ultrasonic vibration generator unit.
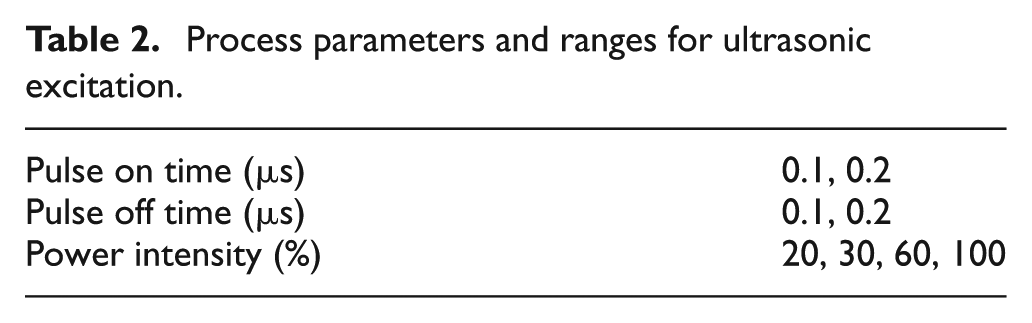
It has been found that important parameters that effect ultrasonic vibrations were pulse on time of ultrasonic vibrations, pulse off time of ultrasonic vibrations and power intensity of ultrasonic generator. 28 The process parameters and ranges used for experimentation have been selected based on the setup constraints. Pulse on time, pulse off time and power intensity were the parameters, and amplitude of vibration was the response. In total, eight experiments have been performed in this study to understand the relationship between ultrasonic generator and amplitude of vibration at the tool end, by varying the parameters according to the constraints of the system. The process parameters and their ranges have been listed in Table 2.
Process parameters and ranges for ultrasonic excitation.
From literature review, it was observed that the range of amplitude of ultrasonic vibrations was between 0 and 20 µm. 6 The amplitude of the vibration at the electrode end was measured indirectly by taking its impression on putty. This impression of the vibrating end of the tool on putty was measured by coordinate measuring machine. The measured values of amplitude for each of the experiment have been presented in Table 3.
Measured responses corresponding to each trial.
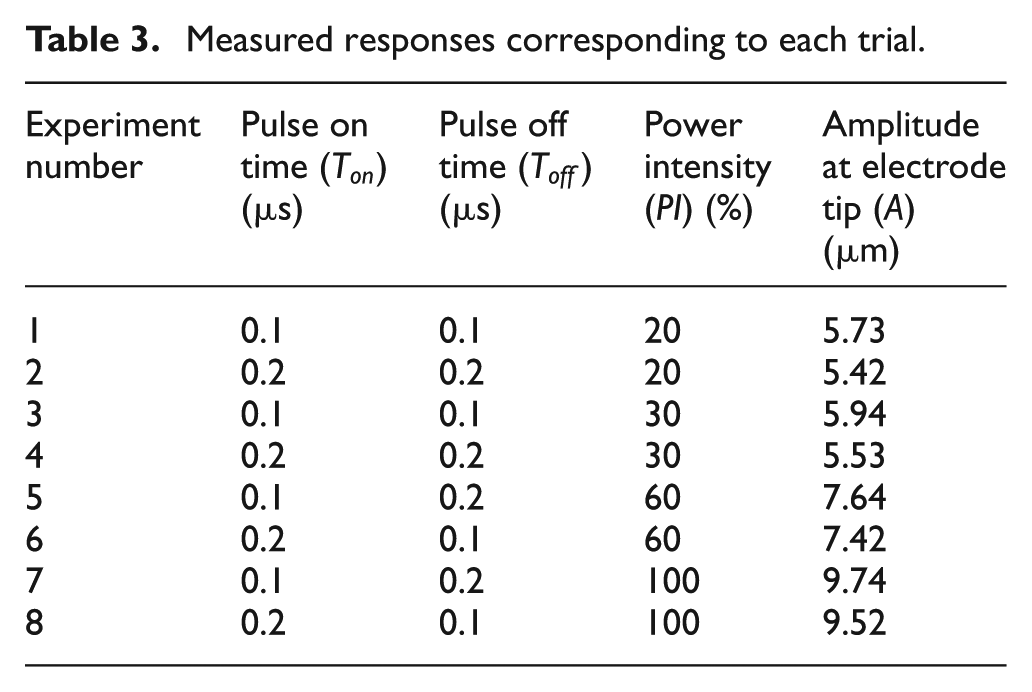
Based on the data presented in Table 3, regression analysis and ANOVA were performed to determine the percentage contributions of each term, which is shown in Figure 2. This figure shows that power intensity is the most influential parameter affecting the amplitude of vibration. Figure 3 displays the main effect plots for amplitude of vibration. It can be seen that amplitude of vibration increases with increase in power intensity. Furthermore, it can also be seen from Figures 2 and 3 that the pulse on time and pulse off time do not influence the amplitude of vibration.
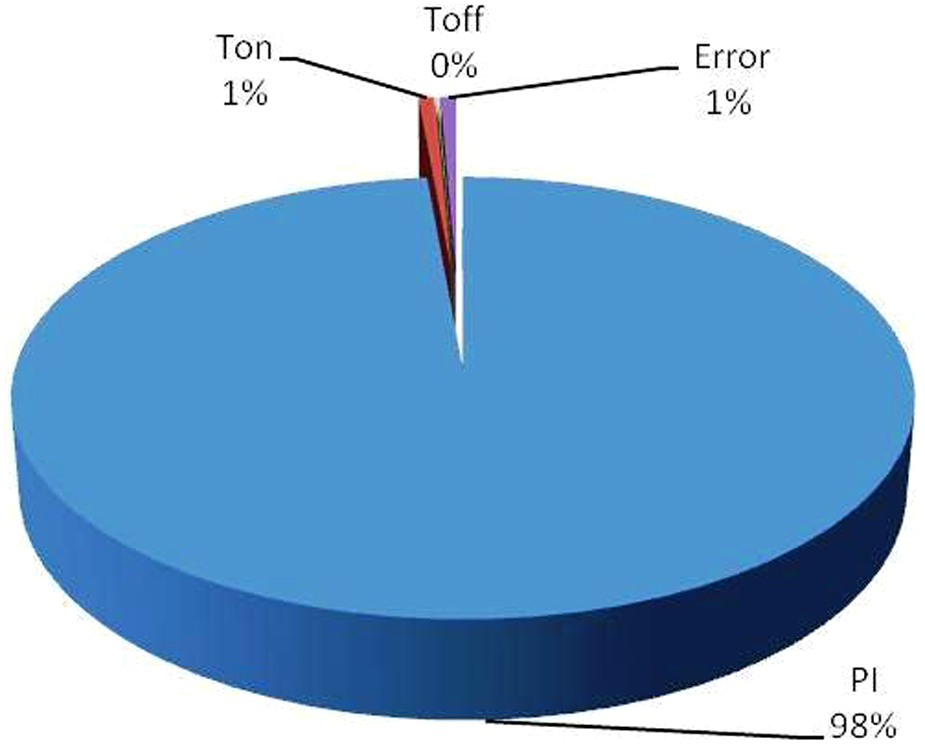
Percentage contribution of the factors on the amplitude of vibration
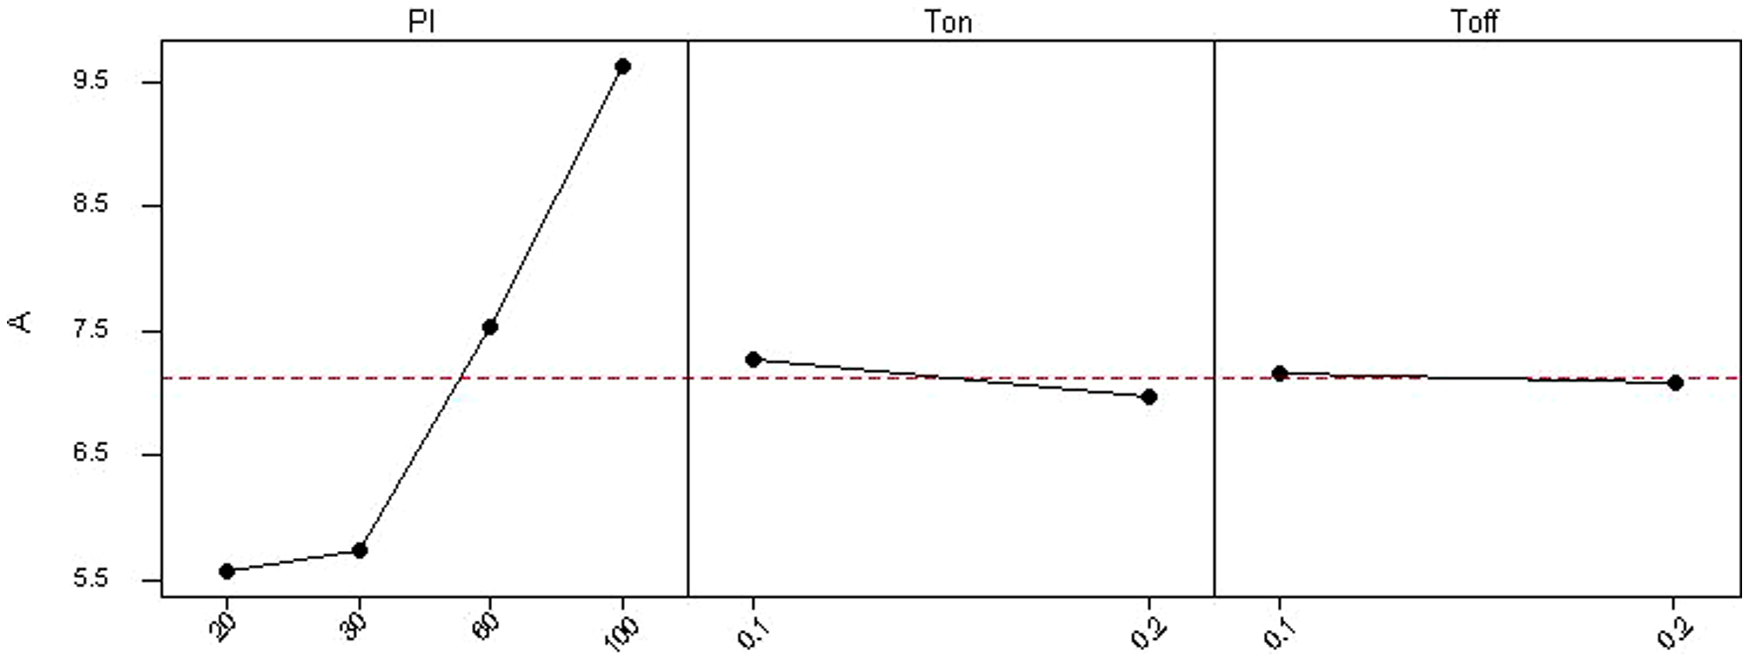
Main effect plots for amplitude of vibration.
The power intensity
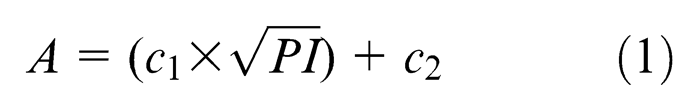
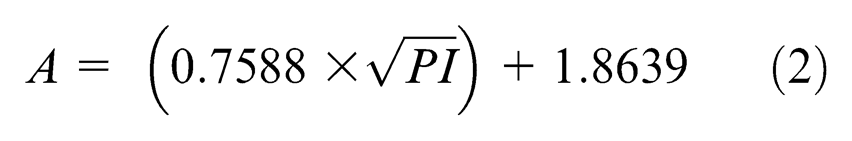
where c1 and c2 are constants. A model for the amplitude was therefore obtained by nonlinear estimation of the data presented in Table 3 and is given as follows
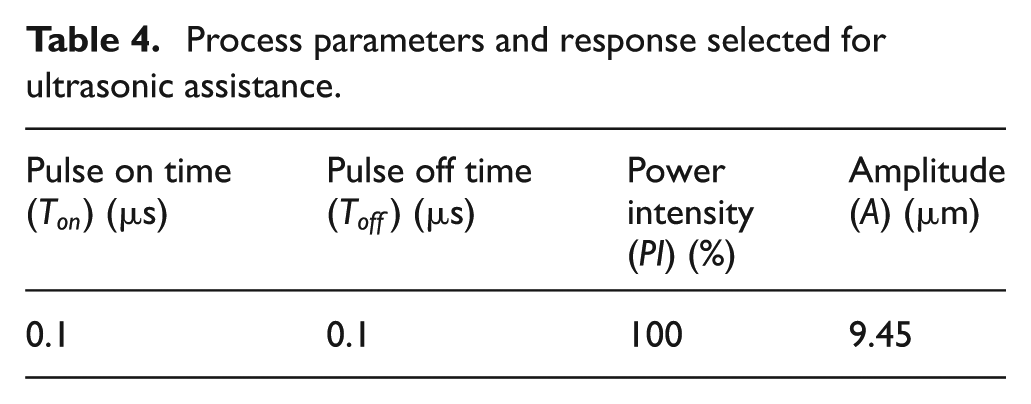
Based on the study conducted, the eventual process parameters used for the excitation of EDM process using cryogenically cooled electrode have been selected as given in Table 4.
Process parameters and response selected for ultrasonic assistance.
Details of workpiece and tool assembly
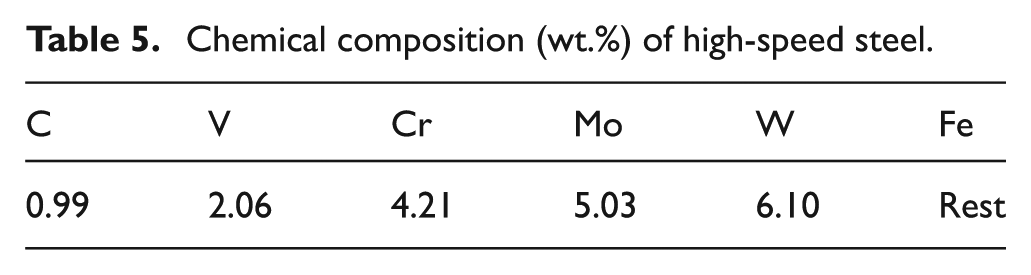
M2-grade HSS workpieces have been spark eroded using copper as tool material. The workpiece used for this study was HSS having the dimension of 15 mm × 15 mm × 15 mm. The hardness of the workpiece was 35 HRC. The chemical composition of the workpiece is given in Table 5.
Chemical composition (wt.%) of high-speed steel.
Copper has been chosen as the electrode material because of its lower electrical and thermal resistance. The tool tip diameter has been taken as 7 mm. The length of the electrode has been kept at 70 mm. The upper part was made to fit the attachment into the electrode collet. The central part is the container, as shown in Figure 4, in which heat exchange between liquid nitrogen and the electrode would take place. The liquid nitrogen was stored in a Dewar and passed through the container. The actual electrode setup has been shown in Figure 4.
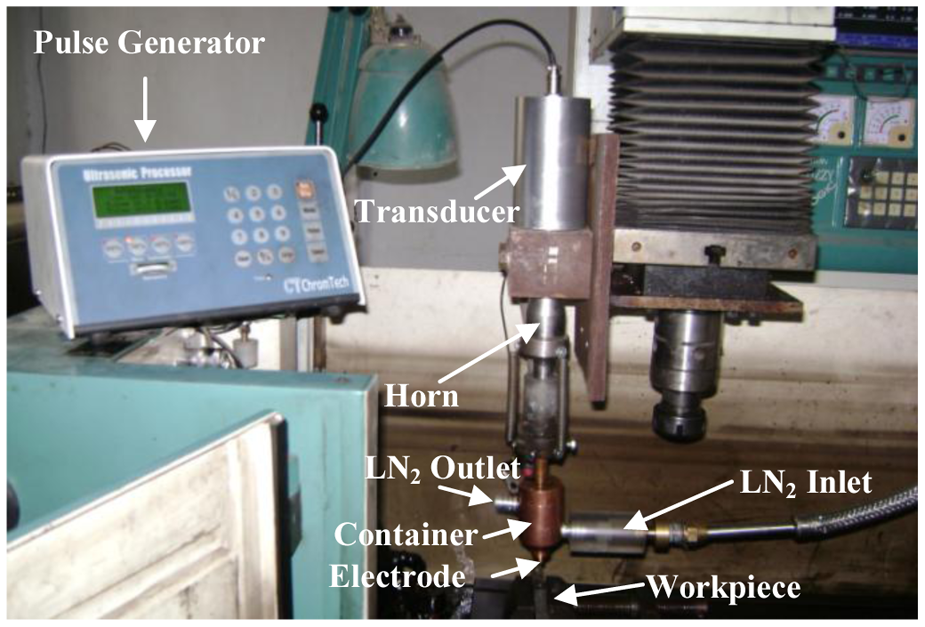
The electrode setup fixed on the EDM machine.
Selection of process parameters
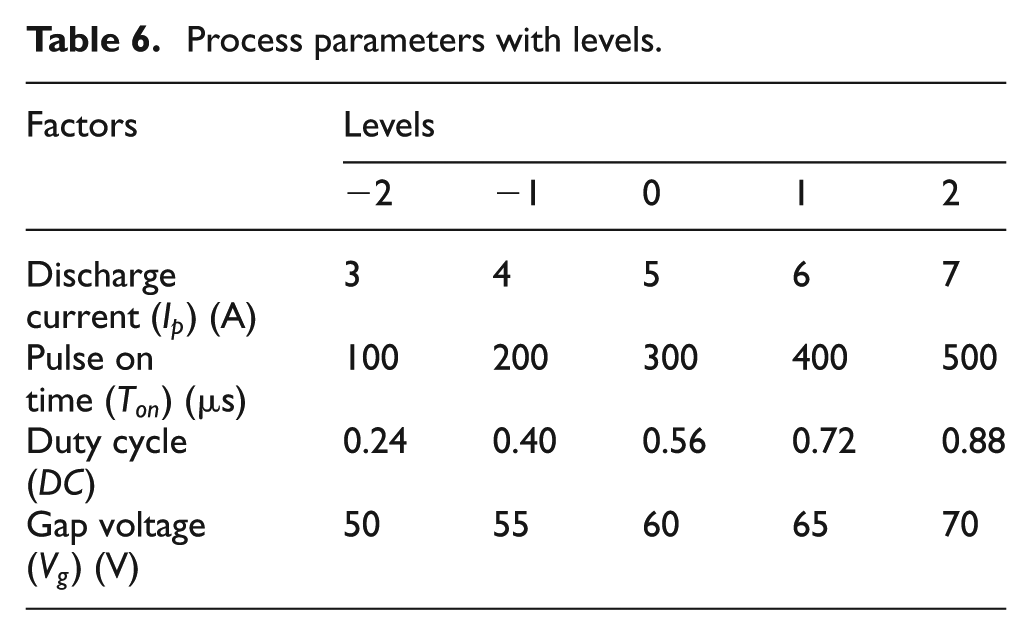
The performance of EDM of steel is governed by a large number of interactive variables like sparking current, gap current, machining time, pulse on time, pulse off time, duty cycle, gap voltage and so on.30,31 However, to facilitate the experimental work, only four controllable variables are considered, namely, discharge current, pulse on time, duty cycle and gap voltage. The experiments have been conducted keeping these factors at due suitable levels. The range of each factor has been selected based on the capability of the machine and preliminary experiments conducted. When the current was kept below 3 A, it was observed that MRR was insignificant, and when current of more than 7 A was selected, it resulted in poor surface finish necessitating the selection of the values at an intermediate. The range selected for the pulse on time is commonly used for the EDM. The range selected for the duty cycle covers a wide range of duty cycle. While the range of gap voltage selected is in accordance to that available on the machine used for the experimentation. The process parameters with levels have been given in Table 6.
Process parameters with levels.
Planning of the experiments
A well-designed experimental plan can substantially reduce the number of experiments. Therefore, it is essential to have a well-designed set of experiments. Central composite rotatable design (CCRD) is the most popular class of second-order designs. 32 CCRD is capable of predicting independent, quadratic and interaction effects of different parameters on the responses. In total, 31 experiments have been carried out at five levels.
Die sinking ultrasonic-assisted EDM experiments with cryogenically cooled electrode have been carried out on EDM machine (Model PS LEADER ZNC; Electronica, India). In all the experiments, kerosene oil was used as dielectric medium. The flash point of kerosene is 55 °C. The machining time was fixed suitably and kept 25 min for all the experiments.
EWR has been defined as the ratio of the wear weight of electrode to the wear weight of workpiece after machining 26 and is given as follows
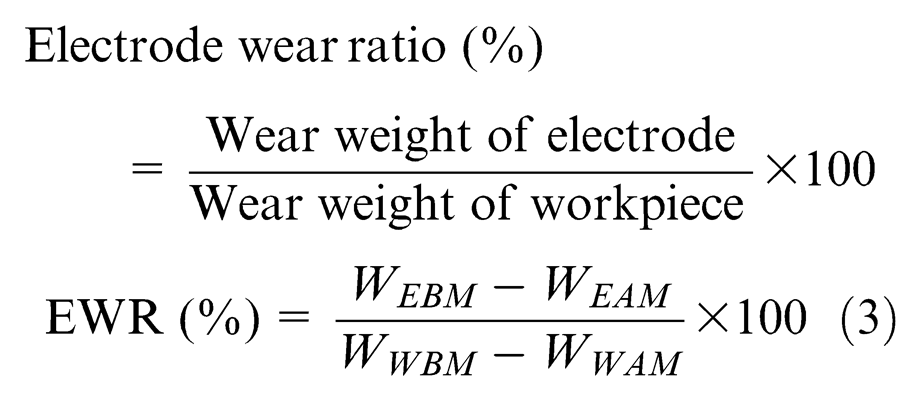
Similarly, MRR has been defined as the ratio of the wear weight of workpiece to machining time 33
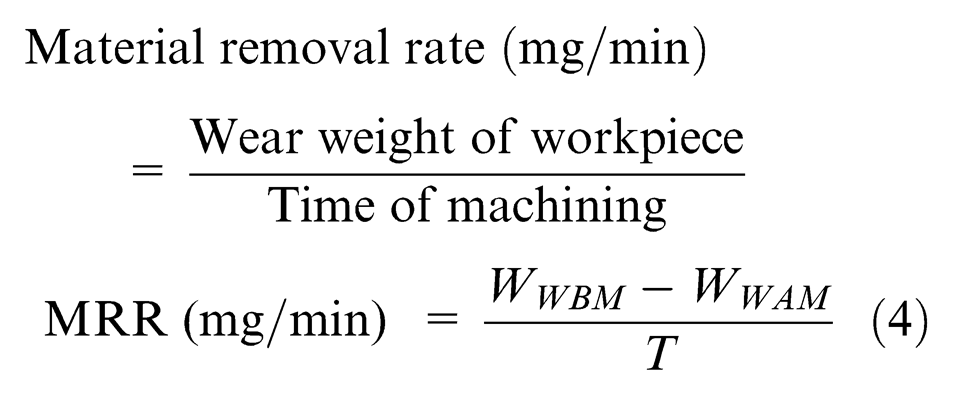
where W
EBM
is the weight of the electrode before machining, W
EAM
is the weight of the electrode after machining, W
WBM
is the weight of the workpiece before machining, W
WAM
is the weight of the workpiece after machining and T is the total time during which machining was performed. The surface finish after machining was measured using Talysurf 6 (Rank Taylor Hobson, England). A traverse length of 3 mm with a cutoff evaluation length of 2 mm was used. The centerline average value of the SR
Analysis of the experimental data
The measured values of MRR, EWR and SR for each of the experiment have been presented in Figure 5.
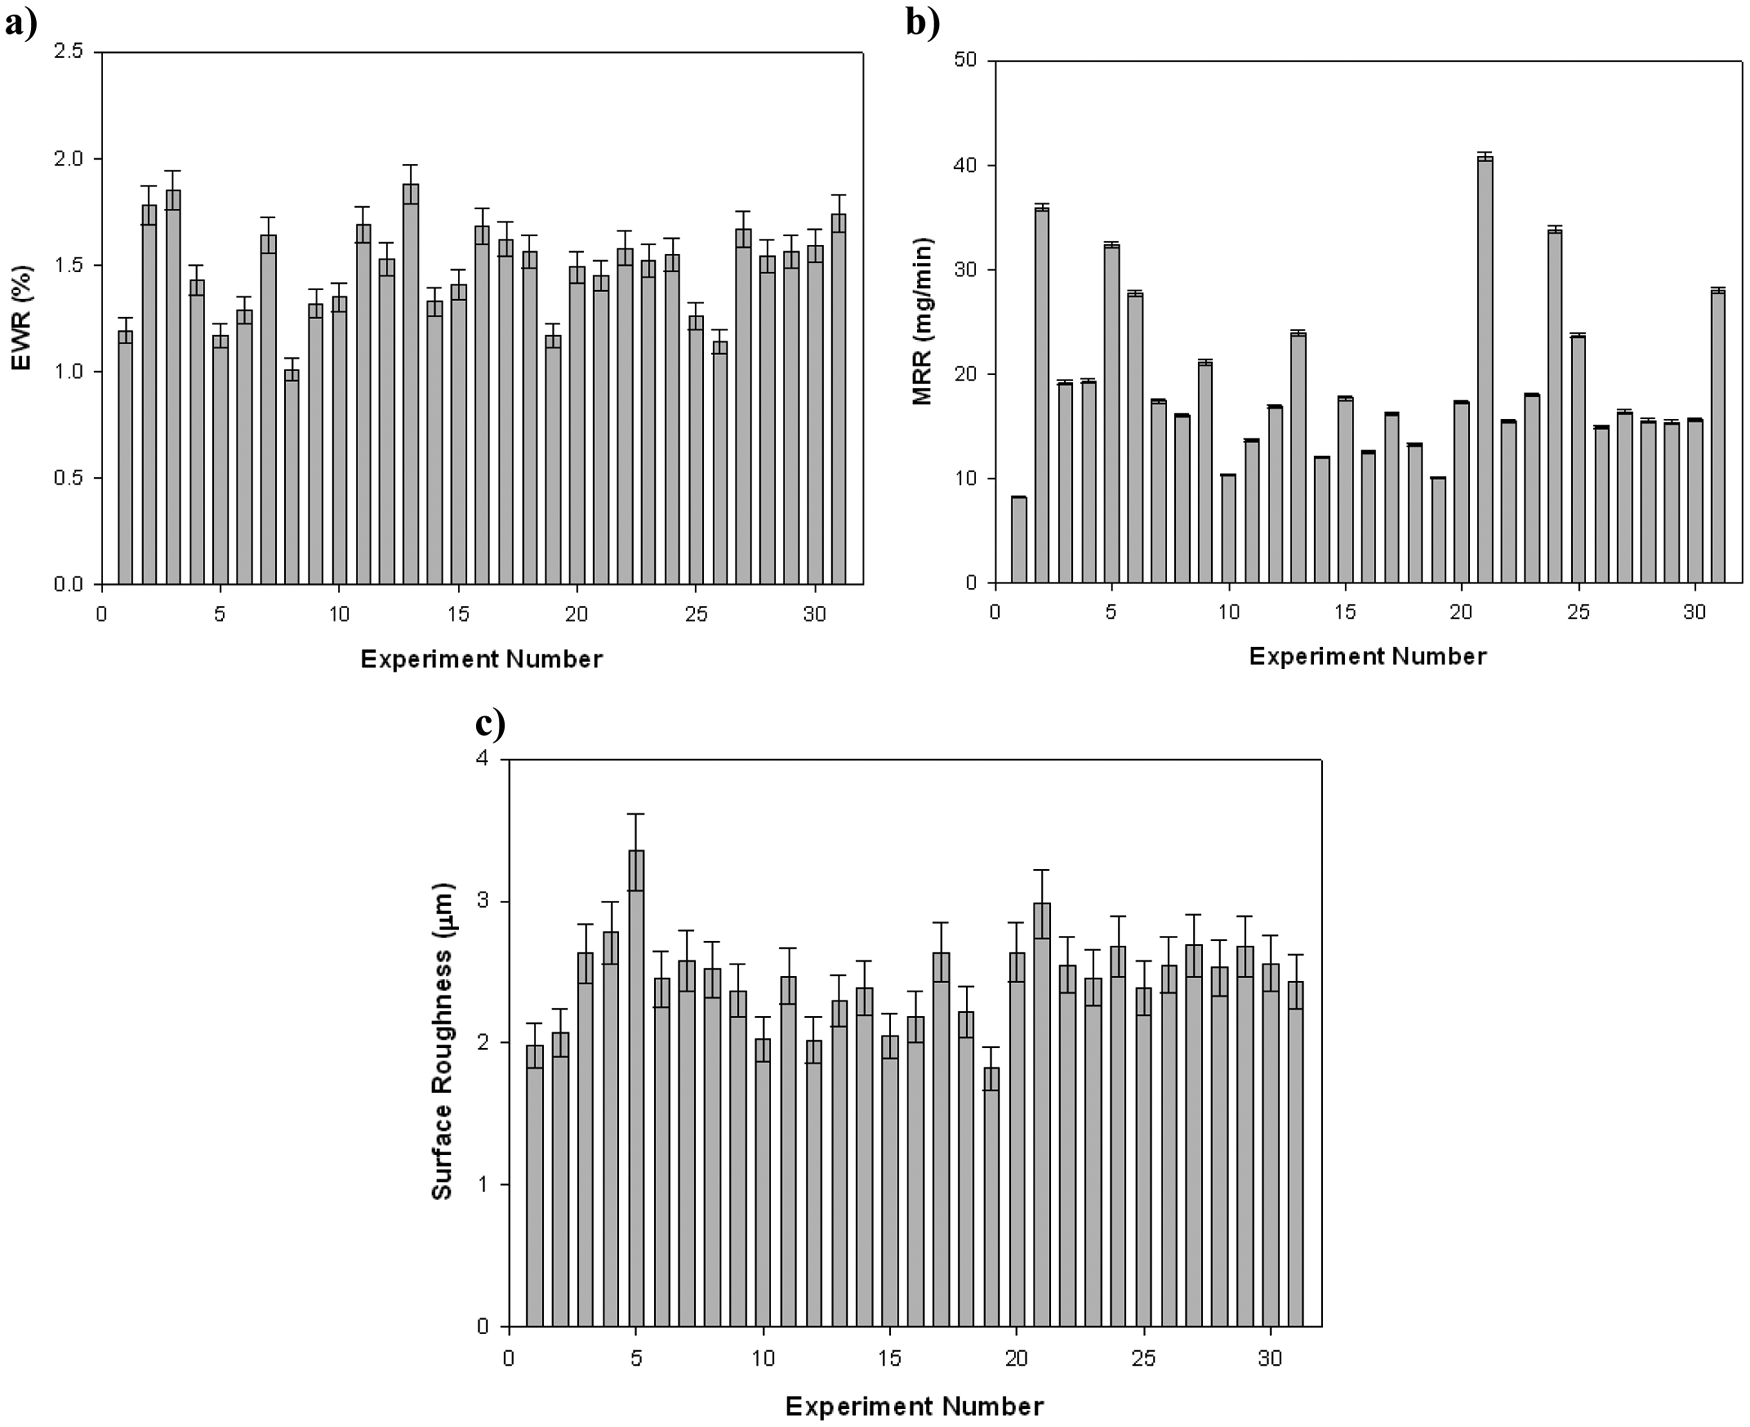
Measured responses corresponding to each trial for (a) EWR, (b) MRR and (c) SR.
EWR
A model for the EWR was obtained by analyzing the data presented in Figure 5(a) and is given as equation (5) after eliminating all the insignificant parameters
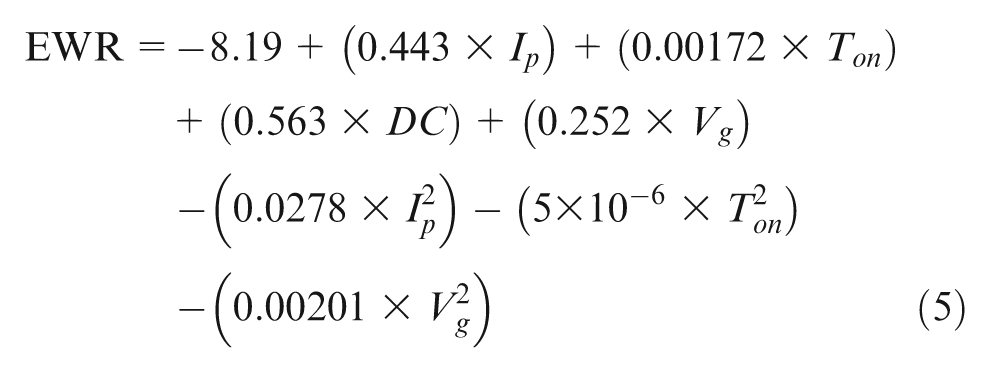
ANOVA has been used to check the adequacy of the developed model. The F ratio of the predictive model was calculated and compared with the standard tabulated value of the F ratio for a specific confidence interval. The ANOVA for the second-order model described by equation (5) has been presented in Table 7. Percentage contributions for each term of the model are shown in Figure 6. This figure shows that discharge current, pulse on time and duty cycle are the most influential parameters affecting EWR. Figure 7 displays the main effect plots for EWR. It can be seen that EWR increases with increase in discharge current. It is also observed that EWR reduces with increase in pulse on time. EWR showed an increase with duty cycle. It can be seen from Figures 6 and 7 that the gap voltage does not influence the EWR.
ANOVA table for EWR.
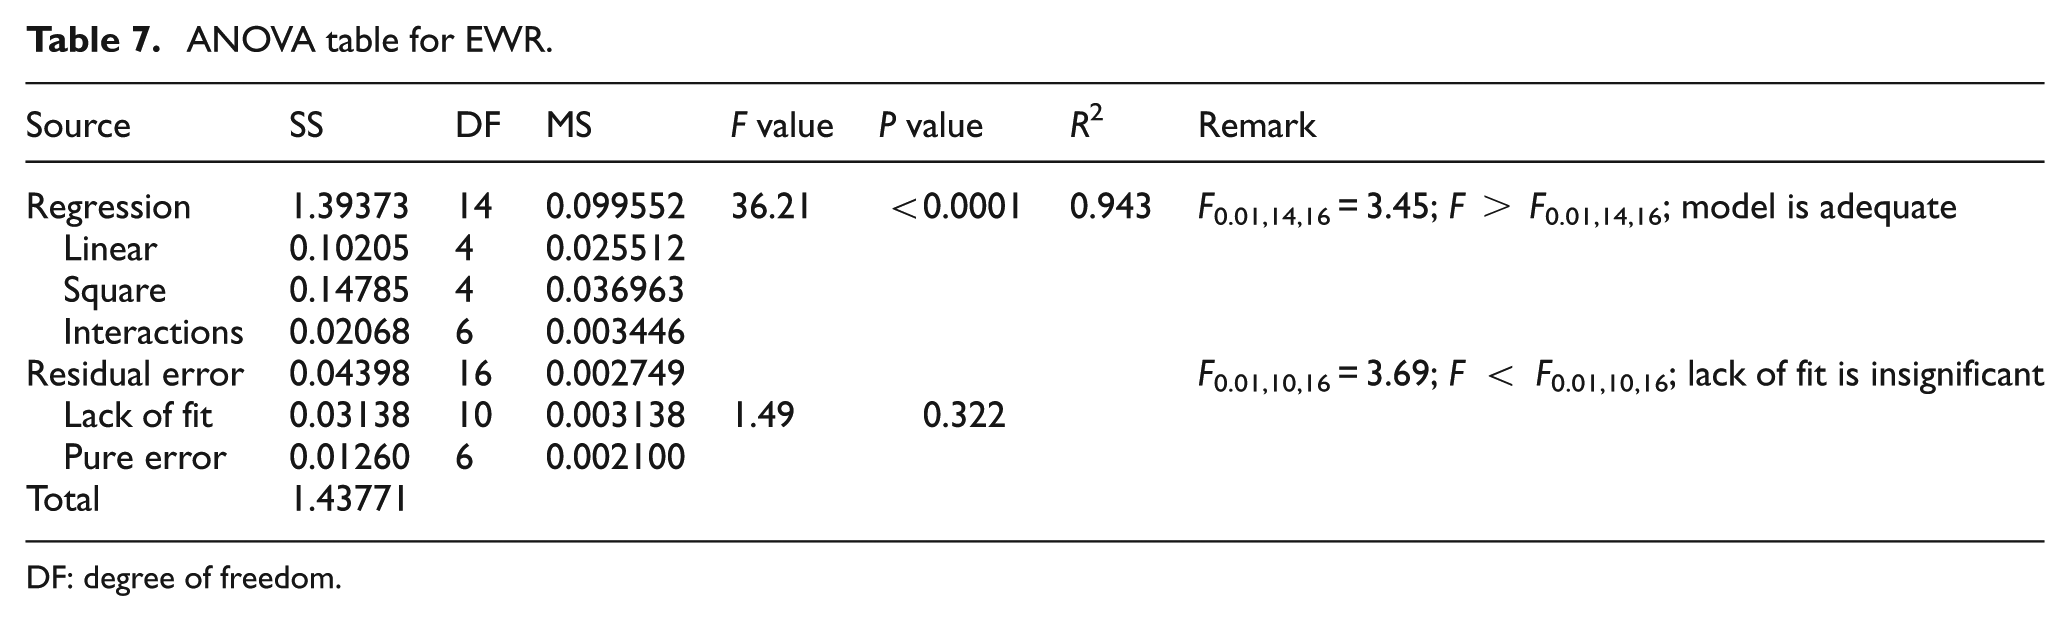
DF: degree of freedom.
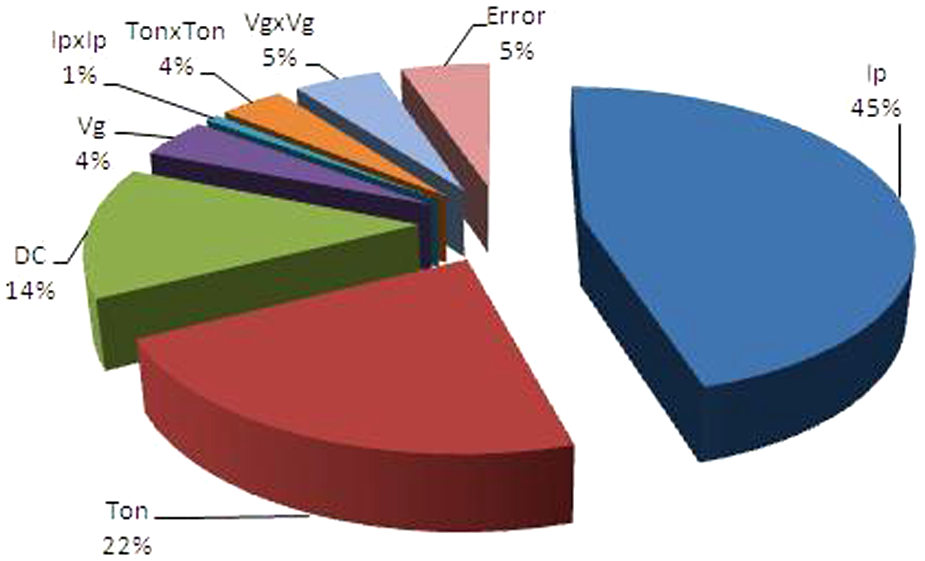
Percentage contribution of the factors on the electrode wear ratio.
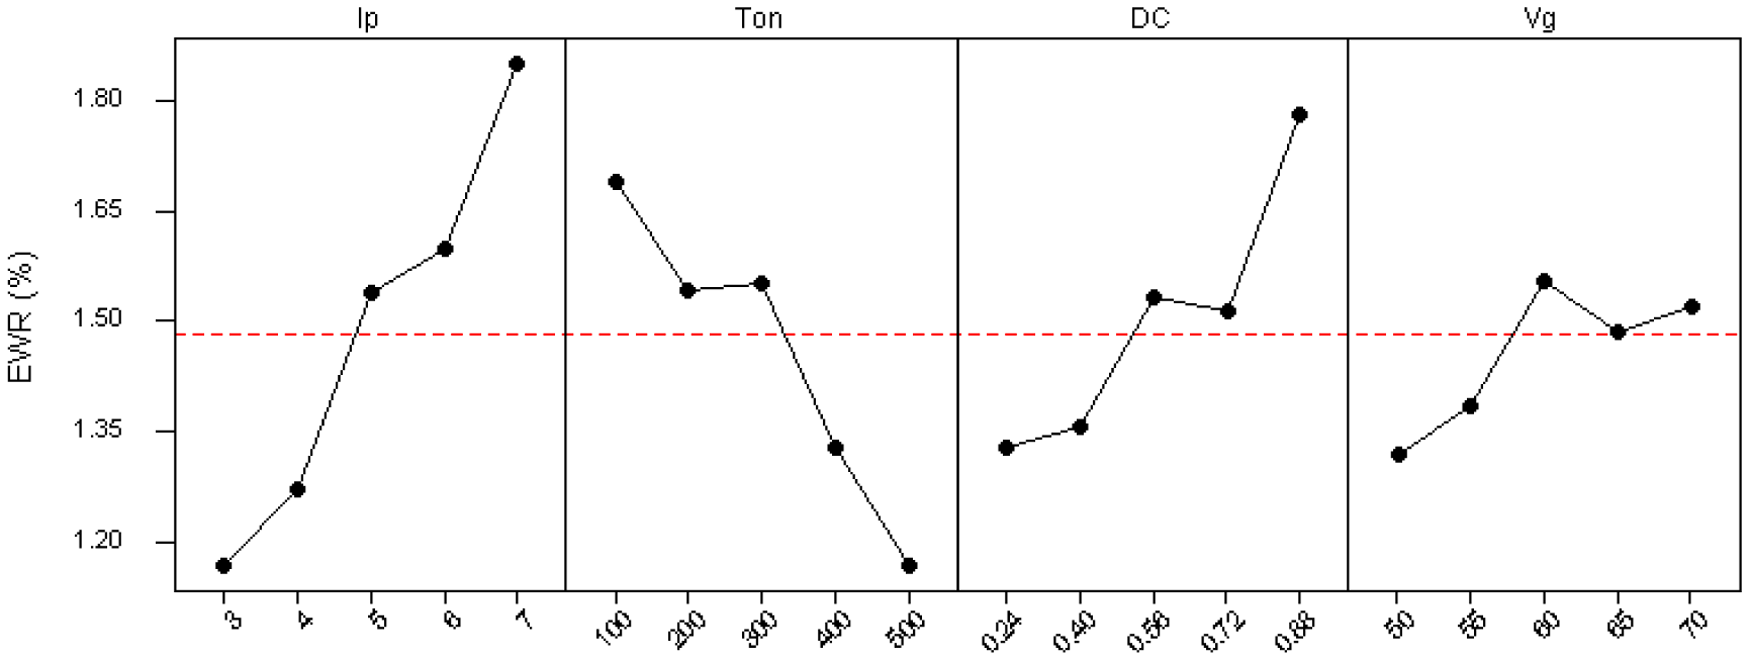
Main effect plots for EWR.
Figure 8(a) shows the effect of discharge current on EWR. The surface plot reveals that EWR increases with discharge current. This may be due to the formation of the electrical discharge column in the machining gap, which not only removes the unwanted workpiece material but it also wears out the electrode. Increase in the discharge current causes more electrical discharge energy to be conducted into the machining gap, thereby increasing the EWR. 35 The effect of duty cycle on the value of EWR is presented in Figure 8(b). It shows that the value of EWR increases with an increase in the duty cycle. An increase in the duty cycle leads to generation of higher spark energy, which causes an increase of electrode wear, which eventually results into higher EWR. The effect of pulse on time on the value of EWR is presented in Figure 8(c). It is observed that an increase in pulse on time decreases the values of EWR. This is due to the fact that the diameter of the discharge column increases with the pulse duration, which eventually reduces the energy density of the electrical discharge on the discharge spot. 31 It has also been reported that at longer pulse on time, the carbon from the decomposition of hydrocarbon-based dielectric liquid deposits on the surface of the tool. 36 This deposited layer increases the wear resistance of the tool and reduces EWR.
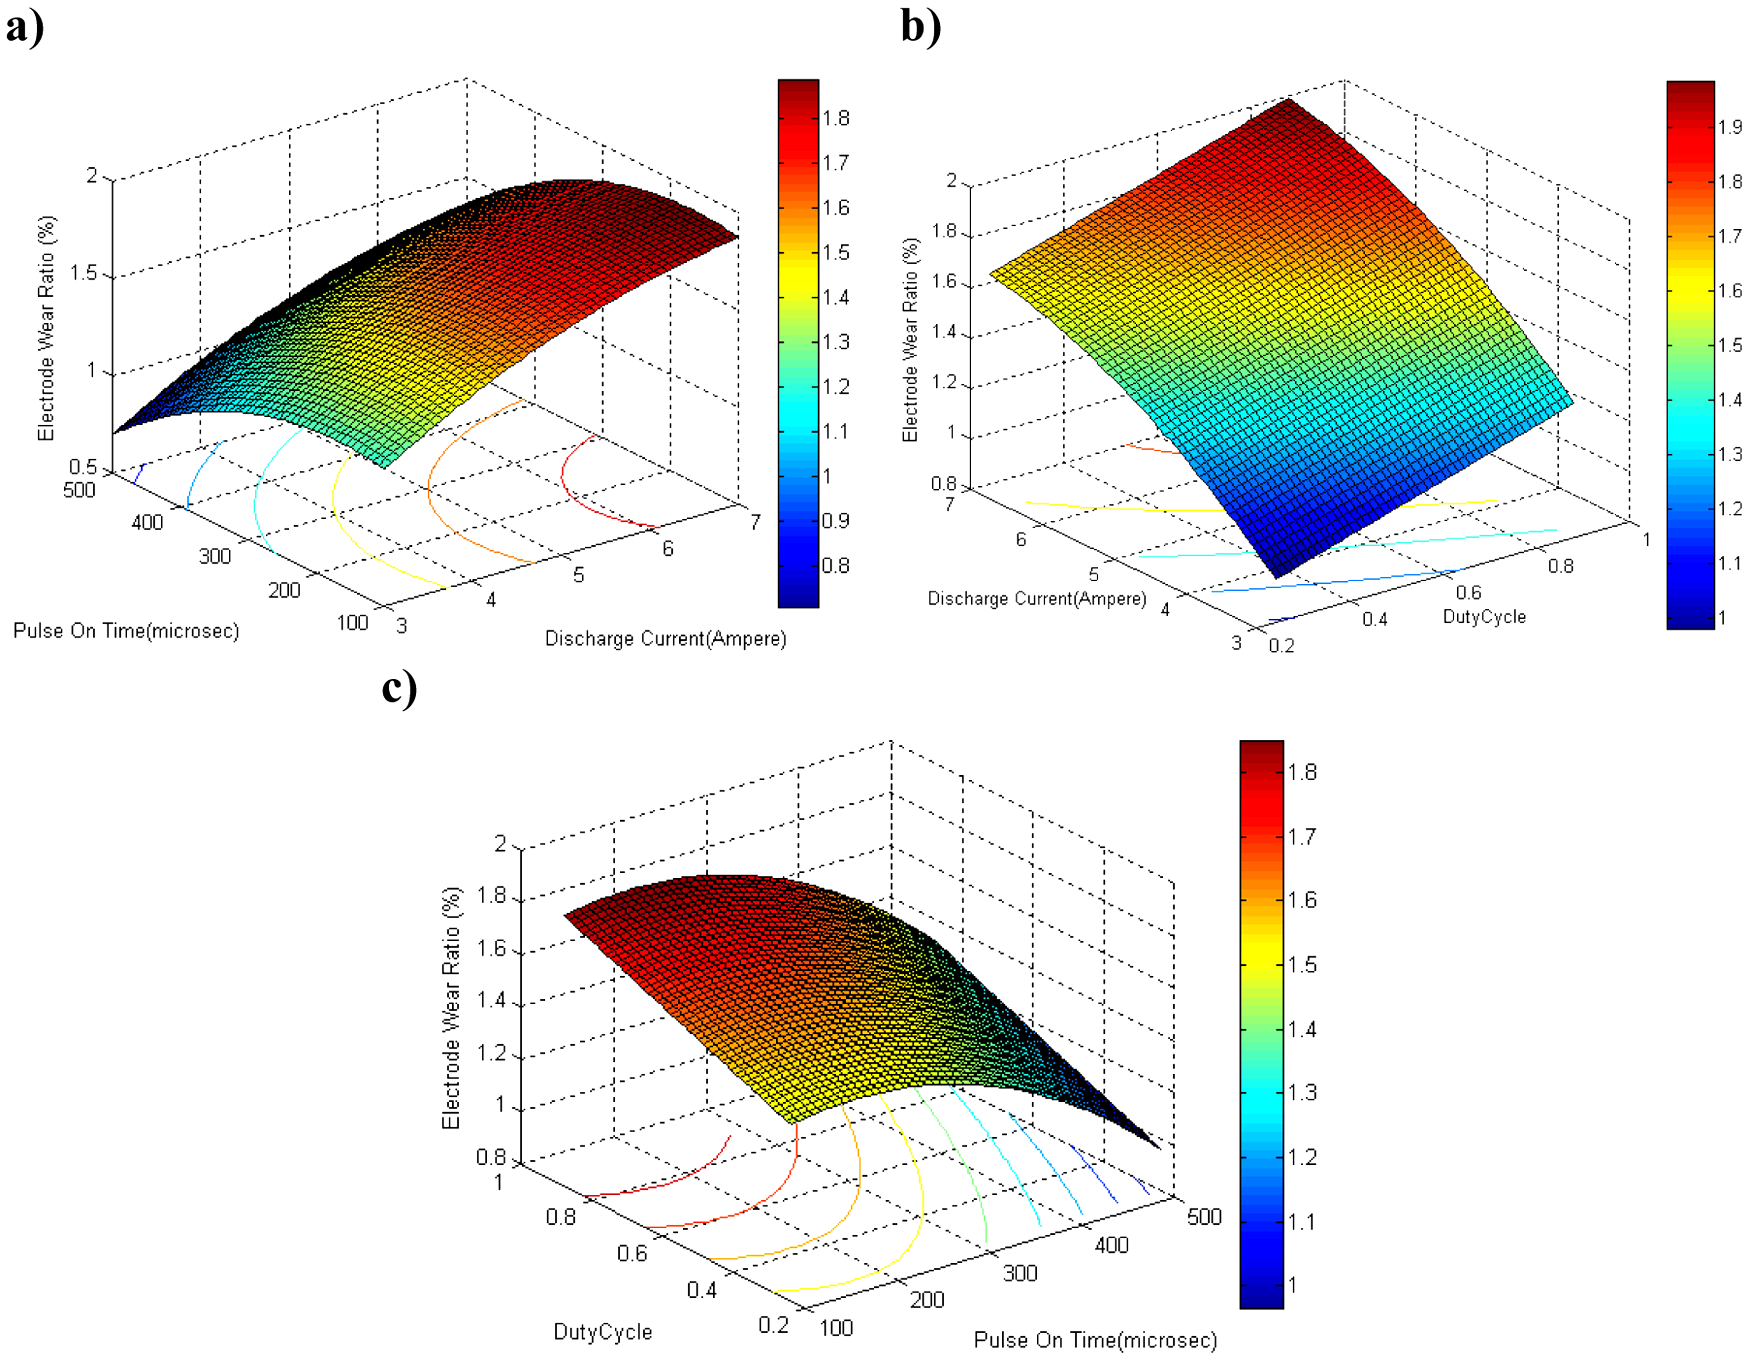
Response surfaces for electrode wear ratio for (a) discharge current (b) duty cycle (c) pulse on time
MRR
A model for the MRR was obtained by analyzing the data presented in Figure 5(b) and is given as equation (6) after eliminating all the insignificant parameters
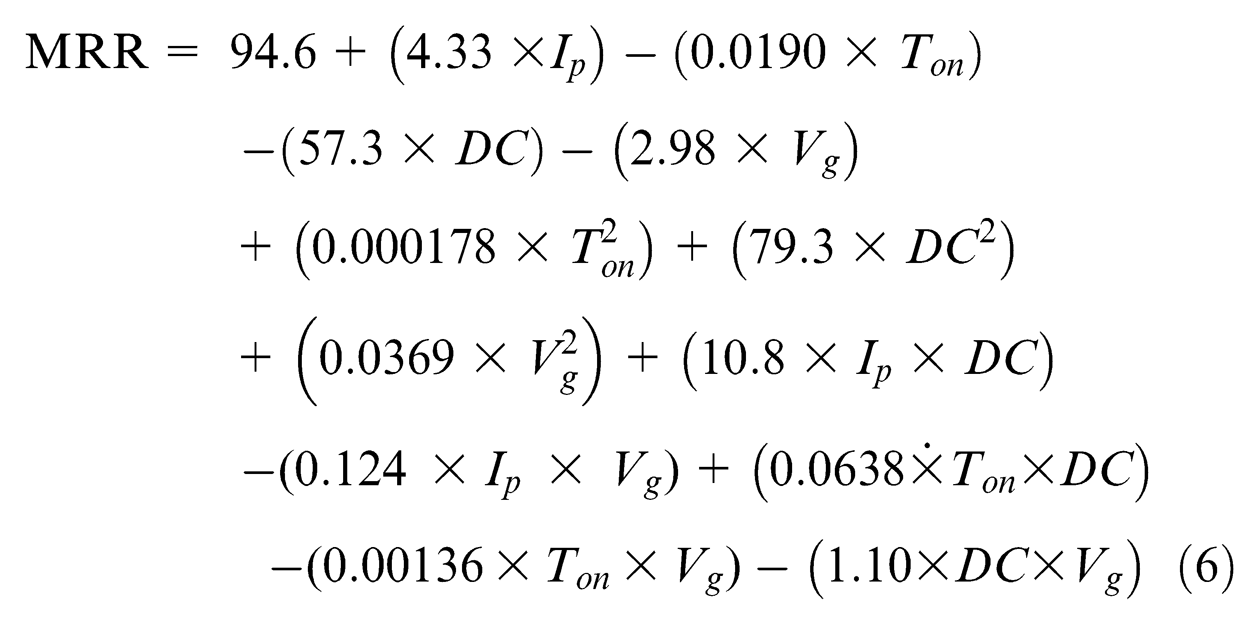
ANOVA has been used to check the adequacy of the developed model. The F ratio of the model was calculated and compared with the standard tabulated value of the F ratio for a specific confidence interval. The ANOVA for the second-order model described by equation (6) has been presented in Table 8. Percentage contributions for each term of the model are shown in Figure 9. This figure shows that discharge current, pulse on time and duty cycle are the most influential parameters affecting MRR. Figure 10 displays the main effect plots for MRR. It can be seen that MRR increases with discharge current. It is also observed that MRR increases with pulse on time. Furthermore, it can be seen that an increase in the duty cycle leads to an increase in the MRR. It can be seen from Figures 9 and 10 that the gap voltage does not influence the MRR.
ANOVA table for MRR.
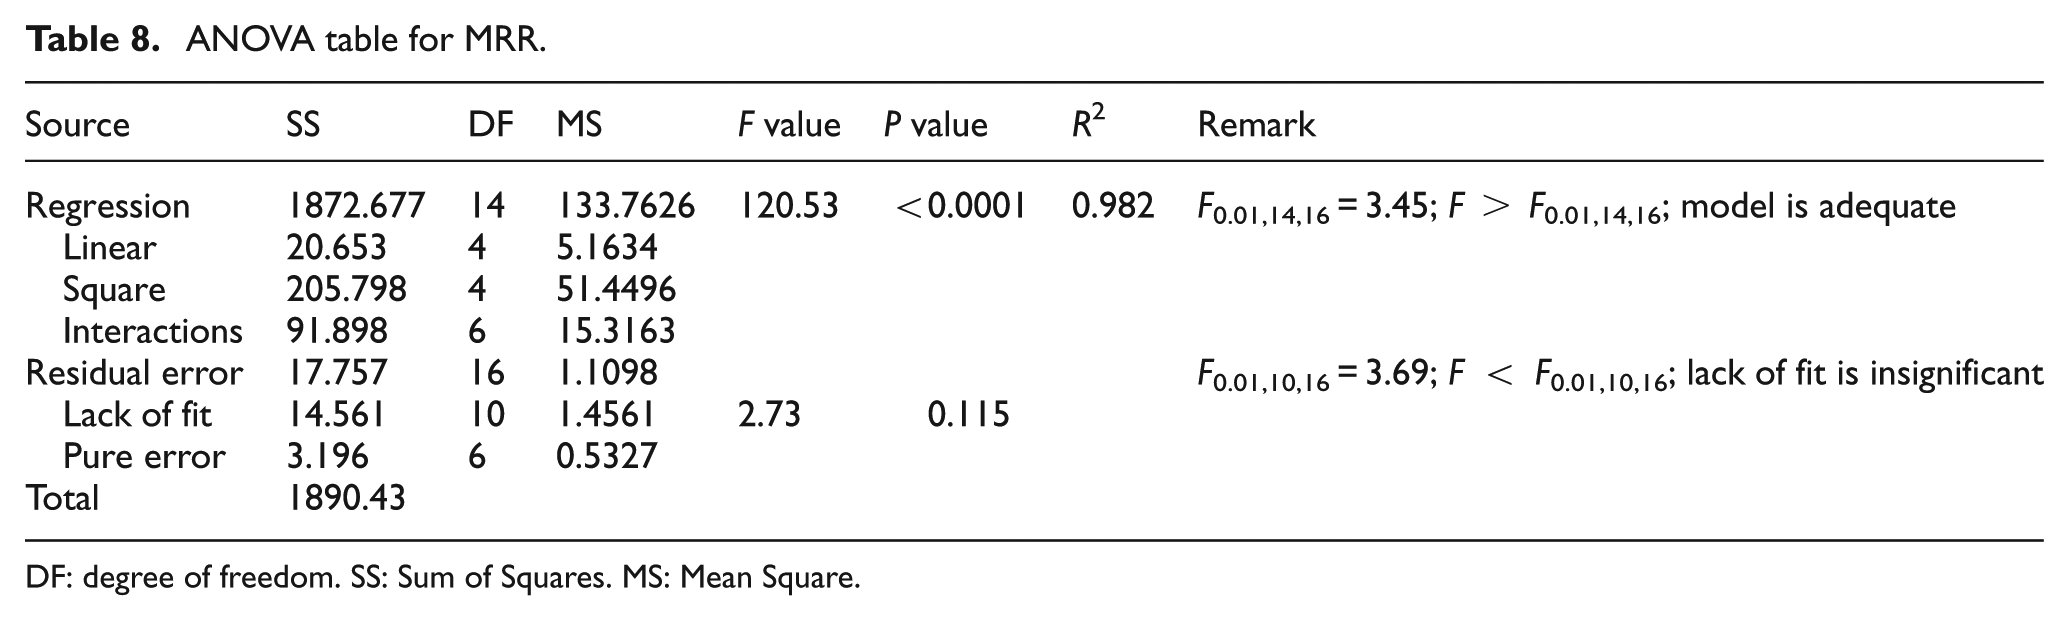
DF: degree of freedom. SS: Sum of Squares. MS: Mean Square.
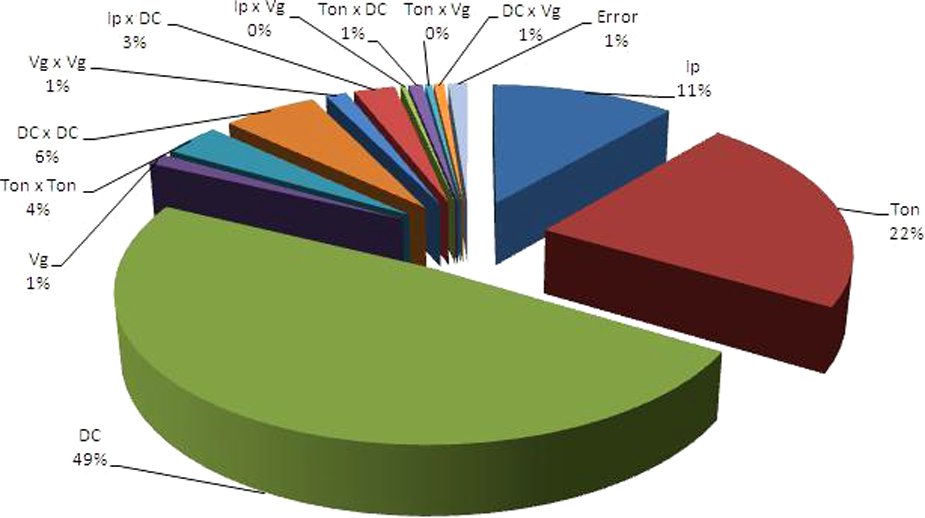
Percentage contribution of the factors on the material removal rate.
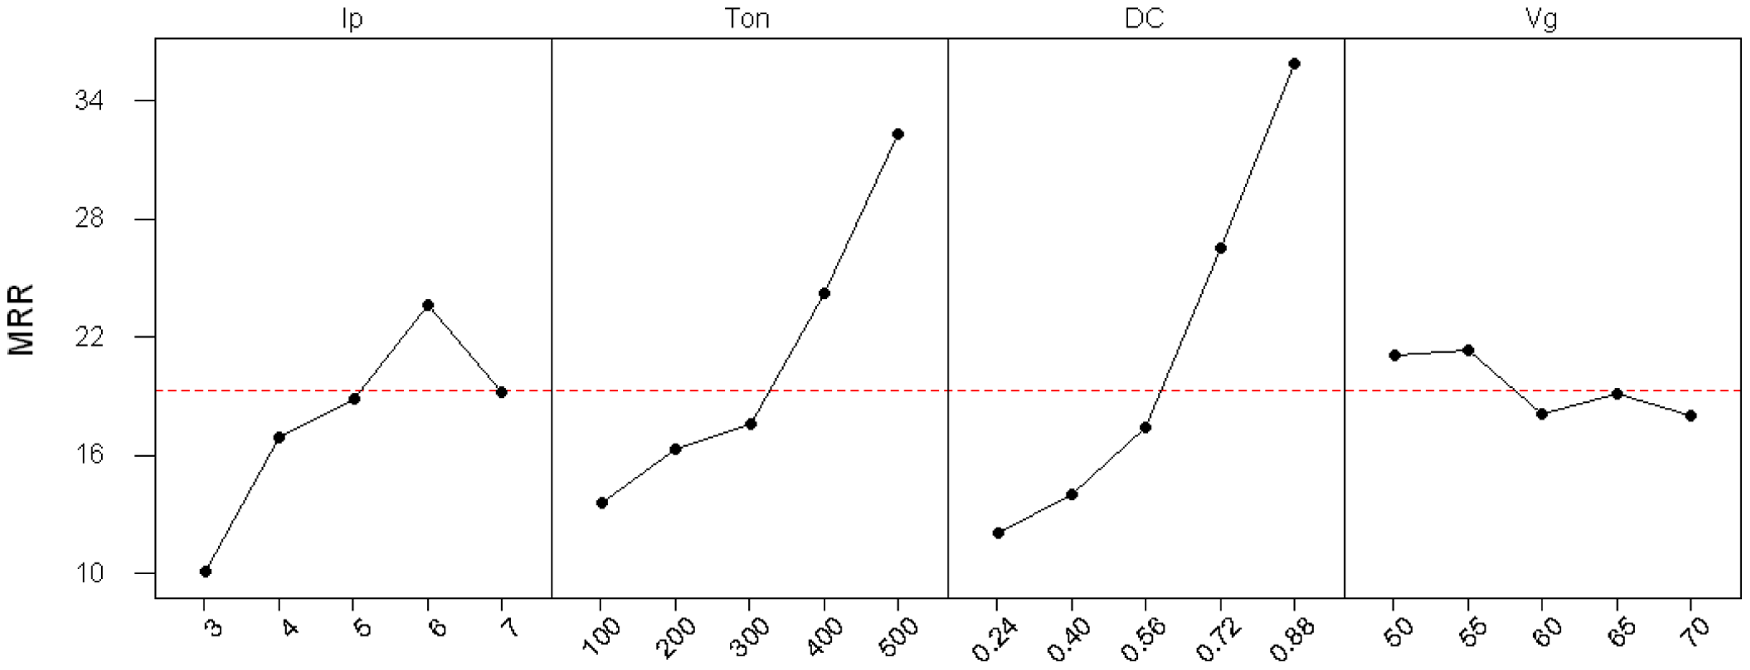
Main effect plots for MRR.
Figure 11(a) shows the effect of discharge current on MRR. MRR increases with the increase in discharge current. This could be due to an increase in both diameter and the depth of the craters as well as discharge energy at the discharge point, which improves the rate of melting and evaporation. In addition, the ultrasonic vibration improves the dielectric circulation, which facilitates better debris removal, thereby increasing MRR. The effect of duty cycle on the value of MRR is presented in Figure 11(b). It can be seen that an increase in the duty cycle leads to an increase in the MRR. The increase of duty cycle means applying the discharge for a longer duration and this causes an increase in MRR. The effect of pulse on time on the value of MRR is presented in Figure 11(c). It can be seen that MRR decreases with the increase in pulse on time initially, but after a certain value of pulse on time, it increases. Despite ultrasonic assistance, some of the melt material resolidifies on the workpiece due to lower discharge energy initially, which leads to decrease in MRR. However, after a certain value of pulse on time, increase in the discharge energy conducted into the machining gap within a single discharge causes the MRR to increase. 37
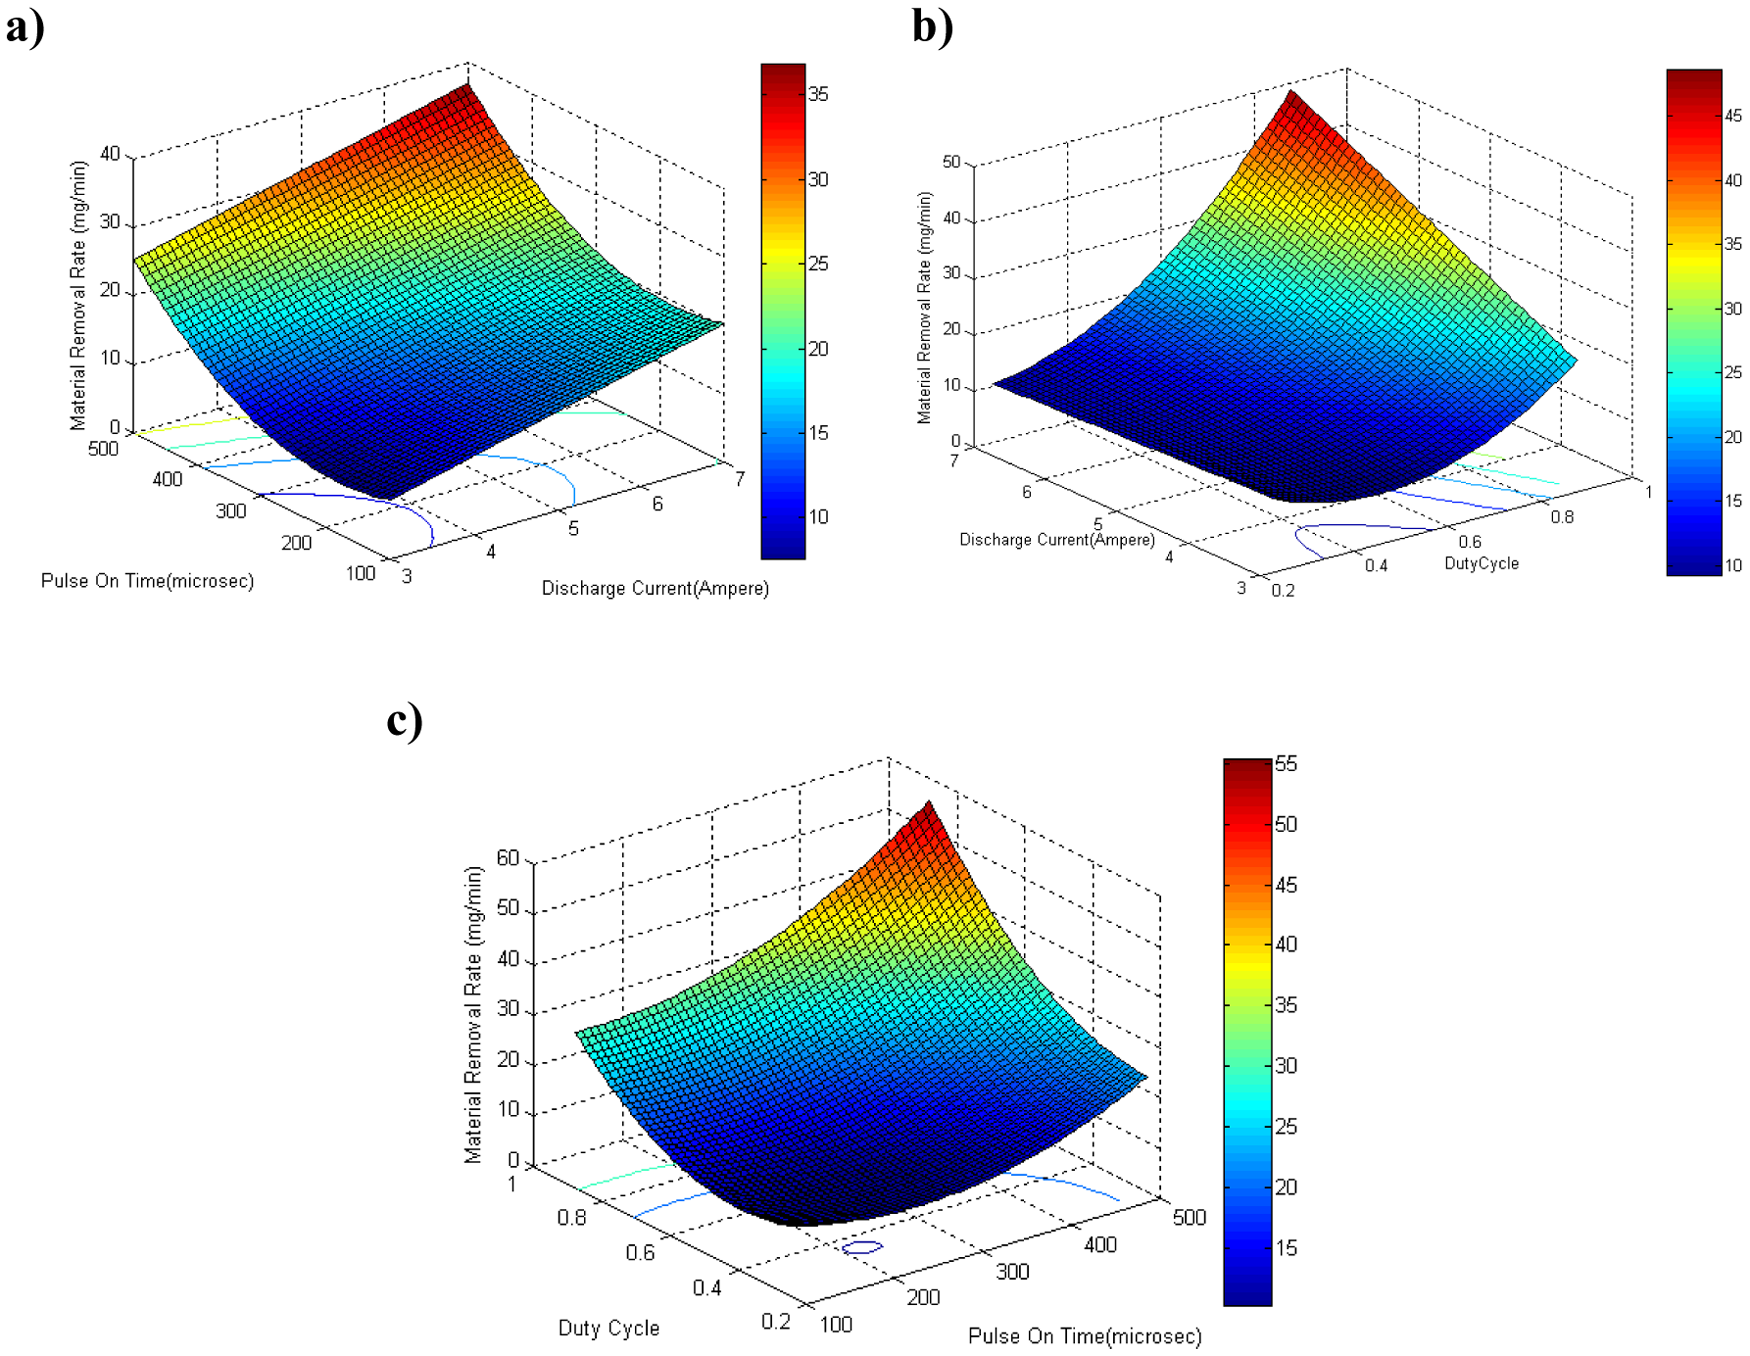
Response surfaces for material removal rate for (a) discharge current (b) duty cycle (c) pulse on time
SR
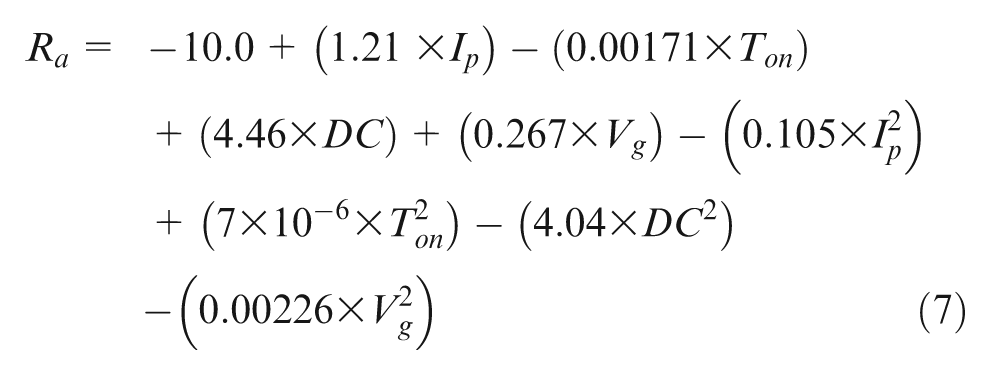
A model for the SR was obtained by analyzing the data presented in Figure 5(c) and is given as equation (7) after eliminating all the insignificant parameters
<>
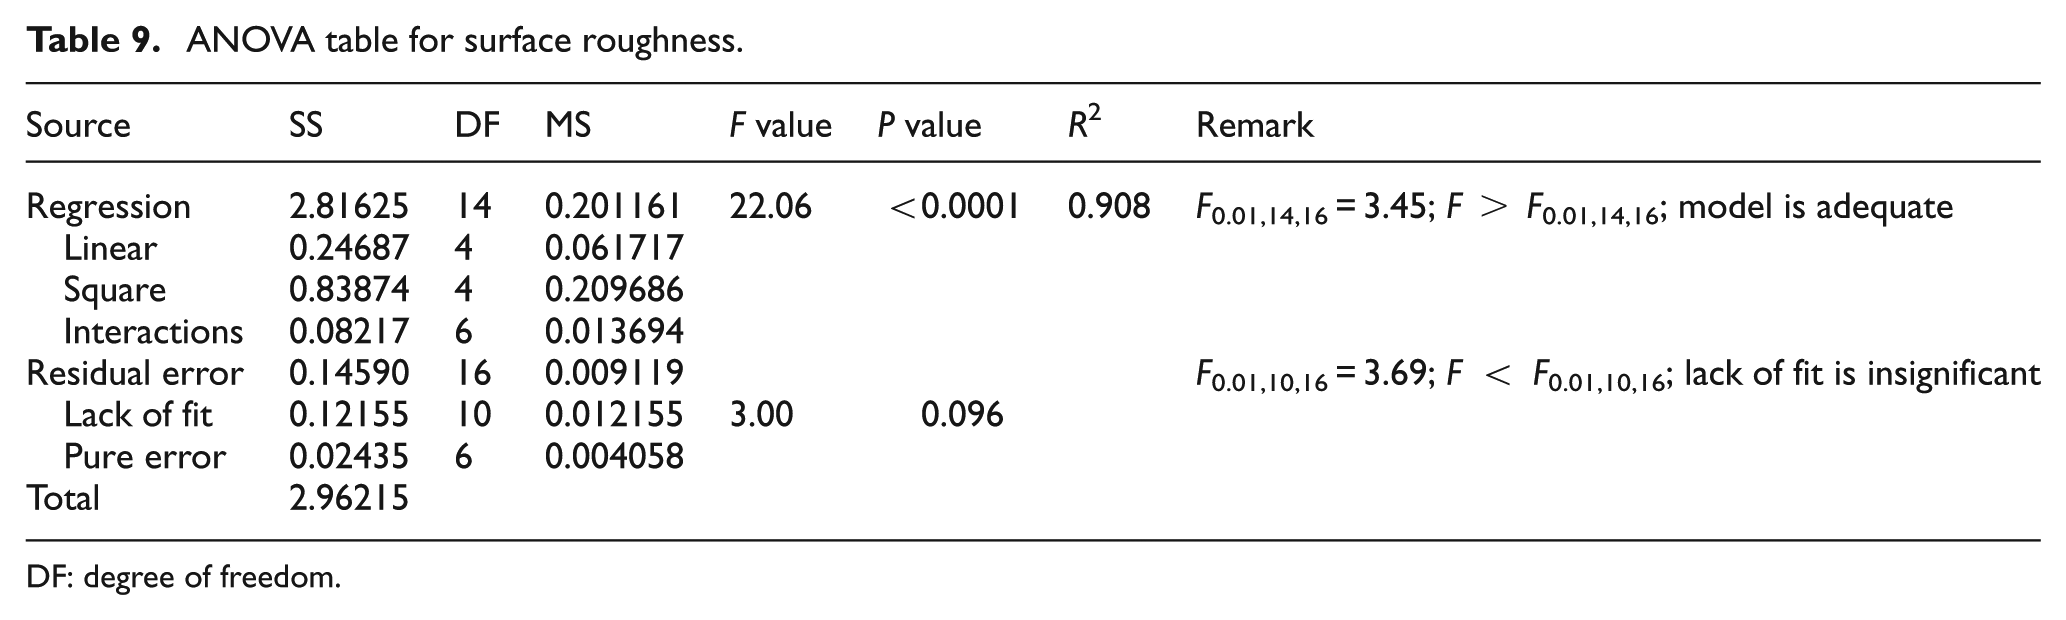
ANOVA has been used to check the adequacy of the developed model. The F ratio of the predictive model was calculated and compared with the standard tabulated value of the F ratio for a specific confidence interval. The ANOVA for the second-order model described by equation (7) has been presented in Table 9. Percentage contributions for each term of the model are shown in Figure 12. This figure shows that discharge current and pulse on time are the most influential parameters affecting SR. Figure 13 displays the main effect plots for EWR. An increase in discharge current results in increase in the SR. An increase in pulse on time increases the SR. It can be seen from Figures 12 and 13 that duty cycle and gap voltage do not influence the SR.
ANOVA table for surface roughness.
DF: degree of freedom.
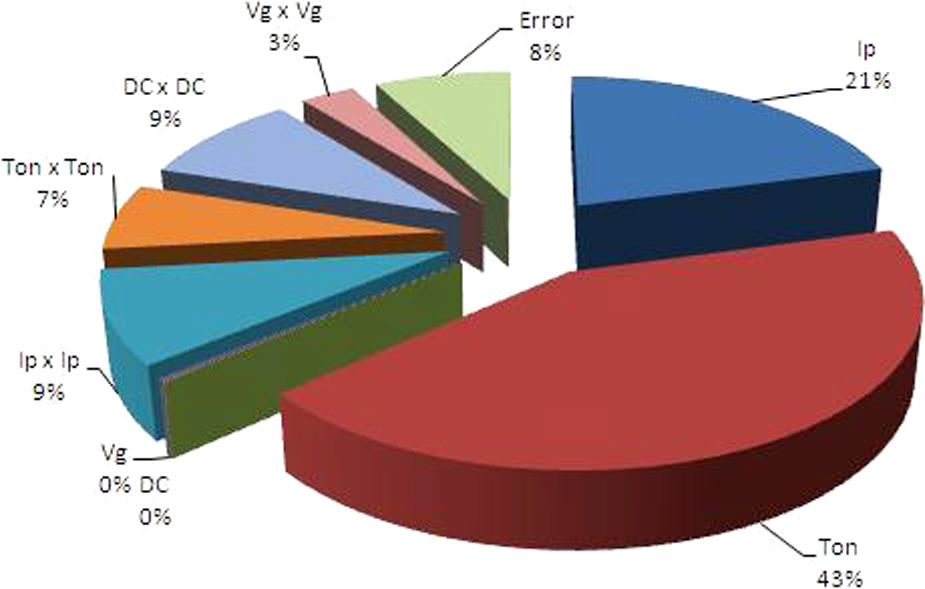
Percentage contribution of the factors on the surface roughness.
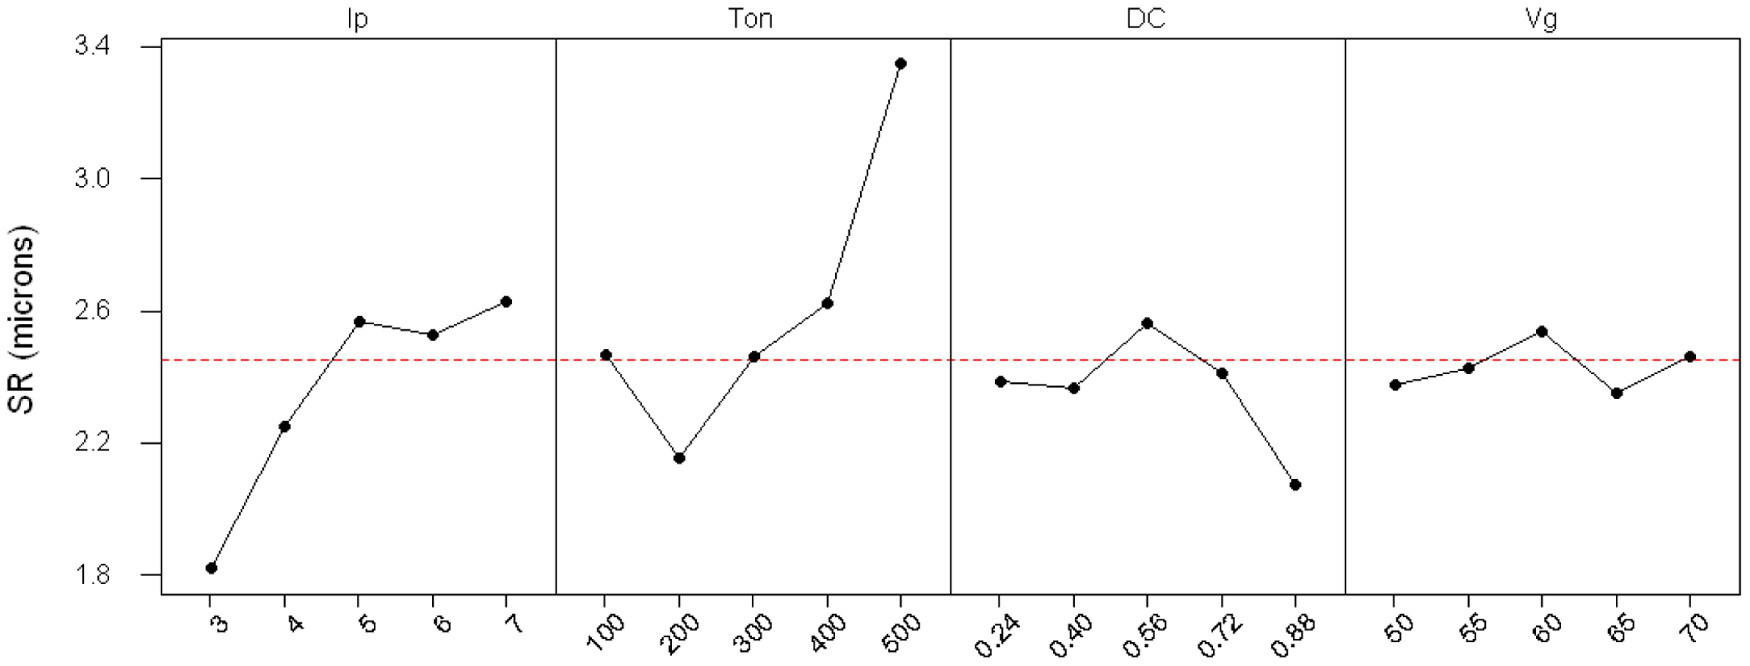
Main effect plots for SR.
Figure 14 shows the relationships between the discharge current and SR at various pulse on time. The surface plot reveals that SR increases with discharge current. As the discharge current increases, the discharge energy density and the impulsive force increase and result in the formation of deeper and larger discharge craters, which in turn increases SR. It can be further observed that increase in pulse on time increases the SR. This is due to the expansion of plasma channel with an increase in pulse on time, which reduces both energy density and the impulsive force. 38 Despite ultrasonic pumping, the melted debris cannot be removed completely due to reduction in impulsive force, and it forms a recast layer to degrade the SR.
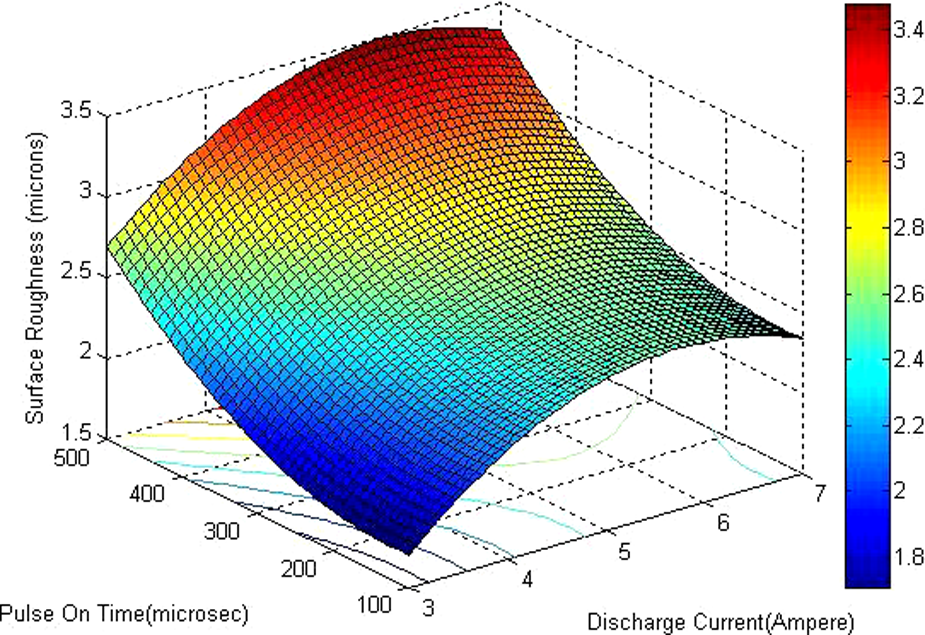
Response surface for surface roughness.
Precision of the models and process optimization
Due to the experimental error, the estimated parameters and hence the estimated responses are subjected to uncertainty. The precision of responses were estimated by calculating confidence interval. The confidence interval for the predicted response is
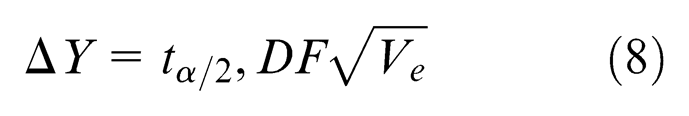
Here, Y denotes the responses, namely, EWR, MRR and SR; t is the value of the horizontal coordinate on t-distribution corresponding to specified degree of freedom (DF); α is the level of confidence interval and V
e
is the variance of error of the predicted response. The value of α is taken as 0.01. The values of
Confirmation experiments.
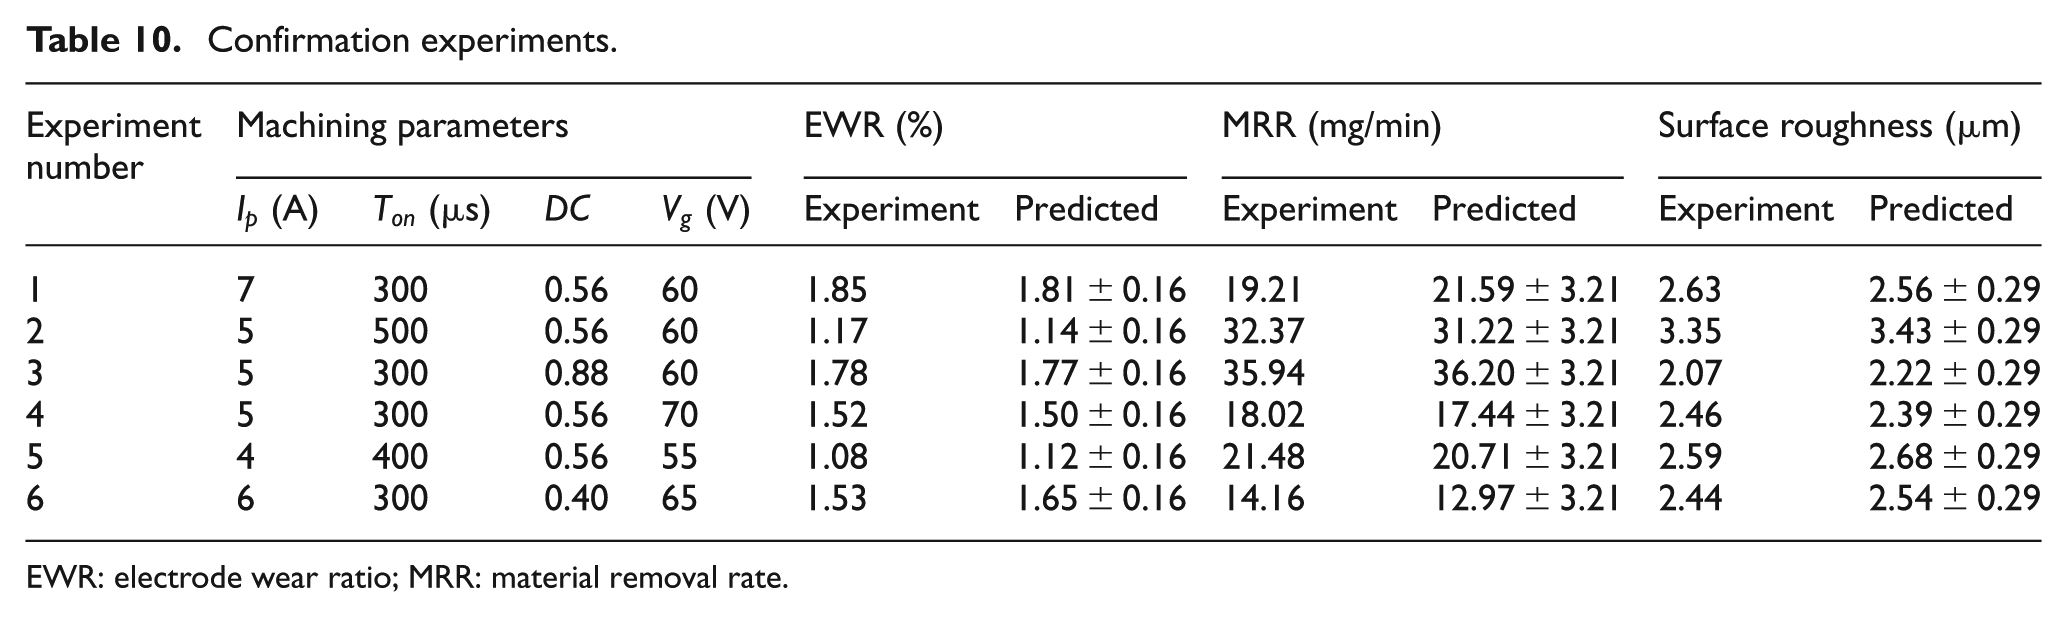
EWR: electrode wear ratio; MRR: material removal rate.
Optimization of machining parameters increases the utility of EDM experiments with cryogenically cooled electrode to a great extent. In this context, an effort has been made to estimate the optimum machining cutting conditions to obtain minimum electrode wear and maximum MRR and to produce the best possible SQ within the constraints. Trust-region method for nonlinear minimization was used to find the optimum levels of the parameters. Optimization tool box of MATLAB 7.0 was used for carrying out the optimization. A standard function of MATLAB 7.0, namely, fmincon, that can handle a large-scale optimization problem with nonlinear equality, as well as inequality constraint, is used for the purpose. The optimum set of parameters is given in Table 11.
Optimum process parameters.
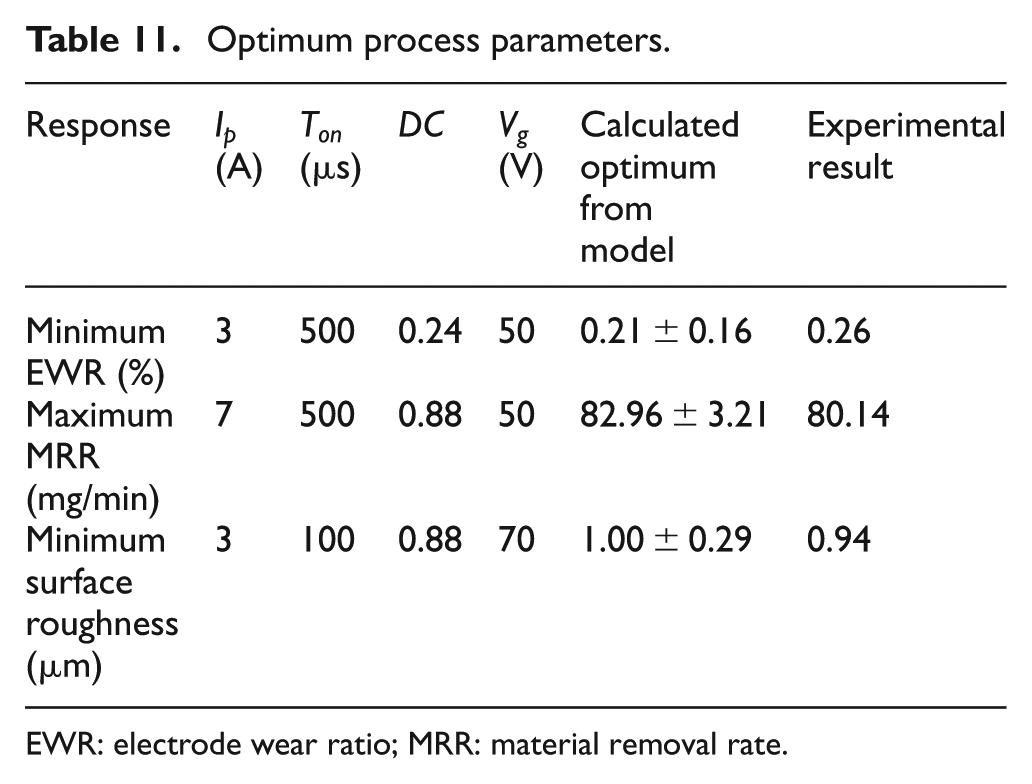
EWR: electrode wear ratio; MRR: material removal rate.
Comparison of conventional EDM process and UACEDM process
Figure 15 shows the comparison of EWR for conventional EDM process and UACEDM process. EWR is lower in UACEDM process as compared to conventional EDM process for the same set of parameters. Due to the ultrasonic action, there is hammering, impacting and cavitation, so the released carbon decomposed from the dielectric does not easily get attached to the surface of the electrode; however, the cooling effect of liquid nitrogen improves thermal conductivity of the electrode materials thereby minimizing heat trapped in the electrode. 26 As a result, melting and vaporization of electrode material minimizes and, thus, wear rate of electrode is reduced. The mean error in EWR measurement is ±5%. It was observed that in UACEDM process, EWR reduced up to 15% (experiment 19) maximum as compared to conventional EDM.
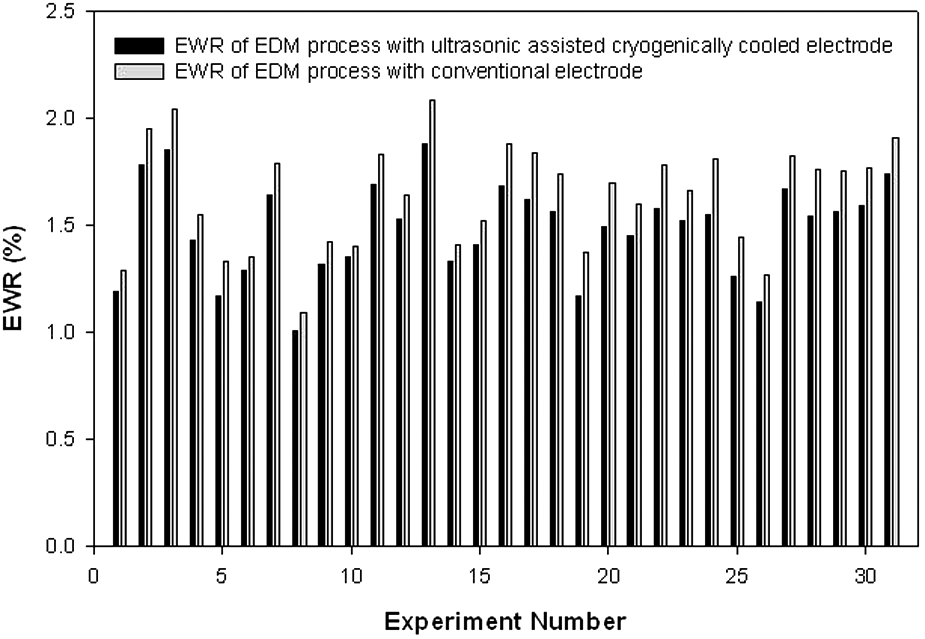
Comparison of EWR for conventional EDM process and UACEDM process.
The comparison of MRR for both conventional EDM process and UACEDM process is shown in Figure 16. It was observed that the MRR is almost same in UACEDM process as compared to conventional EDM process for the same set of process parameter. Although there has been a reduction in the effective heat transferred to the workpiece in ionized zone on application of the cryogenic fluid, but with the ultrasonic vibration of the tool, the spark gap is varied very rapidly. A high-frequency alternate pressure variation is generated. During the decreasing phase of the gap, the pressure is increased and the growth in the diameter of the plasma channel is slowed, while during the increasing phase of the gap, a large pressure drop occurs and an increase in material evaporation arises owing to a decrease in the evaporation temperature. 14 This gives a better ejection of the molten materials, and less molten material is recast onto the surface of the workpiece, resulting in an increase in MRR. The error in predicting the MRR is ±1%.
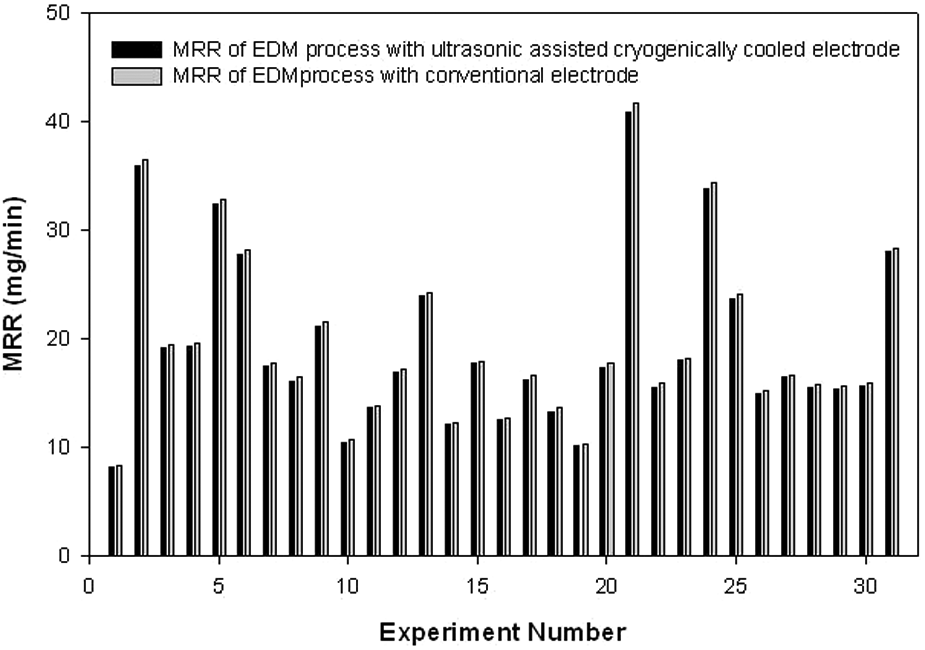
Comparison of MRR for conventional EDM process and UACEDM process.
The comparison of SR for conventional EDM process and UACEDM process has been shown in Figure 17. It is clearly evident that the specimen machined using conventional EDM process has higher value of SR as compared with the specimen machined using UACEDM process. This may be due to cryogenic cooling as the application of liquid nitrogen has resulted in greater occurrence of recast layer formation that might have filled the microcracks and holes, resulting in smoother surface of the workpiece. Furthermore, the intermittent vibrating motion of the tool acts as a pump that creates more turbulence and allows less liquid material recast on the machined surface. The mean error in experimental SR measurement is ±8%. It was observed that in UACEDM process, SR reduced up to 23% (experiment 16) maximum as compared to conventional EDM.
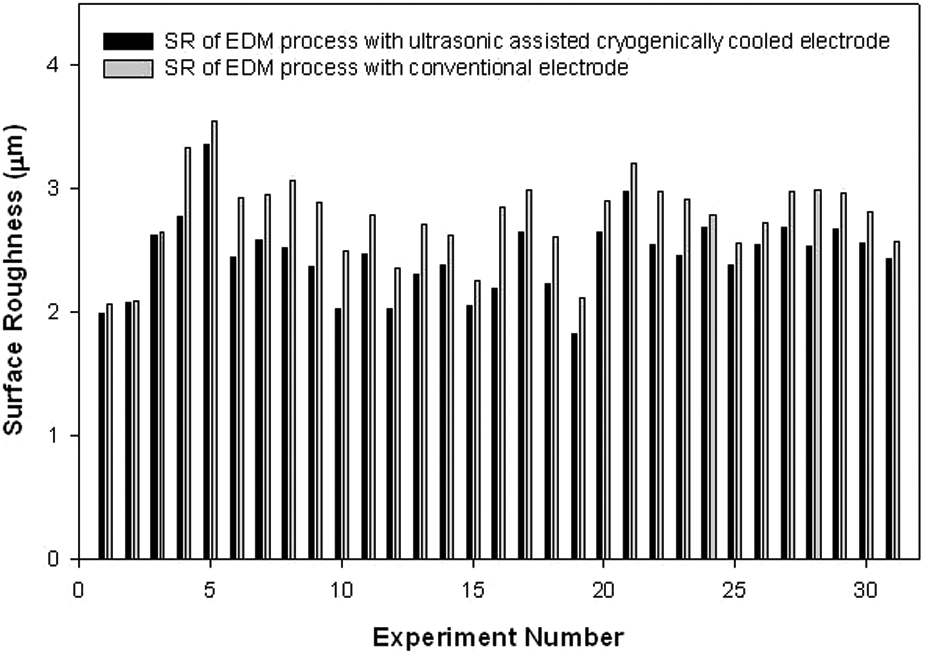
Comparison of SR for conventional EDM process and UACEDM process.
From the evidences presented above, it has been established that EWR and SR reduces in UACEDM process, and MRR is almost at par with conventional EDM process.
Conclusions
In this work, UACEDM process has been successfully performed on M2-grade HSS workpiece material. Statistical models have been developed for predicting MRR, EWR and SR in UACEDM process by correlating the input parameters, namely, discharge current, pulse on time, duty cycle and gap voltage.
In UACEDM process, significant parameters have been identified and ANOVA was used to establish the adequacy of the model. The experimental results revealed that discharge current, pulse on time and duty cycle significantly affect the MRR and EWR, while discharge current and pulse on time affect the SR. The individual influences of all process parameters on the MRR, EWR and SR were analyzed based on the developed mathematical models.
Confirmation experiments were conducted at various test conditions to show that the developed models for UACEDM process can predict MRR, EWR and SR values accurately within 99% confidence interval. Optimal process parameters have been identified for minimum EWR, maximum MRR and minimum SR.
In comparison with conventional EDM process, the EWR and SR were significantly lower in UACEDM process, and MRR was at par with that of conventional EDM.
Footnotes
Funding
This study was financially supported by Department of Science & Technology (DST), New Delhi, India.