
Abstract
Offering participants in mobile app studies personalized feedback on the data they report seems an obvious thing to do: Participants might expect an app to provide feedback given their experiences with commercial apps, feedback might motivate more people to participate in the study, and participants might be more motivated to provide accurate data so that the feedback is more useful to them. However, personalized feedback might lead participants to change the behavior that is being measured with the app, is costly to implement, and also constrains other design decisions for the data collection. In this article, we report on an experimental study that tested the effects of providing personalized feedback in a 1-month mobile app–based spending study. Based on the app paradata and responses to a debrief survey, it seems that participants reacted positively to the feedback. The feedback did not have the potential negative effect of altering the spending participants reported in the app. However, the feedback also did not have the intended effect of increasing initial participation or ongoing adherence to the study protocol.
This article is part of the SSCR special issue on “Using Mobile Apps and Sensors in Surveys,” guest edited by Bella Struminskaya (Utrecht University), Jan-Karem Höhne (University of Mannheim), Florian Keusch (University of Mannheim), and Peter Lugtig (Utrecht University).
Mobile apps installed on smartphones and tablets are increasingly used for data collection in the social sciences. They may be used to increase the level of detail or accuracy of existing questionnaire-based methods, for example, by implementing ecological momentary assessment (Moskowitz & Young, 2006), or to capture data passively, such as geolocation, physical movements, and online behavior (Harari et al., 2016; Link et al., 2014).
Mobile app studies fielded in the general population, however, have generally reported low participation rates. For example, the Understanding Society Innovation Panel in Great Britain asked panel members to download an app to take pictures of shopping receipts and reported that 13% installed and used the app at least once (Jäckle, Burton, Couper, & Lessof, 2019). Similarly, the IAB-SMART app study that was carried out as part of the Labour Market and Social Security panel in Germany and captured a range of passively collected data through smartphone sensors achieved a participation rate of 16% (Kreuter et al., 2018). Two app studies conducted as part of the Longitudinal Internet Studies for the Social Sciences panel in the Netherlands, the Smartphone Time Use study collecting time use and experience sampling data and the Mobile Mobility study collecting data from the user’s geolocation and movements, also achieved participation rates of only 19% and 22% (Scherpenzeel, 2017). For each of these app studies, sample members were recruited from existing longitudinal panels that had been interviewed previously and are likely to have developed some level of commitment to the study sponsor. App studies fielded on new cross-sectional samples are therefore likely to yield even lower participation rates.
Previous studies identified various barriers that may prevent sample members from participating in mobile app studies (Jäckle, Burton, Couper, & Lessof, 2019; Wenz et al., 2019). Sample members might not have access to a mobile device that is compatible with the research app. Even if they do, they might lack the confidence to use it for the requested data collection task or might have privacy concerns about the data being collected. And of course, some sample members might just not be willing or interested in participating in mobile app studies. To date, researchers have tested various methods to address such barriers, increase coverage and participation rates, and reduce biases in mobile app studies. These measures include equipping sample members who do not have a compatible device with a smartphone (Scherpenzeel, 2017), experimenting with different levels of monetary incentives for app download and study participation (Haas et al., 2018; Jäckle, Burton, Couper, & Lessof, 2019), and experimenting with how sample members are invited to the app study (Jäckle, Wenz, et al., 2019).
This article evaluates the effectiveness of a novel approach to incentivizing sample members to participate in a mobile app study by providing personalized feedback on each sample member’s reported spending, similar to what budgeting apps provide. The first purpose of the feedback is to raise interest in the study and motivate sample members to start using the app. According to social exchange and benefit–cost theories (Dillman, 1978, 2000; Keusch, 2015; Singer, 2011), individuals decide whether to participate in a survey by weighing the costs and benefits of study participation. In this respect, we expect the feedback to serve as additional benefit that respondents can receive from their study participation: They gain information about their personal spending, which may be of interest and useful to them in their everyday life. The second purpose of the feedback is to motivate participants to accurately report their spending throughout the study period. When survey participation requires substantial effort, some participants are inclined to engage in satisficing: They provide satisfactory rather than accurate responses which would have required more effort (Krosnick, 1991). Individuals who are motivated to participate in the study are more likely to respond accurately, and the feedback intends to increase and maintain this respondent motivation throughout the study.
While personalized feedback is commonly used in medical and health interventions, either for ethical reasons or to induce behavior change (DiClemente et al., 2001), it is less common in survey research. If surveys do provide feedback, it is mainly done in the form of aggregated rather than personalized feedback, that is, the feedback is based on results from the overall sample rather than on individual responses. Some longitudinal panel surveys, for example, provide study results or selected publications to sample members to increase engagement with the study and maintain willingness to participate in future waves (Blom et al., 2015; Laurie et al., 1999; Scherpenzeel & Toepoel, 2014; Wagner et al., 2007). Experimental studies testing the effectiveness of such aggregated feedback suggest that providing study results does not increase participation rates (Göritz & Luthe, 2013; Scherpenzeel & Toepoel, 2014) and can even have negative effects (Batinic & Moser, 2005). The few studies evaluating the effectiveness of personalized feedback mostly report positive although modest effects on response rates. For example, Marcus et al. (2007) find that offering personalized feedback on survey results increases response rates in a web survey by 7 percentage points, for respondents who find the survey topic less salient. Bälter et al. (2011) and Bälter et al. (2005) report similar positive effects of personalized feedback on response rates in web surveys, although Angelovska and Mavrikiou (2013) find no effects. Finally, Kühne and Kroh (2018) examine the effect of personalized feedback provided in a web survey on survey satisfaction and undesired response behavior, such as socially desirable responding or item nonresponse. They report that the feedback increases satisfaction with the survey but is not effective in reducing undesired response behavior. They do not test the effect of personalized feedback on response rates.
In this article, we use experimental data from a 1-month spending diary implemented with a mobile app to examine the following research questions:
Data and Methods
Study Design
The data for this study were collected on the Lightspeed UK online access panel from July 3, 2018 to January 10, 2019. Panelists are recruited in various ways, including the use of banners and pop-ups on websites where individuals can sign up to the panel. A stratified sample of panelists (stratified by age, gender, and region) were sent an invitation to a baseline survey that collected information on financial behavior, mobile device access and usage, and sociodemographics. At the end of the survey, panelists were invited to download a spending diary app on their smartphone and to use it to report all their spending for 31 days. They were instructed how to find the app in the Google Play Store and Apple App Store and were given login details alongside a logo of the app. Panelists who did not download the app were invited to use a browser-based version of the spending diary, which replicated the design and functionality of the app. This version was offered as an alternative way of participating in case sample members were not able or did not want to download an app on their smartphone. For more information about how participants used the app versus the browser-based version of the spending diary, please see Jäckle, Wenz et al. (2019). At the end of the study, all panelists invited to the spending study were sent a debrief survey about their experience with the study, with different questions for app users, online diary users, and nonparticipants. Panelists could earn a maximum of 500 points, equivalent to £5, which they could exchange for vouchers or charity donations. Participation in the study was voluntary, and participants were able to withdraw at any time. The study was approved by the University of Essex Ethics Committee that examined the survey process and how the data are dealt with once they have been collected.
The app was programmed by Kantar Public UK using the survey app platform QMob (https://www.qmobme.com/) and was available for iOS and Android. The design of the app was based on qualitative interviews that examined how the app could best support participants in recalling and accurately reporting their spending (Suffield et al., 2018). The app and online diary had two main sections: In the first section, participants were asked to report their daily purchases by entering the total amount and category for each purchase or by reporting that they had not made any purchases that day. In the second section, participants were asked to enter all direct debit and standing order payments that would come out of their bank accounts within 31 days. For more information about the study, including screenshots of the app and the online diary, see Jäckle, Burton, Wenz, et al. (2019) and Jäckle, Burton, Wenz, and Read (2019).
Experimental Design
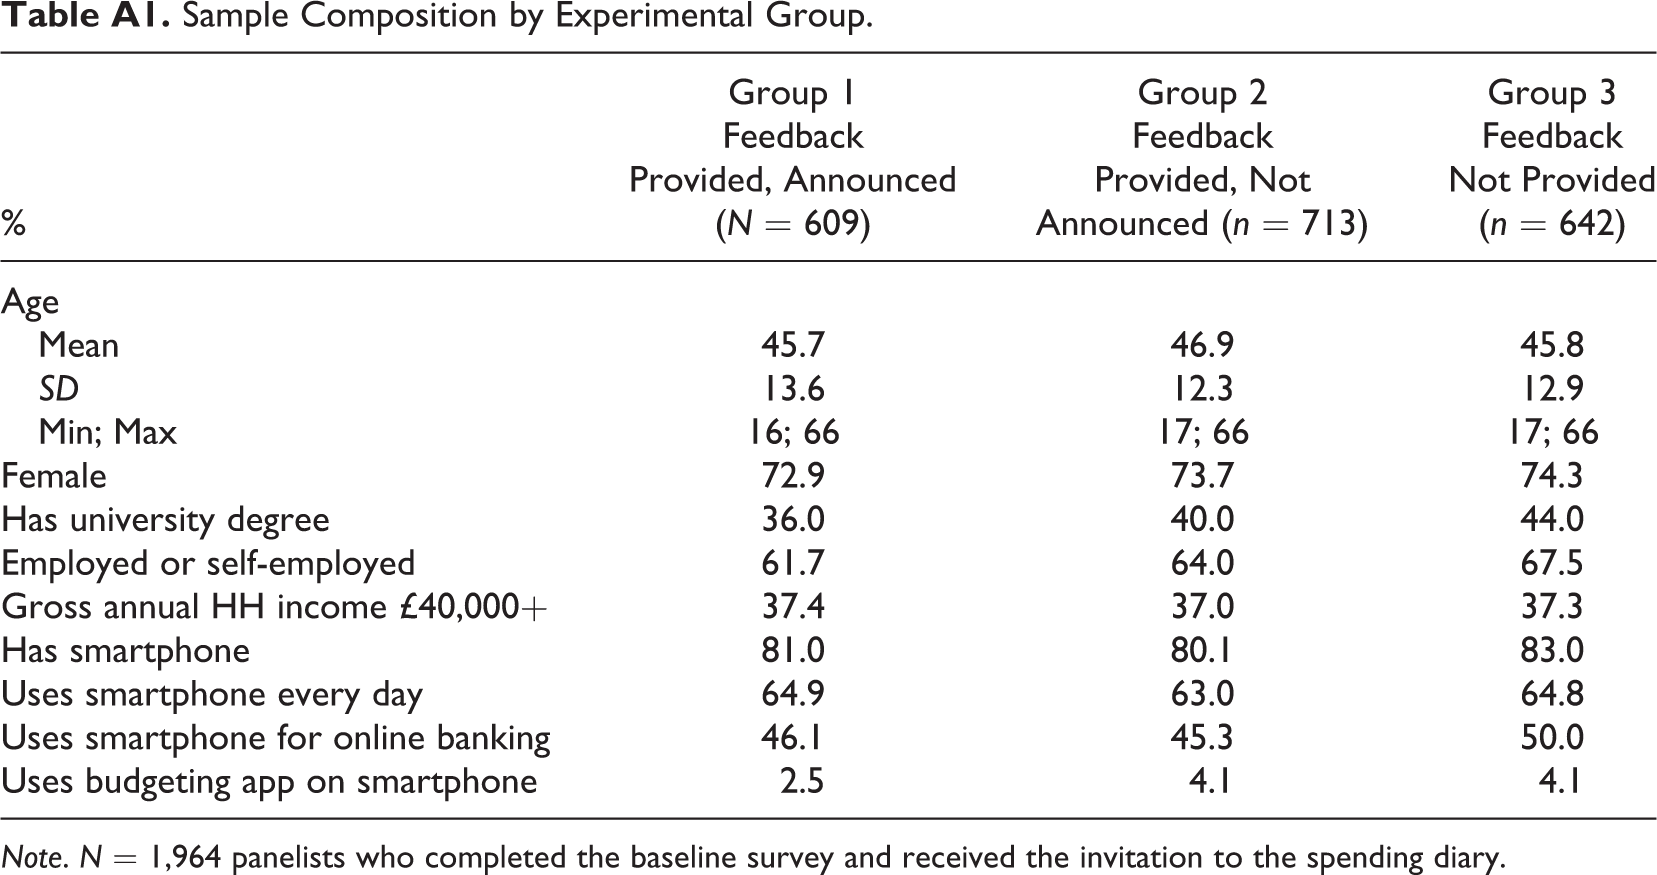
A sample of Lightspeed panelists were randomized to the three treatment groups. N = 1,964 panelists completed the baseline survey and received the invitation to the spending diary. 1 Differential response to the baseline survey between the three groups resulted in different number of subjects per group. But this is orthogonal to the experimental treatments as subjects were unaware of the treatments at the time of completing the baseline survey. For Group 1, feedback on reported spending was provided and announced in the study invitation (n = 609); for Group 2, feedback was provided but not announced in the study invitation (n = 713); and for Group 3, no feedback was provided (n = 642). Group 2 was included in case announcing feedback altered the composition of the participant sample since any effects of feedback on outcomes other than initial participation would then be confounded with differences in sample composition. However, testing for differences between participants in the three groups using χ2 and t tests suggested that the groups were balanced in terms of age, gender, employment status, income, smartphone ownership and usage, and financial behavior (whether they keep a budget) but slightly imbalanced in terms of education, p < .05. Since the sample compositions were not much affected by the feedback treatments, we combine some of the groups in the analyses below: We test the effect of announcing feedback on participation rates (RQ 1) by comparing Groups 1 versus 2 + 3 and the effect of providing feedback on ongoing adherence (RQ 2), perceived burden (RQ 4), and reported spending (RQ 5) by comparing Groups 1 + 2 versus 3.
The study invitation for Group 1 contained an additional paragraph printed in bold that informed participants that they would receive information on how much they spend (Figure 1A). This promise of feedback was repeated for those panelists in Group 1 who did not download the app when they were invited to use the browser-based version of the spending diary instead of the app. The personalized feedback shown to Groups 1 + 2 was provided to participants within the app and the online diary: They were able to view an additional section labeled “View summary” (Figure 1B) that displayed a cumulative summary of their reported spending, in total and by category (Figure 1C). While Group 2 was not told about the feedback upfront, we carefully designed the app such that the feedback could be easily found and accessed, by placing a visually prominent “View summary” button on the landing page. The app and the online diary recalculated the summary every time the participant entered a new purchase. To evaluate how the feedback was used by participants, we collected paradata about the number of times participants clicked on the feedback screen and how much time they spent viewing it.
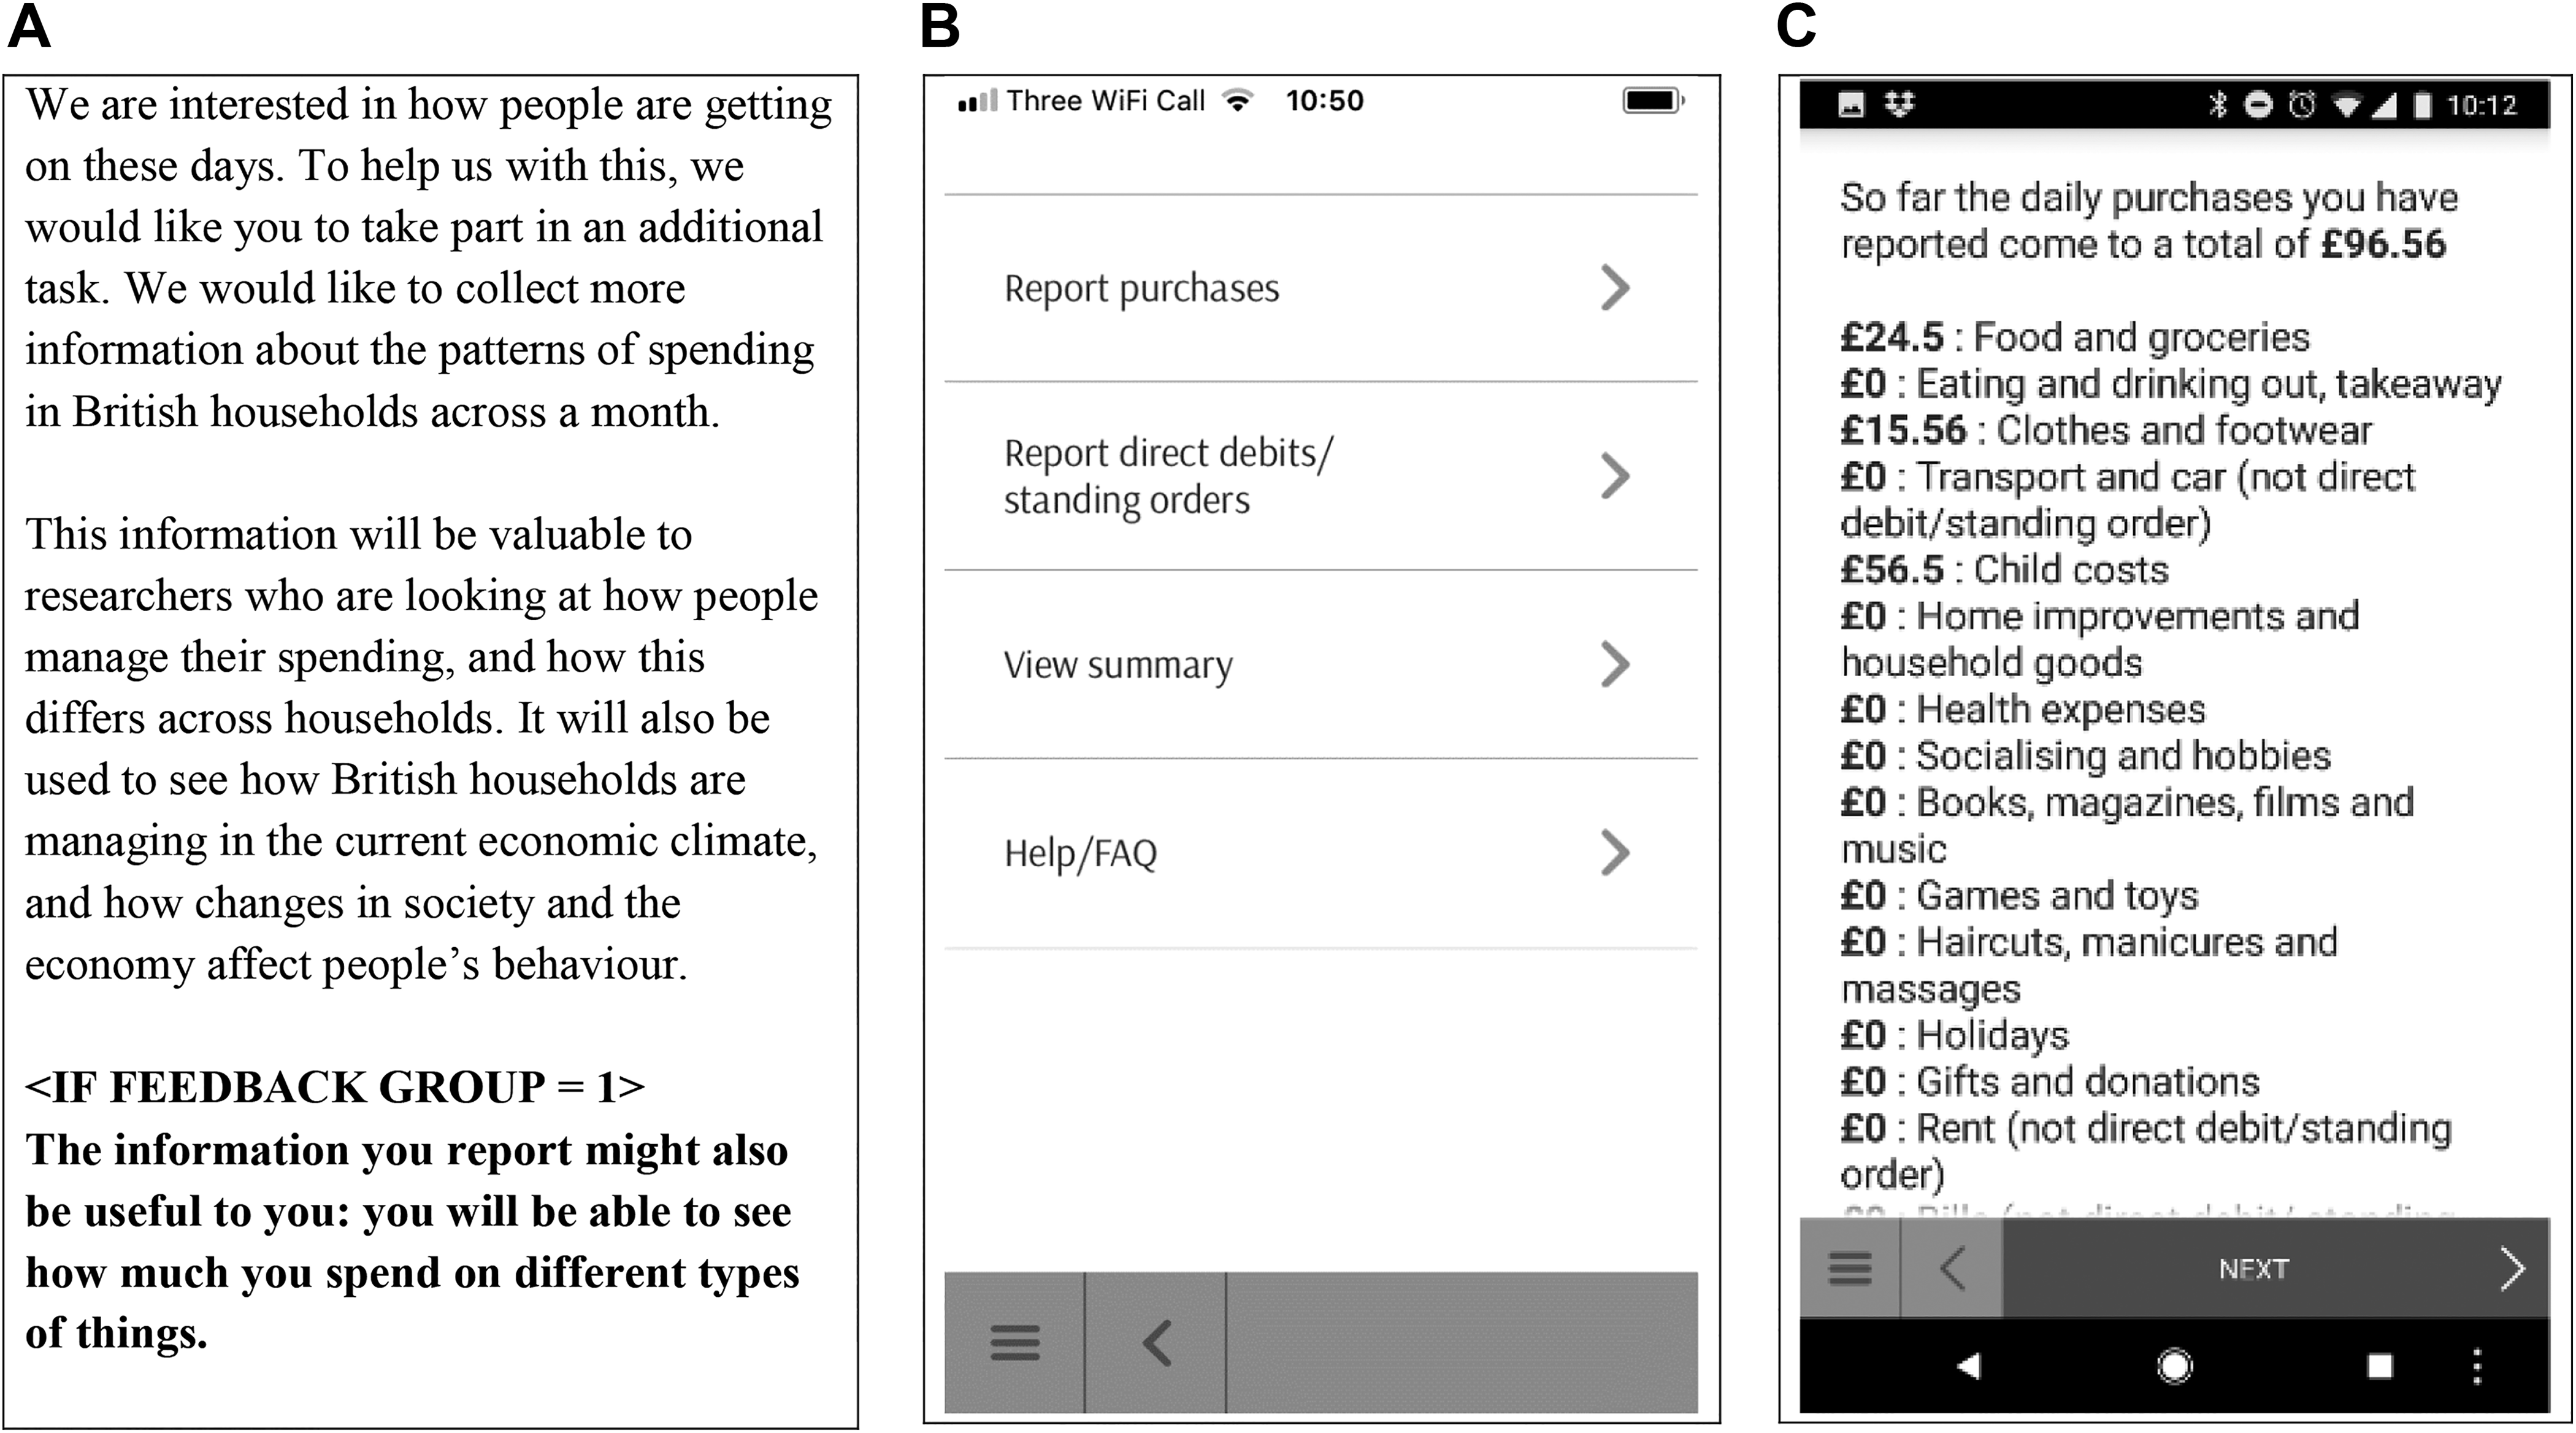
Study invitation and app screenshots. (A) Study invitation. (B) Landing page. (C) Feedback screen.
Sample
The panelists invited to the mobile app study were between 16 and 66 years old with a mean age of 46 years (SD = 13 years). Overall, 74% were female, 40% had a university degree, 65% were employed or self-employed, and 37% had a gross annual household income of £40,000 or more. With regard to smartphone ownership and usage, 81% of respondents had a smartphone, 64% used their smartphone every day, 47% used their smartphone for online banking, and 4% used a budgeting app on their smartphone. 2
Results
RQ 1: Does Offering Personalized Feedback About Reported Spending Increase Initial Participation in the Mobile App Study?
Based on the 1,964 panelists who completed the baseline survey, we first examine whether sample members who were promised personalized feedback in the study invitation (Group 1) were more likely to participate than those who were not promised feedback (Groups 2 + 3). The expectation was that the offer of personalized feedback might motivate more or different types of panelists to participate in the study.
We could not identify panelists who downloaded the app but did not use it to report any purchases. Instead, we examine the following indicators of participation: (1) whether the panelist said they successfully downloaded and logged into the app, derived from a question that followed the invitation to the mobile app study in the baseline survey; (2) whether the panelist used the app at least once to enter a valid purchase (with an amount larger than zero), derived from the app paradata; and (3) whether the panelist used the online diary at least once to enter a valid purchase, derived from the online paradata.
The results indicate that announcing personalized feedback in the study invitation did not increase initial participation in the mobile app study (Table 1). Of those promised feedback, 20.5% reported that they had successfully downloaded and logged into the app, compared to 22.0% of those not promised feedback (χ2 test, p = .464). The results are similar for actual app use: Around 14% of sample members used the app at least once throughout the study period to report a purchase, regardless of whether they were promised feedback or not. The difference between self-reported app download and actual app use was quite large, possibly due to respondents overreporting successful app download in the baseline survey. Even in the final stage, when panelists who had not downloaded the app were invited to use the browser-based spending diary instead of the app, repeating the offer of feedback had no effect on participation: An additional 21.0% of those promised feedback entered at least one purchase in the online diary (but not in the app), compared to 22.4% of those who were not promised feedback.
Participation Rates by Whether Feedback Was Announced.
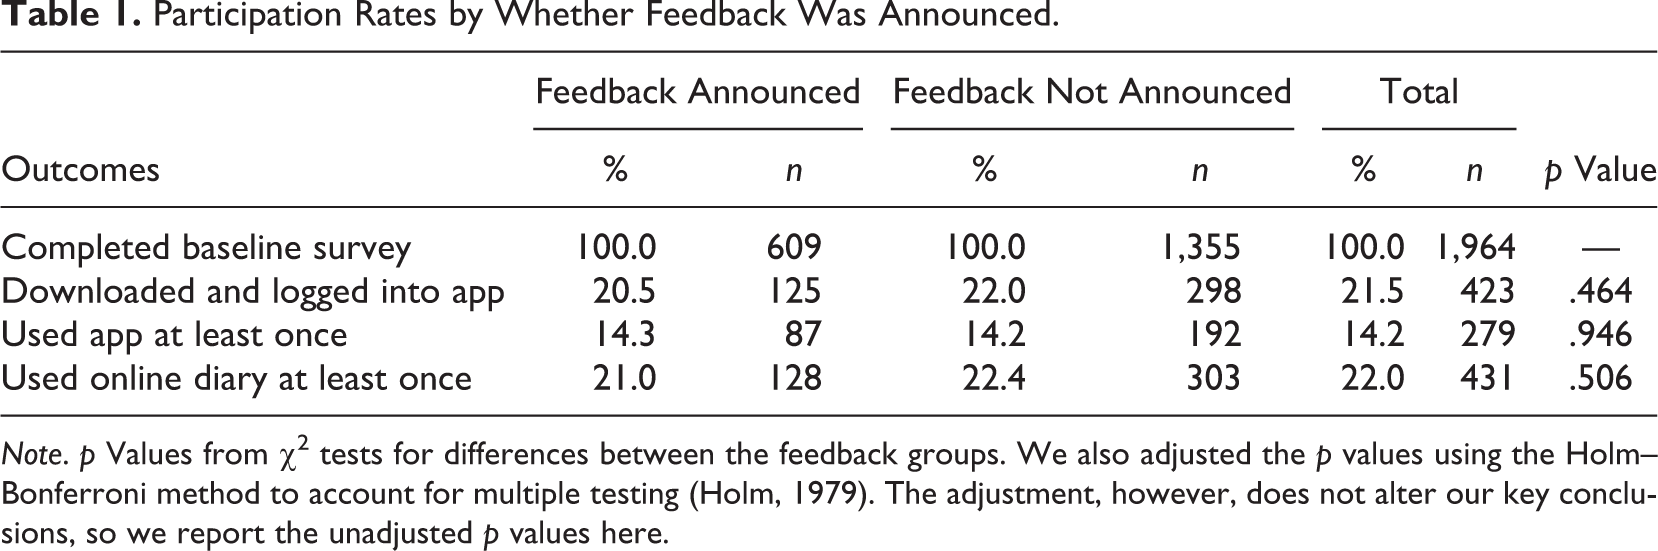
Note. p Values from χ2 tests for differences between the feedback groups. We also adjusted the p values using the Holm–Bonferroni method to account for multiple testing (Holm, 1979). The adjustment, however, does not alter our key conclusions, so we report the unadjusted p values here.
Although a substantial number of panelists used the online diary at least once to report purchases, the dropout rate was such that only 40% used the online diary for more than one day and only 10% remained in the study after 25 days. In contrast, about 80% of the mobile app users were still using the app after 25 study days (Jäckle, Wenz, et al., 2019). Since the remaining analyses focus on how participants engaged with the feedback and whether it affected their adherence to the study protocol, perceived burden, and reporting, we exclude the online diary users and instead focus on the mobile app users for RQ 2–RQ 5.
RQ 2: Does Personalized Feedback Improve Ongoing Adherence to the Study Protocol During the Month?
The study protocol asked participants to use the app for 31 days to report all their daily spending and to report the direct debits and standing orders that would come out of their accounts during this period. The expectation was that participants in the feedback groups might be more motivated to accurately report all their spending so that their personalized feedback would provide a summary that would be of use to them.
Based on the 279 participants who used the app at least once to report a purchase, we examine several indicators of adherence to protocol, all derived from the app entries and paradata: (1) the average number of days on which participants used the app, to report a valid purchase or report that they had not made any purchases that day; (2) whether they reported at least one purchase in each of the 4 weeks of the study period; (3) the average number of purchases reported; and (4) whether participants reported at least one direct debit or standing order in the app. For this analysis, we collapsed Groups 1+2, both of which received personalized feedback, and compared them to Group 3 which received no feedback.
The results suggest that providing personalized feedback in the app did not improve ongoing adherence to the study protocol (Table 2): Participants used the app on average on 18 of the 31 study days, between 66.7% and 70.2% entered at least one purchase in each of the 4 study weeks, they reported on average 29 purchases, and between 81.0% and 85.6% reported at least one standing order or direct debit. None of the differences between the treatment groups were significant.
Adherence to Protocol by Whether Feedback Was Provided.
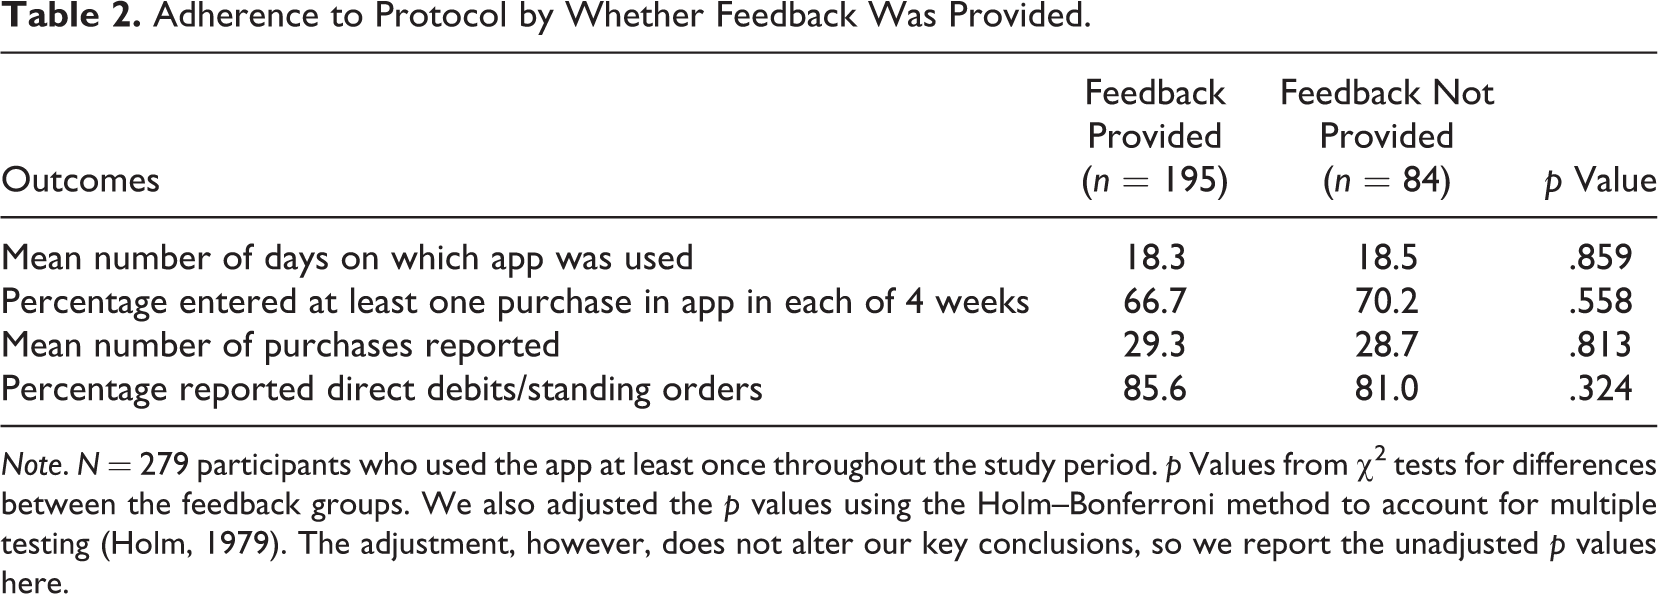
Note. N = 279 participants who used the app at least once throughout the study period. p Values from χ2 tests for differences between the feedback groups. We also adjusted the p values using the Holm–Bonferroni method to account for multiple testing (Holm, 1979). The adjustment, however, does not alter our key conclusions, so we report the unadjusted p values here.
RQ 3: Which Types of Participants Use the Personalized Feedback and How Do They Use It?
To examine whether and how extensively study participants used the personalized feedback, we focus on participants who were provided with feedback (Groups 1+2) and used the app at least once to report a purchase. The expectation was that the offer of feedback might appeal more to people who already engage in monitoring their finances or who use their smartphones more intensely, although it might also appeal to some people who would like to exert more control over their finances than they usually do.
Of the 195 app users provided with feedback, a majority (79.0%; n = 154) looked at the feedback screen at least once during the study period; almost half of those looked on the first day on which they used the app (n = 70). On average, participants who used the feedback screen at least once looked at it on 1 of 4 days (26.3%) on which they used the app. On days when they viewed the feedback, they on average clicked on the feedback once and spent 17.7 s on this screen. Across the study period, participants spent on average 2 min in total on the feedback screen.
Although announcing feedback in the study invitation did not affect participation in the study (RQ 1) or adherence to the study protocol (RQ 2), it did affect whether participants used the feedback. Those promised feedback (Group 1) were significantly more likely to look at the feedback screen (86.2%) than those who were not told about the feedback upfront (Group 2: 73.2%, χ2 test, p = .026).
In the debrief survey sent out at the end of the study, participants were asked to evaluate their experience with the study. Among the 279 participants who used the app at least once, 38.7% completed the debrief questionnaire (n = 108). Participants who were provided with feedback and used it at least once were also asked to evaluate the feedback: (1) how useful they found the summary of their spending (five response categories ranging from “very useful” to “not useful at all”), (2) how interesting they found the summary of their spending (five response categories ranging from “very interesting” to “not interesting at all”), and (3) whether the feedback helped them remember to report their spending (five response categories ranging from “a lot” to “not at all”). Among the 60 app participants who completed the debrief survey and were asked these questions, 45.0% said they found it very useful to see a summary of their spending, 46.7% said they found it very interesting, and 36.7% said the summary helped them a lot remember to report their spending.
Although 21.0% of participants never viewed the feedback screen, there were no observable differences between this group and those who did use the feedback. Testing for differences using χ2 and t tests revealed no differences in terms of financial behavior (whether they keep a budget), mobile device usage (how frequently they use a smartphone, whether they use their smartphone for online banking, type of operating system they use), or sociodemographics (age, gender, education, employment status, and income).
RQ 4: What Effect Does Personalized Feedback Have on Perceived Burden and Satisfaction With the Study?
The debrief survey also asked participants to evaluate their satisfaction with the study overall. The expectation was that participants who received personal feedback might have found participating in the study more interesting and therefore less burdensome.
Based on the 108 app participants who completed the debrief survey, we examine four outcomes, all derived from questions in the debrief survey: (1) how likely they would be to participate in such a study again (four response categories ranging from “very likely” to “very unlikely”), (2) whether they felt that the time and effort they put into the study was well spent (three response categories ranging from “very well spent” to “not very well spent”), (3) whether they found participating in the study interesting (three response categories ranging from “very interesting” to “not interesting”), and (4) how easy or difficult it was to complete the study (four response categories ranging from “very easy” to “very difficult”). For this analysis, we again collapsed the two feedback groups (Groups 1+2) and compared them to the no-feedback group (Group 3).
The results suggest that participants provided with personalized feedback were more likely to perceive the time and effort they put into the study as very well spent (59.5%) than those who were not provided with feedback (37.9%, χ2 test, p = .046; Table 3). For the other indicators, however, we found no differences: Participants in both treatment groups were equally likely to evaluate their study participation as interesting and easy and equally likely to say that they would participate in such a study again.
Perceived Burden by Whether Feedback Was Provided.
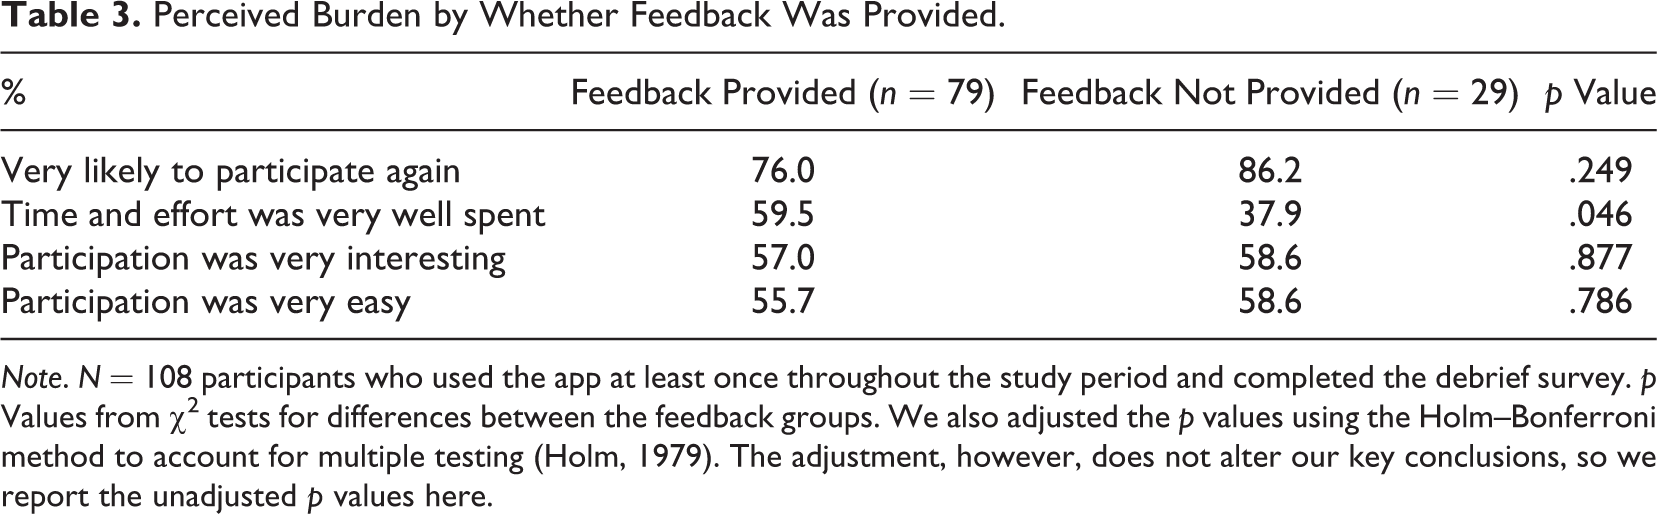
Note. N = 108 participants who used the app at least once throughout the study period and completed the debrief survey. p Values from χ2 tests for differences between the feedback groups. We also adjusted the p values using the Holm–Bonferroni method to account for multiple testing (Holm, 1979). The adjustment, however, does not alter our key conclusions, so we report the unadjusted p values here.
RQ 5: What Effect Does Personalized Feedback Have On Reported Spending?
One of the main arguments against providing personalized feedback is that it might lead participants to change their spending or reporting behavior. To test whether feedback affected reported spending among the 279 participants who used the app at least once, we summed up all spending reported in the daily purchases section of the app. Since direct debits and standing orders were not included in the feedback, they are excluded from the following analyses. We computed both total spending and category spending for each of the 13 categories that participants were able to select when entering their purchases. For this analysis, we again collapsed the feedback groups (Group 1+2) and compared them to the no-feedback group (Group 3). We calculated the median amount for total and category spending, rather than the mean, as the median is more robust against outliers. Since not all participants reported spending across all categories, we only compare participants who provided at least one valid purchase in the respective spending categories.
Overall, there were few differences in reported spending between the feedback groups (Table 4). Median total spending was not significantly different between the feedback groups (p = .796). At the category level, median spending differs between the feedback groups for only 2 of the 13 categories: For both “health expenses” and “books, magazines, films, and music,” the median spending in the no-feedback group was more than twice the median spending in the feedback group (p < .05 for both categories).
Reported Spending by Whether Feedback Was Provided.
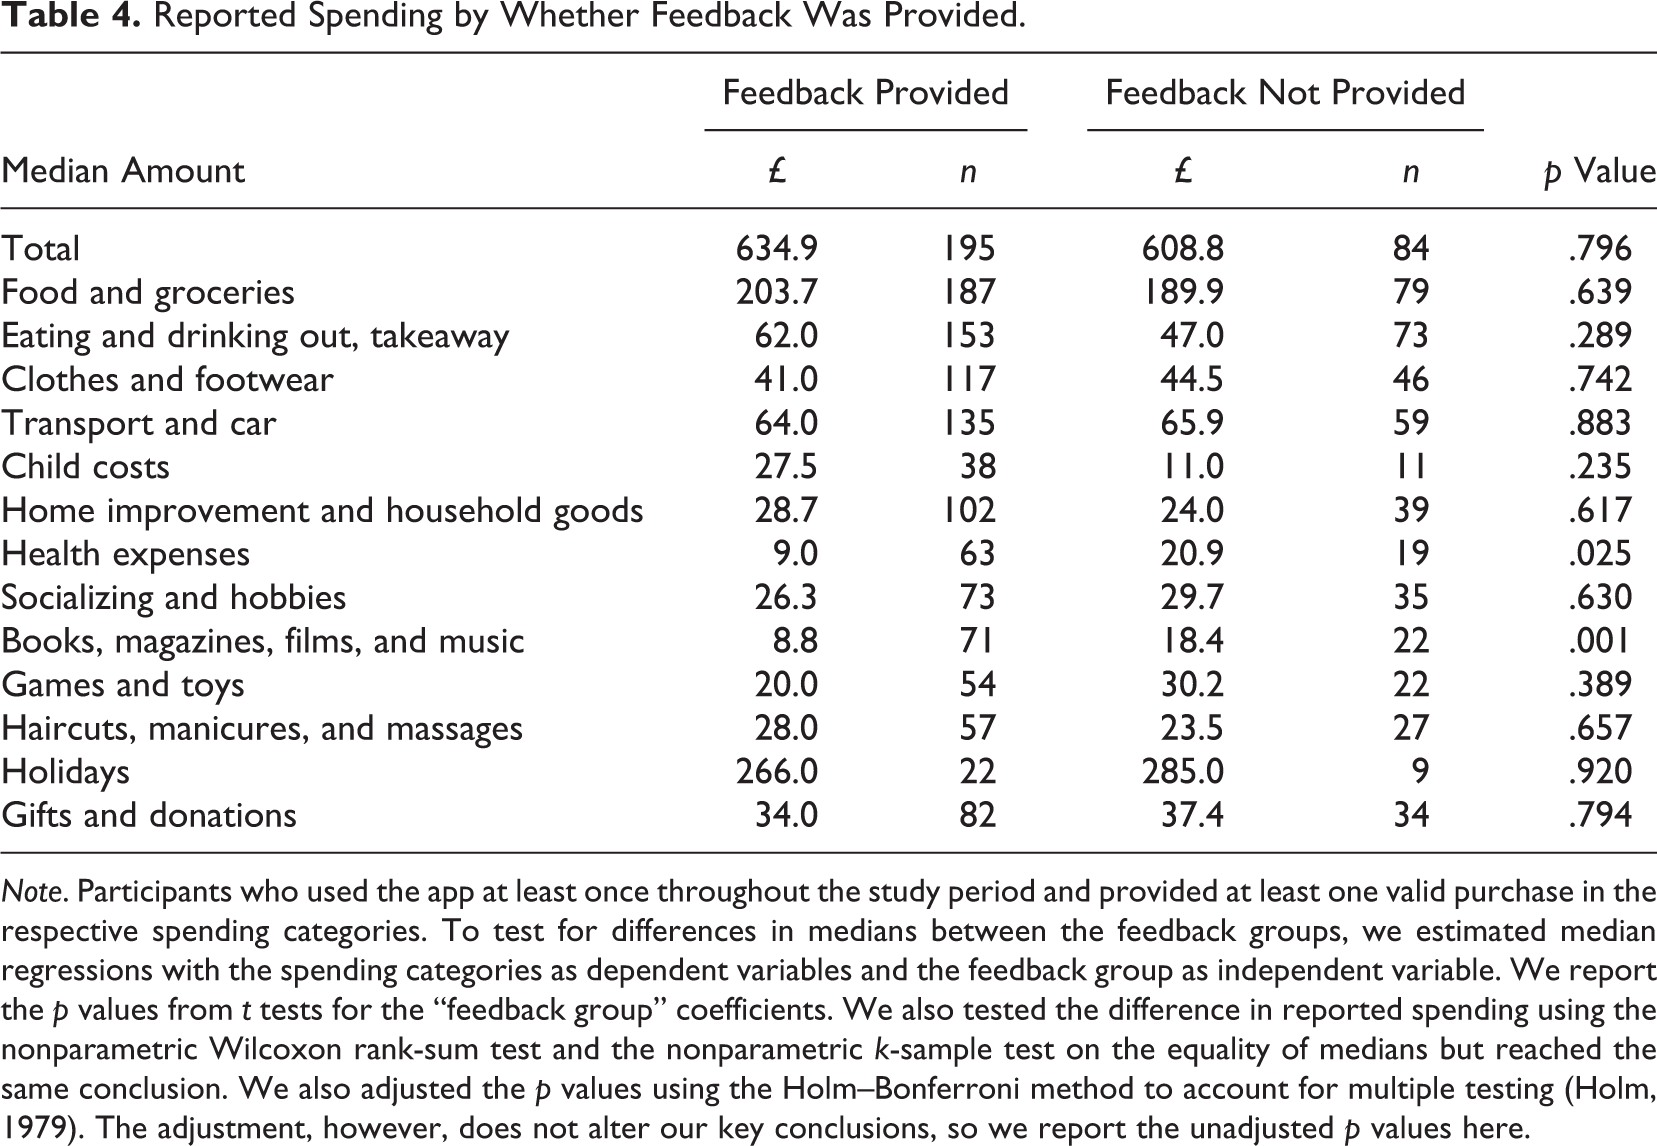
Note. Participants who used the app at least once throughout the study period and provided at least one valid purchase in the respective spending categories. To test for differences in medians between the feedback groups, we estimated median regressions with the spending categories as dependent variables and the feedback group as independent variable. We report the p values from t tests for the “feedback group” coefficients. We also tested the difference in reported spending using the nonparametric Wilcoxon rank-sum test and the nonparametric k-sample test on the equality of medians but reached the same conclusion. We also adjusted the p values using the Holm–Bonferroni method to account for multiple testing (Holm, 1979). The adjustment, however, does not alter our key conclusions, so we report the unadjusted p values here.
Arguably, the feedback can only start to affect spending behavior or reporting after a while, once the participant has used the app for long enough for the feedback to be populated with information that the participant can learn from. To check the robustness of the results in Table 4, we therefore restricted our analysis sample to participants who used the app for at least 2 weeks (n = 189). The conclusions remain the same.
In the debrief survey, we also asked participants whether they thought that participating in the study had affected their spending or reporting behavior: (1) whether participating affected how much they thought about their spending (response categories: “yes, I thought more,” “yes, I thought less,” and “no”), (2) whether they changed how much money they spent (response categories: “yes, I spent more,” “yes, I spent less,” and “no”), (3) whether they changed how often they spent money (response categories: “yes, more often,” “yes, less often,” and “no”), (4) whether they changed what kinds of things they spent money on (response categories: “yes” and “no”), and (5) whether they changed how many of their purchases they reported over the month (response categories: “yes, I reported more,” “yes, I reported fewer,” and “no”). For significance testing using χ2 tests, we pooled both “yes” responses for each of the questions due to small sample sizes.
Among the 108 app participants who completed the debrief survey, we found a significant difference by whether feedback was provided for one of the questions, whether participants changed how much money they spent, in the opposite direction to what we had expected. While around half (51.7%) of participants not provided with feedback said they changed how much money they spent as a result of participating, only around a third (30.4%) of those provided with feedback indicated so (χ2 test, p = .041). For the other questions, we did not find significant differences by feedback group.
Discussion
There are several arguments for offering respondents personalized feedback in return for participating in a mobile app study. More sample members might be willing to participate in a study if they are offered feedback in return. Participants might be more motivated to provide accurate data so that the feedback is more useful to them. And people might find it unacceptable for an app not to provide feedback, given their experience with commercial apps that do provide feedback. However, personalized feedback might alter participants’ behaviors, is costly to implement, and constrains other decisions about the design of the data collection instrument. For example, question-based data collection within the app might be supplemented with uploading of images (Jäckle, Burton, Couper, & Lessof, 2019). The data from the images, however, can only be incorporated in the feedback if they can be processed and coded in real time.
In this article, we provide novel evidence on the effects of personalized feedback in a mobile app study. We experimentally test the effects of feedback on initial participation in a mobile app spending study, ongoing adherence to the study protocols, and reported spending. According to the app paradata, most participants made use of the feedback. The positive reaction to the feedback is corroborated by self-reports in the debrief survey: Participants found the feedback useful and interesting and said that the summary helped them remember to report their spending. Those given feedback were more likely to say that the time and effort they put into the study was well spent than those not given feedback. Thankfully, the feedback did not influence participants’ spending or reporting behaviors: There were no differences between feedback groups in the spending reported in the app. However, the personalized feedback failed to increase initial study participation or ongoing adherence to the study protocols.
Our null findings warrant replication for several reasons. Our findings, in the context of a mobile app study, are in contrast to previous research that has found positive effects of feedback on participation in web surveys (Bälter et al., 2005; Bälter et al., 2011; Marcus et al., 2007). One possible reason why the feedback may not have worked in our study is that the sample comes from a nonprobability online access panel: Those invited were already committed panelists and likely more motivated than the general UK population. We also cannot rule out that other ways of providing feedback in a mobile app study might have an effect. For example, the announcement of feedback could be presented more prominently in the study invitation, by including screenshots of what the feedback would look like. The feedback screen could be formatted in a more attractive way, for example, using diagrams. Regular notifications could also be implemented to remind people of what they have spent. Participants might find the feedback more useful if they could customize the spending categories (Suffield et al., 2018). Finally, the analyses for RQ 2–RQ 5 are based on a small sample size, resulting in low statistical power. The results presented here may therefore be a conservative estimate of the effects of feedback in an app-based study. We would welcome future research that replicates the analyses on a larger sample.
Supplemental Material
Wenz_et_al_Online_Supplement - The Effects of Personalized Feedback on Participation and Reporting in Mobile App Data Collection
Wenz_et_al_Online_Supplement for The Effects of Personalized Feedback on Participation and Reporting in Mobile App Data Collection by Alexander Wenz, Annette Jäckle, Jonathan Burton and Mick P. Couper in Social Science Computer Review
Footnotes
Appendix
Sample Composition by Experimental Group.
| % | Group 1 Feedback Provided, Announced (N = 609) | Group 2 Feedback Provided, Not Announced (n = 713) | Group 3 Feedback Not Provided (n = 642) |
|---|---|---|---|
| Age | |||
| Mean | 45.7 | 46.9 | 45.8 |
| SD | 13.6 | 12.3 | 12.9 |
| Min; Max | 16; 66 | 17; 66 | 17; 66 |
| Female | 72.9 | 73.7 | 74.3 |
| Has university degree | 36.0 | 40.0 | 44.0 |
| Employed or self-employed | 61.7 | 64.0 | 67.5 |
| Gross annual HH income £40,000+ | 37.4 | 37.0 | 37.3 |
| Has smartphone | 81.0 | 80.1 | 83.0 |
| Uses smartphone every day | 64.9 | 63.0 | 64.8 |
| Uses smartphone for online banking | 46.1 | 45.3 | 50.0 |
| Uses budgeting app on smartphone | 2.5 | 4.1 | 4.1 |
Note. N = 1,964 panelists who completed the baseline survey and received the invitation to the spending diary.
Authors’ Note
The authors would like to thank Thomas F. Crossley, Paul Fisher, Carli Lessof, and Brendan Read for comments on an earlier version of this article.
Declaration of Conflicting Interests
The authors declared no potential conflicts of interest with respect to the research, authorship, and/or publication of this article.
Funding
The authors disclosed receipt of the following financial support for the research, authorship, and/or publication of this article: This work was funded by the UK Economic and Social Research Council Transformative Research scheme and the National Centre for Research Methods (grant number ES/N006534/1), as well as by an NCRM International Visitor Exchange Scheme grant funding research visits by Mick P. Couper to the University of Essex.
Software Information
All analyses were conducted in Stata Version 15. The code is available in the Online Appendix.
Supplemental Material
Supplemental material for this article is available online.
Notes
References
Supplementary Material
Please find the following supplemental material available below.
For Open Access articles published under a Creative Commons License, all supplemental material carries the same license as the article it is associated with.
For non-Open Access articles published, all supplemental material carries a non-exclusive license, and permission requests for re-use of supplemental material or any part of supplemental material shall be sent directly to the copyright owner as specified in the copyright notice associated with the article.