
Abstract
As smartphones become increasingly prevalent, social scientists are recognizing the ubiquitous data generated by the sensors built into these devices as an innovative data source. Passively collected data from sensors that measure geolocation or movement provide an unobtrusive way to observe participants in everyday situations and are free from reactivity biases. Information on day-to-day geolocation could provide valuable insights into human behavior that cannot be collected via surveys. However, little is known about the quality of the resulting data. Using data from a 2018 German population-based probability app study, this article focuses on the measurement quality of geolocation sensor data, with a strong focus on missing measurements. Geolocation sensor data are an example of an available data type that is of interest to social science research. Our findings can be applied to the wider subject of sensor data. In our article, we demonstrate (1) that sensor data are far from error-free. Instead, device-related error sources, such as the manufacturer and operating system settings, design decisions of the research app, third-party apps, and the participant, can interfere with the measurement. To disentangle the different influences, we (2) apply a multistage error model to analyze and control the error sources in the specific missingness process of geolocation data. We (3) raise awareness of error sources in geolocation measurement, such as the use of GPS falsifier apps, or device sharing among participants. By identifying the different error sources and analyzing their determinants, we recommend (4) identification strategies for future research.
As smartphones become increasingly prevalent in Western societies (Pew Research Center, 2018), social scientists are recognizing the ubiquitous data generated by the sensors built into these devices as an innovative source for behavioral and social research (Raento et al., 2009; Sugie, 2018). Passively collected data from sensors that measure geolocation or movement are hailed because they are allegedly generated “[…] without any participation or action from the subject” (Onnela & Rauch, 2016, p. 1692). The resulting data are seen as “[…] unobtrusive, naturalistic observational records that reduce the likelihood that participants will behave reactively” (Harari et al., 2017, p. 83). In particular, information on day-to-day geolocation could provide valuable insights into human behavior patterns (Kelly et al., 2013) that cannot be collected via surveys (Nitsche et al., 2012).
However, while the praise is intriguing, little is known about the overall quality of data resulting from smartphone sensors (Jäckle, Gaia, et al., 2019). We address this gap using unique data collected from German smartphone users through a research app (Kreuter et al., 2018). While some previous studies investigate potential coverage and nonresponse bias resulting from differential smartphone ownership and willingness to participate in such research studies (Antoun et al., 2018; Elevelt et al., 2019; Hargittai, 2018; Jäckle, Burton, et al., 2019; Keusch et al., 2020a, 2020b), our research is concerned with the measurement quality of smartphone sensor data. By measurement quality, we mean the absence of measurement error and a high degree of completeness of the data to be measured. Measurement error comprises any deviations of measurement from the true score, where systematic error (bias) is usually distinguished from random error (variance; Miller, 2008). While systematic error leads to biased estimates, random error leads to an increase in the variance of estimates. An assessment of this quality aspect is highly desirable. However, it requires the availability of validation data representing the true score and we can present only partial evidence on this aspect of measurement quality.
The focus of this article is on the second quality aspect, the missingness of data from units that generally participated in the study (called “item nonresponse” in the survey context). Like random measurement error, missing data lead to a loss of efficiency (i.e., an increase in the variance of estimates). If missingness does not occur completely at random, that is, missingness is uncorrelated to its unknown value and all other variables (Rubin, 1976), and the problem is not addressed by adequate methods (e.g., multiple imputations), this leads to additional bias in the estimate.
We focus on geolocation data as an example of a readily available data type that is of interest to a broad range of social science research. Geolocation sensors face technical challenges as environmental (e.g., indoor areas and densely populated urban areas), device, and user-related factors affect the measurement accuracy or the ability of a smartphone to establish geolocation (Blunck et al., 2011; Ranasinghe & Kray, 2018). However, most of these studies are technical tests based on convenience samples. By contrast, our study is based on a sample of the general German population and focuses on various processes resulting in missing data and user-introduced aspects of geolocation measurement quality in smartphone data collection for social science research. Our multistage approach provides insights into the quality of other passive measurements taken from smartphones.
At the first workshop on Mobile Apps and Sensors in Surveys, Couper (2019) called the notion that passively measured sensor data are flawless, “passive fantasy.” Aside from issues of selectivity, when inferring from a smartphone-owning participant sample, several factors can potentially influence whether measurements are recorded or valid. For example, built-in sensors from different manufacturers might differ in their measurement quality, different operating system (OS) settings affect geolocating accuracy, third-party apps stop data collection, and participants themselves affect measurements by their handling of the smartphone (e.g., handgrip and walking style; Blunck et al., 2011). However, even ignoring these issues, smartphone sensors might offer a limited perspective of human movement and physical activity. If we assume that some users do not always carry around their devices or turn them off from time to time, then immobility inferred from smartphone data might just represent a device forgotten at home or resting in a desk drawer at work, a purse, or a gym locker (see e.g., Casilari et al., 2016, p. 2).
In any given smartphone data collection of geolocation, a significant proportion of the measurements that were designed to be collected will not be successful. This missingness can be caused by intended or unintended user behavior, such as switching off the smartphone or running out of battery, by characteristics of the location (no signal), or by technical problems related to the hardware or OS of the smartphone (e.g., energy-saving modes).
To disentangle this plethora of factors interfering with data quality, we propose a multistage model of geolocation missingness. The proposed model includes general preconditions for data collection (i.e., device being turned on and allowing data collection) and processes specific to geolocation measurement that lead to valid geocoordinates in the context of a study. Each stage of the model is dependent on success in the previous stage, thus allowing us to rule out more general explanations for missingness and to focus on the occurrence of missing data and the duration of gaps in measurement at the current stage. We use data from the IAB-SMART study in Germany (Kreuter et al., 2018) and focus on four groups of explanatory variables: participant characteristics, device hardware, device state, and temporal and spatial context of the measurement.
A Stage Model of the Missingness of Mobile Geolocation Data
To disentangle the plethora of factors that can interfere with the successful measurement of geolocation on smartphones, we develop a multistage model that—on the first stage—analyzes general missingness processes unspecific to the type of data collected and works its way down to error sources specific to geolocation data.
By distinguishing the different processes, we can model the occurrence, defined as the identification of geolocation measurement gaps, and the extent, defined as the length of each identified gap in terms of the number of missing geolocation measurements, in each stage separately to avoid confounding effects of the previous stage. The separate modeling of gap occurrence and extent allows for factors to have differential effects on either. With this novel approach, we can systematically learn about the importance of different factors responsible for errors in each stage, which is a prerequisite for strategies to address these missing processes. Figure 1 illustrates the different stages of our multistage model and their effect on geolocation missingness.
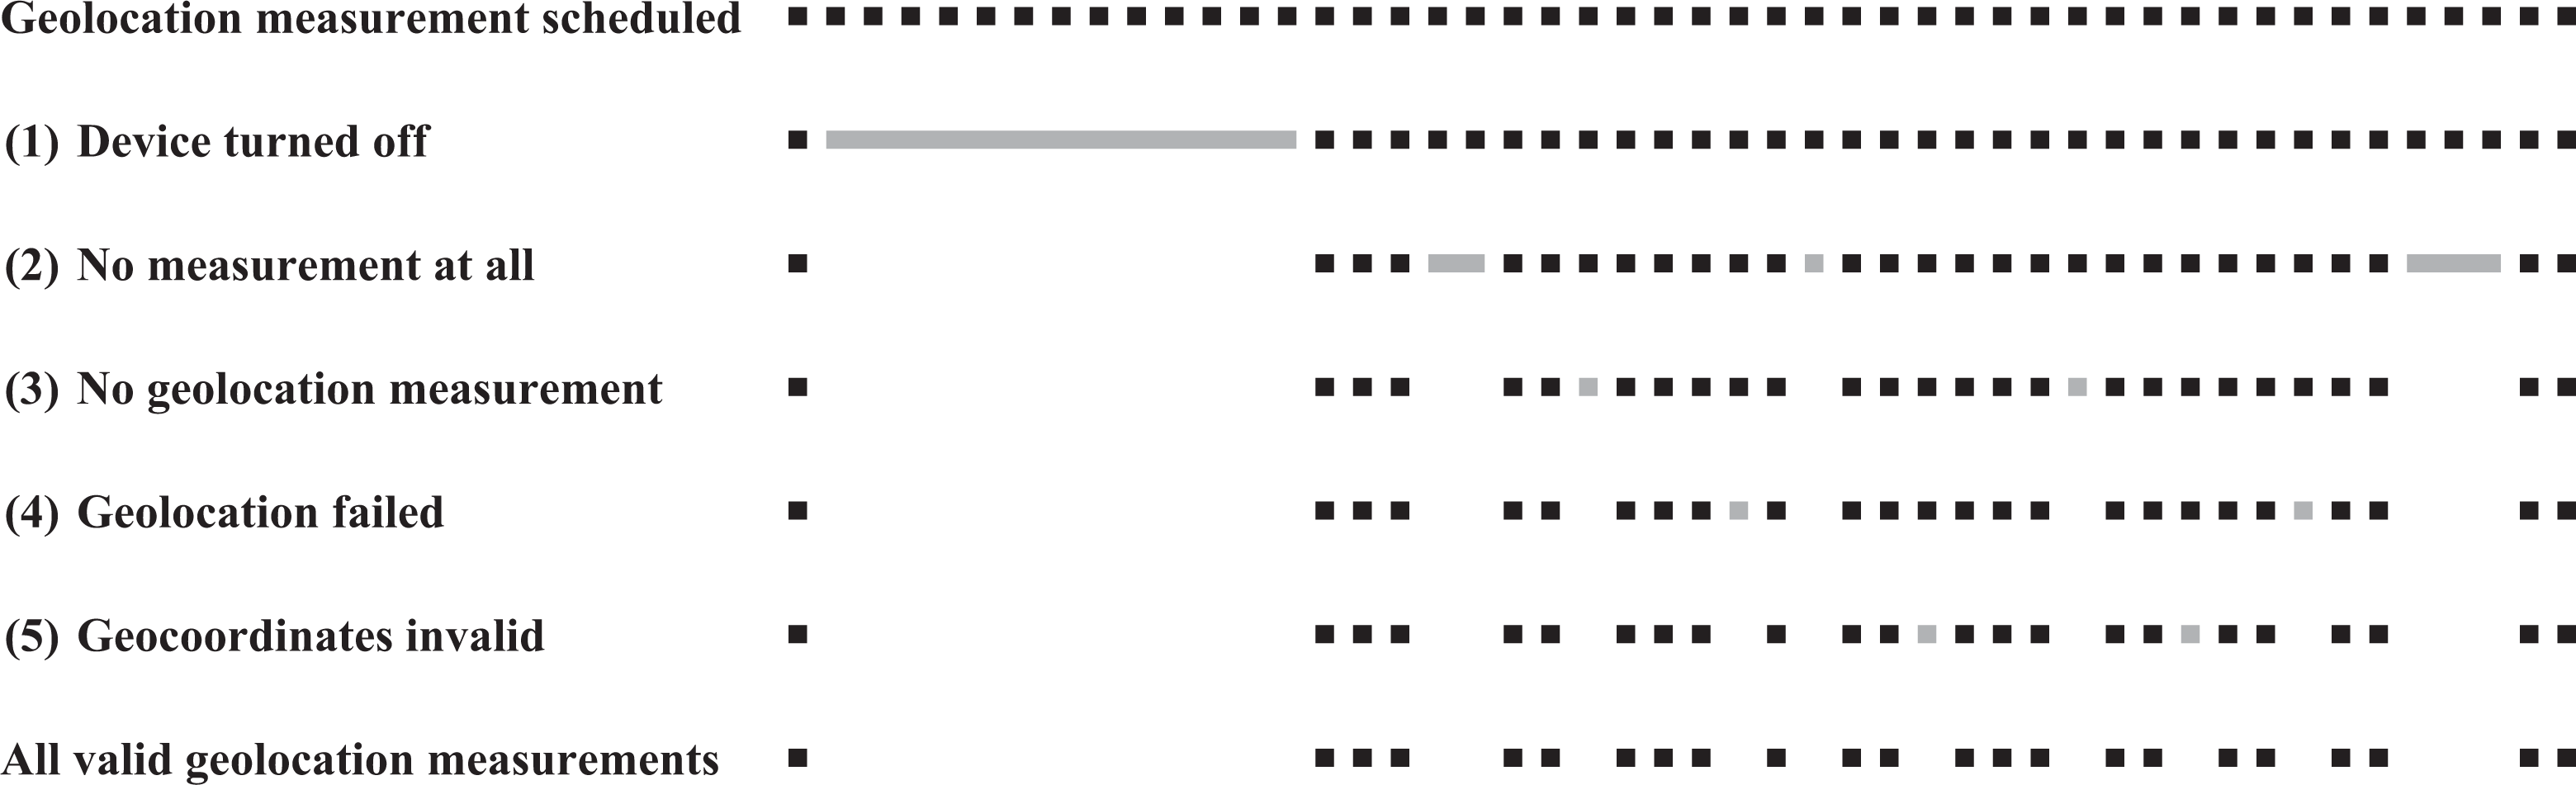
A five-stage model of smartphone geolocation data missingness. Note. This figure shows the missingness process. Episodes where the device was turned off (1) will generate missing geolocation data, as do episodes where the research app could not collect any measurements at all (2). For the remaining time, there are episodes where no geolocation measurements were collected (3) despite an otherwise active research app. Even for the times where a measurement was collected, there are several cases, where our attempt at geolocation was unsuccessful (4), leading to missing geocoordinates. Finally, some collected geolocations are invalid (5). In the context of our study, this includes cases of faked geolocations, shared devices, or the use of multiple concurrent devices.
The first four stages deal with the missingness of geolocation measurements we obtain, and the results are applicable to all research using geolocation smartphone data. In contrast, Stage 5 focuses on the measurement error of geolocation measurements once the data are collected. While addressing error at these stages is vital, it is to some extent dependent on the individual research aims.
In the first and most general stage, we analyze whether the device is turned on (1) at the scheduled time of a geolocation measurement. If a participant regularly turns off the device, this systematically affects our measurement and inference. Different reasons have been identified for turning off a smartphone: being in quiet locations such as at a university lecture (Ugur & Koc, 2015), at night (Chen et al., 2013), coping with overuse and its related problems (Lee et al., 2014), or consciously disengaging from work (MacCormick et al., 2012). Device downtime could also have technical reasons, most prominently when running out of battery. How fast smartphones run out of battery power and are subsequently turned off depends on factors such as the brand, model, and OS of the device (Kongsiriwattana & Gardner-Stephen, 2016; Zhang et al., 2013); the charging patterns of users (Ferreira et al., 2011), how intensively people use their smartphones (Oliver, 2010); what features and sensors of a smartphone are used (Hosio et al., 2016; Metri et al., 2012); and external factors such as outside temperature (Peltonen et al., 2016).
In the second stage, we check whether our app could collect any measurements at all (2) from the turned-on device. Energy-saving modes, restrictive permission management by the OS, or even third-party task killer apps could prevent an app from collecting data at the time of a scheduled geolocation measurement.
Missingness in the first two stages can also be due to participants temporarily uninstalling our research app. Approximately 12.5% of participants in our study installed the app more than once, so this is a nonnegligible factor driving data missingness in these stages. We control for this factor in our models. For participants who permanently uninstall our app, our analyses use their data only up to the point the app is uninstalled.
In the third stage, we focus on missing geolocation measurement (3) given that the device is turned on and the app is actively collecting data. Technical reasons for failed measurement include a low battery level and the availability and strength of GPS, Wi-Fi, and mobile network signals. An additional reason for measurement failure at this stage could be that users may manually disable location tracking in the general smartphone settings.
One could think that the existence of a geolocation measurement is a sufficient condition for substantive analyses. In fact, the existence of a measurement simply means that the app attempted to establish the geographic location of the device at the scheduled time; however, geolocation can fail (4), that is, although a measurement was initiated, a geolocation with no information is recorded. This differs from the third stage, where we miss a geolocation measurement, in that the measurement itself exists, but geographic coordinates are missing. A failure in recording the actual location means none of the built-in methods, GPS, mobile carrier network, Google’s built-in Fused Location Provider application programming interface (API) that uses Wi-Fi information, or the cell tower location database could successfully establish geolocation. The main reason for failing to establish geolocation is indoor location(s), where reception depends on the number of walls, the wall material, and the closeness of surrounding buildings (Blunck et al., 2011; Kjærgaard et al., 2010). Also, the device type and OS version determine the quality of the built-in sensors, the computational resources, and the underlying algorithms (Ranasinghe & Kray, 2018, p. 10). User-related factors such as mobility or the placement of the smartphone on the body (Blunck et al., 2011) can also influence the quality of geolocation measurement.
A scheduled measurement that includes actual coordinates might still be invalid (5) for subsequent substantive analyses. For example, sharing devices with others or passing on study invitation codes to other household members makes the mapping of data to the corresponding targeted participant impossible. Also, geolocation is a sensitive data type that could encourage participants to falsify their geolocation using third-party apps.
Data and Methods
We analyze the determinants of each of the five stages, using data from the IAB-SMART study (Kreuter et al., 2018). The following section provides background on the study, details about our variables of interest and the explanatory variables, and finally describes the analytical models.
The IAB-SMART Study
In January 2018, we invited 4,293 participants of the long-standing German panel study “Labour Market and Social Security” (PASS; Trappmann et al., 2019) to install the IAB-SMART app on their smartphones for 6 months. All invited participants had stated in PASS Wave 11 (2017) that they owned a smartphone with Android Version 4.0 or higher.
To ensure European Union General Data Protection Regulation–compliant sensor data collection, the IAB-SMART app requested consent to five different data collection functions: (1) location and network connectivity data, (2) call and text message logs, (3) phonebook characteristics, (4) activity sensor data, and (5) app usage data. By default, each function was deactivated. Participants needed to provide individual consent for each function and could withdraw consent and stop sensor data collection at any point in time using the app. In addition, we regularly administered in-app surveys during the study period from January to August 2018. Overall, 625 (14.6%) invited sample members downloaded the IAB-SMART app from the app store, went through the installation process, completed the short welcome survey in the app, and could be verified as eligible PASS Wave 11 participants (“verified installers”).
As this article is concerned with missing information in geolocation data collection, we focus on the first function of the IAB-SMART app, location and network connectivity data. If active, the function attempted to collect geolocation information using a two-step sampling process. First, to preserve the battery, our app checked whether geolocation already was available in the Android system. This was the case if the system or third-party apps recently had acquired geolocation. This geolocation could be established via GPS, the mobile carrier network, or Wi-Fi via Google’s built-in Fused Location Provider API. Only if no current location was available did our app try geolocation using GPS, the mobile carrier network, or a database of known cell tower locations proprietary to our app developer to establish at least a coarse location as a last resort. This second step did not make use of Wi-Fi information because the app developer custom-built this app feature according to one of their default templates, which—for compatibility reasons—only relies on native Android functions.
Each method achieves a different geolocation accuracy: GPS has the highest accuracy (median accuracy: 11 m), followed by the mobile carrier network (median accuracy: 21 m), Wi-Fi (median accuracy: 36 m), and the cell tower database (median accuracy: 967 m). These results are in line with those reported in earlier studies (e.g., Zandbergen, 2009). Except for GPS, the accuracy of geolocations from all methods varies considerably due to outliers with high uncertainty.
For each measurement, the app either recorded available locations or attempted to record the location with the highest accuracy of GPS, carrier network, or the cell tower database. From Table 1, we see that in more than half of all measurements, the carrier network was chosen because this technique offers reasonably precise geolocation without the device having to sync its location with multiple satellites. GPS, as the energetically most demanding option, was the third most frequent mode chosen, followed by Wi-Fi. Even though the cell tower database was used about 15% of the time as a last resort, no geolocation could be established in about 18% of all geolocation measurements. These shares of the different location providers are certainly the result of our two-step method. While locations based on GPS and the carrier network could be collected in both steps, locations based on Wi-Fi were only recorded if they were already available in the Android system. The developer’s cell tower database is an additional source for geolocations in the second step and has certainly provided geolocation in cases where GPS or the carrier network would not have helped.
Measurement Accuracy by Geolocation Source.
We implemented a 30-min sampling rate to address privacy issues and balance our data needs with battery consumption. Overall, 578 individuals were willing to share their geolocation (“network and location participants”). To identify gaps in the collection of data, we used every available data source collected during the IAB-SMART study (see below). For our analysis sample, we end up with 88,941,180 measurements from 499 participants, of which 1,031,165 are geolocation measurements. Table A1 in the Appendix displays the selection process of participants from participants of the PASS study to our analysis sample. Coverage and nonresponse analyses are beyond the scope of this article but are reported in the studies of Keusch et al. (2020a, 2020b).
Table 1 shows that even for the times when a measurement was collected, in several cases, geolocation failed (4) leading to missing geocoordinates. This could be a result of our two-step sampling process, where our app relied on GPS or carrier network but not Wi-Fi-information to establish geolocation. Finally, some collected geocoordinates are invalid (5). In the context of our study, this includes cases of faked geolocations, shared devices, and—depending on the research question and population—measurements outside of Germany. In our analyses, we separate each missingness process and analyze the occurrence and extent of each process individually, independent from the previous stages.
Variables
In the following, we list and briefly describe our variables of interest (the gaps) and the factors we hypothesized to be responsible for the occurrence and extent of the gaps (explanatory variables).
The gaps
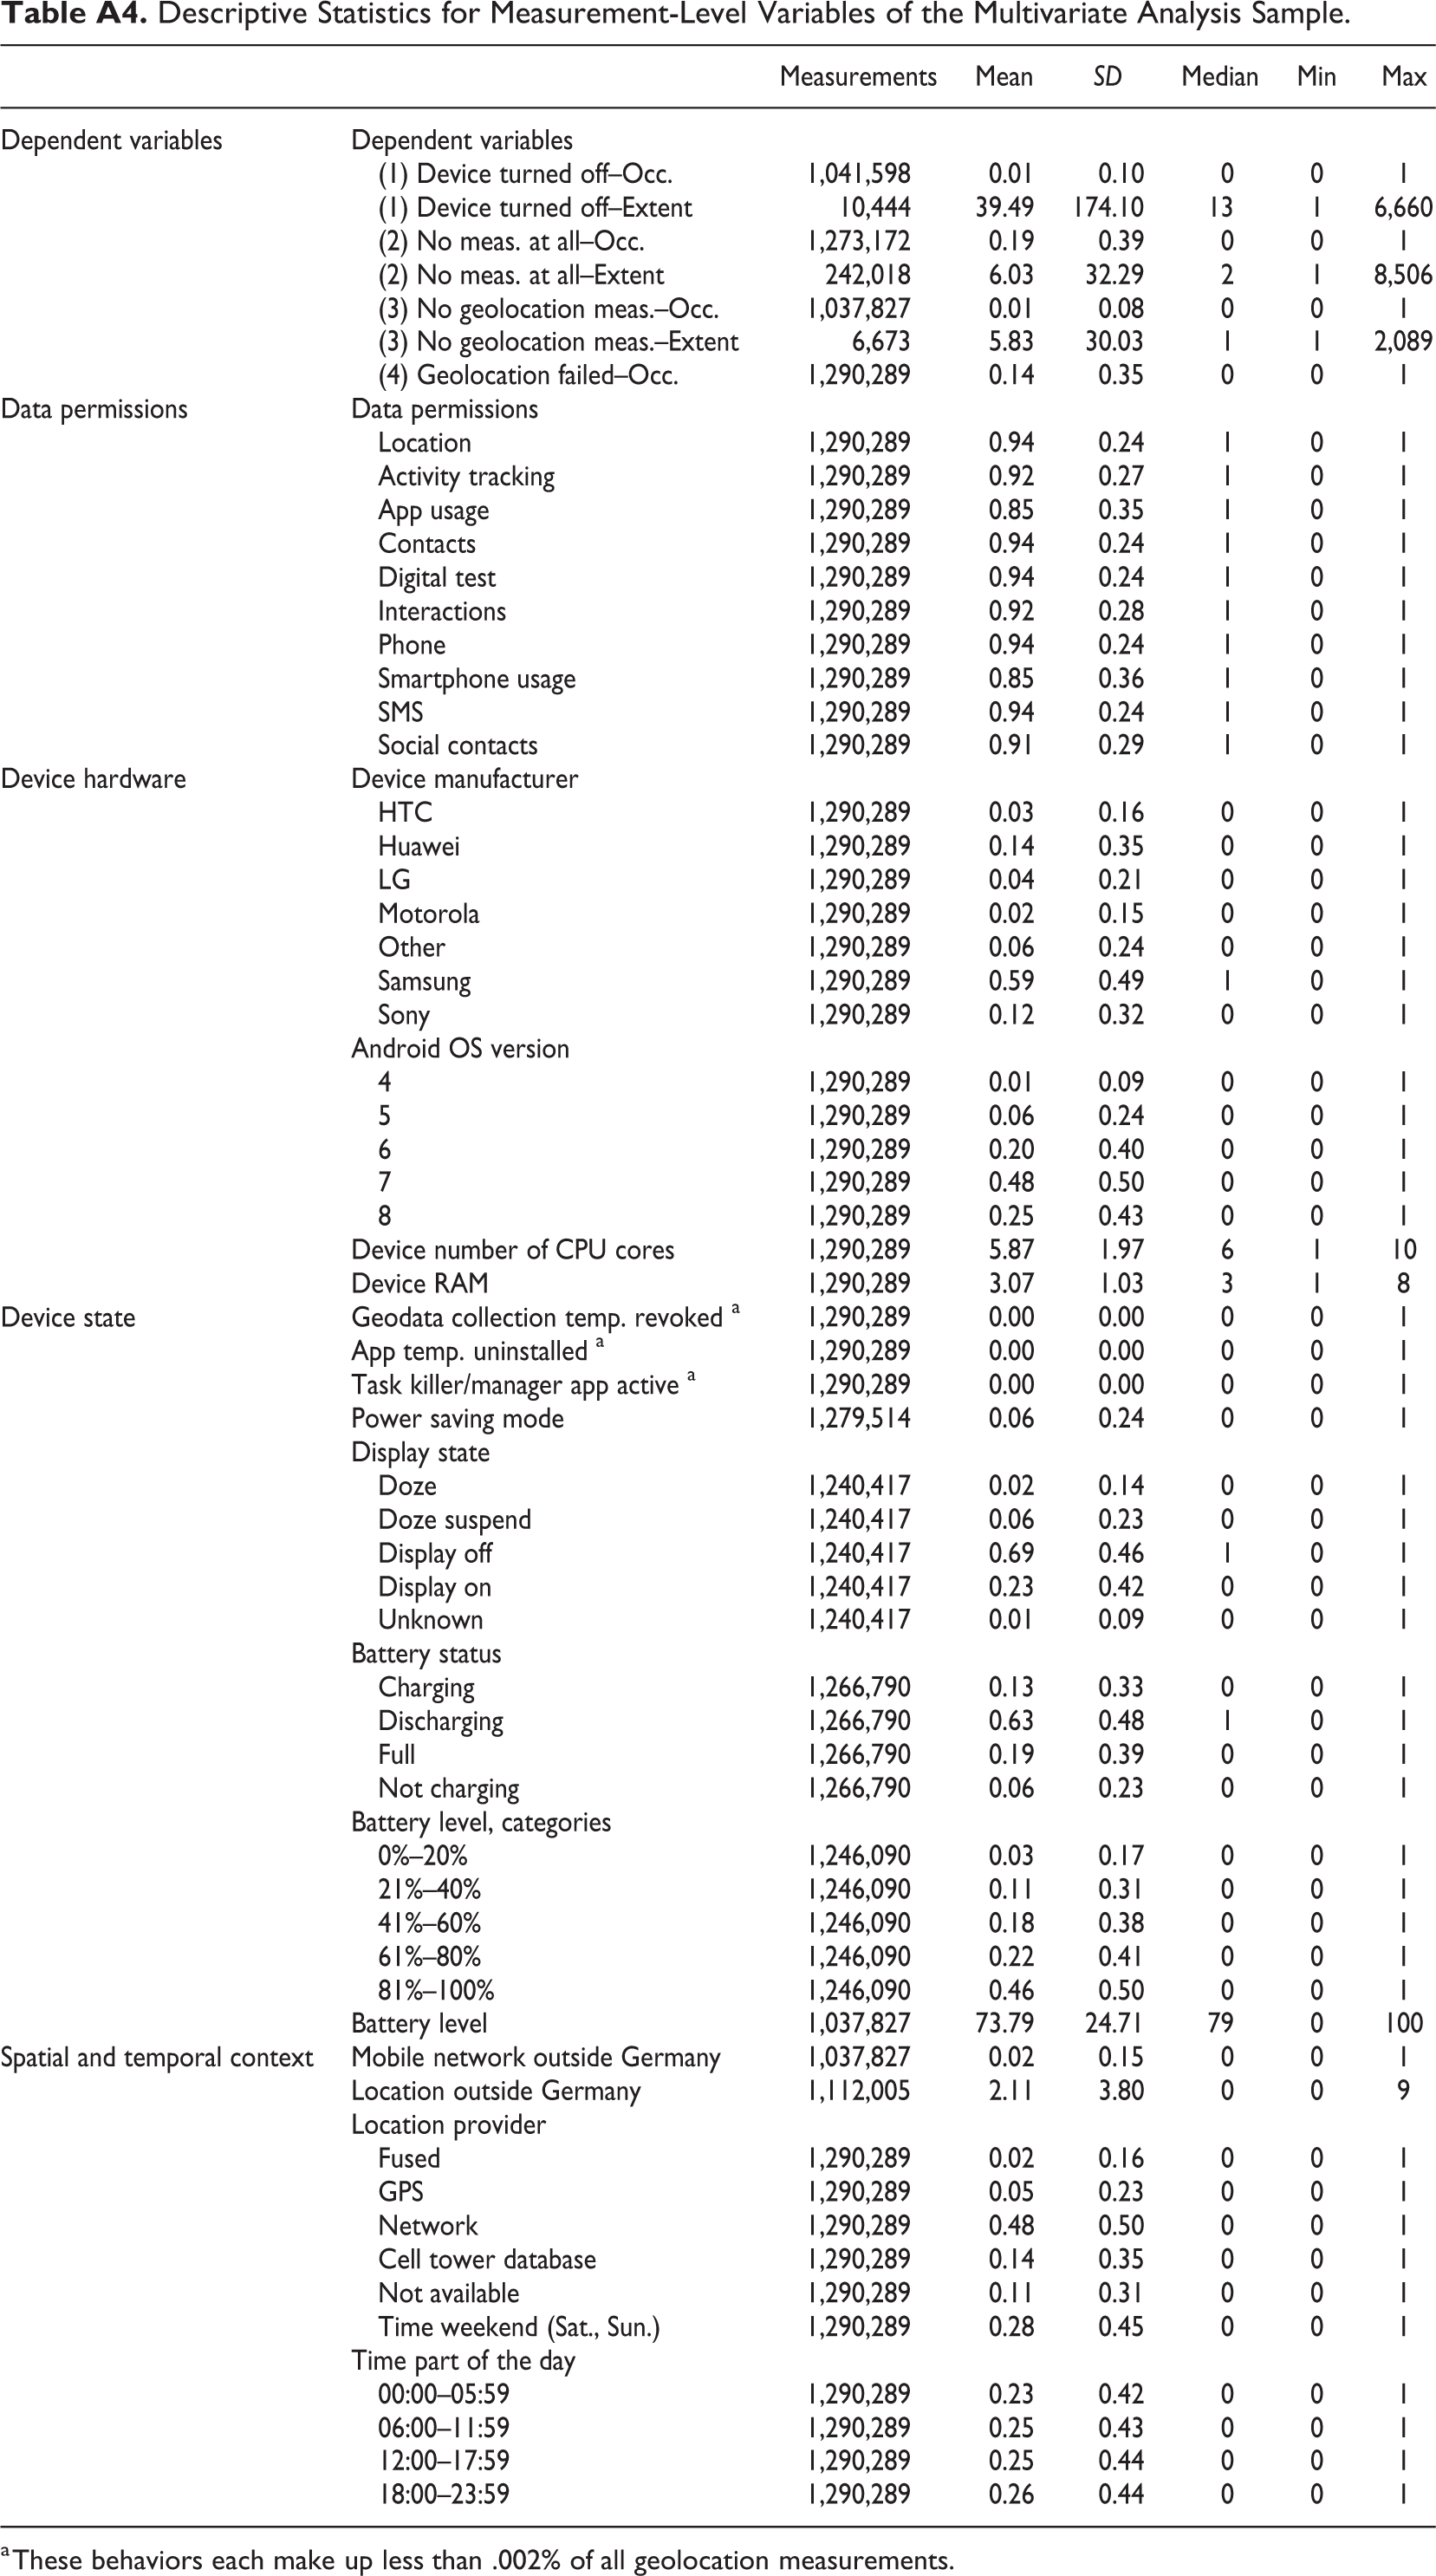
Our data consist of measurements and survey responses with precise timestamps and paradata concerning, for example, information on the device, its operational state (i.e., battery level, display state), and the state of the mobile network connection. From these paradata, we create five variables of interest that align with the five stages of our model in Figure 1: (1) turned off devices, (2) no measurements at all, (3) no geolocation measurements, (4) failed geolocation, and (5) invalid geocoordinates. In the Appendix, we provide descriptive statistics for all dependent and independent variables at the participant level (Table A3) and measurement level (Table A4). Figure 2 illustrates the first three measurement gaps, which are related to the absence of scheduled geolocation measurements.
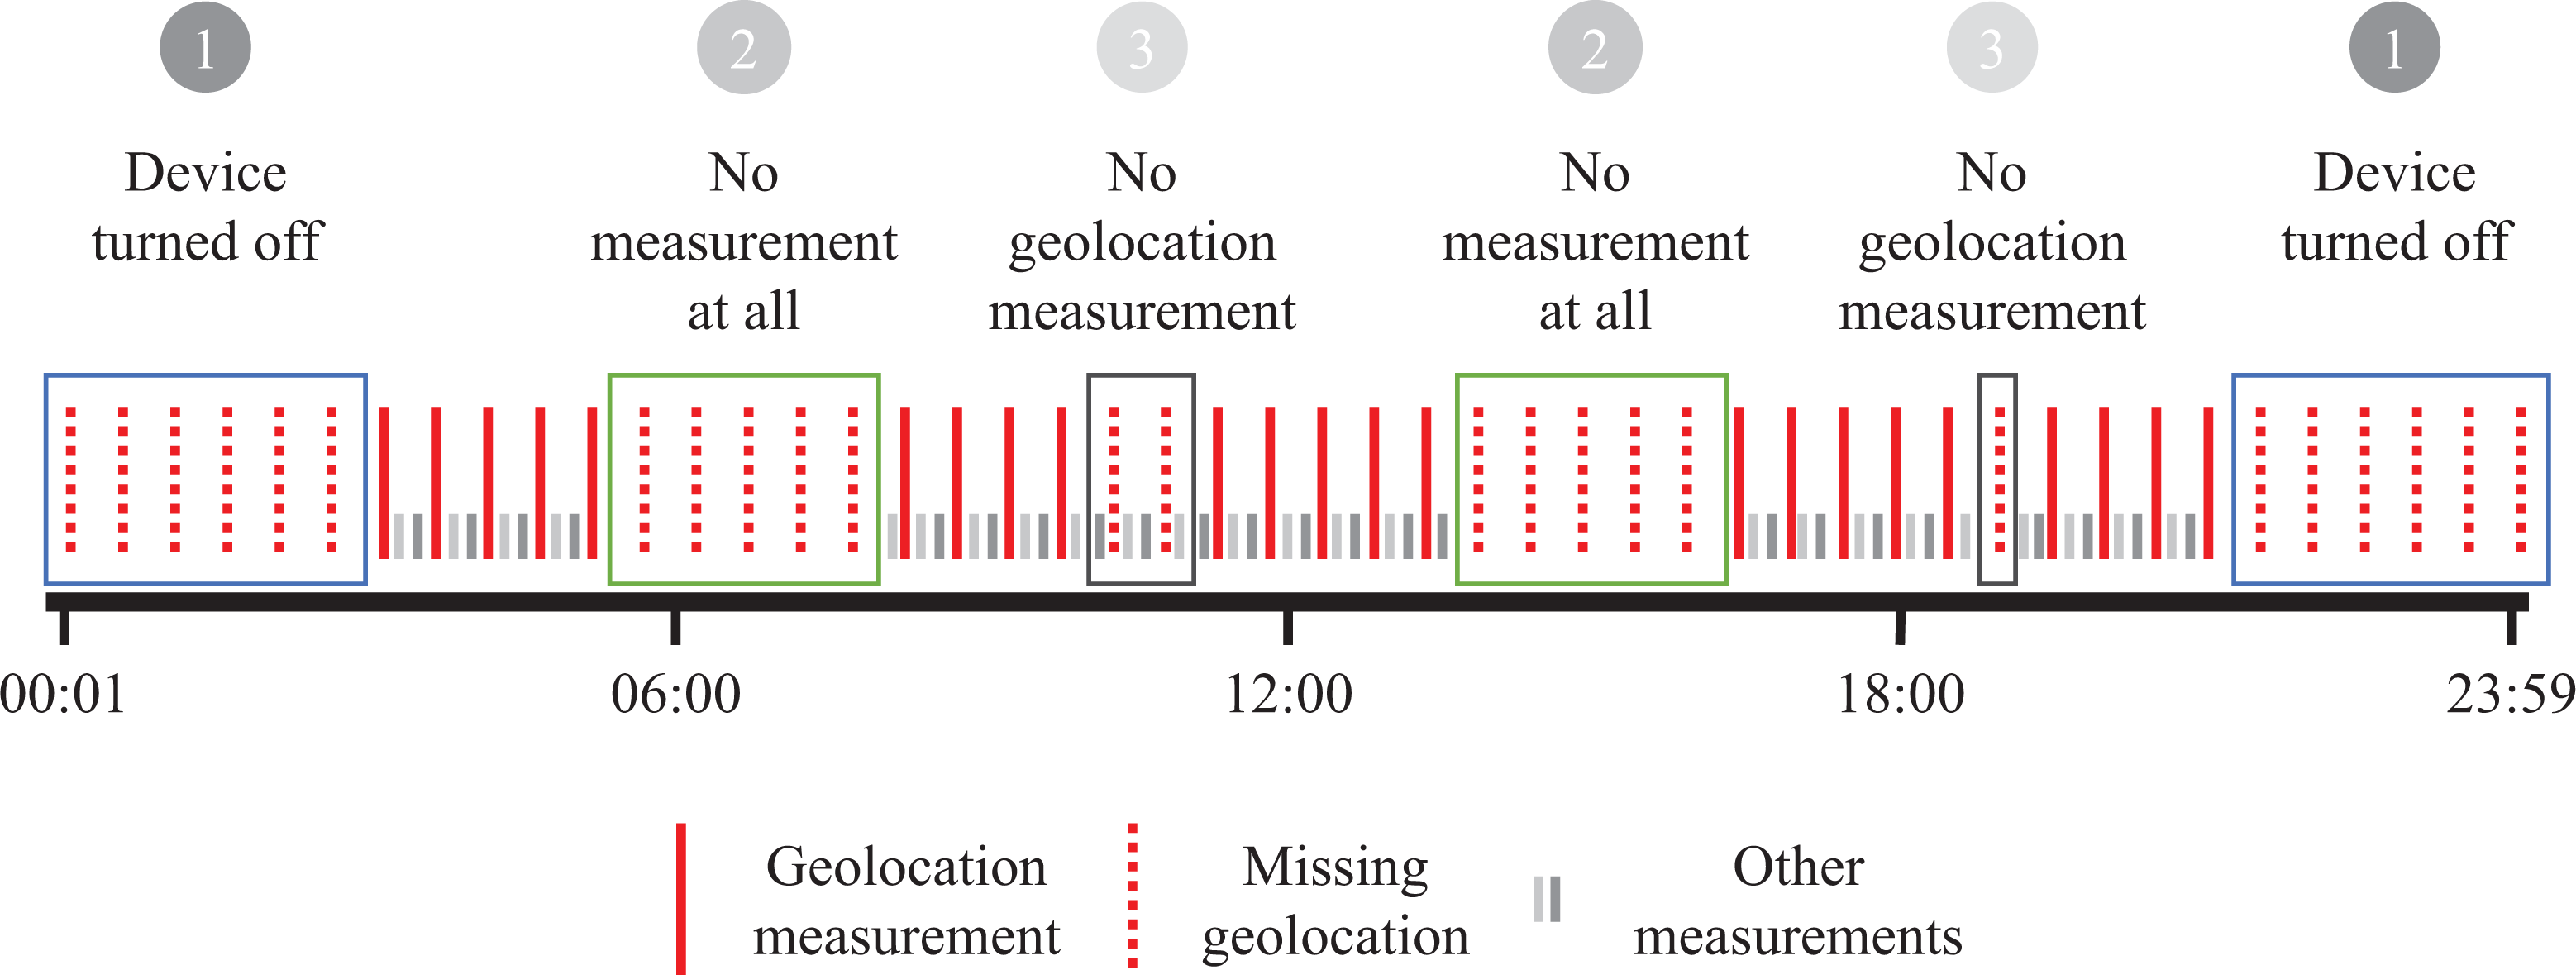
An example of missingness at Stages 1–3. Note. This figure shows the first three missingness processes. Episodes where the device was turned off (1) no data are collected, including no geolocation data. Similarly, there are episodes where the device is on, but the research app could not collect any measurements at all (2). For the remaining time, there are episodes where no geolocation measurement was collected (3) despite an otherwise actively collecting research app.
Some gaps in data collection occur naturally or by design. For the purpose of this study, we are interested in only those gaps that lead to a loss of scheduled geolocation measurements. Our planned 30-min geolocation sampling rate is satisfied, with a median actual sampling rate of approximately 30.7 min. However, the mean of 63.24 min and its standard deviation of 1,155.18 min point to considerable variation in the extent of gaps, which could be due to on-device processes that delay the geolocation measurement or device downtimes. Therefore, we choose a conservative measure to consider a geolocation measurement to be lost, namely, when the gap between two geolocation measurements is equal to or exceeds 60 min. In this way, we can be sure that at least one additional geolocation measurement was scheduled but is missing. Doing so, we analyze only a subgroup of all actual measurement gaps: Approximately 12% of all gaps between geolocation measurements are at least 60 min.
We identify (1) turned off devices from the information of the last device start. The span from the last time the IAB-SMART app could collect data until the recorded restart time constitutes the turned off device episode. We combine all data collected by the IAB-SMART app into a single data set, where each measurement episode and turned off device episode are represented as a data row with start and end time stamps.
This data structure provides an overview not only of the sequence of measurements but also the gaps in the collection of any data. From these gaps, we generate our second variable of interest, (2) no measurements at all. These gaps also constitute data rows, creating a gapless data set (at the 1-second level) from the first to the last observation of each participant.
We next identify (3) no geolocation measurements using the interval between location measurements. We define all intervals with a duration of at least 60 min as problematic and flag them as gaps. To rule out turned off devices and gaps in general data collection as explanations, we consider only the intervals between two location measurements where other measurements (e.g., app use data or activity sensor data) were collected.
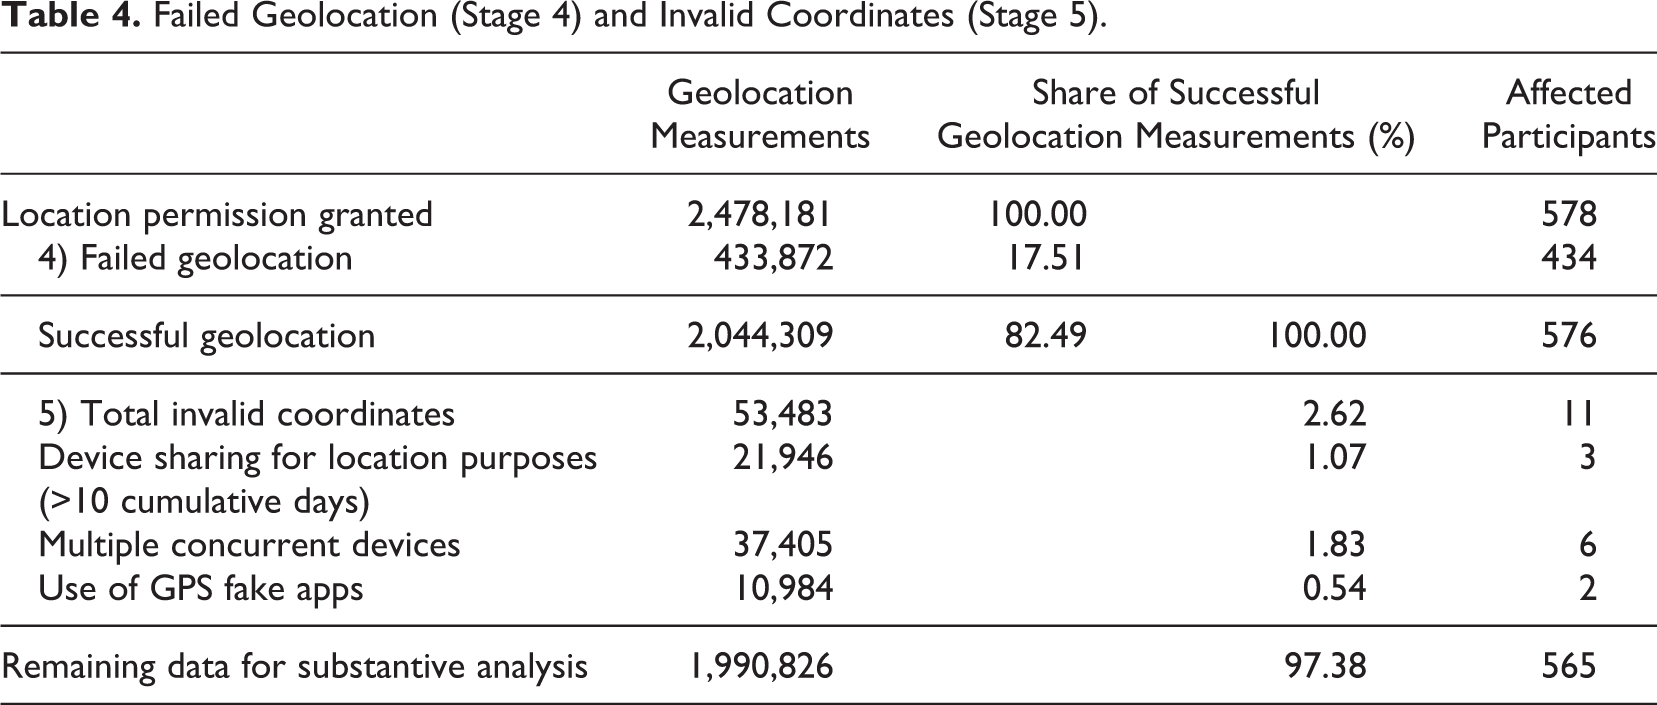
Even if the app triggers a geolocation measurement as planned, this does not ensure that the geolocation, that is, the identification of the geographic location, was actually successful. In such a case, the information on longitude and latitude would be missing in our data set. According to Google (2019b), failed geolocations should rarely occur and is mainly due to disabled location in the device settings. However, in our study, 17.5% of all location measurements contain missing longitude and latitude coordinates. We identify such cases as (4) geolocation failed. Compared to (3), the difference is that in (4), we did initiate a geolocation measurement as planned, nonetheless, the data are missing because of failed geolocating.
Finally, having collected functioning location data, it is possible that the (5) coordinates are invalid for use in substantive analyses, for example, when participants falsify their real location with third-party apps, pass on their invitation code to other people, share their device with others, or use more than one device with the research app installed. We obtained the information on device sharing from an in-app survey at the end of the study period. Participants who shared their device with others for more than 10 cumulative days over the study period, we define as problematic because the passively measured data cannot be attributed with certainty to the targeted participant (see Table A2 for details on the reasons for device sharing). From the paradata on device type, we could infer concurrent installations on multiple devices. We gained information on location faking from analyzing the app use data of participants. The use of apps that falsify the geolocation disqualifies the use of the participants’ data. We identify approximately 2.6% of all available geolocations as potentially invalid for substantial analysis.
The explanatory variables
We group the explanatory variables into four major lines of explanation: First, we use a set of sociodemographic variables consisting of age, gender, household size, and employment status of the participant. These variables were surveyed during the IAB-SMART study period and supplemented with information from the PASS survey. For the models of Stages (1) through (4), we also control for participants with invalid measurements due to behavior such as device sharing, having the app installed on multiple devices, and location faking. Because the frequency of each of these behaviors is low, we group these participants together and call them “problematic participants.” By including an indicator for these participants, we can parse out the effect of problematic behavior, freeing the other coefficients from its influence. At the same time, we gain at least summary insights into the direction of bias by this behavior from the coefficient of the indicator variable itself.
Second, we use a set of variables with information about the device hardware. The variables include the device manufacturer to account for device quality and user interface. We choose Samsung as the reference category because it is by far the largest manufacturer of smartphones in our data. We also control for the Android OS version, which provides an indication of the age of the device and the quality of algorithms for battery optimization and geolocating. In addition, newer Android versions contain more restrictive energy management systems that could prevent our app from collecting data in the background (e.g., Google, 2019a). The number of CPU cores and the size of the device’s RAM control for the computational resources that influence system stability.
Third, we add a set of variables on the state of the device at the time of measurement. This includes battery status and level as important indicators for energy-saving modes, which restrict the data collection, to prevent the device from powering down. For the same reasons, we monitor whether task manager or task killer apps are being used before the gaps occur. The display state provides information about system-initiated doze modes and user-activated power saving modes. We also control for temporary uninstallation of our research app and temporary revoking of geolocation permissions because both factors provide unique explanations for geolocation missingness. All these factors can impede measurement and could be attributed to technical issues or user behavior.
Fourth, we consider the spatial and temporal context of the measurement. We control for activated roaming, mobile network location outside of Germany, and geolocation measurement outside of Germany to indicate stays in border regions or abroad that could interfere with the geolocation measurement. We use the last known location provider to establish the quality of measurement. Controlling for the time dimensions (weekday or weekend and time of day) enables analysis of behavioral patterns, such as switching off devices at night or during work hours.
Not every measurement source provides all paradata (e.g., on the device information or the device state), we, therefore, imputed missing values in two ways. We imputed time-constant information (such as the device maker, RAM, etc.) with nonmissing preceding values if they were in accordance with the following non-missing information. For time-varying information (e.g., the battery level), we interpolated from values before and after the missing information. Including more elaborated imputation models in this complex set would exceed the scope of this article.
Models
For each of the Outcomes (1)–(3), we generate a variable identifying (a) the occurrence of such gaps and (b) their extent as a variable counting the number of geolocation measurements that are missing in each of these identified gaps. Figure 3 displays the analytical strategy for predicting the occurrence of the geolocation measurement due to one of the first three mechanisms. We use the measurement taken immediately before the gap occurred to inform us about the device state and the spatial and temporal context of the device when the gap occurred.
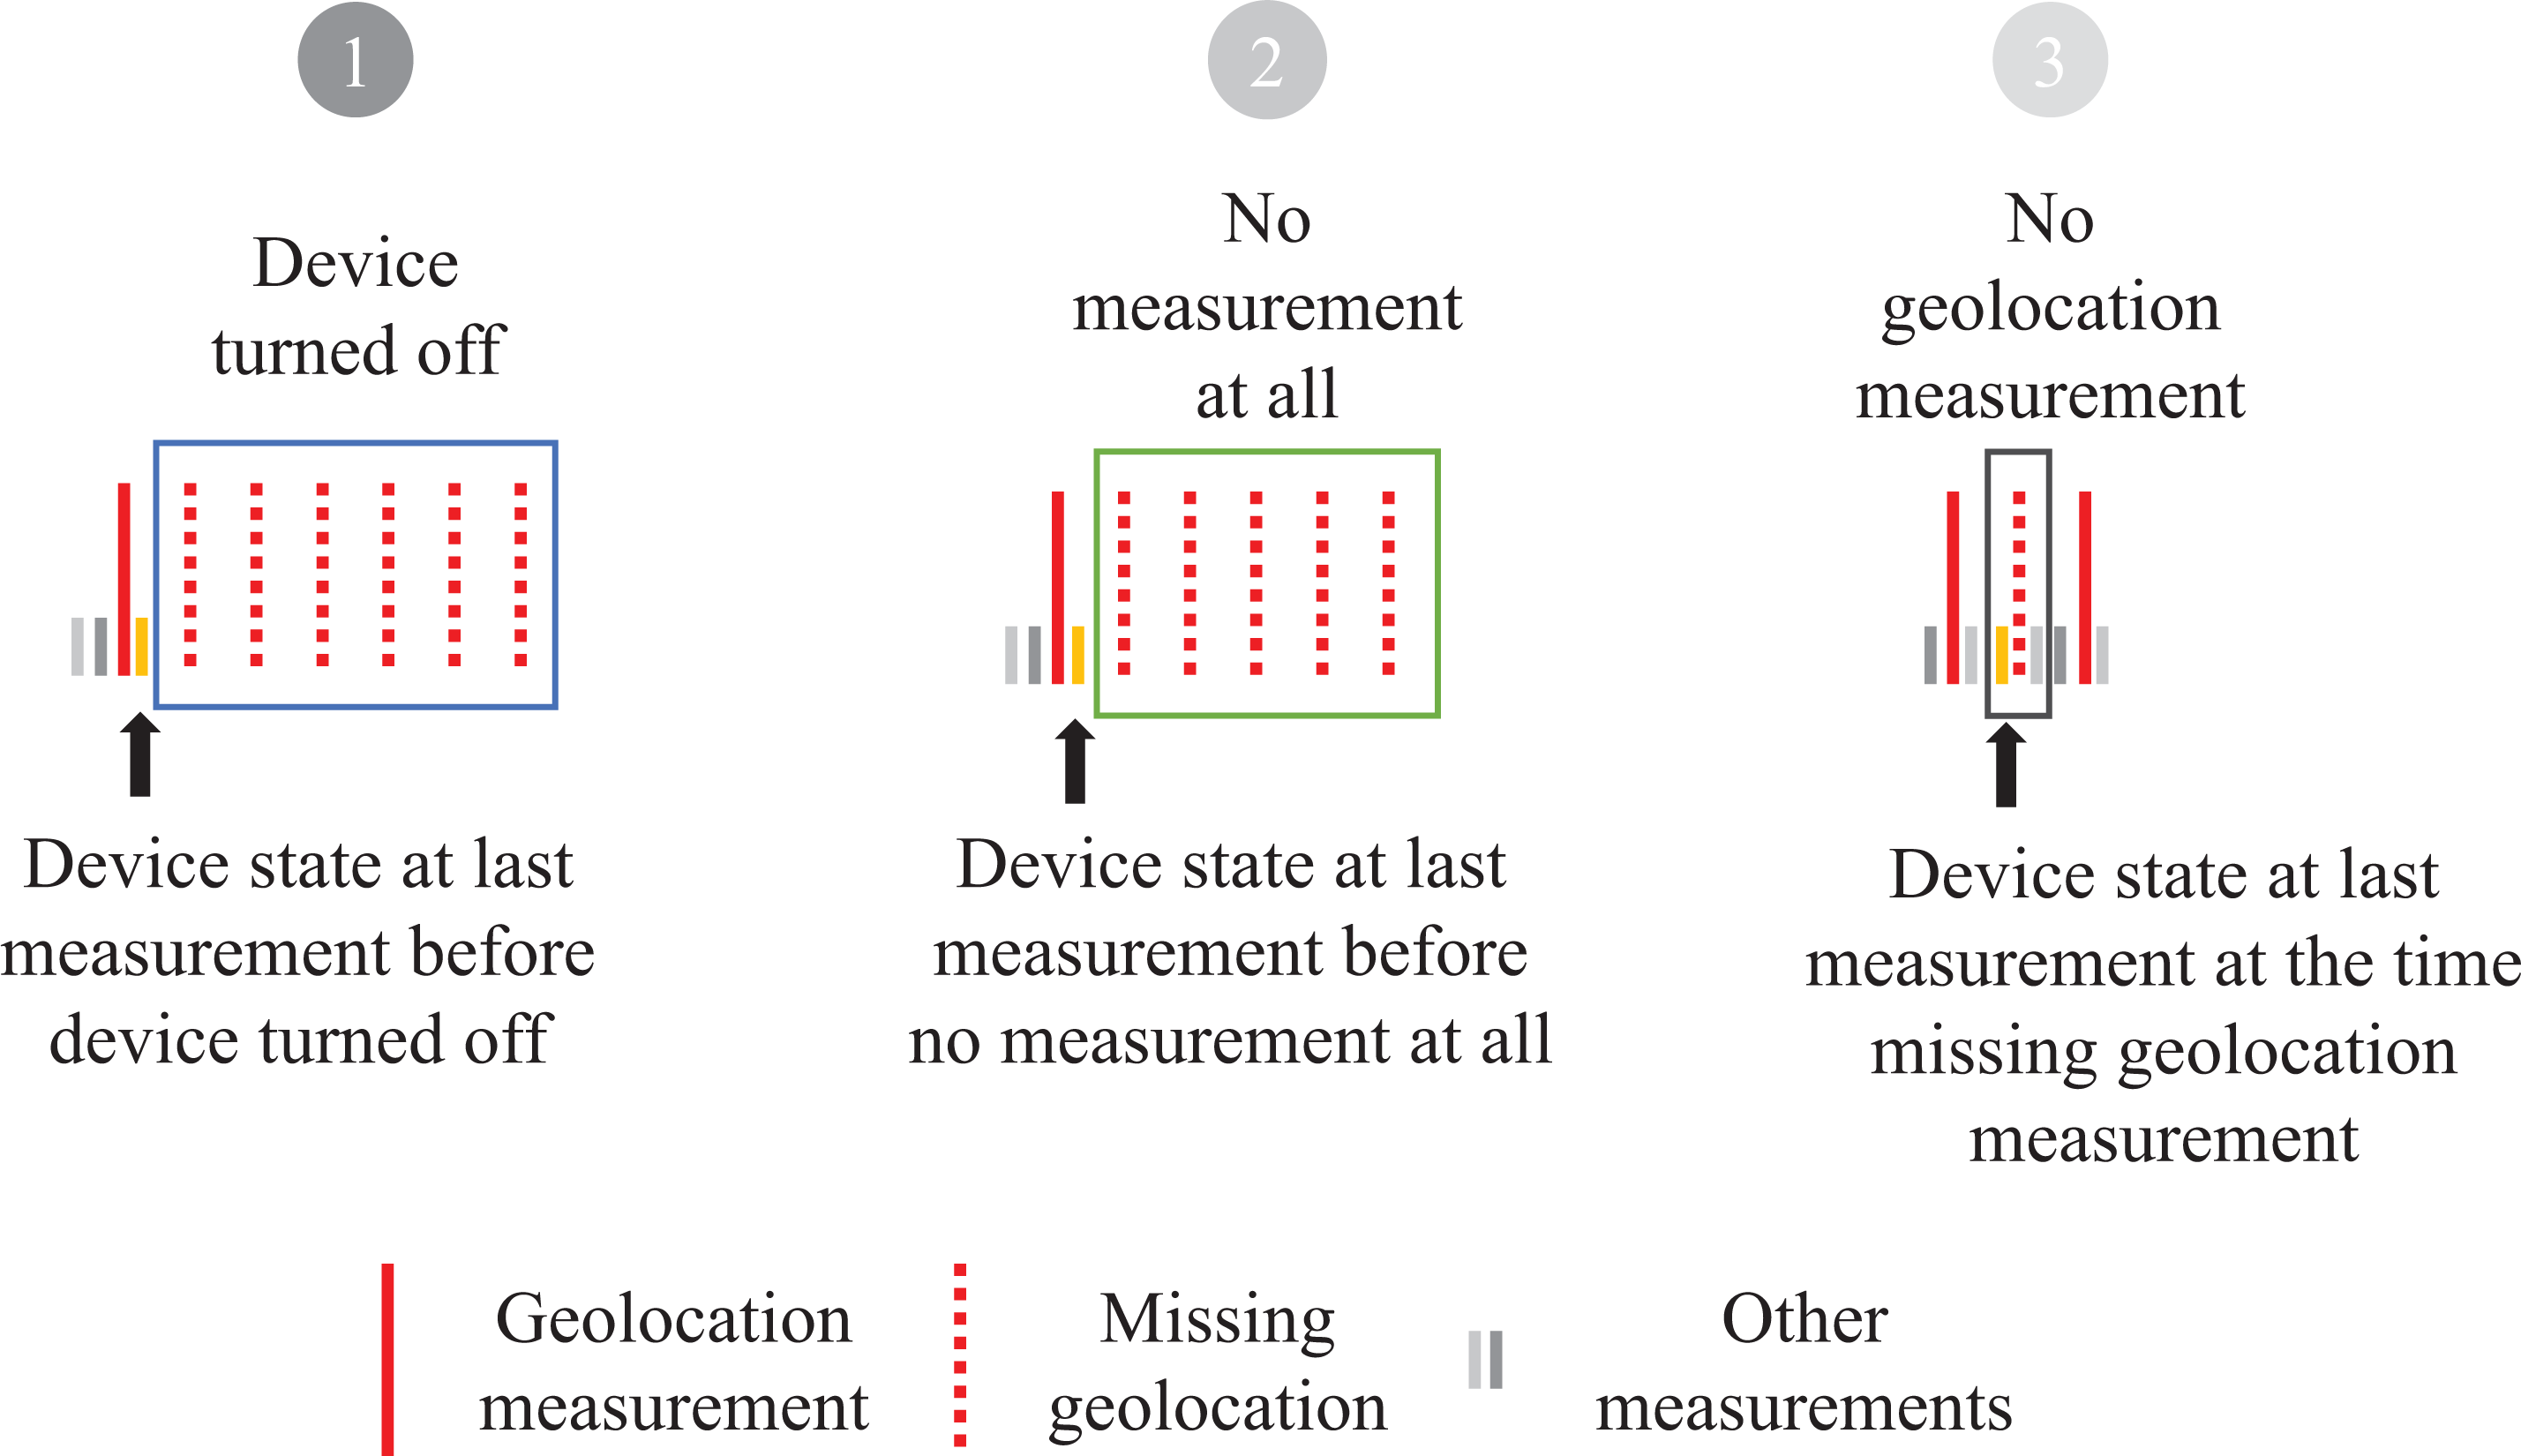
Analytical strategy for missingness at Stages 1–3.
While the first three outcomes deal with the absence of geolocation measurements, that can span multiple planned measurements, failed geolocation (4) occurs only in existing measurements. Therefore, we analyze only the occurrence of this missingness. Measurement error due to invalid coordinates (5) is a collection of problematic behavior, which is heterogeneous, and the individual components rarely occur. We, therefore, limit ourselves to a descriptive presentation to inform future research.
Although our dependent variables deviate from the prerequisites of the linear model in that they are either binary outcomes or count variables, we follow the arguments of Angrist and Pischke (2009, p. 197) and Breen et al. (2018, p. 51) and provide all results as linear regression estimates since they are simple to compute, easily interpreted as marginal effects, and comparable across studies. 1
We include all explanatory variables that are not fixed over the study period as lags; thus, we consider the information from the measurement that immediately precedes the gap. In addition to the mentioned controls, we include indicator variables for the data permissions and data sources to capture the effects of varying smartphone use intensity and varying numbers or types of permissions on the frequency and extent of gaps. To provide a comparative overview, we use the same model specification on the occurrence (Models 1, 3, 5, 7 in Table 2) and extent (Models 2, 4, 6 in Table 2) of all gap phenomena.
Multivariate Results.
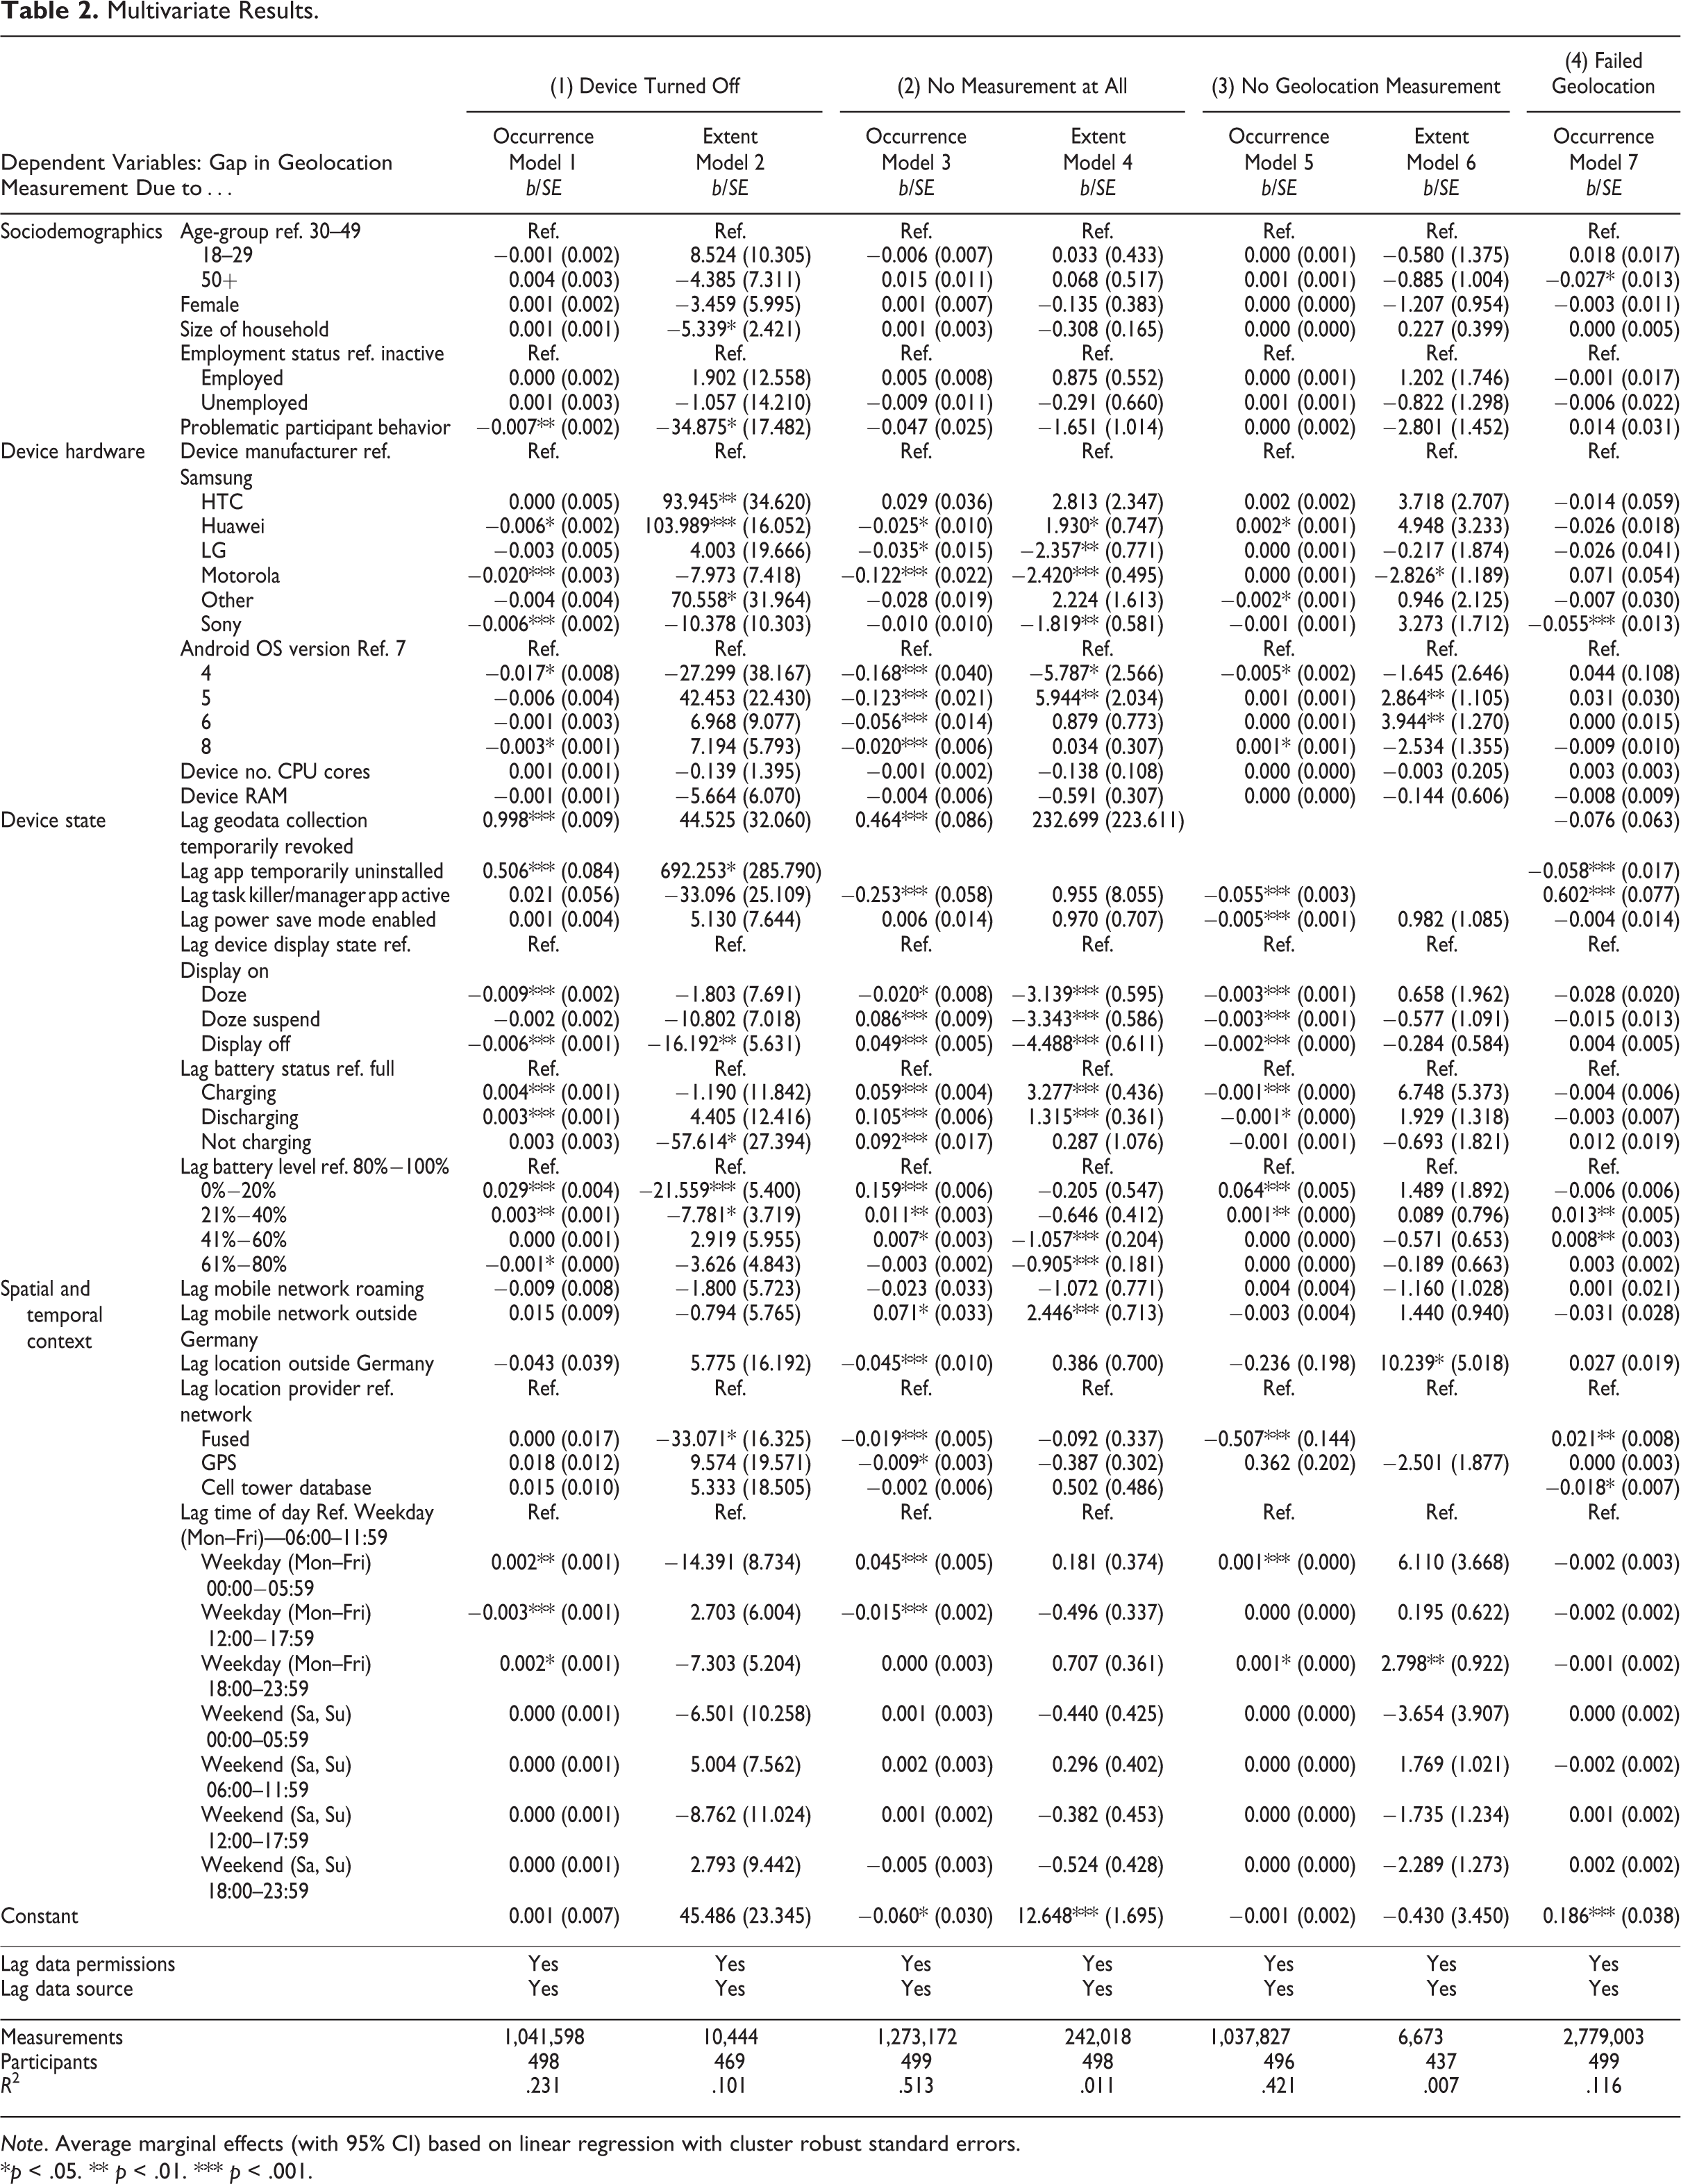
Note. Average marginal effects (with 95% CI) based on linear regression with cluster robust standard errors.
*p < .05. ** p < .01. *** p < .001.
Results
Table 3 shows an overview of the amount of collected geoinformation over the data collection period. On average, the app collected at least one geolocation data point for 164 days for 578 participants who provided at least one geolocation measurement. As the median number of days is 196, which is greater than the mean, our data are left-skewed and have cases with only a few days of data collection. As our data collection interval for geolocation data was 30 min, the app should have collected 48 measures per day, leading to an average target number of 9,359 geolocations. The actual number of measured geolocations, however, is only 4,289 (45.8%), that is, 54.2% of the observations are missing.
Amount of Missingness of the Geolocation Measurements Per Participant.
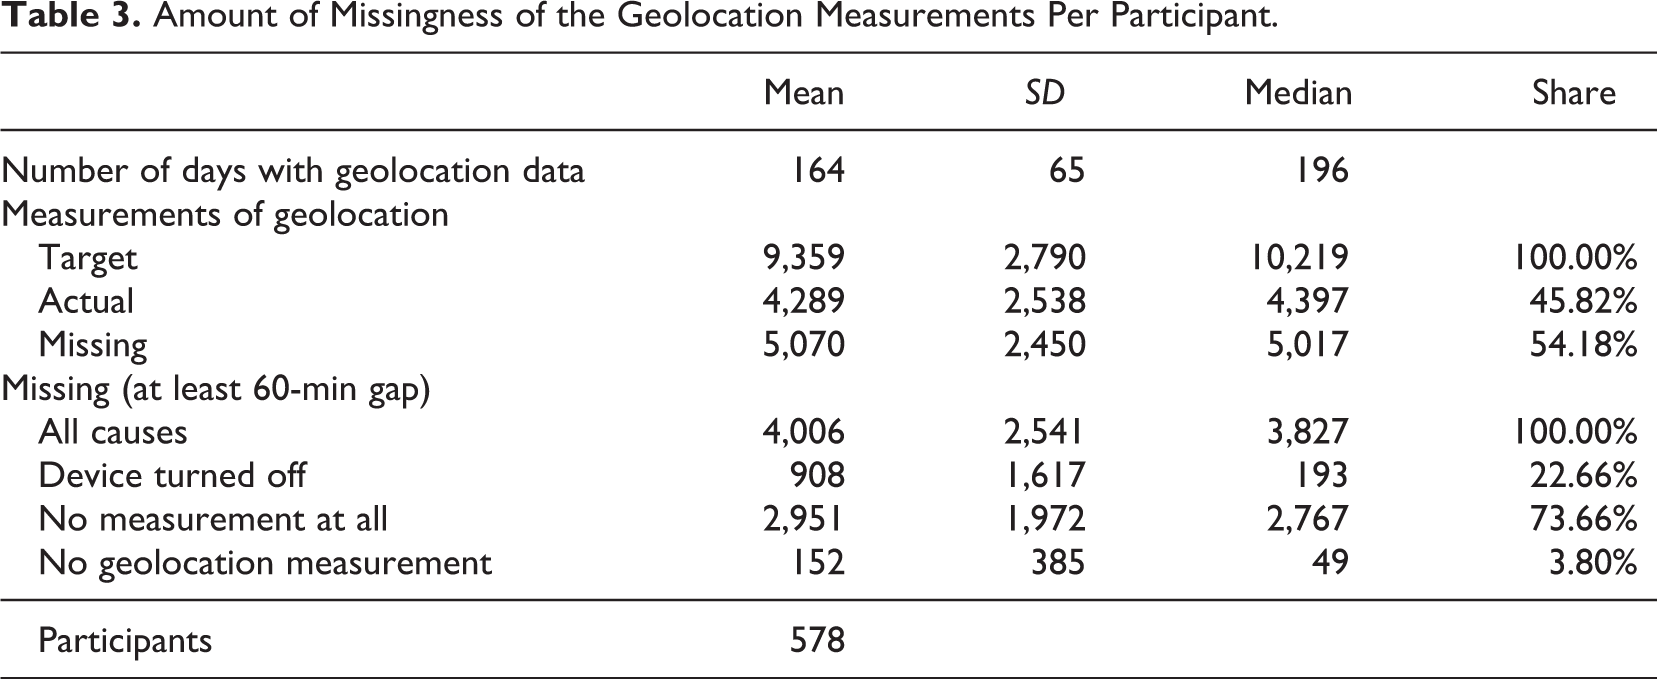
Beside small variations in the actual sampling frequency, the following reasons should explain, why we have fewer observations than expected: turned off devices, gaps with no measurements at all, and gaps in geolocation measurement. When we concentrate on the geolocation gaps that last for at least 60 min, turned off devices are responsible for 22.7%, gaps in all data collection are responsible for 73.7%, and gaps in geolocation data are responsible for 3.8% of missing location measures. Table 3 also highlights our design decision to focus on gaps between geolocation measurements of at least 60 min. While these gaps constitute only 12% of all gaps in terms of time, they include 79% of all missing geolocation measurements.
Table 2 displays the results from our multivariate analyses reported as average marginal effects. For Outcomes (1)–(3), we display results for the occurrence, defined as the identification of geolocation measurement gaps, and the extent, defined as the length of each identified gap in terms of the number of missing geolocation measurements. For Outcome (4), we display the occurrence of failed geolocation.
Explaining Missingness Due to Turned Off Devices (1)
At the median, 193 missing geodata measurements per participant can be explained by turned off devices. Results for gap occurrence due to gaps in all measurements can be found in Table 2, Model 1. Model 2 explains the number of missing measurements due to turned off devices.
Gap occurrence
Model 1 shows no differences between sociodemographic groups in the likelihood of the device being turned off. Problematic participant behavior is negatively correlated (−.007) with the likelihood of gaps by turned off devices. We find some isolated effects of manufacturers. Compared to Samsung devices, smartphones from Huawei (−.006), Motorola (−.020), and Sony (−.006) have a significantly lower likelihood of missing geolocation measurements due to device turnoffs. Compared to Android 7, the oldest version (Android 4) and the most frequent version (Android 8) in our sample are less prone to missing geolocations because of turned off devices. Other device indicators such as the number of CPUs or the device’s RAM have no effect on gaps due to devices being turned off. Regarding the device’s state, we find that temporarily revoking the geodata collection in the app settings menu (.998) and temporarily uninstalling the app (.506) are very likely to precede a turned off device period. The usage of the so-called task killer apps and enabling the power save mode do not influence the device being turned off. If the devices display state is not “on” but “doze” or “off,” we see negative probabilities for turned off device episodes (−.009 and −.006). The battery states “charging” and “discharging” have a larger probability to precede a turned off device episode (.004 and .003) than the battery status “full.” In addition, low battery levels, that is, 0%–20% (.029) and 20%–40% (.003) make immediate device turnoffs more likely while a battery state between 61% and 80% (−.001) makes it less likely for devices being turned off. Concerning spatial and temporal context factors, we find a higher probability that the device is turned off during the night hours on weekdays (.002) and lower probabilities for afternoons on weekdays (−.003). The location of the smartphone outside of Germany and the location provider have no effect on devices being turned off.
Gap Extent
For sociodemographic variables, we find no significant effects on the extent of gaps due to turned off devices. The number of missing geolocation measurements in a gap decreases with an increasing household size (−5.3) indicating the need to communicate with other household members. Here also problematic behavior by participants does not lead to more but to less missing geolocation data (−34.9). Compared to Samsung smartphones, we find three device manufacturers that have, on average, more missing geodata per gap: HTC (93.9), Huawei (104.0), and other manufacturers (70.6). We find no differences in gap extents by Android version, the number of CPU cores, or the device’s RAM. Regarding the device state, we find longer gaps when the app was temporally uninstalled before the gap. We find no effects in the extent of gaps when considering that the consent to geodata collection was temporarily revoked and when the participant used a task killer app or enabled the power save mode. If the device’s display was switched off before the device powered down, gaps were 16.2 geolocations shorter. Furthermore, if the device was actively charging, this decreased the extent of geodata measurement gaps by 57.6. Furthermore, we find that the extent of gaps decreases by 21.6 missing geolocation measurements when the device has a battery level of 0%–20% and by 7.7 when the battery level is between 21% and 40% compared to fully charged. Considering the spatial and temporal context, we see no effects on the extent of gaps due to turned off devices.
Explaining Missingness Due to No Measurement at All (2)
At the median, we find 2,767 missing geolocation measurements per participant due to episodes where the app was unable to collect any data at all. Results for gap occurrence due to gaps in all measurements can be found in Model 3. Results for the extent of gaps in all measurements (given a gap) can be found in Model 4.
Gap occurrence
We find that sociodemographic variables have no effect on the occurrence of gaps in all data collection (see Model 3). For device hardware factors, we find effects related to the device manufacturers and the OS: Huawei (−.025), LG (−.035), and Motorola (−.122) smartphones have fewer gaps than Samsung smartphones, and the number of gaps in all measurements decreases with older Android versions. Concerning the number of CPU cores and RAM, we find no effects. Shortly after participants revoke their consent for geodata collection, we see an increased gap likelihood in missingness (.46) while we see a smaller likelihood for gaps if participants use a task killer app.
While one would expect that uninstalling the app would manifest itself in gaps in all measurements, in our data structure, this is covered by the gaps due to (1) turned off devices. We find gaps to be less likely if the device activated the “doze” mode (−.02) but more likely if the device activated the “doze suspend” mode (.086). This is in line with the finding that, the likelihood of gaps increased when the display was turned off (.049), indicating that most data collection happens when the device is somewhat inactive. Furthermore, if the battery has the status “full,” devices are less likely to have gaps in all measurements. A low battery level increases the occurrence of gaps compared to a fuller battery level which indicates that the Android OS may kill apps running in the background to save energy. For the spatial and temporal context factors, we are more likely to find gaps in all measurements (.015) if the device is logged into a non-German carrier network, while smartphones located outside of Germany are less likely to have gaps (−.045). This indicates first, connectivity issues in border regions, and second, more stable environments, once the device is abroad. We also find effects of the time of day with gaps being more likely during the night hours on weekdays (.045) and less likely on weekday afternoons (−.015).
Gap extent
For sociodemographic variables, we find no effects for the extent of gaps in all measurements. Compared to Samsung smartphones, we find three device manufacturers with, on average, two fewer missing geodata measurements per gap: LG (−2.4), Motorola (−2.4), and Sony (−1.8). Huawei smartphones produce on average 1.9 more missing geodata measurements per gap. Android 5 produces six additional missing measurements per gap, while Android 4 produces 5.8 fewer missing measurements per gap compared to Android 7. Regarding device states, we find no effects if the participants revoked the geodata collection, used a task killer app, or enabled the power saving mode. However, the extent of all measurement gaps is strongly related to the device states display status, battery status, and battery level. The device display state “doze” (−3.1), “doze suspend” (−3.3), and “off” (−4.5) as well as having a rather high battery level, that is, 41%–60% (−1.1) and 61%–80% (−0.9), decrease the extent of gaps. Charging (3.3) and discharging (1.3) the device increases the number of missing geolocations per gap compared to the status “full.” For our spatial and temporal factors, we find devices that use mobile networks outside of Germany have 2.4 more missing geolocation measurements per gap. For the time of day, we find no effect.
Explaining Missingness Due to No Geolocation Measurement (3)
At this stage, the app was able to collect other data but no geolocation data (see Figure 3). At the median, we find that 49 measurements per participant are lost due to this phenomenon. Results of the gap occurrence due to gaps in geolocation measurements can be found in Model 5. Results for the extent of gaps in geolocation measurements can be found in Model 6.
Gap occurrence
Model 5 shows that sociodemographic variables have no effect on the occurrence of geolocation measurement gaps. Users with a Huawei device (.002) are more likely to have geolocation measurement gaps than Samsung devices, while devices from other manufacturers (−.002) are less likely. Android 4 (−.005) devices have a smaller probability of geolocation data gaps, while smartphones with Android 8 (.001) have a higher probability for gaps compared to Android 7 devices. Gaps in geolocation data can be explained well by device state factors. We find gaps to be less likely when task killer apps were used (−.055) or the power saving mode was activated (−.005). Furthermore, we find that each display state decreases the probability for a gap compared to the display state “on.” Location data gaps are less likely to occur when the device is charging or discharging (−.001). Low battery levels of 21%–40% (.064) and 0%–20% (.001) increase the probability of a gap in geodata measurement. For spatial and temporal context factors, we find that location data gaps are more likely during the night on weekdays.
Gap extent
Sociodemographic variables have no effect on the extent of geolocation measurement gaps (see Model 6). Motorola smartphones have 2.8 fewer missing geolocations per gap than Samsung smartphones. Android Versions 5 and 6 produce 2.8 and 3.9 more missing locations, respectively than Android 7. For device state factors, we find no effect on the extent of geolocation measurement gaps. Regarding spatial and temporal context variables, we find that smartphones located outside of Germany to have 10.2 more missing geolocations per gap than smartphones that are in Germany. Furthermore, we find 2.8 more missing geolocations per gap on weekday evenings.
Failed Geolocation (4)
In our study, the geolocating failed in about 17.5% of all nonmissing geolocation measurements. Results for the occurrence of failed geolocation can be found in Model 7. For sociodemographic variables, we find that participants 50+ years old are less likely to have failed geolocations (−.027) than the 30- to 49-year-olds. Regarding device hardware characteristics, we find that Sony devices are less likely to produce failed geolocation (−.055) than Samsung devices. Looking at the impact of device states, we find failed geolocations to be less likely if the participant temporally uninstalled the app (−.058). Task killer apps (.602) and battery levels of 21%–40% (.013) and 41%–60% (.008) seem to (strongly) increase the probability for failed geolocation. These last two results are in line with the technical nature of this phenomenon (Google, 2019b). If the last successful geolocation measurement before the gap was provided by Wi-Fi information, this increases the probability of failed geolocation (.021), which indicates that it is indoor situations, where Wi-Fi and mobile carrier network reception are weak, that produce these gaps (Kjærgaard et al., 2010). This also hints at the design decision not to implement Wi-Fi in the group of providers used for active geolocation, as a factor driving the extent of missingness at this stage. As indoor stays have a higher probability of missingness in our study, substantial analysis will have to deal with underrepresented indoor events. The occurrence of the gap is invariant over the time of day and week, so it affects indoor locations both at home and at work in the same way. In summary, Model 7 differs considerably from Model 5, underlining the distinctiveness of both missing phenomena.
Invalid Coordinates (5)
In the last stage, we subsume participant behavior that makes their geolocations in the context of our study invalid. At the end of the study period, we asked, how often participants shared their device with others (see Table 4). Three participants shared their devices for more than 10 cumulative days over the study period, which is the threshold we consider problematic, explicitly to enable others to be reachable on the go. Such sharing invalidates the geolocation data of the originally sampled study member; therefore, we need to exclude them from substantive analyses (see Table A2 for further details). All together 10 respondents provided measurements stemming from different devices at the same time; 4 had parallel measurements of only a few seconds, while the remaining 6 had on average 31 days of parallel measurement (the maximum was 118 days). We need to exclude these six from substantive analysis because it is unclear who was using the device and which locations belonged to the sampled participant. When further analyzing the app use data, we identified two participants, who used apps to falsify their geolocations. Close inspection, confirmed, for one of them, that geolocations were altered while the participant was using the app. 2 Thus, we need to exclude the affected observations for both individuals. All these problematic behaviors invalidate a total of 2.6% of all collected geolocation measurements. Technically, we would have to count the 61 participants, whose gender or age provided in the initial in-app surveys differed from the sampled PASS respondents, here also. This is the case, when sampled respondents pass on their invitation to others, for example, household members. Because we ultimately cannot link their data to the PASS records, we excluded their data right from the start of our analysis.
Failed Geolocation (Stage 4) and Invalid Coordinates (Stage 5).
Discussion and Conclusions
This article investigated the measurement quality of geolocations measured by smartphones. We showed that sensor data are far from objective and error-free. Instead, device-related error sources such as specific manufacturer and OS settings, design decisions of the research app, third-party apps, and the participants’ behavior can greatly interfere with the measurement. To disentangle the different influences, we applied a multistage error model to first analyze and then control the general error source in the specific missingness processes of geolocation data.
The good news is that there are almost no effects of the (mostly sociodemographic) respondent attributes used in the models. The number of significant results does not exceed those we would expect by chance. However, user behavior like temporarily revoking the apps’ access to geolocation data or temporarily uninstalling the app unsurprisingly has the largest effects on the occurrence and extent of gaps. Further research into this user behavior is needed to evaluate whether this is a threat to the unbiasedness of the resulting data.
Regarding device hardware, we find that Motorola and Sony smartphones produced fewer gaps and gaps of a smaller extent in our study than Samsung while Huawei smartphones produced fewer but larger gaps. Concerning the OS, with more recent Android versions, the number of instances where no measurement at all could be taken increases noticeably. This reflects the increasing restrictions imposed by Android on third-party apps with each new iteration of the OS. Extrapolating this trend, future research apps will have to manage an increasingly difficult environment for data collection.
The presence of task killer apps on the study smartphone has effects in different directions at different stages. While task killer apps even reduce the number of instances where no measurement at all or no geolocation measurement could be taken, they increase the likelihood of invalid geolocation measurements substantially.
Results for the device state are quite surprising. Doze modes and switched off displays before a scheduled measurement reduce the occurrence and extent of gaps. This challenges the intuition that these modes inhibit data collection.
Battery levels and charging status have large and consistent effects in the expected direction for gap occurrence. However, gaps due to turned off devices at low battery levels tend to be smaller than such gaps occurring at higher battery levels. This could be because faced with low battery status users turn off the smartphone to charge it (phones tend to charge faster when turned off), whereas if the smartphone is turned off at high battery status is might be for more substantial reasons, that is, for good night sleep. We have no data to examine this in the current study, but it could be an interesting next step for the exploration. Further analyses are needed to see what would predict low battery levels to see if there is an inherent threat to substantive conclusions derived from these data. To the extent that the charging behavior of respondents is unrelated to the variables of interest, this should not be a problem. We choose our geolocation sampling rate of 30 min with battery consumption in mind. Other studies might choose to measure geolocation at a higher frequency, in which case battery draining can become more of an issue. If the focus is on short periods (e.g., walking around the neighborhood), this can work fine. If like in our case, measurements are taken over 6 months, a different trade-off needs to be made to avoid participants turning off geolocation tracking, closing the app, or uninstalling the app altogether. By sampling geolocations actively only if they were not already available in the Android system, we emphasized battery efficiency over accuracy. Because GPS and mobile carrier networks were the only providers used for active geolocation, we missed locations that would have been available using Wi-Fi-information (Stage 4). Further research is needed to explore a suitable balance of data collection frequency and device performance.
Surprisingly, there are no consistent effects of locations and networks out of Germany and roaming. Using mobile networks outside of Germany increases the occurrence and extent gaps where no measurement was taken at all, while locations outside Germany reduce the occurrence of such gaps. This could point at two separate issues, living close to the border (or having a foreign mobile plan) and being temporarily abroad (e.g., on vacation). Another technical variable that can be shown to have a large effect is the location provider. If the previous geolocation measurement was fused, this leads to fewer and smaller gaps (although there is a slightly increased chance that geolocation failed).
Gaps in geolocation measurements are at all Stages (1–3) more likely to occur at night (0:00 to 5.59 a.m.) than at any other time of the day. It seems plausible that no activities are missed (when gaps coincide with sleep).
While very rare in our data, we nevertheless want to raise awareness of so far little known error sources in geolocation measurement, like the use of GPS falsifier apps or device sharing among participants. It seems advisable to collect this kind of information either through a survey among participants or where feasible directly by passive data collection from the smartphone (e.g., collect information on all apps installed). For shared devices, using machine learning algorithms might be another strategy to identify who used the device at which time.
Despite being a first comprehensive step to understand missingness in geolocation data collected by smartphones, our study left several questions unanswered and raised some new ones. A deeper understanding of the effects of doze modes related to smartphone use behavior will require more collaboration between computer scientists and social scientists. Such collaboration is generally encouraged as we move forward and technology changes (quickly). Here we already saw the effects of more recent OS on the occurrence of missing data. We highly recommend future studies to work with technology experts to ensure sparse battery consumption. Further research is needed to explore a suitable balance of data collection frequency and device performance.
Our study is longitudinal, and further analyses need to be done to understand the mechanisms leading to gaps in measurement through attrition. We cannot rule out that attrition is unrelated to our measurement of interest. It will be interesting to investigate how attrition relates to unit nonresponse, and if the potential biasing effect of unit nonresponse gets amplified or reduced.
GPS data will continue to be of importance for research in the social sciences. They can help us understand mobility patterns, commuting behavior, or the use of different means of transportation. By combining geolocation data with open data about the locations visited, we can reconstruct day structures and infer about social participation. Connecting short surveys to geolocations provides opportunities for situation-specific measurements. Such short surveys do not need to be limited to customer satisfaction surveys (where we observe most applications until now) but could be used for research on interventions (like training programs or consulting meetings) where questions can be asked right after the location of the meeting is left (thus minimizing recall error) or for research on the effect of activities on happiness.
Footnotes
Appendix
Descriptive Statistics for Measurement-Level Variables of the Multivariate Analysis Sample.
| Measurements | Mean | SD | Median | Min | Max | ||
|---|---|---|---|---|---|---|---|
| Dependent variables | Dependent variables | ||||||
| (1) Device turned off–Occ. | 1,041,598 | 0.01 | 0.10 | 0 | 0 | 1 | |
| (1) Device turned off–Extent | 10,444 | 39.49 | 174.10 | 13 | 1 | 6,660 | |
| (2) No meas. at all–Occ. | 1,273,172 | 0.19 | 0.39 | 0 | 0 | 1 | |
| (2) No meas. at all–Extent | 242,018 | 6.03 | 32.29 | 2 | 1 | 8,506 | |
| (3) No geolocation meas.–Occ. | 1,037,827 | 0.01 | 0.08 | 0 | 0 | 1 | |
| (3) No geolocation meas.–Extent | 6,673 | 5.83 | 30.03 | 1 | 1 | 2,089 | |
| (4) Geolocation failed–Occ. | 1,290,289 | 0.14 | 0.35 | 0 | 0 | 1 | |
| Data permissions | Data permissions | ||||||
| Location | 1,290,289 | 0.94 | 0.24 | 1 | 0 | 1 | |
| Activity tracking | 1,290,289 | 0.92 | 0.27 | 1 | 0 | 1 | |
| App usage | 1,290,289 | 0.85 | 0.35 | 1 | 0 | 1 | |
| Contacts | 1,290,289 | 0.94 | 0.24 | 1 | 0 | 1 | |
| Digital test | 1,290,289 | 0.94 | 0.24 | 1 | 0 | 1 | |
| Interactions | 1,290,289 | 0.92 | 0.28 | 1 | 0 | 1 | |
| Phone | 1,290,289 | 0.94 | 0.24 | 1 | 0 | 1 | |
| Smartphone usage | 1,290,289 | 0.85 | 0.36 | 1 | 0 | 1 | |
| SMS | 1,290,289 | 0.94 | 0.24 | 1 | 0 | 1 | |
| Social contacts | 1,290,289 | 0.91 | 0.29 | 1 | 0 | 1 | |
| Device hardware | Device manufacturer | ||||||
| HTC | 1,290,289 | 0.03 | 0.16 | 0 | 0 | 1 | |
| Huawei | 1,290,289 | 0.14 | 0.35 | 0 | 0 | 1 | |
| LG | 1,290,289 | 0.04 | 0.21 | 0 | 0 | 1 | |
| Motorola | 1,290,289 | 0.02 | 0.15 | 0 | 0 | 1 | |
| Other | 1,290,289 | 0.06 | 0.24 | 0 | 0 | 1 | |
| Samsung | 1,290,289 | 0.59 | 0.49 | 1 | 0 | 1 | |
| Sony | 1,290,289 | 0.12 | 0.32 | 0 | 0 | 1 | |
| Android OS version | |||||||
| 4 | 1,290,289 | 0.01 | 0.09 | 0 | 0 | 1 | |
| 5 | 1,290,289 | 0.06 | 0.24 | 0 | 0 | 1 | |
| 6 | 1,290,289 | 0.20 | 0.40 | 0 | 0 | 1 | |
| 7 | 1,290,289 | 0.48 | 0.50 | 0 | 0 | 1 | |
| 8 | 1,290,289 | 0.25 | 0.43 | 0 | 0 | 1 | |
| Device number of CPU cores | 1,290,289 | 5.87 | 1.97 | 6 | 1 | 10 | |
| Device RAM | 1,290,289 | 3.07 | 1.03 | 3 | 1 | 8 | |
| Device state | Geodata collection temp. revoked a | 1,290,289 | 0.00 | 0.00 | 0 | 0 | 1 |
| App temp. uninstalled a | 1,290,289 | 0.00 | 0.00 | 0 | 0 | 1 | |
| Task killer/manager app active a | 1,290,289 | 0.00 | 0.00 | 0 | 0 | 1 | |
| Power saving mode | 1,279,514 | 0.06 | 0.24 | 0 | 0 | 1 | |
| Display state | |||||||
| Doze | 1,240,417 | 0.02 | 0.14 | 0 | 0 | 1 | |
| Doze suspend | 1,240,417 | 0.06 | 0.23 | 0 | 0 | 1 | |
| Display off | 1,240,417 | 0.69 | 0.46 | 1 | 0 | 1 | |
| Display on | 1,240,417 | 0.23 | 0.42 | 0 | 0 | 1 | |
| Unknown | 1,240,417 | 0.01 | 0.09 | 0 | 0 | 1 | |
| Battery status | |||||||
| Charging | 1,266,790 | 0.13 | 0.33 | 0 | 0 | 1 | |
| Discharging | 1,266,790 | 0.63 | 0.48 | 1 | 0 | 1 | |
| Full | 1,266,790 | 0.19 | 0.39 | 0 | 0 | 1 | |
| Not charging | 1,266,790 | 0.06 | 0.23 | 0 | 0 | 1 | |
| Battery level, categories | |||||||
| 0%–20% | 1,246,090 | 0.03 | 0.17 | 0 | 0 | 1 | |
| 21%–40% | 1,246,090 | 0.11 | 0.31 | 0 | 0 | 1 | |
| 41%–60% | 1,246,090 | 0.18 | 0.38 | 0 | 0 | 1 | |
| 61%–80% | 1,246,090 | 0.22 | 0.41 | 0 | 0 | 1 | |
| 81%–100% | 1,246,090 | 0.46 | 0.50 | 0 | 0 | 1 | |
| Battery level | 1,037,827 | 73.79 | 24.71 | 79 | 0 | 100 | |
| Spatial and temporal context | Mobile network outside Germany | 1,037,827 | 0.02 | 0.15 | 0 | 0 | 1 |
| Location outside Germany | 1,112,005 | 2.11 | 3.80 | 0 | 0 | 9 | |
| Location provider | |||||||
| Fused | 1,290,289 | 0.02 | 0.16 | 0 | 0 | 1 | |
| GPS | 1,290,289 | 0.05 | 0.23 | 0 | 0 | 1 | |
| Network | 1,290,289 | 0.48 | 0.50 | 0 | 0 | 1 | |
| Cell tower database | 1,290,289 | 0.14 | 0.35 | 0 | 0 | 1 | |
| Not available | 1,290,289 | 0.11 | 0.31 | 0 | 0 | 1 | |
| Time weekend (Sat., Sun.) | 1,290,289 | 0.28 | 0.45 | 0 | 0 | 1 | |
| Time part of the day | |||||||
| 00:00–05:59 | 1,290,289 | 0.23 | 0.42 | 0 | 0 | 1 | |
| 06:00–11:59 | 1,290,289 | 0.25 | 0.43 | 0 | 0 | 1 | |
| 12:00–17:59 | 1,290,289 | 0.25 | 0.44 | 0 | 0 | 1 | |
| 18:00–23:59 | 1,290,289 | 0.26 | 0.44 | 0 | 0 | 1 | |
a These behaviors each make up less than .002% of all geolocation measurements.
Data Availability
Software Information
For all analyses, author-originated code under Stata Version 15.1 was used. The code is available at the Institute for Employment Research (IAB) and will be delivered together with data access (see Section Data Availability).
Declaration of Conflicting Interests
The authors declared no potential conflicts of interest with respect to the research, authorship, and/or publication of this article.
Funding
The authors disclosed receipt of the following financial support for the research, authorship, and/or publication of this article: Georg-Christoph Haas’ time was supported by the German Research Foundation (DFG) through the Collaborative Research Center SFB 884 “Political Economy of Reforms” (Project A9) [139943784 to Markus Frölich, Florian Keusch, and Frauke Kreuter].