
Abstract
The new European General Data Protection Regulation (GDPR) imposes enhanced requirements on digital data collection. This article reports from a 2018 German nationwide population-based probability app study in which participants were asked through a GDPR compliant consent process to share a series of digital trace data, including geolocation, accelerometer data, phone and text messaging logs, app usage, and access to their address books. With about 4,300 invitees and about 650 participants, we demonstrate (1) people were just as willing to share such extensive digital trace data as they were in studies with far more limited requests; (2) despite being provided more decision-related information, participants hardly differentiated between the different data requests made; and (3) once participants gave consent, they did not tend to revoke it. We also show (4) evidence for a widely-held belief that explanations regarding data collection and data usage are often not read carefully, at least not within the app itself, indicating the need for research and user experience improvement to adequately inform and protect participants. We close with suggestions to the field for creating a seal of approval from professional organizations to help the research community promote the safe use of data.
This article is part of the SSCR special issue on Integrating Survey Data and Digital Trace Data guest edited by Sebastian Stier, Johannes Breuer, Pascal Siegers (GESIS – Leibniz Institute for the Social Sciences) & Kjerstin Thorson (Michigan State University).
Background
As smartphone adoption has exploded, fundamentally transforming our lives, social scientists have been eager to make use of the treasure trove of data these smartphones provide. The passive collection of behavioral data through digital devices not only provides the possibility to reduce burden by reducing questions that would otherwise need to be asked in surveys but also opens possibilities for entirely new measurements (Link et al., 2014).
New Forms of Measurement
Good examples of studies in which passive measurements via digital devices can enrich social science data collection are those studies which traditionally used observations for data collection. For example, in the landmark “Marienthal Study,” where Jahoda, Lazersfeld, and Zeisel (1971) observed and recorded activities in an Austrian small town after a massive layoff, field workers were deployed and measured the residents’ walking speed in key parts of town. Because such in-person observations did not scale, such data collections have not taken off and instead surveys were used to report on behavior (Warr, 1987). Today, activities can be measured passively through mobile devices that can capture geolocation and have accelerometer sensors (for an overview, see Link et al., 2014; for a use case example, see Sugie, 2018). 1
In other examples, studies interested in the effects of long-term unemployment and labor market (re-)integration ask respondents to report on their social network and the frequency of interaction with members of their network (e.g., Atkinson, Liem, & Liem, 1986; Eisenberg & Lazarsfeld, 1938; Kelvin & Jarret, 1985; Sprengers & Tazelaar, 1988). Unfortunately, methodological work has shown these questions suffer from interviewer- and respondent-induced measurement error. In order to reduce the amount of follow-up questions (Tourangeau, Kreuter, & Eckman, 2012), interviewers and respondents might be tempted to report smaller networks with fewer interactions (empirical examples shown by Brüderl, Huyer-May, & Schmiedeberg, 2013; Josten & Trappmann, 2016). Similarly, behavioral recall questions are at risk of measurement error when frequent and not particularly distinct behaviors are asked for (e.g., Boase & Ling 2013; Eckman et al., 2014).
It is therefore not surprising that the passive collection of social interaction is appealing. Smartphones have become a common tool of daily life, fulfilling several uses, such as social interaction, job search, dating, and entertainment (Rainie & Perrin, 2017), as smartphone adoption increased to 46–80% in Western nations, with 77% in United States and 66% in Germany, respectively (Poushter, 2017). Besides social interactions, social network size and activity are of great interest. A research app capable of reading the address book and recording interactions made with each member in the address book can shed light not only on interactions but also on network size (Sugie, 2018).
While these use cases are compelling, they illustrate practical challenges during the “onboarding process,” the step between participant recruitment and the continuing data collection after successful installation of the research app. In the European context, there are explicit General Data Protection Regulation (GDPR) requirements (see Online Appendix) that add to these challenges: collecting explicit and recordable consent agreements and the persistent provision of data; all within a GDPR regime that provides participants the opportunity to turn off data transmission.
Participation in Smartphone Studies
Not many studies exist that contain good assessments of how large the participation rate in smartphone studies with passive data collection might be. Studies focusing on the hypothetical willingness to participate in a smartphone study indicate that the willingness to participate using an app that passively collects data is lower than the willingness to use an app to actively engage with the researcher (e.g., via short questionnaires, diaries, or pictures). For example, Couper, Antoun, and Mavletova (2017) reviewed several studies asking respondents about their willingness to comply with special requests using mobile devices, such as sharing Global Positioning System (GPS) location or taking photos at the end of a survey, and found consent rates between 5% and 67%. Revilla, Toninelli, Ochoa, and Loewe (2016) demonstrated that hypothetical willingness to engage in additional research-related tasks on smartphones was in general quite low among members of seven nonprobability online panels in Spanish- and Portuguese-speaking countries, but varied by task. In a follow-up study in Spain, Revilla, Couper, and Ochoa (2019) found that only 20% of surveyed panel members reported being willing to share GPS information on their smartphone and less than 18% would be willing to install an app that tracks information about websites visited. Similarly, Wenz, Jäckle, and Couper (2017) reported that willingness differs by hypothetical task in the Understanding Society Innovation Panel (IP). Among IP panelists who used smartphones, 65% said they would be willing to take photos or scan bar codes, 61% said they would use the built-in accelerometer to record physical movements, 39% said they would share GPS location, and 28% said they would download a tracking app that collects anonymous data about phone usage. The vignette study conducted by Keusch, Antoun, Couper, Kreuter, and Struminskaya (2019) suggests higher willingness in university-sponsored studies compared to studies conducted by government agencies or studies where participants are given control over when they are sharing data with the researchers.
The Understanding Society IP later asked participants to download an app to take pictures of receipts, of which 16.5% of their eligible panel members agreed and approximately 13% installed the app and took at least one picture (Jäckle, Burton, Couper, & Lessof, 2017). The Longitudinal Internet Studies for the Social Sciences (LISS) Mobile Mobility study in the Netherlands achieved a 19% participation rate among a random subsample of LISS panel members for a time use survey app that passively collected information about geolocation and movements of users (Scherpenzeel, 2017). Given these moderate consent rates, the added requests for data sharing can cause considerable concern. It is unknown at this point if multiple data collection request for a variety of sensitive data would create even lower participation rates.
We first report on the IAB-SMART app study and its design, before detailing the measurements and requested digital trace data in order to answer the following questions:
to what extent people from the general population are willing to participate in extensive digital trace data collection; do participants differentiate between the types of data they provide; will participants continuously provide data; and can we reasonably argue that the provision of data was fully informed.
Study Design
The author team developed the IAB-SMART app together with the telecommunications consulting firm P3 insight GmbH (http://www.p3-group.com/en/about-us/executive-board/p3-insight-gmbh/). The purpose of the app is to measure the effects of long-term unemployment on social integration and social activity, as well as the inhibiting effects of reduced social networks and activities in finding reentry into the labor market. To do so, the app needs extensive access to sensor and activity data on the smartphone. Currently, the iOS operating system does not allow such extensive access to third-party apps, and operating systems other than Android do not have enough market penetration in Germany to justify the cost of developing the app for additional systems. Therefore, a decision was made to focus on the Android operating system. Such focus on Android is common for smartphone studies, usually for similar cost reasons (Church, Ferreira, Banovic, & Lyons, 2015).
Sample
Participants for the IAB-SMART app study were recruited from the panel study “Labour Market and Social Security” (PASS). PASS is an annual household panel survey of the German residential population aged 15 and up, with an oversample of welfare benefit recipients (Trappmann, Beste, Bethmann, & Müller, 2013). PASS is conducted in a sequential mixed-mode design, combining computer-aided personal and telephone interviews. The initial PASS sample consisted of an address-based sample of the German general population and a welfare benefit recipients sample from national registers. The latter is supplemented every year by a sample of new benefit receipients (Trappmann, Müller, & Bethmann, 2013). Initial wave response rates have ranged from 25% to 35% ([AAPOR RR1] American Association for Public Opinion Research, 2016). Annual attrition rates range between 15% and 20% (compare the annual PASS methods and data reports available at https://fdz.iab.de/de/FDZ_Individual_Data/PASS.aspx). In spite of the relatively low response rates, several articles utilizing high-quality administrative data have shown that nonresponse bias is rather small for a range of variables such as benefit receipt, employment status, income, age, or disability (Kreuter, Müller, & Trappmann, 2010; Levenstein, 2010; Sakshaug & Kreuter, 2012). Foreign nationals have found to be considerably underrepresented (Kreuter et al., 2010), but weighting can adjust for this.
Due to the oversampling of welfare benefit recipients, respondents to PASS Wave 11 are, before weights are applied, more likely to receive those benefits than the general population (30.0% compared to 6.3%), but also more likely to be aged 55–64 (20.5% vs. 16.1%) and to live in eastern Germany (26.7% vs. 19.7%). In spite of the oversampling of—on average lower educated—benefit recipients, the distribution of educational degrees is very similar between PASS and the general population, due to a compensating nonresponse effect.
All PASS respondents who reported having an Android smartphone in Wave 11 (fielded in 2017) were eligible for the IAB-SMART study. Although smartphone owners are younger, more educated, and more likely to live in larger communities than non-smartphone owners, little coverage bias in substantial PASS variables exist due to smartphone ownership. This holds true even when limiting the sample to Android smartphone owners only (Keusch, Bähr, Haas, Kreuter, & Trappmann, 2018a).
Invitation
In January 2018, a total of 4,293 postal invitations were sent to a random sample of PASS participants who own an Android smartphone. In order to monitor return and gauge how many invitations would need to be sent out to achieve a target of 500 participants, we sent invitations in two separate installments. The first installment consisted of 1,074 invitations, the second of 3,219. Adaptations to the mailings were made after the first installment. Participants were invited to join the study for six months of data collection. The invitation package sent in both installments contained a cover letter, information on data privacy, a description of the app functions, and an explanation regarding the incentives. The cover letter explained the goals of the study and how to find the app in the Google Play Store. It included a direct download link and a Quick Response code. The note had a unique registration code for each participant. After 11 days, a reminder mailing was sent, including an installation brochure, which walked users through the downloading and registration process step-by-step. In the second installment, the installation brochure was added to the first mailing (see Online Appendix Table A1 for a full list of documents). 2
The information on data privacy covered all privacy issues associated with downloading and using the app. A separate document detailed the description of functions responsible for the passive data collection to make them stand out more (for wording, see Online Appendix Table D1). Additionally, we provided a frequently asked questions menu which was linked to within the app (www.iab.de/iab-smart).
As explained in a separate document, participants received incentives in form of points for each of the following activities: downloading the app, answering survey questions, and activating passive data collection functions for 30 days at a time (within the 6-month long study). We varied the incentive amounts, though none of the experimental conditions showed any notable difference across those conditions (Haas, Kreuter, Keusch, Trappmann, & Bähr, 2018). In what follows we will only present overall results.
Measurements
The IAB-SMART app collected data in two ways: (1) through short surveys pushed by the app at predefined times (maximum 10 questions), and (2) through passive mobile measurement using sensors on the smartphone. Eleven different survey modules were fielded throughout, covering various job search activities, as well as smartphone usage and demographics, including a request to link the app study data to administrative data available within the German labor market agency. One module was triggered when participants spent more than 30 minutes in predefined geofences corresponding to 400 local job centers where welfare benefit recipients meet with their placement officers (only if consent was given for the geolocation to be tracked).
Passive measurements
Five sets of passive data collection packages were programmed into the IAB-SMART app: (1) mobile phone network quality and location information, (2) interaction history, (3) characteristics of the social network, (4) activity data, and (5) smartphone usage (see Online Appendix Table C1).
Mobile phone network quality and location information were collected every half hour together with information on network providers and network technology, to examine questions regarding digital infrastructure and the labor market.
Interaction history: This function collects participants’ incoming and outgoing call and text message logs (i.e., time stamps, hashed numbers, not the content of text messages or phone calls). Hashing of all phone numbers ensures privacy protection for any third party with which the participant is interacting.
3
Characteristics of the social network: To analyze the composition of the smartphone owner’s social network, information is collected regarding gender and nationality of the phonebook entries by matching the first name of each contact with information from the website Genderize (https://api.genderize.io) and first and last names with information from the website NamePrism (www.name-prism.com). In neither case were data transmitted to the outside websites. Simply the ping results were saved and transmitted as classification probabilities together with the hashed names.
Activity data: This data package contains data from built-in sensors (accelerometer and pedometer) and will be used to create measures of means of transportation (e.g., walking, biking, in a motorized vehicle) and periods of activity.
Smartphone usage: This data package contains information on apps installed on the participant’s smartphone and the frequency of their usage (measured as beginning and end of an app being in the front of the phone screen, when the phone is active). No information is collected on what is done within the app.
Consent Process
For the IAB-SMART app study, we requested the informed consent within the onboarding process. We refer to the onboarding process as the steps needed to completely install the app. This means not only pressing install and accepting Google permissions but also setting all options in the correct user specified way.
There is a prespecified way any app is installed on an Android phone. Upon downloading the app, a screen appears indicating all data the app will require access to. Those permissions must be granted before an app can be installed. Exceptions are dynamic permissions, which were not used in this study to ensure compatibility with most Android versions.
Figure 1 shows the permissions requested by the IAB-SMART app. Developers cannot modify the standard Google permissions screen or modify the explanations given why those data need to be accessed or how they are used. The inability to add explanations regarding the exact scope and nature of the data collection led us to include a separate additional consent step. This decision was made together with the Federal Employment Agency’s legal counsel, since they were concerned that information provided in the invitation letter might (a) not be read and (b) leave no trace of the intvitee seeing or reading the explanation. Through adding the extra consent step within the app, we align with the GDPR's demand for transparency (Art. 5 para. 1a and distinguishing of consent from other matters Art. 7 para. 1). Furthermore, the default Google permissions is an all or nothing choice. The individual either accepts all permissions and can participate or does not accept any permissions and cannot participate. 4 This approach contradicts GDPR recital 33: “Data subjects should have the opportunity to give their consent only to areas of research or parts of research projects to the extent allowed by the intended purpose.” With our second level of consent requests, individuals can decide to which data collection or research project they are willing to contribute. Equally important, participants can withdraw their consent at any time in the setting menu of the app, which aligns with the GDPR requirement (GDPR Art. 7, para. 3). A final reason to not rely on the Google permissions but on the two-step consent procedure is that Google permissions are packages that would have allowed us to collect more data than needed. We explained this two-step procedure to the participants in the installation guide.
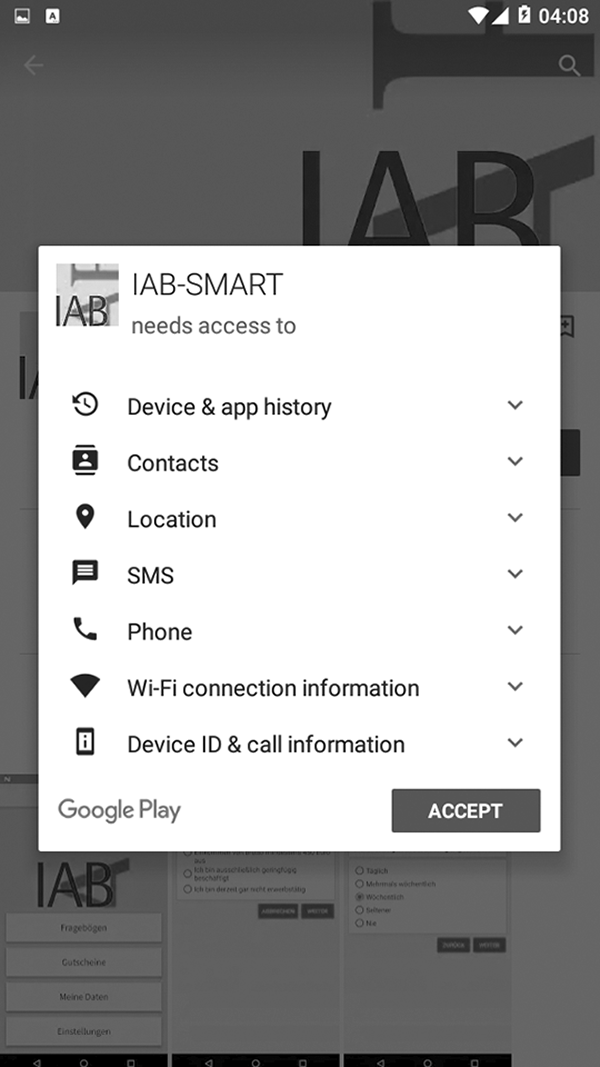
IAB-SMART app—Google Play Store consent settings.
The additional IAB-SMART app onboarding screens are displayed in Online Appendix Table B1 including a translation into English. Immediately after downloading the app from the Google Play Store and opening the app for the first time, and prior to consenting to the individual IAB-SMART app data packages, participants were asked to consent to the linking of their data with data from the PASS survey. This step was mandatory for participation in the study.
After participants typed in their unique registration code, the app displayed the general privacy note. The participants had already received a written version of the same text in the invitation letter. Without the participants acceptance of the general privacy notice, we were not able to process any data from the app. Only consenting participants were able to continue with the installation/onboarding process. Participants also had to actively consent to the terms of service.
The next screen showed the consent requests for the five data packages: (a) network quality and location information, (b) interaction history, (c) characteristics of the social network, (d) activity data, and (e) smartphone usage. With a click on an individual function, a short description (37–112 words) unfolded to explain to subjects which data this function (if activated) enabled the app to collect, as well as the general research purposes the data are used for (see Online Appendix Table D1 for the full description provided to the participants in the invitation letter and on the study’s website). Having the explanations behind a foldout tab allowed us to fit all consent requests on one screen and avoid scrolling. Also, participants could focus their reading on packages of particular interest to them without filling their screen and losing orientation through up and down scrolling. An ideal typical progression would be to open one description text at a time, record the decision to activate this function (or not), close the description, and go on to the next function.
At the point of entry to the screen, all boxes indicating consent were empty. In order to provide consent, the participants had to actively check a box so a check mark appears. For the fifth data package (smartphone usage), after activating the function on the app screen, participants had to move to the phone’s native menu and change settings to allow access—an additional hurdle that we anticipated would have an effect on consent rates.
Because GDPR requires adding possibilities to reverse any prior data collection consent at any time (Art. 7 para. 3 and Figure A1 in the Online Appendix), we provided a list of all functions and the option to view their description within the app settings. Participants were able to deactivate or to activate functions at any time during the data collection process. 5 Installing the app first and being able to explore its functionality might have a trust-increasing effect. Finally, we also collected paradata within the app, such as time stamps associated with the opening and closing of certain pages or features. These will contribute to our analysis of the consent request.
Results
To which Extent are People from the General Population Willing to Agree to an Extensive Digital Trace Data Collection within a Research App?
A total of 652 of the 4,293 invited participants installed the IAB-SMART app, 6 185 invitations were undeliverable and 3 indicated no longer having a smartphone, resulting in a participation rate of 15.9%. Focusing first on the digital trace data collection activated during the onboarding screen, we found 91% of all participants to immediately consent to at least one of the five passive data collection packages. Of those not consenting immediately during the onboarding process, most took advantage of the possibility to do so later within the app settings after the installation was completed.
The willingness to activate at least one of the data functions did not differ across most of the major demographic groups (see Figure 2). The only slightly lower activation rates are visible among first-generation immigrants compared to nonimmigrants and second-generation immigrants (Diff = 1.6, χ2 = 6.7, df = 3, p = .08) and those with only primary and lower secondary education compared to people with higher educational degrees (Diff = 0.5, χ2 = 9.02, df = 2, p = .01), though these effects are small.
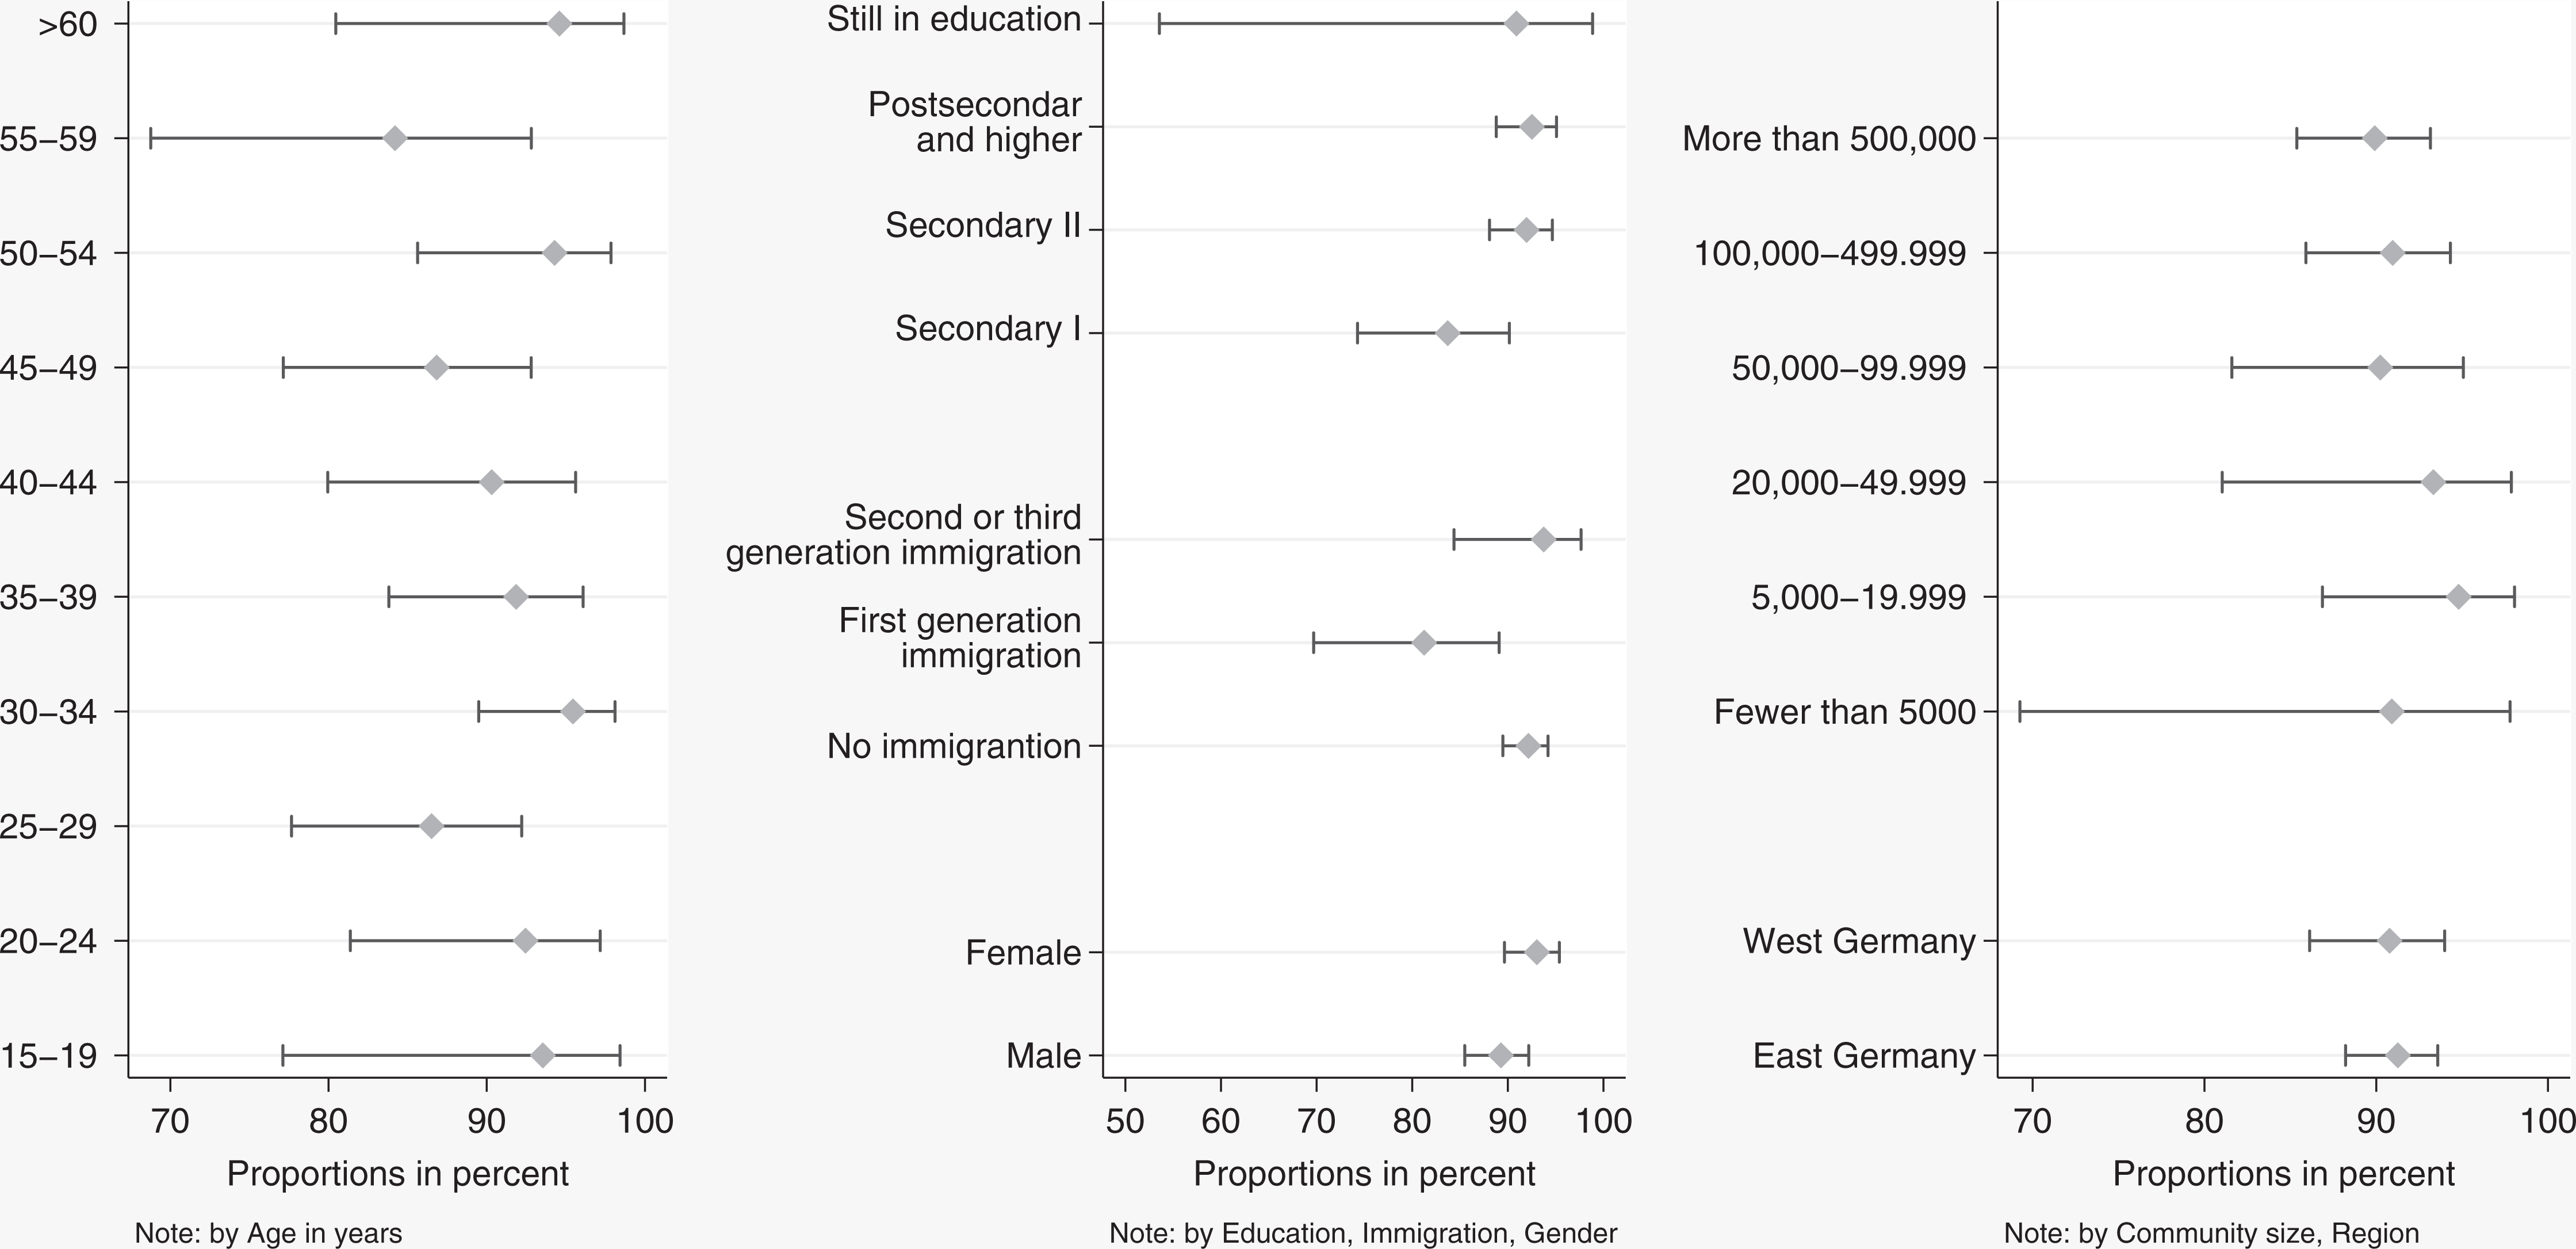
Willingness to activate at least one data function by demographic groups with 95% confidence intervals.
More than two thirds of the participants (71%) gave consent to all five functions during the installation process, about 13% consented only to four (mostly due to a reduced consent rate to the smartphone usage package, which required participants to move to the native phone settings). Looking at the time stamp paradata, we see that most participants gave consent to the packages in the order they were displayed on the screen, with 86% agreeing first to network quality and geolocation. The second package received the second highest “first consenters” with 7%.
Do Participants Differ in their Willingness to Participate in Different Digital Trace Data Collections?
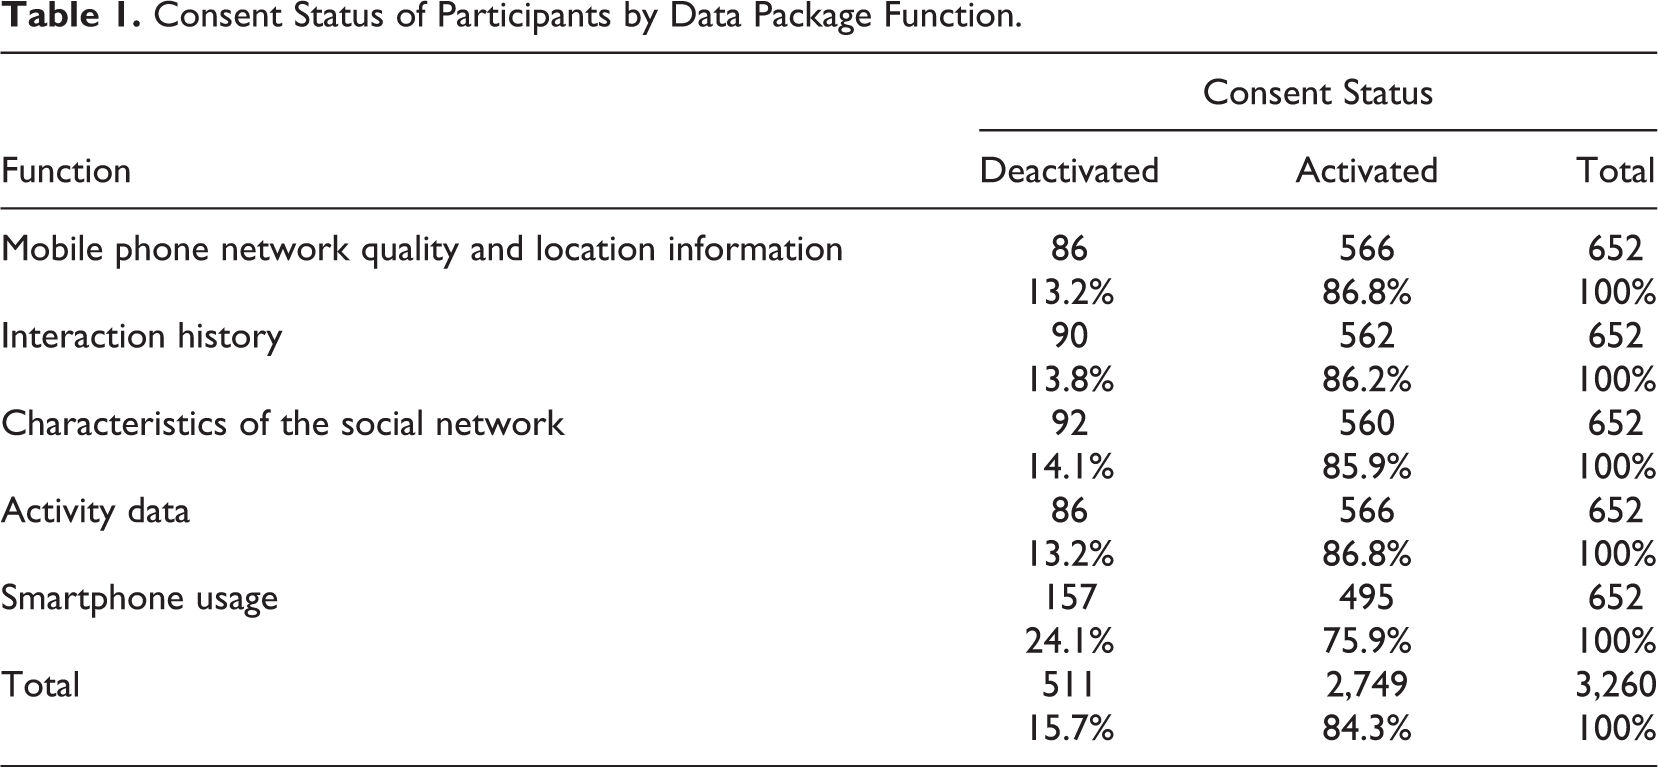
Overall, there is very little variation in the consent given to the different data collection requests. Table 1 reports the decisions each participant made after installing the app with respect to their participation in each individual digital trace data package. Activation rates are very similar for the first four data package functions ranging between 85.9% and 86.8%. The function smartphone usage is activated at a significantly (z value = −4.14, p ≤ .001) lower rate of 75.9% as it required participants to move to the native phone settings. 7
Consent Status of Participants by Data Package Function.
Do Participants Use their Ability to Revoke Consents after Previously Giving Them?
Most participants (554 of the 652; 85%) did not change their consent to provide data for a specific data collection package. For each data package, over 88% of the decisions did not change through the data collection.
Did Participants Open and Read the Explanations Provided within the App?
About 30% of the participants opened a function description before consenting to the collection of one of the five data packages. The distribution is clearly bimodal with 18% opening all five descriptions and 11% opening between one and four descriptions. Again, we see little difference in opening the explanations across demographic groups, with the exception of age. Here, we see a clear negative relationship between age groups and reading. Young participants between 15 and 20 years of age lead with 48%, whereas of those age 60 and older only 16% opened the function description (Figure 3).
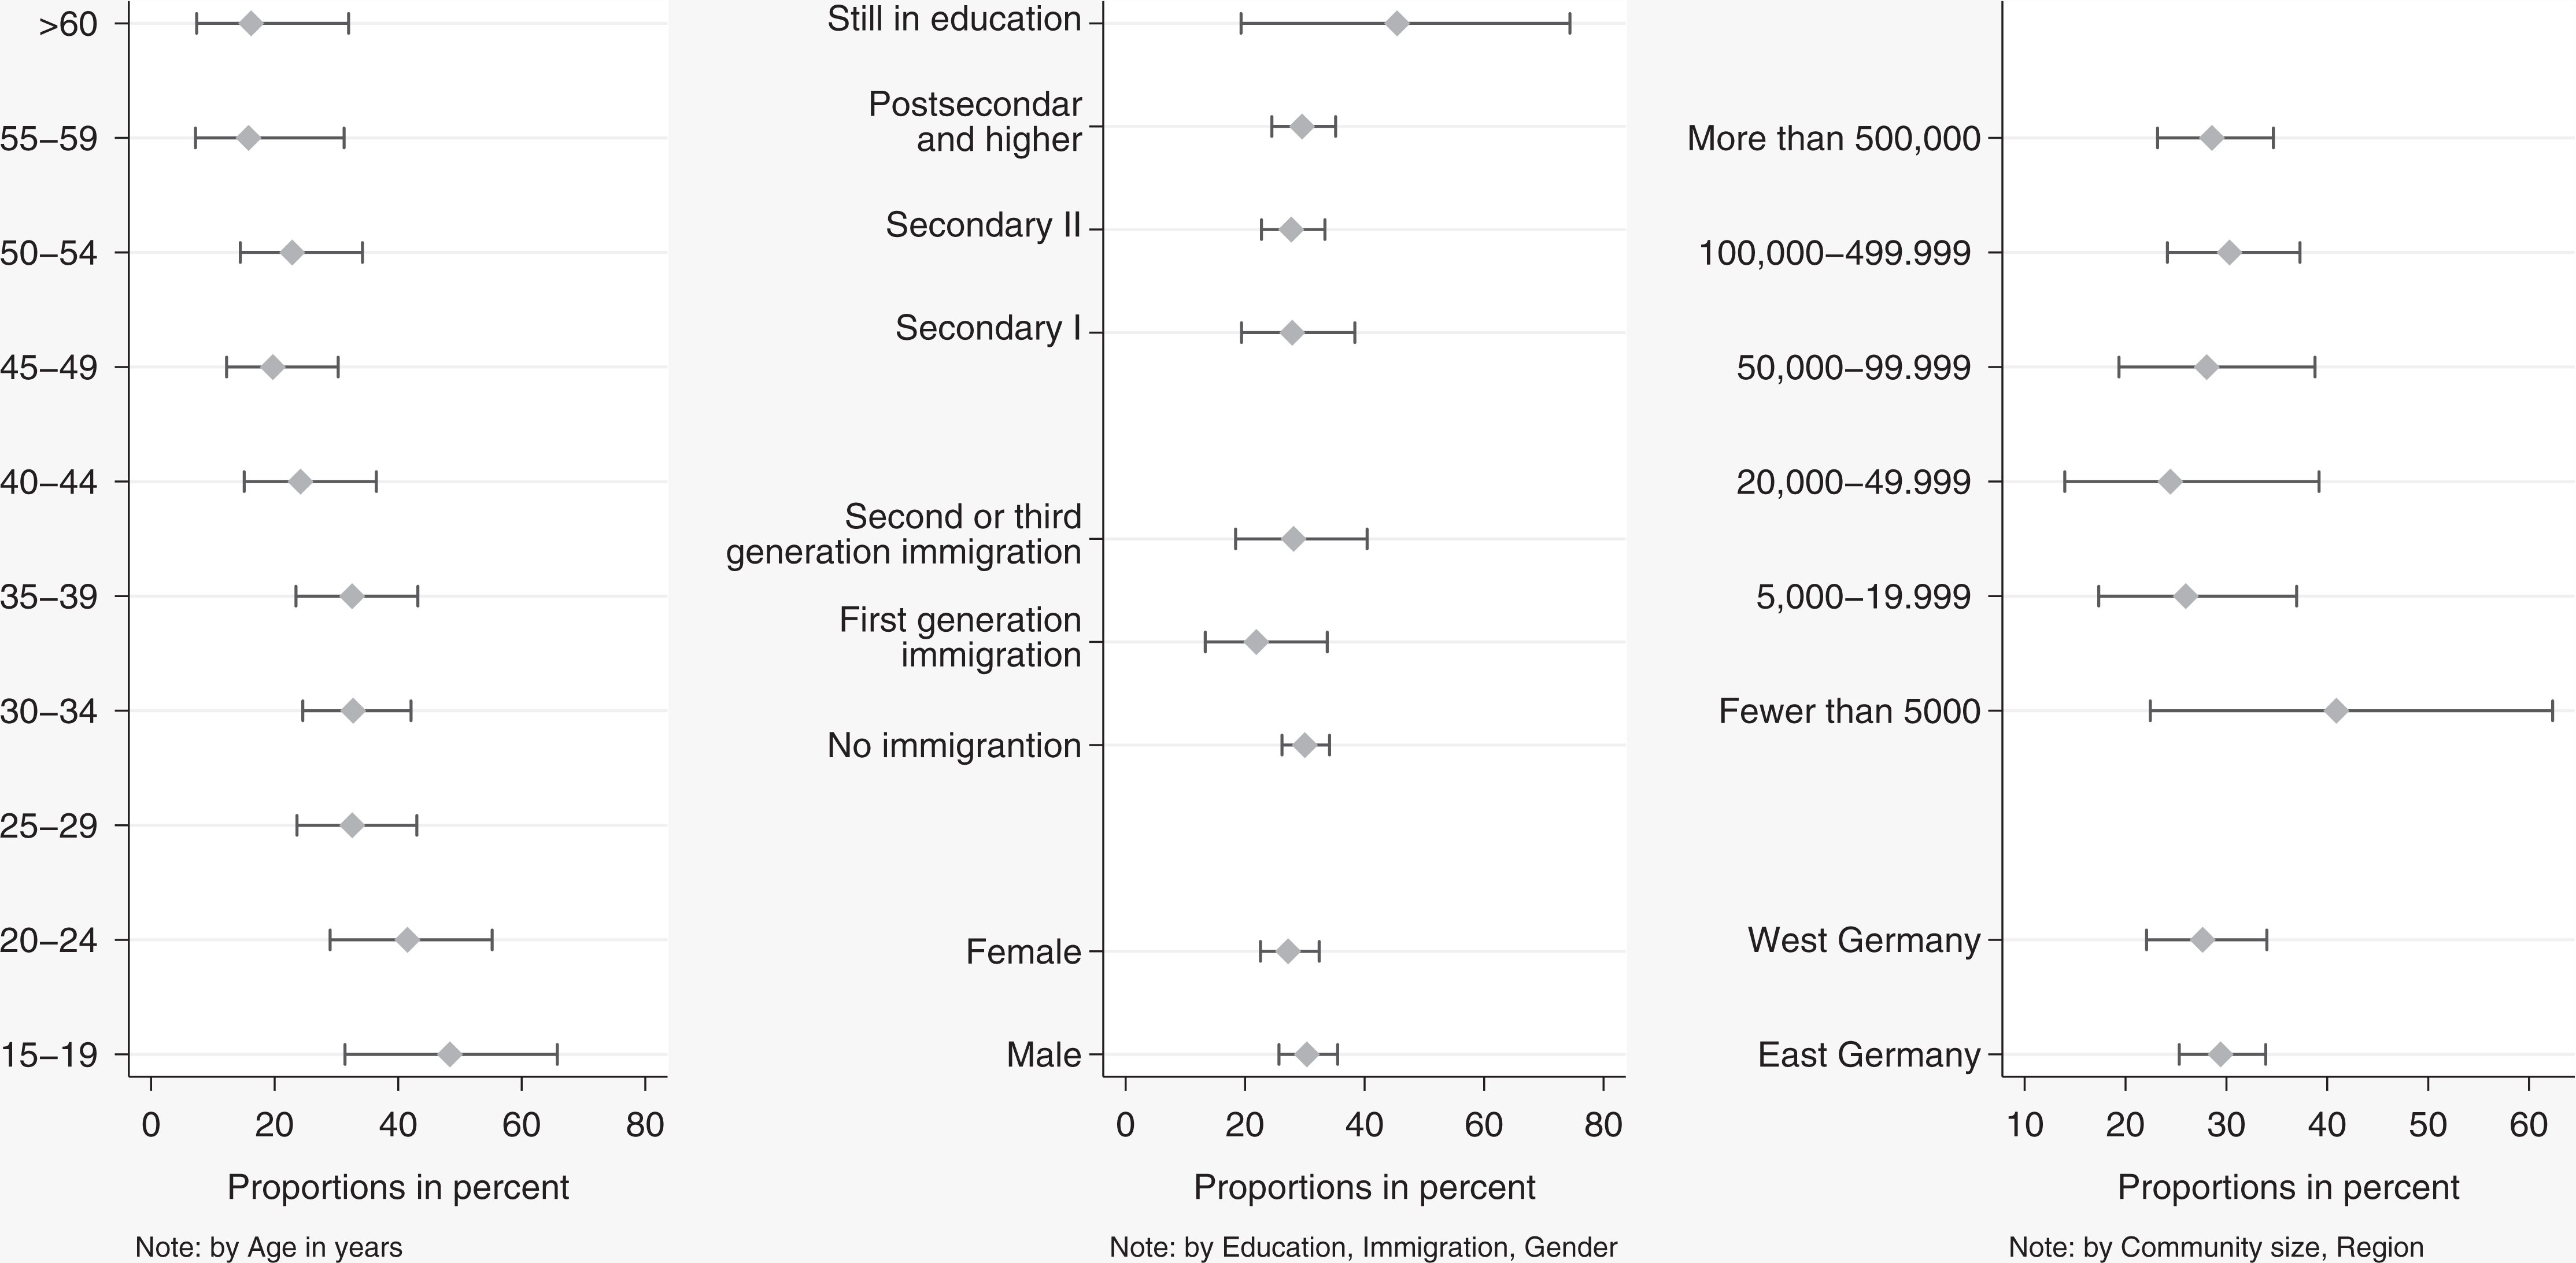
Description opened in percentage by demographic groups with 95% confidence intervals.
All function descriptions were opened at roughly the same rate, meaning each was opened by about 20% of the participants. To measure the time spent reading the opened function description, we only used those cases that opened and closed a function. For those who opened the description but then just scrolled down on the app, we have no measurement indicating when the participants stopped reading.
The time spent reading varied between 15 s on average for the activity data and 21 s for the smartphone usage data. As one would expect, there is quite a variation across participants in the times they had the descriptions open. Accounting for the number of words in the descriptions, we converted the reading times into words per minutes (wpm) and divided reading speeds into above and below 1,000 wpm. We used a conservative approach to categorize reading faster than 1,000 wpm as reading that might be too fast to capture the content except for experienced speed readers (for measures of reading speeds, see Trauzettel-Klosinski & Dietz, 2012). Table 2 shows that most of the participants who opened a description spent enough time on it that we would consider it reading. The exception to this is the first data package on network quality and location information. It was overall opened more and read by a smaller fraction than to the others.
Proportion of Participants who Opened the Description of a Data Package Function During Installation, Mean Duration Descriptions Were Open, and Reading Speed in Words per Minute (wpm) of Descriptions by Data Package Function.
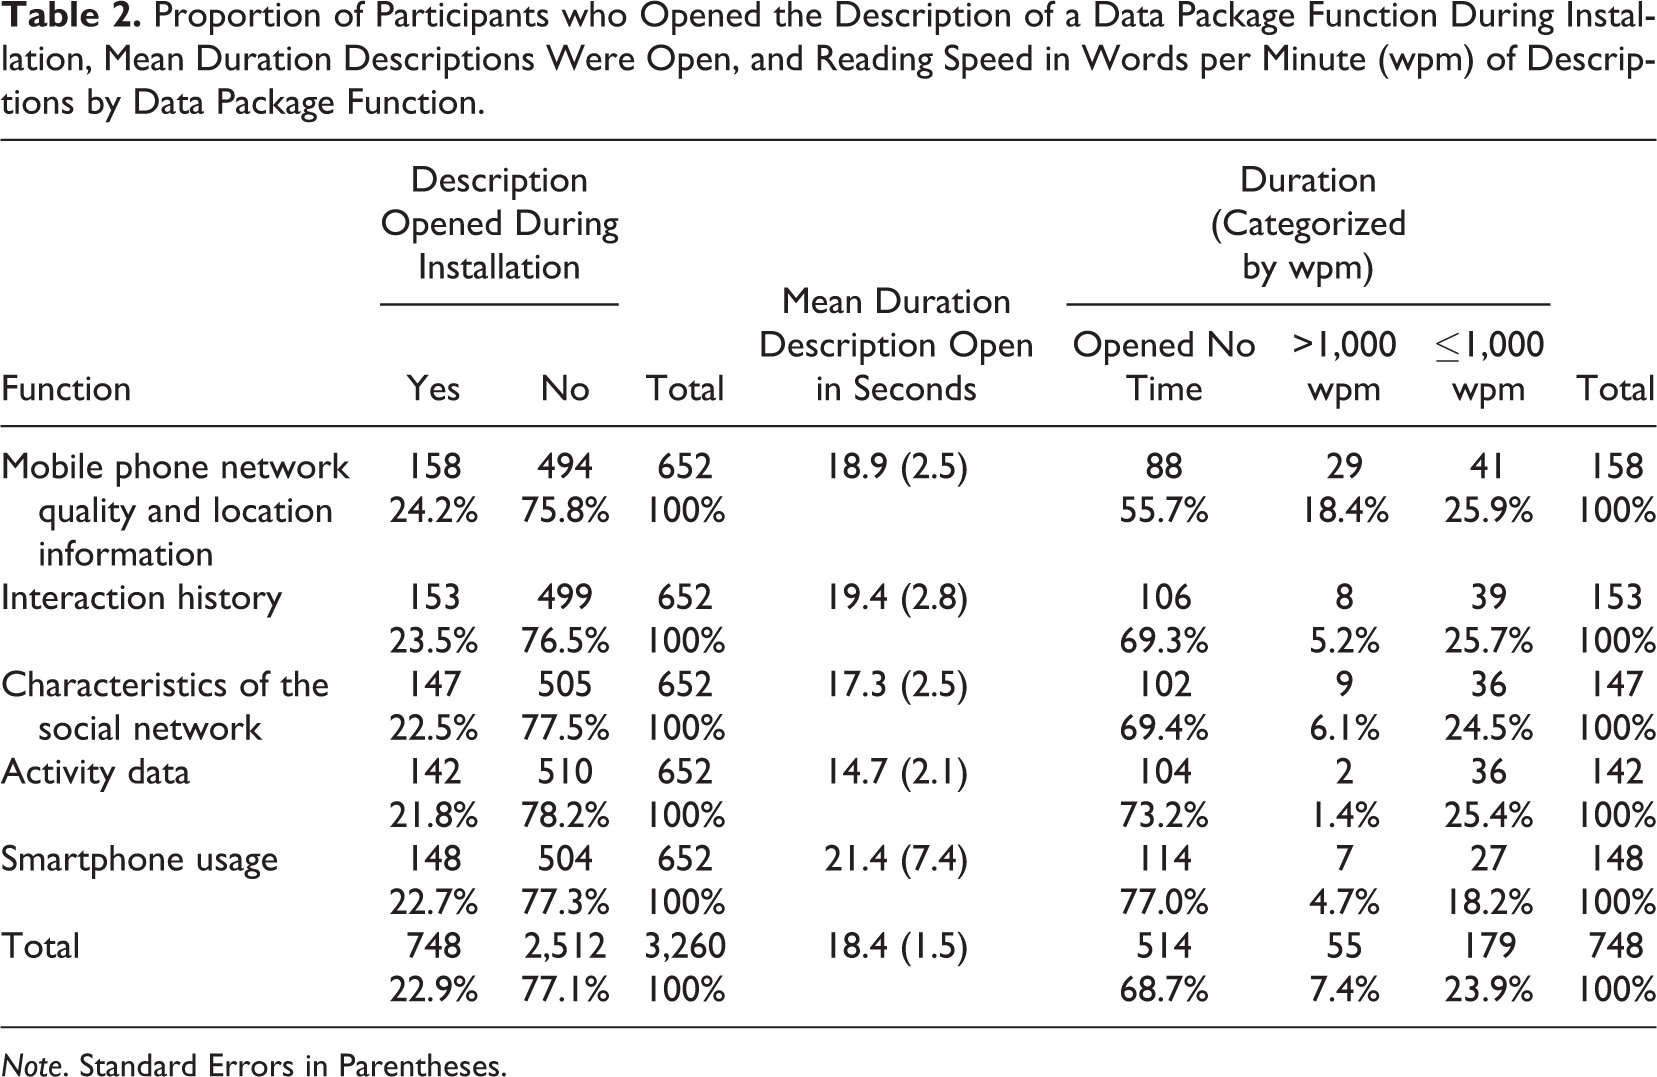
Note. Standard Errors in Parentheses.
When opening the description later within the settings of the app rather than during the installation process, participants showed a much more uniform and overall lower reading speed (see Table 3). Having opened the function description lead to slightly higher consent rates (see Table 4), with functions being active 86.5% of all times a description was opened (n = 748), and 83.7% of all times functions were not opened (n = 2,512). 8
Proportion of Participants who Opened the Description of a Data Package Function in Setting Menu, Mean Duration Descriptions Were Open, and Reading Speed in Words per Minute (wpm) of Descriptions by Data Package Function.
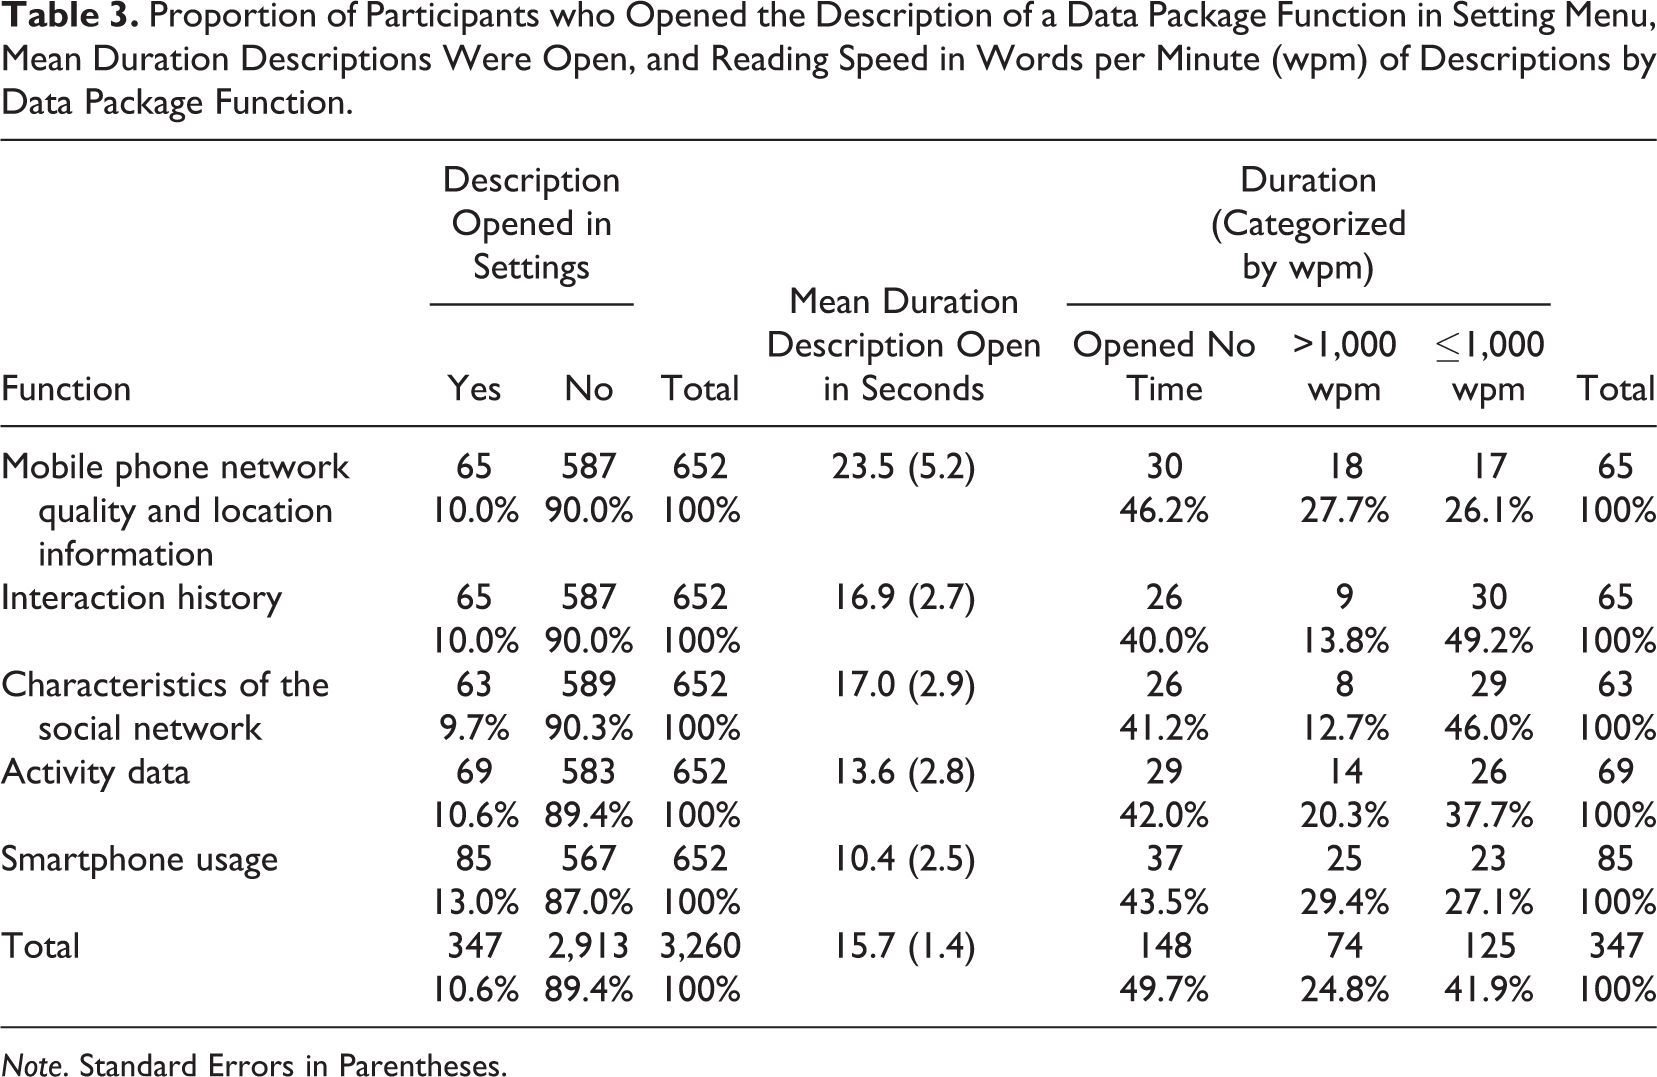
Note. Standard Errors in Parentheses.
Participants Decision to Consent to Passive Data Collection, That Is, to Activate a Data Package Function by Participant Opened the Description At Least Once or Not.
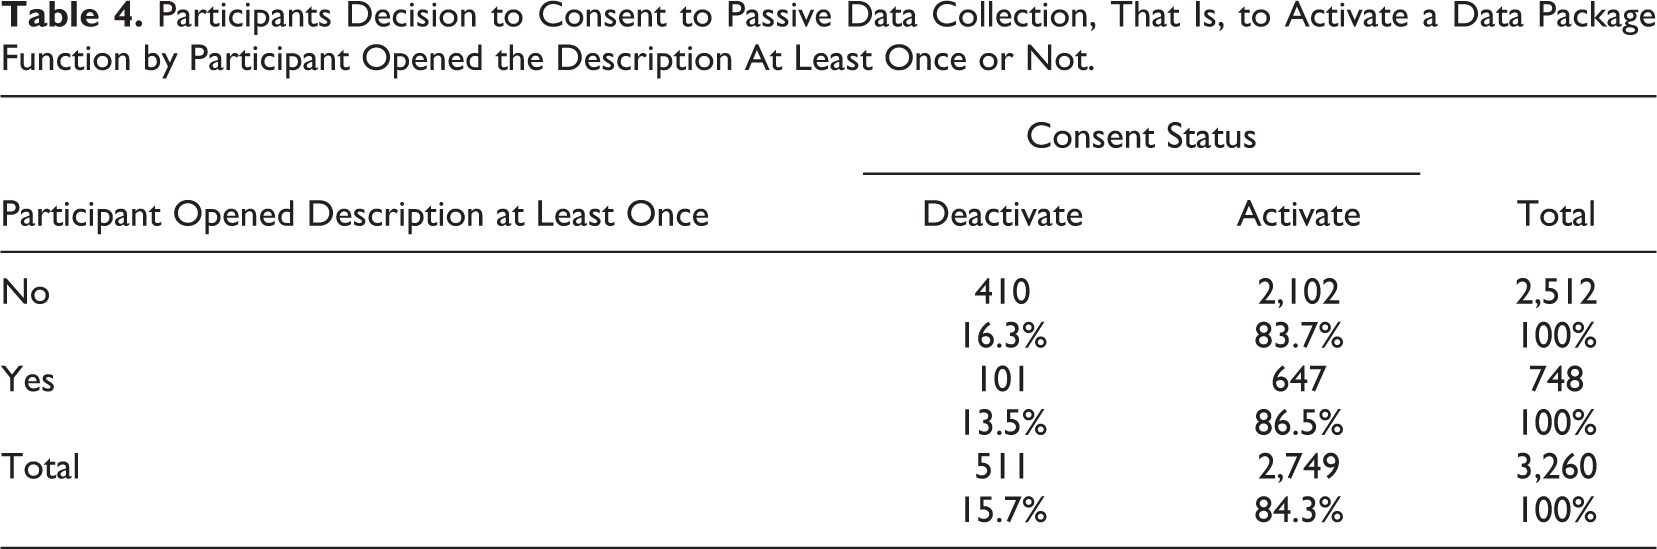
This overall pattern held across the different consent requests, though the differences between consent after opening and consent without opening are too small to call them statistically significant. Important for us is the fact that additional explanation did not discourage any participants in any systematic way—if anything transparency seems to help.
Discussion
In this study, we invited a random subset of a longitudinal probability-based panel with smartphones to join an extensive digital trace data collection. Information on mobility, the level of activity, and the mode of transportation have the potential to provide new insights into the everyday life of employed and unemployed individuals and thus can further our understanding of hitherto unobserved opportunity structures and inequalities on the labor market. Location-triggered surveys allow targeted and timely collection of information, for example, of respondents’ experience of a visit to their local job center. We measure the integration in social networks on and off the smartphone through questionnaires and the collection of phone logs and text message logs. This information will help to assess the role social networks play for labor market outcomes. By linking these smartphone data to panel survey data of the participants and their administrative labor market records at the Federal Employment Agency, the potential of these data is enhanced. It allows analyzing these new measures in conjunction with exact information on key labor market outcomes like unemployment or wages before, during, and after the data collection. The requests for sharing all the necessary passive trace data were quite extensive, including geolocation, accelerometer data, phone and text messaging logs, app usage, and access to the address book.
To participate in the research, individuals used an Android smartphone app designed explicitly for this study. Of those invited, 16% were willing to install the app, and, of those, more than 90% agreed to at least some of the extensive smartphone data collection. While a 16% installation rate seems rather low compared to the response rate of high-quality face-to-face surveys, particularly given that only respondents of a long running panel survey who had previously indicated that they own an Android smartphone had been invited, the installation rate we observed here is similar to those observed in other studies, with similar designs, but less extensive requests (see, e.g., Jäckle et al., 2017; Scherpenzeel, 2017). This is good news for social scientists interested in building complex measurements formed out of a variety of data sources collectable on the smartphone.
Any nonresponse carries the risk of nonresponse bias. Here, the rich panel data that the sample is based on allow for a detailed modeling and adjustment for a potentially selective participation process. First, analyses indicate that while differences in installation rates between groups with different income and education are in the expected direction, they are not as substantial as might have been anticipated, typically between one and three percentage points (Keusch et., 2018b).
Another highlight from our research is the consistency with which participants gave permissions for data collection over the course of the study. The GDPR requires the ability to revoke one’s permission to provide data as easily as it was given. We implemented this requirement by having a setting within the app that allowed participants, with one check mark, to activate and deactivate the data collection. Participants used this option very sparingly. The vast majority did not change any settings after initial installation. Furthermore, we provided participants with a large amount of control over which data they wanted to share and which they did not. This control is also in line with the GDPR requirements. In our study, participants rarely made use of the ability to differentiate their consent to the different data packages. These findings are encouraging for all those who take ethically aligned design seriously (see the Institute of Electrical and Electronics Engineers [IEEE] Global Initiative https://standards.ieee.org/develop/indconn/ec/ead_brochure.pdf) but currently worry about the effect on participation.
It should be noted though that our study, as well as others, recruited participants from existing panels. In our cases, this means PASS, and in other instances, this means LISS (Scherpenzeel, 2017) or the Understanding Society IP (Jäckle et al., 2017). Thus, we draw from a population of cooperative respondents who have previously agreed to provide data for research purposes, albeit in form of surveys. It is therefore likely that the rates we report here are different in the general population. However, there is no empirical evidence to date on multidimensional consent rates among a direct sample (without the preceding surveys). While there have been studies investigating overall willingness to participate in passive mobile data collections, those studies were all done through survey questions, thus subsetting the population in similar ways (Jäckle et al., 2017; Keusch et al., 2019; Revilla, Couper, & Ochoa, 2018; Wenz, Jäckle, & Couper, 2017). While our expectation is that the willingness is higher among those already part of a panel survey, it is conceivable that some members of the population are more willing to be part of a research study that only involves passive measurements (and maybe very short surveys) than spending time to engage in a lengthy phone interview or allowing someone to visit their home. Anecdotally, we received very positive feedback from the PASS participants about the IAB-SMART app as a data collection mode.
GDPR and research ethics requirements, in general, put a strong emphasis on informed consent, meaning participants need to be informed about the data collected and the purpose for which it is collected. Being informed requires active engagement and effort on the side of the participants. Thus, while we argued initially that passive measurements reduce burden, there is considerable increased cognitive burden on the side of the participants in obtaining and processing the information. Dependent on the task at hand, people are reluctant to voluntarily spend too much cognitive effort; instead, we tend to gravitate toward easy routes when making low-cost decisions (Kahneman, 2011), in this case consent. Past research on informed consent has shown varying consent rates as a function of when and how requests are presented (Kreuter, Sakshaug, & Tourangeau, 2016; Sakshaug, Wolter, & Kreuter, 2015) and raised concern that, in certain circumstances, requiring explicit consent may reduce survey participation without adequately informing survey respondents (Couper & Singer, 2013). In our study, we provided participants detailed information in multiple places (invitation package, website, and within the app). Usability tests prior to launching the study showed those explanations to be clear and understandable. Nevertheless, as expected, we found only about one third of participants read the information provided to them within the app (but we cannot measure reading of the paper material sent).
The more fundamental question of to what extent the notion of “informed” consent is achievable has been raised previously in other contexts (e.g., Barocas & Nissenbaum, 2014). Kreuter, Sakshaug, Schmucker, Couper, and Singer (2015) showcased higher nonconsent rates to data linkage between survey and administrative data when respondents to a survey did not understand the content of the linkage request. By trying to reduce survey data collection burden through passive measurements, we might impose additional burden on participants to think through and process the request. Satisficing will likely happen in the form of consenting without reading. It may be time to expand efforts like those of the AAPOR Transparency Initiative (https://www.aapor.org/Transparency_Initiative.htm) to include passive data collection, into the scope of the initiative. Furthermore, it may be necessary to join forces with organizations such as the American Statistical Association and the IEEE to jointly create a seal of approval for proper handling of individual digital trace data in a research context (similar to security seals for online banking). We hope this article will contribute as a first step into this direction.
Supplemental Material
Kreuter_Online_Supplement - Collecting Survey and Smartphone Sensor Data With an App: Opportunities and Challenges Around Privacy and Informed Consent
Kreuter_Online_Supplement for Collecting Survey and Smartphone Sensor Data With an App: Opportunities and Challenges Around Privacy and Informed Consent by Frauke Kreuter, Georg-Christoph Haas, Florian Keusch, Sebastian Bähr and Mark Trappmann in Social Science Computer Review
Footnotes
Authors’ Note
Declaration of Conflicting Interests
The author(s) declared no potential conflicts of interest with respect to the research, authorship, and/or publication of this article.
Funding
The author(s) disclosed receipt of the following financial support for the research, authorship, and/or publication of this article: Georg-Christoph Haas' time was supported by the German Research Foundation (DFG) through the Collaborative Research Center SFB 884 “Political Economy of Reforms” (Project A9) [139943784 to Markus Frölich, Florian Keusch, and Frauke Kreuter].
Supplemental Material
Supplemental material for this article is available online.
Notes
References
Supplementary Material
Please find the following supplemental material available below.
For Open Access articles published under a Creative Commons License, all supplemental material carries the same license as the article it is associated with.
For non-Open Access articles published, all supplemental material carries a non-exclusive license, and permission requests for re-use of supplemental material or any part of supplemental material shall be sent directly to the copyright owner as specified in the copyright notice associated with the article.