
Abstract
The present study investigates the influence of Fused Deposition Modelling (FDM) process parameters on the mechanical properties and surface quality of multi-material PLA-ABS Bi-layer Laminate Structures fabricated at elevated printing speeds. A Taguchi L9 orthogonal array was used to evaluate the effects of printing speed (150–250 mm/s), layer height (0.1–0.3 mm), and infill pattern (concentric, octagram spiral, and Hilbert curve) on tensile properties and surface roughness. The results show that a printing speed of 150 mm/s, a layer height of 0.1 mm, and concentric infill provided optimal mechanical performance, yielding a Young’s modulus of 1252.29 MPa, an ultimate tensile strength of 42.17 MPa, and an elongation at break of 5.79%. Surface roughness analysis indicated the minimum roughness (Ra = 3.4 µm) at a printing speed of 250 mm/s and a layer height of 0.2 mm using concentric infill. Statistical evaluation using mean effect plots, signal-to-noise ratios, and ANOVA revealed that layer height predominantly governs surface quality, while infill pattern and printing speed significantly influence tensile behaviour. Optical fractography and scanning electron microscopy showed that fracture initiation occurred at interlayer interfaces and inter-raster voids. Well-bonded specimens exhibited ductile micro-void coalescence, whereas poorly bonded samples failed by interlayer separation and brittle fracture propagation. These findings demonstrate that appropriate selection of layer height and infill pattern enables rapid fabrication of PLA-ABS Bi-layer Laminate components with improved mechanical performance and surface finish.
Introduction
Additive Manufacturing (AM) enables the fabrication of three-dimensional components through layer-by-layer material deposition directly from computer-aided design (CAD) models.1,2 Compared with conventional subtractive manufacturing, AM offers high material efficiency, enhanced design freedom, and the ability to fabricate complex geometries with minimal waste.3,4 Consequently, AM has emerged as a key enabling technology for rapid prototyping and functional components within the Fourth Industrial Revolution.5,6 Among various AM techniques, such as Stereolithography (SLA), Selective Laser Sintering (SLS), and Binder Jetting, Fused Deposition Modelling (FDM) also referred to as Fused Filament Fabrication (FFF) or Material Extrusion (MEX) is the most widely adopted process due to its cost-effectiveness, operational simplicity, and broad material availability.7,8 In FDM, a semi-molten thermoplastic filament is extruded through a heated nozzle and deposited along predefined toolpaths, where it solidifies and bonds with previously deposited layers.9,10 However, the mechanical performance of FDM-fabricated parts is highly sensitive to process parameters and thermal history, leading to anisotropic properties that require careful optimization for industrial us. 11
Industrial and functional applications of ABS and PLA materials.
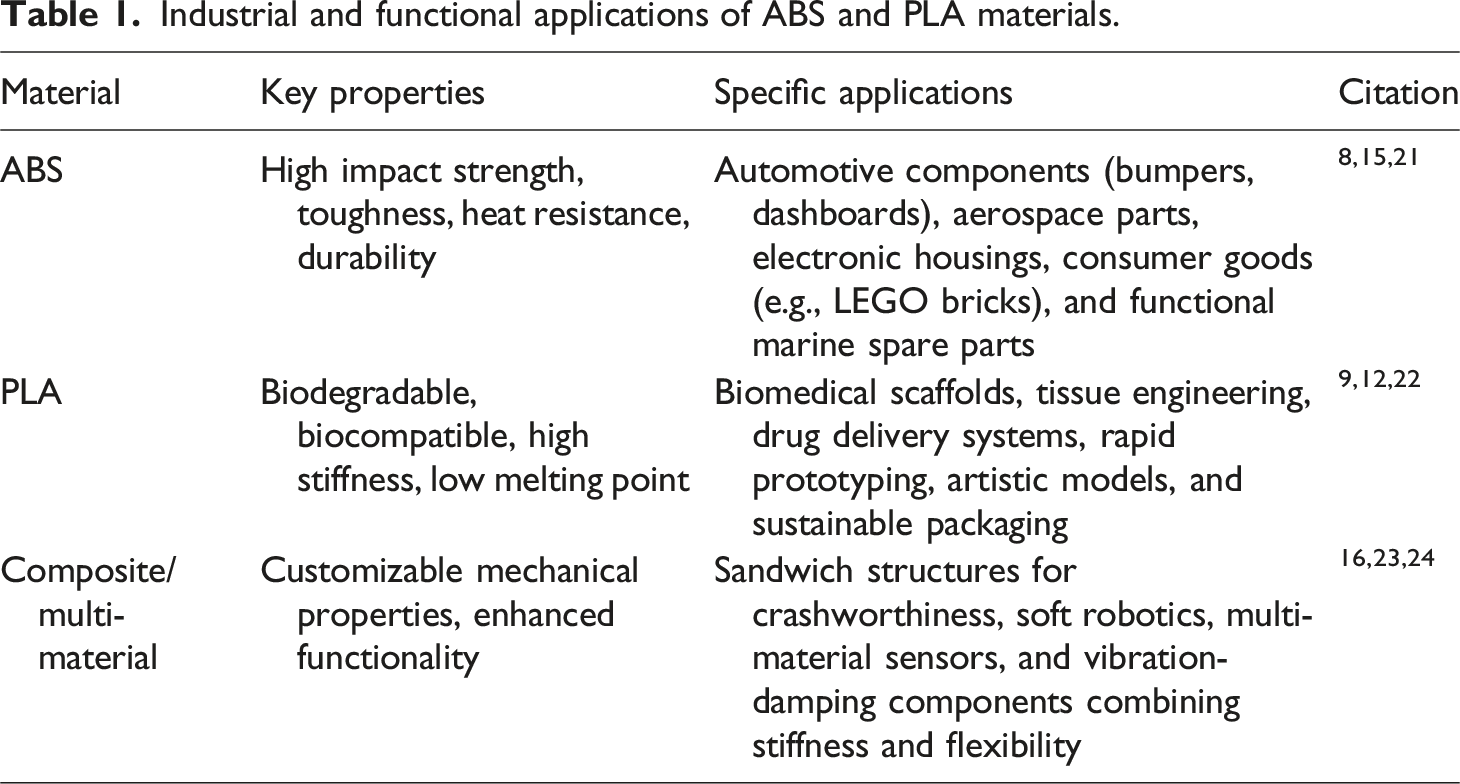
Parametric optimization of FDM processes has been widely investigated to improve the mechanical performance and surface quality of printed parts. 25 The final properties of FDM components depend on a complex interaction of parameters such as layer height, infill density, raster angle, printing speed, and nozzle temperature.13,25 The mesostructured generated by slicer settings strongly influences tensile behaviour, with raster orientation and infill density identified as dominant factors. 26 Maximum tensile strength is generally achieved at 100% infill and raster angles aligned with the loading direction, whereas perpendicular raster orientations often result in reduced strength due to weaker inter-raster bonding. Interlayer adhesion is another critical factor governing mechanical performance, as poor bonding between layers can lead to premature failure under tensile loading.13,27 SEM-based fracture analyses indicate predominantly ductile failure in PLA, while ABS exhibits brittle or mixed-mode fracture depending on processing conditions.8,11 Recent studies on multi-material printing, including PLA/ABS Bi-layer Laminate, emphasize the need for precise process control to ensure adequate interfacial bonding between dissimilar materials.4,21 While extensive research exists on FDM parameters, studies focusing on high-speed multi-material printing (>150 mm/s) remain limited. Most prior work, such as the interface studies by Khan et al. and surface optimization by Kechagias et al., was conducted at standard speeds (30–60 mm/s).26,28 This study addresses this gap by optimizing the interfacial bonding and mechanical performance of PLA-ABS Bi-layer laminates specifically under high-velocity deposition regimes. Unlike fibre-reinforced composites which rely on matrix-fibre transfer, this work isolates the thermal fusion efficacy of incompatible polymers (amorphous ABS vs semi-crystalline PLA) when deposited at speeds up to 250 mm/s. 25
Surface roughness remains a key quality concern in FDM due to the inherent stair-stepping effect of layer-by-layer deposition. 28 Layer height has been consistently reported as the most influential parameter, with reduced layer height improving surface finish.22,29 Printing speed and nozzle temperature also affect surface quality, as improper thermal conditions and excessive speeds can cause defects such as stringing, vibration-induced waviness, and surface irregularities. 30 Despite extensive research, systematic optimization of FDM at high printing speeds is still limited. Most studies focus on moderate speeds, whereas industrial applications increasingly demand higher production rates.8,14 High-speed printing introduces challenges such as reduced interlayer adhesion, under-extrusion, and increased surface roughness.29,31 Moreover, limited work has examined the combined influence of high printing speed, infill pattern, and layer height on both mechanical and surface properties of PLA and ABS using robust statistical approaches.8,9
To address these gaps, the present study focuses on optimizing key FDM parameters to enhance the manufacturability of PLA and ABS at elevated printing speeds. 32 The effects of layer height, infill pattern, and high printing speed on tensile strength, surface roughness, and fracture behaviour are investigated using a Taguchi L9 DoE approach.9,33 The outcomes aim to establish practical guidelines for high-speed FDM, balancing part quality with production efficiency.
Materials and methods
Material
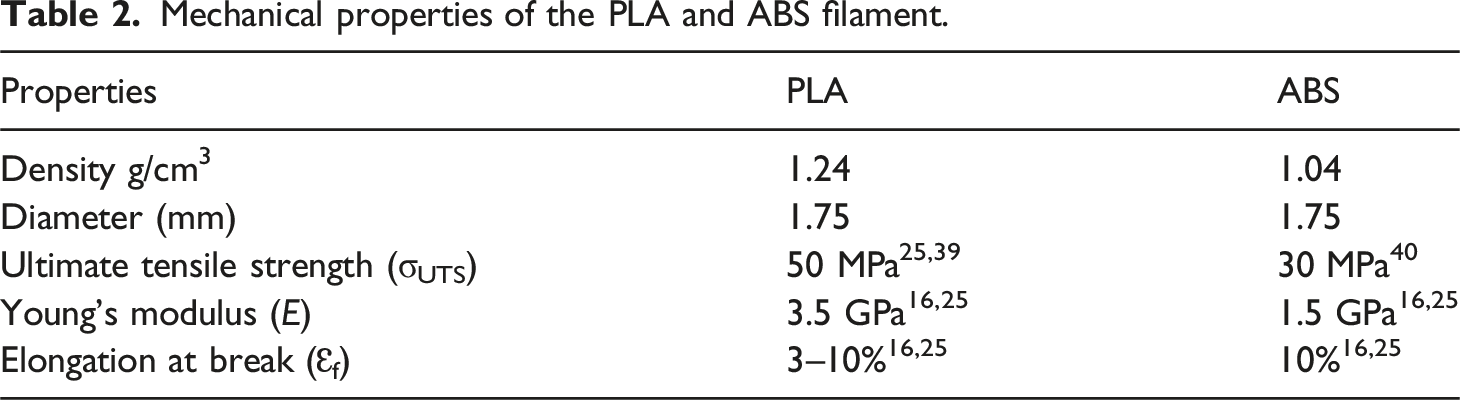
Mechanical properties of the PLA and ABS filament.
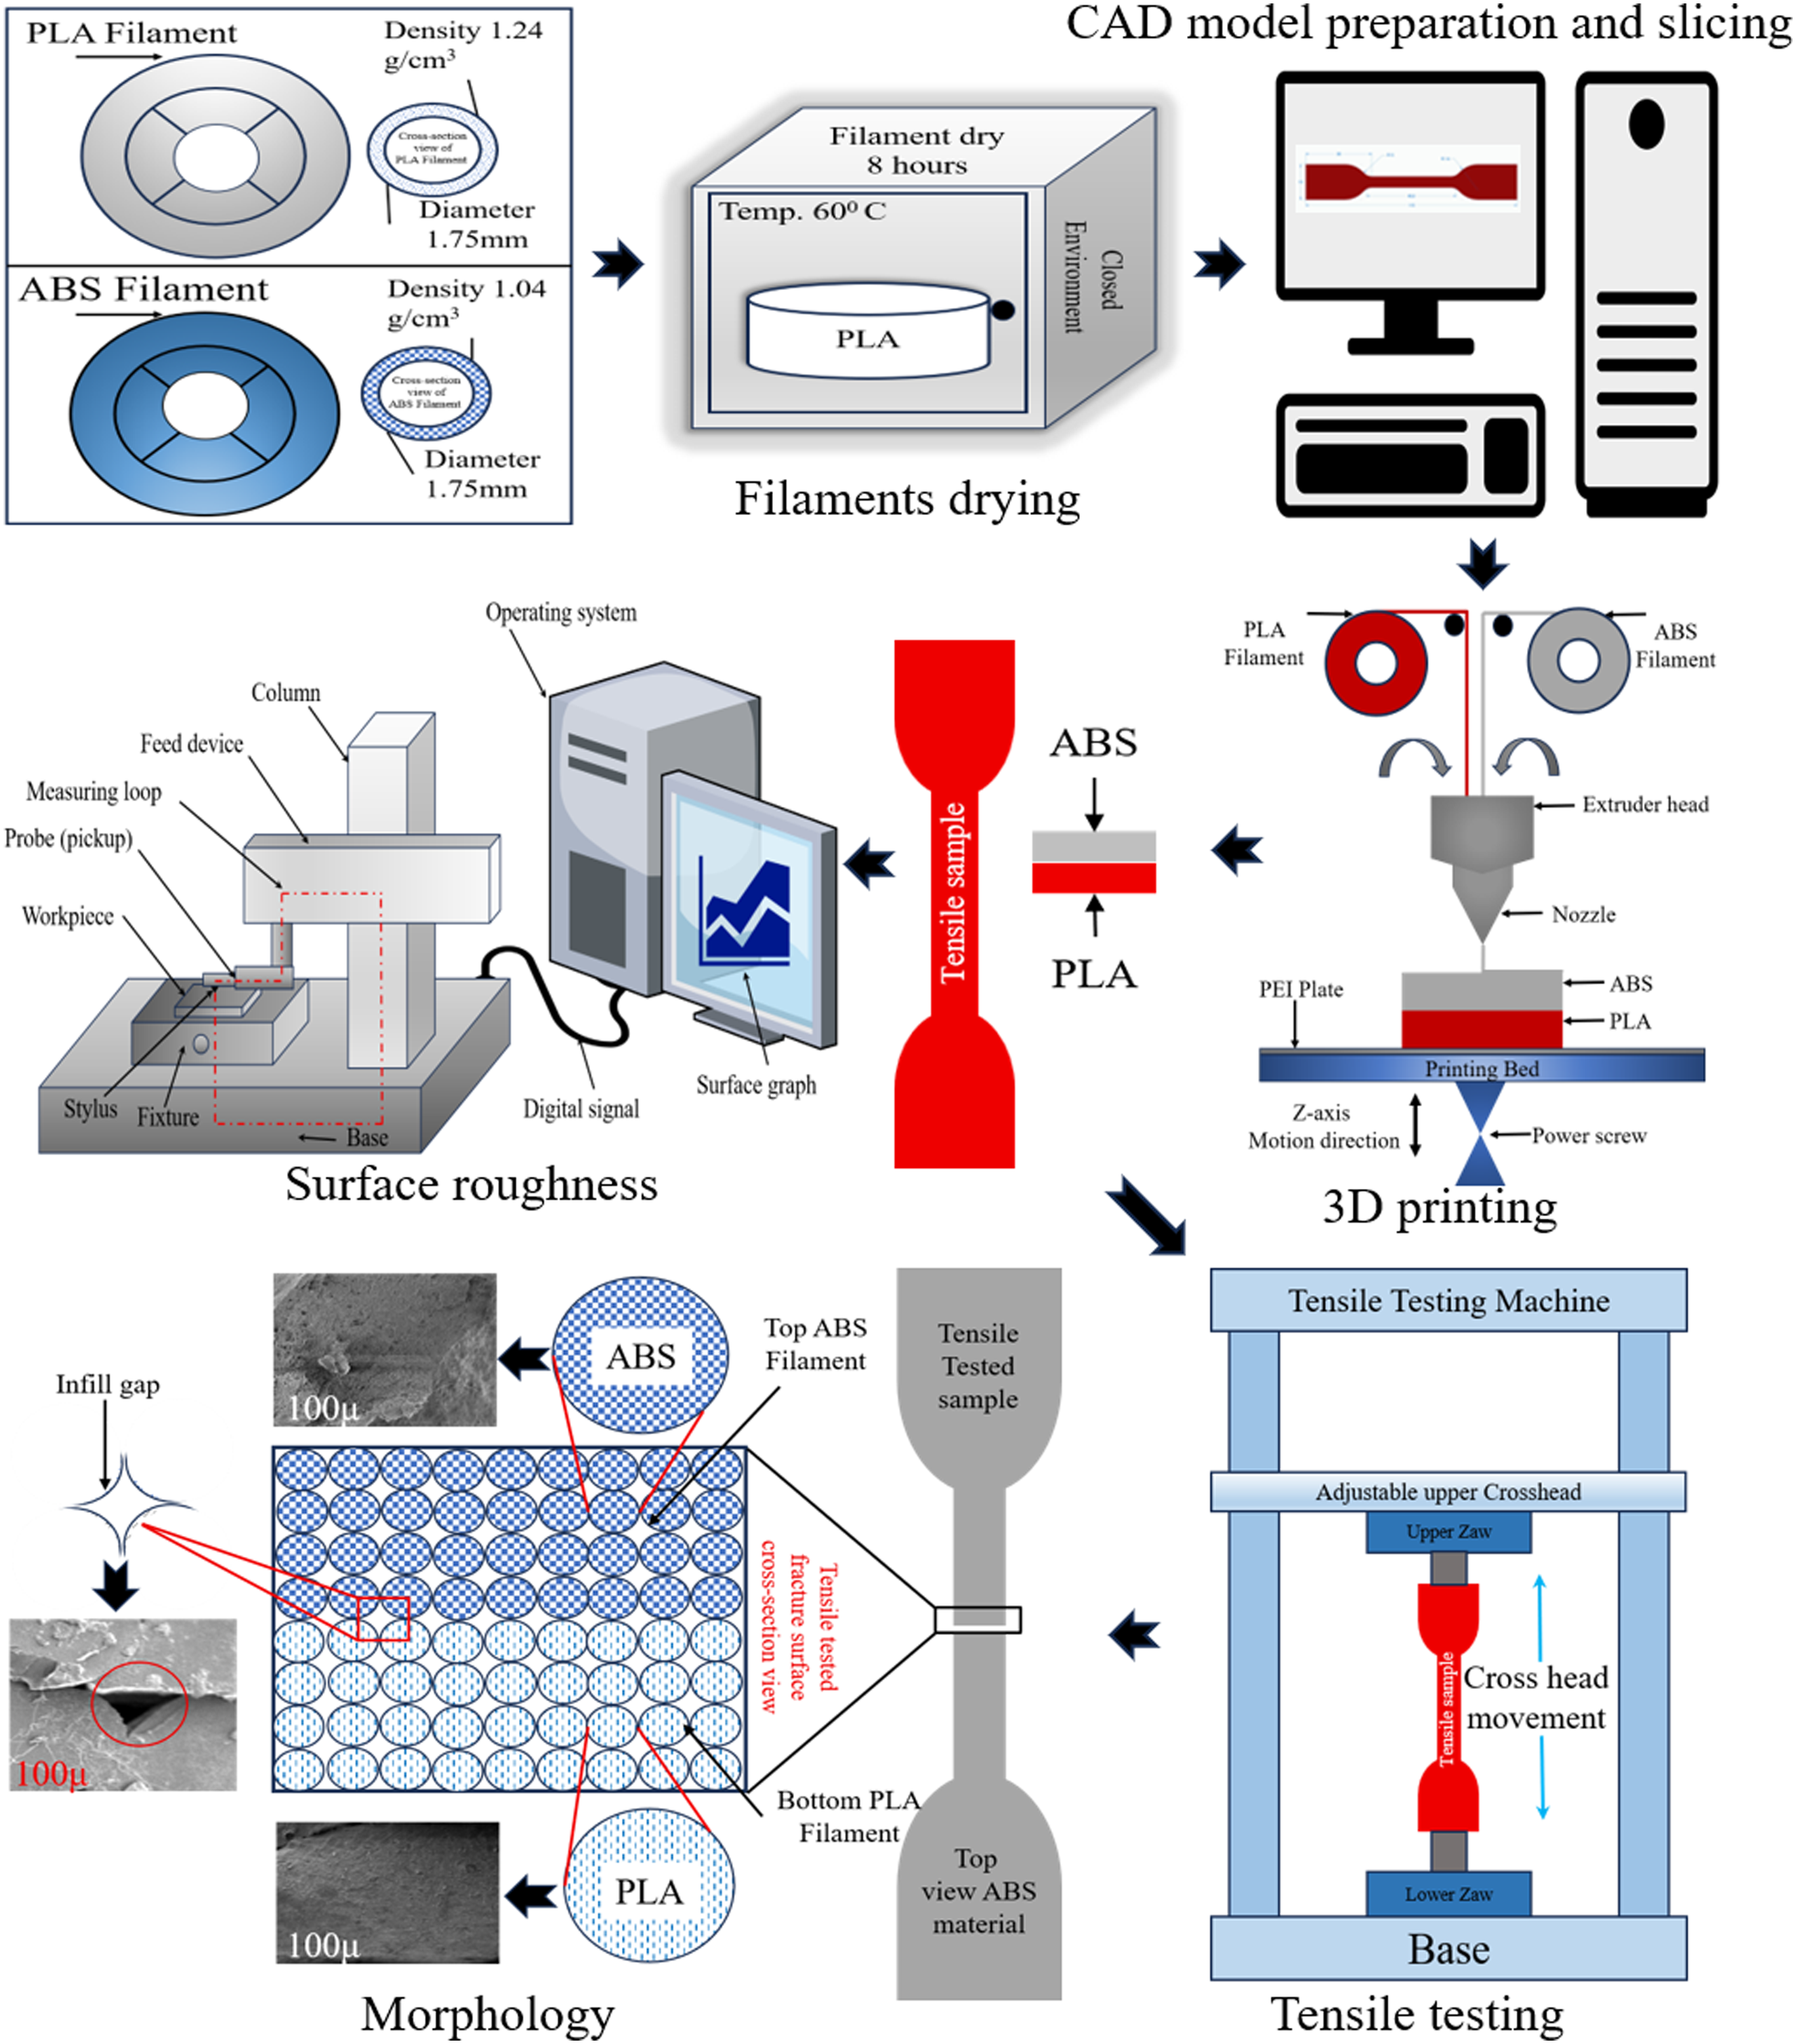
Schematic workflow of fabrication and characterization of dual-material PLA-ABS tensile specimens by fused filament fabrication.
Printing parameters
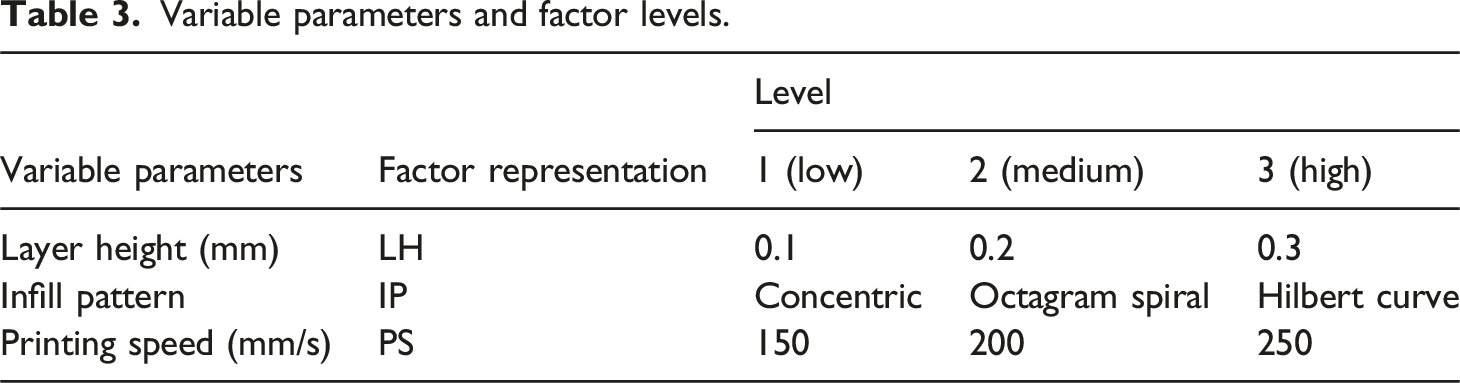
Variable parameters and factor levels.
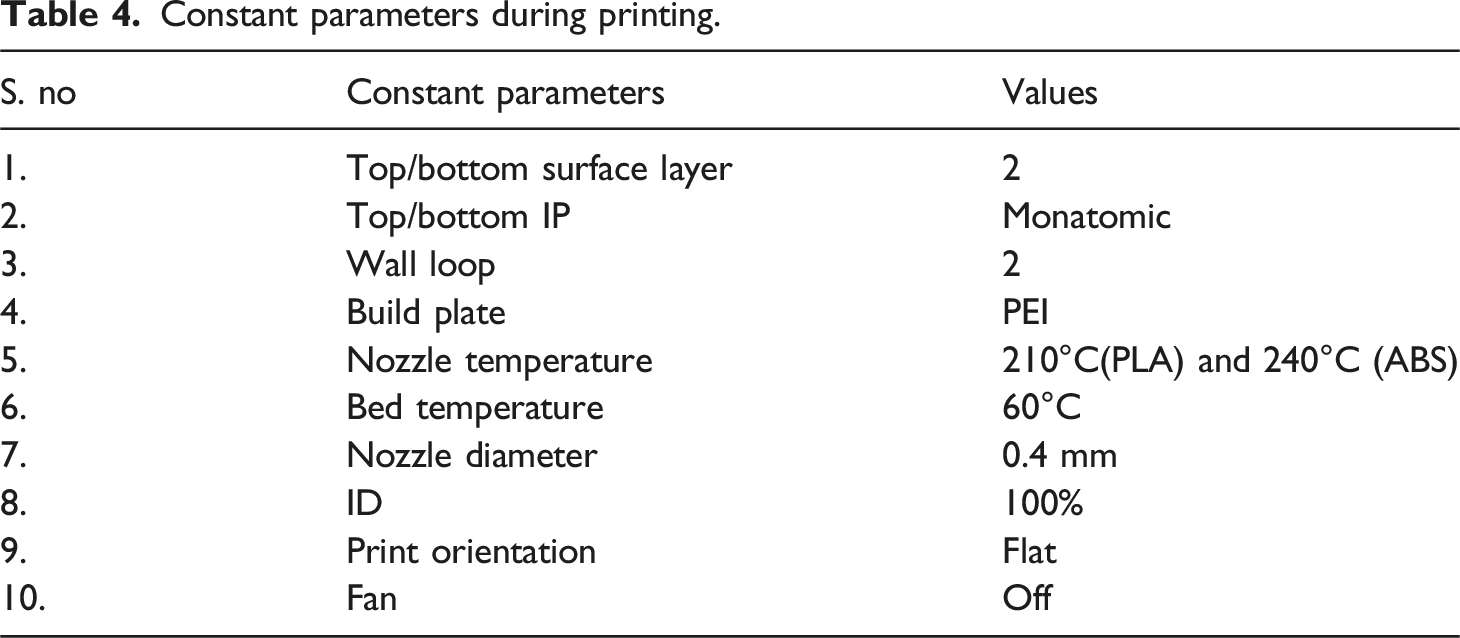
Constant parameters during printing.
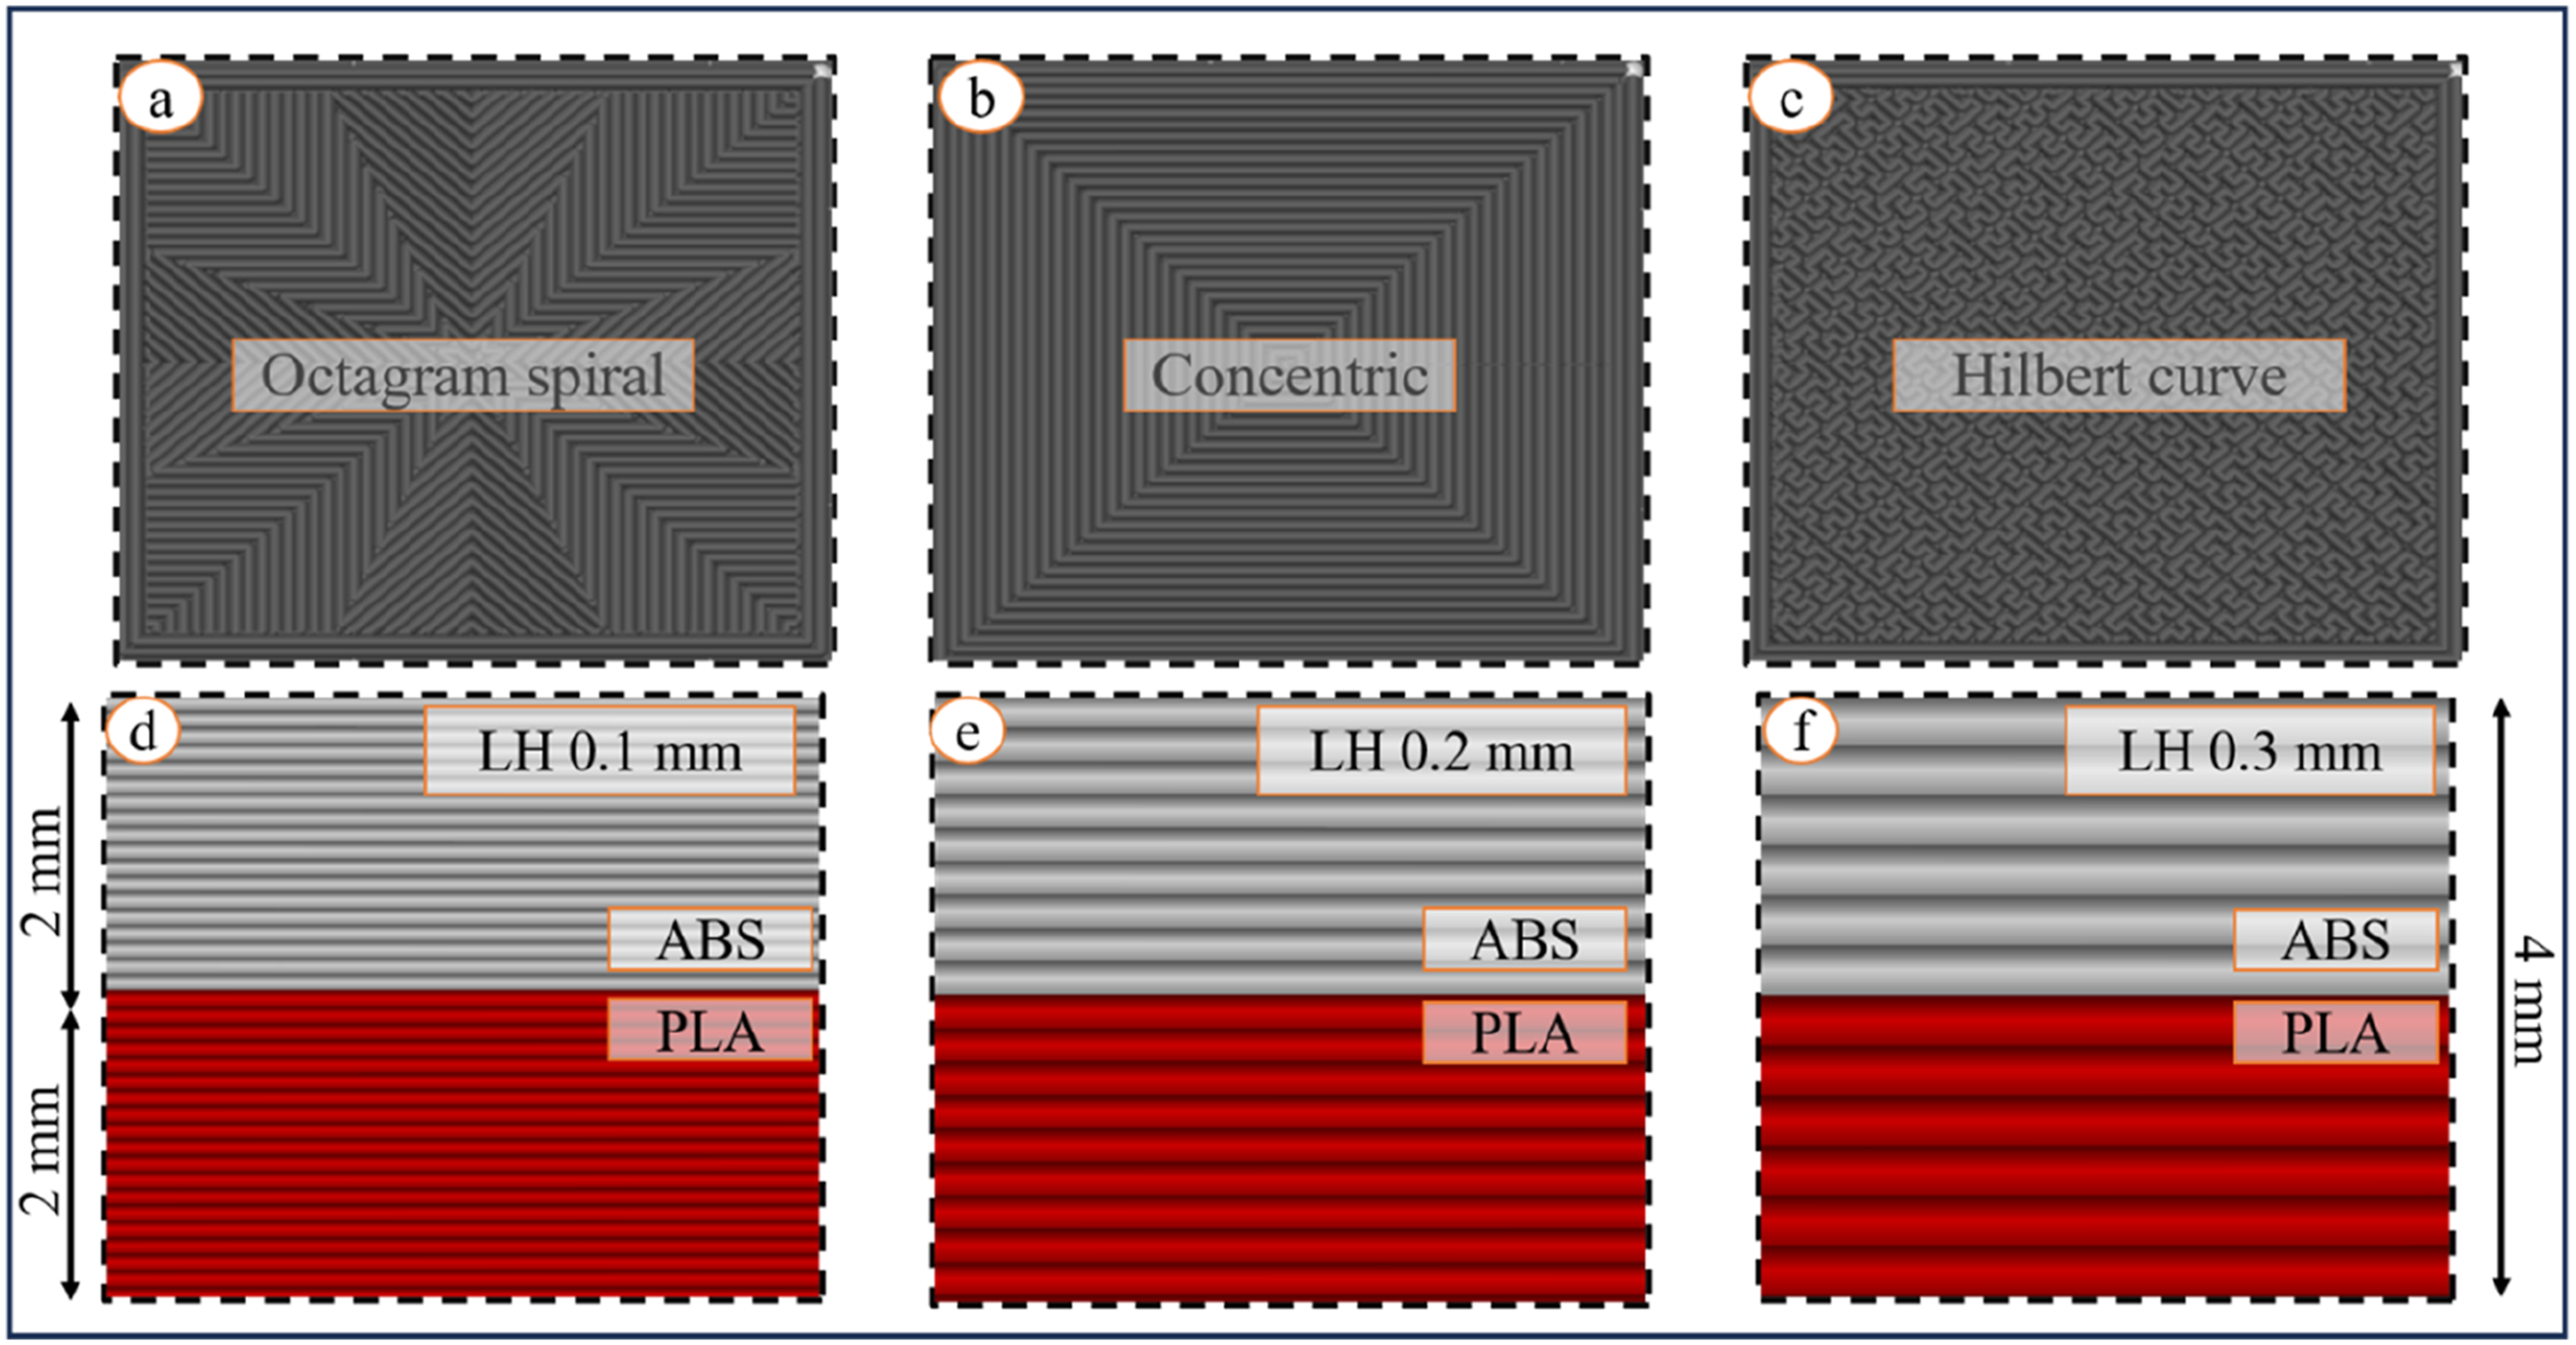
Infill pattern and layer height orientation (a) octagram spiral, (b) concentric, (c) Hilbert curve, (d) LH 0.1 mm, (e) LH 0.2 mm and (f) LH 0.3 mm.
Design matrix
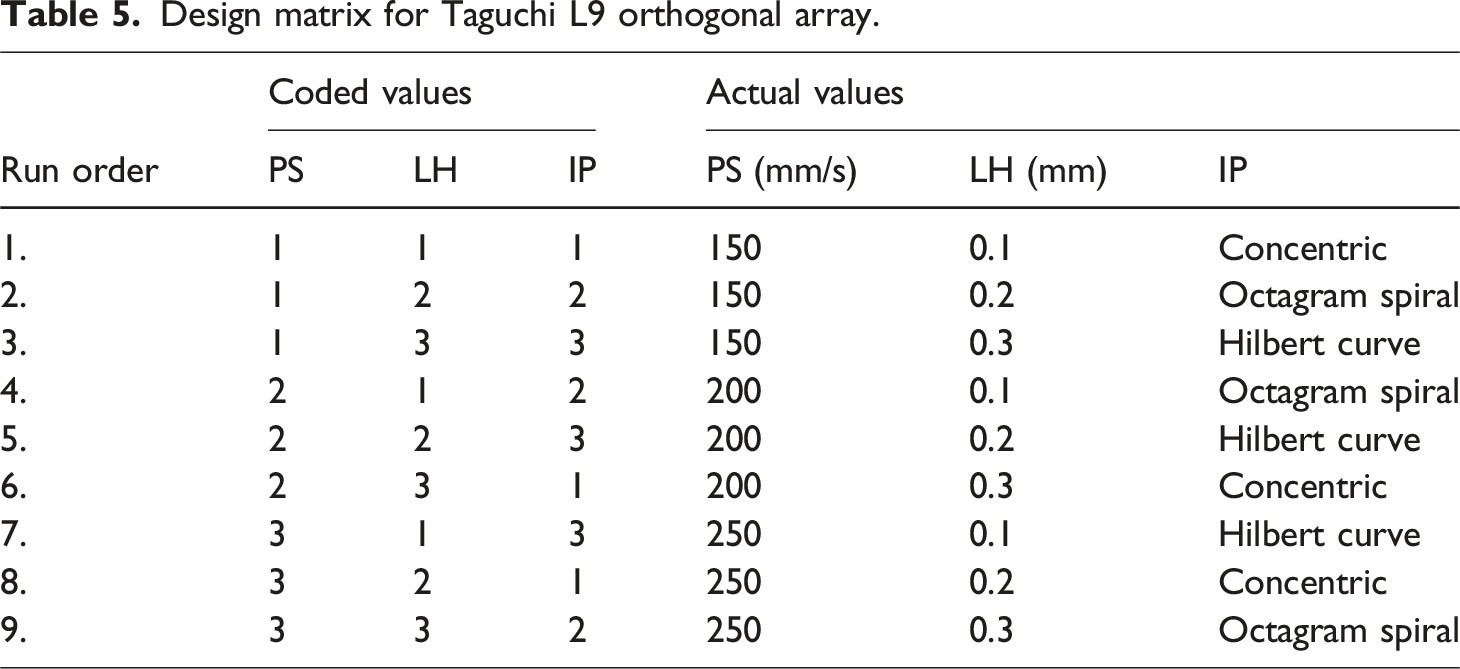
Design matrix for Taguchi L9 orthogonal array.
Sample preparation
Tensile specimens were fabricated in accordance with the ASTM D638 Type IV standard, which is widely used for evaluating rigid thermoplastic polymers.
27
The specimen geometry, shown in Figure 1, has an overall length of 115 mm to ensure adequate gripping during testing and a gauge length (L) of 19 mm, which serves as the primary deformation region.23,31 Rounded transitions with defined radii of curvature (R6 and R14) were incorporated to minimize stress concentrations and promote fracture within the gauge section. The digital workflow began with three-dimensional modelling in AutoCAD (Computer-Aided Design), followed by exporting the geometry in STL (Stereolithography) format. This standard file format discretizes the CAD model into triangulated surface meshes, ensuring compatibility with additive manufacturing systems.
30
The STL files were then imported into Bambu Slicer, where slicing was performed to generate G-code (Geometric code) containing machine-readable instructions for nozzle movement, extrusion rate, and material transitions.
49
The configuration of the Bambu X1 Carbon printer is shown in Figure 3(a). Key components include a heated PEI (polyetherimide) build plate to enhance adhesion, an enclosed thermal chamber to maintain a stable printing environment, a Micro Lidar depth sensor for real-time surface detection and first-layer calibration, a precision servo-controlled filament feeding system, and a multi-material hot-end assembly with independent nozzles and cooling fans. This configuration enables simultaneous extrusion of PLA and ABS. The specimens were fabricated using a bi-layer laminate strategy rather than a traditional sandwich core configuration.23,35 To ensure equal volumetric contribution (50% PLA/50% ABS), the slicing software was configured to deposit PLA for the bottom half of the specimen thickness (0-2 mm), followed by ABS for the top half (2-4 mm). The Automatic Material System (AMS) executed the filament change precisely at the mid-plane layer. PLA was used to fabricate the bottom layers of the specimens (Figure 3(b)), while ABS was deposited on the top layers (Figure 3(c)). A total of nine tensile specimens with alternating material configurations (labelled 1–9 in Figure 3(b) and (c)) were printed sequentially. The slicing parameters were optimized to ensure 100% infill density, precise nozzle positioning, and seamless material switching between PLA and ABS. This approach resulted in well-defined interfacial regions suitable for tensile testing and comparative mechanical characterization across the material variation matrix.16,21 Fabrication of ASTM type IV tensile samples: (a) Bambu X1 carbon 3D printer, (b) bottom side showing PLA and (c) top side showing ABS material.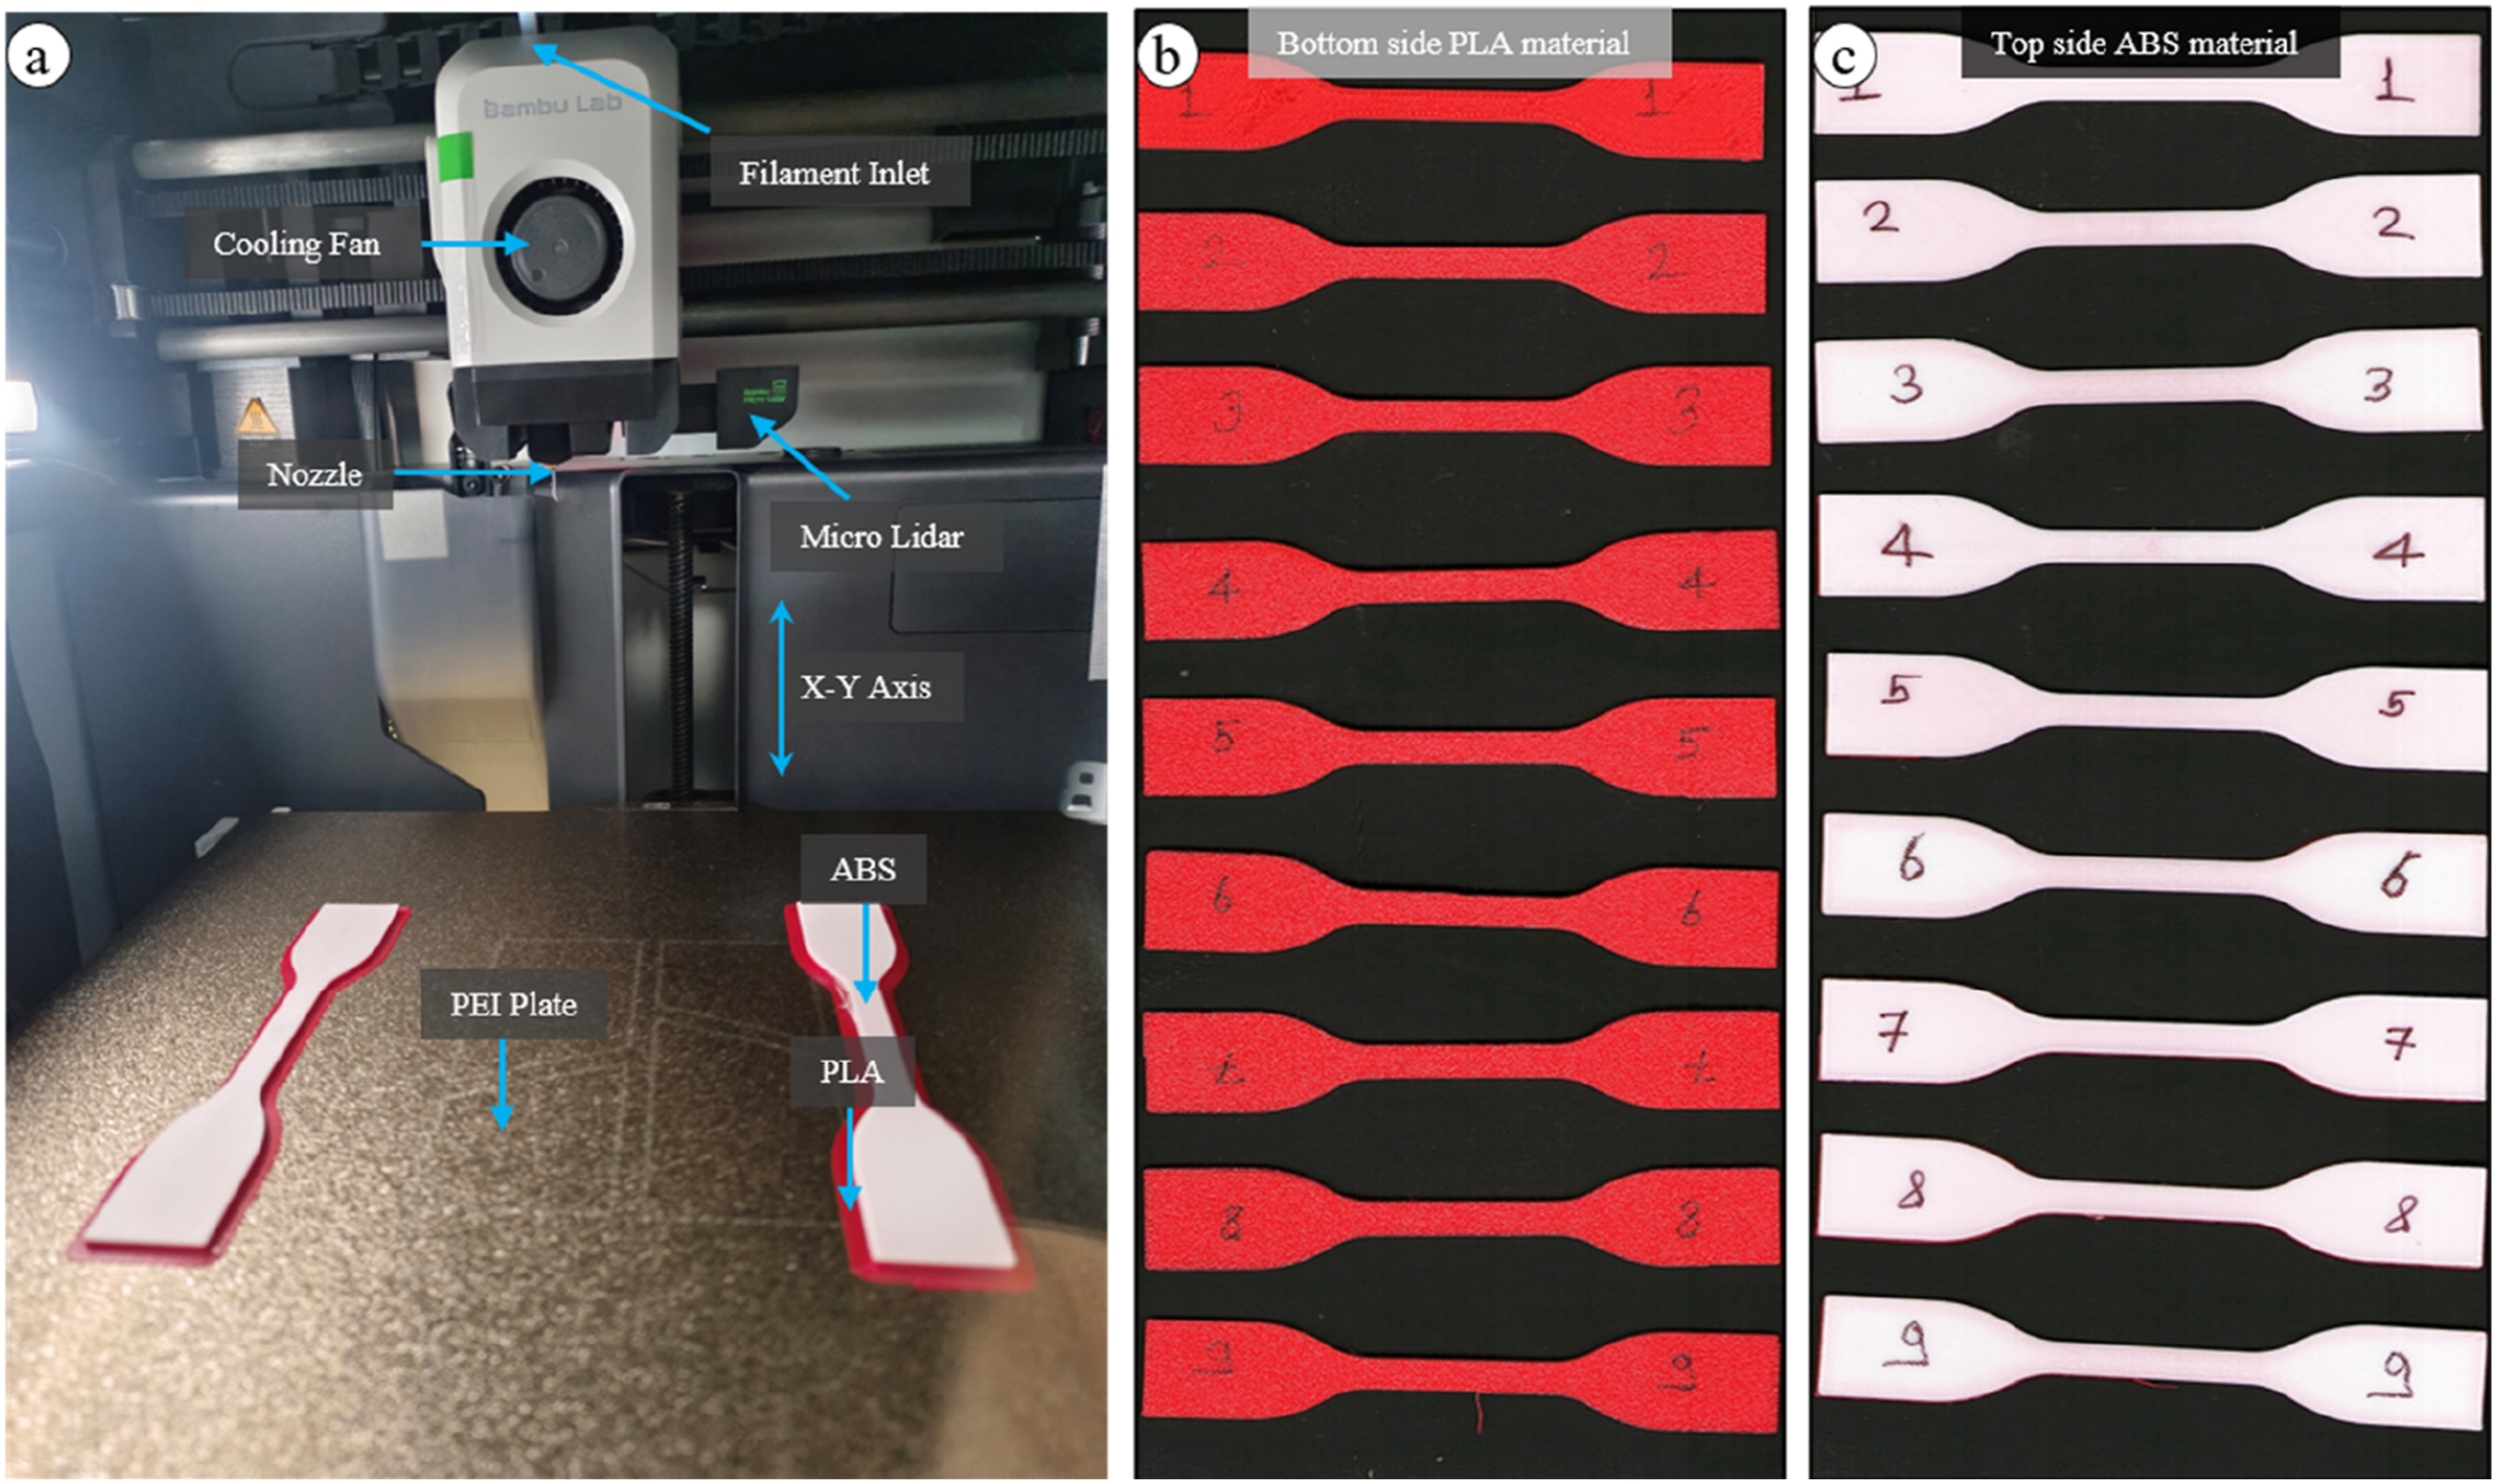
Tensile and surface roughness testing
Figure 4 illustrates the tensile testing procedure. Tensile tests were conducted using a Zwick Roell Z010 universal testing machine. Figure 4(a) shows the complete testing setup, including the control panel connected to a dedicated computer interface for real-time data acquisition and load displacement monitoring, upper and lower jaws for specimen gripping, and an emergency stop button for safety. To eliminate atmospheric effects such as thermal expansion or humidity-induced degradation, all nine ASTM D638 Type IV tensile specimens with different print speeds, layer heights, and infill patterns were tested under controlled room-temperature conditions.
30
Tensile testing: (a) universal testing machine hardware, (b) specimen positioning and load direction of tensile testing, (c) operating system of surface profilometer, (d) specimen jaw assembly of tensile testing and (e) surface profilometer.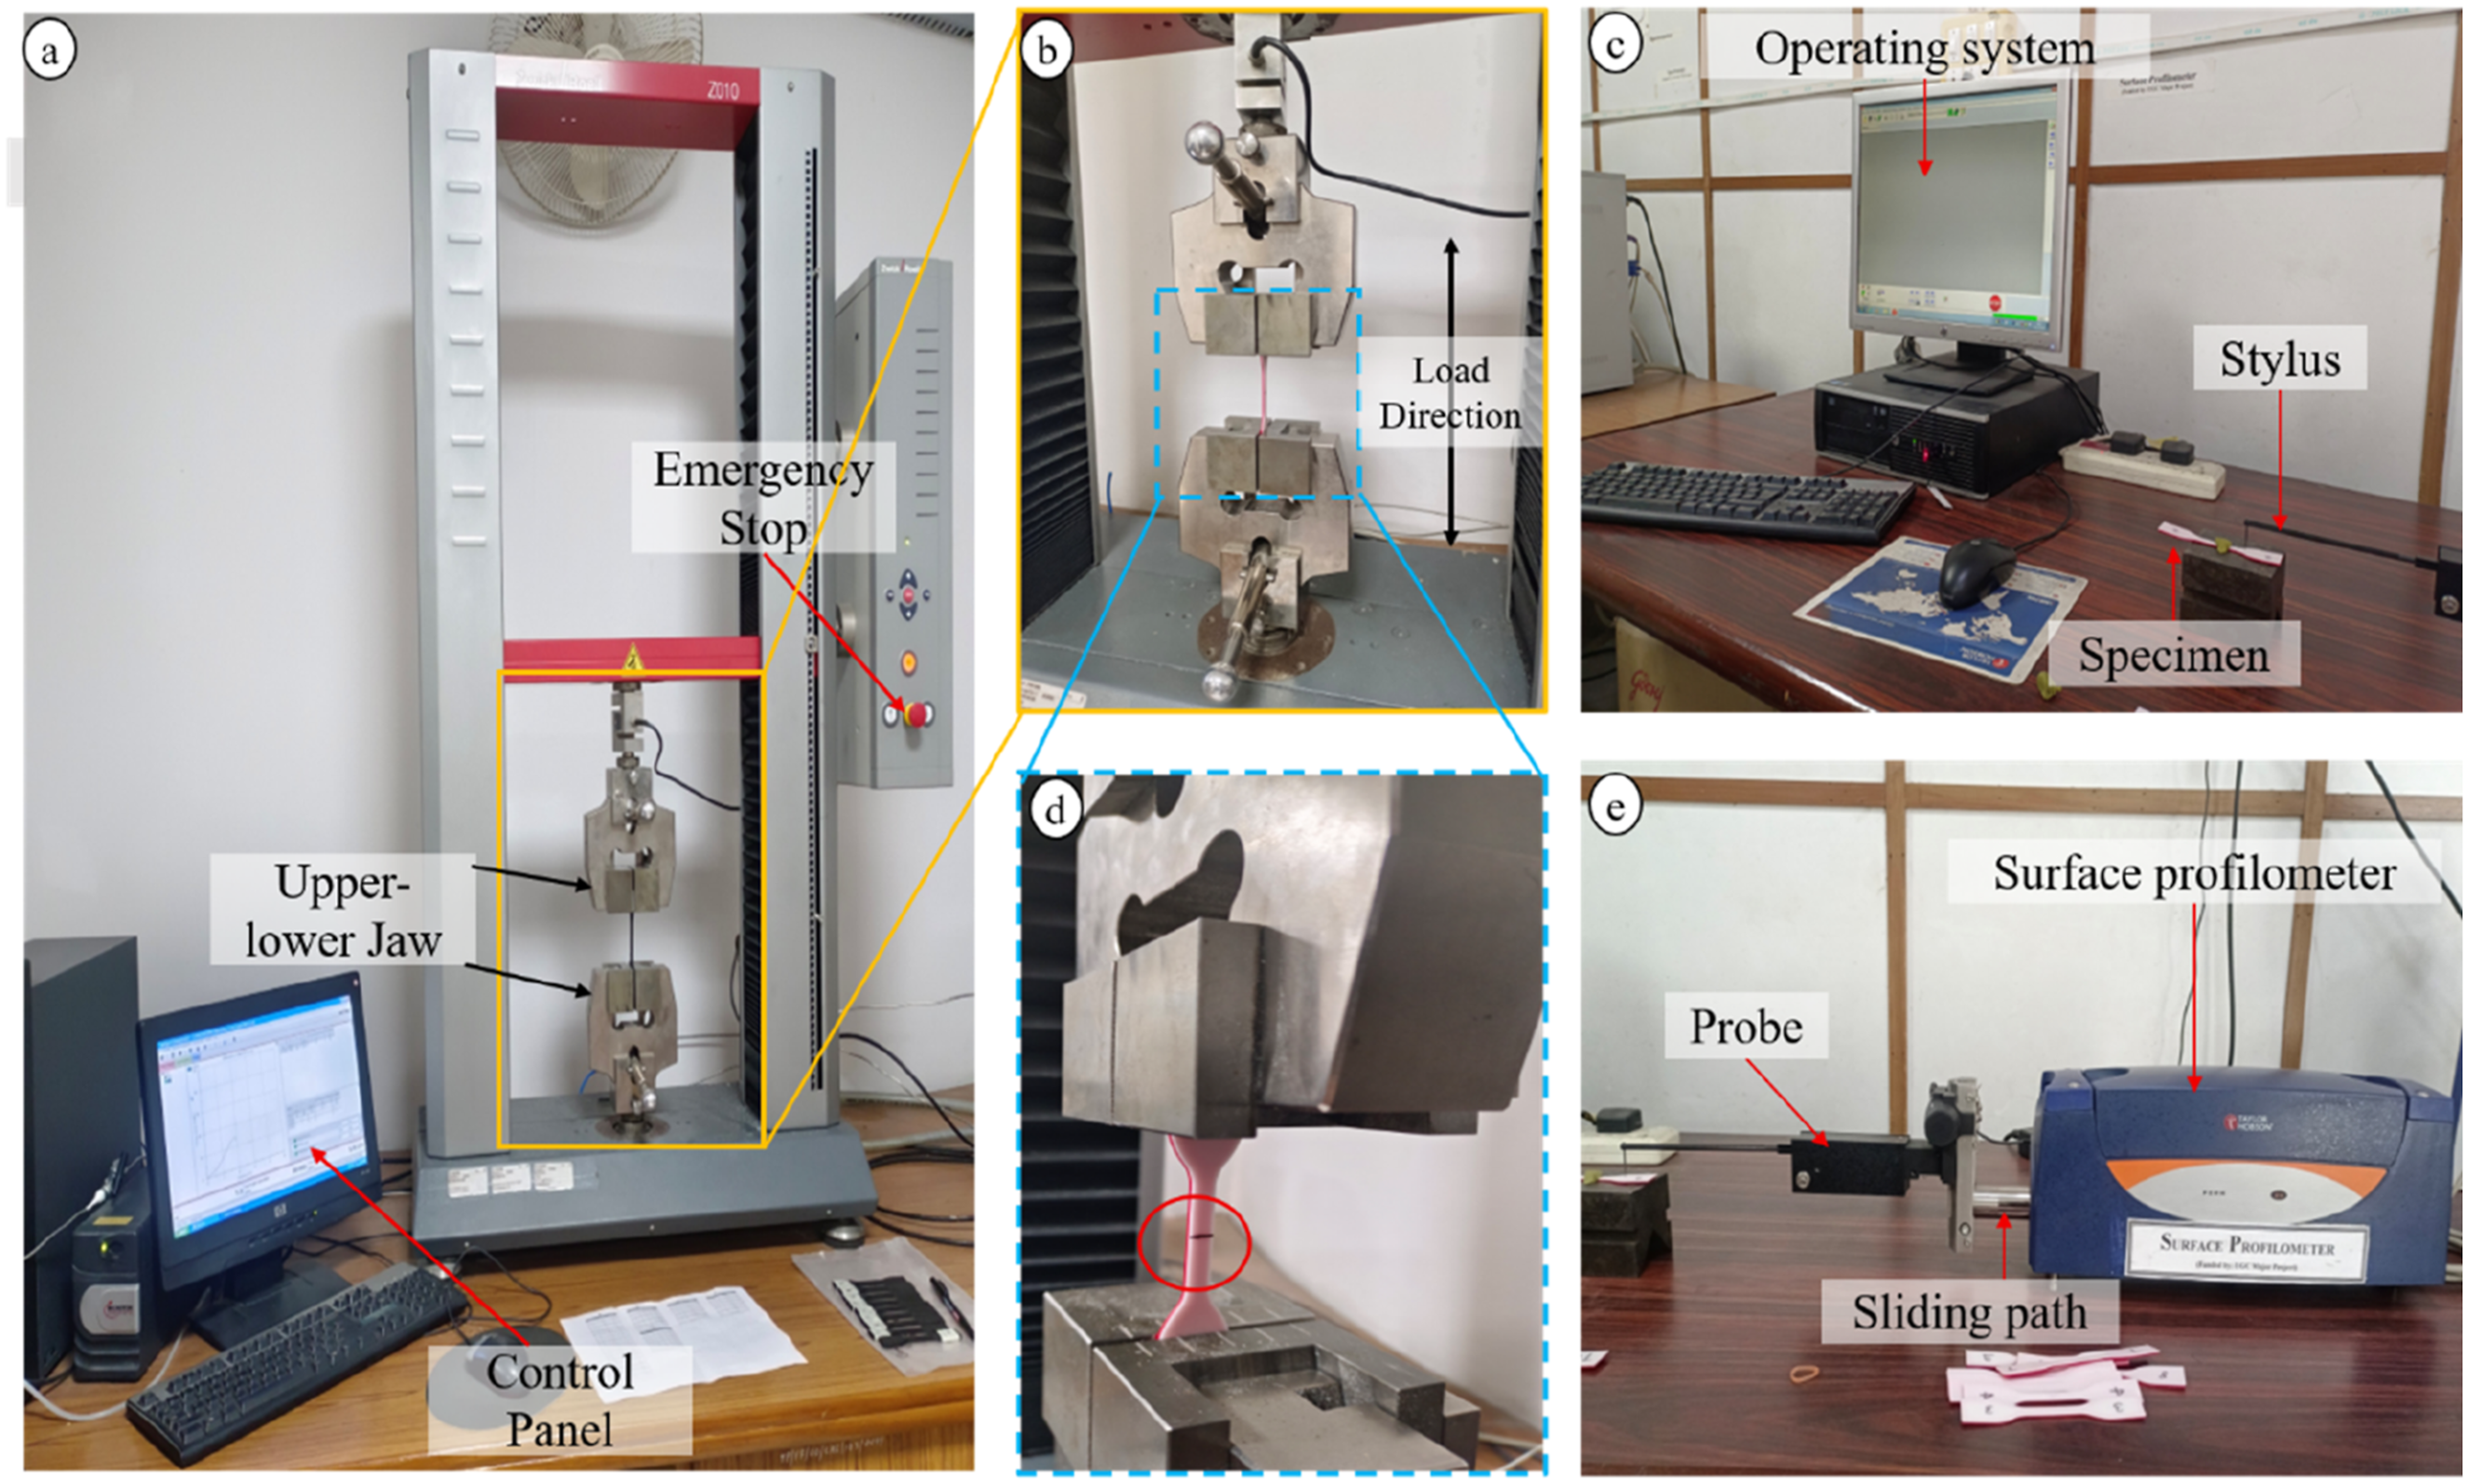
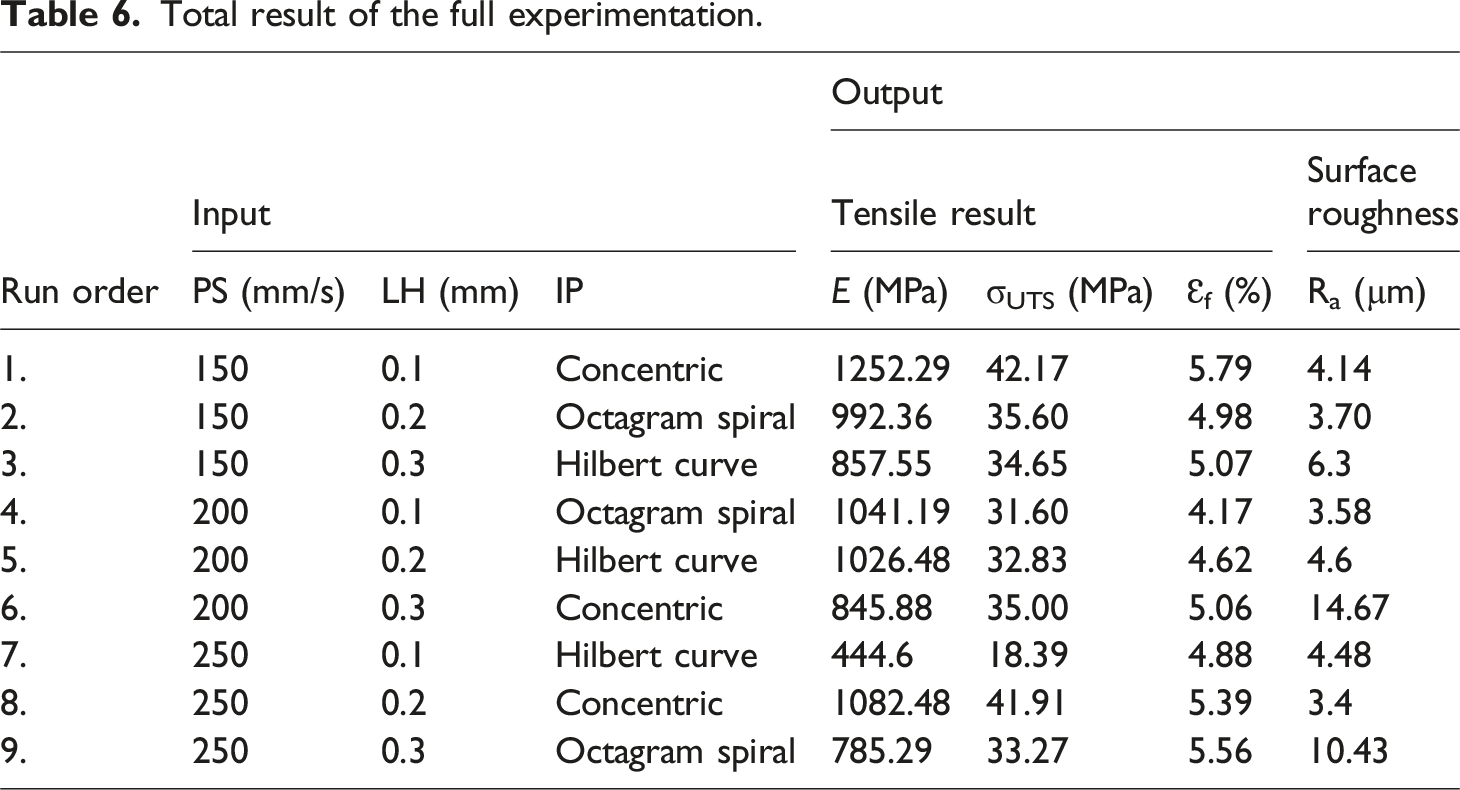
Total result of the full experimentation.
Results and discussions
Tensile and surface roughness result
Table 6 summarizes the tensile and surface roughness responses of the ABS-PLA Bi-layer Laminate specimens fabricated using the L9 matrix. The key response parameters reported include E, σUTS, Ɛf, and Ra. Among all conditions, the combination of printing speed (150 mm/s), layer height (0.1 mm), and concentric infill pattern (Sample 1) yields the best overall performance, with E = 1252.29 MPa, σUTS = 42.17 MPa, and a maximum Ɛf = 5.79%, while maintaining a relatively low surface roughness (Ra ≈ 4.14 μm). 50 In contrast, increasing the layer height to 0.3 mm or employing Hilbert and octagram spiral infill patterns generally leads to a reduction in both E and σUTS. In extreme cases, such as Sample 6 (200 mm/s, 0.3 mm, concentric), the mechanical performance deteriorates significantly, with a very low modulus (E = 444.6 MPa) and strength (σUTS = 18.39 MPa), despite moderate ductility (Ɛf ≈ 4.88%) and high surface roughness (Ra ≈ 14.67 μm). This behaviour indicates poor interlayer bonding at coarse layer heights and the presence of internal defects, which also explains the elevated Ra values observed for Samples 3, 6, 7, and 9. 51
At a higher printing speed of 250 mm/s, the Bi-layer Laminate structure retains relatively high strength for selected infill conditions. For example, Sample 8 (concentric infill, layer height = 0.2 mm) exhibits σUTS = 41.91 MPa, E = 1082.48 MPa, Ɛf = 5.39%, and a low Ra ≈ 3.40 μm. This result demonstrates that concentric infill combined with thin-to-medium layer heights promotes effective PLA-ABS load transfer and improved surface quality. Conversely, Hilbert and octagram spiral patterns at the same speed (Samples 7 and 9) show reduced E and σUTS, along with moderate to high Ra, confirming that complex infill trajectories and thick layers promote stress concentrations, premature debonding, and rougher surfaces in this Bi-layer Laminate system. 52 A critical trade-off was observed between production efficiency and mechanical performance. While the lowest speed (150 mm/s) yielded the maximum tensile strength of 42.17 MPa (sample1), increasing the printing speed to 250 mm/s (Run 8) resulted in a tensile strength of 41.91 MPa. This represents a negligible strength reduction of only ∼0.6%, whereas the print time was reduced by approximately 40%. These finding tests earlier studies that reported important property degradation above 100 mm/s8. The results indicate that with the ‘Concentric’ infill pattern, industrial-grade high-speed printing (250 mm/s) is viable for PLA-ABS laminates without compromising structural integrity. 53
The tensile stress–strain curves in Figure 5 further support these trends. At a printing speed of 150 mm/s (Figure 5(a), Samples 1–3), all curves exhibit an initial linear elastic region followed by gradual strain hardening up to σUTS. However, Sample 1 shows a steeper slope, higher peak stress, and greater strain at fracture, indicating a stiffer and more ductile response when concentric infill and minimum layer height are employed.
54
Samples 2 and 3 (octagram spiral and Hilbert) display lower slopes and earlier softening, consistent with stress localization within the core infill. At printing speeds of 200 and 250 mm/s (Figure 5(b) and (c)), concentric infill samples (Samples 6 and 8) demonstrate higher σUTS and extended plastic deformation prior to failure, whereas Samples 5 and 7 show reduced modulus and premature load drops due to weak interfacial bonding. Overall, the PLA-ABS Bi-layer Laminate structure behaves as a semi-ductile laminate, in which stiff PLA skins dominate elastic loading while the ABS core accommodates strain, with optimized thin layers, concentric infill, and moderate-to-high printing speeds providing a favourable balance between E, σUTS, and Ɛf.
55
The bi-layer design (50% PLA/50% ABS) produces a non-uniform stress distribution due to the stiffness disparity between the layers. Given that PLA has a greater Young’s Modulus (E ≈ 3.5 GPa) than ABS (E ≈ 2.0 GPa),
19
the PLA substrate predominantly supports the tensile load in the elastic region. The interface operates as a shear transfer zone; effective load-bearing capacity of up to 42 MPa demonstrates that the interfacial shear strength surpassed the stress differential between the strained PLA and ABS layers, thereby averting premature delamination.
12
Tensile stress–strain curves of ABS-PLA Bi-layer Laminate specimens fabricated with different printing parameters: (a) PS = 150 mm/s (Samples 1–3), (b) PS = 200 mm/s (Samples 4–6), and (c) PS = 250 mm/s (Samples 7–9).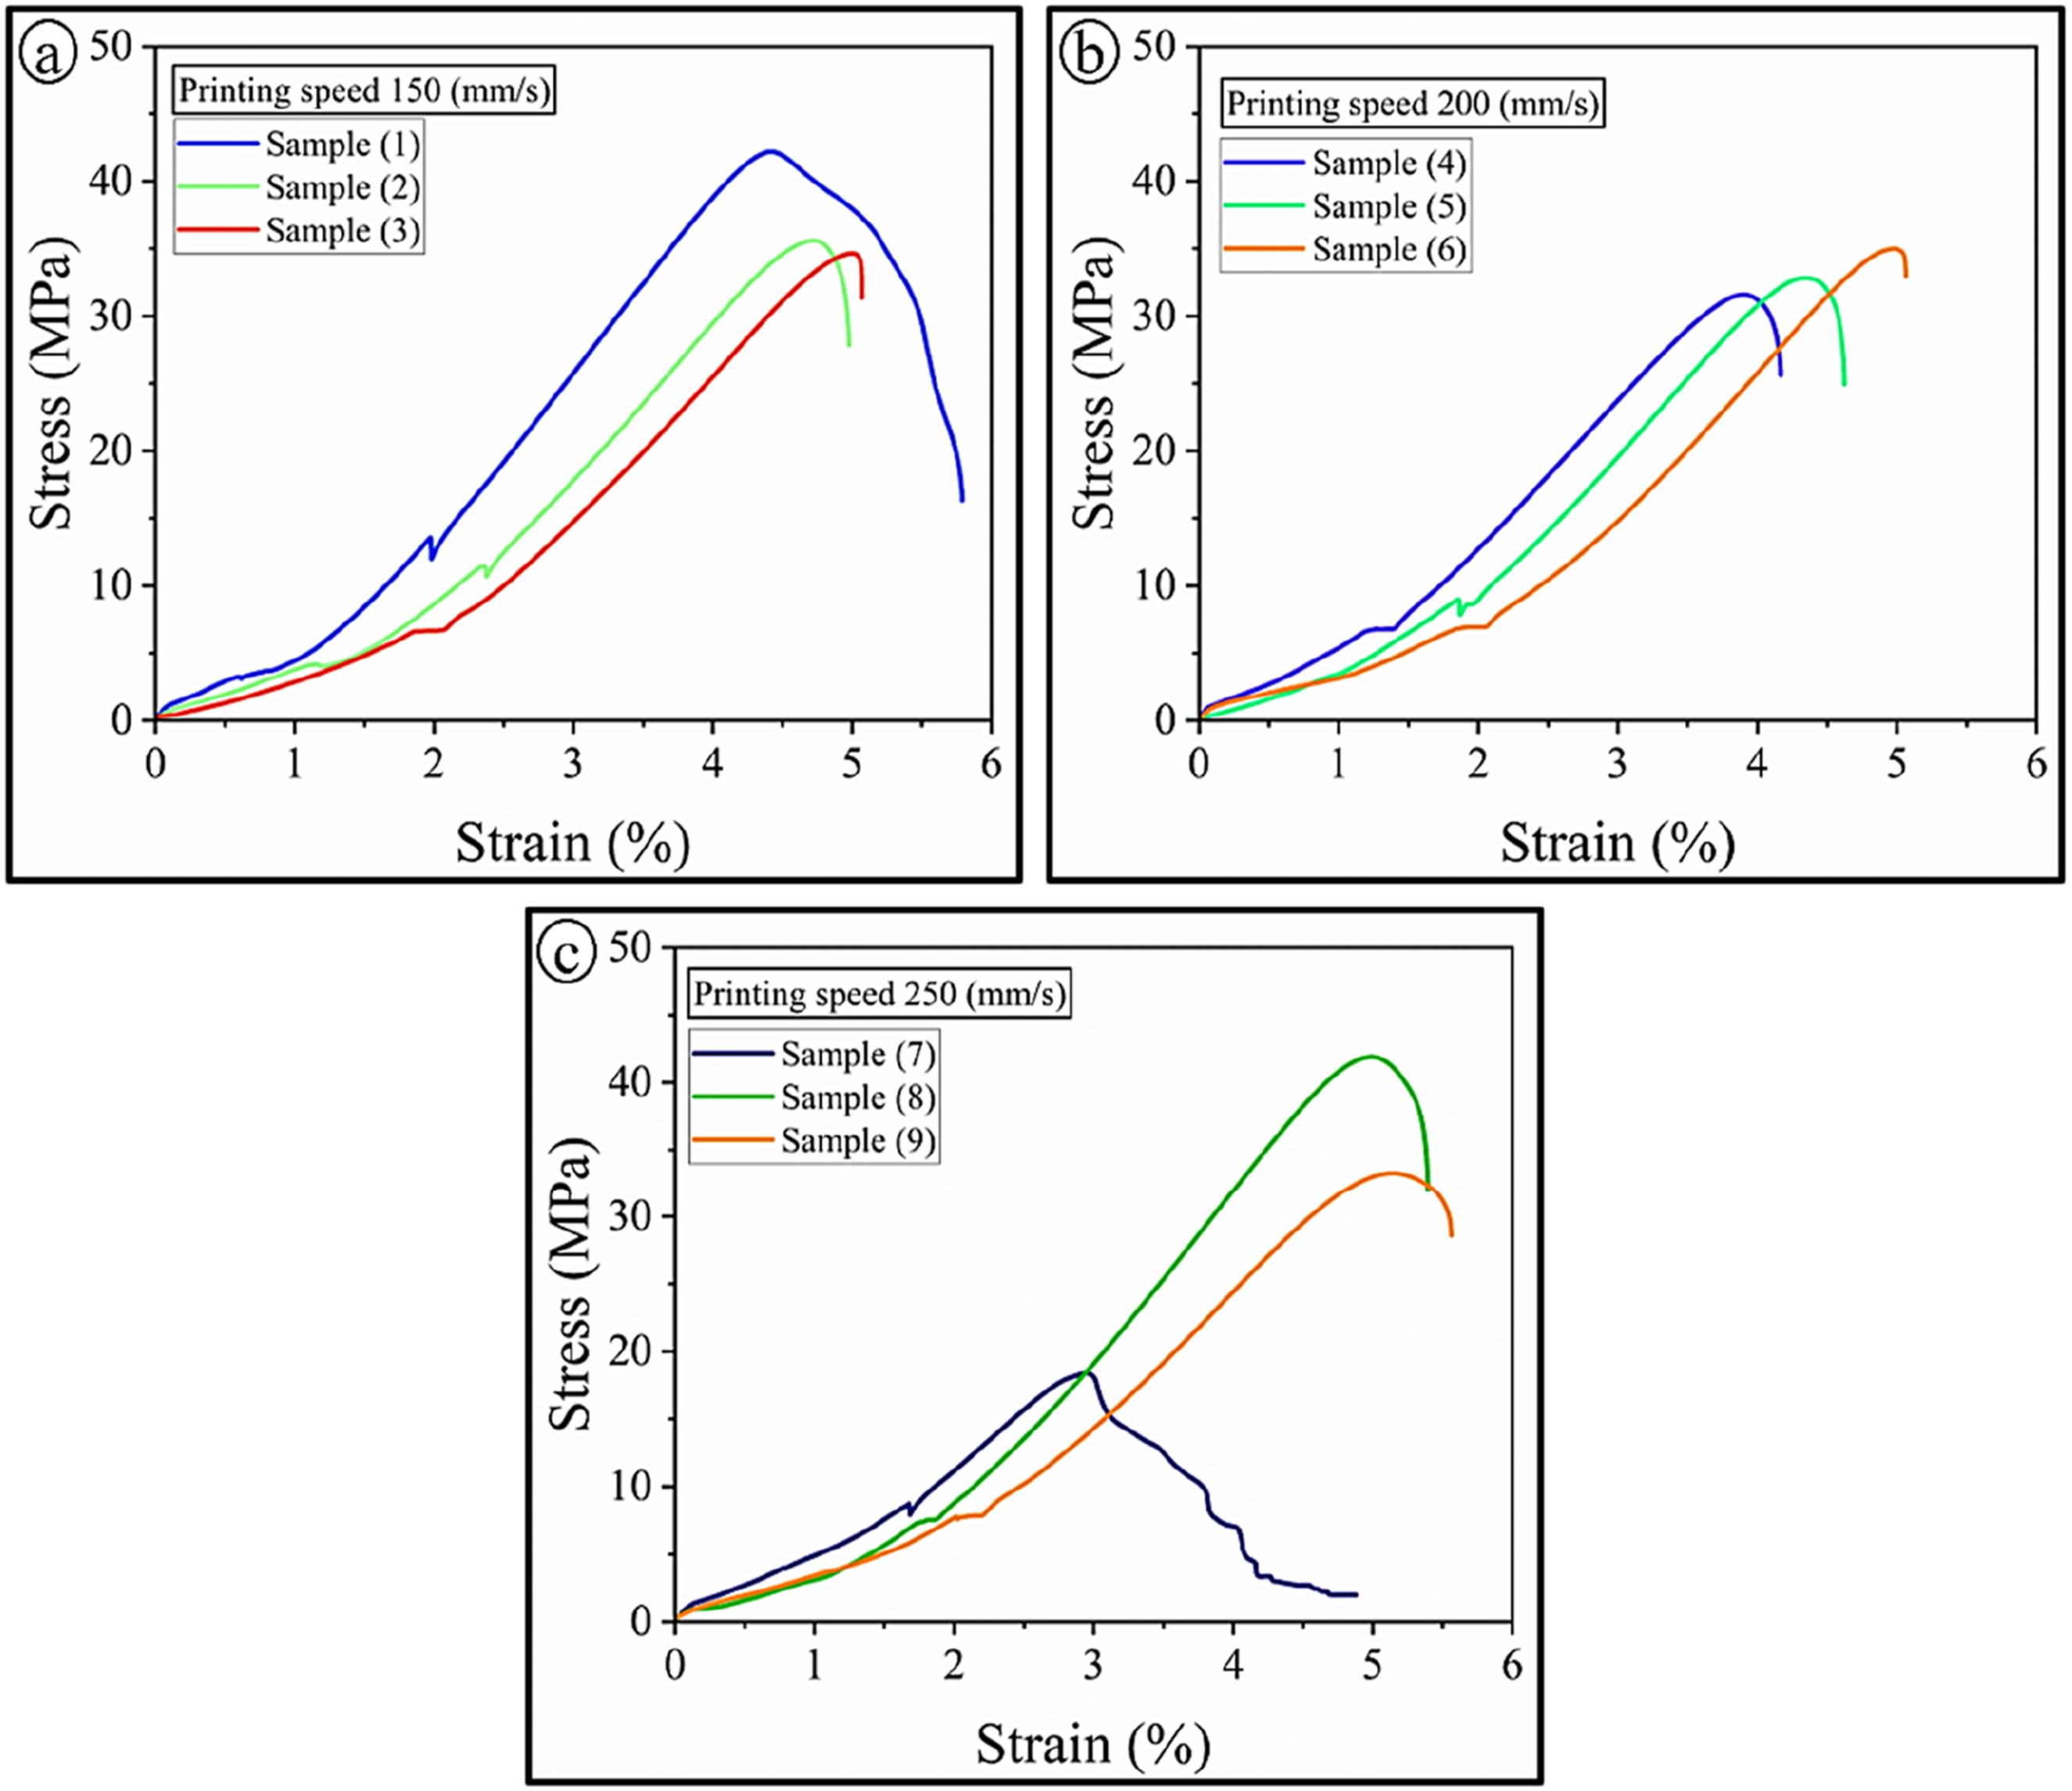
Figure 6 presents the surface profile traces measured along the tensile gauge length for all nine samples and confirms that conditions yielding superior mechanical performance also produce smoother surfaces (Figure 6(a)–(i)). Samples 1, 2, 4, and 8 exhibit relatively stable, low-amplitude roughness oscillations around the mean line (Ra ≈ 3–4 μm), corresponding to uniform filament deposition and good layer coalescence in the PLA-ABS Bi-layer Laminate. In contrast, Samples 3, 6, 7, and 9 show pronounced peaks and valleys, consistent with their higher Ra values and degraded tensile behaviour, particularly for Sample 6. These surface profiles indicate the presence of voids, under-extrusion marks, and interlayer gaps associated with thick layers and non-concentric infill paths.
56
Surface roughness profiles of ABS-PLA Bi-layer laminate specimens: (a) samples 1, (b) samples 2, (c) samples 3 (d) samples 4, (e) samples 5, (f) samples 6, (g) samples 7, (h) samples 8, and (i) samples 9.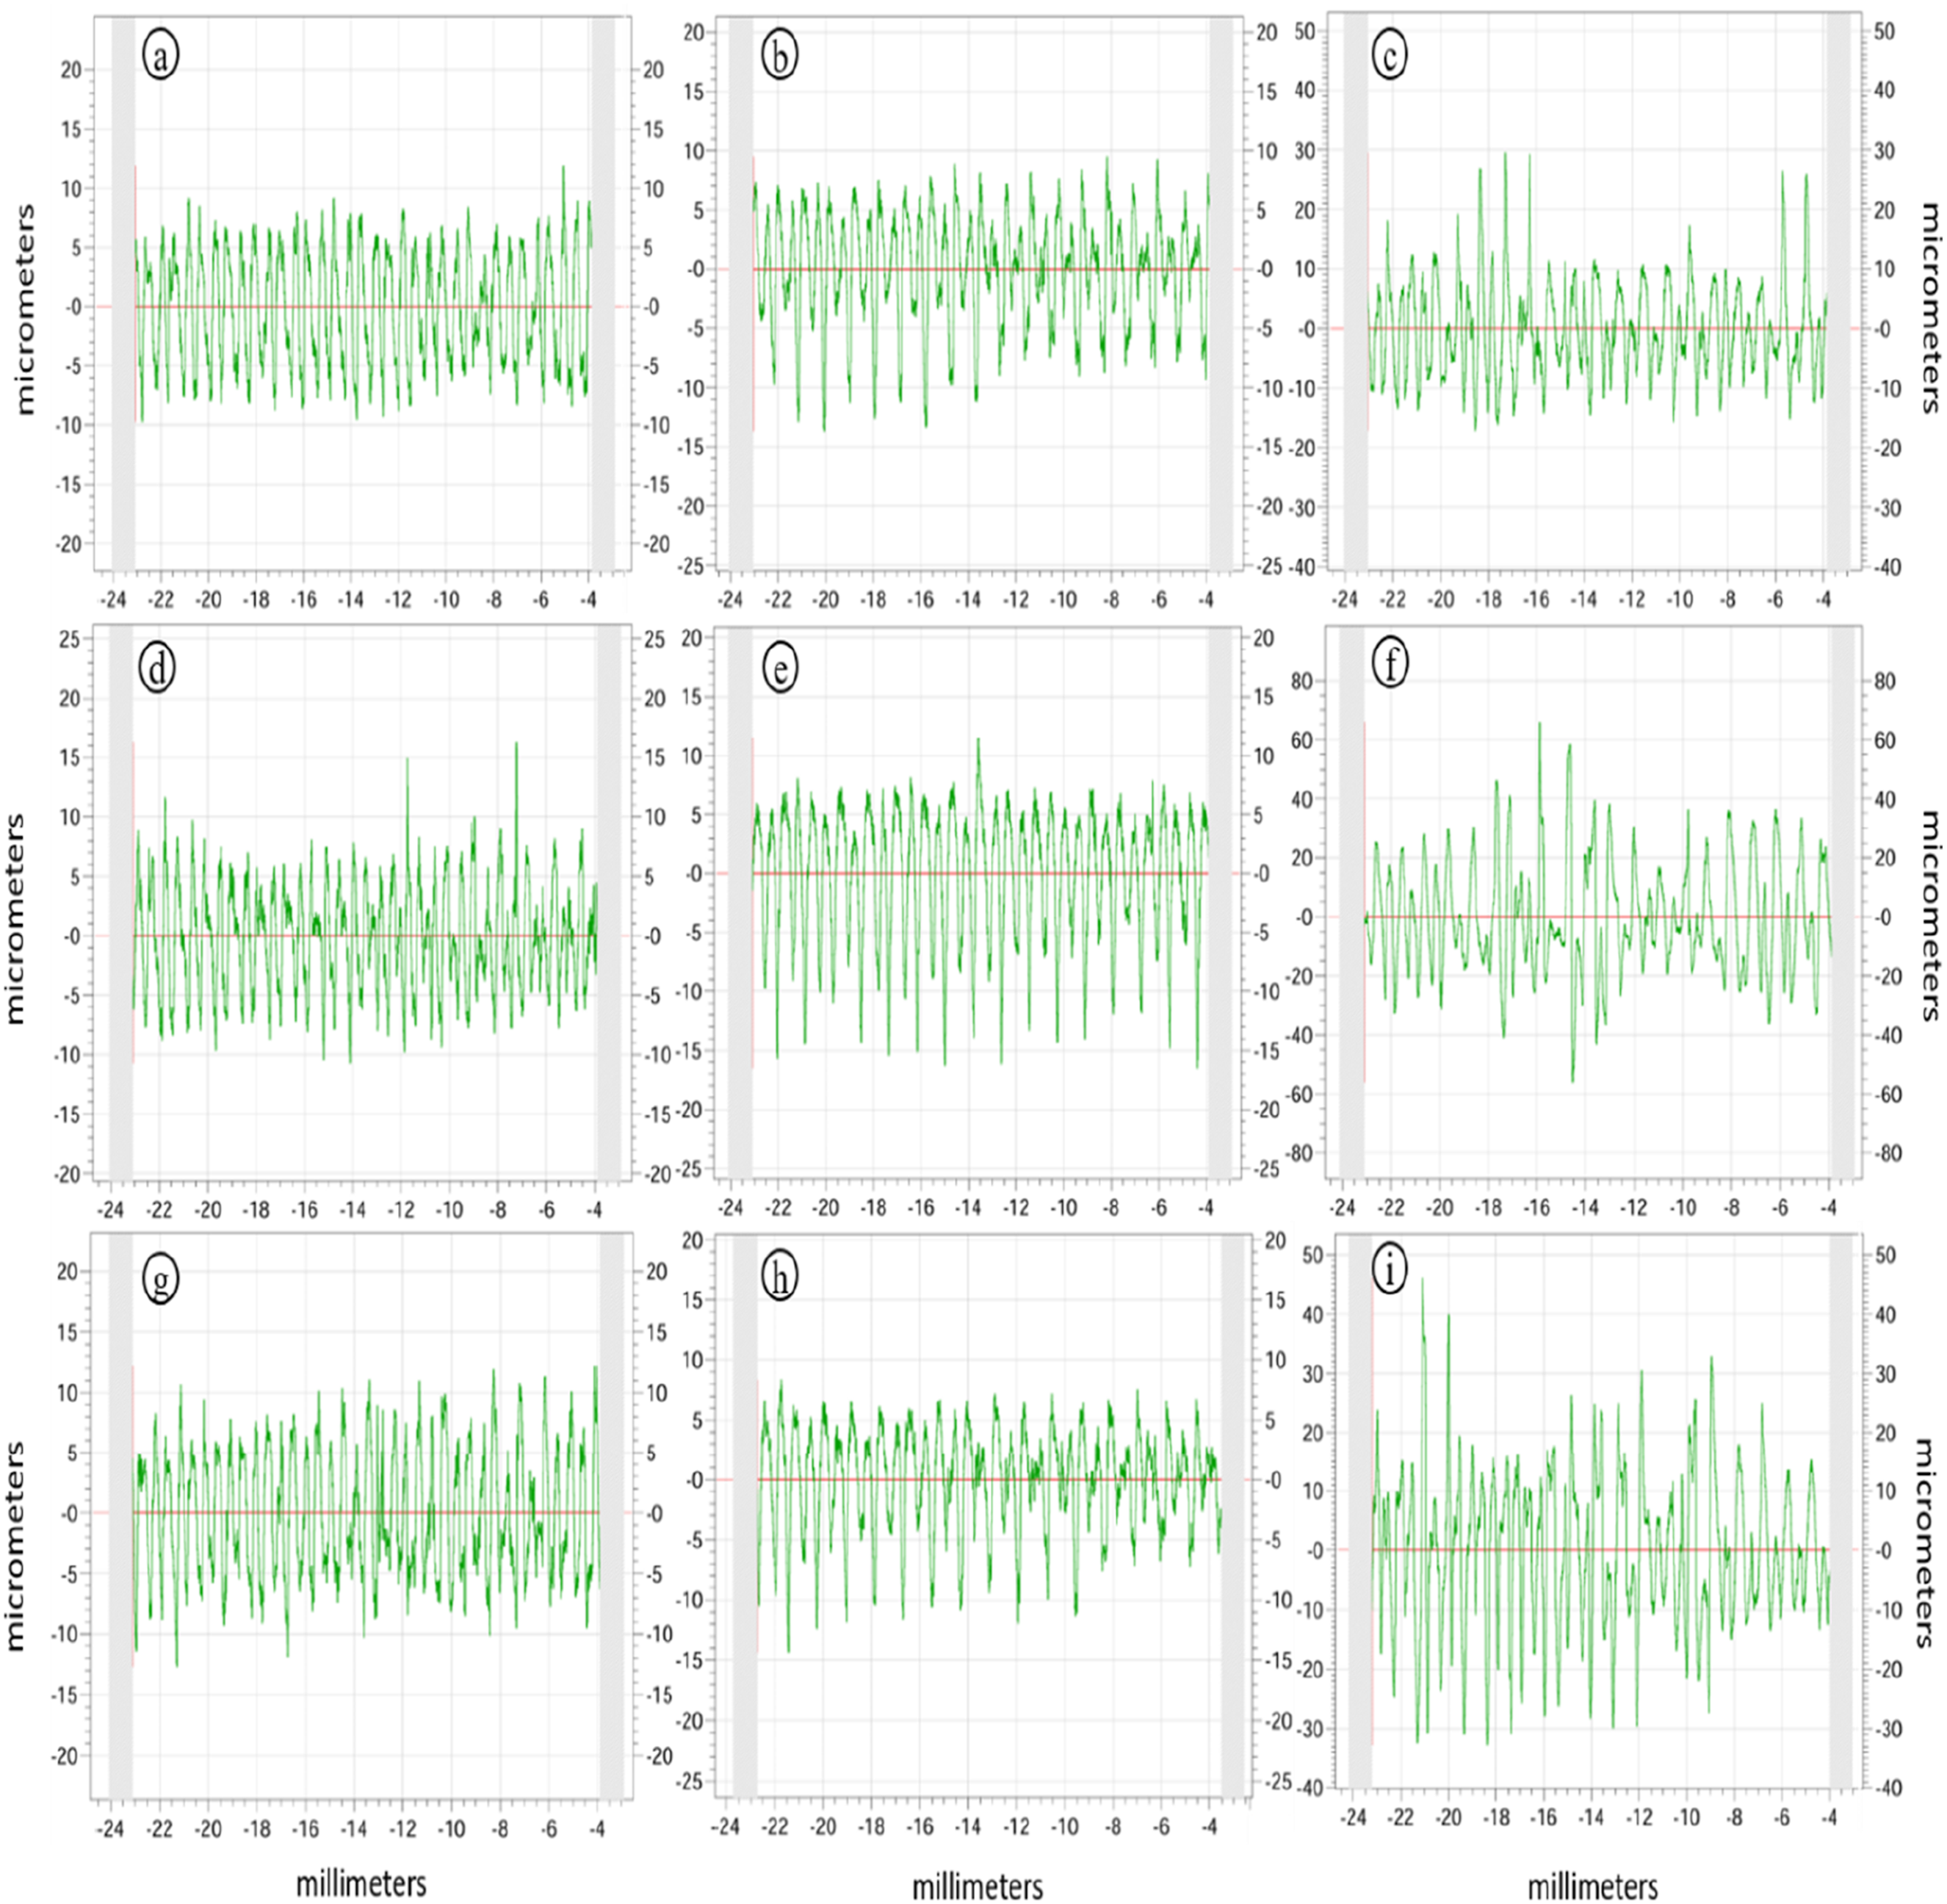
Figure 7 graphically summarizes the result of tensile testing and roughness measurement. Figure 7(a) highlights the superior E of Sample 1, attributed to thin layer height and concentric infill promoting uniform load transfer, whereas the reduced modulus of Sample 5 is associated with Hilbert-induced defects. Figure 7(b) confirms that Samples 1 and 8 achieve peak σUTS through effective skin loading, largely independent of printing speed. Figure 7(c) demonstrates that the ABS core sustains high Ɛf (>5.5%) when concentric infill is used. Finally, Figure 7(d) identifies the optimal Ra of Sample 8, attributed to enhanced filament fusion at higher printing speed, in contrast to the severe surface waviness of Sample 6 caused by excessive layer height.
35
To validate the Bi-laminate approach, the optimized PLA-ABS specimen (sample 1 σUTS = 42.17 MPa) was compared to standard mono-material data reported in the literature under similar FDM conditions. The laminate strength exceeds that of pure ABS specimens, which typically range between 30 and 35 MPa,16,25 but remains lower than pure PLA specimens, which can reach 50–60 MPa.
19
This indicates that the PLA-ABS Bi-laminate successfully synergizes the materials, it offers higher strength than a pure ABS part while providing the superior thermal and impact resistance of the ABS surface, which pure PLA lacks.
57
Tensile and surface roughness data: (a) E (MPa), (b) σUTS (MPa), (c) Ɛf (%), (d) Ra (μm).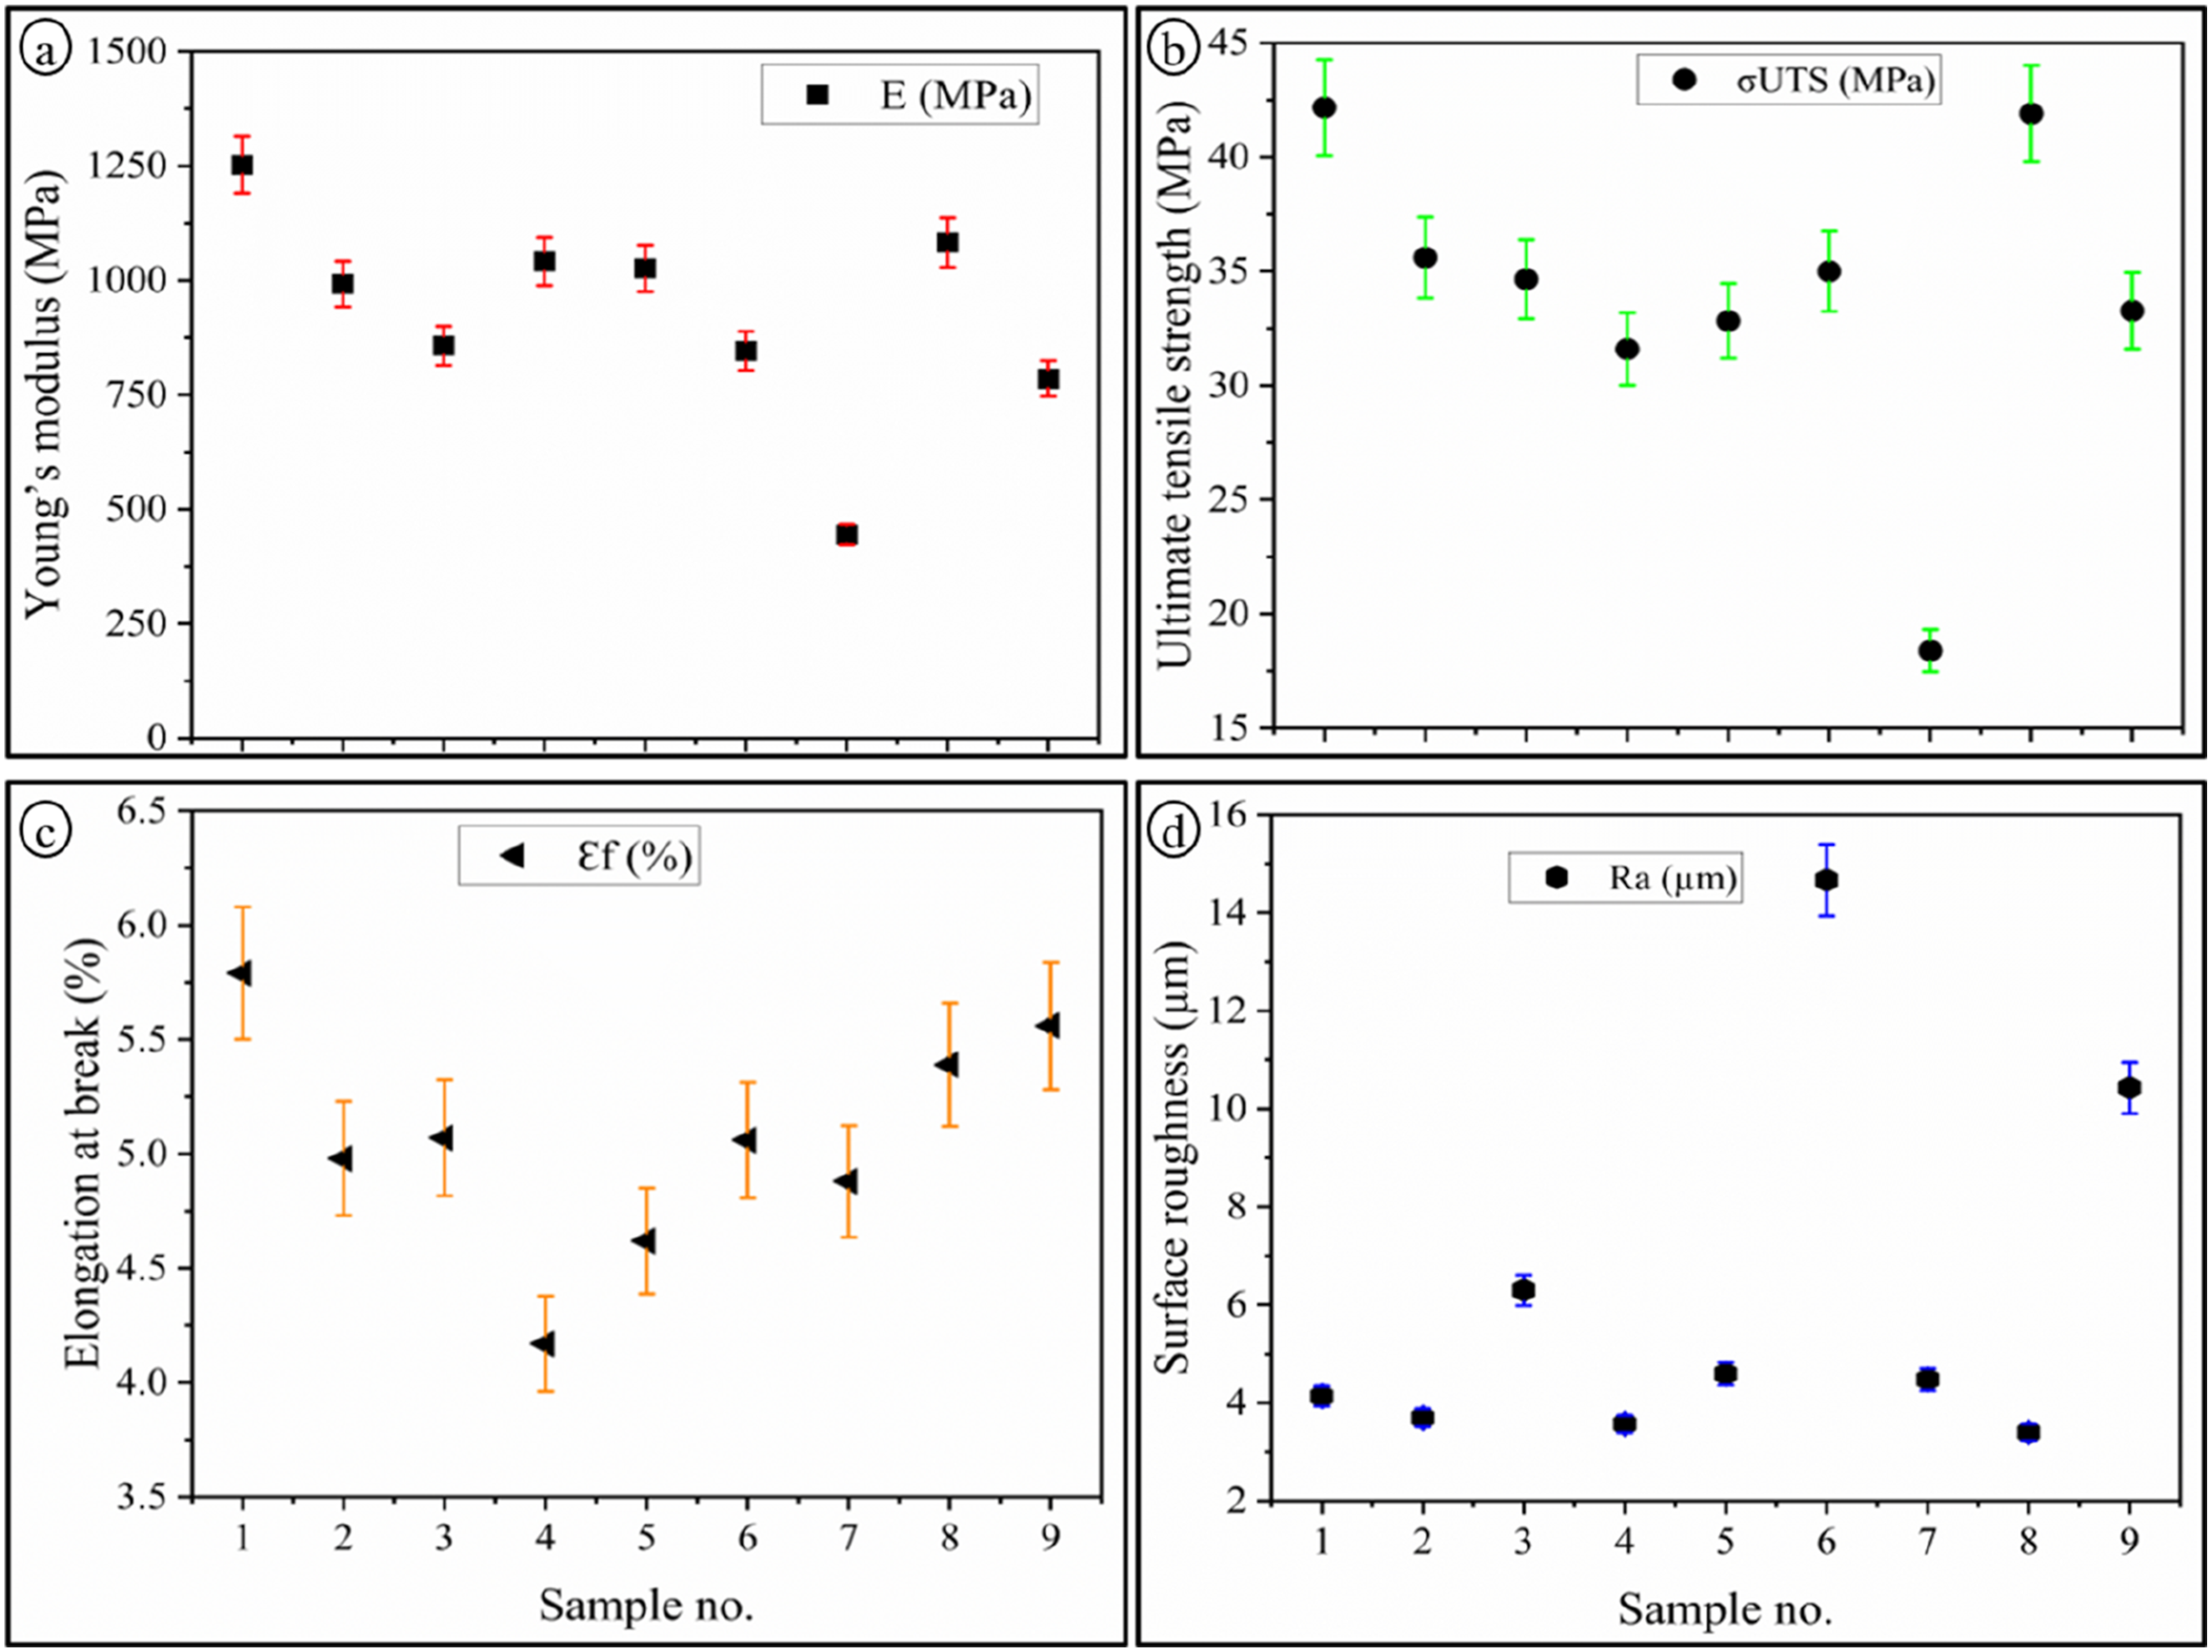
Taguchi analysis
Mean affect plots
Figure 8 presents the mean effect plots obtained from the Taguchi L9 analysis, highlighting the individual influence of printing speed, layer height, and infill pattern on the mechanical and surface characteristics of the 3D-printed Bi-layer Laminate structure. These plots show the average response at each factor level and assist in identifying optimal parameter settings in the absence of interaction effects.
27
Figure 8(a) shows the mean effects on E (MPa). A lower printing speed of 150 mm/s yields the maximum stiffness, which can be attributed to improved interlayer bonding and reduced void formation under slower deposition conditions. Layer height exhibits an increasing trend, with the highest E observed at 0.3 mm, as thicker layers enhance load transfer despite potential anisotropy.
30
The infill pattern significantly affects stiffness, with concentric and octagram configurations outperforming the Hilbert pattern, which introduces stress concentrations due to its complex toolpath.
43
Main effect plots from Taguchi L9 analysis showing individual influences of printing speed, layer height, and infill pattern on (a) Young’s modulus (MPa), (b) ultimate tensile strength (MPa), (c) elongation at break (%), and (d) surface roughness (μm).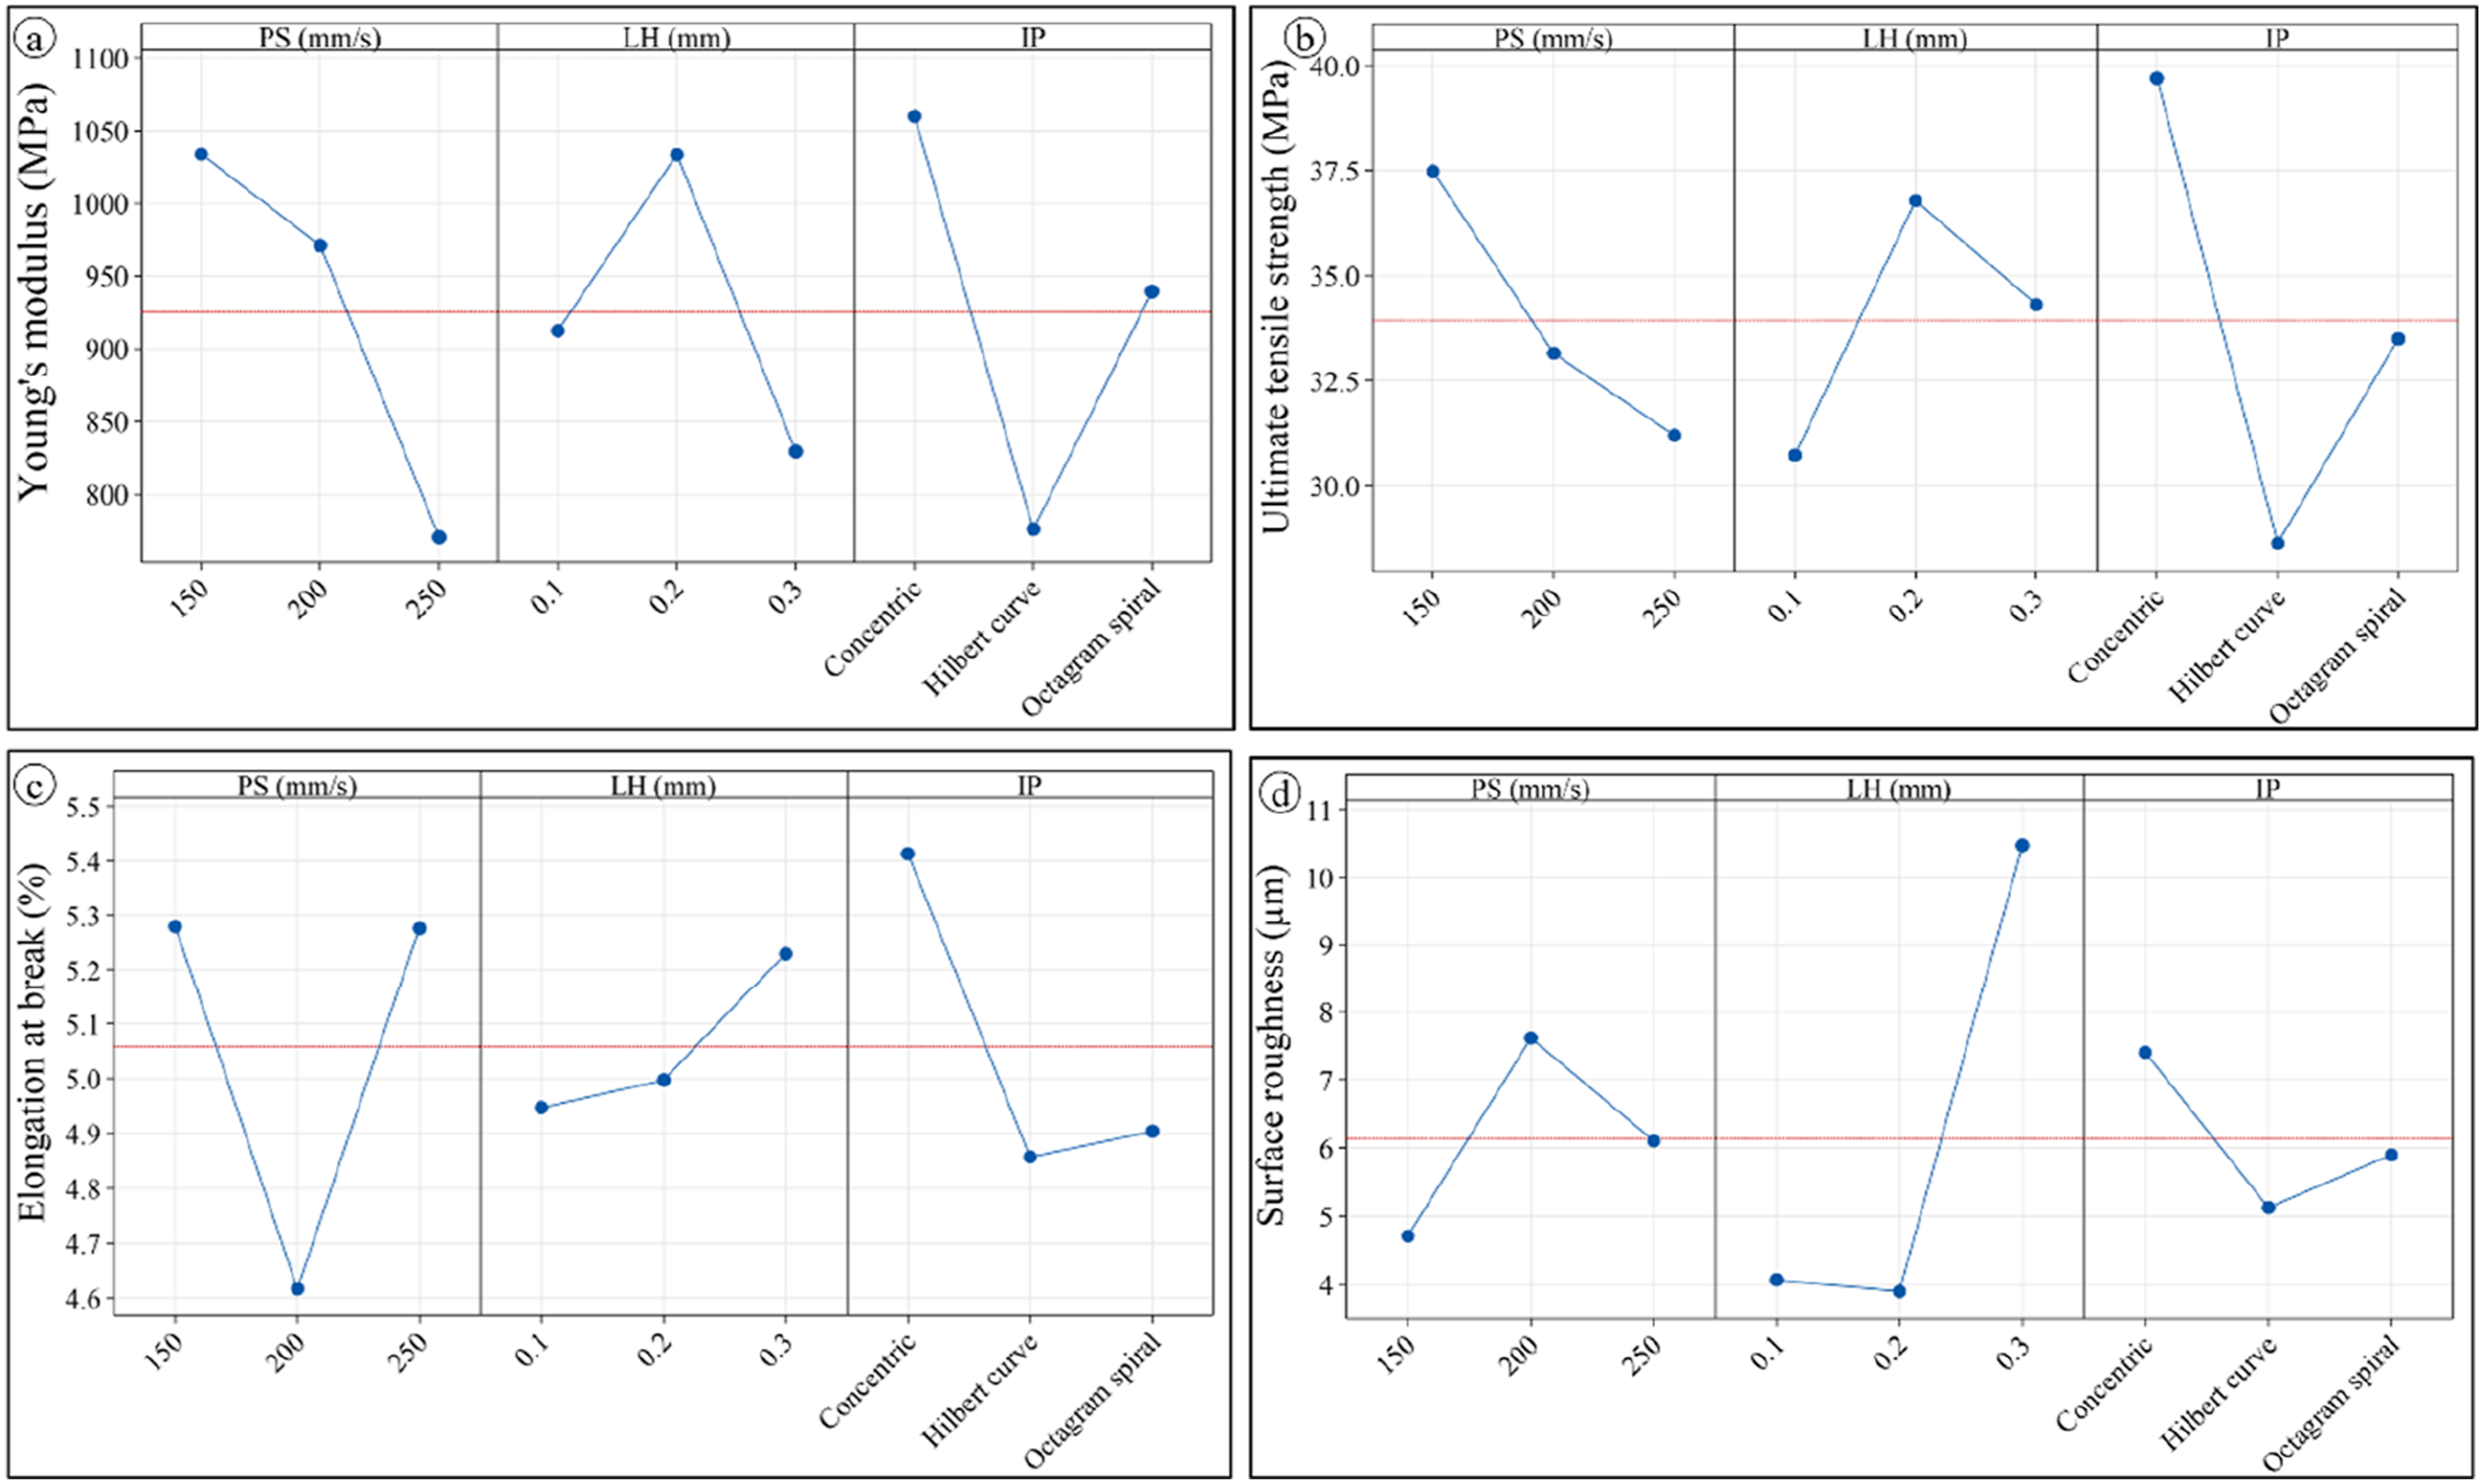
Figure 8(b) illustrates the response of σUTS (MPa). The maximum strength is achieved at a printing speed of 150 mm/s, resulting from enhanced filament fusion and reduced thermal gradients during extrusion. The optimal layer height is 0.2 mm, balancing interlayer bonding while avoiding over-extrusion effects at higher values. Among infill patterns, the octagram spiral provides the highest σUTS, followed by the concentric pattern, whereas the Hilbert pattern shows inferior performance, emphasizing the importance of continuous deposition paths for load transfer. 12 Figure 8(c) shows the variation in Ɛf (%), where layer height is the dominant factor. Ductility increases progressively from 0.1 to 0.3 mm due to reduced strain localization in thicker layers. Printing speed displays a U-shaped trend, with higher strain capacity at 150 and 250 mm/s compared to 200 mm/s. The concentric infill pattern produces the highest Ɛf, while the Hilbert and octagram patterns exhibit lower ductility due to non-uniform strain distribution. 29
Figure 8(d) presents the mean effects on Ra (µm). Higher printing speed (250 mm/s) reduces surface roughness by promoting rapid solidification and layer stabilization, thereby limiting sagging. A layer height of 0.2 mm provides the optimal surface finish by avoiding fine-layer stair-stepping at 0.1 mm and excessive waviness at 0.3 mm. The Hilbert infill pattern increases Ra due to frequent directional changes and overhangs, whereas concentric and octagram patterns yield smoother surfaces. Overall, the trends in Figure 8 indicate that a printing speed of 150 mm/s and a layer height of 0.2–0.3 mm combined with octagram or concentric infill enhance mechanical performance, while a printing speed of 250 mm/s and a layer height of 0.2 mm favour improved surface finish, enabling balanced parameter selection for hybrid optimization. 31
Single to noice ratio plots
Figure 9 presents the signal-to-noise (S/N) ratio plots obtained from the Taguchi L9 orthogonal array analysis, corresponding to the printing parameters and experimental responses previously shown in the mean effect plots. Unlike mean effect plots, the S/N ratios (higher-the-better criterion) emphasize parameter robustness by maximizing the signal (mean response) relative to noise (variation), thereby guiding the selection of stable processing conditions. The trends observed in Figure 9 are consistent with those in Figure 8 and highlight operating conditions that minimize response variability. Figure 9(a) illustrates the S/N ratios for E (MPa).
9
A printing speed of 150 mm/s yields the highest S/N ratio, indicating reduced stiffness variability due to improved cooling and inter-layer adhesion. A layer height of 0.3 mm further enhances robustness by promoting a more homogeneous microstructure. Among the infill patterns, concentric and octagram spirals outperform the Hilbert pattern, as the latter introduces higher variability due to its complex toolpath and non-uniform extrusion.
31
Signal-to-noise (S/N) ratio plots from Taguchi L9 analysis showing robustness effects of printing speed, layer height, and infill pattern on (a) Young’s modulus (MPa), (b) ultimate tensile strength (MPa), (c) elongation at break (%), and (d) surface roughness (μm).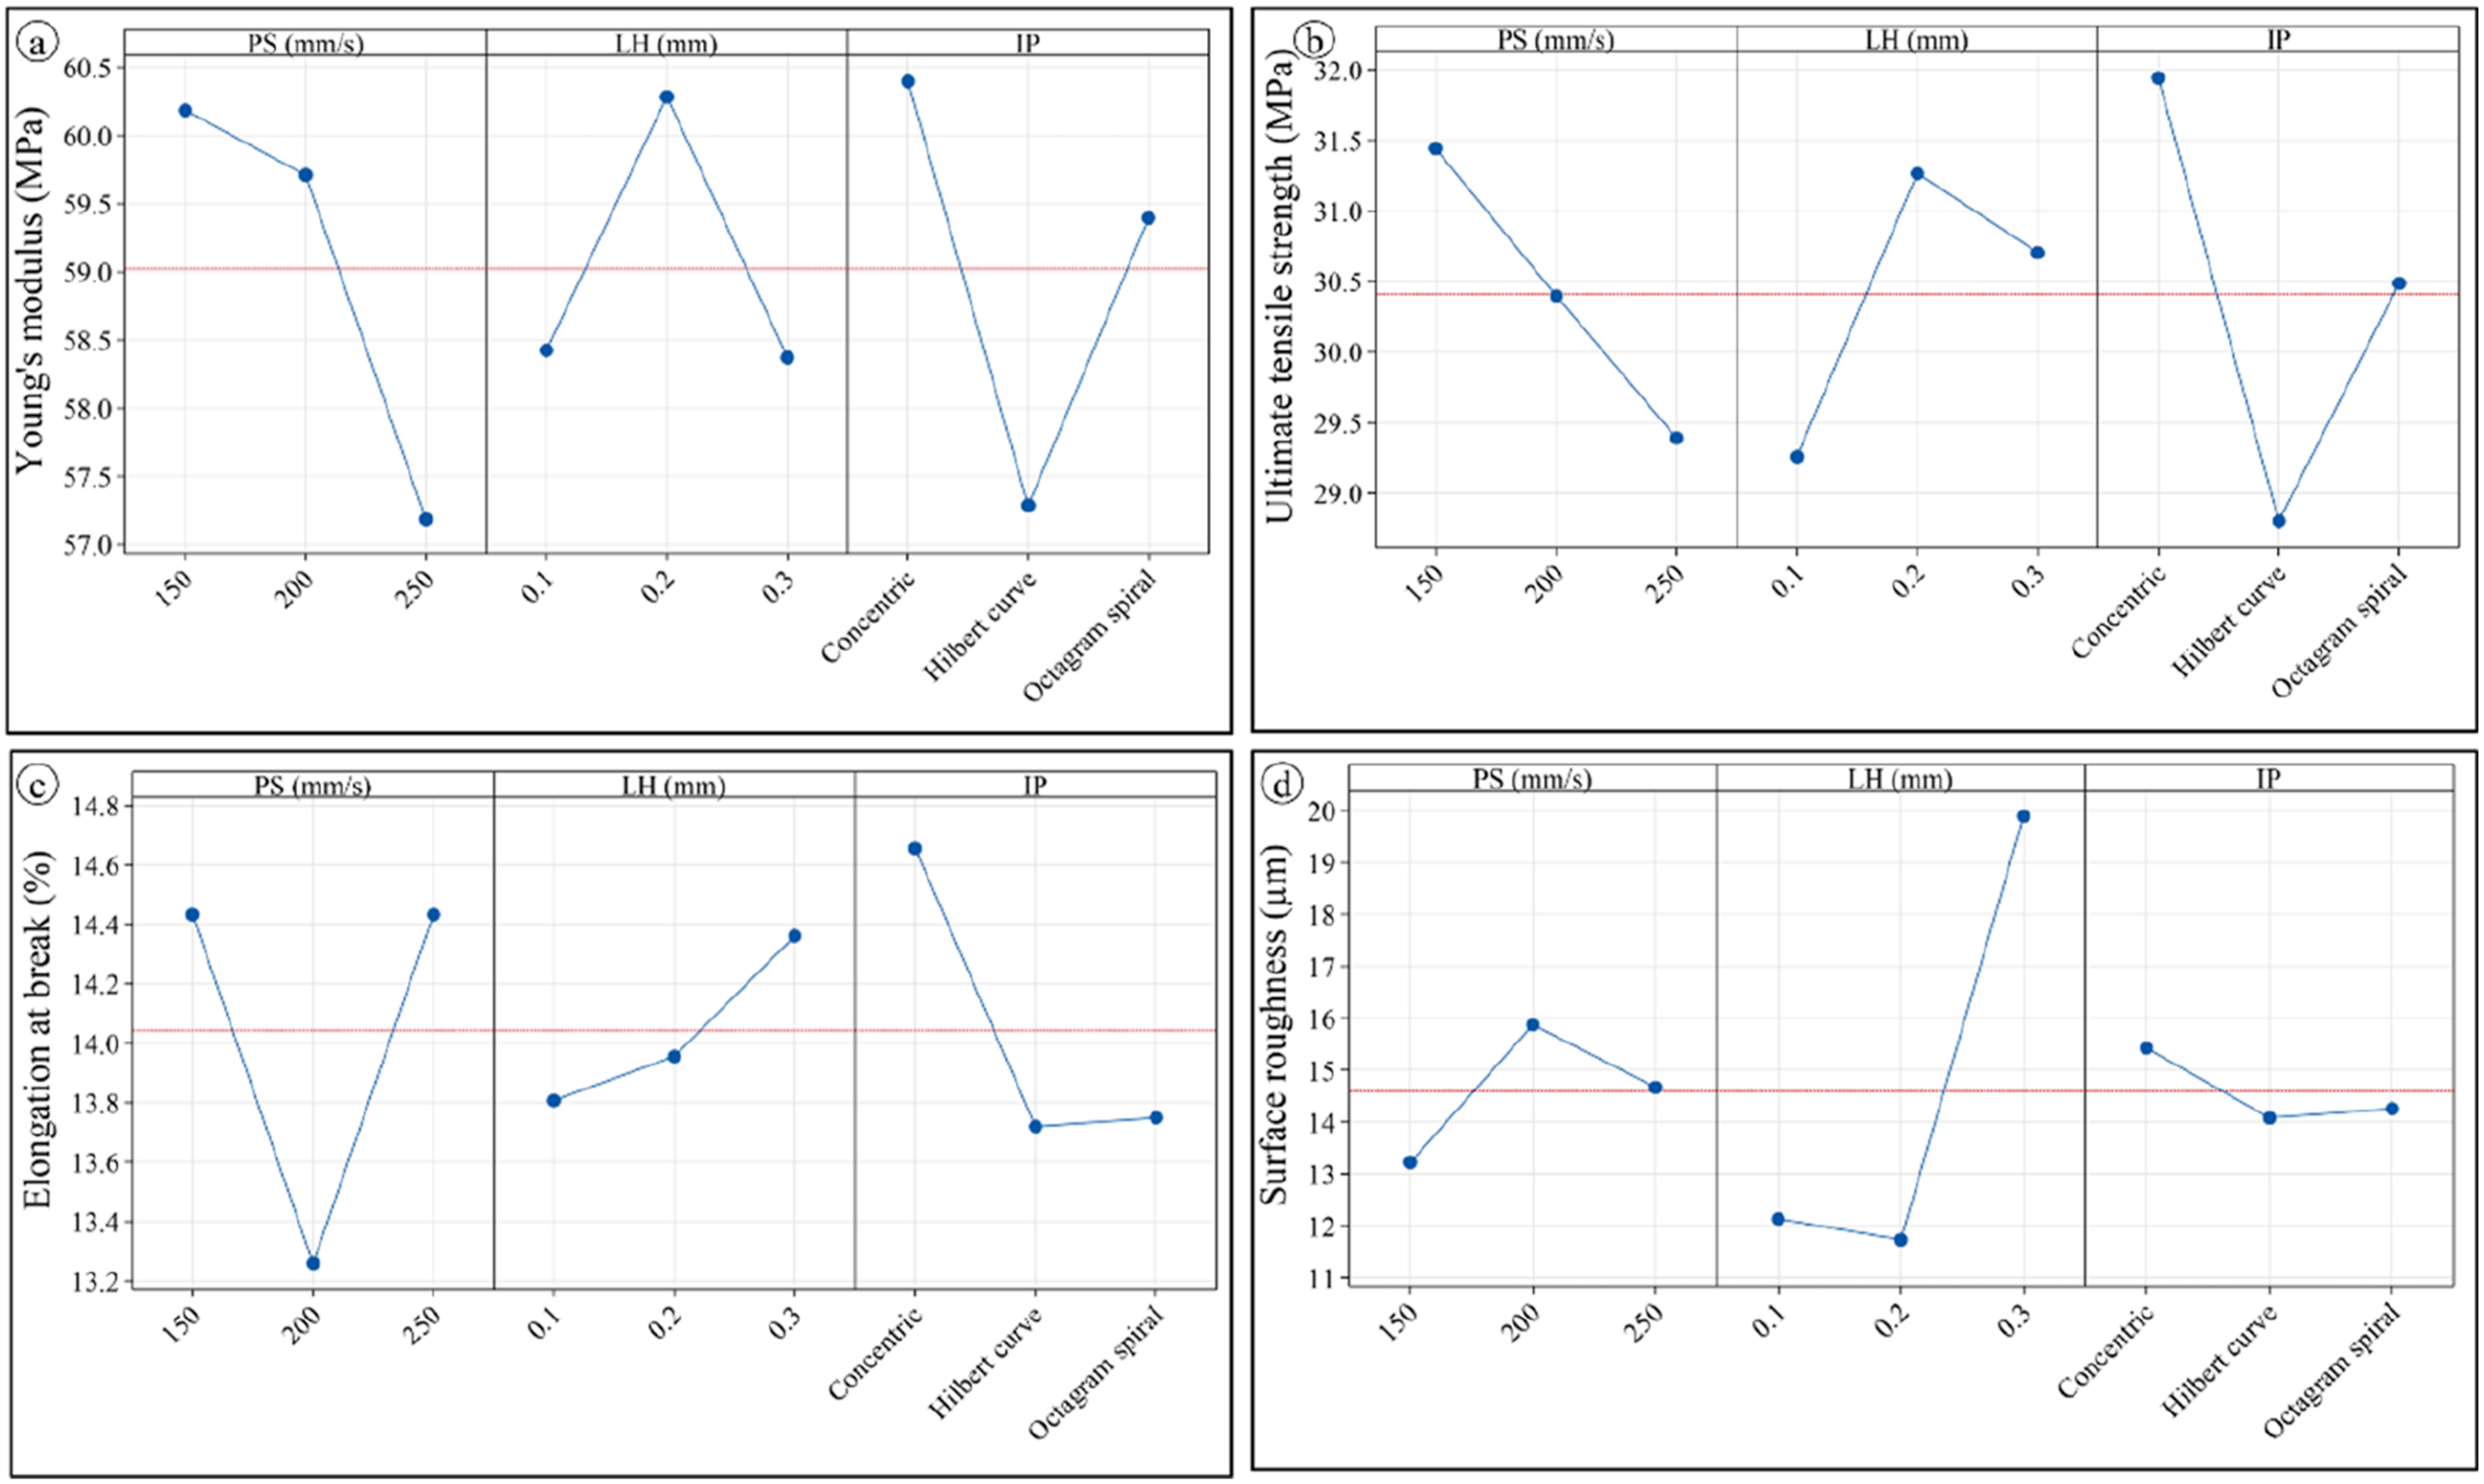
Figure 9(b) shows the S/N analysis for σUTS (MPa). The maximum S/N ratio is achieved at a printing speed of 150 mm/s, which enhances strength stability through improved inter-layer bonding. A layer height of 0.2 mm provides an optimal balance between deposition accuracy and defect formation. The octagram spiral infill exhibits the highest robustness, attributed to its symmetric load-transfer paths, whereas the Hilbert pattern increases variability due to irregular fibre bridging. Figure 9(c) presents the S/N ratios for Ɛf (%). 38 A layer height of 0.3 mm is optimal for ductility stability, as thicker layers reduce strain inconsistencies through improved matrix coalescence. A printing speed of 150 mm/s is preferred, since higher speeds increase variability due to warping effects. The concentric infill pattern provides the highest S/N ratio, indicating more uniform deformation and reduced variability in crack initiation compared to Hilbert and octagram patterns. 45 Figure 9(d) depicts the S/N ratios for Ra (μm) using the lower-the-better criterion. A printing speed of 250 mm/s results in the most stable surface finish due to rapid layer solidification, while a layer height of 0.2 mm improves Ra consistency by limiting resolution-related defects. Non-Hilbert infill patterns, particularly concentric and octagram, produce lower noise in surface roughness due to simplified toolpaths. Overall, the S/N analysis confirms that a printing speed of 150 mm/s, a layer height of 0.2–0.3 mm, and octagram or concentric infill patterns yield robust mechanical and surface properties. 58
ANOVA analysis
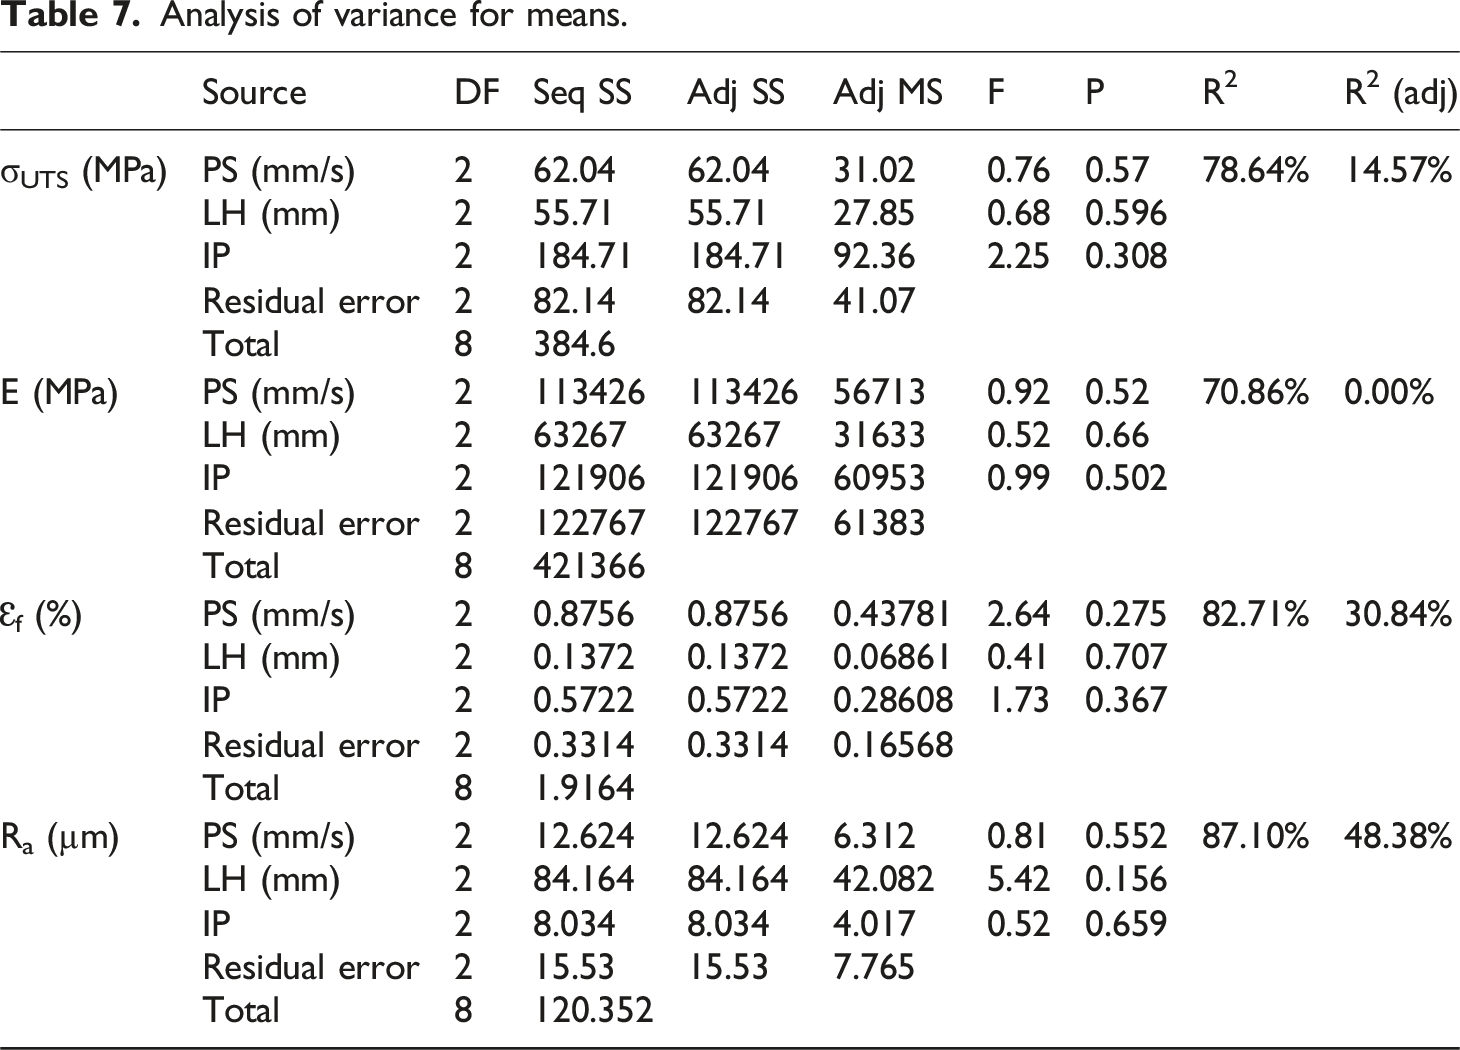
Analysis of variance for means.
Analysis of variance for single to noise ratios.
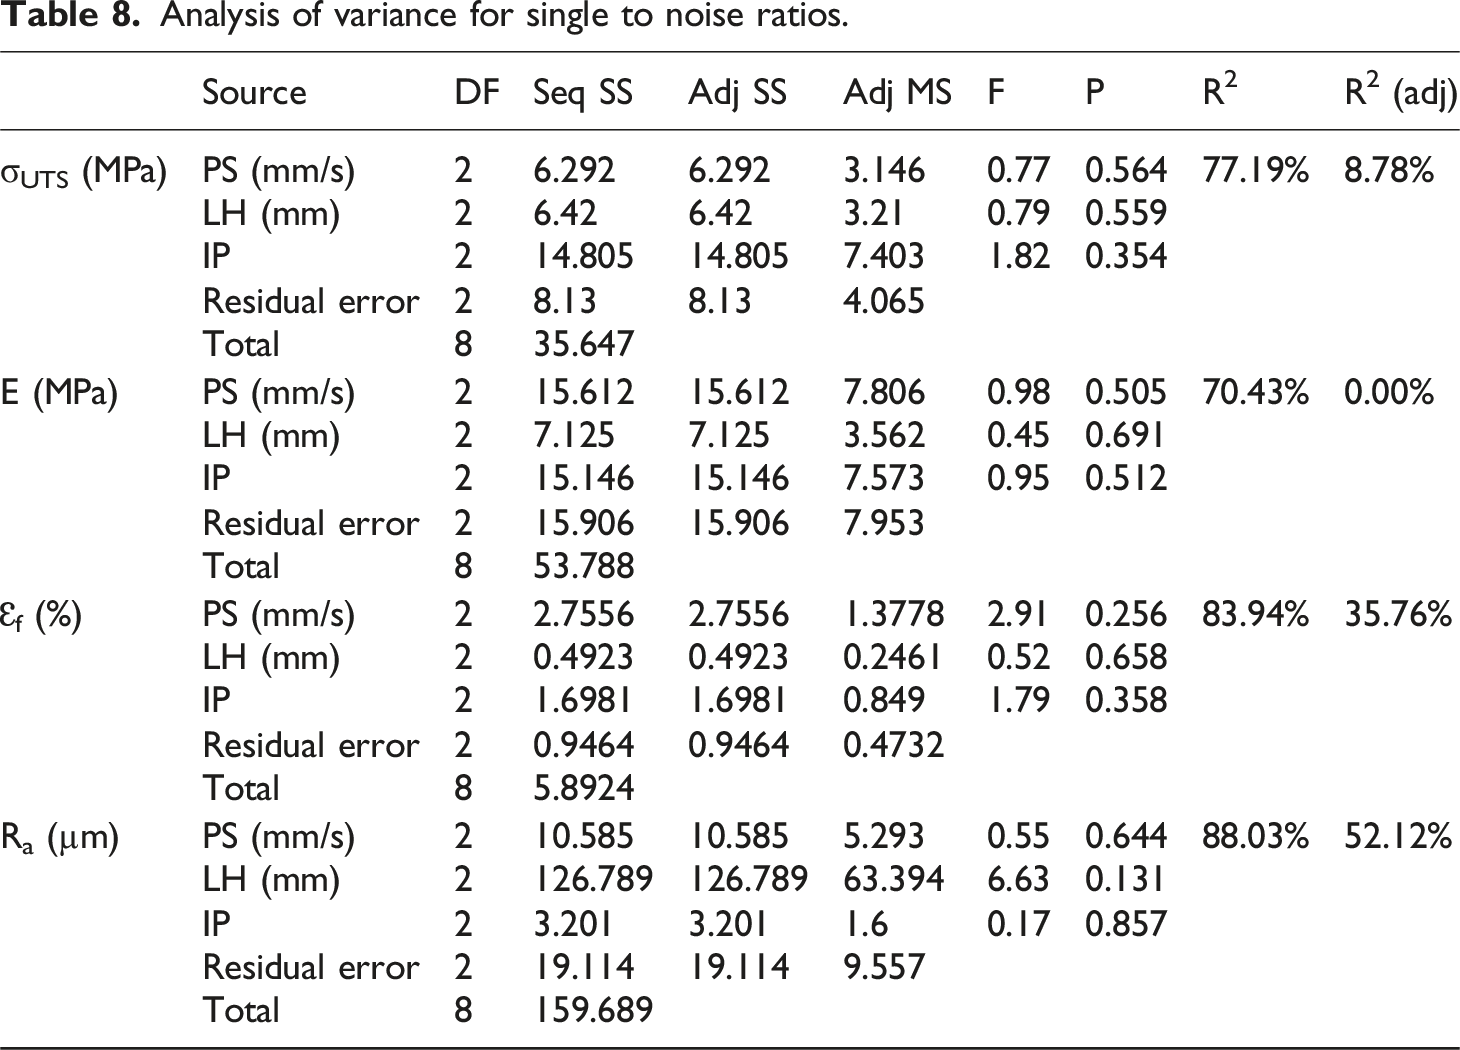
For Ɛf (%), printing speed emerges as the dominant factor. Table 7 shows the highest Seq SS (0.876) and F value (2.64), while Table 8 reports a corresponding S/N F value of 2.91. These results yield R2_adj values of 30.84% and 35.76%, quantitatively validating the U-shaped response observed in Figures 8(c) and 9(c). The comparatively low residual MS values enable clear detection of this effect, while infill pattern and layer height show secondary influence with F values below 2. 60 Surface roughness, Ra (µm), is strongly governed by layer height. Table 7 shows that layer height contributes 84.16 Seq SS, accounting for approximately 70% of the total variation, with an F value of 5.42. Similarly, Table 8 reports an even higher contribution of 126.79 Seq SS (79%) and an F value of 6.63. These dominant effects produce the highest R2 values of 87.10% and 88.03%, with R2_adj values of 48.38% and 52.12%, respectively. These findings are in excellent agreement with the trends observed in Figures 8(d) and 9(d) and are further supported by the low residual MS values, indicating high surface predictability. 61 The ANOVA results demonstrate strong statistical consistency between quantitative analysis and experimental trends. The Seq SS rankings closely follow the visual spreads in Figures 8 and 9, F values ranging from 0.5 to 6.6 confirm that factor effects exceed experimental noise, and high R2 values (69–88%) indicate substantial explanatory power. The moderate R2adj values reflect the limited DF while maintaining statistical credibility, confirming that the Taguchi screening successfully identifies reliable process parameter combinations for industrial fabrication. 62 The ANOVA revealed distinct dominant factors for different responses. Infill Pattern was the most significant factor for σUTS, contributing 47.9% to the total variation, confirming that raster alignment is critical for load bearing. 36 Conversely, Layer Height was the dominant factor for Ra, contributing 78.8%, which aligns with the geometric relationship between layer thickness and surface profile. 28 Printing Speed showed a significant contribution (∼30%) to Ɛf, influencing the thermal bonding history of the polymer chains.
Fractography of tensile fracture surfaces
The macroscopic fracture morphology of the tensile-tested specimens was examined using optical imaging, and the results are shown in Figure 10. Clear differences in fracture characteristics are observed between the ABS and PLA regions. The fracture surface of ABS in Figure 10(a) (Sample 1) exhibits a rough and irregular morphology with uneven edges and visible tearing zones. The crack path is non-linear, showing local deviations that indicate noticeable deformation prior to final failure.
63
The ABS side view in Figure 10(c) confirms that fracture occurred within the gauge section, demonstrating proper tensile loading. A slight reduction in cross-sectional area near the fracture region suggests localized plastic deformation. Similarly, the ABS side view of Sample 5 in Figure 10(e) shows fracture within the central region of the specimen. The fracture surface of ABS in Sample 5 (Figure 10(g)) reveals a distinct layered structure, where crack propagation follows a step-like path along the printed layers. This behaviour indicates that interlayer interfaces acted as preferential crack paths, highlighting the influence of layer bonding on the failure behaviour of FDM-fabricated parts.
64
Optical and fractographic analysis of specimens. Sample 1: (a) ABS fracture surface (Sample 1), (b) PLA fracture surface (Sample 1), (c) sample 1 ABS side view, (d) sample 1 PLA side view, (e) sample 5 ABS side view, (f) sample 5 PLA side view, (g) ABS fracture surface (sample 5), (h) PLA fracture surface (sample 5).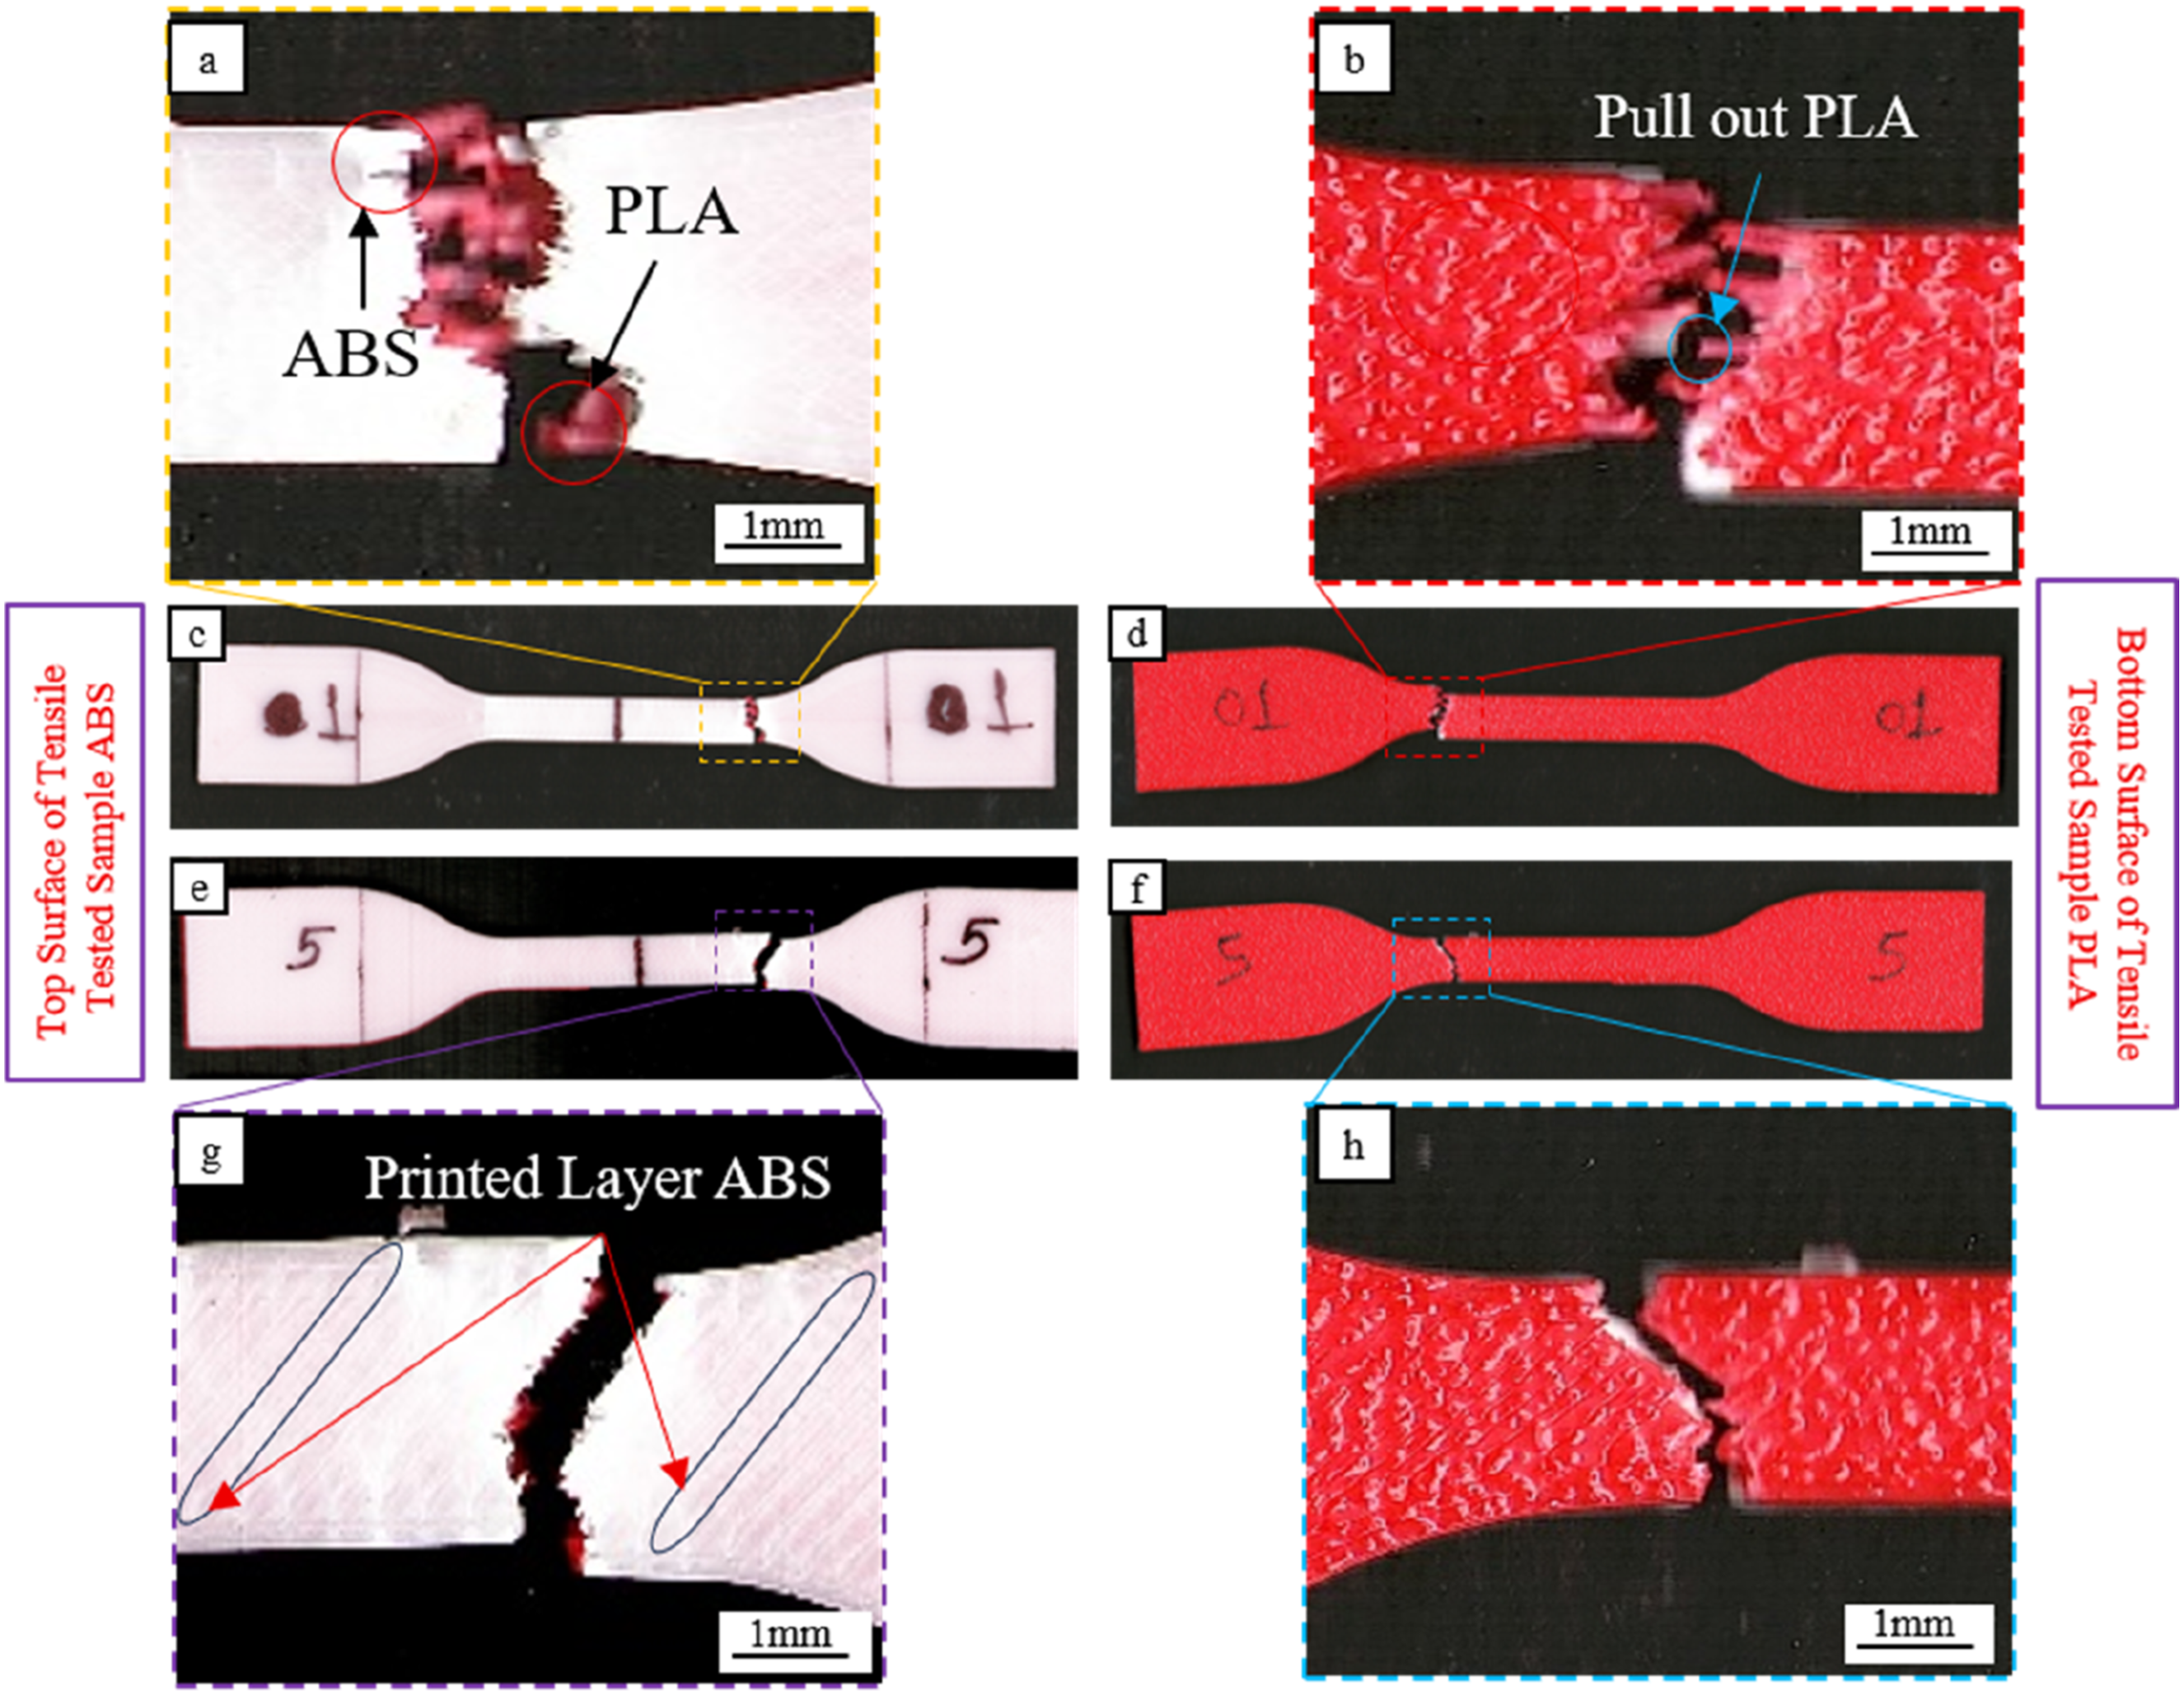
In contrast, the PLA fracture surfaces exhibit comparatively flatter and sharper features. The PLA fracture surface in Figure 10(b) (Sample 1) shows a localized fracture region with a cleaner separation between the fractured halves. The presence of a pull-out region suggests localized detachment, likely associated with weaker inter-raster or interlayer bonding. 65 The side views in Figure 10(d) (Sample 1) and Figure 10(f) (Sample 5) display relatively straight fracture paths across the cross-section with minimal visible necking. The PLA fracture surface in Figure 10(h) (Sample 5) appears more planar with limited tearing, indicating rapid crack propagation. Overall, the optical observations show that ABS exhibits a rough fracture surface and clear signs of plastic deformation, reflecting a semi-ductile failure response. In contrast, PLA displays sharper and more planar fracture features, characteristic of a brittle tensile failure mode. The layer-oriented fracture morphology, particularly evident in ABS (Figure 10(g)), confirms that failure behaviour is strongly governed by interlayer adhesion inherent to the FDM process. 1
To gain a deeper understanding of the failure mechanisms (Figure 11), the fractured tensile specimens were examined using Scanning Electron Microscopy (SEM). The analysis was performed using a TESCAN MAIA3 XMH Field Emission Scanning Electron Microscope (FE-SEM). Imaging was carried out at an accelerating voltage of 5 kV and a working distance of approximately 9–10 mm in Secondary Electron Imaging (SEI) mode, which provides detailed surface topography and enables clear observation of interlayer bonding and fracture features.
66
While direct interlaminar shear strength (ILSS) tests were not conducted in this study, the global tensile strength serves as a macroscopic indicator of interfacial bonding quality. In multi-material FDM parts, weak adhesion typically results in delamination failure at stresses significantly lower than the yield strength of the constituent materials.
26
The high σUTS observed in optimal specimens (sample 1 is > 42 MPa) suggests that the PLA-ABS interface achieved sufficient thermal fusion to transfer load effectively. SEM micrographs (Figure 11) confirm this, showing rough fracture surfaces and material pull-out at the interface, characteristic of cohesive failure, rather than the smooth surfaces associated with adhesive delamination failure.
52
SEM images of tensile-fractured specimens: (a) layered PLA-ABS structure of Sample 1, (b) voids and partially bonded, (c) micro voids and ductile fracture features, (d) fractured PLA layers of Sample 5 showing interlayer debonding and (e) infill gaps and non-uniform layer bonding in Sample 5.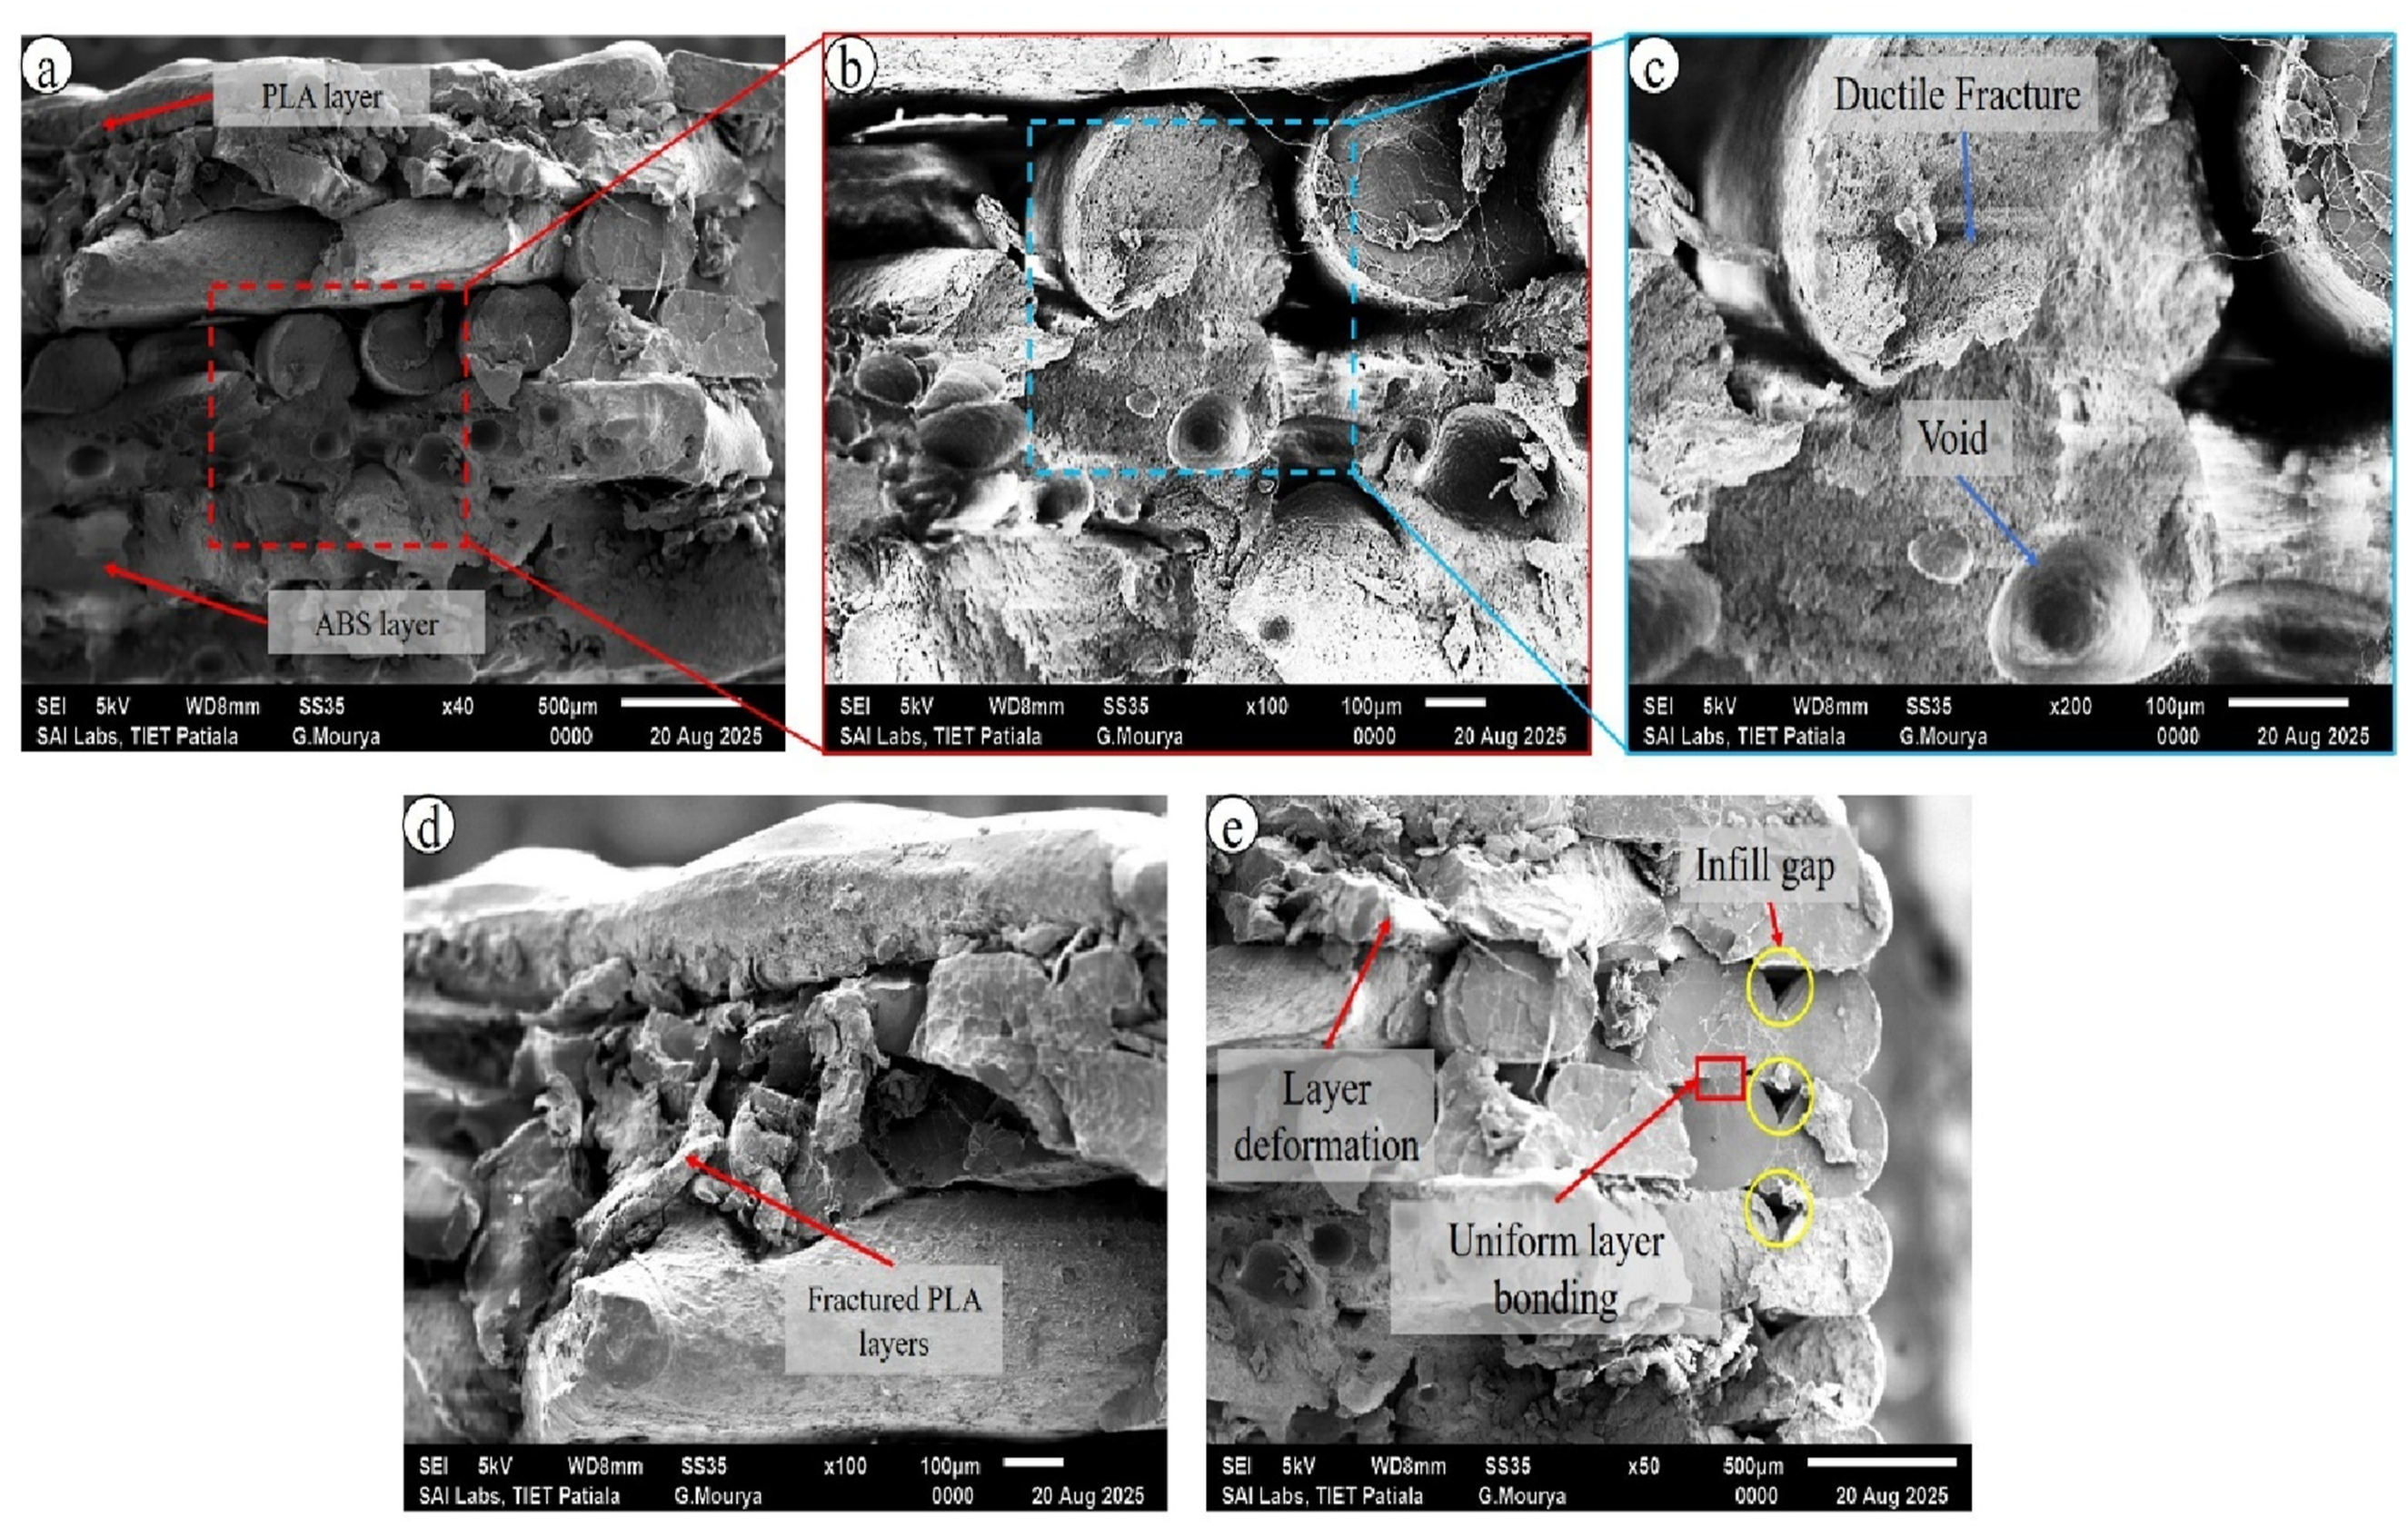
The low-magnification SEM micrograph of Sample 1 (Figure 11(a)) clearly reveals distinct PLA and ABS layers, confirming the layered architecture produced during the FDM process. The fracture surface appears uneven, with visible separation between adjacent layers, indicating that interlayer interfaces significantly influenced the failure process. This morphology highlights the anisotropic nature of the printed material, where interlayer bonding governs the mechanical response. At higher magnification (Figure 11(b)), micro-voids, small cavities, and regions of partially bonded rasters are observed. 67 These defects suggest that crack initiation occurred at inherent structural discontinuities, such as inter-raster gaps formed during deposition. Incomplete fusion between neighbouring filaments created localized stress concentration sites, promoting crack nucleation under tensile loading. Further magnification (Figure 11(c)) shows rough fracture regions with micro-voids and torn surfaces, which are characteristic of ductile fracture behaviour involving plastic deformation followed by void growth and coalescence. These observations are consistent with optical analysis, which indicated noticeable deformation in Sample 1 prior to fracture and a comparatively improved tensile response. 67
In contrast, the SEM micrograph of Sample 5 (Figure 11(d)) shows fractured PLA layers with pronounced interlayer debonding and delamination. Several regions of the fracture surface appear relatively planar, indicating rapid crack propagation along weak layer interfaces. 68 Compared with Sample 1, fewer features associated with plastic deformation are observed, suggesting a more brittle mode of failure. The higher-magnification image in Figure 11(e) further reveals infill gaps, localized layer distortion, and non-uniform bonding between adjacent layers. 67 These discontinuities act as stress raisers, facilitating early crack initiation and unstable crack growth under tensile loading. The presence of such defects explains the reduced tensile performance of Sample 5, as poor interlayer fusion limits the material’s ability to sustain applied stress. From this SEM examination, it is clear that the fracture behaviour of the printed specimens is governed by interlayer adhesion, raster bonding quality, and void content. Specimens with uniform layer bonding exhibit ductile fracture features, whereas those with significant interlayer defects predominantly fail through interlayer separation and rapid crack propagation. 66
Comparative analysis
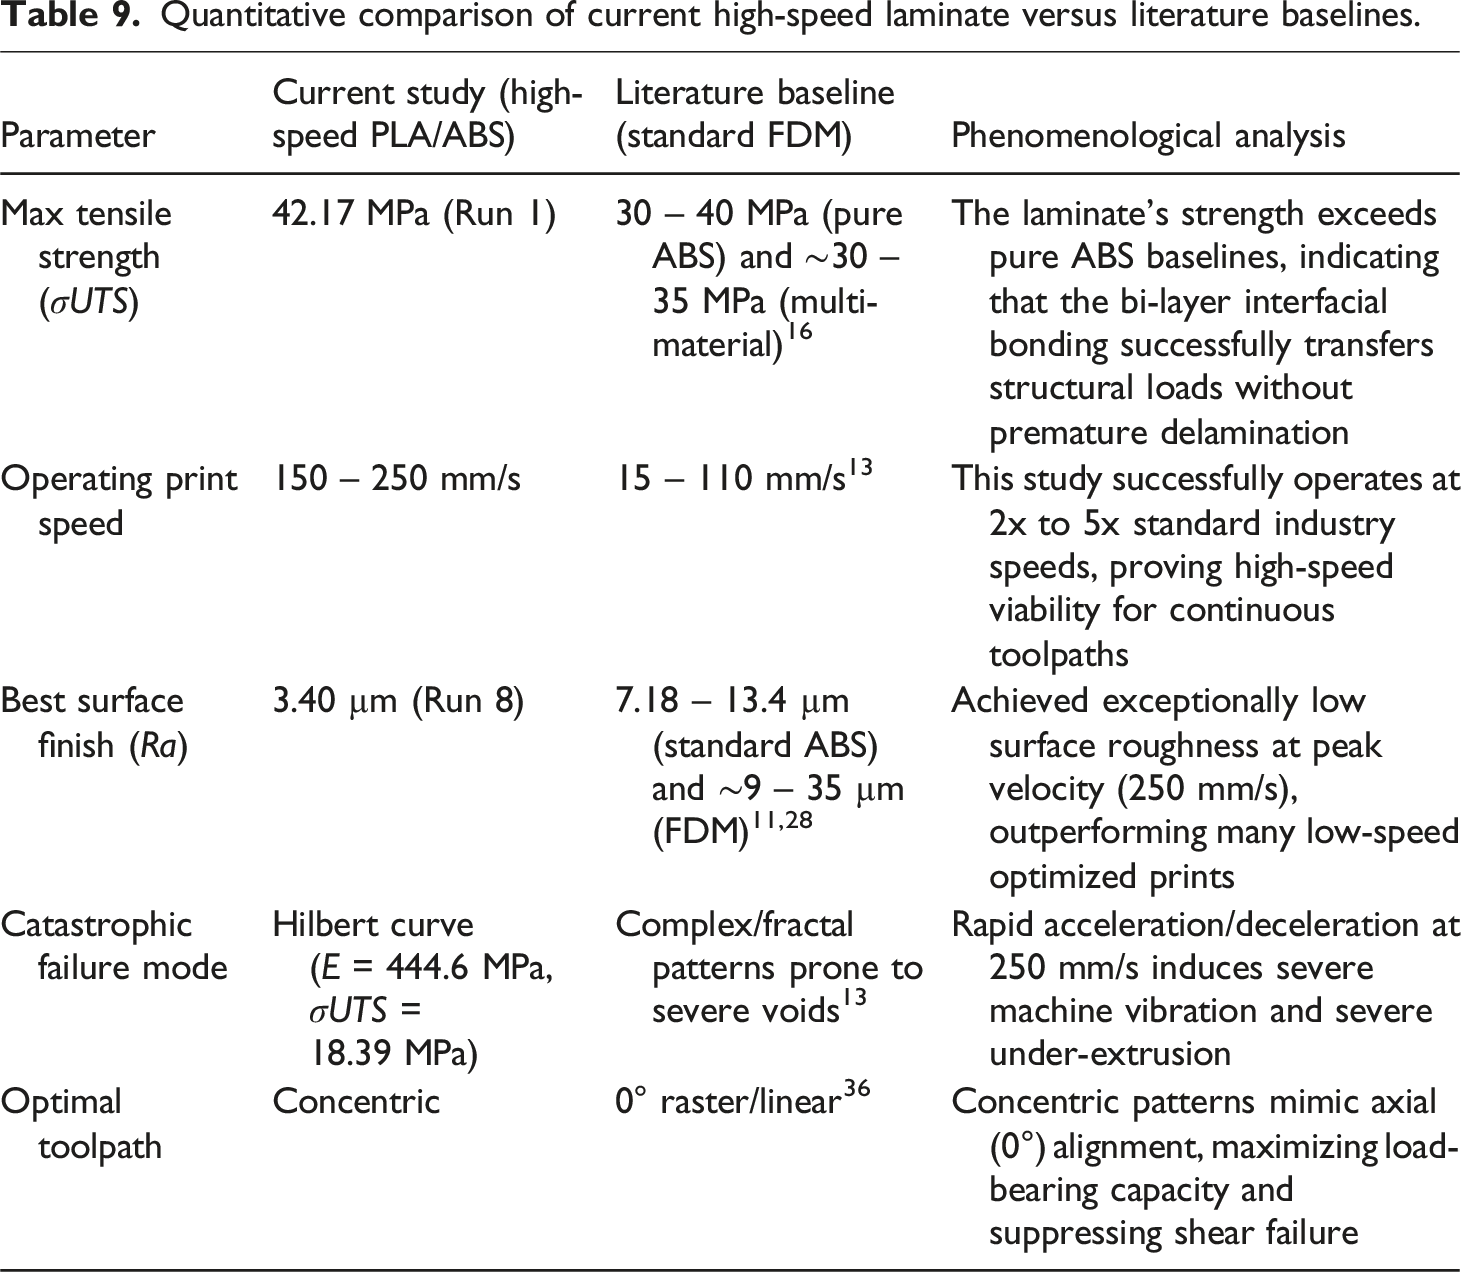
Quantitative comparison of current high-speed laminate versus literature baselines.
Conclusion
This study successfully developed a systematic framework for the parametric optimisation of FDM-printed PLA + ABS Bi-layer Laminate using a Taguchi L9 design of experiments. The main conclusions are summarised as follows: • The parameter combination of PS = 150 mm/s, LH = 0.1 mm, and concentric infill (Sample 1) produced the best mechanical performance, with E = 1252.29 MPa, σUTS = 42.17 MPa, and Ɛf = 5.79%. This result confirms that thinner layers enhance interlayer fusion, leading to improved stiffness and strength. • Poor interlayer bonding at higher layer height (LH = 0.3 mm) significantly reduced mechanical performance. Sample 6 exhibited high surface roughness (Ra = 14.67 µm) and lower strength, indicating that coarse layers promote interlayer defects. • The infill pattern strongly influenced mechanical behaviour. Even at PS = 250 mm/s and LH = 0.2 mm, the concentric infill configuration (Sample 8) achieved high strength (σUTS = 41.91 MPa, E = 1082.48 MPa) with low surface roughness (Ra = 3.4 µm), demonstrating efficient load transfer. • Optical microscopy and SEM analyses revealed micro-voids, inter-raster gaps, and layer debonding as the dominant crack initiation sites, directly linking reduced tensile properties to poor filament fusion and internal defects. • The fracture mode transitioned from ductile behaviour (micro-void coalescence in Sample 1) to brittle interlayer separation (Sample 5 and high-LH samples). This confirms that the mechanical reliability of PLA-ABS FDM parts is primarily governed by interlayer adhesion quality.
Footnotes
Declaration of conflicting interests
The authors declared no potential conflicts of interest with respect to the research, authorship, and/or publication of this article.
Funding
The authors received no financial support for the research, authorship, and/or publication of this article.