
Abstract
This study investigated the prediction of compressive strength in fused deposition modeling (FDM) printed acrylonitrile butadiene styrene (ABS) samples Taguchi-fuzzy logic (FL) approach. The research examined six critical printing parameters: printing direction (PD), infill density (ID), infill pattern (IP), layer height (LH), printing speed (PS), and nozzle temperature (NT). The Taguchi L27 orthogonal array was utilized to systematically design experiments, ensuring minimal trials while maximizing the amount of obtained data. Analysis of variance (ANOVA) revealed that ID was the most influential parameter with a 37.39% contribution to compressive strength, followed by PS (26.95%) and LH (17.51%). The optimal parameter combination achieved a maximum compressive strength of 55.76 MPa with 90% ID, 100 µm LH, and 40 mm/s PS. FL model was developed to predict compressive strength, demonstrating superior accuracy with a 3.1% average error rate compared to the Taguchi model’s 3.7%. The model’s reliability was validated through additional experiments, confirming its effectiveness for predicting compressive strength in FDM-printed ABS components. This research provides a robust methodology for accurately predicting mechanical properties, contributing to advancing additive manufacturing (AM) quality control.
Introduction
AM has emerged as a transformative fabrication technology in recent years across various industries. 1 Unlike traditional manufacturing methods, AM technology produces 3D parts by depositing material layer by layer, enabling the fabrication of complex geometries. 2 One of the most notable advantages of AM is the minimal material waste and fewer production steps it requires. 3 These features, particularly in prototyping and low-volume production, help reduce costs. 4 Moreover, through the ability to produce customized products and enhanced design flexibility, AM has become indispensable in sectors such as healthcare, aerospace, automotive, construction, biomedical scaffolds, and defense.5–9
FDM is one of the most widely used methods among various AM techniques. This method operates on the principle of depositing thermoplastic materials in a molten state, layer by layer, onto a platform using an extruder. 10 The materials used in this method are typically polymer-based,11–13 with ABS being one of the most employed. 14 ABS is an engineering plastic with excellent mechanical properties such as high impact resistance, strength, and thermal durability. FDM is widely used in various fields such as aerospace, automotive, medical, and consumer products for rapid prototyping, functional parts production, and custom manufacturing due to its versatility and cost-effectiveness.15–18 FDM is popular because of its low cost, material diversity, and ease of use, attracting a broad user base.19,20 However, the mechanical properties of parts produced by FDM can vary significantly depending on the selected printing parameters. 21 Specifically, the compressive strength of parts is directly related to the proper selection of printing parameters. This strength refers to the material’s resistance to forces that compress or squeeze it and is a critical mechanical property for many structural components. 22 Predicting the compressive strength of FDM-produced parts is vital to guarantee their functionality and durability under applied loads.
FDM printing parameters play a critical role in determining the mechanical performance of the produced parts.23–25 This study examines the parameters PD, ID, IP, LH, PS, and NT. Each of these parameters directly affect the internal structure and material distribution, leading to significant changes in mechanical properties. PD determines how the part will behave under load. Prints made in the XY direction generally provide higher compressive strength compared to the Z direction, as interlayer bonds are stronger in the XY direction. Similarly, ID affects the amount of material within the part’s internal structure. Increasing ID enhances strength by incorporating more material, whereas a lower ID results in lighter but structurally weaker parts. LH is directly related to print precision. Thinner layers create a denser structure, improving mechanical strength but increasing printing time. Parameters such as PS and NT influence material deposition and interlayer adhesion, thereby affecting the mechanical performance of the part. Predicting each of these parameters can significantly improve the compressive strength of FDM-produced parts. 26
There are not enough studies in the literature on improving and predicting compressive strength.27–29 Recent research has primarily concentrated on enhancing tensile strength and surface roughness of 3D-printed specimens.30–33 Ramiah and Pandian focused on optimizing printing parameters to improve the mechanical properties of FDM-produced prototypes. 34 Physical prototypes were fabricated using the Taguchi L18 array, and the effects of parameters were examined through laboratory tests. The best experiments were selected using the decision tree method, and the optimal parameter combination was determined using fuzzy analytical hierarchy process and complex proportional assessment of alternatives techniques. The results showed that raster angle had the most significant effect on mechanical properties, while the gap between raster’s had the least effect. Nathaphan and Trutassanawin aimed to determine the optimal parameters for achieving the highest dimensional accuracy and compressive yield strength in ABS parts produced by FDM. 35 Tests were conducted on cylindrical specimens made of ABS, and the effects of five parameters. The best compressive properties were achieved with low LH, low PS, and a higher shell number, while the horizontal direction provided higher compressive strength. Equal et al. investigated the performance of ABS P400 parts fabricated by FDM under compressive load. 36 The effects of FDM parameters, including raster angle, air gap, and raster width, on compressive stress, percentage deformation, and break stress were explored. The analysis conducted using ANOVA, response graphs, and 3D surface plots, revealed that ABS P400 parts exhibited low strength and anisotropic behavior. While parameters significantly affected compressive properties, it was observed that break stress was lower than compressive stress. Feng et al. investigated the effect of supports on the stress resistance of complex parts produced by FDM. 37 Three factors—support density, z-direction support distance, and support pattern—were examined to determine how they affected the compressive strength of supported areas. A total of 99 compressive tests were performed, and the results were analyzed using 3D topographic imaging. The strength of unsupported parts was also tested as a reference. The results showed that 30% support density and a Z = 0.14 support distance minimized compressive strength, while unsupported structures were stronger when support density was below 30% and Z ≥0.10. The highest strength was achieved using the grid-support method.
In contrast to the existing literature, this study uniquely focuses on predicting the compressive strength of FDM-printed ABS components using a hybrid Taguchi and FL model—an approach not previously explored in detail. While prior research has primarily emphasized tensile strength and dimensional accuracy, this study specifically targets compressive strength, which is crucial for structural applications. To achieve this, the influence of key printing parameters—ID, PD, IP, NT, LH, and PS—on compressive strength was comprehensively analyzed. A Taguchi L27 orthogonal array was employed to optimize parameter combinations while minimizing the number of required experiments. The statistical significance of these parameters was assessed using ANOVA. Additionally, an FL-based predictive model was developed and validated against experimental data, demonstrating high accuracy in predicting compressive strength. Unlike conventional regression-based models, which often struggle with nonlinear and uncertain relationships in experimental data, the FL system introduced in this study provides a more adaptable and precise approach to mechanical performance prediction. This study improves the accuracy and efficiency of compressive strength prediction by combining experimental design with soft computing techniques, thereby aiding process optimization in AM. The results confirm that optimized printing parameters can significantly improve the mechanical strength of FDM-manufactured components, showcasing the effectiveness of this innovative methodology.
Materials and Methods
3D Printing Process and Material
The 3D fabrication process of the samples was performed using the FDM, which is a widely used type of AM technology. In this process, a thermoplastic filament is heated to a semi-molten state and deposited layer by layer onto a platform.
38
The production process generally involves the following steps: First, the digital design phase begins with the creation of a 3D model using computer-aided design (CAD) software. The designed model is then converted into standard tessellation language (STL) format. The STL file defines the surface of the model using triangles, and this data is processed in slicing software to generate G-code. The G-code instructs the printer on how to move for each layer, how much material the extruder should deposit, and settings such as temperature. In this way, the 3D production process of the samples is completed. According to the defined experimental design process, a total of 27 samples were produced. Some of the samples with completed production are shown in Figure 1(b). The Creality K1C 3D printer was used in the FDM process (Figure 1(c)). This printer is capable of handling engineering materials such as ABS, with an extruder that can heat up to 300°C, utilizing 1.75 mm diameter filament, and a heated bed that can reach 180°C. The printer can achieve a print speed of up to 600 mm/s and offers a precision of up to 0.1 mm, enabling high-quality and rapid production. (a) The specimen dimensions (mm) (b) Some test samples fabricated with a 3D printer (c) Creality K1C 3D printer.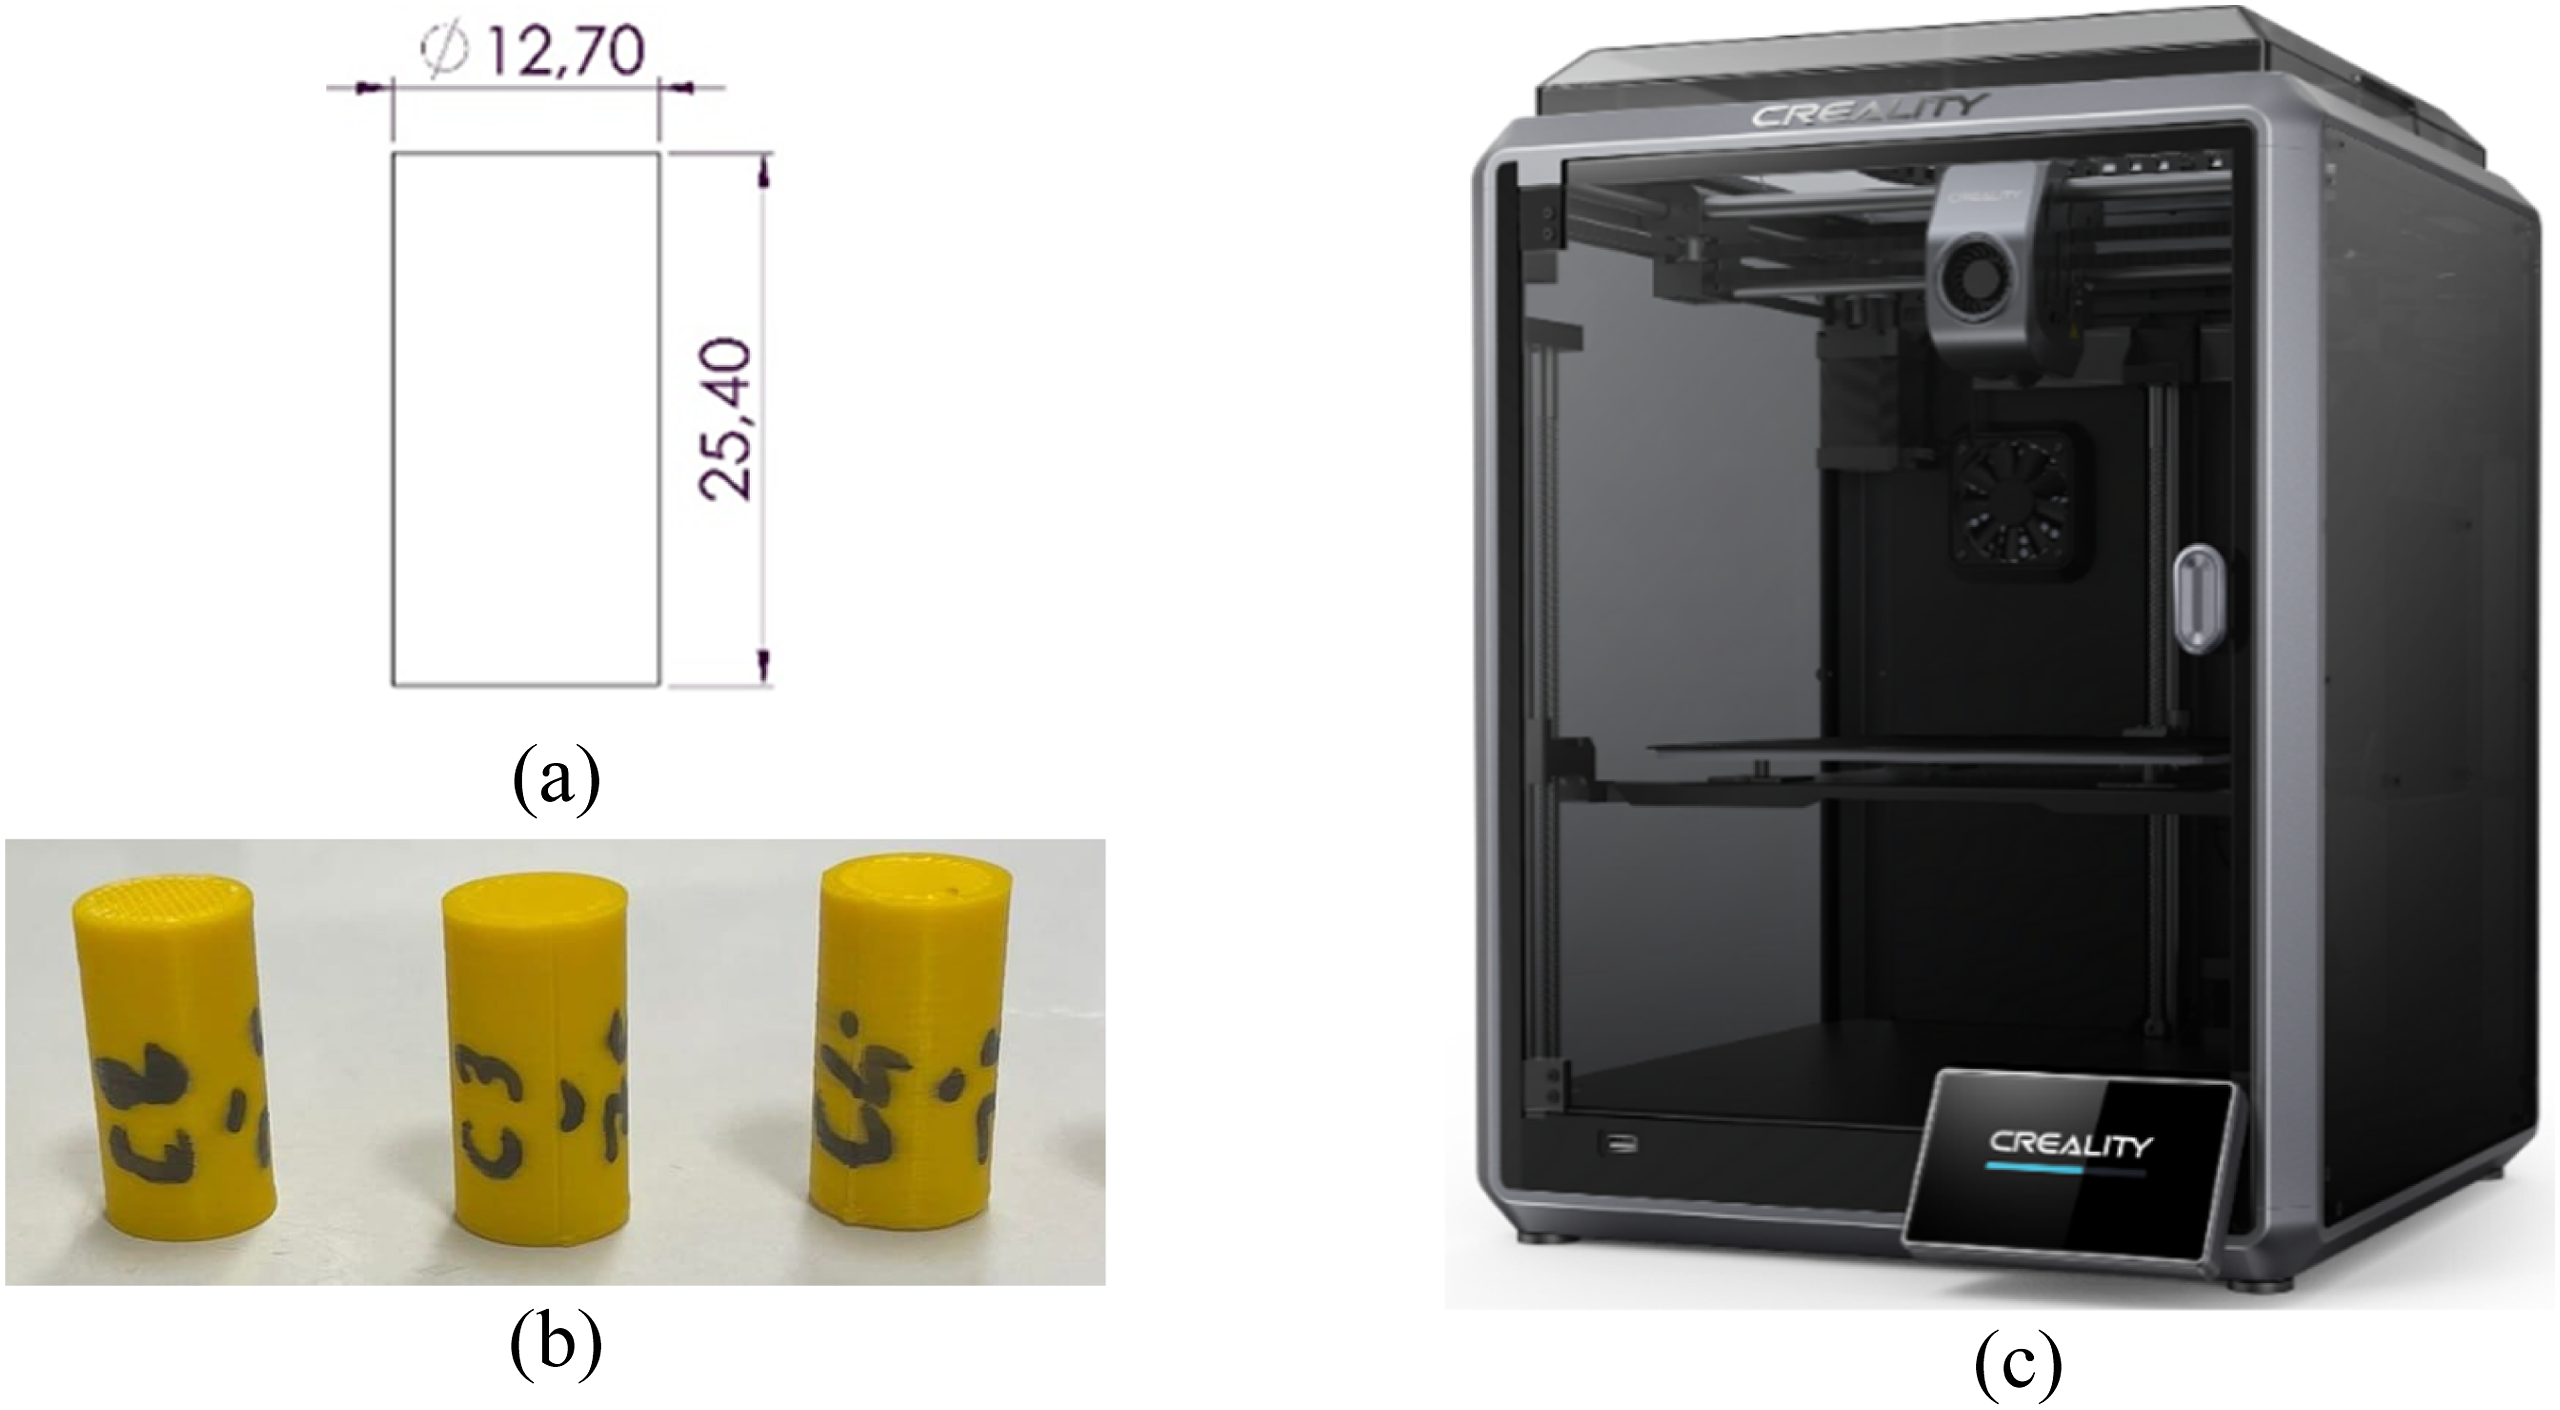
The printing process utilized yellow ABS filament from the Creality brand. This filament, with a diameter of 1.75 mm, is a suitable choice that complies with the common standards of 3D printers. The density of ABS is approximately 1.04 g/cm3, and due to its high impact resistance, mechanical strength, and thermal stability, it is frequently preferred in industrial applications. The glass transition temperature of ABS is around 105°C, while its melting temperature falls within the range of 220-250°C, making it suitable for projects requiring high-temperature resistance. ABS is also known for its low moisture absorption capacity, which reduces the filament’s sensitivity to humidity during printing, resulting in more consistent and higher-quality prints.39,40 Another prominent feature of this filament is its chemical resistance; it exhibits high durability against many acids and bases. These properties make ABS widely applicable in areas such as automotive, electronics, and engineering, while its durability and functionality make it an ideal material for functional prototypes and end-use parts.
Specimen Preparation
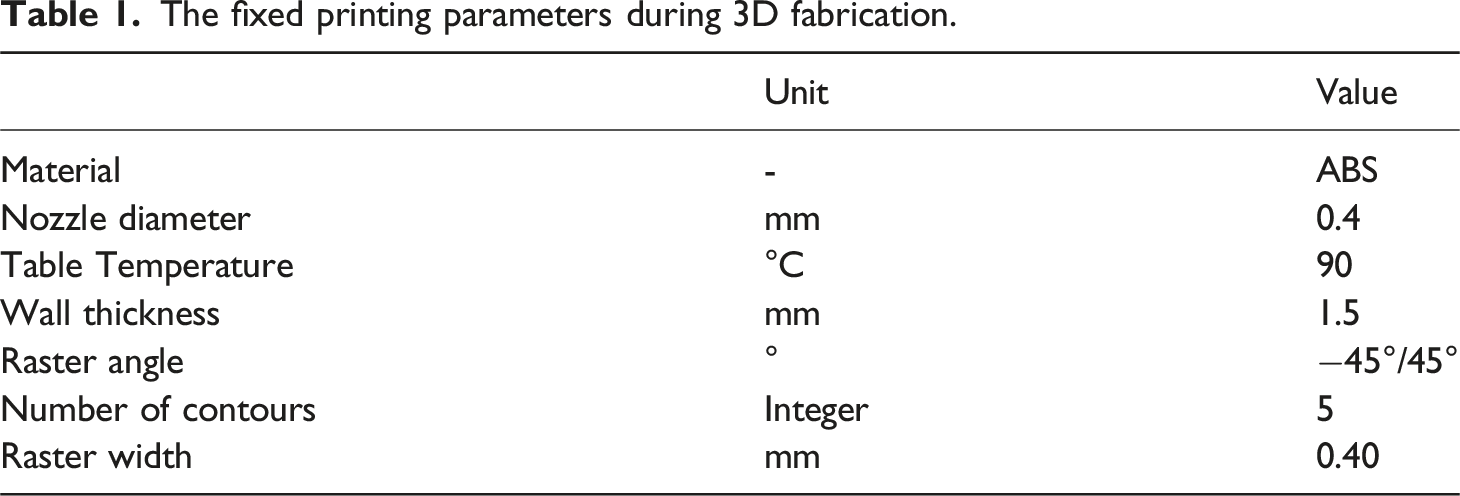
The fixed printing parameters during 3D fabrication.
Design of Experiments
In this study, the Taguchi method was employed to minimize the number of compressive test experiments and optimize the production process. This method is a technique used in research and development phases to increase efficiency or improve a process, enabling the production of high-quality products at low cost. 42 The optimal selection of printing parameters is crucial for improving the quality and mechanical properties of the final product in the production process. In this context, the process parameters influencing compressive strength were studied. Literature reviews, previous studies, and experiments played a significant role in determining the constant and variable parameters.43–45
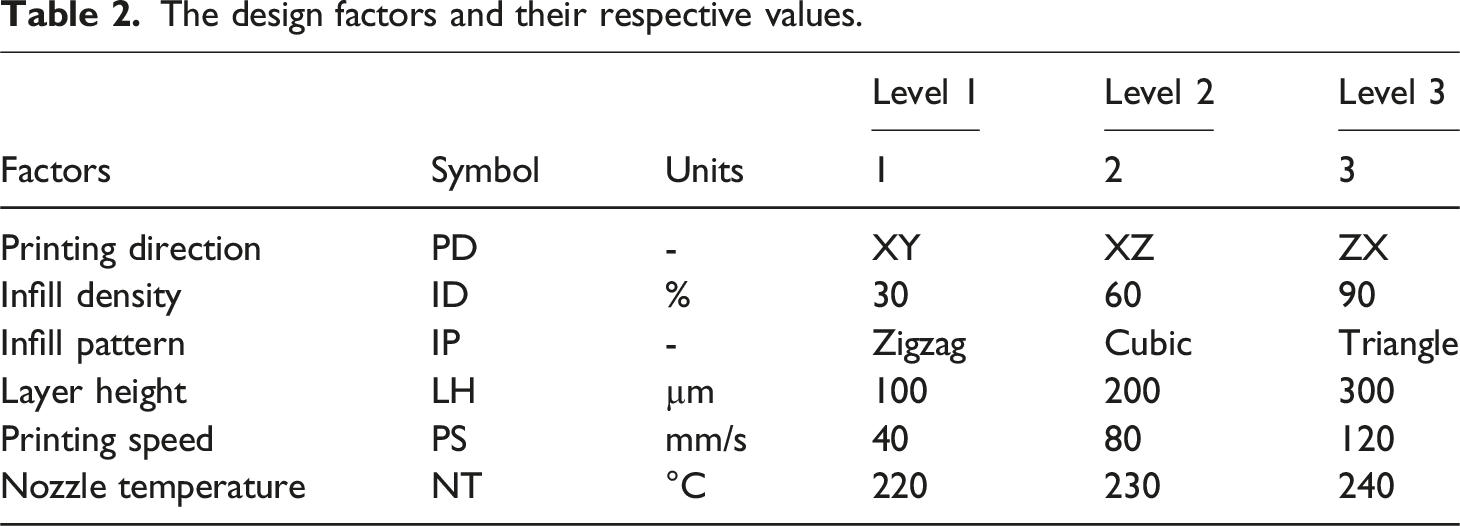
The design factors and their respective values.
To optimize the selected parameters and minimize process variability, the Signal-to-Noise (S/N) ratio was used. The experimental results were converted into S/N ratios for evaluation. The “larger is better” approach, one of the criteria used to define S/N ratios, was adopted to identify the highest compressive strength values. ANOVA and regression analyses were applied to determine and model the relationship between compressive strength and the printing parameters. In this experimental process, the effects of the printing parameters on compressive strength were thoroughly investigated.
Experimental Test
The compressive test to be conducted on the ABS sample, designed and produced according to the ASTM D695-15 standard, aims to determine the material’s compressive strength and mechanical properties. The test will be performed using a test machine with a capacity of 50 kN (AG-X Shimadzu). Before the test, the sample is carefully placed between the machine’s two jaws, ensuring proper alignment. This step is critical to applying the load uniformly to the sample and ensuring reliable results. During the test, a continuously increasing compressive force will be applied to the sample at a constant loading rate of 1.3 mm/min. This rate conforms to the loading speed specified in the ASTM D695-15 standard and is typically used to accurately observe the material’s deformation behavior and reliably measure its mechanical properties. The compressive load applied at this constant rate will progress as follows: the sample will enter the elastic deformation region, then transition into the plastic deformation region, and finally continue until it reaches the fracture or permanent deformation point. The test machine will continuously record the applied load and the amount of deformation experienced by the sample throughout the test. The data obtained during the test will be analyzed to determine mechanical properties such as the material’s compressive strength, elastic modulus, and maximum deformation capacity. The primary goal of the test is to determine the maximum compressive force the sample can withstand before failure and the amount of deformation it undergoes. This data will provide crucial information about the compressive strength of the ABS material and its performance in engineering applications.
Figure 2 presents the stress-strain curves obtained from the compressive tests for selected experiments, providing insight into the mechanical behavior of the FDM-printed ABS specimens. The differences in the maximum stress values and deformation characteristics highlight the influence of printing parameters on compressive strength. Experiment five exhibited a maximum compressive strength of approximately 45 MPa. The curve shows a smooth transition from the elastic to the plastic region, followed by a gradual decline in stress. This indicates that the specimen maintained its structural integrity under compression but eventually underwent plastic deformation. The lowest compressive strength was recorded in Experiment 12, reaching a peak stress of around 15 MPa. The curve demonstrates a relatively short elastic region, followed by an early onset of plastic deformation. The rapid decline in stress suggests weak interlayer bonding, likely due to suboptimal printing parameters such as low ID or high LH. Experiment 15 achieved a peak compressive strength of approximately 30 MPa. The curve indicates a moderate elastic region and a more gradual transition into the plastic phase. Compared to Experiment 12, this specimen exhibited higher resistance to compression, suggesting improved layer adhesion and structural integrity. Experiment 25 yielded the highest compressive strength, reaching nearly 55 MPa. The stress-strain curve shows an extended elastic region and a gradual decline in stress beyond the peak, indicating excellent load-bearing capacity and enhanced interlayer bonding. The comparison of stress-strain curves confirms that printing parameters, particularly ID, LH, and PS, play a crucial role in determining the mechanical performance of FDM-printed ABS components. A higher ID and finer LH enhance structural strength and resilience, while a lower ID and excessive LH can cause premature failure under compressive loads. Stress-strain diagrams of compressive tests of some experiments.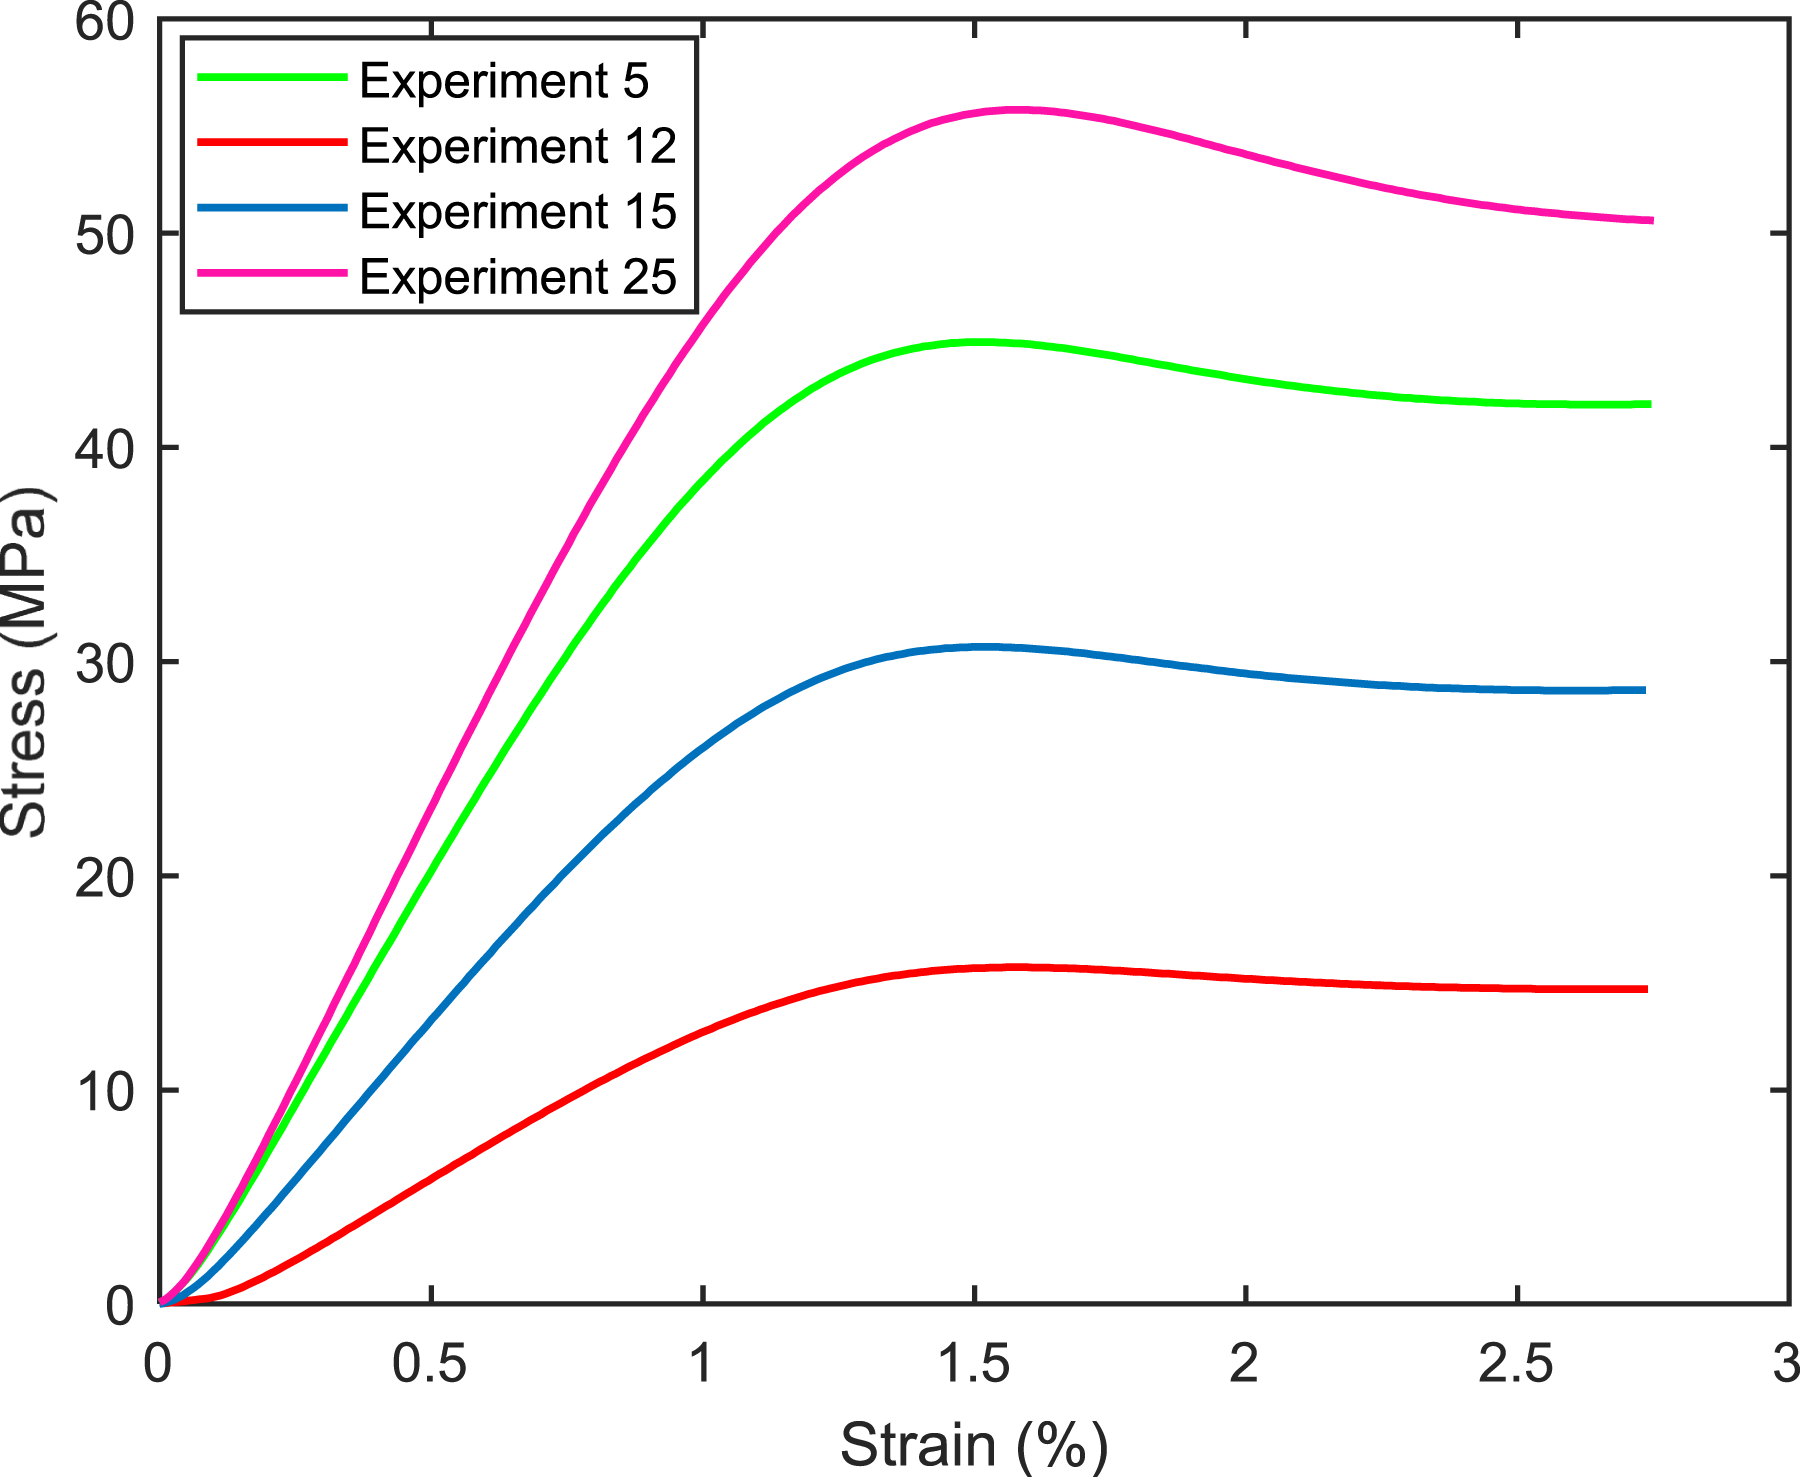
Fuzzy Logic Method
A FL-based model is an effective method for analyzing complex systems and, particularly, for predicting engineering parameters such as compressive strength, surface roughness, and flexural strength.46–48 In recent years, FL has found extensive application in the fields of artificial intelligence and control systems. One of its most significant advantages is that it can be applied to nonlinear and uncertain systems without requiring mathematical modeling. Unlike traditional logic systems, FL does not rely on binary outcomes (true-false) but instead considers intermediate outcomes that account for uncertainty. Therefore, it operates on a principle different from the binary structure seen in classical computer systems. In FL, a situation does not have to be entirely true or entirely false; instead, intermediate values such as “partially true,” “mostly false,” or “close to true” are possible. This flexibility allows systems to be modeled in a more realistic manner, closer to human thought processes.49,50
The core functioning of FL systems is based on defining the relationships between inputs and outputs through fuzzy sets and rules. The structure of these systems resembles a mathematical cause-and-effect function, but instead of relationships defined by precise boundaries, there are relationships characterized by uncertainty and flexible boundaries.51–53 One of the most critical elements of fuzzy systems is the definition of fuzzy rules. These rules, which are typically expressed in an “If… Then…” format, are fuzzy control rules created to achieve a specific control objective. At this stage, the key is to express expert knowledge about the system in the form of fuzzy rules within a cause-and-effect framework. Thus, the experience and knowledge of experts can be integrated into the model through FL rules, rather than through mathematical equations.
In this study, the proposed fuzzy inference system (FIS) consists of four fundamental stages (Figure 3). This diagram explains the working principles of a FL system based on 3D printing parameters. Input variables such as PD, ID, IP, LH, PS, and NT, which are critical parameters in 3D printing, are used. These parameters are provided as inputs to the system to predict compressive strength. In the first stage, the input parameters undergo a fuzzification process, where they are transformed into fuzzy sets. In other words, the input variables are converted into fuzzy values using specific membership functions. This allows the system to handle the uncertainties and variations in the input data. These fuzzified inputs then enter the fuzzy inference system, which is composed of two essential components: the database and the rule base. The database contains the membership functions and fuzzy sets, while the rule base consists of IF-THEN rules that define the relationships between inputs and outputs. These rules determine how the system makes decisions. This stage is where the cause-and-effect relationships, fundamental to FL, are established. In the next stage, the fuzzified and inferred result is subjected to defuzzification. This process converts the fuzzy outputs into a precise numerical value, which forms the system’s output. In this example, the predicted output is the compressive strength, which is expressed as a specific numerical value. Defuzzification is typically performed using methods like centroid calculation or mean of maxima. The final step produces the system’s output, which is the predicted compressive strength value. The basic structure of the FL controller with inputs and output parameters.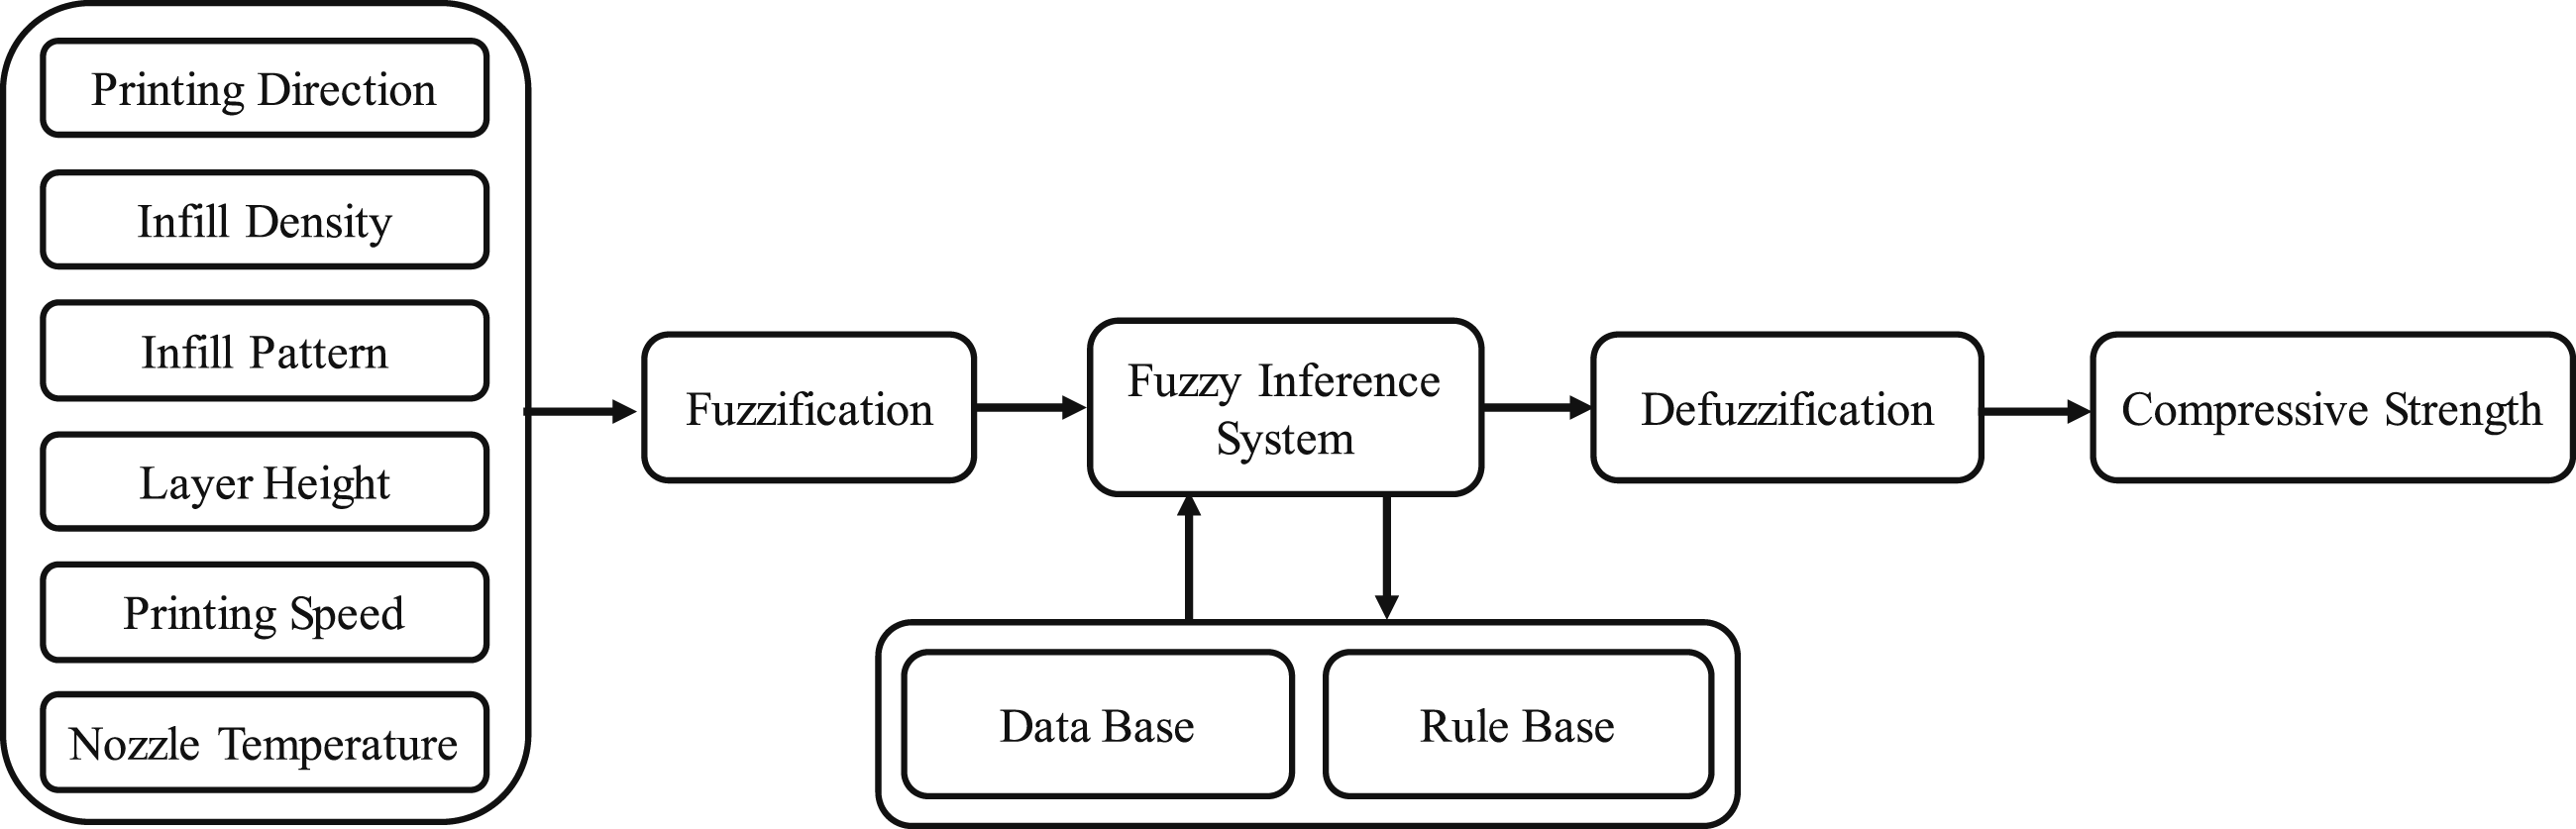
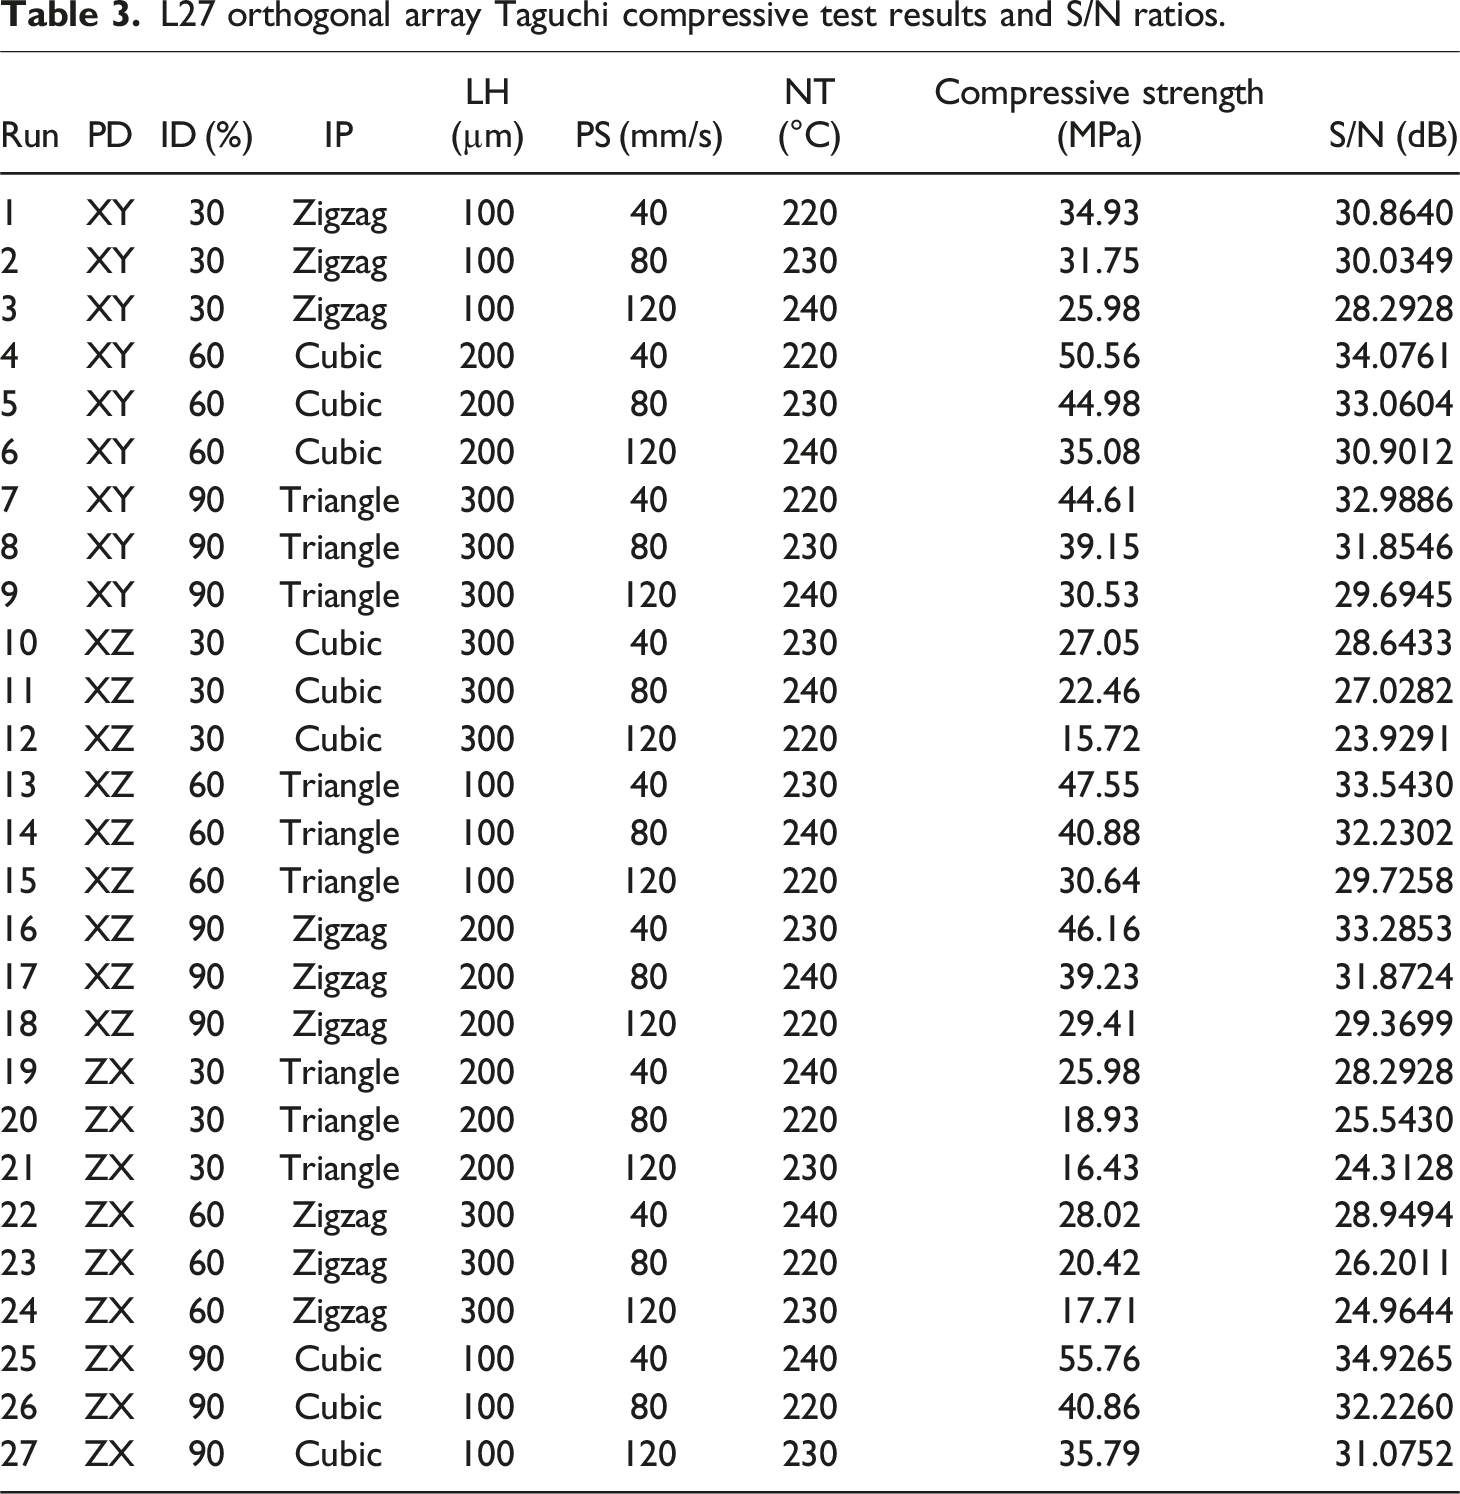
The first step in the FL modeling process is defining the input and output parameters (Figure 4). The system’s output is defined as the compressive strength values measured from the compressive test. The input parameters are selected as the most used printing parameters in the literature that influence the output. The minimum and maximum values of the input and output parameters are determined based on the data in Tables 2 and 3. The proposed prediction model was implemented using MATLAB. In this process, the Mamdani method was applied as the fuzzy inference system. This method is widely used in FL systems because of its interpretability and ease of implementation. Schematic diagram of the FL system with six inputs and one output response. L27 orthogonal array Taguchi compressive test results and S/N ratios.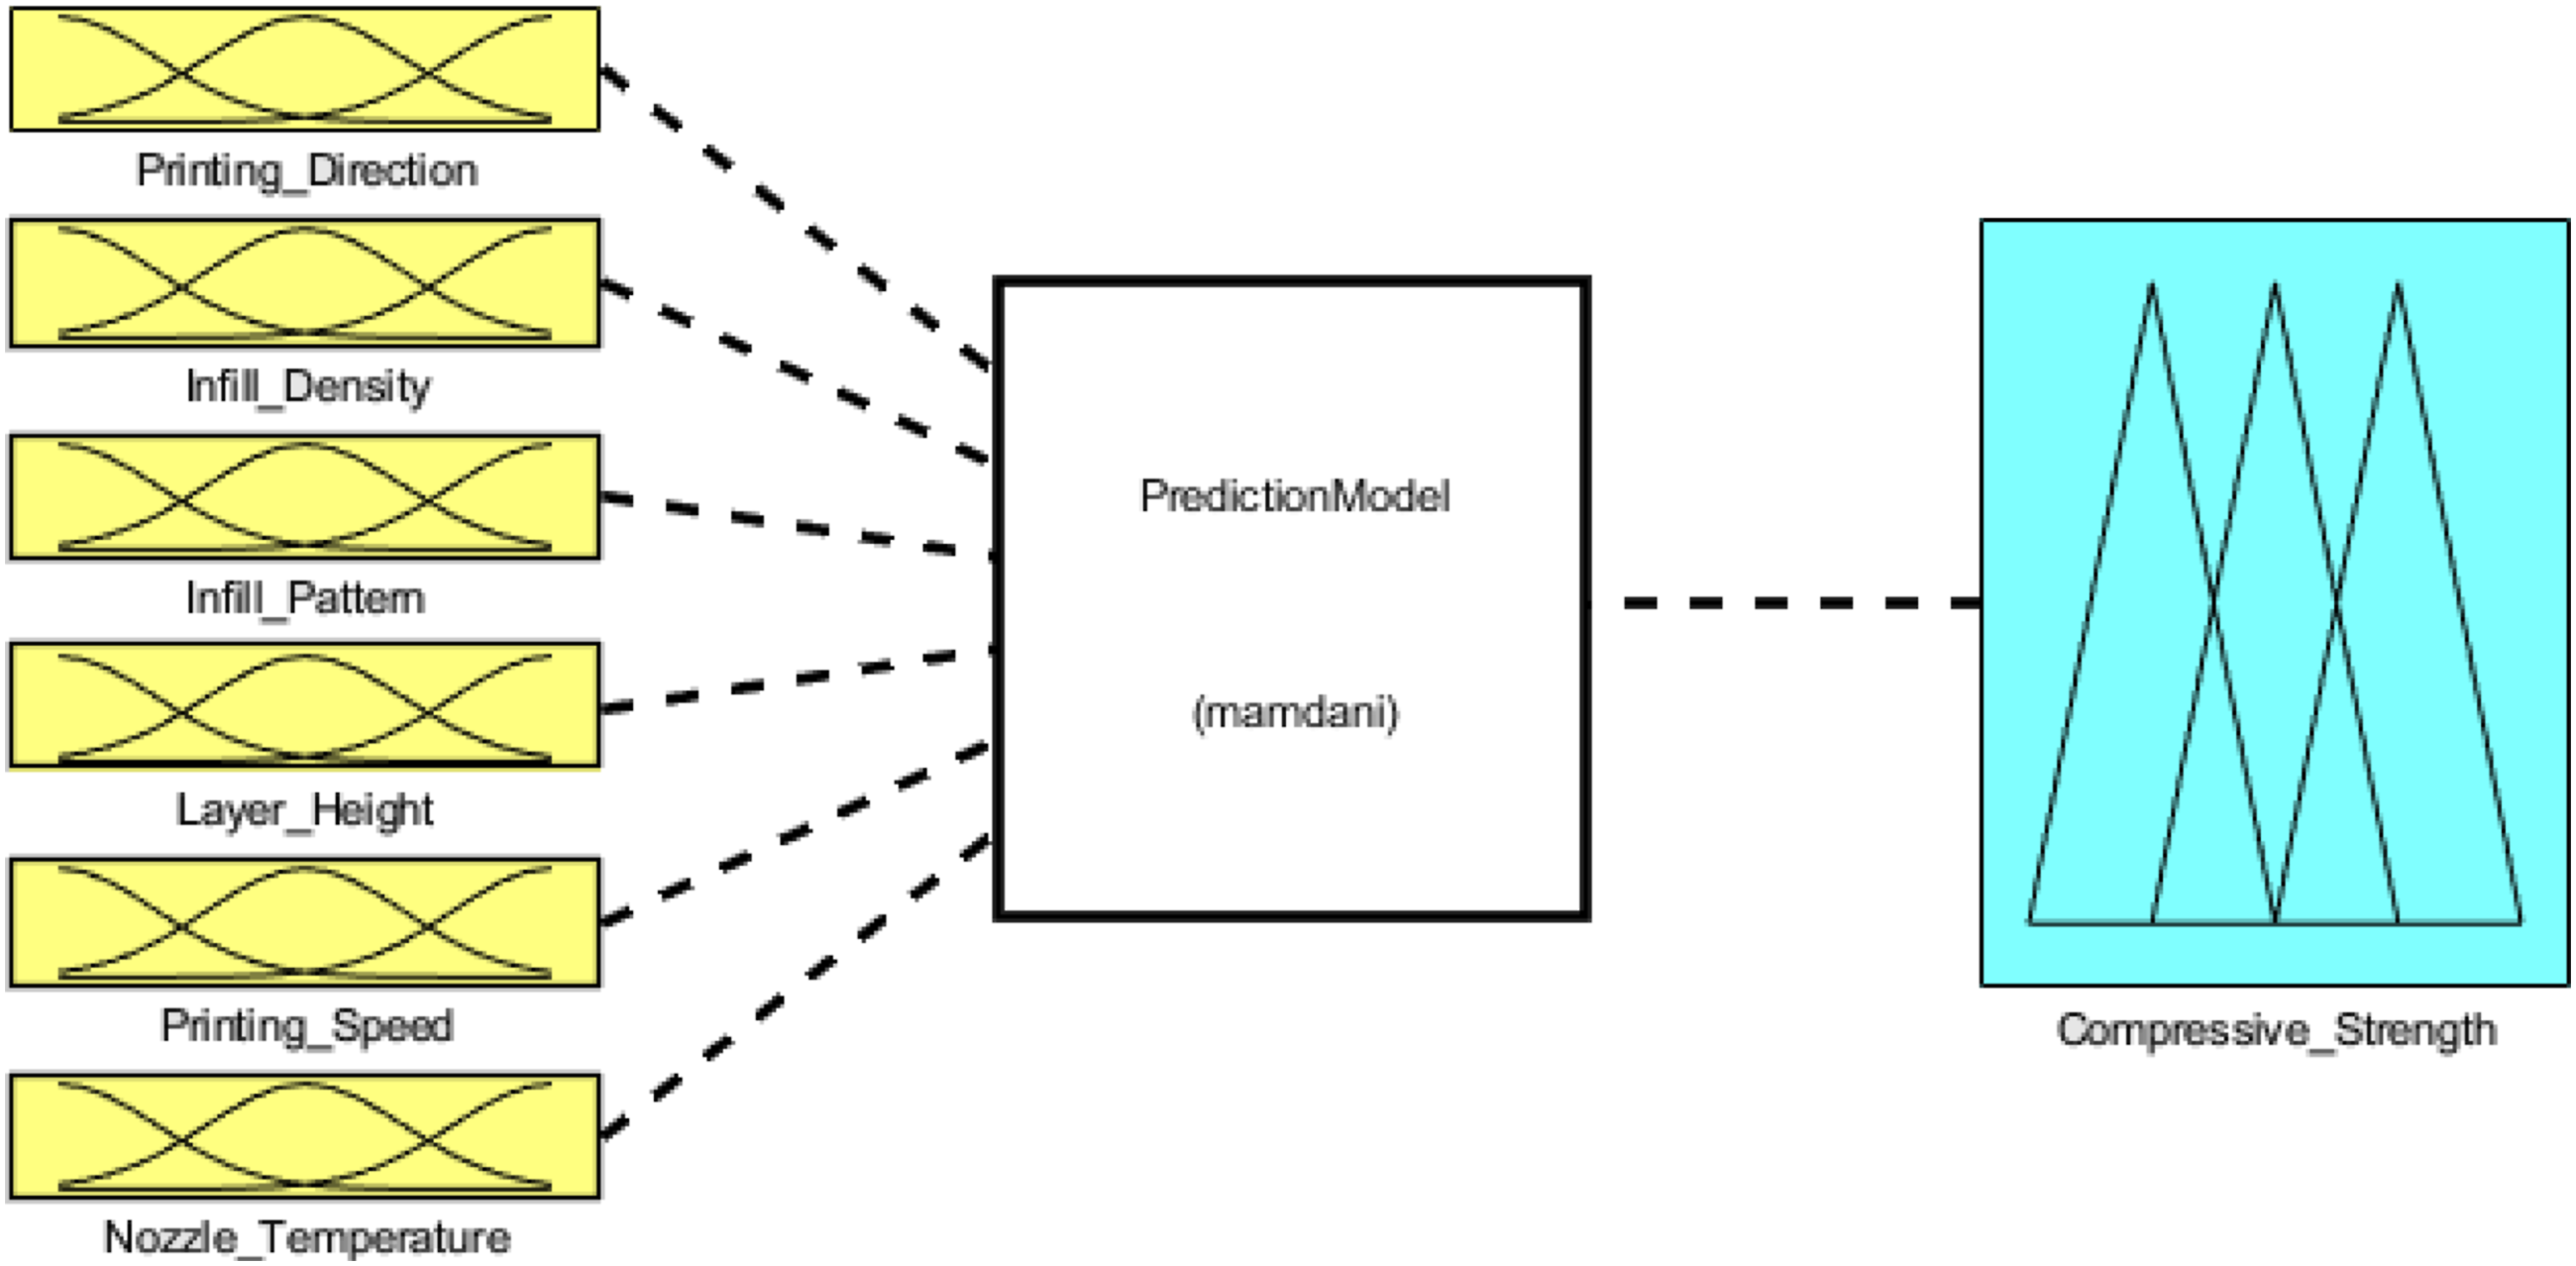
The values of membership functions are calibrated based on the upper and lower limits of inputs and outputs during the FL modeling process. Following the Taguchi, the upper and lower bounds, along with rules for parameter values, were established. A total of 128 rules were formulated to define the relationships between these parameters. The fuzzy model was characterized by the following: methods of minimum or maximum, implication defined by minimum, aggregation via maximum, and the defuzzification method as centroid. The input and output parameters are represented through linguistic variables or fuzzy membership functions shaped like a Gaussian, as illustrated in Figure 5. Gaussian membership functions of printing parameters (a) printing direction (b) infill density (c) infill pattern (d) layer height (e) printing speed (f) nozzle temperature (g) compressive strength.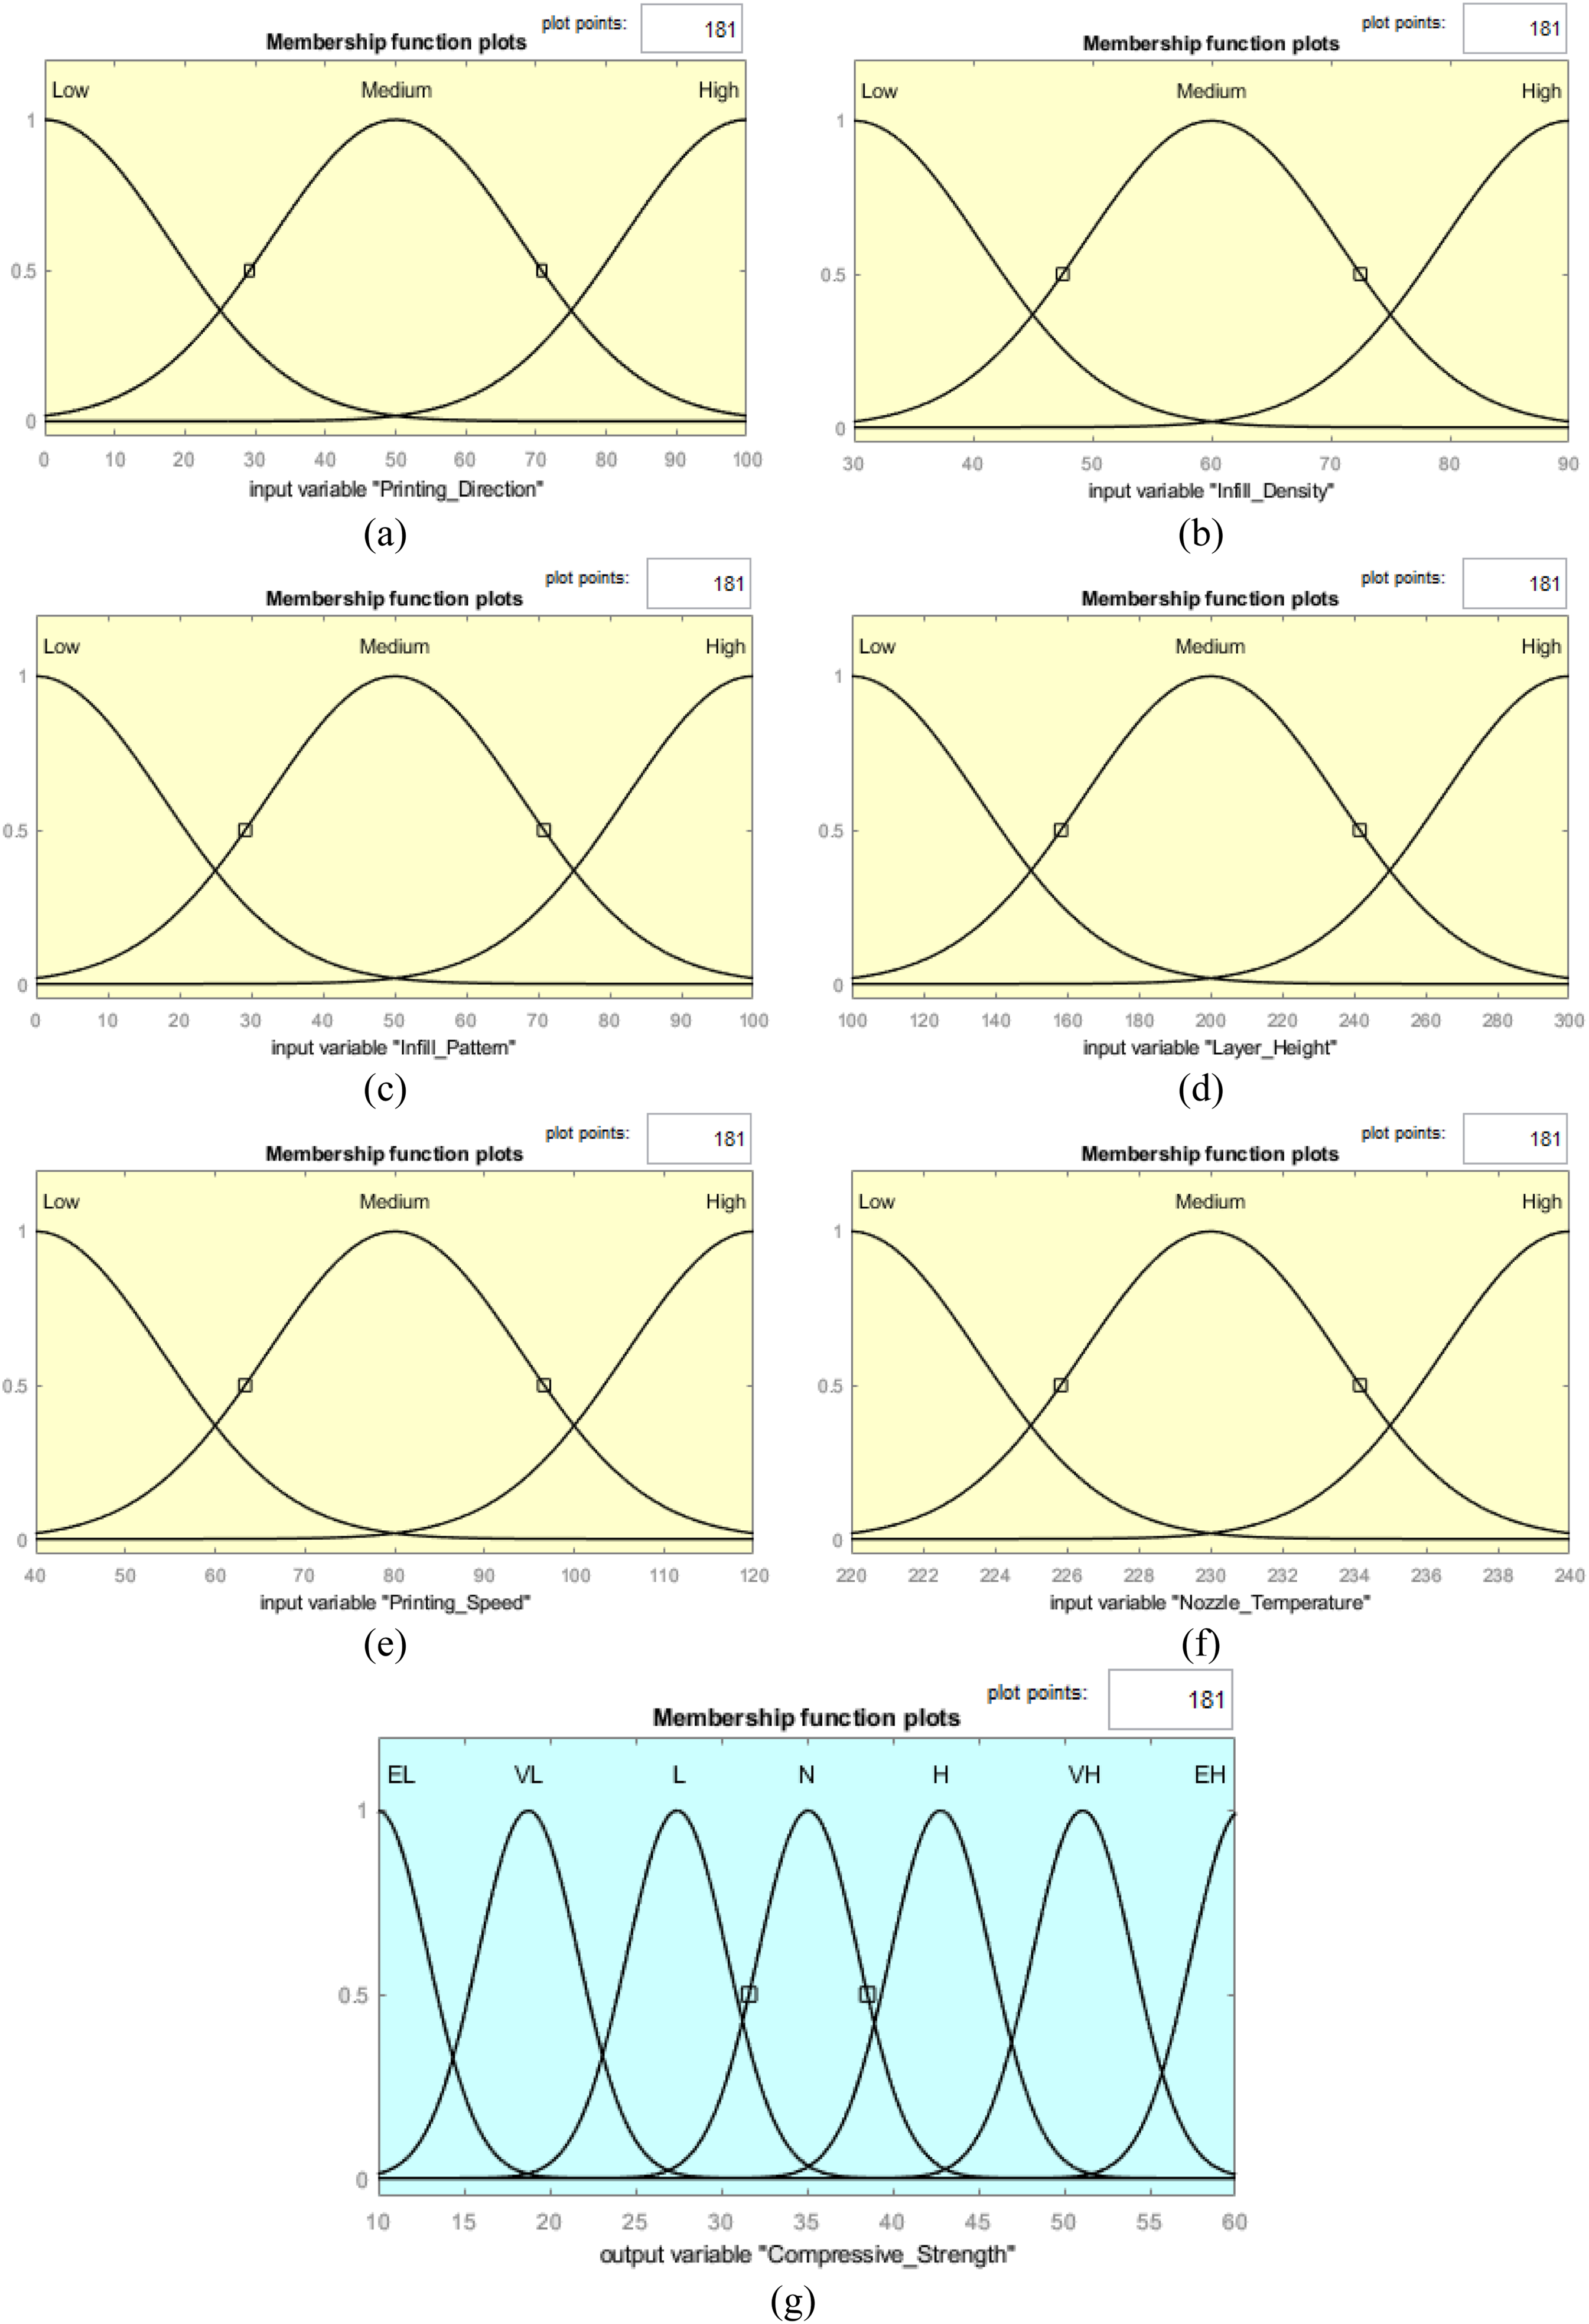
In the Gaussian membership function for the ‘Printing Direction’ input, the categories are defined as follows: ‘Low’ for values in the range [0-50], ‘Medium’ for values in the range [0-100], and ‘High’ for values in the range [50-100]. For the ‘Infill Density’ input, the membership functions categorize ‘Low’ values within the range [30-60], ‘Medium’ values from [30-90], and ‘High’ values from [60-90]. In the case of the ‘Infill Pattern’ input, the ranges are set to ‘Low’ for [0-50], ‘Medium’ for [0-100], and ‘High’ for [50-100]. The ‘Layer Height’ input employs a membership function where ‘Low’ corresponds to the range [100-200], ‘Medium’ spans [100-300], and ‘High’ is designated for [200-300]. For the ‘Printing Speed’ input, values classified as ‘Low’ fall between [40-80], ‘Medium’ is defined within [40-120], and ‘High’ is from [80-120]. The ‘Nozzle Temperature’ input categorizes ‘Low’ in the range [220-230], ‘Medium between’ [220-240], and ‘High’ from [230-240]. Lastly, in the Gaussian membership function for the ‘Compressive Strength’ output, the categories are defined as ‘Extremely Low’ for [0-18 MPa], ‘Very Low’ for [0-27 MPa], ‘Low’ for [18-37 MPa], ‘Normal’ for [27-43 MPa], ‘High’ for [37-52 MPa], ‘Very High’ for [43-60 MPa], and ‘Extremely High’ for values in the range [52-60 MPa].
Results and Discussion
Taguchi Design Results
In this section, the results of the Taguchi method used in the experimental design process are presented. The analysis process of this method was performed using Minitab 16 statistical software. Taguchi aims to reduce costs by improving quality in product and process design. This method enhances system performance by minimizing variation, achieving higher efficiency with fewer resources. The average compressive strength values obtained from the production of samples using the FDM, and the corresponding S/N ratios for each printing parameter, are provided in Table 3. These ratios are used to optimize the parameters determined in the experimental design, ensure stability, and minimize process variability. The Taguchi design method was implemented using the Taguchi L27 orthogonal array. A total of 27 experiments were conducted for this method (Table 3). For each sample, three measurements were taken, and the average of these values is presented on the table.
The aim of this study was to optimize and predict the compressive strength properties of ABS samples produced using various printing parameters. Therefore, the “larger is better” approach was used to determine the highest average strength values. The average compressive strength values and the corresponding S/N ratios for each printing parameter are presented in Table 3. These values range between 15.72 MPa and 55.76 MPa. The highest compressive strength, 55.76 MPa, was measured in Experiment 25. In this experiment, the printing parameters of PD, ID, IP, LH, PS and NT are ZX, 90%, Cubic, 100 µm, 40 mm/s and 240°C, respectively. While the average strength value was 55.76 MPa, the S/N ratio was 34.9265 dB. The highest S/N ratio was observed in the experiment with the highest compressive strength. Higher S/N ratios indicate stronger compressive strength and less variability. These values suggest that certain production settings provide consistent and desirable outcomes. Lower S/N ratios represent either lower compressive strength, higher variation, or both, indicating that the corresponding settings are less optimal for compressive strength or yield more inconsistent results.
The relationship between the printing parameters and compressive strength was investigated using main effect graphs based on Taguchi (Figure 6). Here, the strength values corresponding to each factor and level are analyzed. For PD, evaluated at XY, XZ, and ZX, a significant decrease in compressive strength is observed as the PD changes. At XY, the highest strength is achieved, but when shifting to XZ, there is a noticeable reduction. This decline continues further at ZX, where the lowest strength is recorded. This indicates that layer orientation significantly affects mechanical performance, with XY being the optimal direction for maximum compressive strength. The analysis of ID at 30%, 60%, and 90% reveals a substantial enhancement in compressive strength as density increases. The structure is weakest at 30% ID but shows a marked strength enhancement when the ID is raised to 60%. The highest strength is reached at 90% ID, demonstrating that a denser internal structure enhances mechanical properties. Compressive strength exhibits significant variation depending on the IP pattern configuration, demonstrating that architectural design critically influences mechanical performance. While the Zigzag configuration exhibits relatively low compressive strength, transitioning to the Cubic pattern yields a substantial increase in load-bearing capacity. However, transitioning to the Triangle leads to a slight decline, suggesting that Cubic provides the most favorable mechanical properties. Regarding LH, tested at 100 µm, 200 µm, and 300 µm, the compressive strength decreases as the height increases. At 100 µm, the highest strength is observed but increasing to 200 µm results in a noticeable drop. At 300 µm, the lowest strength is recorded, indicating that thinner layers contribute to better adhesion and overall structural integrity. For PS, evaluated at 40 mm/s, 80 mm/s, and 120 mm/s, a clear decreasing trend is noted. The highest strength is observed at 40 mm/s but increasing to 80 mm/s leads to a reduction. At 120 mm/s, the lowest strength is recorded, implying that higher speeds negatively impact the bonding between layers and overall part strength. Analysis of NT at varying temperatures (220°C, 230°C, and 240°C) reveals that compressive strength initially increases from 220°C to 230°C, indicating that moderate thermal conditions enhance interfacial adhesion. Moving to 240°C, the strength increases slightly compared to 220°C, but the improvement is not as significant as the transition from 220°C to 230°C. This suggests that beyond a certain point, further increasing temperature does not substantially enhance strength. ID, PS, and LH emerge as the most influential factors affecting compressive strength. The results highlight that higher ID, lower LH, and slower PS contribute to stronger printed parts, making these parameters critical for optimizing mechanical performance in 3D printing. The maximum compressive strength is achieved using ‘XY’ PD, ‘90%’ ID, ‘Cubic’ IP, ‘100 μm’ LH, ‘40 mm/s’ PS and ‘240°C’ NT. In the experiment using these parameters and levels, the compressive strength was calculated as 73.45 MPa. The closest experiment to these optimal parameters is Experiment 25 (Table 3). Main effect plots of S/N ratios for compressive strength.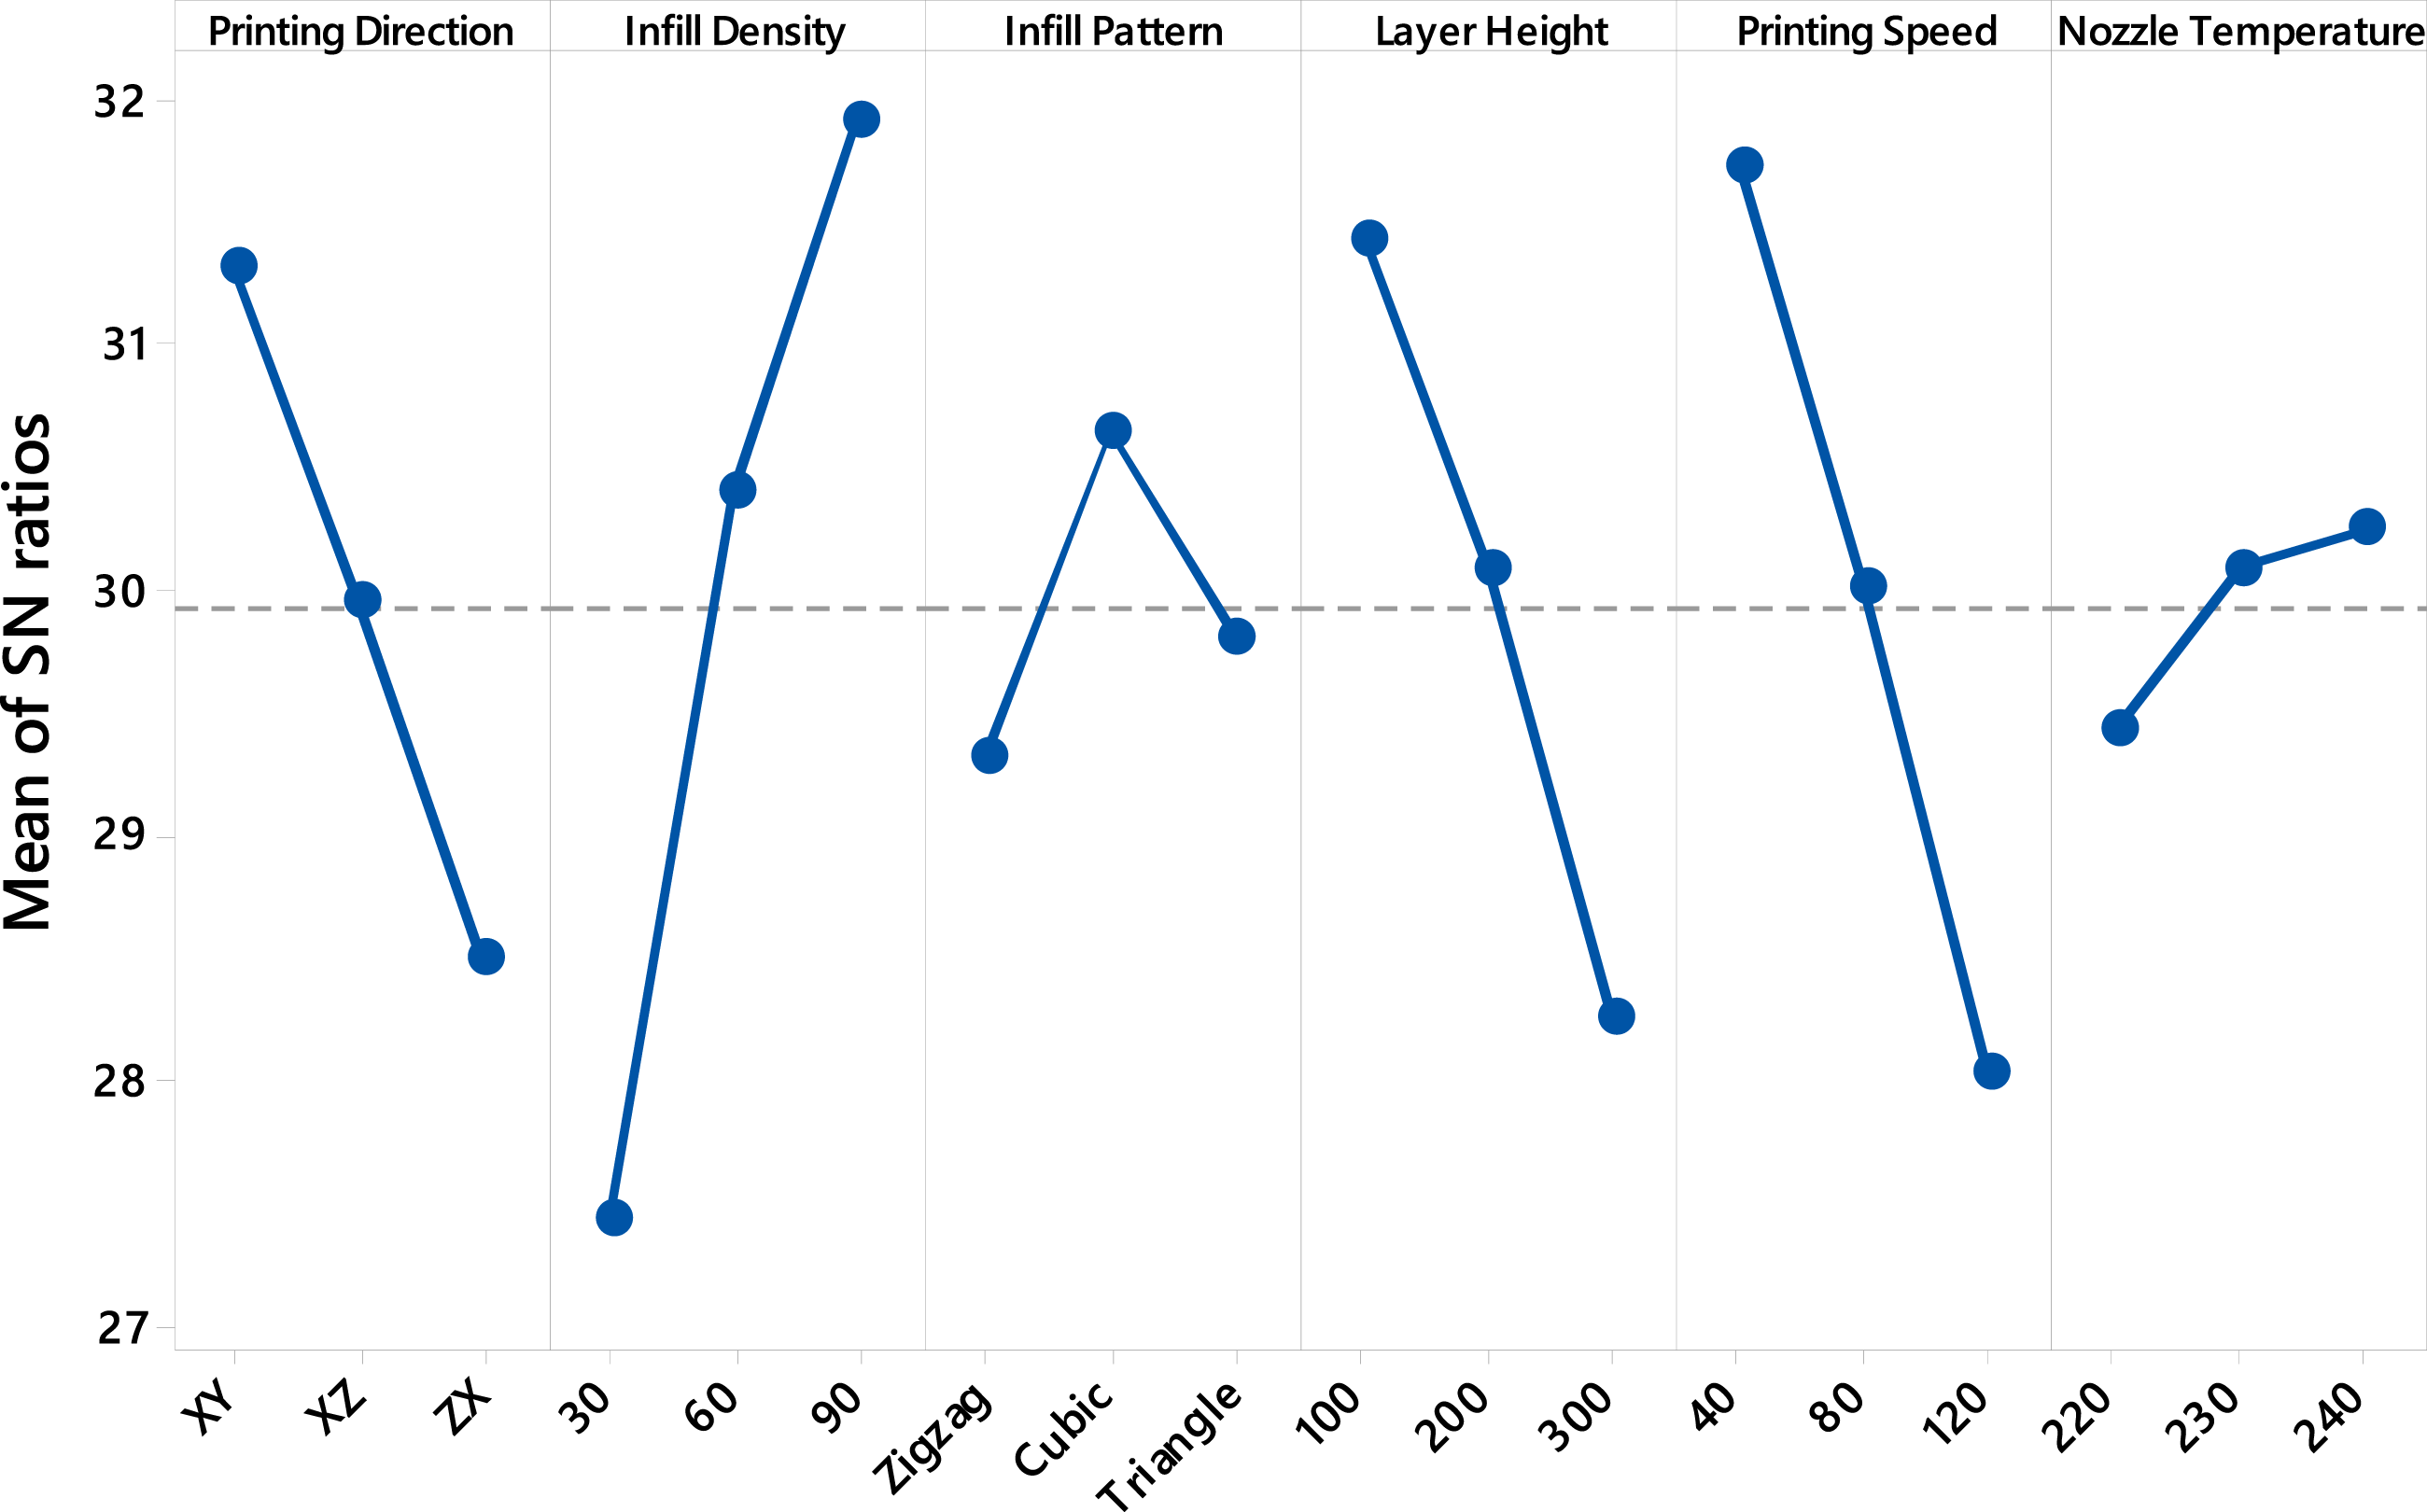
Figure 7 shows the contour plot graphs that show the relationship between compressive strength and printing parameters. Contour plots are a powerful and effective way to visualize the relationships between three variables. Similar results were obtained from the main effect graph results. 15 graphs had to be drawn to show the interaction between all the factors. The interaction between the factors with the highest effect is shown in Figure 7. Figure 7(a) shows the effect of ID and LH on compressive strength. The highest strength (>50 MPa) is observed in areas where the ID is high (3.0) and the LH is at medium levels (approximately 1.5-2.0). Strength decreases as LH increases, even with a high ID, and when LH reaches 3.0, the strength falls below 20 MPa. Therefore, the ID should be increased, and the LH should be kept at medium levels for optimum strength. The PD and ID graph shows that the effect of the PD decreases at high ID, but the PD significantly affects the compressive strength at low ID (Figure 7(b)). In the PS and ID graph, low PS and high ID increase the compressive strength, while the strength decreases rapidly as the PS increases (Figure 7(c)). The IP and LH graph show that high strength is provided at optimum IP and medium LH, but the strength decreases as the LH increases (Figure 7(d)). The PD and NT graph shows that the compressive strength is high at medium NT and PD, but the strength decreases as these parameters increase (Figure 7(e)). In the IP and PS graph, the strength reaches the highest level at low PS and optimum IP, while the strength decreases as the PS increases (Figure 7(f)). The NT and ID graph shows that the compressive strength is highest at high ID and medium NT (Figure 7(g)). In the PS and PD graph, strength rises under low PS and suitable PD conditions but decreases as PS increases (Figure 7(h)). These graphs reveal that low PS and high ID are critical in increasing the compressive strength, while increases in LH and PS decrease the strength. Contour plots of compressive strength with printing factors. (a) ID versus LH. (b) ID versus PD. (c) ID versus PS. (d) LH versus IP. (e) NT versus PD. (f) PS versus IP. (g) NT versus ID. (h) PD versus PS.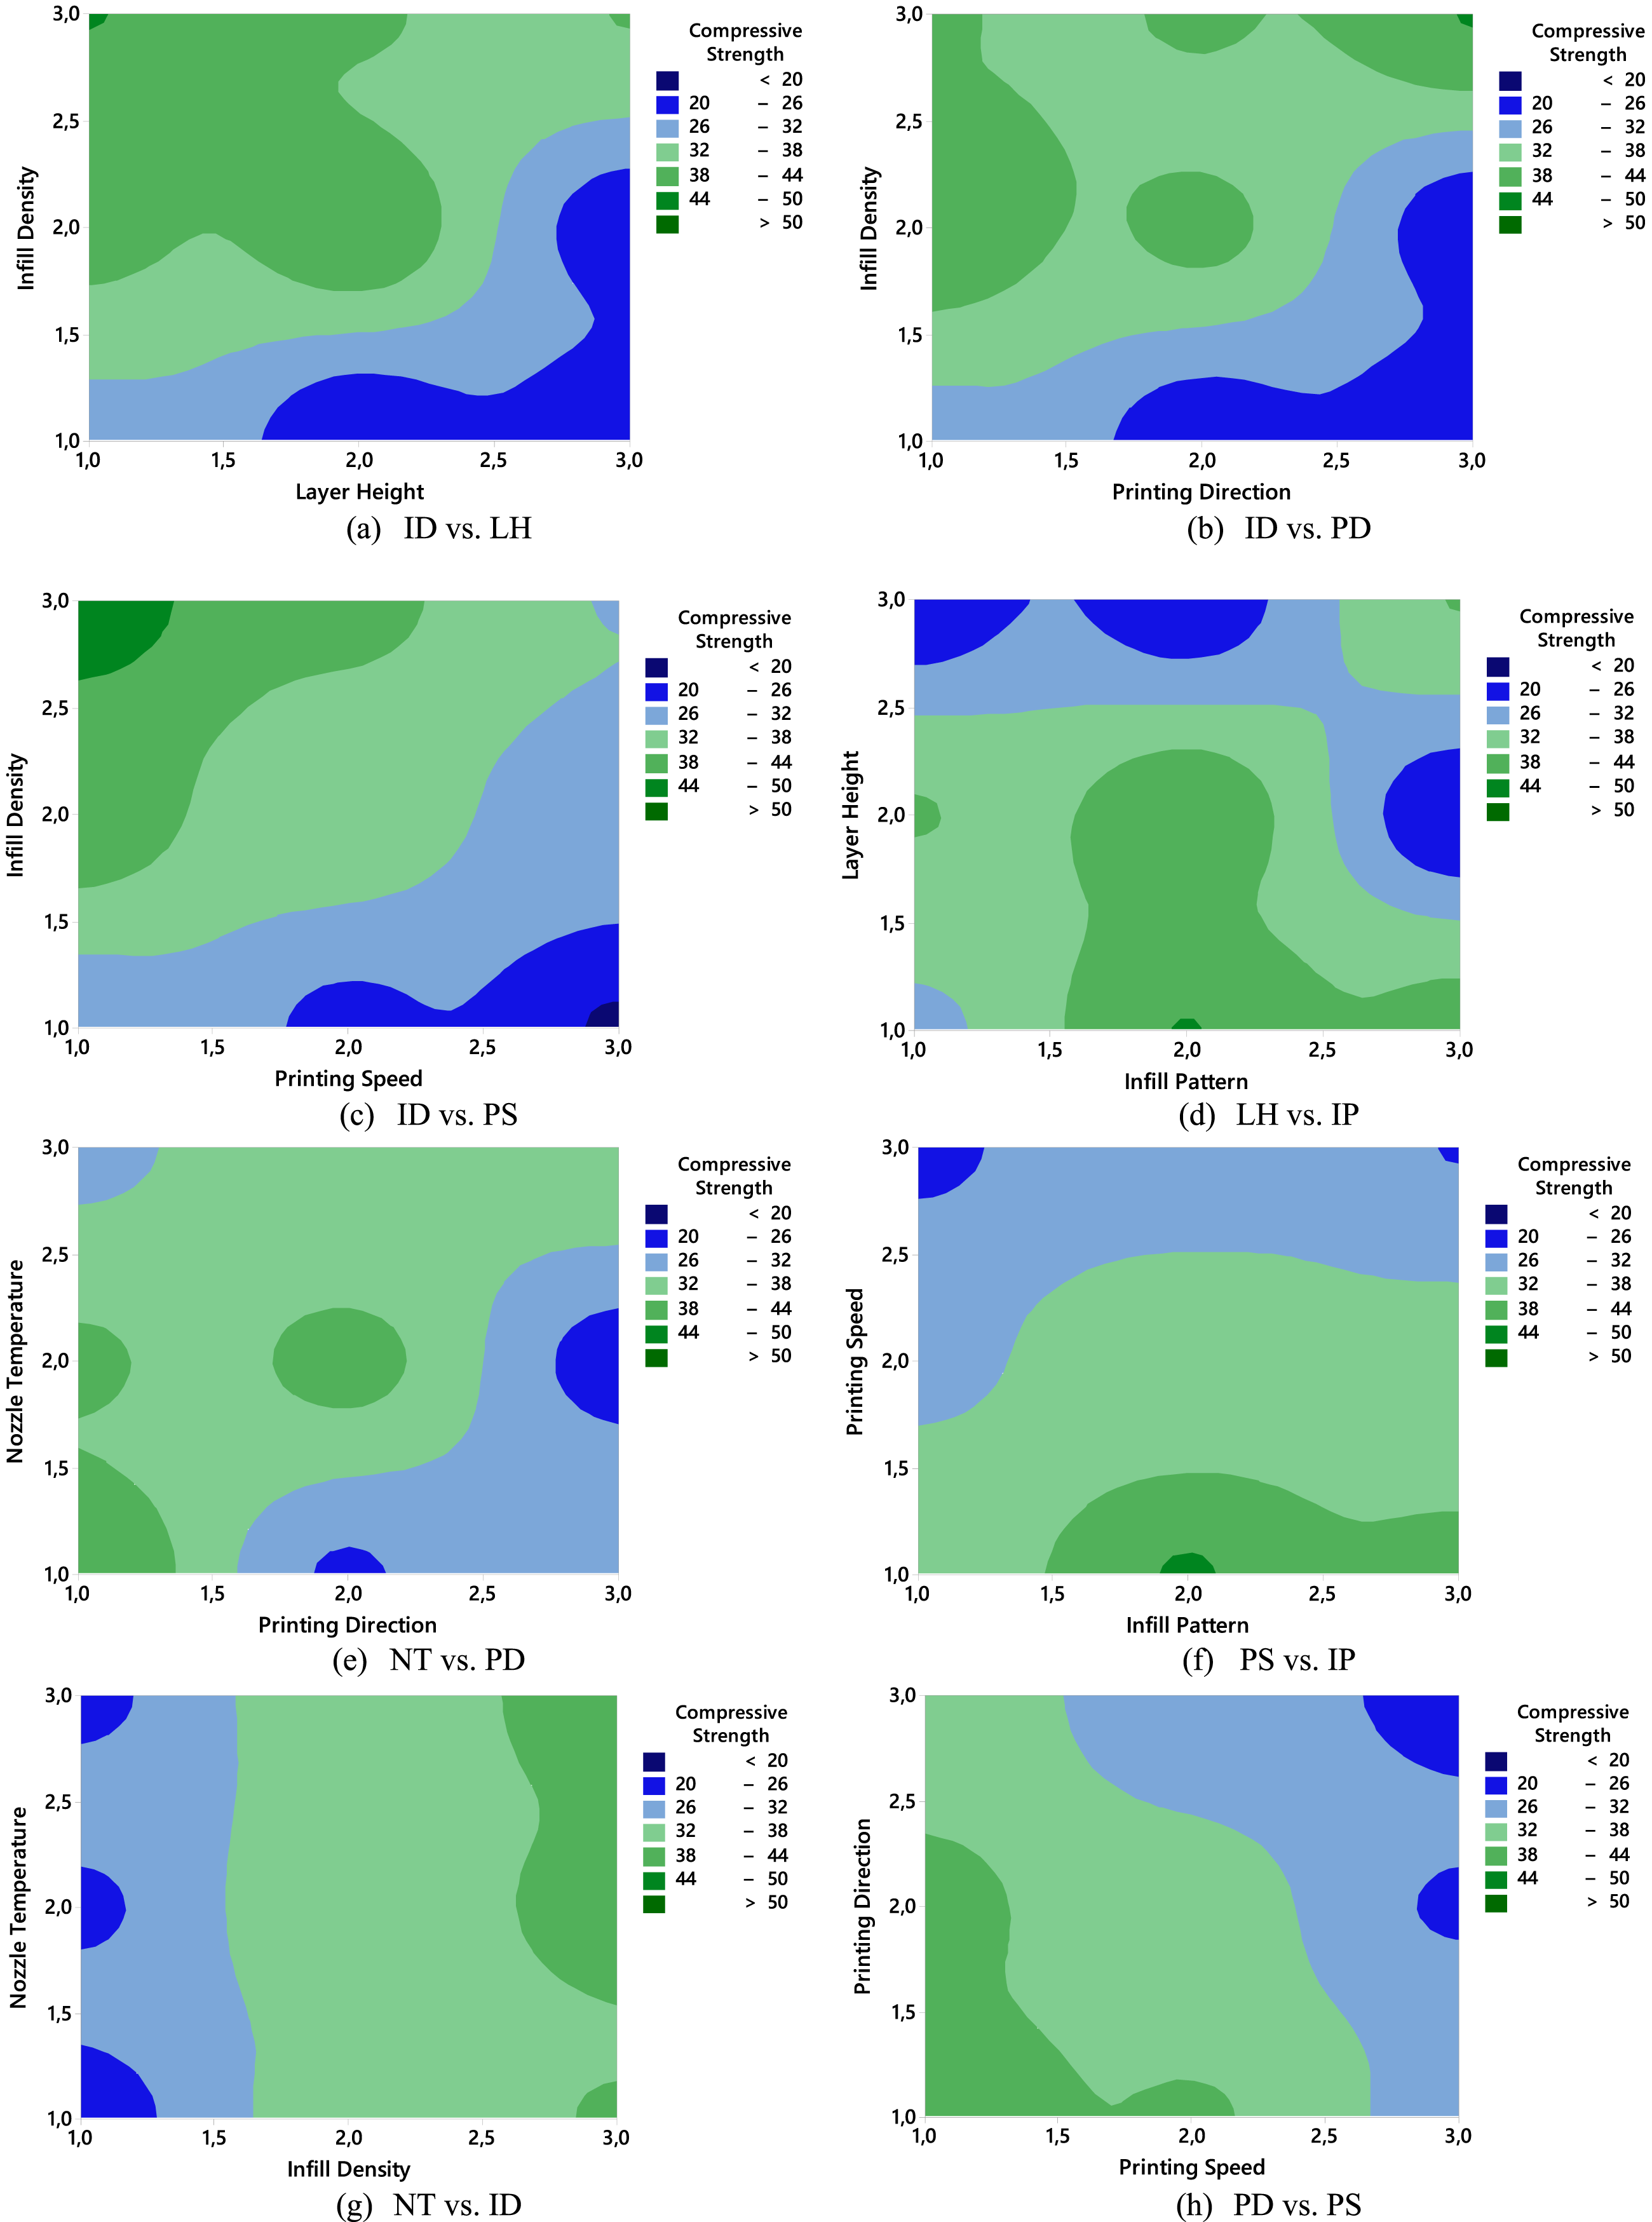
Effect of Density on Compressive Strength Properties
The relationship between density and compressive strength of FDM-printed ABS specimens was thoroughly investigated to understand the material’s structural behavior. The experimental results revealed a strong linear correlation between these two parameters, as demonstrated by the regression analysis shown in Figure 8. The relationship can be expressed by the linear equation y = 0.054x - 3.095, with a high coefficient of determination (R2 = 0.978), indicating an excellent fit of the experimental data. Co-relation between density and compressive strength.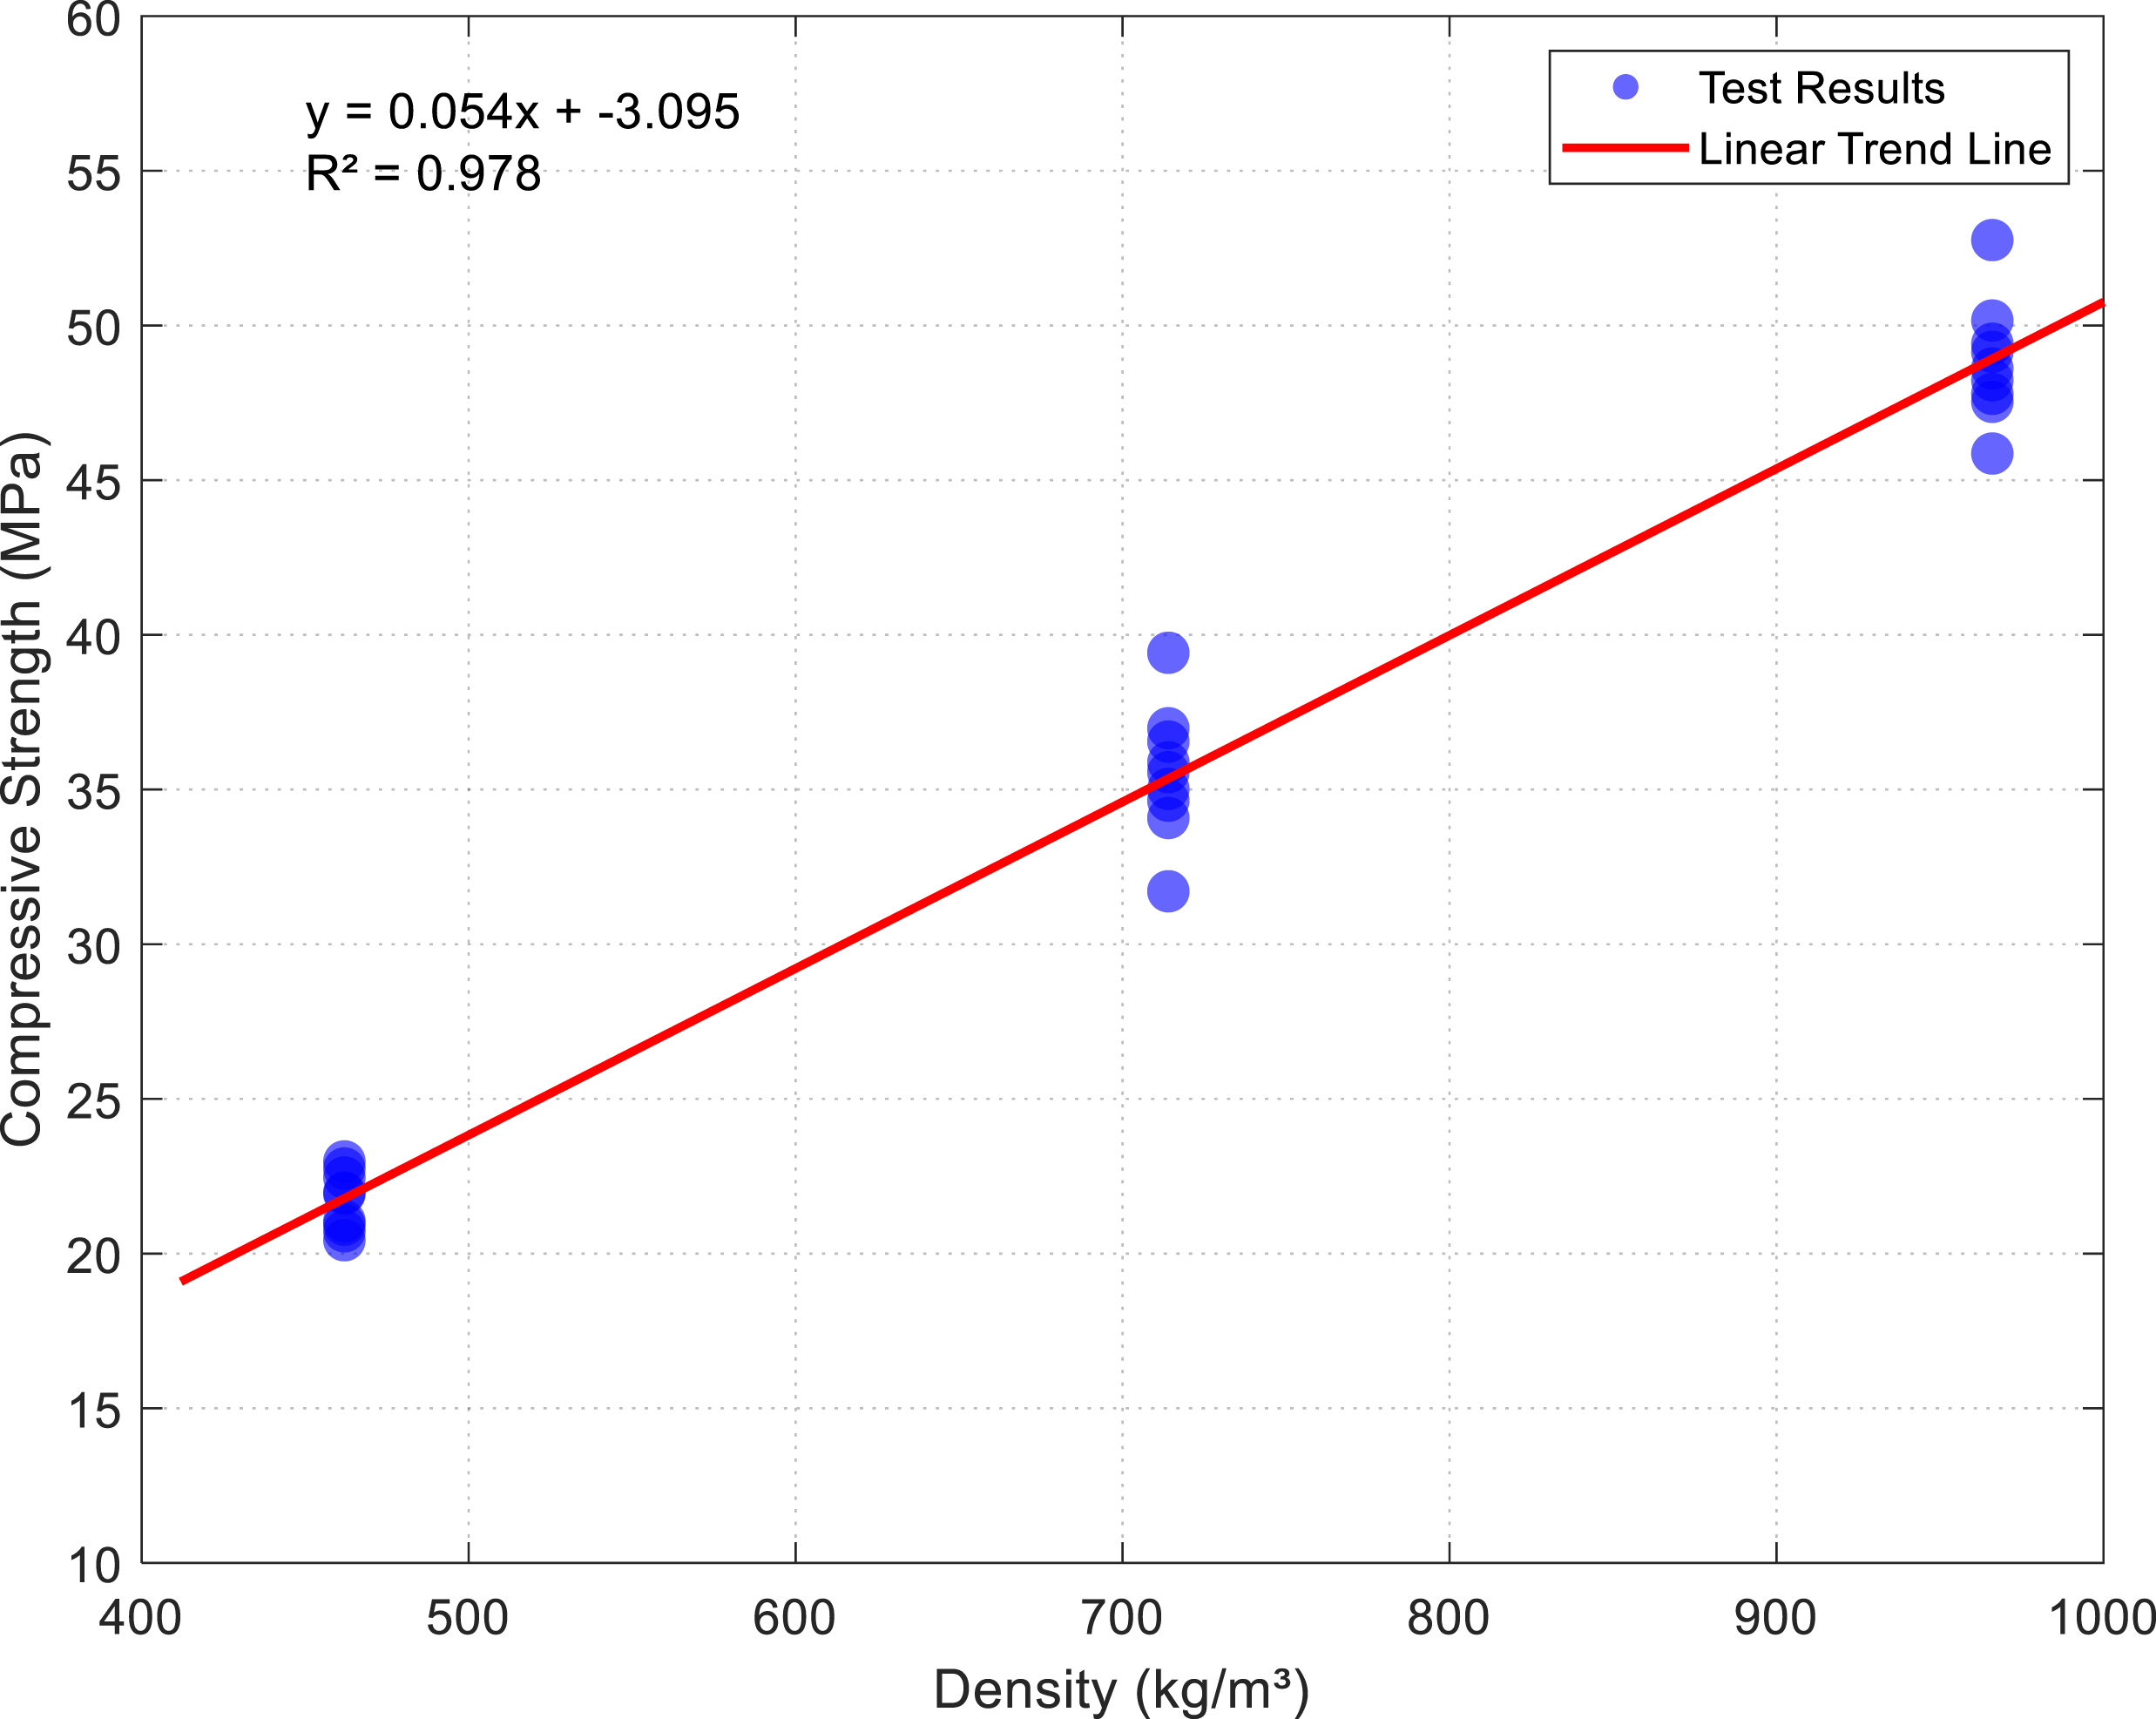
The specimens were tested at three distinct density levels: low (462 kg/m3), medium (714 kg/m3), and high (966 kg/m3), corresponding to infill densities of 30%, 60%, and 90% respectively. At the lowest density of 462 kg/m3, specimens exhibited a mean compressive strength of 21.63 MPa, while those at medium density (714 kg/m3) achieved average strengths of 35.53 MPa. The highest density specimens (966 kg/m3) demonstrated superior mechanical performance with average compressive strengths of 48.73 MPa. The regression analysis shows that compressive strength increases by approximately 0.054 MPa for each unit increase in density (kg/m3). This linear relationship holds consistently across the tested density range, with density explaining approximately 97.8% of the variation in strength values. The maximum compressive strength of 52.76 MPa was recorded at 966 kg/m3, while the minimum value of 20.43 MPa was observed at 462 kg/m3. Some scatter in the experimental data was observed, particularly in the medium density range (714 kg/m3) and high-density range (966 kg/m3), which can be attributed to variations in the printing process and internal structure formation. However, the overall trend remains highly consistent, as evidenced by the high R2 value. The strong correlation between density and compressive strength can be attributed to the increased material volume and reduced void content at higher densities, resulting in more efficient load distribution and enhanced structural integrity. This relationship provides valuable insights for optimizing the printing process and predicting mechanical properties based on density specifications. These findings are particularly relevant for applications requiring specific strength requirements, as they enable precise control of mechanical properties through density adjustment during the manufacturing process. The results underscore the critical role of density control in achieving desired mechanical properties in FDM-printed ABS components. This understanding is essential for quality control, material optimization, and design decisions in practical applications where specific strength requirements must be met.
Analysis of Variance
ANOVA results for Taguchi design.
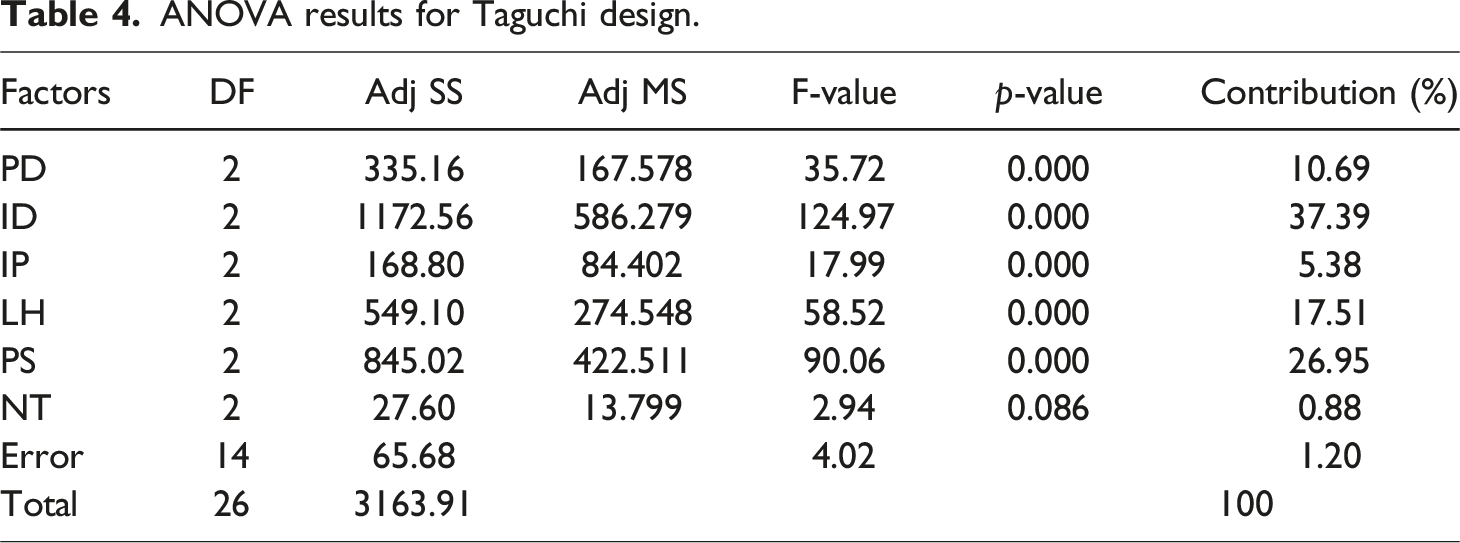
The F-values in the ANOVA table further support these results. The high F-values for ID, PS, and LH indicate that these parameters have a significant effect on compressive strength, while the low F-value for NT shows that its effect is negligible. The total error rate is quite low at 1.20%, which indicates that the model provides a good fit and that the analysis is reliable. The findings reveal that ID and PS significantly enhance compressive strength, while NT exhibits only marginal effects under the tested conditions.
Regression Model Results
A regression analysis was conducted to numerically express the relationship between printing parameters and compressive strength, and to better understand the effects of these parameters. This analysis was used to create a model that relates the dependent variable, compressive strength, with independent variables such as PD, ID, IP, LH, PS, and NT. Based on the printing parameters, a predictive equation for strength was developed. The accuracy and suitability of the regression models were evaluated using the coefficient of determination (R2), adjusted R2, and predicted R2 values. The R2 value indicates how well the model explains the variability in the data and was calculated as 98.75% in this study. This high R2 value shows that the model explains a significant portion of the variability in compressive strength. The adjusted R2 value was 98.16%, providing an adjusted measure that accounts for the number of parameters in the model, confirming that the model is not overfitting with unnecessary parameters. Additionally, the predicted R2 value was calculated as 97.93%, indicating that the model has a strong predictive ability on new data.
Residual analyses were conducted during the regression analysis to verify the model assumptions. The residual plots displayed in Figure 9 were used to assess the accuracy of the model and its adherence to assumptions. The normal probability plot was used to check whether the residuals followed a normal distribution, and it was observed that many of the residuals lined up closely along the red line. This indicates that the model largely conforms to the assumed normal distribution and supports its accuracy. However, slight deviations at the extremes of the plot may suggest minor departures from normality in a small portion of the model. In the versus fits plot, the random scatter of residuals suggests that the model has an appropriate linear relationship. The absence of any clear pattern in the residuals indicates that there is no systematic error, and the linear relationship between the variables is valid. Nonetheless, a few outliers and some spread out suggest that the model may have small inaccuracies in certain predictions. The histogram of residuals shows the distribution of the residuals and presents a shape close to a normal distribution. However, there is a slight skew toward the negative side, indicating that the residuals may not follow a perfectly normal distribution. In the versus order plot, the random distribution of residuals according to the order of experiments shows that there is no time-dependent bias or trend, and the model satisfies the assumption of independence. In conclusion, the regression model successfully predicts compressive strength with a high R2 value. The residual analyses also demonstrate that the model largely meets the assumptions and is accurate. The model exhibits strong predictive ability and reliably forecasts the effects of printing parameters on compressive strength. Graphs obtained as a result of compressive strength regression analysis.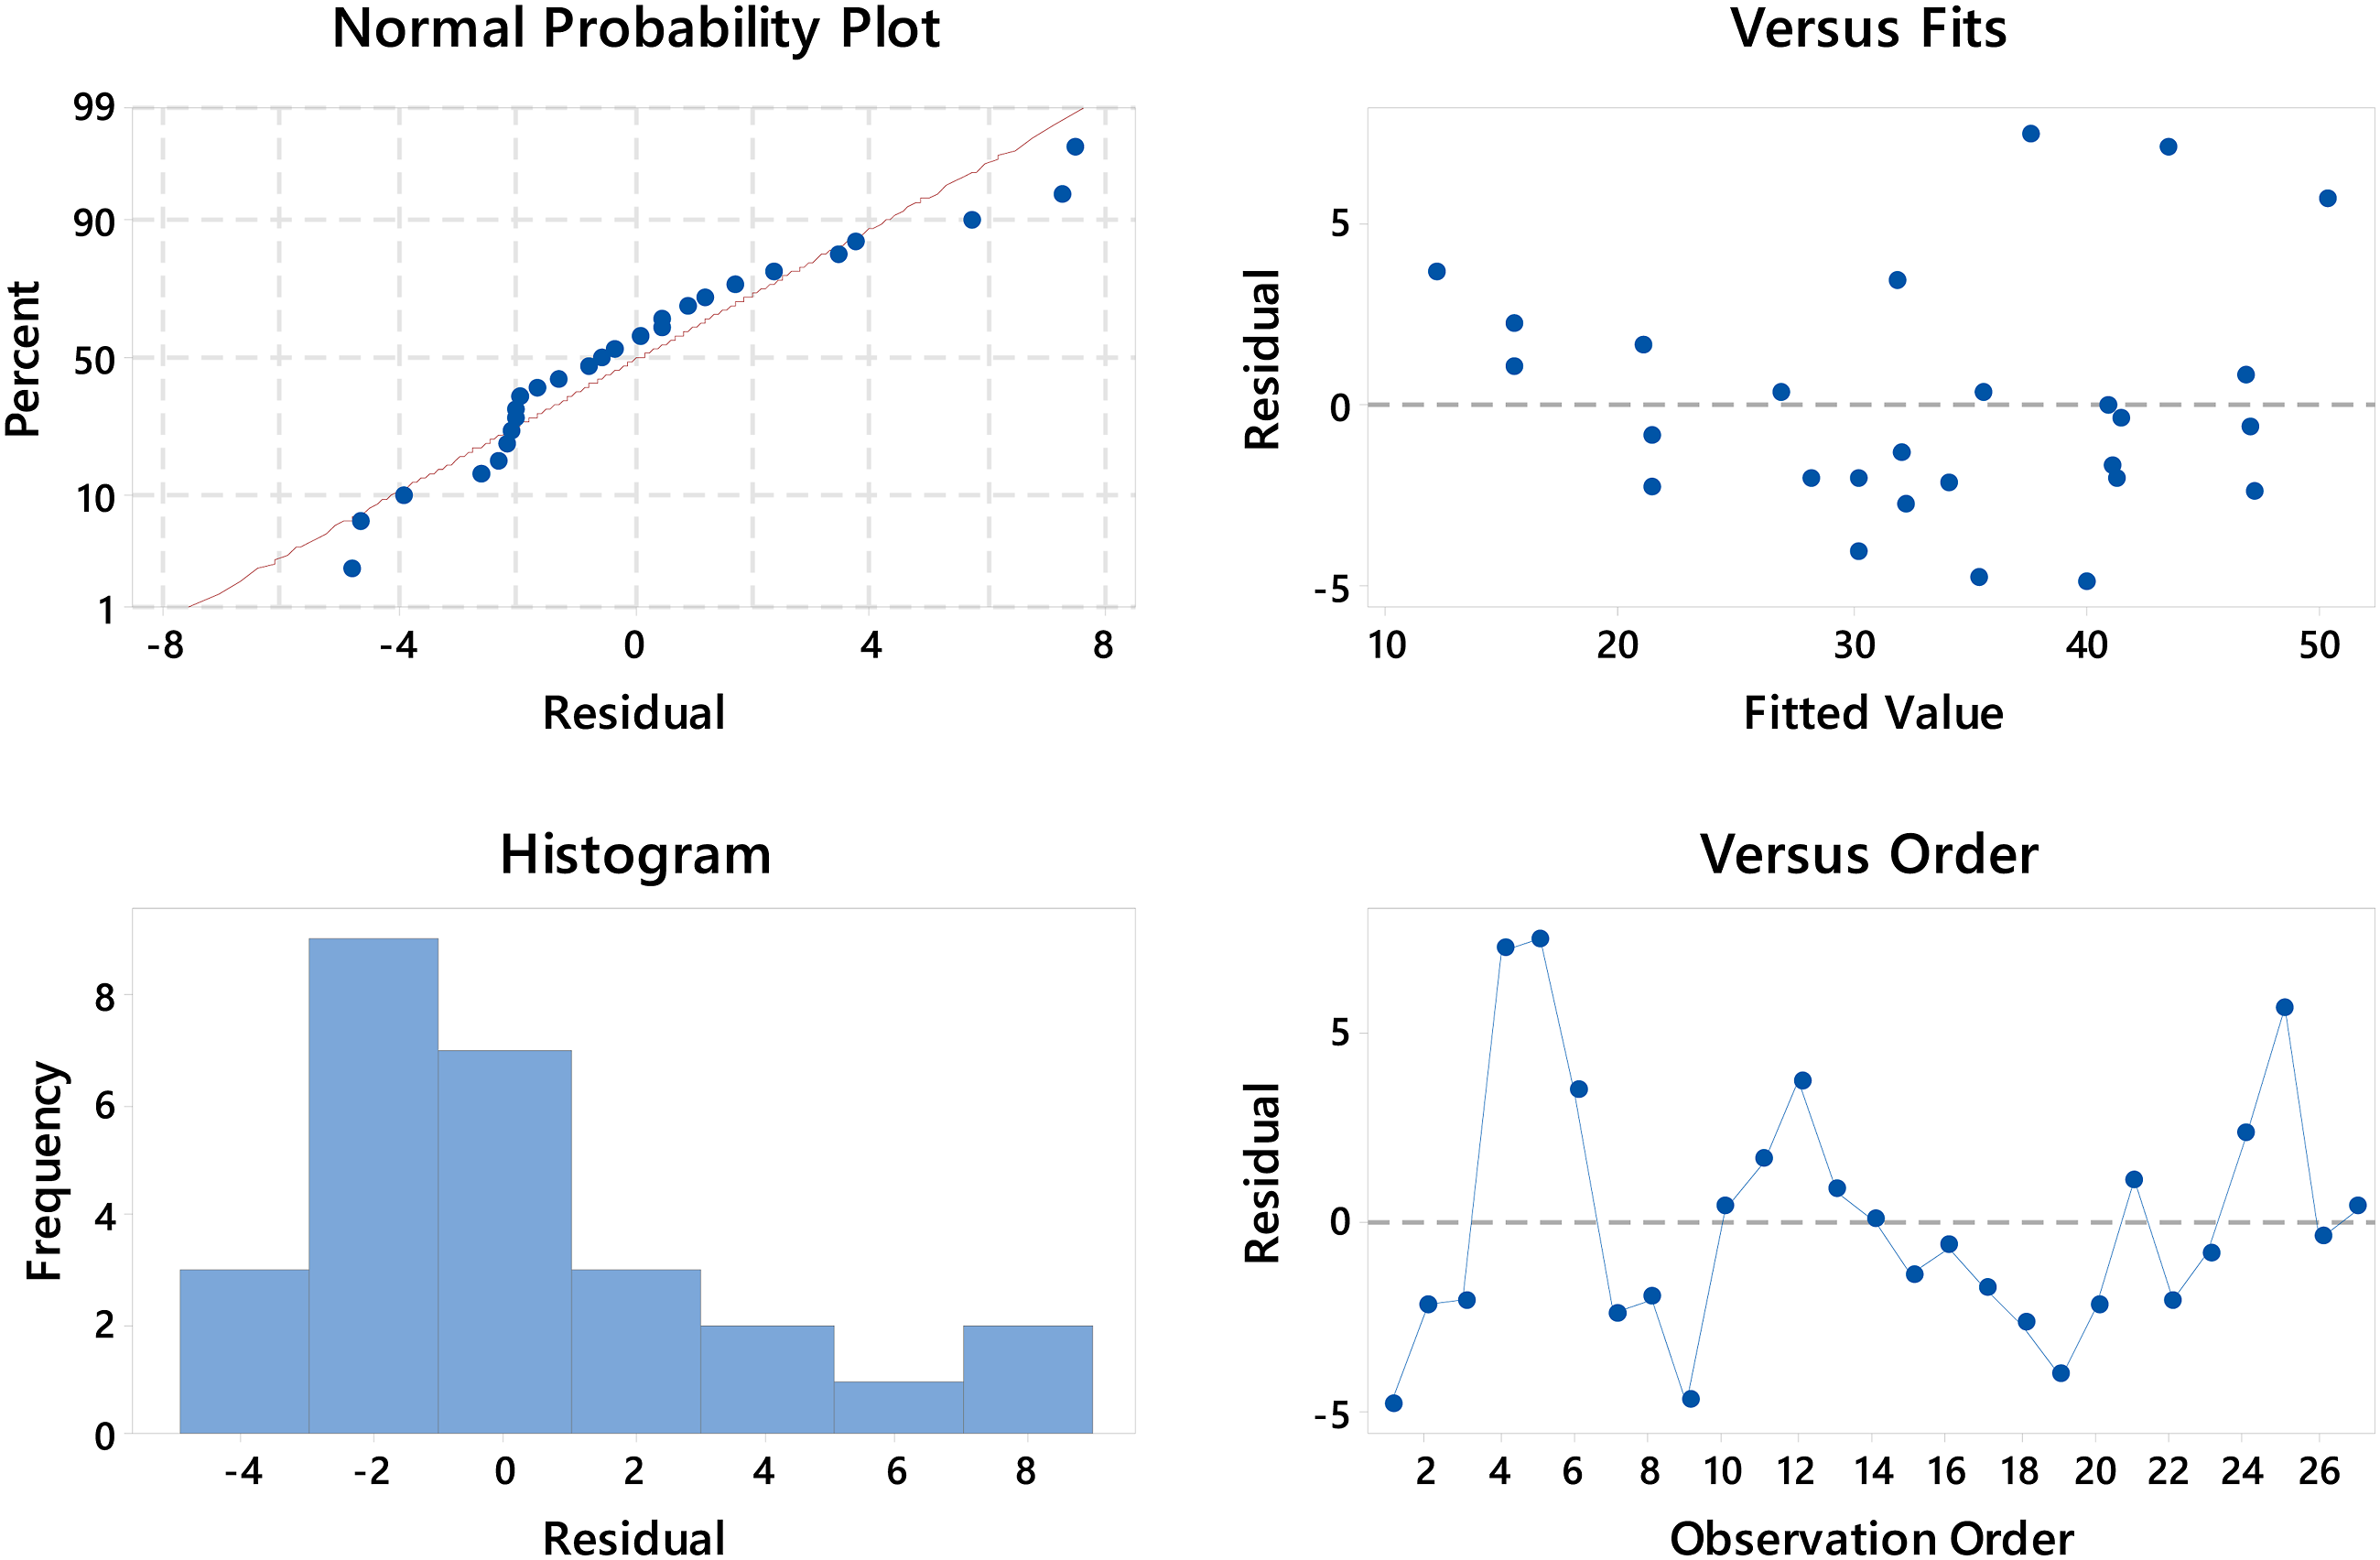
Evaluation of Fuzzy Logic Results
In this section, the results of the proposed FL model based on the Taguchi L27 orthogonal array experiment results have been obtained. This model was implemented using MATLAB R2019b software and 729 rules were created. The FL model enabled the creation of 3D surface plots to visualize the relationships between input and output parameters. The FL results regarding the effects of printing parameters on compressive strength are presented in Figure 10. The input parameters have a significant effect on compressive strength. Consistent with the ANOVA results, the ID parameter stands out as the most important variable. This is followed by PS, LH, and PD, respectively. Figure 10(a) shows the effect of ID and LH on compressive strength. When ID is high (80%-100%), strength reaches its highest level (around 41 MPa). However, as LH increases (especially in the 200-300 µm range), strength significantly decreases. The combination of low ID and high LH results in the lowest strength values (around 35 MPa). When ID is high (80%-100%), compressive strength remains at high levels (36-37 MPa), whereas when both PD and ID are low (0%-40%), compressive strength drops to its lowest value (around 28 MPa) (Figure 10(b)). Figure 10(c) explores the relationship between ID and PS. As ID increases (especially above 80%), strength rises to around 39 MPa. However, as PS increases (in the 90-100 mm/s range), a noticeable decrease in strength is observed. Especially when high PS combined with low ID, strength reaches its lowest levels. When LH is low and IP is high, strength reaches its highest levels (38-39 MPa). However, as LH increases (in the 200-300 µm range), compressive strength significantly drops to around 32 MPa (Figure 10(d)). Figure 10(e) shows that when ID is high (80%-100%), strength exceeds 35 MPa, but as NT increases (in the 220 °C–240 °C range), a decrease in strength is observed. Especially when low ID is combined with high temperature, strength drops to its lowest levels (around 31 MPa). Compressive strength exceeds 36 MPa with high PD and low PS. When PD is low, particularly at high PS, strength significantly decreases to about 33 MPa, highlighting the importance of PD in material strength (Figure 10(f)). FL results in plots of compressive strength with printing parameters. (a) ID versus LH. (b) ID versus PD. (c) ID versus PS. (d) LH versus IP. (e) NT versus ID. (f) PD versus PS.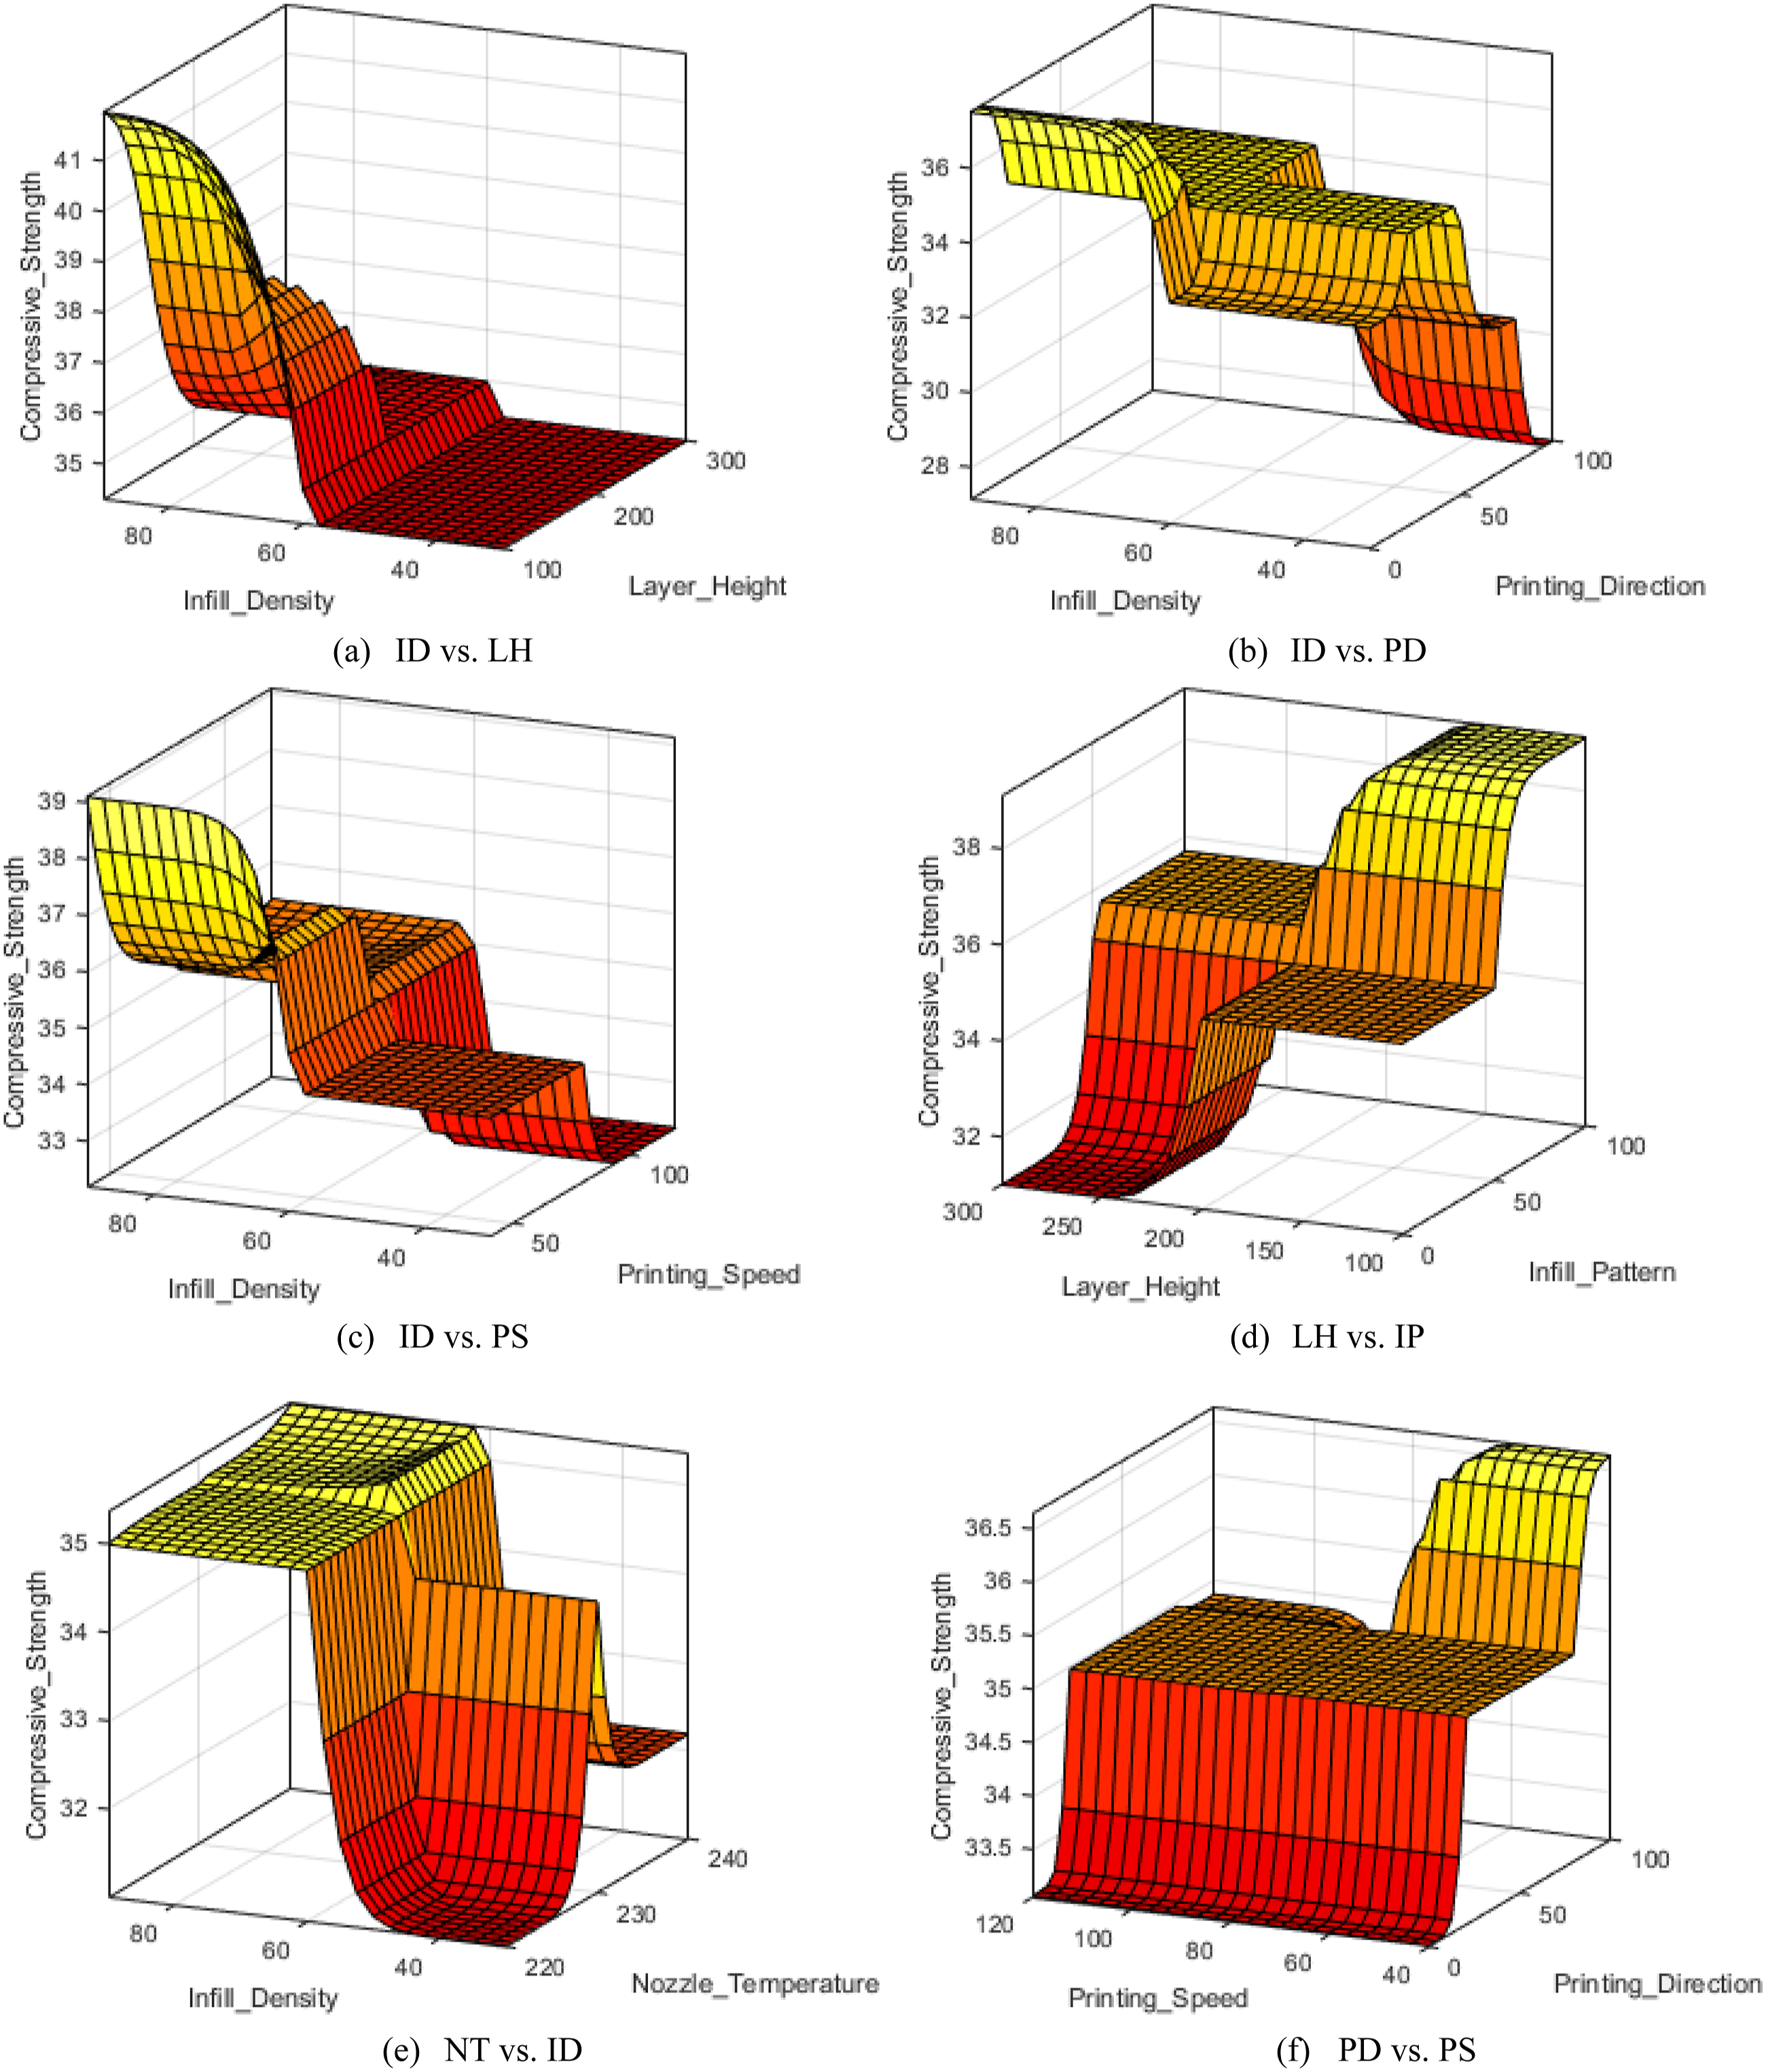
The results obtained from the FL model demonstrate that the input parameters have significant effects on compressive strength. ID emerges as the most critical parameter, followed by PS, LT, and PD. Specifically, the combination of low LH and high ID provides the highest compressive strength values. These results are consistent with the ANOVA and Taguchi findings, confirming that compressive strength can be optimized by properly adjusting the printing parameters. After the FL modeling process, a defuzzification step was applied to assign a precise value to the output parameter. Following this step, a comparison was made to evaluate the agreement between the model’s predicted results and the experimental data. Figure 11 presents a graphical comparison of experimental data, fuzzy model predictions, and Taguchi model results. Upon reviewing the graph, the proposed FL performs better in predicting compressive strength compared to the Taguchi. Based on predictions made across the 27 experiments listed in Table 3, the FL and Taguchi methods yielded average error rates of 3.1% and 3.7%, respectively. This indicates that the FL provides more accurate predictions with a lower error margin. The predictions from the fuzzy model exhibit a closer alignment with the experimental data, while the Taguchi model shows more noticeable deviations. Particularly in most of the experiments, the predictions from the fuzzy model almost overlap with the experimental data, highlighting the high accuracy of the model. These findings suggest that the proposed FL is a highly effective method for accurately predicting the behavior of parameters. When forecasting a crucial engineering parameter such as compressive strength, the fuzzy model stands out as a reliable tool, exhibiting strong agreement with experimental results. Comparison of actual and predicted compressive strength.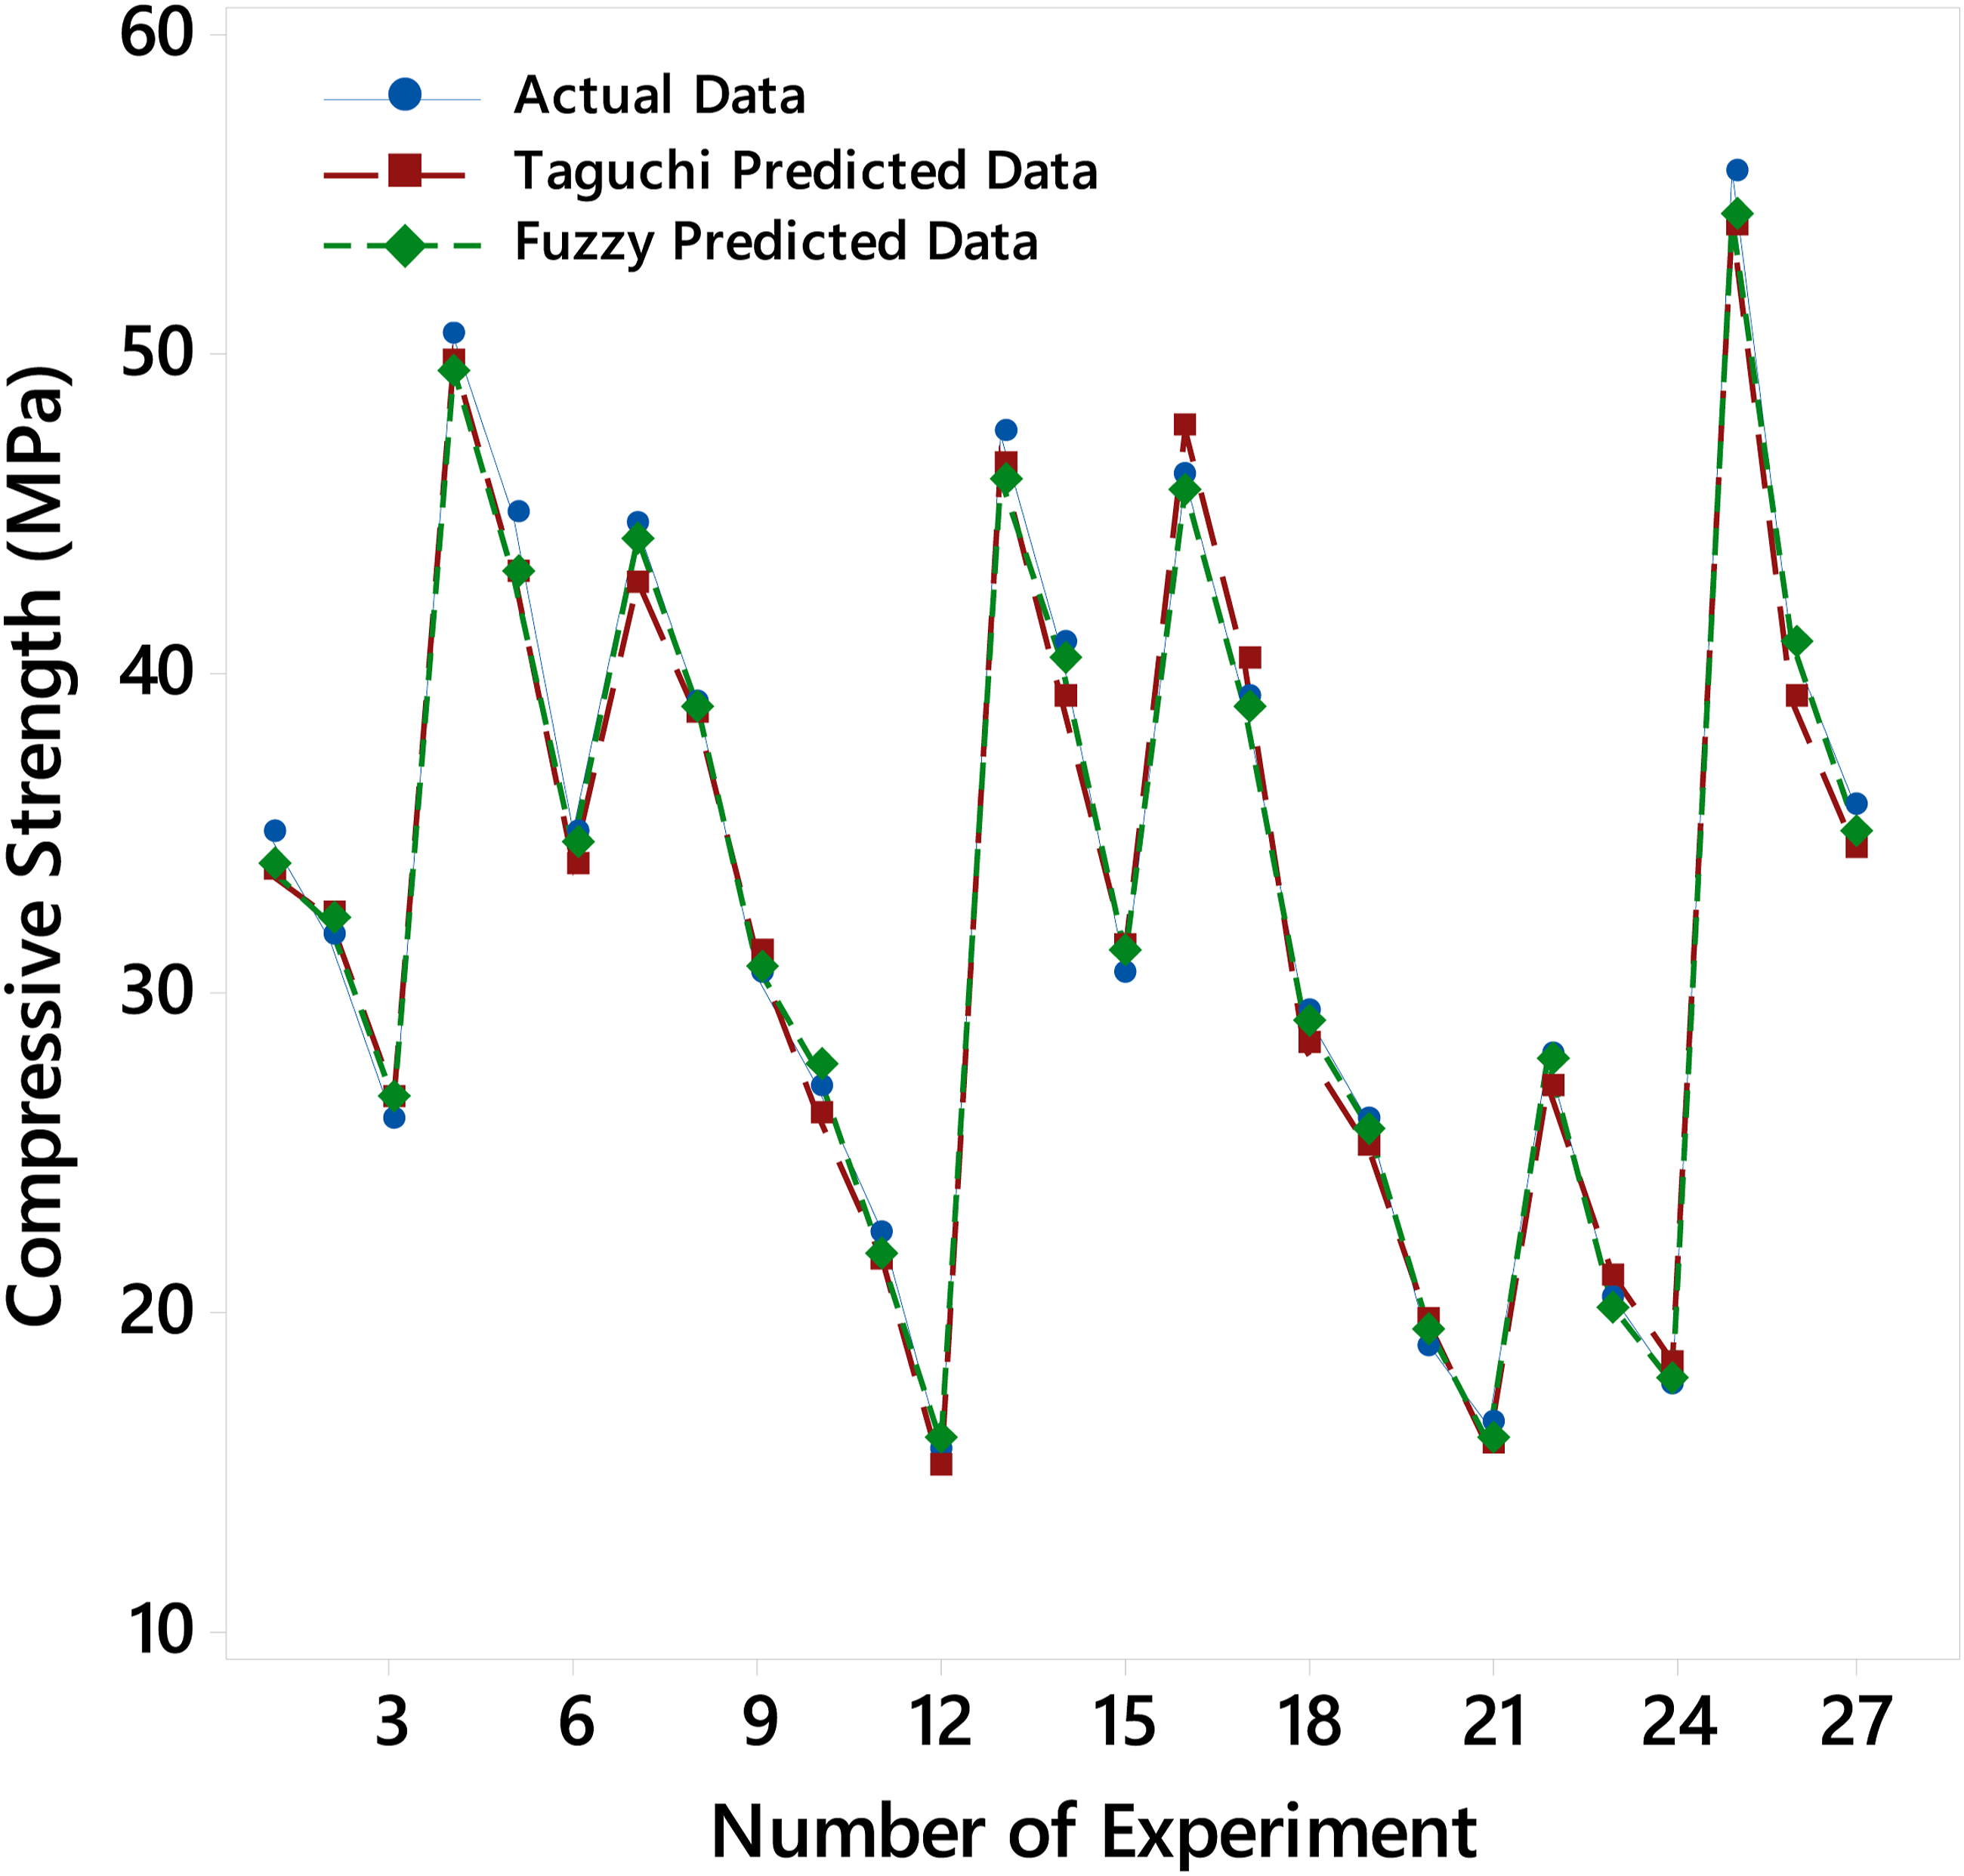
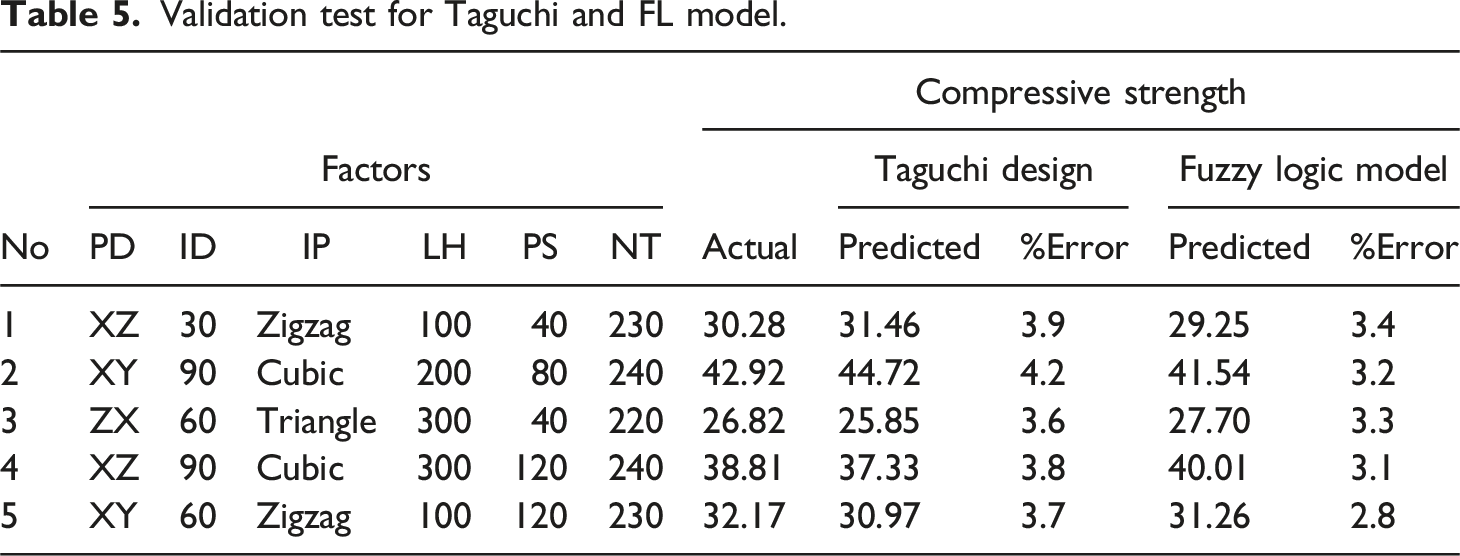
Validation Tests
Validation test for Taguchi and FL model.
Discussion
This study presents a novel approach for predicting the compressive strength of FDM-printed ABS components by integrating Taguchi experimental design and FL modeling. The originality of this research lies in its comprehensive analysis of the effects of multiple printing parameters, including ID, LH, PS, IP, NT, and PD, on the mechanical performance of printed parts. Unlike previous studies, which primarily focused on tensile strength or surface roughness optimization, this work specifically investigates compressive strength, a critical property for structural applications. This study presents a robust methodology for optimizing FDM process parameters while reducing experimental costs and time by integrating the Taguchi L27 orthogonal array-based experimental design with FL predictive modeling. The key findings highlight the dominant influence of ID (37.39%), PS (26.95%), and LH (17.51%) on compressive strength, as confirmed by ANOVA. The optimal parameter combination—90% ID, 100 µm LH, and 40 mm/s PS—yielded the highest compressive strength of 55.76 MPa. Furthermore, the FL demonstrated superior accuracy in predicting strength, outperforming the Taguchi-based regression model, with an average error rate of 3.1% compared to 3.7%. The ability of the FL model to handle nonlinear relationships and uncertainties in datasets further validates its reliability as a predictive tool for AM applications. This study makes significant contributions to the field of AM by introducing a systematic framework for compressive strength prediction using a hybrid Taguchi-FL approach, which can be extended to other polymeric materials and AM techniques. Additionally, the developed FL enhances predictive capabilities, reducing the dependency on extensive experimental trials, while the findings provide valuable insights into the role of printing parameters in optimizing mechanical performance. These insights will assist engineers and researchers in improving FDM-printed part quality for industrial applications, including aerospace, automotive, and biomedical engineering.
While this study primarily focuses on compressive strength prediction, the importance of failure mode analysis in understanding the mechanical behavior of FDM-printed components is recognized. Although failure mode analysis was not within the scope of this study, we have planned a detailed investigation of failure mechanisms for future research. This will enable us to correlate printing parameters with different failure types, such as brittle fracture, layer delamination, and ductile yielding, which are crucial for understanding the mechanical reliability of 3D-printed structures under compression loads. Furthermore, although this study specifically focuses on ABS material and the Creality K1C printer, the proposed Taguchi-FL framework is highly adaptable and can be applied to other thermoplastic materials, such as PLA, PETG, and composite-reinforced polymers, by adjusting the relevant process parameters. The same methodology can also be implemented using different FDM printers, provided that the experimental conditions are appropriately calibrated. Future research should explore the application of this methodology to a broader range of materials and printing technologies to further validate its robustness. Additionally, integrating machine learning (ML) techniques, such as artificial neural networks or genetic algorithms, could further enhance the predictive capabilities of the model, leading to more accurate and generalized predictions across various AM conditions. The current model is limited to the specific experimental design used in this study; therefore, further investigations should focus on validating the findings under different environmental conditions, such as variations in humidity and temperature. Another important direction for future research is the investigation of multi-objective optimization, where compressive strength can be balanced with other mechanical properties, such as tensile strength, flexural strength, and impact resistance. In conclusion, this study successfully demonstrates that optimizing FDM process parameters through a hybrid experimental-design and soft computing approach leads to significant improvements in strength prediction. The findings not only contribute to the growing body of knowledge in AM but also provide a generalizable methodology that can be extended to other materials and printing systems. Future research integrating failure mode analysis, advanced computational models, material diversity, and multi-material printing techniques holds great potential for further advancements in this field.
Conclusions
This study focused on predicting the compressive strength of FDM-printed ABS specimens using Taguchi and FL modeling. The results demonstrated the critical influence of FDM parameters on the mechanical properties of the final product, particularly compressive strength. The experiments were designed using the Taguchi L27 orthogonal array, examining six key printing parameters: PD, ID, IP, LH, PS, and NT. ANOVA revealed ID as the most significant parameter with a 37.39% contribution rate, followed by PS (26.95%) and LH (17.51%). The contribution rates of other parameters, including PD, IP, and NT, were calculated as 10.69%, 5.38%, 17.51%, and 0.88%, respectively. The optimal parameters yielding the highest compressive strength (55.76 MPa) were determined as 90% ID, 100 µm LH, and 40 mm/s PS. The regression analysis achieved an R2 value of 0.94, confirming the statistical significance of these parameters. The FL model demonstrated superior prediction accuracy with a 3.1% average error compared to the Taguchi model’s 3.7%. This study has demonstrated that a combination of Taguchi, regression analysis, and FL modeling can effectively predict the compressive strength of ABS components produced via FDM. Future work will explore ML techniques to further enhance prediction accuracy and process optimization.
Footnotes
Declaration of conflicting interests
The author(s) declared no potential conflicts of interest with respect to the research, authorship, and/or publication of this article.
Funding
The author(s) received no financial support for the research, authorship, and/or publication of this article.