
Abstract
Composite structures have been widely used in recent years in the aerospace industry as well as in industries that require lightweight structures due to their lightness and high strength-to-weight ratio. The purpose of this research is to introduce and compare a new type of sandwich panel to introduce structures that can be used in the aerospace industry. The cores in this research are made using Fused Deposition Modeling (FDM) with two types of PLA and ABS polymers. The face sheets used for this study are glass fiber reinforced composites and aluminum face sheets. In the first part of this study, a theoretical model for obtaining the force-displacement curve in nuclei with rectangular geometry was presented. Comparison of theoretical and experimental results showed that theoretical relationships have a good ability to predict the amount of force in experimental tests. The results obtained in this study showed that the use of composites made of epoxy glass fibers as a face sheet for sandwich panels leads to higher resistance to three-point bending. It was also found that sandwich panels made with ABS cores have higher strength compared to PLA cores, but their softness is less.
Introduction
Investigation of mechanical and flexural properties in composites and especially sandwich panels is one of the most up-to-date research areas. Various materials have always been used as the core and face sheet of sandwich panels, including metal honeycomb cells, polyurethane foams, and fiberglass composites. One of the technologies that has recently been considered in the discussion of sandwich panels is 3D printing technology using polymer filaments. 3D printers are useful in different industries including automobile industry, airplane industry, medical, civil, etc.1,2 Additive manufacturing process is the base process which is done in 3D printing. Because of flexibility and design merits of additive technology the use of this method has an upward trend. For instance, this method, while allowing the production of shapes which are complex and structures which have less weight, decreases time and cost of tool and remarkably make the production process more simple.1,3,4 By means of this method, those parts which are made using various assembly parts can be made like a single part.
Thin-walled energy absorbers, metal honeycomb cells and polyurethane foams, and lattice structures attracted the attention of many collision researchers before the advent of 3D printers. These structures are very light and have a high strength to weight ratio, so much research has been done in this area and many researchers have studied these samples.5–14 As new methods for producing structures emerged, researchers examined the efficiency of production methods in impact research. The following are some of the studies conducted in recent years in the field of printed structures that have examined the performance under flexural and compressive loads.
In relation to Energy absorbers, Zeng et al. 15 carried out experimental investigations on continuous fiber reinforced composite honeycomb structures (CFRCHSs) with exceptional shape memory properties that were fabricated using fused filament fabrication (FFF) technology. The focus of these investigations was on the compression behaviors exhibited by these structures in both out-of-plane and in-plane orientations, as well as their energy absorption characteristics. In a study conducted by Pirouzfar and Zeinedini, 16 the influence of various geometric parameters on the flexural characteristics of 3D-printed honeycomb structures and their sandwich panels, which had face-sheets composed of E-glass/epoxy laminates, was examined for three-point bending. The honeycomb structures were evaluated using three different cell wall thicknesses: 1 mm, 1.5 mm, and 2 mm. In certain publications, an examination of the mechanical properties was conducted. A study conducted by Ayrilmis et al. 17 explored the impact of core configuration on the mechanical properties of specimens fabricated via 3D printing using a commercially available wood/PLA filament. Various wood/PLA specimens were manufactured utilizing a 3D printer, incorporating different infill rates and pattern types such as square, hexagonal, and octagonal.
In regards to researches carried out on PLA, recent investigations have been considered in this paragraph. Chahardoli 18 conducted an investigation into the flexural characteristics of sandwich panels comprising of 3D printed cellular cores and aluminum face sheets subjected to quasi-static loading. The findings unveiled that the samples exhibited contrasting behavior when subjected to flexural and compressive loads, indicating the potential for diverse performances despite their similar manufacturing. The alterations in the structure resulted in a substantial enhancement of up to 542% in energy absorption. The implementation of numerical simulation using LS-DYNA demonstrated the accurate prediction of the collapse behavior of energy absorbers and sandwich panels. In a study conducted by Wang et al., 19 a novel lightweight cylindrical structure with a random honeycomb pattern was proposed. This structure was achieved by extending the two-dimensional Voronoi structure to a three-dimensional space using the rolled-up algorithm. The manufacturing process of this structure involved the use of fused deposition 3D printing technology on a PLA material. The study focused on investigating the crushing behavior of this new structure under quasi-static axial loading. Furthermore, researchers prepared PLA random honeycomb-filled double circular tubes (PLARHFDCTs) and conducted a systematic study on their crushing performance. The influence of stiffener geometry on flexural properties of 3D printed polylactic acid (PLA) beams was investigated by Gebrehiwot et al. 20 Rebelo et al. 21 conducted an investigation on PLA materials. In their study, the dynamic response of a 3D printed PLA sacrificial honeycomb cladding was experimentally obtained by means of an explosive driven shock tube, while the corresponding numerical simulations are performed using the commercial finite element software LS-DYNA.
In terms of those investigations done on ABS materials, following papers could be taken into account. Kucewicz et al. 22 performed experimental and numerical studies on the deformation process of 3D printed cellular structures under uniaxial compression loading. The main aim of their study was to perform a mesh sensitivity study to assess the influence of the mesh size the obtained results. Additionally, different types of elements, that is, brick, shell and beam elements were investigated and compared. In a study conducted by Kucewicz et al., 23 a comparison was made between the experimental and numerical findings of the honeycomb cellular structure, alongside the presentation of the deformation procedures. Before conducting the experimental investigation on the uniaxial compression test, uniaxial tensile tests were carried out on dog-bone specimens. The outcomes of these tests were subsequently employed in order to determine the strength characteristics of ABSplus. A procedure for characterizing the deformation process of regular cellular structures fabricated with Fused Deposition Modelling of ABSplus material is presented by Kucewicz, et al. 24 Two different topologies with similar relative densities were experimentally compressed for five different deformation velocities. A novel class of 3D-printed sandwich structures with triply periodic minimal surface (TPMS) cores were investigated by Peng et al. 25 Primitive, Neovius and IWP sandwich structures were designed and 3D printed by FDM technique. Three-point bending tests were conducted to compare their bending performance and failure mechanism. A numerical model was also developed by ABAQUS.
As can be seen in this introduction, research on sandwich panels made with 3D printing technology is one of the topics that researchers are addressing and will undoubtedly be the focus of many manufacturers and researchers in the future. A review of previous literature has shown that so far little research has compared the performance of sandwich panels made of PLA and ABS cores. Therefore, in this study, we have tried to make a comprehensive comparison between the flexural properties of these two materials by making different cores in different geometries and also from PLA and ABS. Since the face sheets of each sandwich panel have an important role in improving the flexural properties, so two types of face sheets including aluminum face sheets and composites reinforced with glass fibers have been used and the effect of each on the flexural properties has been investigated. The use of GFRP for 3D printed cores is a new approach not seen in previous research. Also, in a theoretical approach, an attempt was made to provide a validated theoretical relationship with experimental tests that can well predict the force-displacement curves in cores made by the 3D printing process.
Materials and structures
The materials used to make sandwich panels in this study can be divided into three categories: metal, polymer and composite. In the following, the details of each material will be examined.
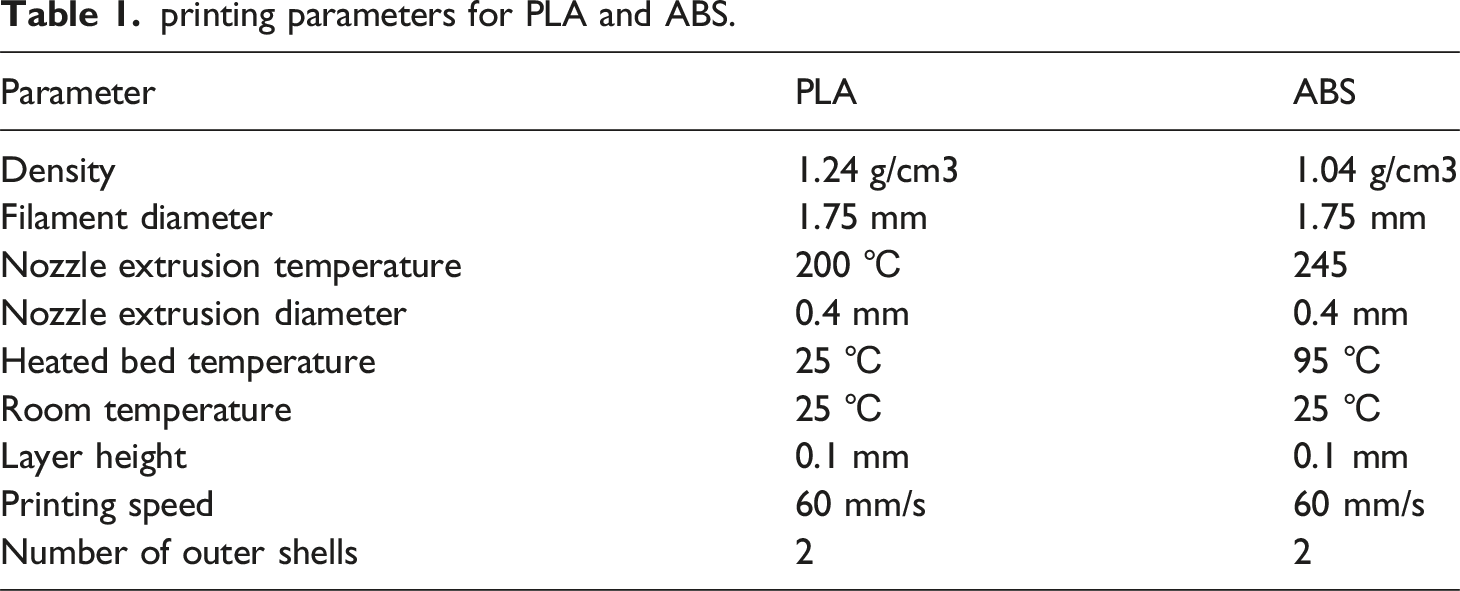
PLA and ABS polymers were used for the production of sandwich panel cores, and for the face sheet sandwich panels glass fiber and aluminum metal composite were used. Figure 1 shows the geometric dimensions of the cores used. The wall thickness in all samples of Figure 1(a) was equal to one mm. As shown in Figure 1(a), the cores were made in three geometries: rectangular, trapezoidal, and triangular. Quantum Generous 3D printer was used to produce ABS and PLA cores. The production specifications of both types of materials are given in Table 1. The cores were placed on the printer platform as shown in Figure 1(b). A: Geometric specifications of sandwich panel’s core. (Dimensions in millimeters) B: How the cores are placed on the printer platform. printing parameters for PLA and ABS.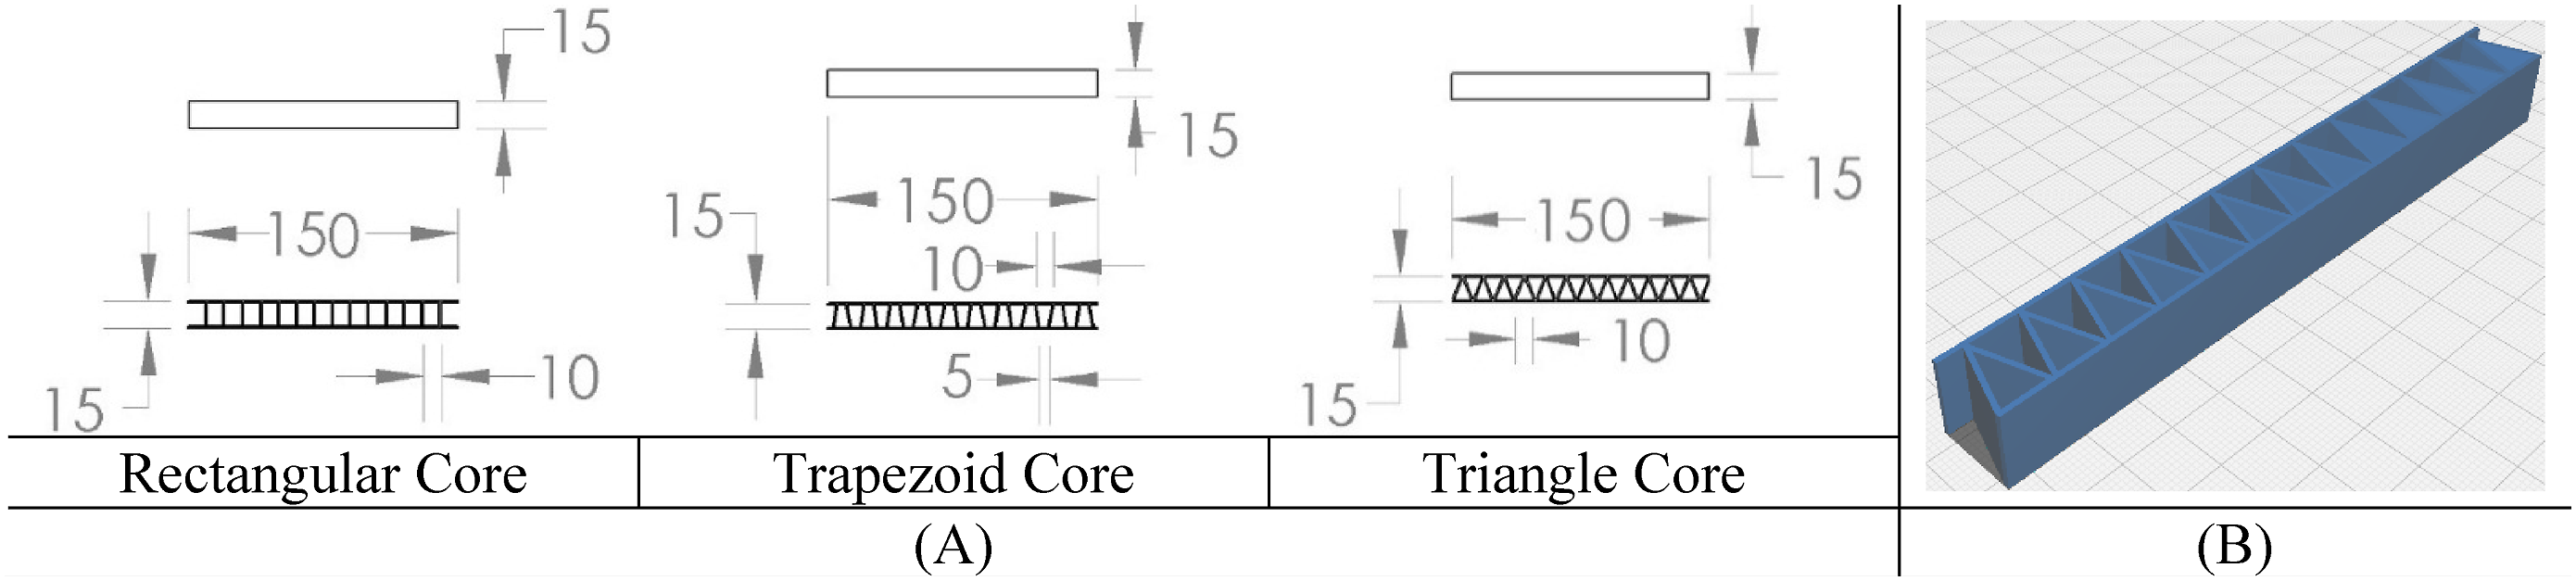
In order to make composite face sheets, woven glass fibers with a surface density of 200 g/m2 and PC105 epoxy resin with 20% hardener were used. Figure 2 shows the fibers used. In order to make E-Glass/Epoxy composite face sheets, six layers of glass fibers were stacked on top of each other and the layers were joined together using resin in each layer. Figure 2 shows the arrangement of the layers on top of each other. The final thickness of the composite sheet made was 1.5 mm. The bonding between core and its sheets is a critical factor influencing the structural integrity and performance of sandwich composites. This bonding can occur through various mechanisms. In the present specimens adhesive (epoxy) layers applied between the core and sheets were established a strong chemical bond. Placement of layers of glass fibers on top of each other.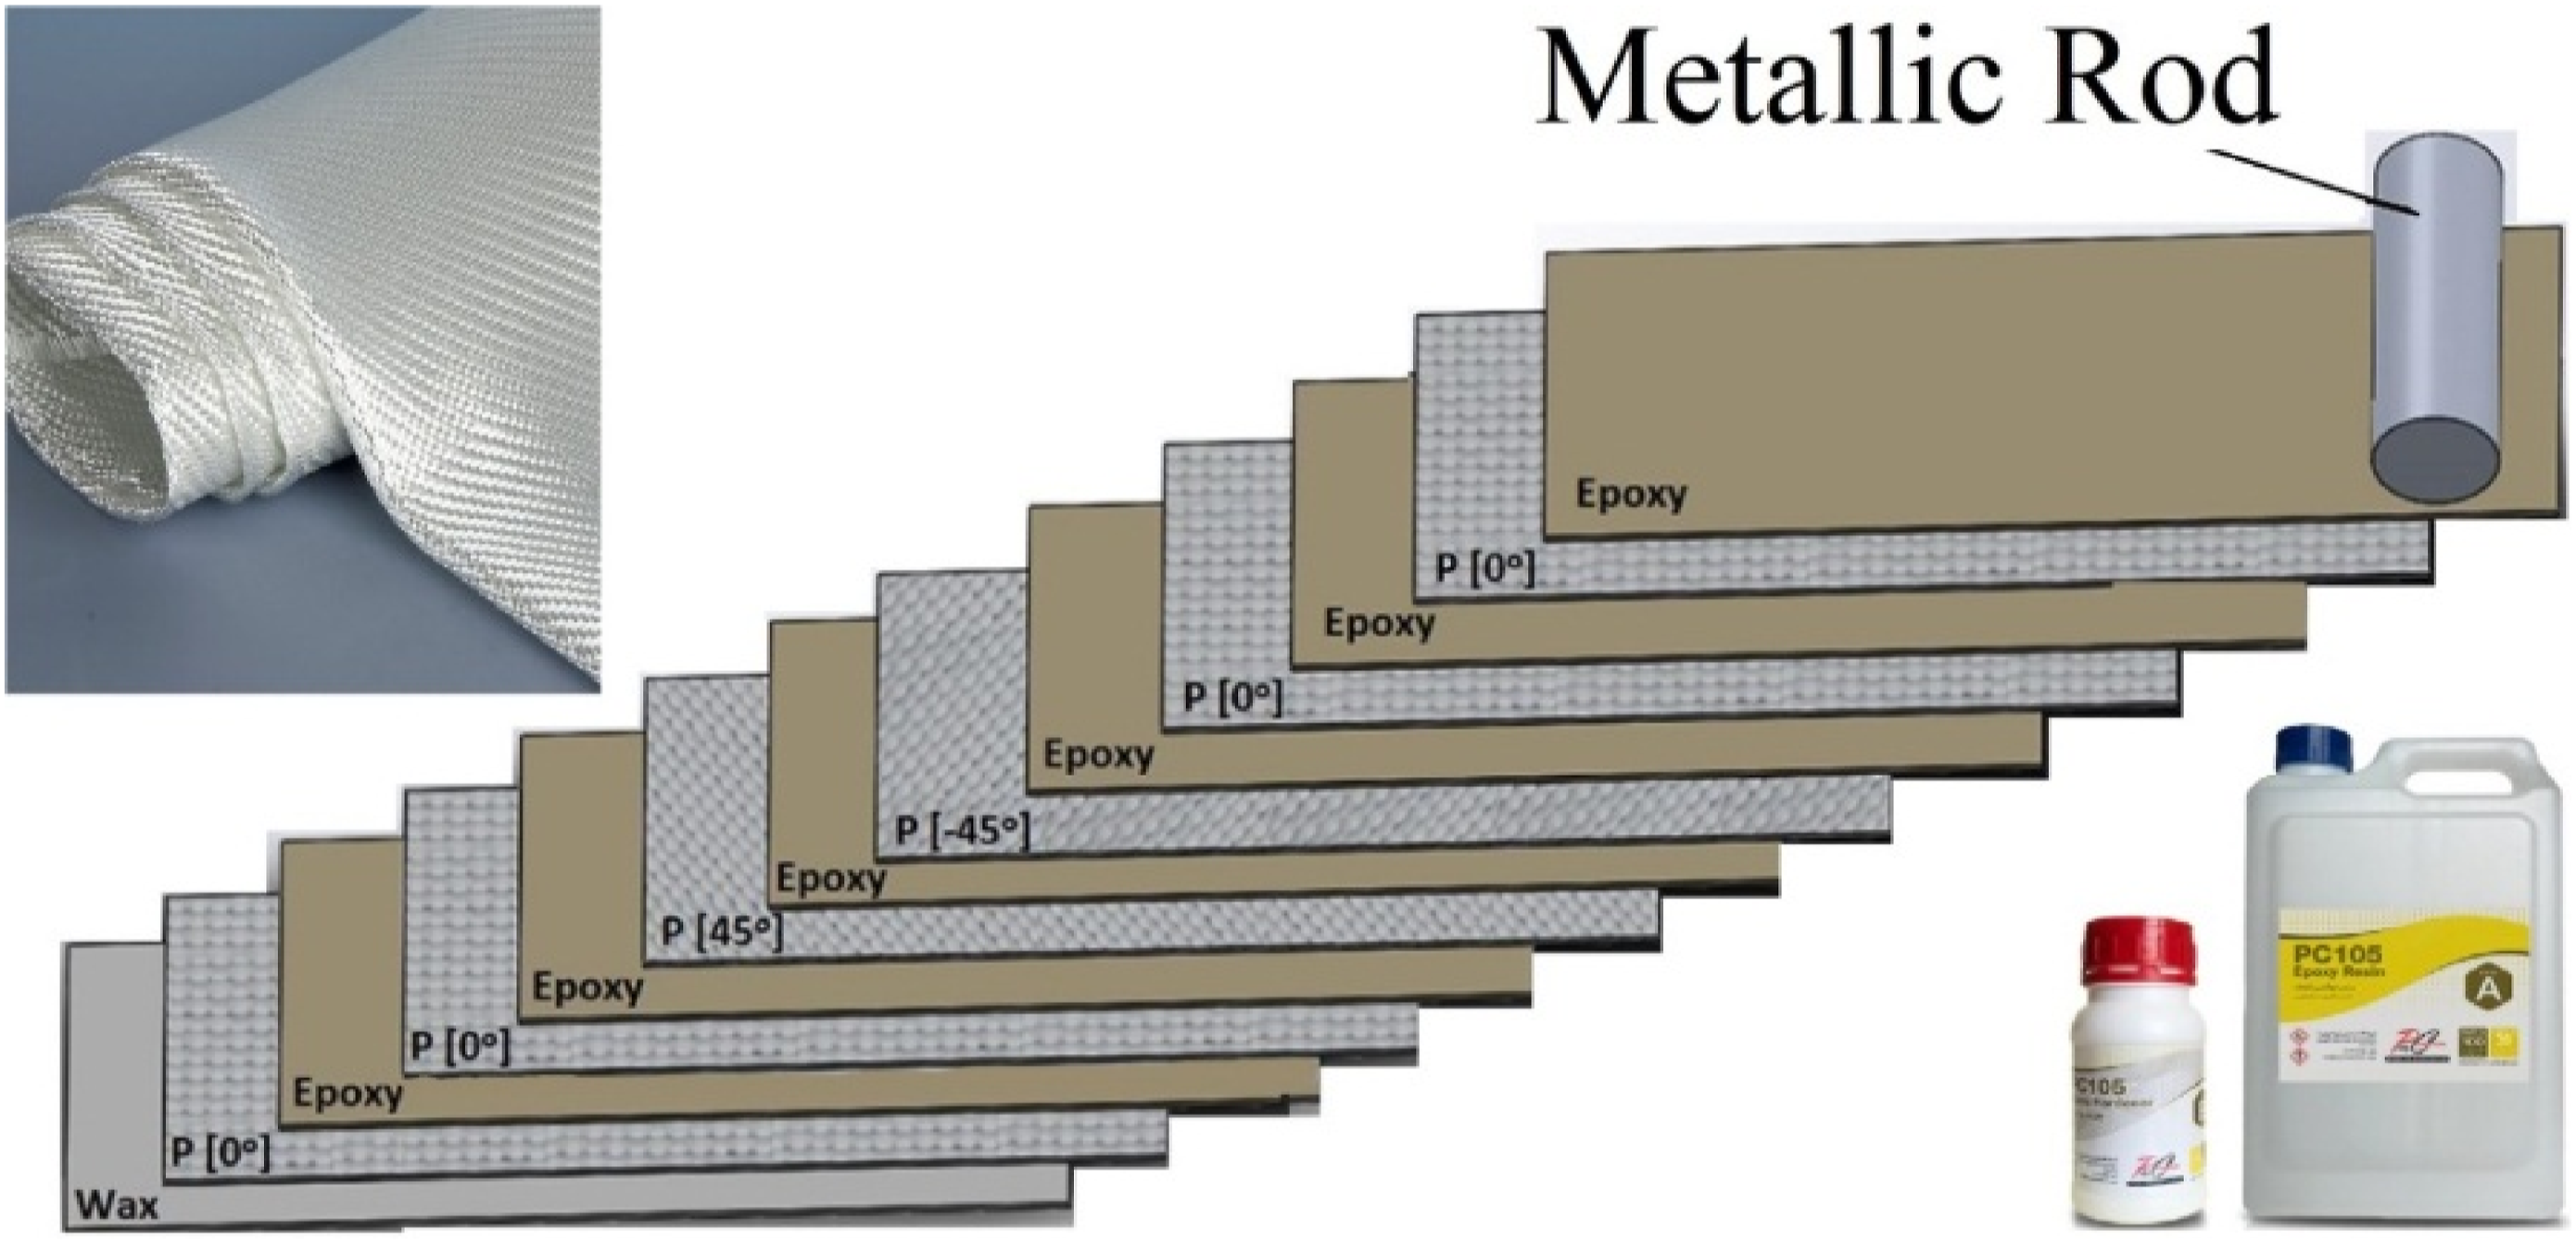
For metal face sheets, 3105 aluminum alloy with a thickness of 0.85 mm was used. Figure 3(a) shows the samples prepared for tensile tests and Figure 3(b) shows the true stress-strain curves for aluminum, composite, PLA and ABS samples. The tests were performed for aluminum samples according to ASTM E8 standard and for other materials according to ASTM D638. To ensure the reproducibility of the tests, 3 samples of each type were made. Experimental tests related to tensile testing were performed using a 5 ton SANTAM device. The loading speed of all samples was 2 mm/min. A: Tensile test specimens, B: True stress-strain curves for aluminum, composite, PLA and ABS specimens.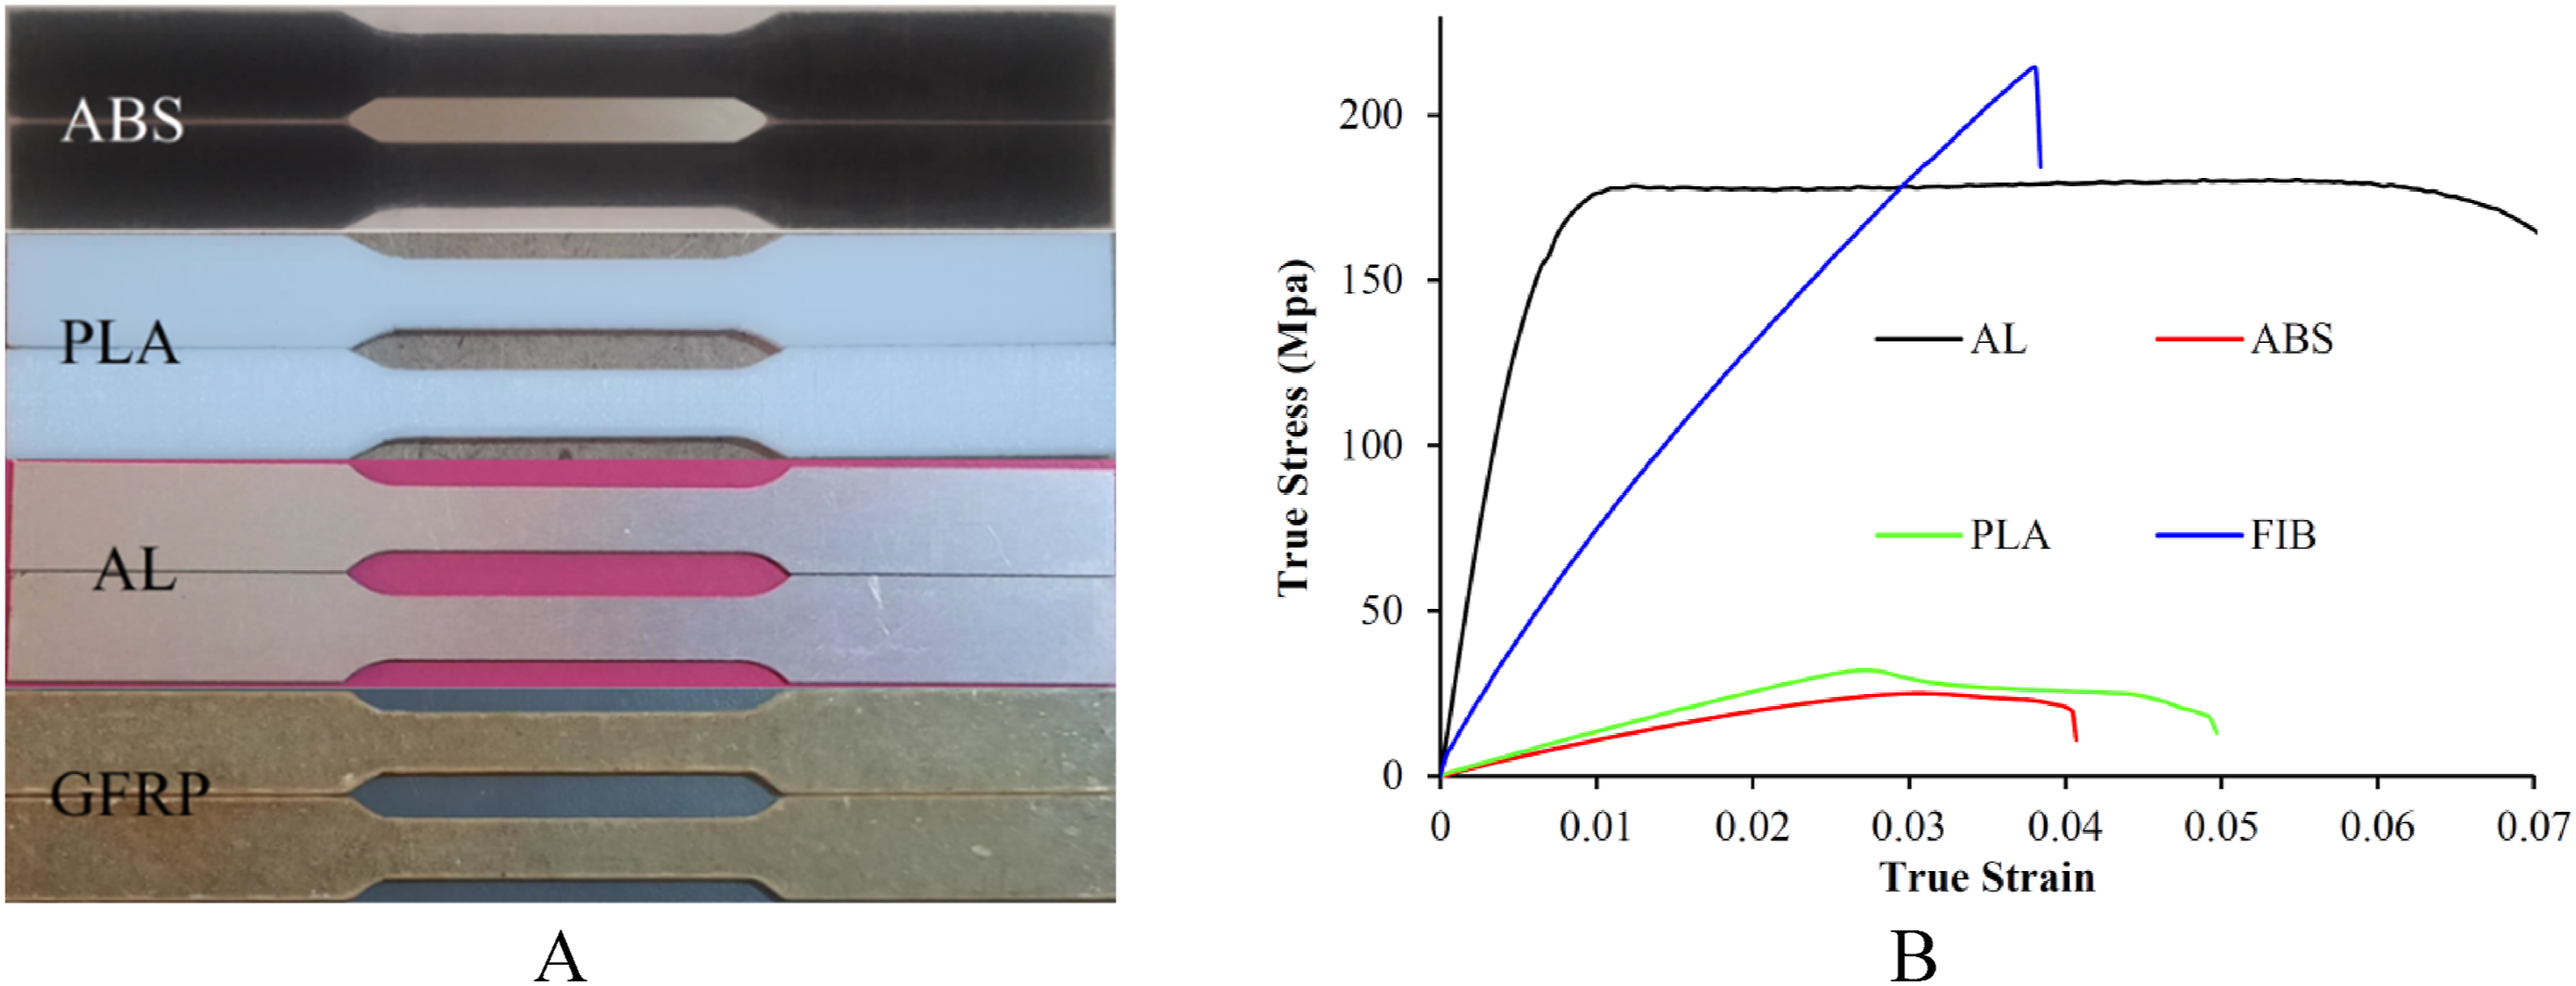
It should be noted that for extracting aluminum tensile test specimens (thickness: 0.85 mm) a wire cut machine, and for extracting composite tensile test specimens (thickness: 1.5 mm), a laser device was used. Polymer tensile test specimens (thickness: 2 mm) were made of ABS and PLA, with the specifications listed in Table 1 and printed with a Quantum Generous 3D printer.
Methods: Test and theory
Three-point bending tests on quasi-static loading were performed using a 15-ton SANTAM machine. The total length of all samples was 150 mm. The distance between the lower jaws was 120 mm and the radius of curvature of the edge of all jaws was 5 mm. Also, the bending load speed in all tests was 2 mm/min. For naming the sandwich samples of this research, a combination of letters and numbers were used. The first letter of each code represents the material used to make the core. The number shown in each code represents the geometry of the core (1 for a rectangular core, 2 for a trapezoidal core, and 3 for triangular core), and the final letter of each code indicates the type of layers used as the sandwich panel face sheet, which can be aluminum (A) or fiberglass composite (F). A total of 18 different sandwich panels were tested.
According to the force-displacement curves, parameters can be extracted that describe the behavior of sandwich panels well. These parameters include maximum force (Fmaximum or Fm), absorbed energy (EA), specific energy absorption (SEA), average force (Faverage or Fa) and crushing force efficiency. The maximum force is the maximum amount of force in the force-displacement curve, the energy absorbed means the final energy absorbed by the sample during the decay process (d) and is calculated by Equation (1). It is clear that the more energy absorbed, the higher the efficiency of the structure.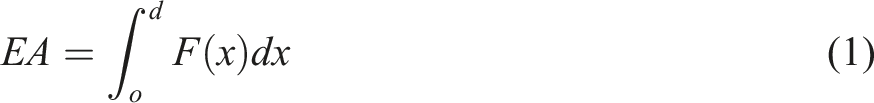
Specific energy absorption (SEA) is the amount of energy absorbed per unit mass of the structure, and the higher it is, samples with a higher strength-to-mass ratio are obtained. This parameter is calculated by Equation (2), in which m is the mass of the sandwich panel.
The parameters of average force and crushing force efficiency represent the mean force during the collapse process and the stability of the force in the force-displacement curve, respectively. These parameters are defined by Equations (3) and (4), respectively.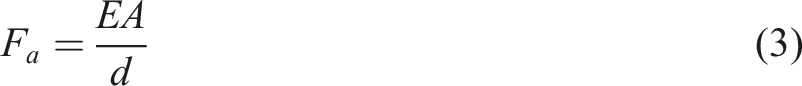

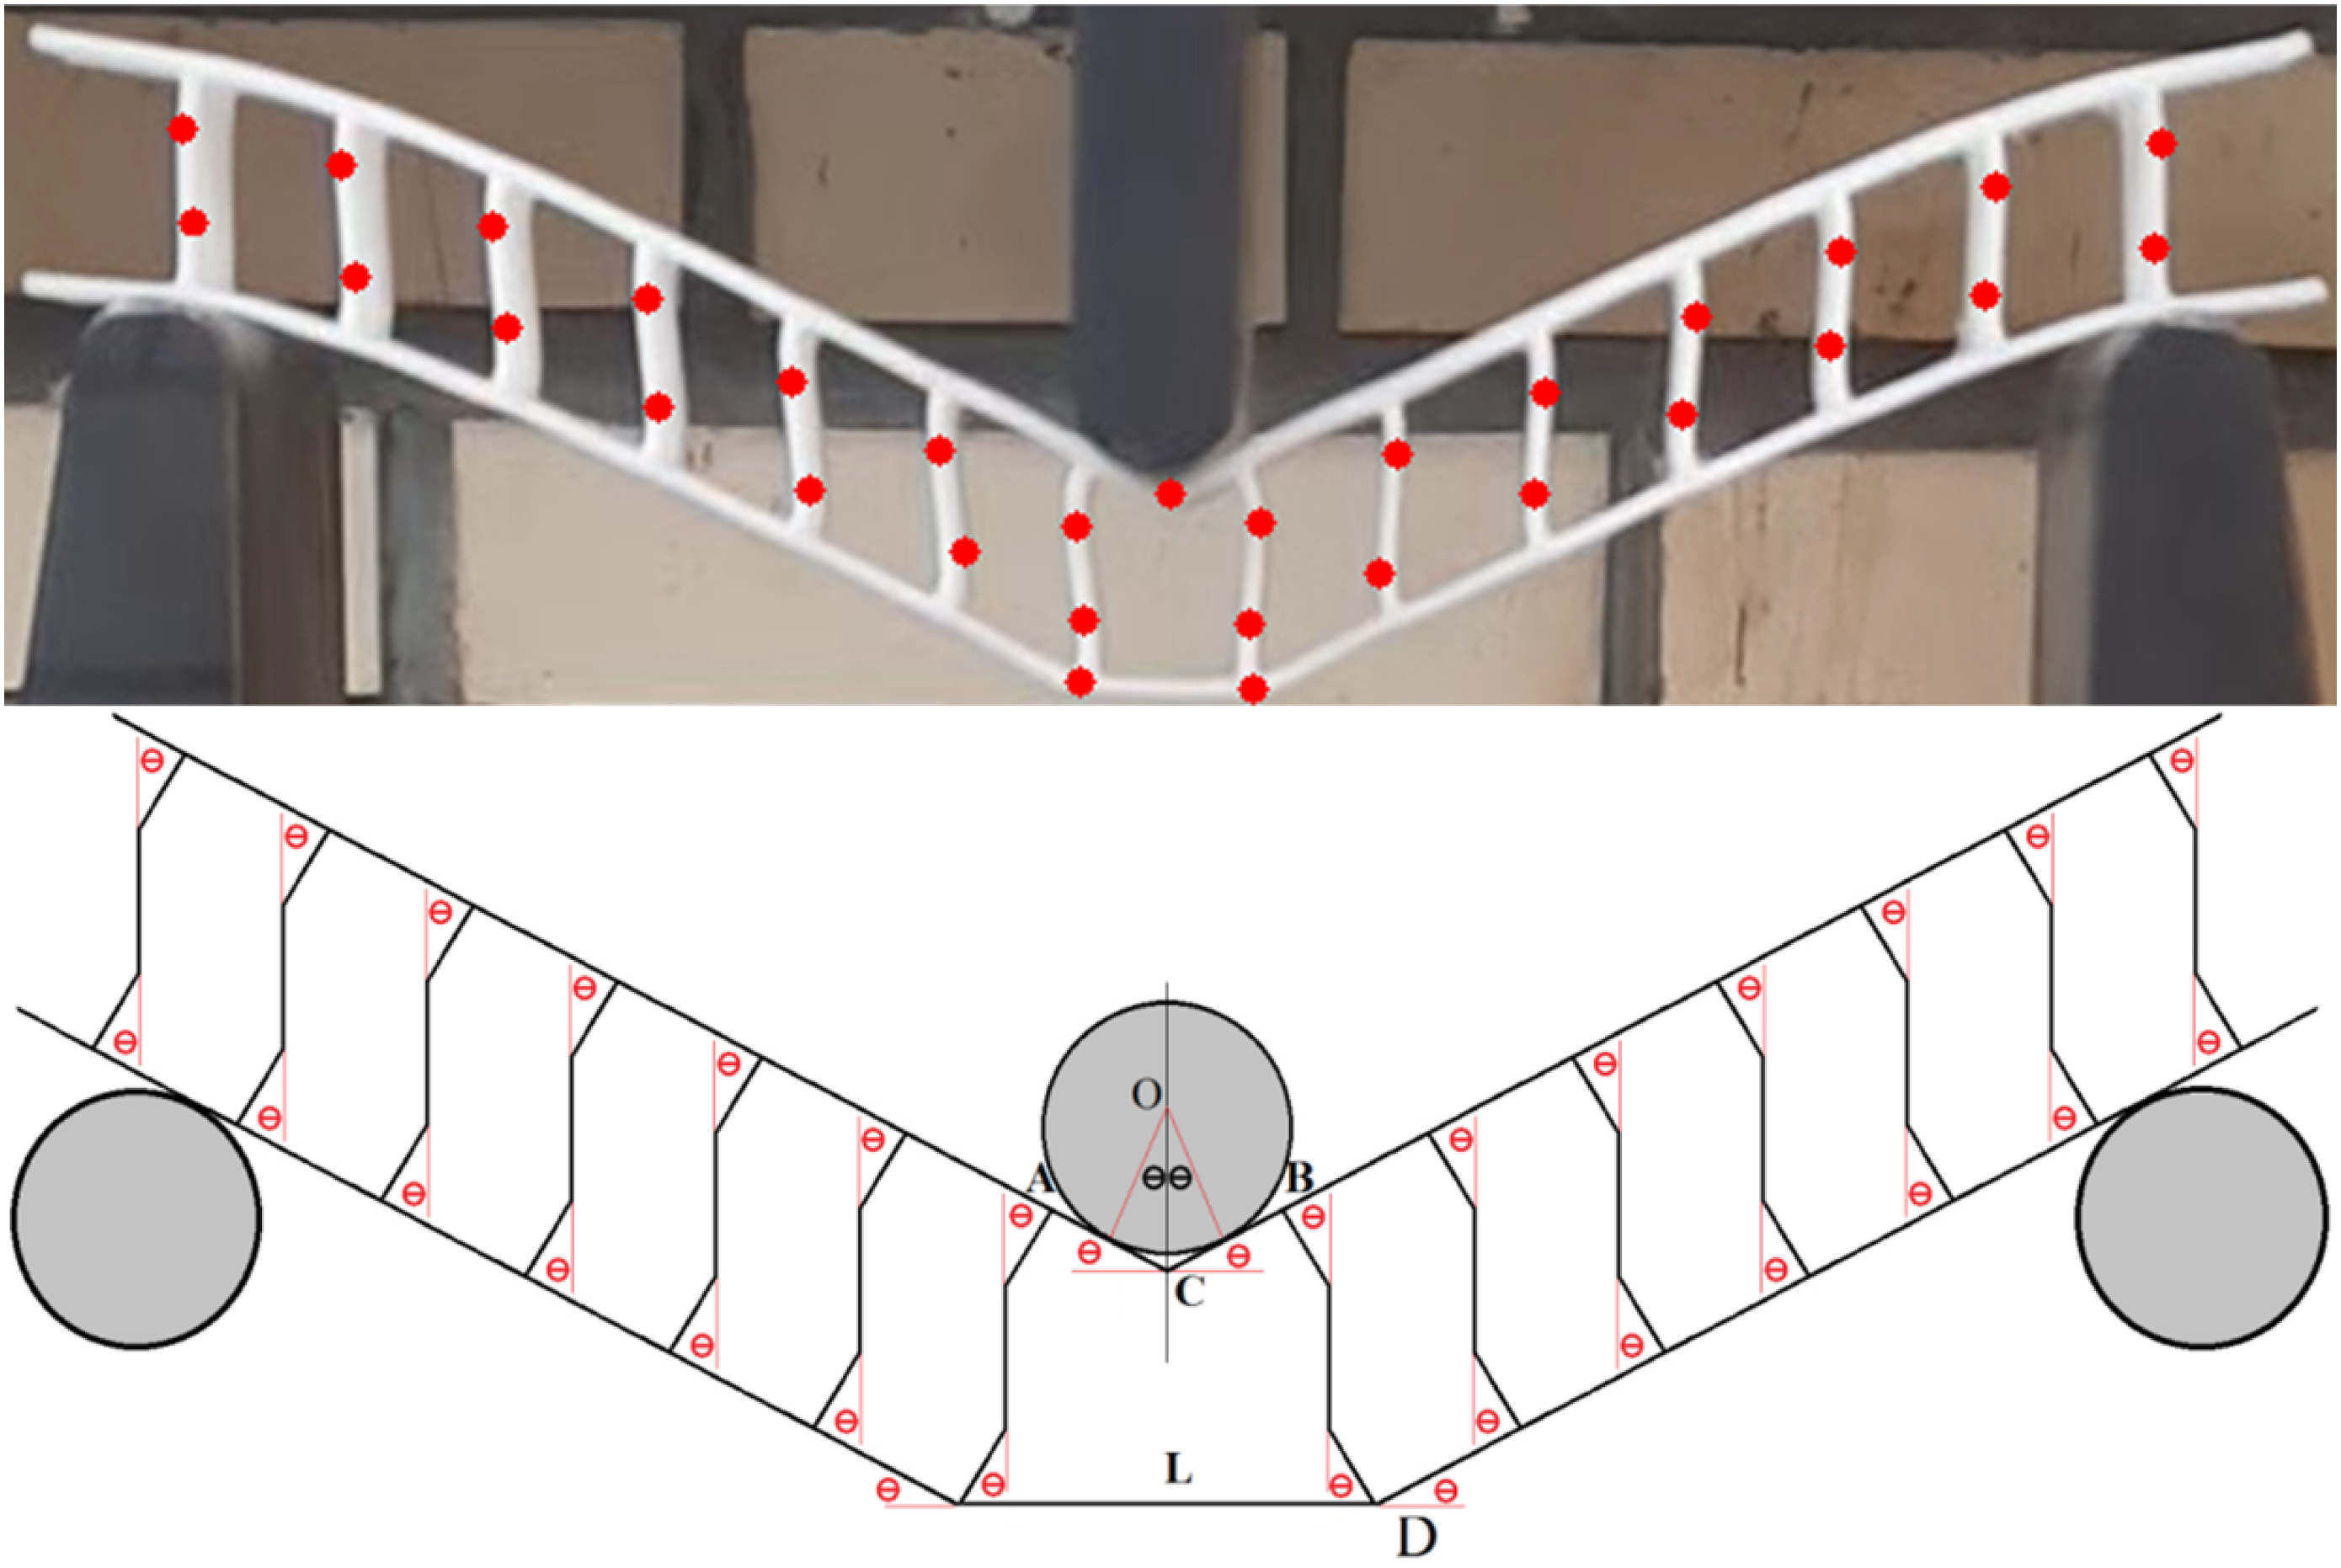
In this research, panels with rectangular cores made of PLA and ABS are theoretically examined. The force-displacement curves of these specimens consist of two parts, elastic and plastic. In the elastic part, according to the method presented in the source,
26
it is assumed that most of the deformations are localized, and therefore the bending of the beam in this part can be similar to the bending of a beam with a simple support. The relationship between the force of F
l
and the displacement of the indenter (δ) in the linear (elastic) part is obtained using Equation (5). In this regard, E is the Young’s modulus, L
0
is the length between the walls, as shown in Figure 4(a), and I
f
is the second bending moment for the surface.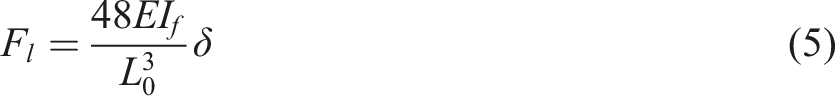
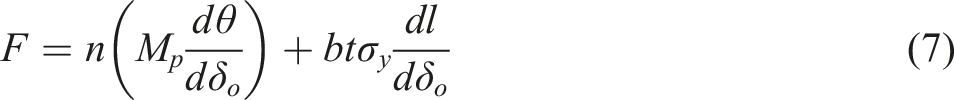
The energy method was used in the study of the implemented theory of plastic deformations. In this method, due to the fact that the panels are simply placed on the lower jaws, they can move freely, so the energy applied by the indenter, after creating elastic deformations, is spent on creating plastic hinges and the tension caused by the tensile stress in the lower part of the middle cell in the sandwich panel. Figure 4(b) shows all the hinges involved and the parts that undergo plastic strain. The proposed model is based on observations recorded in experimental tests. According to Figure 4(b), two plastic hinges are formed in each wall of the core and also in the middle cell, a plastic hinge is formed in the upper part and the lower face sheet is stretched. Therefore, it can be said that the penetrating energy is spent on creating plastic hinges in the core walls and stretching in the lower part of the middle cell. The energy balance can be expressed as Equation (6), the letter n in the first part of Equation (6) represents the number of plastic hinges formed in a beam with the schematic shown in Figure 4(b). The thickness and width of all the core parts of the examined sandwich panel are constant and equal to t. M
P
represents fully plastic bending moment for a wall in which bending has occurred. The second part of Equation (6) represents the energy distributed in the horizontal wall with an initial length of L
0
, V is the volume of this part, and σ and ɛ represent the true stresses and strains, respectively. A: Simplified model for investigating the bending of sandwich panels in the elastic deformations, B: Theoretical model presented for sandwich panels with rectangular core under three-point bending and C: The approximation for calculating the line segment length x.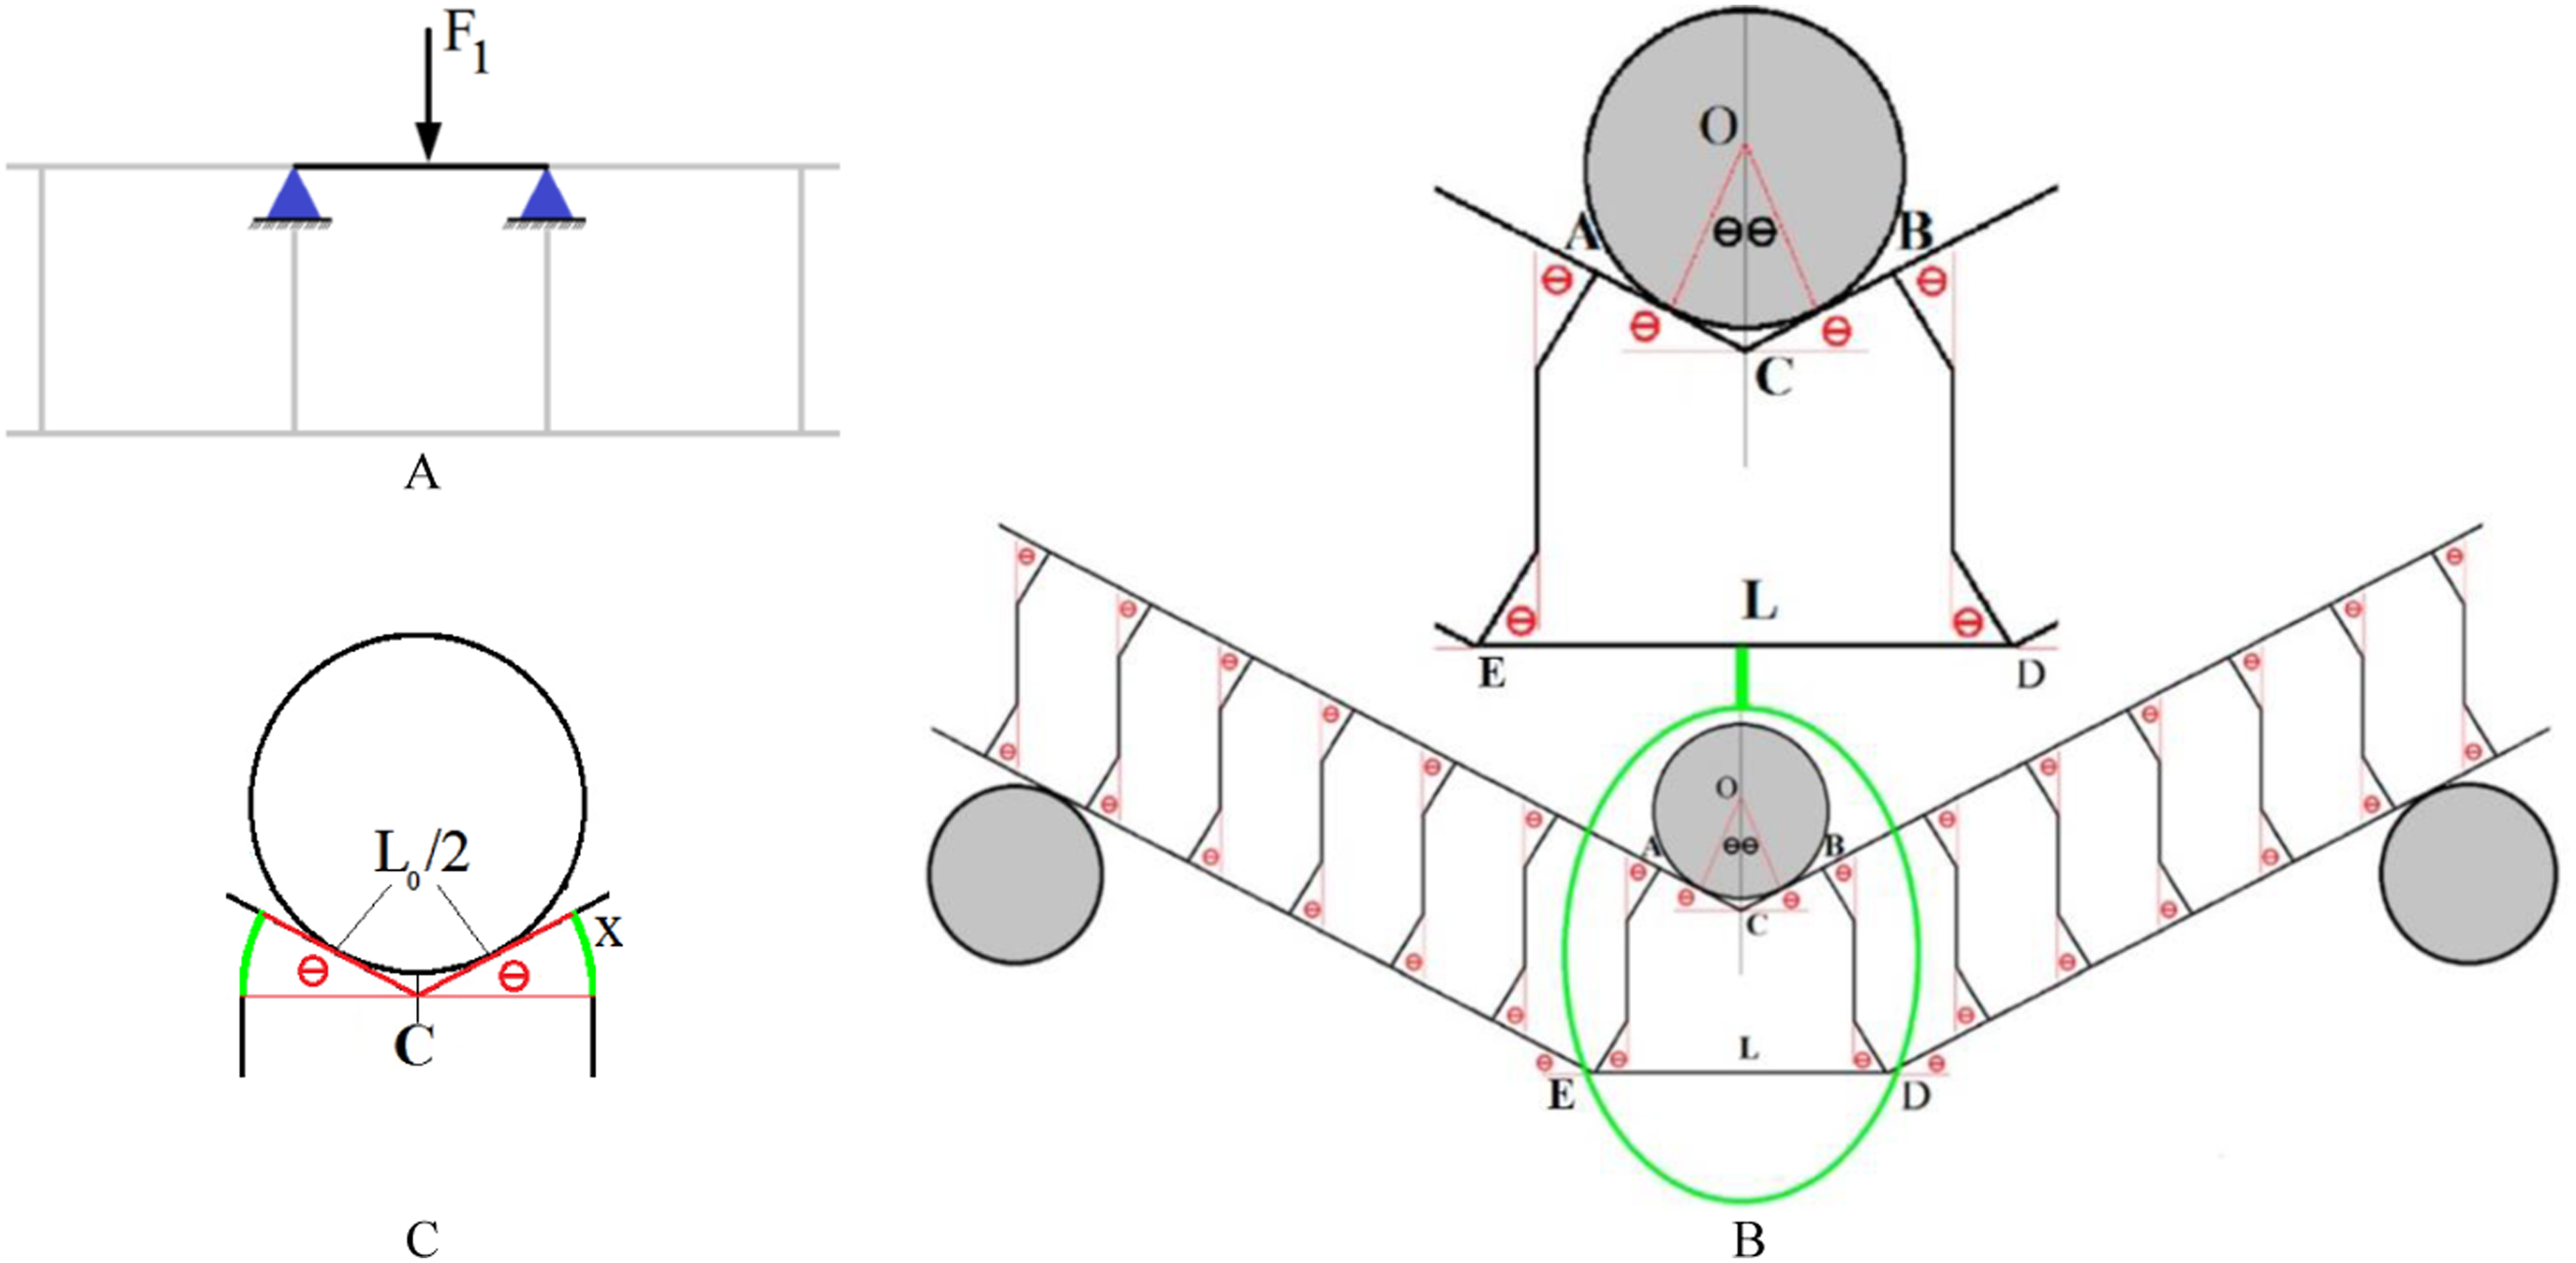
It should be noted that it is assumed that the stress-strain curve of the material is completely elastic-plastic. Given that the initial length, thickness, and width of the ED line segment are L
0
, b, and t, Equation (6) can be rewritten as Equation (7).
θ can be calculated from Equation (8), and δ
D
, which is the displacement rate of point D in Figure 4(b), is calculated from Equation (9) in terms of the penetration displacement (δ
o
). In this equation r is the radius of the penetrating curvature and h
c
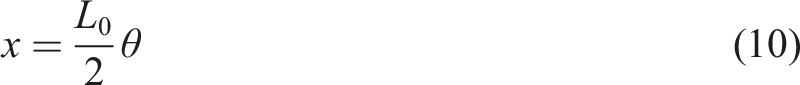
is the initial height of the wall. The letter x in Equation (9) represents the length of the wall that bends, this length varies with the advancement of the indenter. The changes of x in terms of θ can be written in Equation (10). In the case of Equation (10), Figure 4(c), which shows the relationship between x and θ, shows that x can approximately be considered as the length of the line segment BD, which is a part of the circumference of a circle with center C and radius of L
0
/2. Considering the changes in the length of the DE line segment, the geometry shown in Figure 4(b) can be used and L can be written as a Equation (11).


Results and discussion
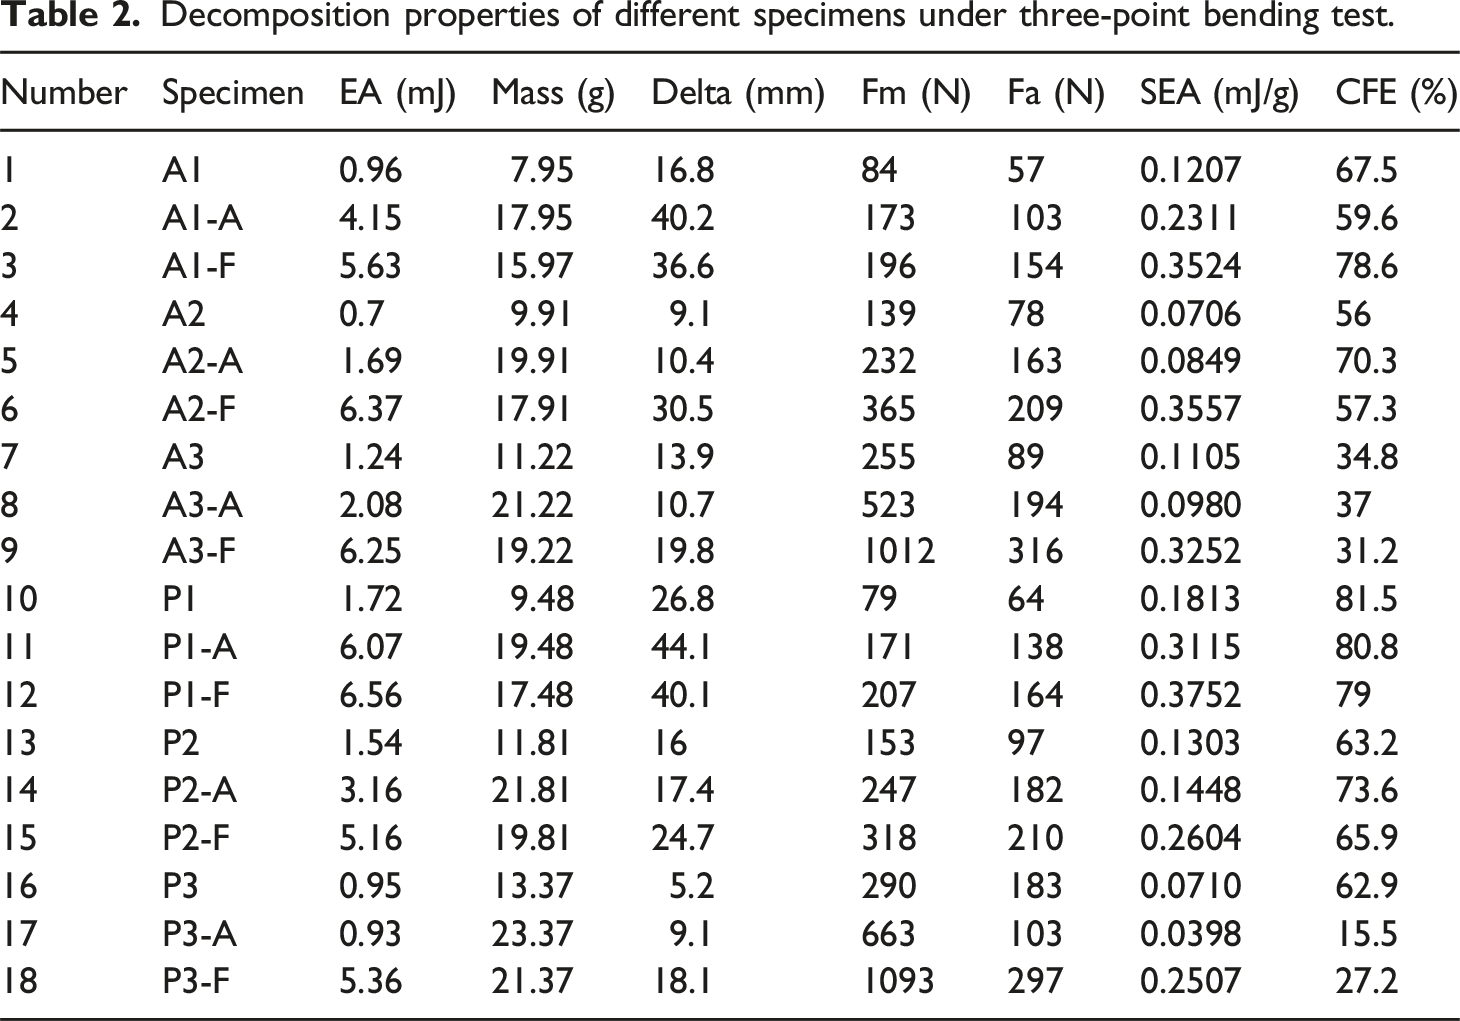
Decomposition properties of different specimens under three-point bending test.
Review of force-displacement diagrams
In this section, force-displacement diagrams for three-point bending tests are investigated. Figure 5 shows the diagrams extracted from the 15-ton SANTAM machine. According to the diagrams in Figure 5, it is clear that the highest resistance to deformation was related to samples with a triangular core. In other words, these specimens had the highest maximum force, but as shown in the diagrams, specimens with a triangular core were more brittle than other specimens, and the force of penetration of the jaw exerts the minimum force possible. Force-displacement diagrams of the specimens under the three-point bending test.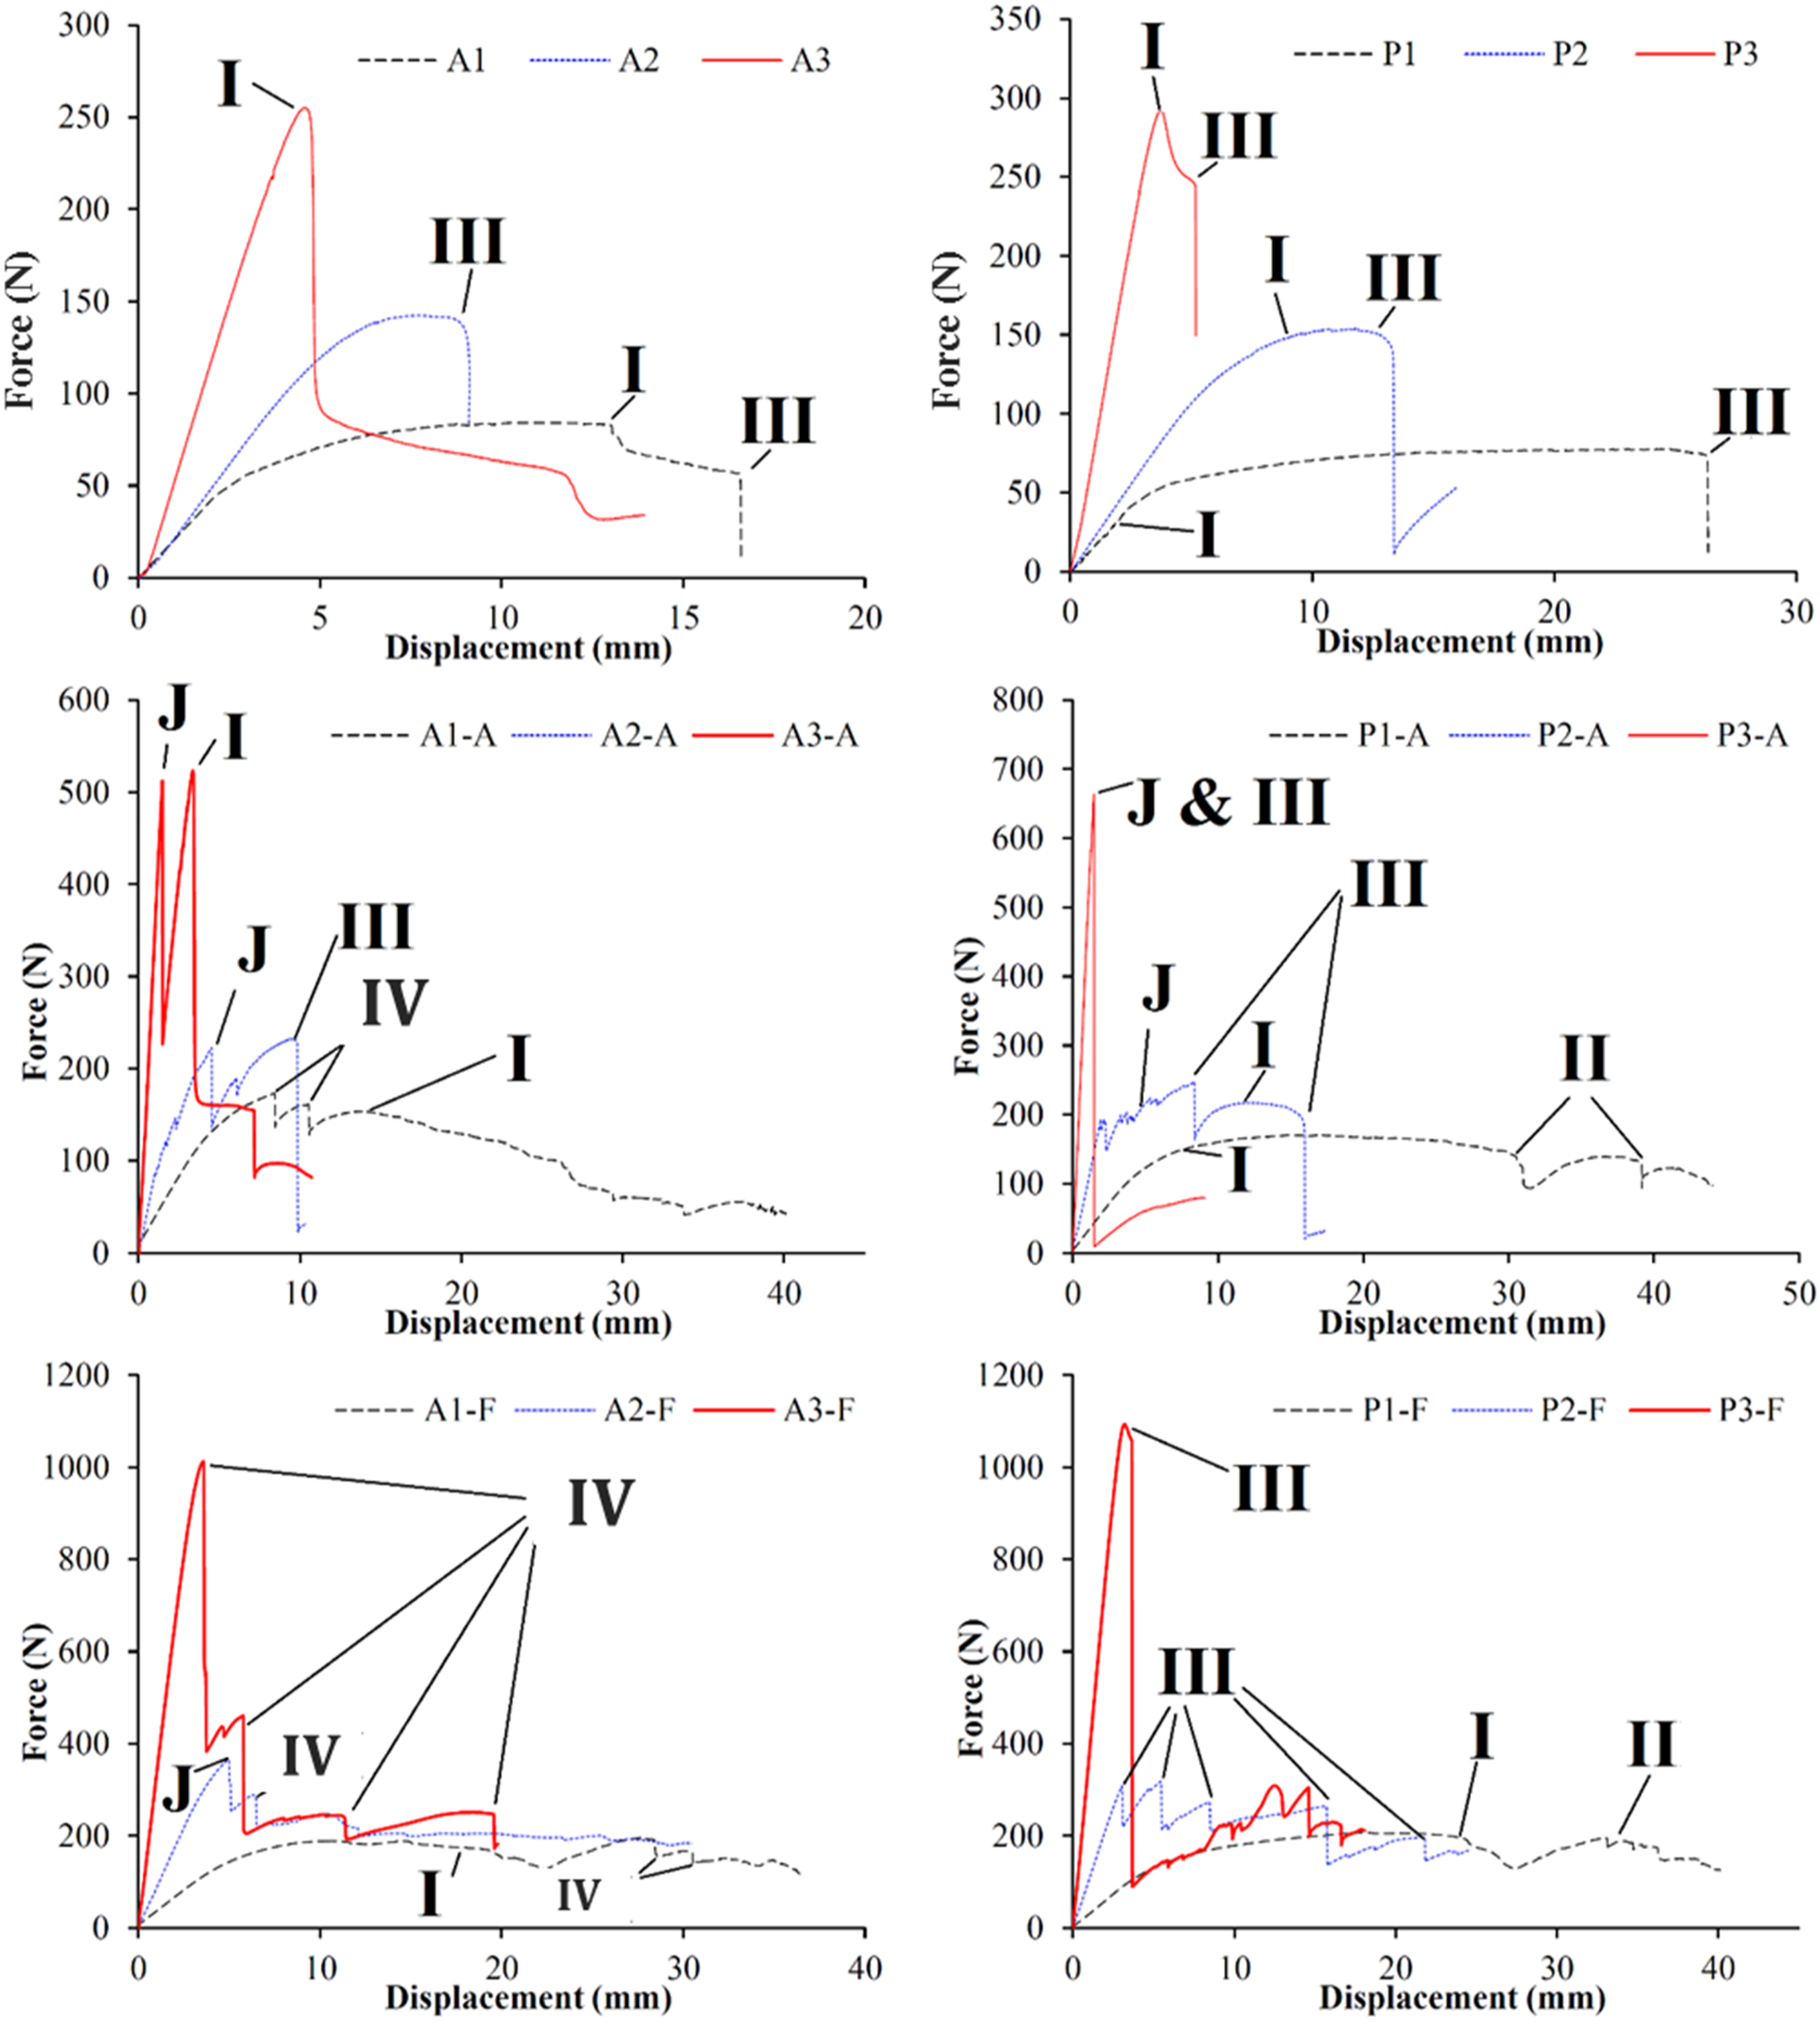
According to the diagrams in Figure 5, abrupt changes were observed in the force-displacement diagrams, these changes indicate sudden ruptures in the bent specimen. These changes correspond to the occurrence of collapse in one of the parts of the sandwich panel, which can appear in four patterns: 1- general bending 2- wall bending 3- general fracture and 4- wall fracture.
In the diagrams of Figure 5, all four patterns: 1- global bending 2- wall buckling 3- global fracture and 4- wall fracture are presented with the symbols I, II, III and IV, respectively, and the rupture between the core and the face sheet of the sandwich panels, which is a result of shear stress, is indicated by the letter J.
Figure 6 shows the collapsed state of all tested specimens. According to this figure, it is clear that the collapse pattern of P1, P1-A and P1-F samples is global bending. As the diagrams for these specimens show, the collapse length of these specimens is longer than that of other specimens. In the case of fracture patterns, attention to the diagrams shows that the fractures that occur in each specimen correspond to a sudden drop in the force-displacement diagram. Figure 6 (P2-A, P3-A, P3-F) indicates that shear stress -which arises from the relative sliding or displacement between the core and sheets, particularly under bending loads- can concentrate at the interface between the core and sheets, especially in regions of geometric discontinuity or material mismatch. The adhesive layer between the core and sheets is particularly susceptible to shear stress. If the adhesive’s shear strength is exceeded, debonding can occur within the adhesive layer or at the adhesive-substrate interface. Collapse of all specimens tested under the three-point bending test.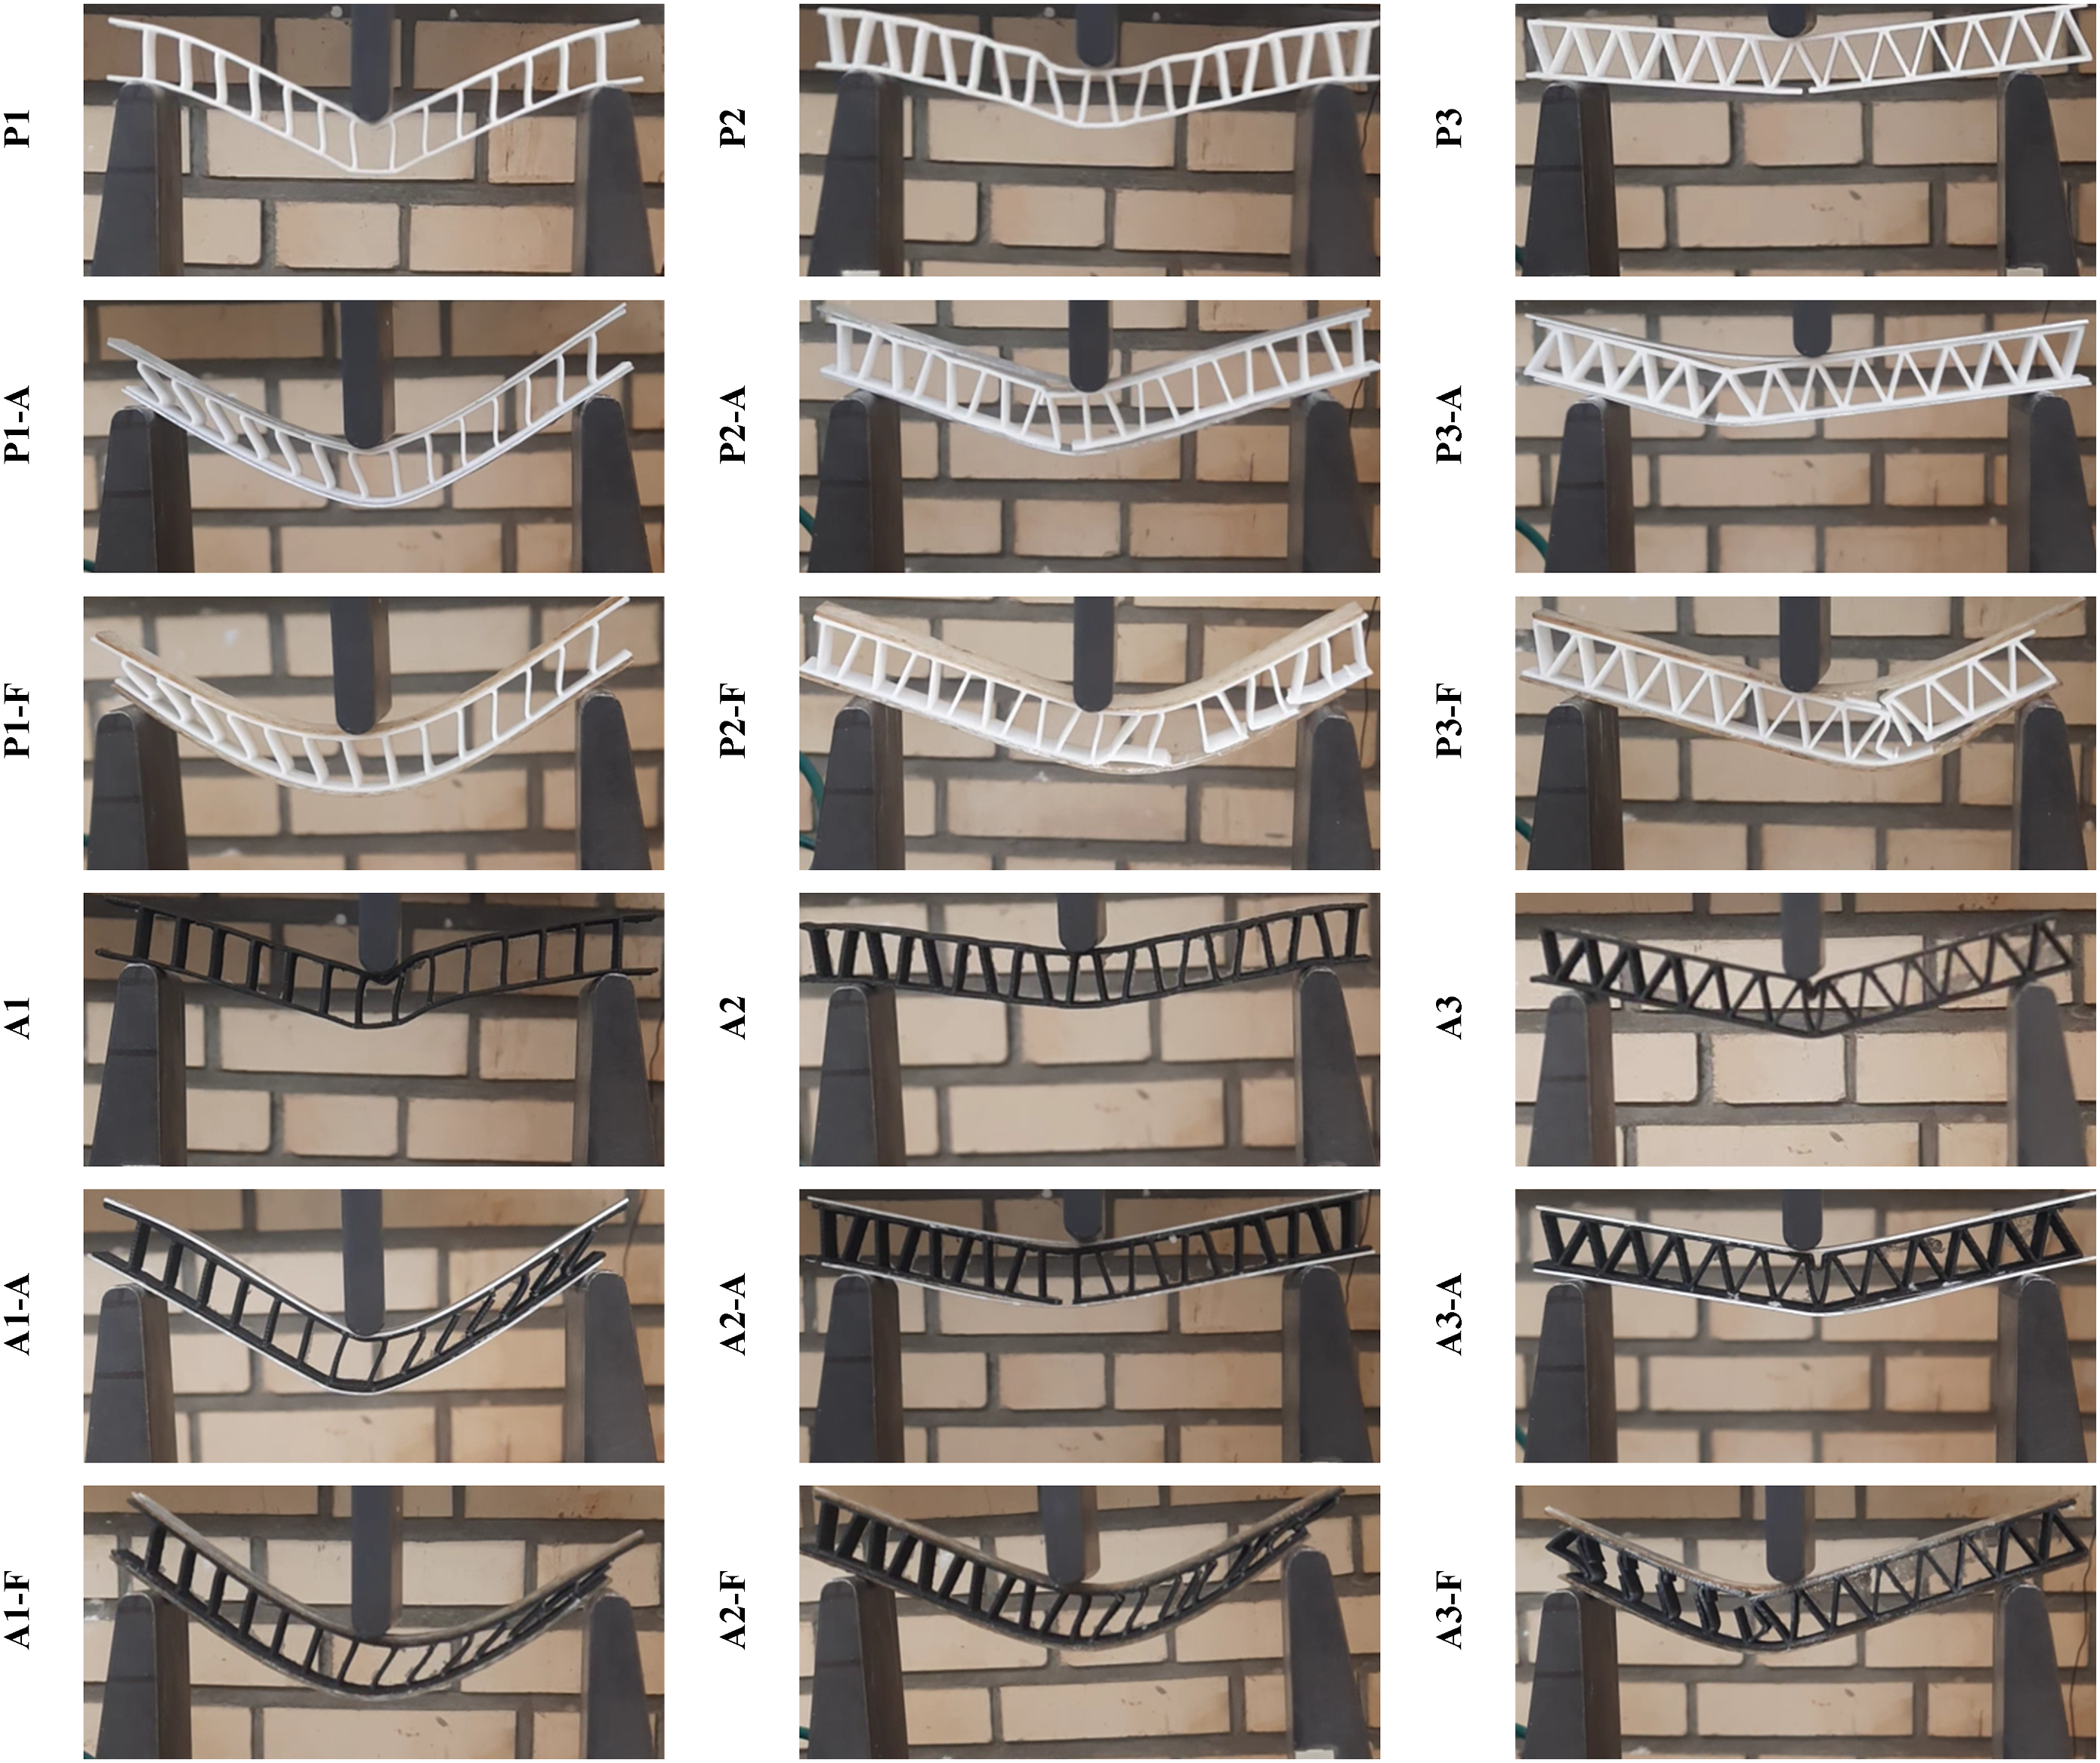
Comparison of collapse characteristics of sandwich panels in terms of constituent material
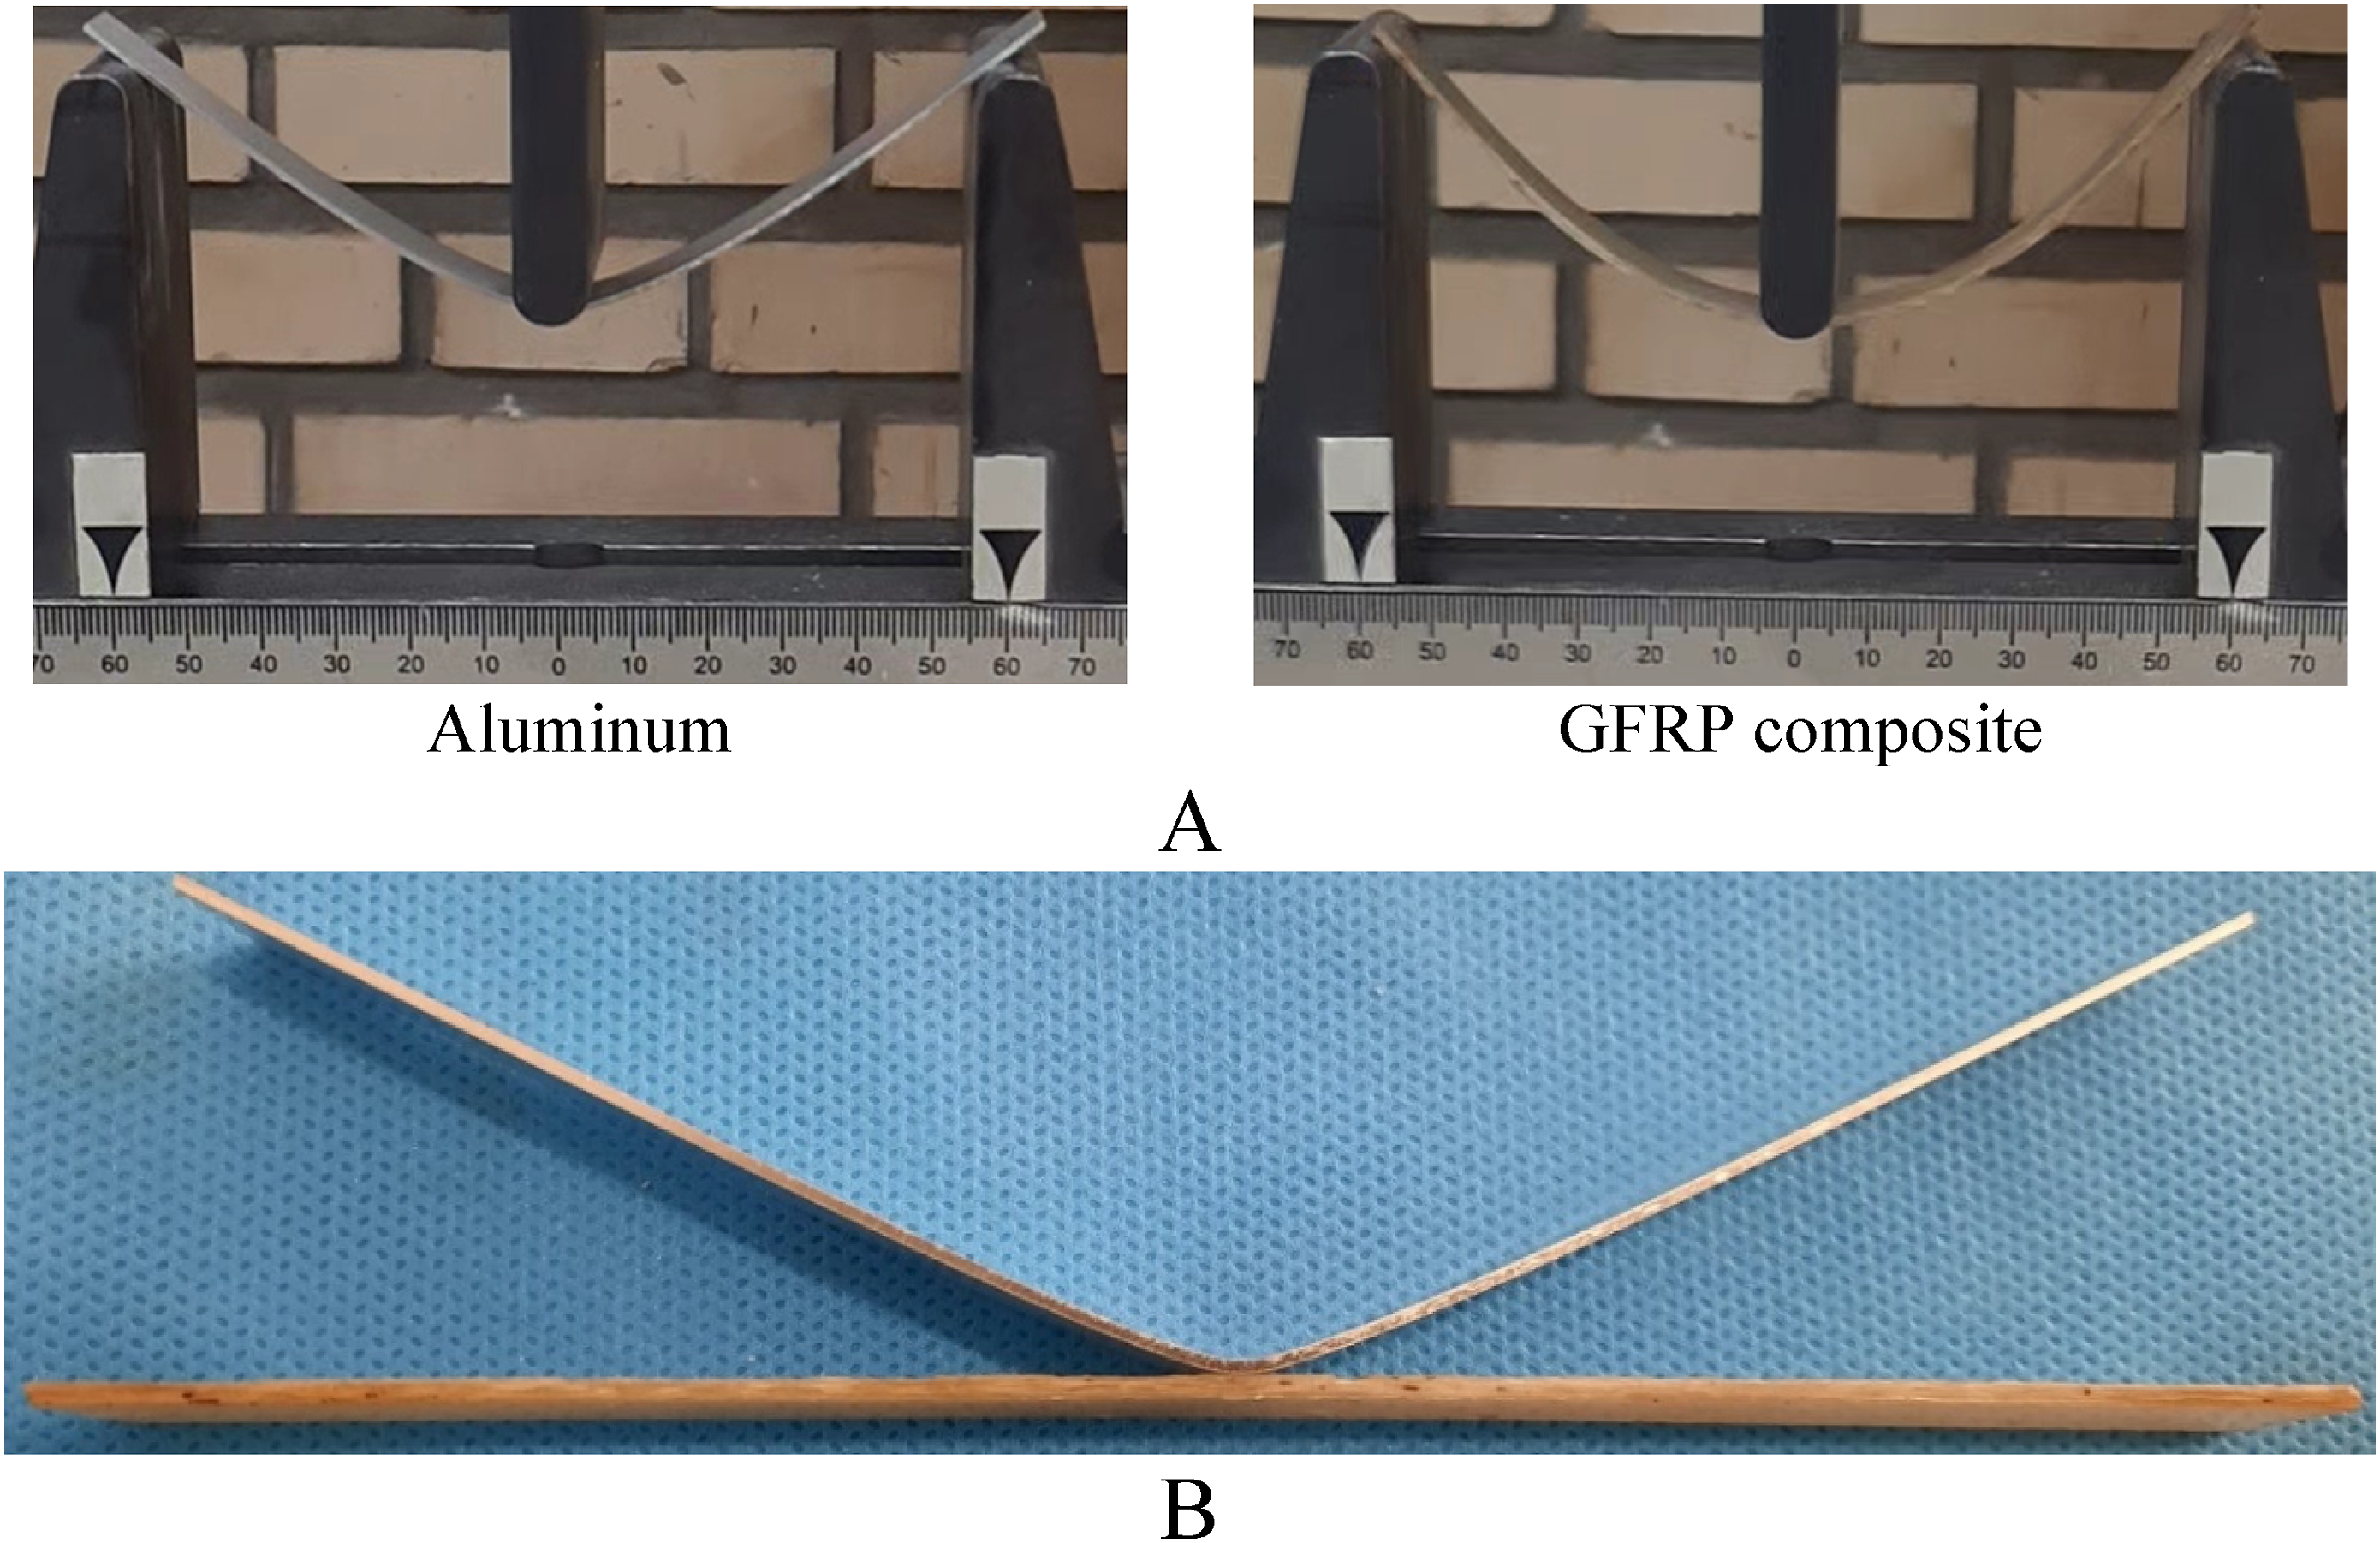
Figure 7 compares the collapse characteristics presented in Table 2 in the form of a diagram. Some of the main features of the diagrams are discussed below. According to Figure 7(a), the main feature is that the use of composite face sheets significantly increases energy absorption. Regarding this increase in energy absorption, it can be noted that the composite face sheets showed a very high resistance to bending compared to the aluminum face sheets, so that none of the composite face sheets sustained fractures. In order to further investigate this issue, the two aluminum and composite face sheets were subjected to three-point bending and their force-displacement curves were extracted. The extracted curves are shown in Figure 7(d). As can be seen, the composite face sheet made of glass fibers has a higher strength compared to the aluminum face sheet. However, after loading both aluminum and composite samples, the composite sample returned to its original state and no plastic deformation remained in them. In all the sandwich panels of this study, the composite face sheets returned to their original state. Figure 8(a) shows the composite and aluminum face sheets during the bending process and Figure 8(b) shows the face sheets after the three-point bending test. A_C Comparison of collapse characteristics of sandwich panels from Table 2, D: Comparison of force-displacement curve of composite and aluminum face sheets. (a): Energy Absorption. (b): Average Force. (c): Maximum Force. (d): Force-Displacement. (a): Composite and aluminum face sheets during the bending process (b): Composite and aluminum face sheets after the process.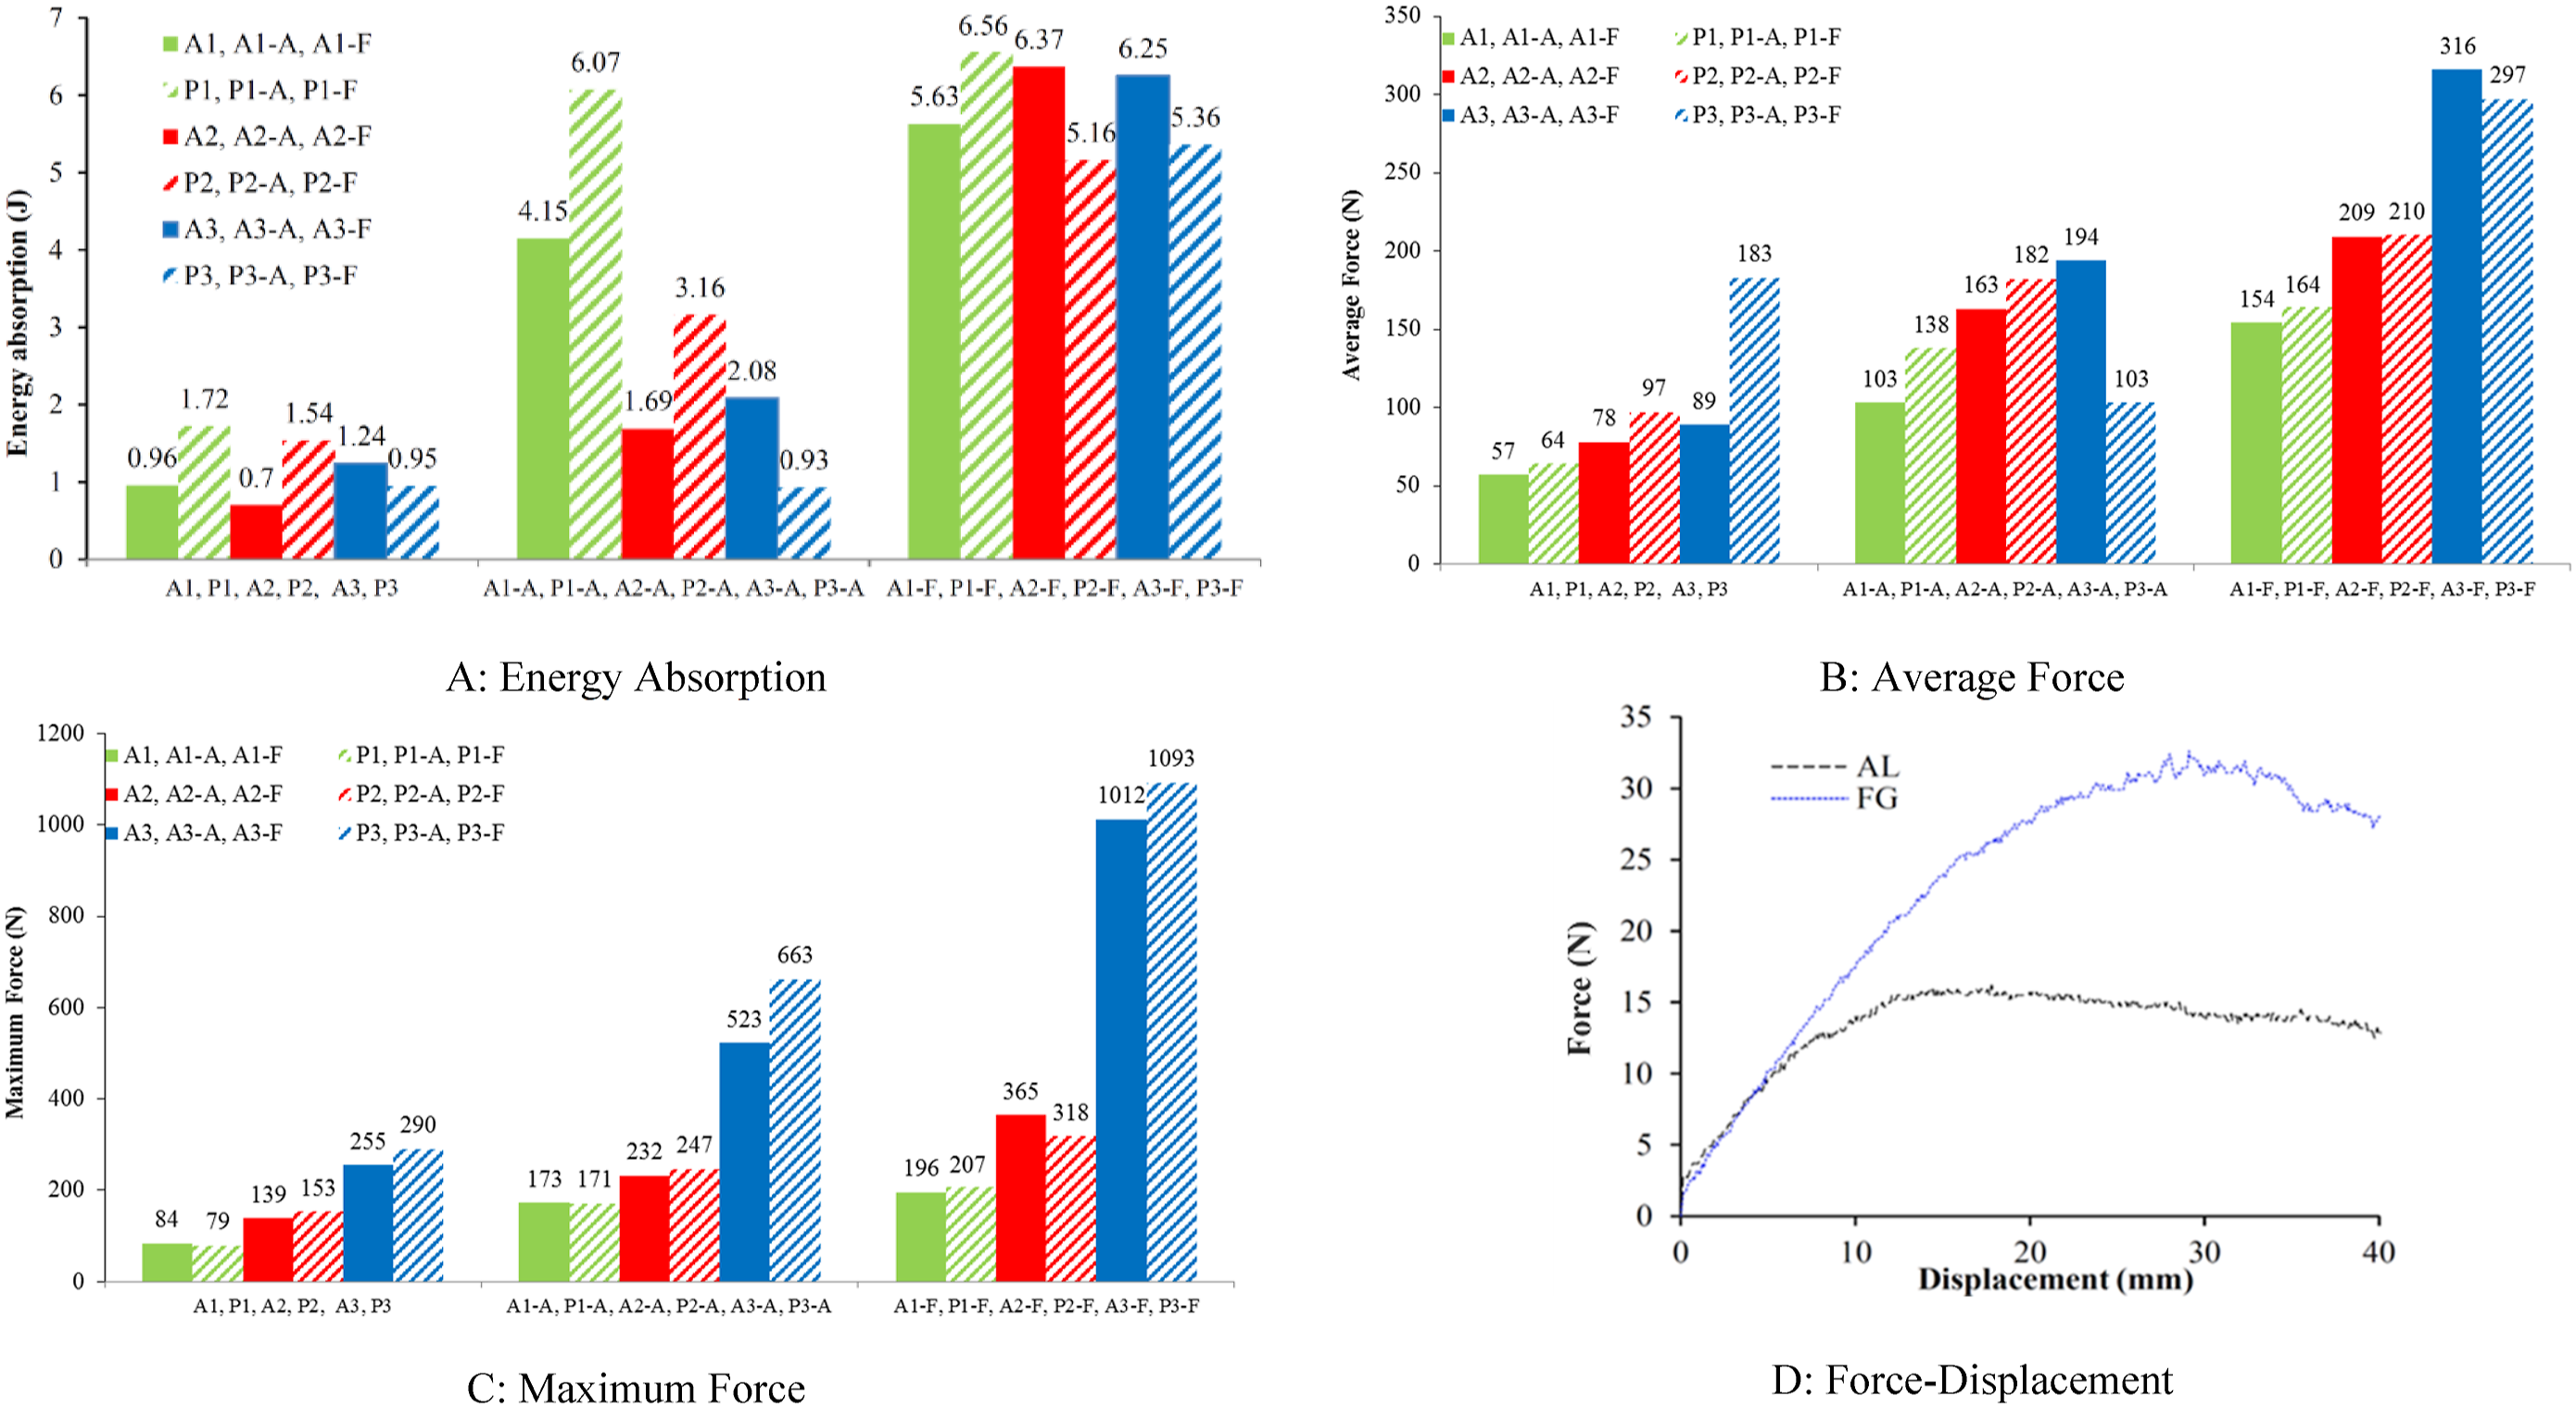
According to Figure 7(a) models with PLA cores generally have higher energy absorption compared to ABS cores. More precisely, the energy absorption of PLA cores in rectangular and trapezoidal geometries is higher than in ABS models, but less for triangular geometries. Regarding the higher energy absorption of PLA specimens, it can be pointed out that these specimens have a longer decay length and consequently have a wider area under the curve and therefore absorb more energy. In the case of specimens with a triangular core, since the location of the maximum bending moment is exactly at the intersection of the three walls, it can be said that in this part, the specimen is stronger than other points and therefore collapses in weak areas in which there is a high bending moment. Figure 8 shows the collapsed state of the A3, A3-A and A3-F specimens. As can be seen from this figure, none of the specimens are bent in the middle. Compared to sample P3, it is evident that sample P3-A’s energy absorption has not changed significantly. It should be noted in its explanation that, in contrast to the P3, the area under the force-displacement diagram (as shown in Figure 5) was nearly constant in the P3-A even with the addition of the aluminum layer. The debonding for the P3-A is the cause, as Figure 6 also makes evident. Indeed, for small displacements, the P3-A showed a sharpie growth in the force parameter before experiencing an abrupt drop in force.
Considering Figure 7 in terms of maximum strength shows that in general, by adding aluminum and composite face sheets to different cores, the maximum force increases, and among these, composite face sheets have the greatest effect on increasing the maximum force. Among the various geometries, it can be seen that the maximum force of a PLA sample is higher. This was due to the higher yield stress of PLA compared to ABS.
With a closer look at Figure 7 average force diagrams, it can be seen that in the samples with triangular geometry the average force of the sample with ABS core and aluminum and composite face sheets is more than similar samples with PLA cores, but without the presence of the face sheets, the average force of the PLA core with 183 N is 106% higher than the average force of the ABS core with 89 N. Regarding this different behavior, it can be said that the addition of aluminum and composite face sheets has a significant effect on the average force. In relation to the changes in the maximum force shown in Figure 7(c), it can be seen that the maximum force of PLA core panels is generally higher than that of ABS core panels. However, in the case of the A2-F and P2-F models, it can be seen that the maximum force of the P2-F model is less than that of the A2-F model. To justify this, it is necessary to pay attention to the diagrams in Figure 7(a) for these two examples. As can be seen in this diagram, the energy absorption of the P2-F sample is less than that of the A2-F sample, which reduces the average force in the P2-F sample. Figure 9 shows the force-displacement curves of both samples together. Comparison of force-displacement curve in samples A2-F and P2-F.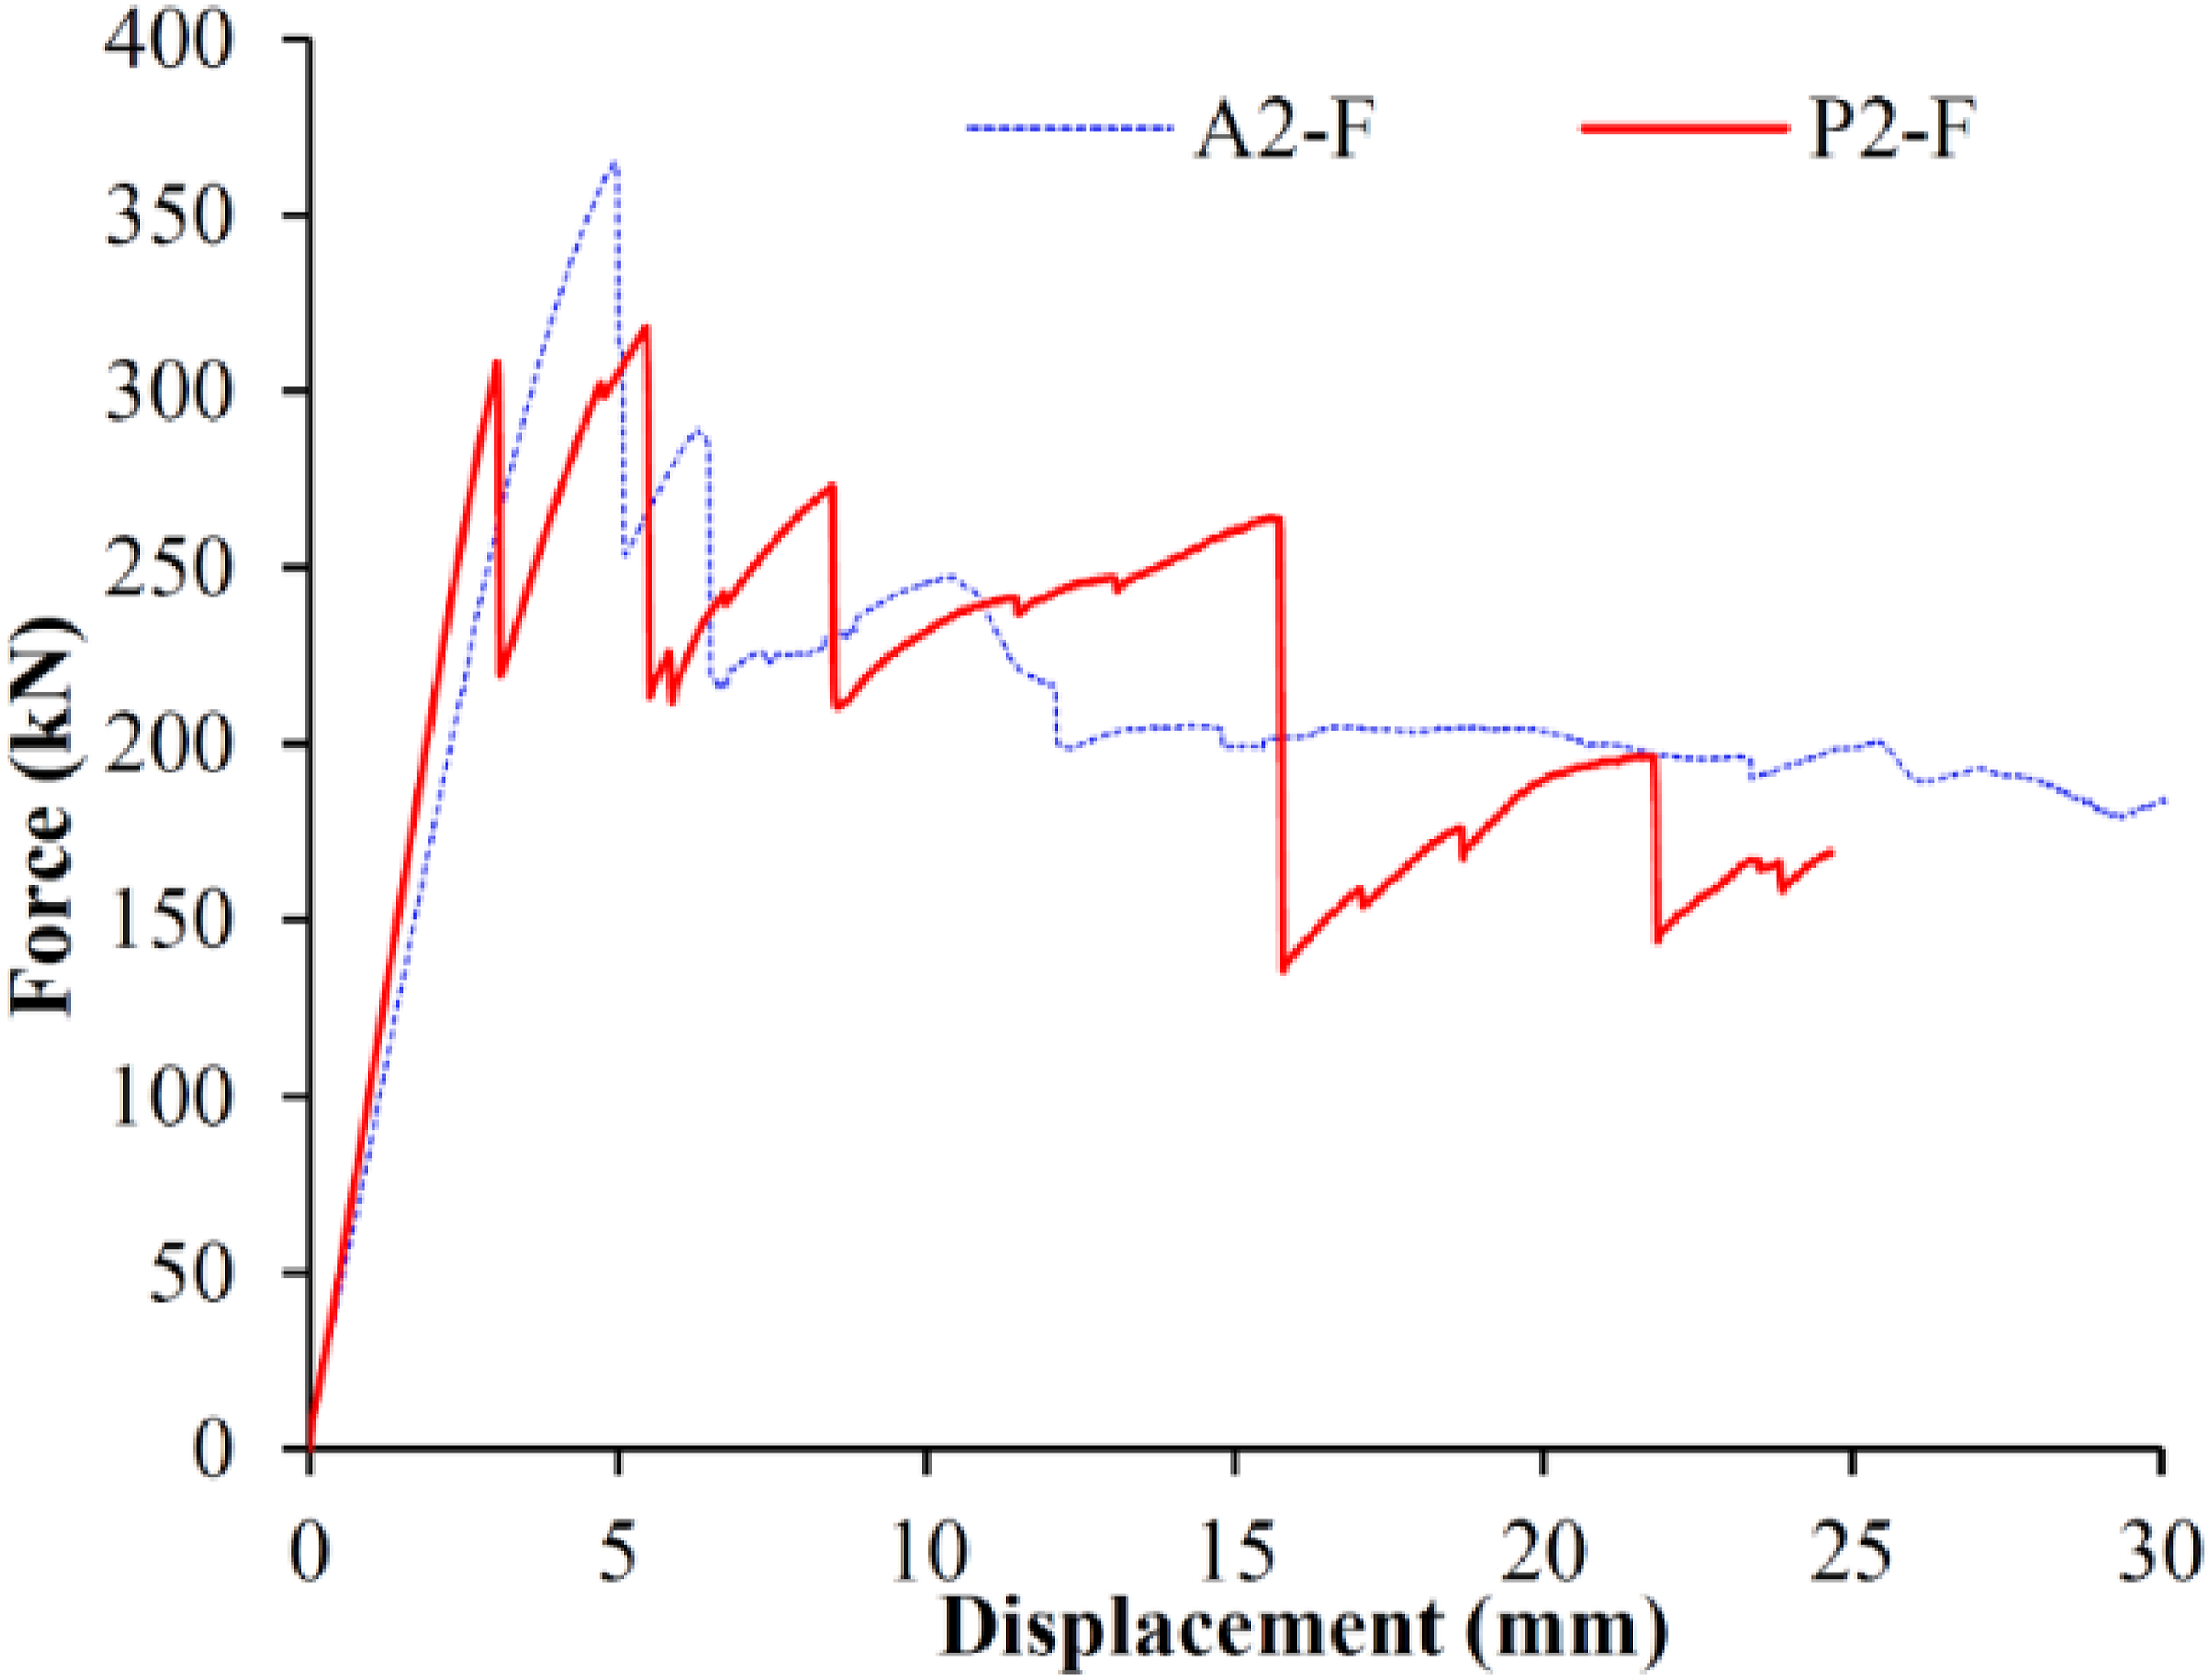
Experimental analysis of the theoretical results for panels with a rectangular core
Parameters required to draw theoretical diagrams.
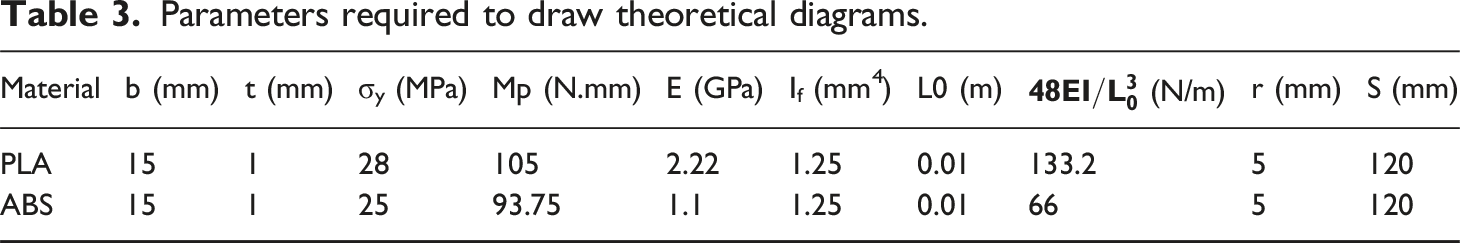
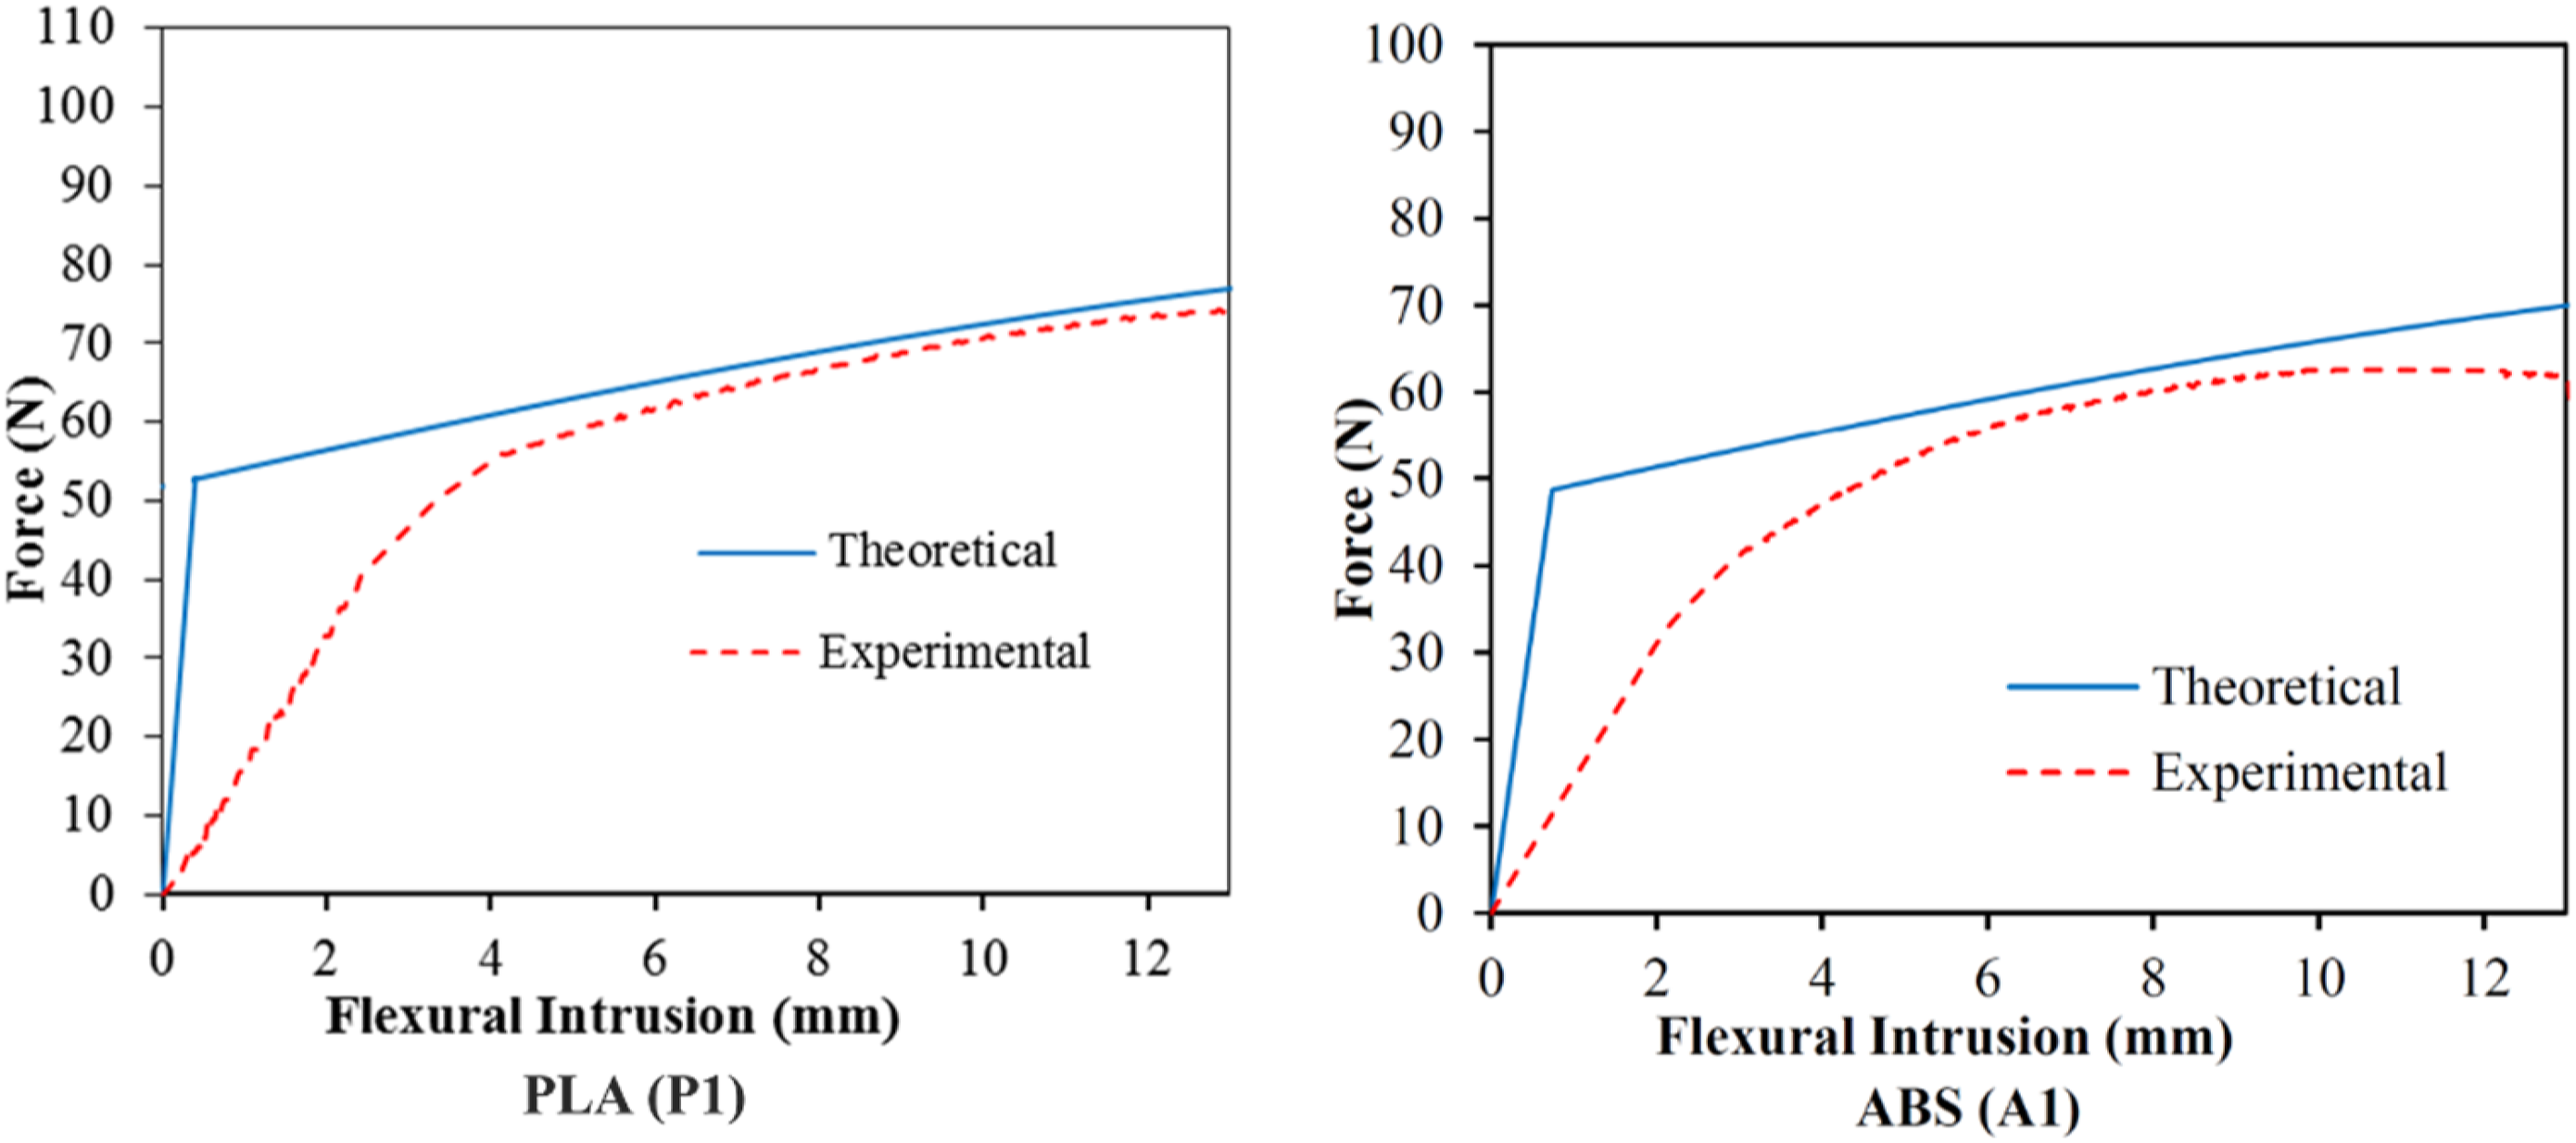
Comparison of force-displacement diagrams of ABS (A1) and PLA (P1) specimens in experimental and theoretical modes.
Comparison of collapse pattern of P1 sample in experimental and theoretical conditions.
According to Figure 10, it can be said that the accuracy of the theoretical relation presented in the plastic part is much higher than the accuracy in the linear or elastic part. The main reason for the discrepancy in the elastic part is first related to the hypothesis used to derive Equation (5). In fact, in this part, it was assumed that the edges of the upper part of the middle cell are on two fixed supports, while in reality these supports move, and therefore in exchange for increasing the same amount of force in the relationship between the theory and the experimental state of displacements will be greater in experimental graphs, and this will reduce the slope of the linear part for the experimental graph. The difference in the thickness of the ideal state (theory) and the experimental state is another reason for the difference in the linear part of the experimental and numerical graphs.
Various factors can be considered regarding the observed difference for the plastic or non-linear part. The most important factor in this difference is the actual thickness of the specimens in the experimental state. Considering that in the method of making samples with the process of 3D printing, different layers are placed on top of each other, it can be said that there is always some defect or empty space in the connection between the layers and this defect (empty space) reduces the effective thickness. In order to have a better understanding of this issue, referring to Figure 12 can be helpful. Figure 12 shows a set of images. Figure 12(a) and (b) show cross-sections of samples P1 and A1 that have failed. As can be seen in these two figures, the thickness of the specimens is not ideally perfectly uniform. This lack of uniform thickness distribution is due to the type of manufacturing process with a 3D printer. Figure 12(c) shows the schematic of 3D printing. Finally, the SEM (Scanning Electron Microscope image) cross-section of Figure 12(d) is one of the printed examples. Investigation of thickness distribution in samples made using a 3D printer. (a): PLA core, (b): ABS core, (c): Schematic of the orientation of the additive manufacturing layers and (d): SEM from PLA-section.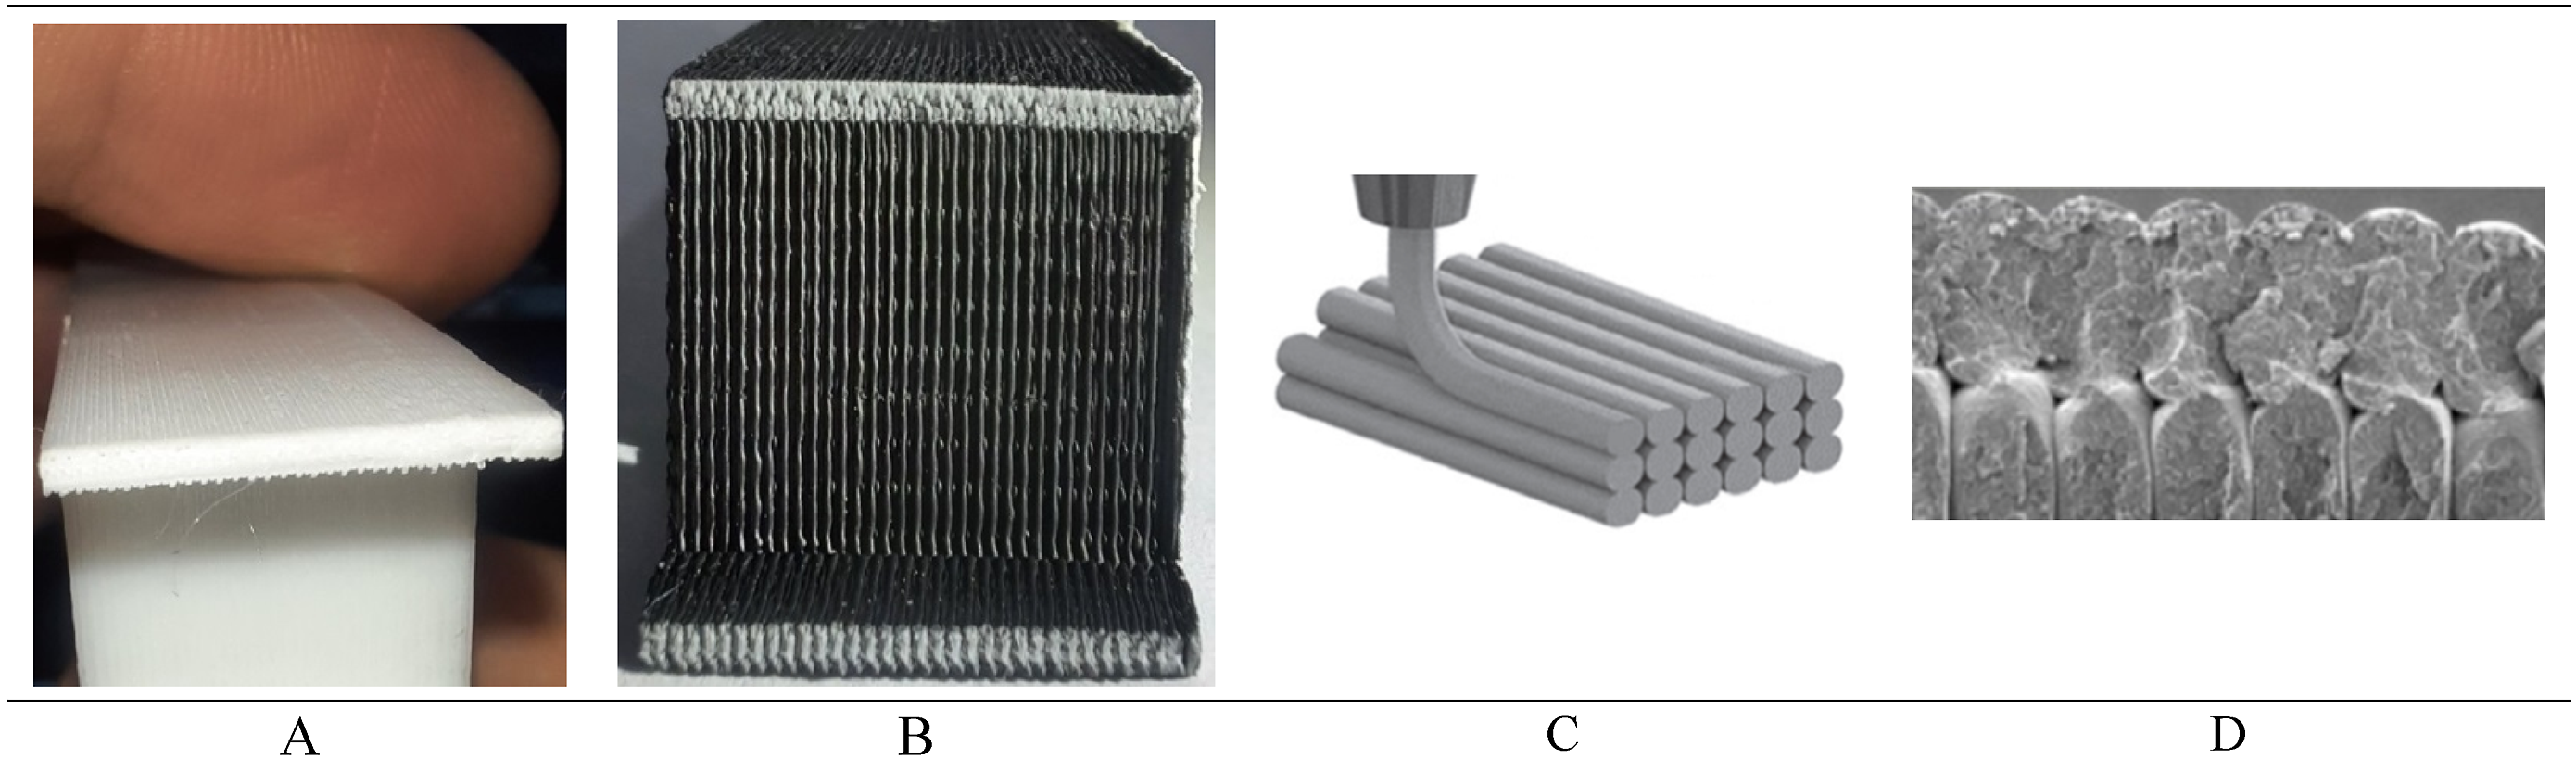
Conclusion
In this research, a new type of sandwich panels has been introduced. 3D printing method was used for making the cores, and for the face sheets, aluminum sheets and composite shells reinforced with glass fibers were used. The cores were made of two materials, ABS and PLA, and the composite face sheets consisted of six layers of glass fibers with a surface density of 200 g/m2, which were stacked with a suitable resin. In the studies conducted in this experiment, it was found that the addition of aluminum and composite face sheets leads to the improvement of collapse properties under the three-point bending test. In the final part of the research, citing the reliability of energy in the collapse process, a theoretical method was proposed to predict the amount of force required for bending cores with rectangular geometry made of PLA and ABS filaments. According to the experimental results, an acceptable agreement was observed between the experimental and theoretical results, so it can be said that the theoretical relationships have a good ability to predict the force required for the decay of cores with rectangular geometry. The following are some of the most important results obtained in this study. 1. In sandwich panels, the highest resistance to deformation is related to the samples with triangular core. These samples have the highest maximum force, but compared to other samples, they are more brittle and the amount of penetration of the indenter is the minimum amount possible for them. 2. Sudden changes in force-displacement diagrams related to bending of sandwich panels is due to sudden ruptures in the bent specimen. These changes correspond to the occurrence of collapse in one of the parts of the sandwich panel, which can appear in four patterns: 1- global bending 2- wall buckling 3- global fracture and 4- wall fracture. 3. The use of composite face sheets significantly increases energy absorption. Composite face sheets showed a very high resistance to bending compared to aluminum face sheets, so that none of the composite face sheets failed. 4. Examination of the force-displacement curve of two aluminum and composite face sheets under three-point bending showed that the composite face sheet of glass fibers has a higher strength compared to aluminum face sheets. However, after loading both aluminum and composite samples, the composite sample returned to its original state and no plastic deformation remained in it. In all the sandwich panels of this study, the composite face sheets returned to their original state. 5. Models with PLA cores generally have higher energy absorption than ABS cores. More precisely, the energy absorption of PLA cores in rectangular and trapezoidal geometries is higher than in ABS specimens, but less for triangular geometries. 6. In general, by adding aluminum and composite face sheets to different cores, the maximum force increases, and in the meantime, composite face sheets have the greatest impact on increasing the maximum force. Among different geometries, the maximum force of PLA specimens is higher. 7. In samples with triangular geometry, the average force of samples with ABS core and aluminum and composite face sheets is more than similar models with PLA core, while without the presence of face sheets, the average force of PLA core with 183 N is 106% higher than the ABS core with 89 N. 8. The average strength of PLA core panels is generally higher than that of ABS core panels. However, in the case of samples A2-F and P2-F, it was observed that the maximum force of the sample P2-F is less than that of the sample A2-F.
Footnotes
Declaration of conflicting interests
The author(s) declared no potential conflicts of interest with respect to the research, authorship, and/or publication of this article.
Funding
The author(s) received no financial support for the research, authorship, and/or publication of this article.