
Abstract
Fused deposition modeling (FDM) process parameters influence the mechanical behavior of the printed parts. Optimization of parameters like extrusion temperature, layer height, print speed and infill density enhances the performance of the product. The ability to process a variety of thermoplastic materials and quick and personalized design makes FDM a desirable alternative process to manufacture fabric structures. However, the mechanical properties are often compromised. This research attempts to optimize extrusion temperature, layer height and print speed for manufacturing of 2/1 twill woven fabric structure for desired properties. In this work, Taguchi robust design is used for experimental design. Samples from Polylactic acid (PLA) are subjected to tensile and flexural loading. Tensile strength, tensile modulus, flexural strength and flexural modulus are recorded and optimized using commercial software MINITAB. The order of influence of process parameters on fabric is varied for different properties evaluated. Either extrusion temperature or layer height is reported to be the most influential process parameter for the fabric sample. In contrast, print speed does not have significant effect on most of the properties studied. The mechanical properties and nature of influence by process parameters are found to be dissimilar in warp and weft direction.
Keywords
Introduction
Fused deposition modeling (FDM) also known as free form fabrication (FFF) is an additive manufacturing (AM) technique used to process polymers. In this method, a continuous polymer monofilament is fed into the machine which melts the polymer and deposits the melt on a flat surface to fabricate the desired design. Ability to process a variety of polymers make this method popular and desirable to produce not only prototypes but also functional parts.1–6 Acrylonitrile butadiene styrene (ABS), Polylactic Acid (PLA), Thermoplastic Polyurethane (TPU) and nylon are some of the widely processed thermoplastics using FDM process. Easy processing, rapid manufacturing with quick design change, design flexibility with part, customized and in situ design possibility and reduced solid waste are some highlighted advantages of FDM which made scientists interested in exploring this manufacturing method. Figure 1 illustrates different processes involved with conventional fabric making and highlights the difference with the FDM method. Conventional method includes several processes which require more time and manpower and produces more solid waste – which goes to either landfill or must go through difficult recycling process. In contrast, the straightforward workflow of FDM can produce the desired fabric structure directly from polymer filament. Hence, there is a possibility to reduce time, manpower and waste associated with fabric making.
7
The FDM method is handy for customized and personalized parts. In aerospace and other applications, the on the spot production and one time use designs might be required. It would take a long time to change the design of the fabric with traditional manufacturing methods whereas a simple design change in the CAD file will work for the FDM method. (a) Traditional fabric manufacturing process flow and (b), fabric manufacturing flow with FDM.
In recent years, some researchers have given significant attention to making fabric structures using FDM. Takahashi and Kim 8 produced woven structures using PLA that can bear 4 kg of load. Similarly, Fajardo et al. 9 also used PLA to make several fabric structures and achieved some degree of flexibility, mainly because of the gaps present between individual yarns. Furthermore, Li et al. 10 fabricated woven fabric with PLA and evaluated mechanical behavior of the fabric with varying designs. Literature shows that PLA is the most popular material among scientists to make fabric structures. However, in addition to PLA, Forman et al., Spahiu et al., and Uysal and Stubbs11–13 have made different fabric designs with alternative materials such as TPU, PETG, ABS and nylon. Researchers have successfully reported that the wearable fabric can be made with these polymers. Moreover, Jayswal et al. have highlighted the fact that woven fabric can be produced, and the performance can be analyzed with finite elements modeling to understand the behavior of the fabric. 14 However, most of the results lead to a conclusion that, although fabric can be produced using FDM, strength and flexibility are the main issues associated with the structure. It is reported that the manufactured structures lack sufficient strength and flexibility to be used as functional fabric. The nature of the FDM process where the molten material is deposited layer by layer on top of each other is the main reason behind compromised strength of the parts produced. 15
The available literature and their findings suggest that the mechanical properties of an FDM part are compromised to some extent when compared to a similar part made with conventional methods like injection molding. For instance, injection molded ABS part has 40 MPa tensile strength and 2.3 GPa elastic modulus whereas FDM ABS part has 30 MPa tensile strength and 1.8 GPa elastic modulus.
2
The reduction in mechanical properties of the parts is mainly because of the layer by layer deposition of the polymer. The viscosity of molten polymer decreases with increasing temperature. If the viscosity is lower at elevated temperatures, the material will deposit in elliptical shape rather than circular cross section due to gravitational pull. The elliptical shaped deposition will increase contact area between the two layers, but the internal voids will still be present in the part. Figure 2 illustrates the circular and elliptical cross section of the deposited material at high viscosity and low viscosity.
16
In addition to geometry of the extrusion, other process parameters also influence the mechanical behavior of FDM parts. A handful of literature shows that extrusion temperature, print speed, layer thickness, build orientation, raster angle, raster width, infill density, air gap, infill pattern and nozzle diameter are the parameters that can potentially influence part properties. Researchers have attempted to find optimum level of each parameter for better mechanical behavior of the parts manufactured.17–23 Although most of the research has studied parameter impact on standard dog-bone samples, it can be inferred that these parameters can influence the strength of other structures like interlaced fabrics because the nature of the material deposition is similar in these structures as well. Hence, optimization of FDM process parameters can be done to enhance the mechanical properties of fabric structures produced by this method. Because of robust design and reliability, Taguchi method for design of experiment is widely used in process parameter optimization of FDM process.24–27 To the best of the knowledge of the authors, no literature is found where the influence of FDM process parameters on woven fabric structures has been carried out. (a) Voids formation in FDM part - circular cross section of the deposited material at high viscosity due to low temperature and (b), elliptical cross section of the deposited material at low viscosity due to high temperature.
Method and materials
Woven fabrics have a wide range of designs. In this type of fabric design, fabric yarns are basically interlinked with each other where a horizontal yarn, known as warp yarn, passes over and under of one or more vertical yarn(s), known as weft yarn(s). Depending upon the nature of how the yarns are interlaced, a plethora of designs is possible for woven fabrics. Plain weave, rib weave, basket weave, twill weave and satin weave are basic weave designs. Twill weave is one of the basic and most common weave designs. In this research, 2/1 twill weave design is manufactured using the FDM process. The general architecture of interlacing between warp and weft yarns is presented in Figure 3(a). In this design each warp yarn goes over two weft yarns and under one weft yarn and it repeats. As illustrated in the diagram, the position of warp yarns going either over or under changes for each warp. As a result of this nature, a diagonal-type pattern can be observed at the intersection points where warp yarn is over the weft. A repeat unit also known as unit cell of the design is represented in Figure 3(b). This interlaced design is replicated in the design software to make a 3D model of fabric. (a) Interlaced design architecture of 2/1 twill design and (b), repeat unit (unit cell) of 2/1 twill design.
FDM requires a CAD file to be fed into the FDM machine. A commercial design software, SolidWorks® is used to make the required design which is presented in Figure 4(a). The designed CAD file is converted into the machine-readable code, called G-code, which includes the tool path for the machine using the slicing software Cura Lulzbot Edition 3.6.40. (a) SolidWorks design of 2/1 twill fabric to fabricate with FDM and (b), geometry of warp and weft yarns.
The structure is designed in such a way that the fabric can be separated after printing. The yarn diameter is 1 mm in each direction and the distance between two consecutive yarns, in both directions is 3 mm. As illustrated in Figure 4(b), the vertical distance between a warp yarn and the weft yarn over it is fixed as 0.65 mm whereas the distance between warp yarn and two weft yarns passing under it is 0.59 mm. The designed part is printed in upright position on the print bed. The upright orientation of the part ensures that there is no need for support material which significantly reduces the printing time and the material consumption. Also, this orientation ensures that the warp and weft yarns are not fused into each other, and they are easily separable later. This set-up for printing makes one set of horizontal yarns which will be referred to as warp yarns and another set of vertical yarns which will be called weft yarns in this article. The designed sample is square shaped and has 31 yarns in warp (horizontal) direction and 31 yarns in weft (vertical) direction. For more technical detail about fabric design, the reader may refer to the references 7,28.
Polylactic acid (PLA) is used to make a woven fabric for this research. PLA is a biodegradable material with reduced environmental impact. 29 Since the interlaced fabric design is intricate, accuracy and ease of control are important factors to consider. PLA is selected because it is known for good processability with the FDM processes. To fabricate the designed part, a 2.85 mm diameter PLA monofilament (PolyLiteTM, Polymaker) is subjected to FDM set up (LULZBOT TAZ PRO: Fargo Additive Manufacturing Equipment 3D, LLC).
Taguchi L16 orthogonal design table.

The fabric yarns are manually separated once the part is fabricated to test for mechanical properties. It is observed that the yarns in weft direction are fragile and prone to get damaged while manually separating from the part. In contrast, yarns in warp direction have sufficient strength and are easily separable without any damage. Hence, tensile tests are conducted with two different group of samples – (1) with the individual warp yarns separated manually and (2) with the cut-out fabric sample containing 15 yarns. The second set of samples is prepared by cutting the specimen produced into two halves, both along warp and weft directions. In addition to tensile test, a three-point bending test for flexural properties is carried out for the printed part in warp and weft directions. ASTM D 3822 standard test method for tensile test and ASTM D 790-17 standard test method for 3 point bending test are followed using Instron 5900 universal testing machine.30,31
The interlaced nature of the yarns in fabric makes them wavy (crimped) shaped. When subjected to tensile load, the wavy yarns undergo straightening phase first. At this phase of the test, known as decrimping region, the stress is lower because straightening the yarn is easier than stretching it. A small portion of force-displacement curve will have a straight line at the beginning of the test. After decrimping, the yarns will undergo deformation upon continuous force application. Once the yarn is fully straightened, the stress increases sharply. Therefore, the stress-strain behavior of the sample is non-linear.
Mechanical properties (tensile strength, tensile modulus, flexural strength and flexural modulus) are collected during the test and fed into the statistical software MINITAB. The results are further analyzed in MINITAB to evaluate if the impact of the process parameters on the measured properties is significant or not. The rank of the influence of process parameter and level of significance of those effects is evaluated at 95% confidence level. The optimum level of each parameter is summarized based on signal to noise (SN) ratio. The SN ratio is calculated considering ‘the larger is better’ scenario for strength. For the modulus, ‘the smaller is better’ approach is adapted because rigidity is not preferable property for flexible fabric structures (it should be noted that the level of the required rigidity depends on the application of the product). The lower the modulus, the less rigid or less brittle the part is. An identical approach is taken of both scenarios for tensile and flexural behavior of the produced woven structures. The time taken to produce each sample is also recorded in hours and the influence of process parameter is monitored. A ‘smaller is better’ approach is taken to assess the impact on printing time.
Results and discussion
Printing time of the fabric samples
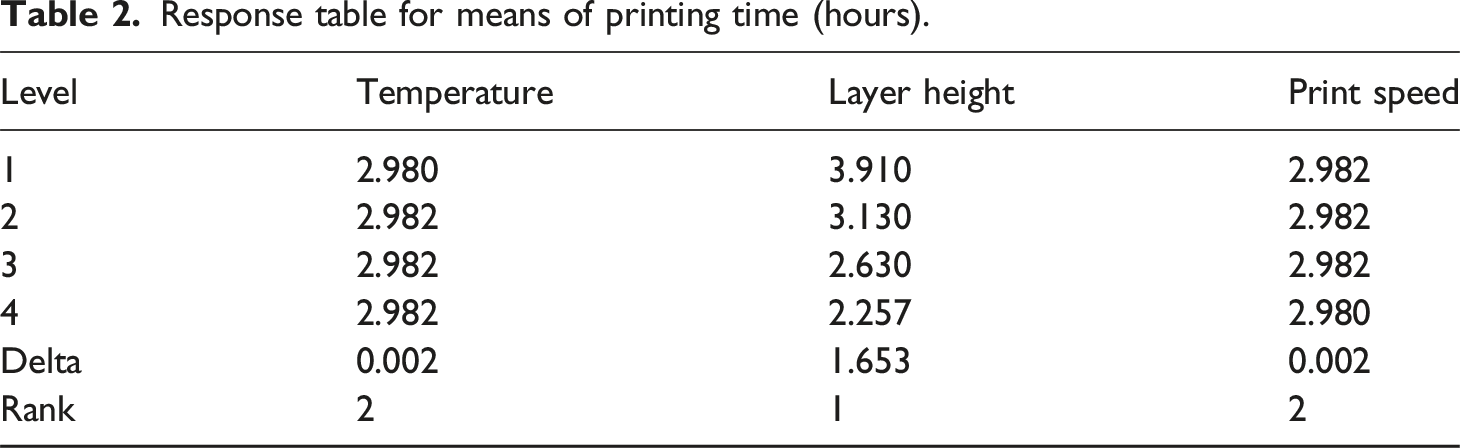
Response table for means of printing time (hours).

Pareto chart for the standard effects on printing time.

Main effect plots of printing time (hours) for (a) mean of means and (b) SN ratio.
Tensile properties of fabric yarns
Response table for means of tensile strength of yarns (MPa).

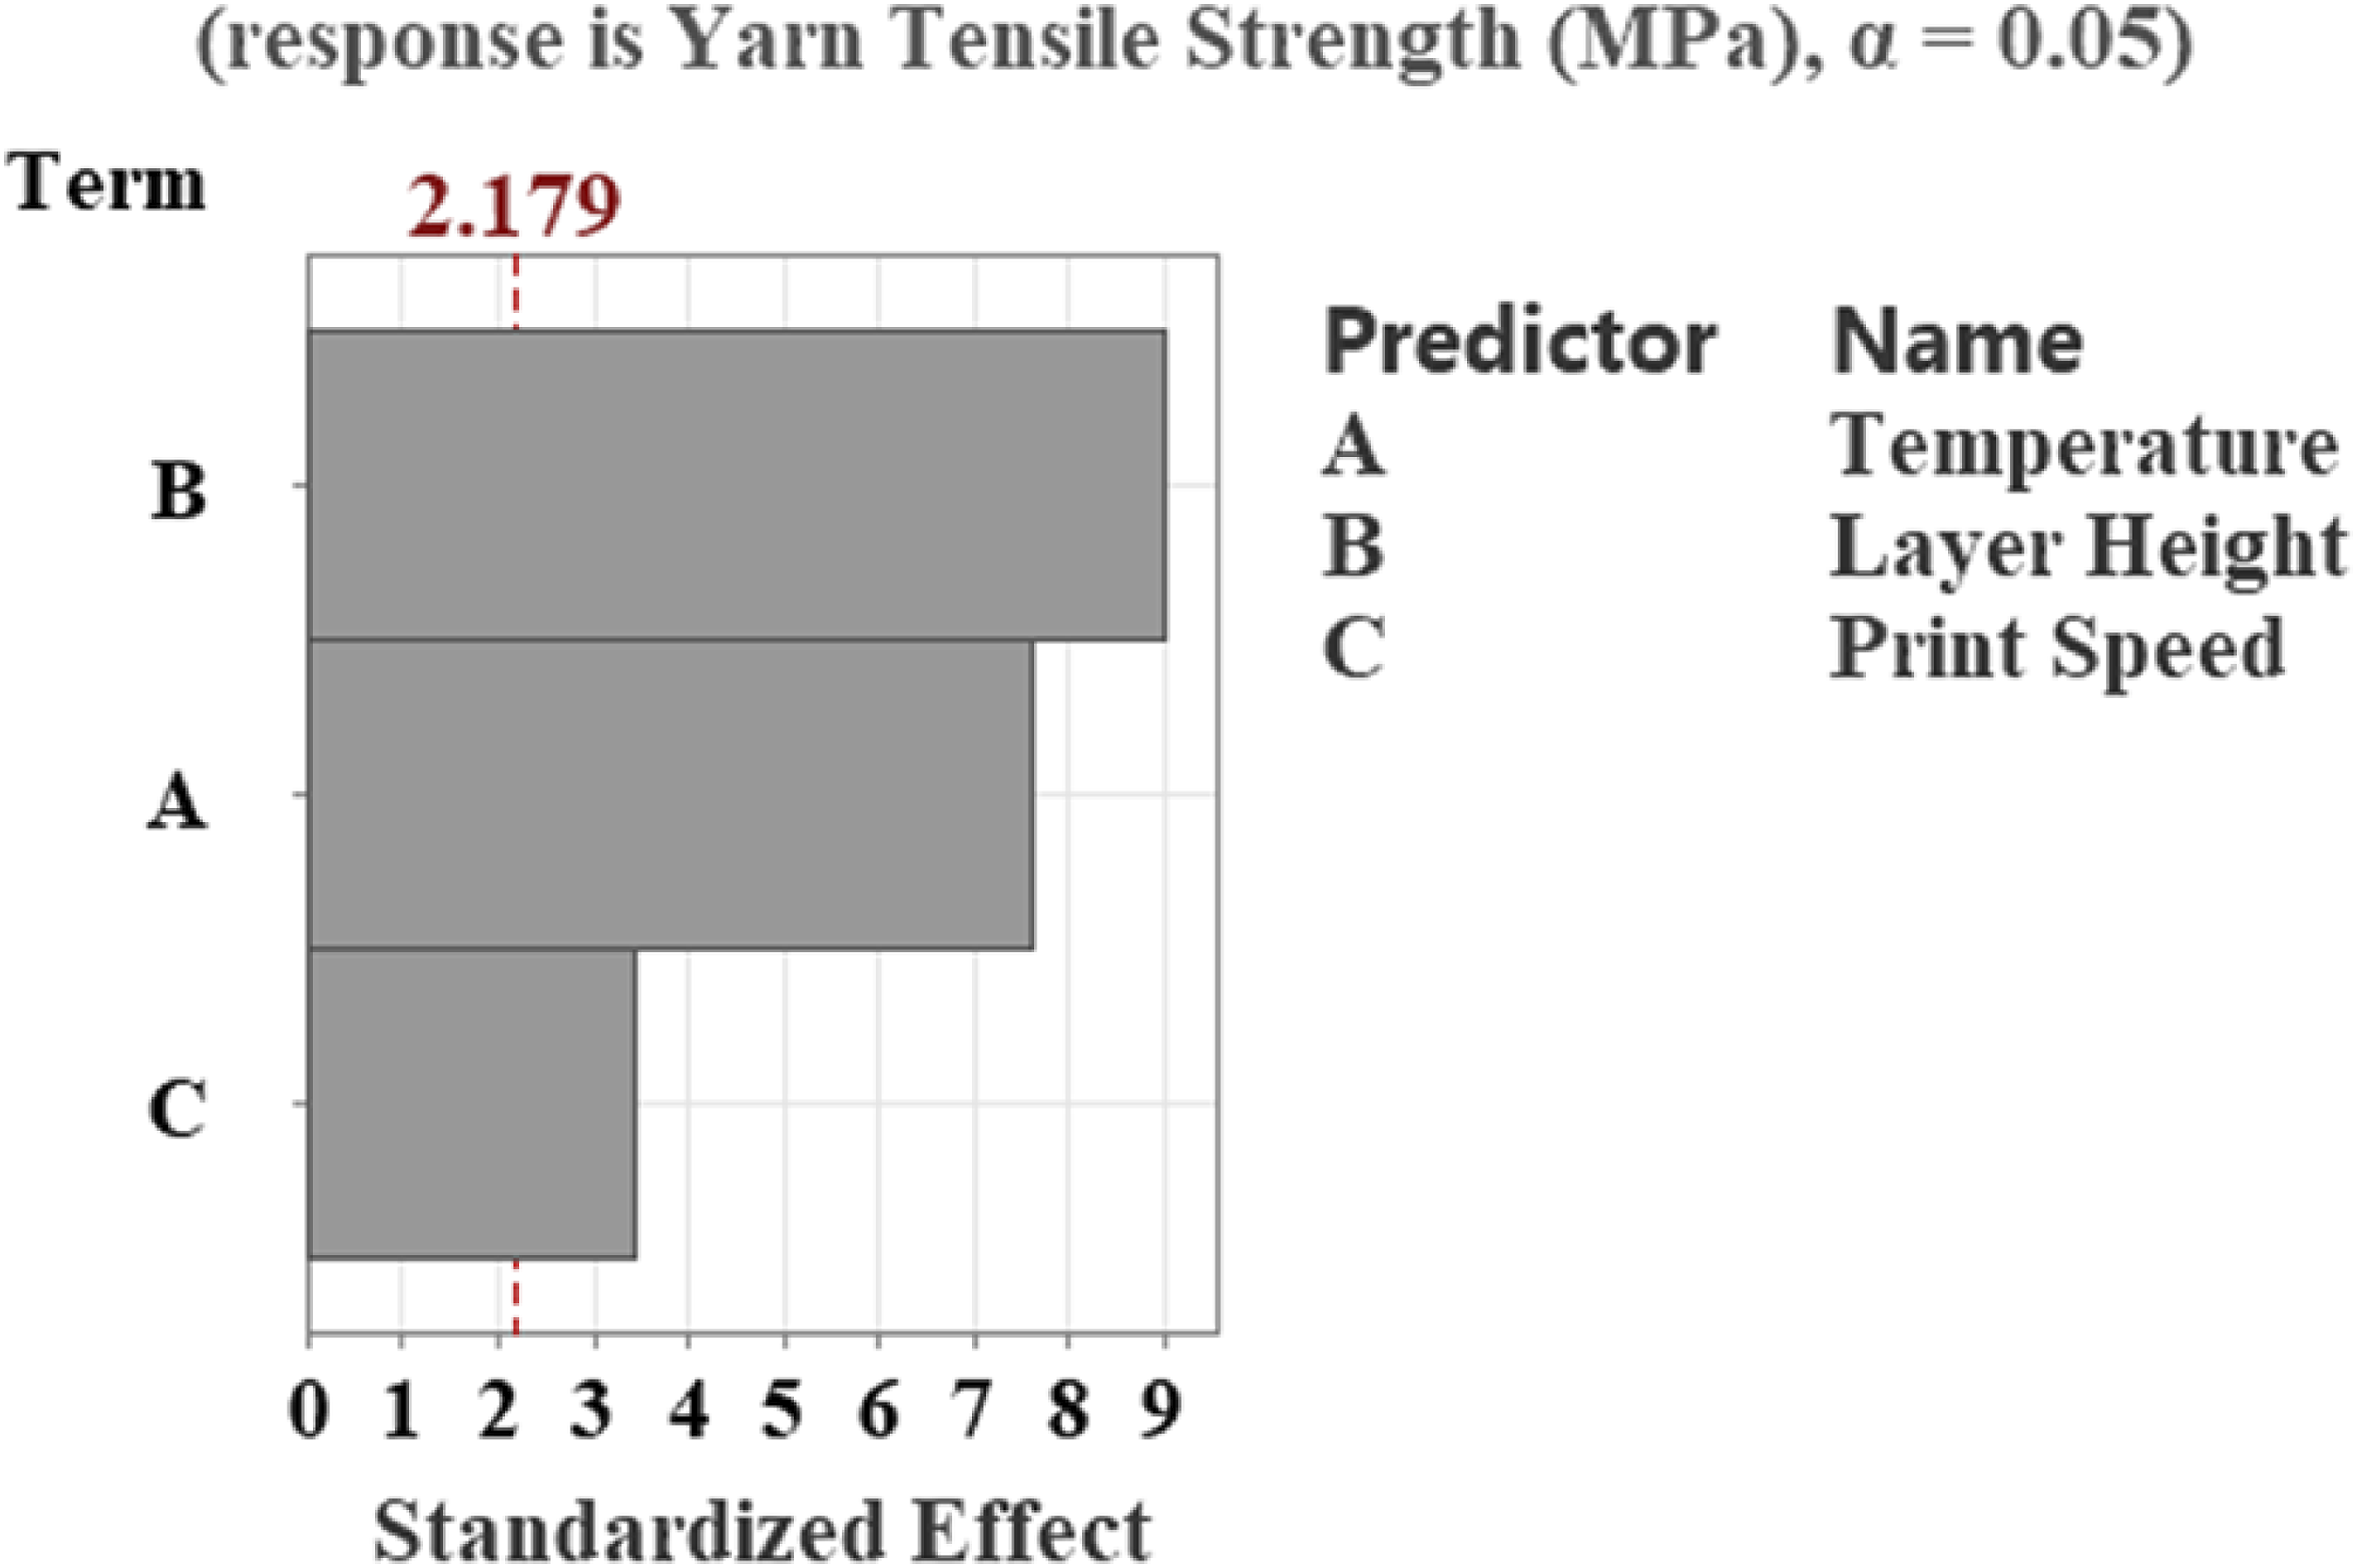
Pareto chart for the standard effects on tensile strength of yarns.
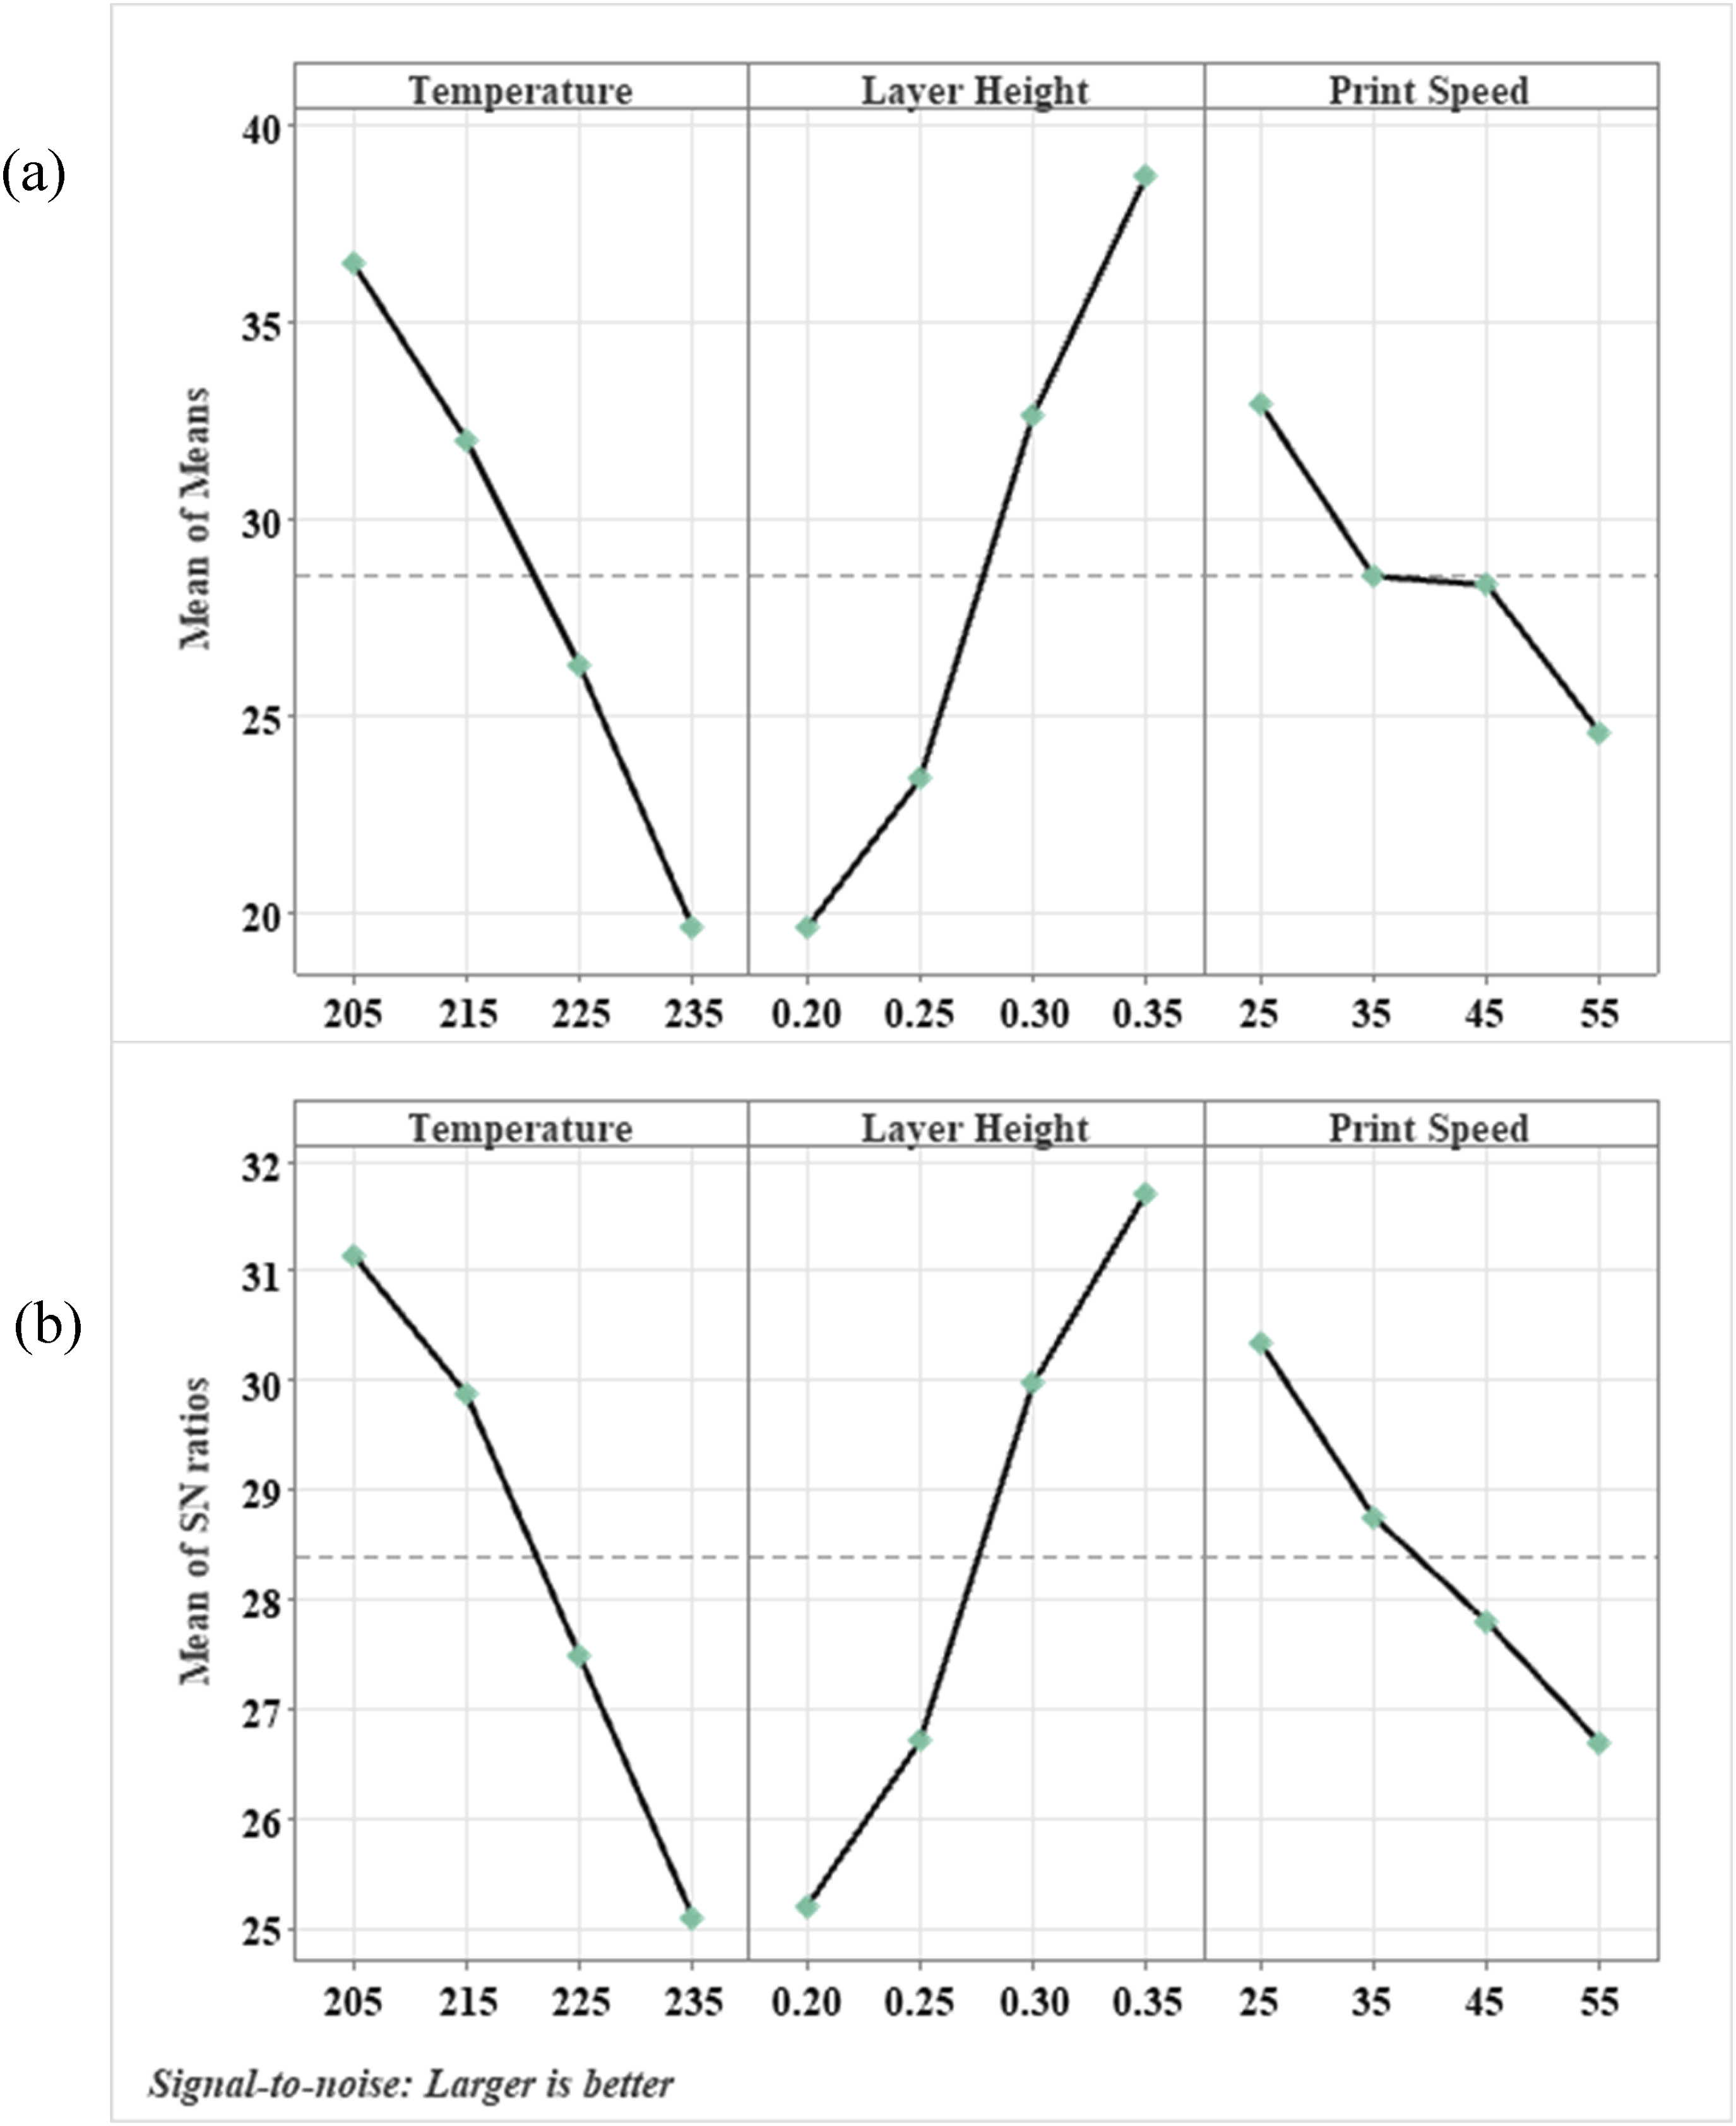
Main effect plots of tensile strength of yarns (MPa) for (a) mean of means and (b) SN ratio.
Figure 9 illustrates the standard effects on tensile modulus of the yarns and it is observed that only extrusion temperature and print speed have significant impact on modulus. Extrusion temperature has the highest effect followed by print speed and layer height as presented in response table for mean values of tensile modulus in Table 4. In addition, Figure 10 presents the variation on modulus based on each parameter level. It is observed that the modulus also decreases with an increase in temperature. It is noticed that the modulus is decreasing with increasing print speed. The SN ratio analysis suggests that the optimum parameter level for modulus is 235°C extrusion temperature, 0.2 mm layer height and 55 mm/s print speed. Pareto chart for the standard effects on tensile modulus of yarns. Response table for means of tensile modulus of yarns (MPa). Main effect plots of tensile modulus of yarns (MPa) for (a) mean of means and (b) SN Ratio.


Tensile properties of fabric in warp direction
Response table for means of tensile strength of fabric (MPa) in warp direction.


Pareto chart for the standard effects on tensile strength of the fabrics in warp direction.
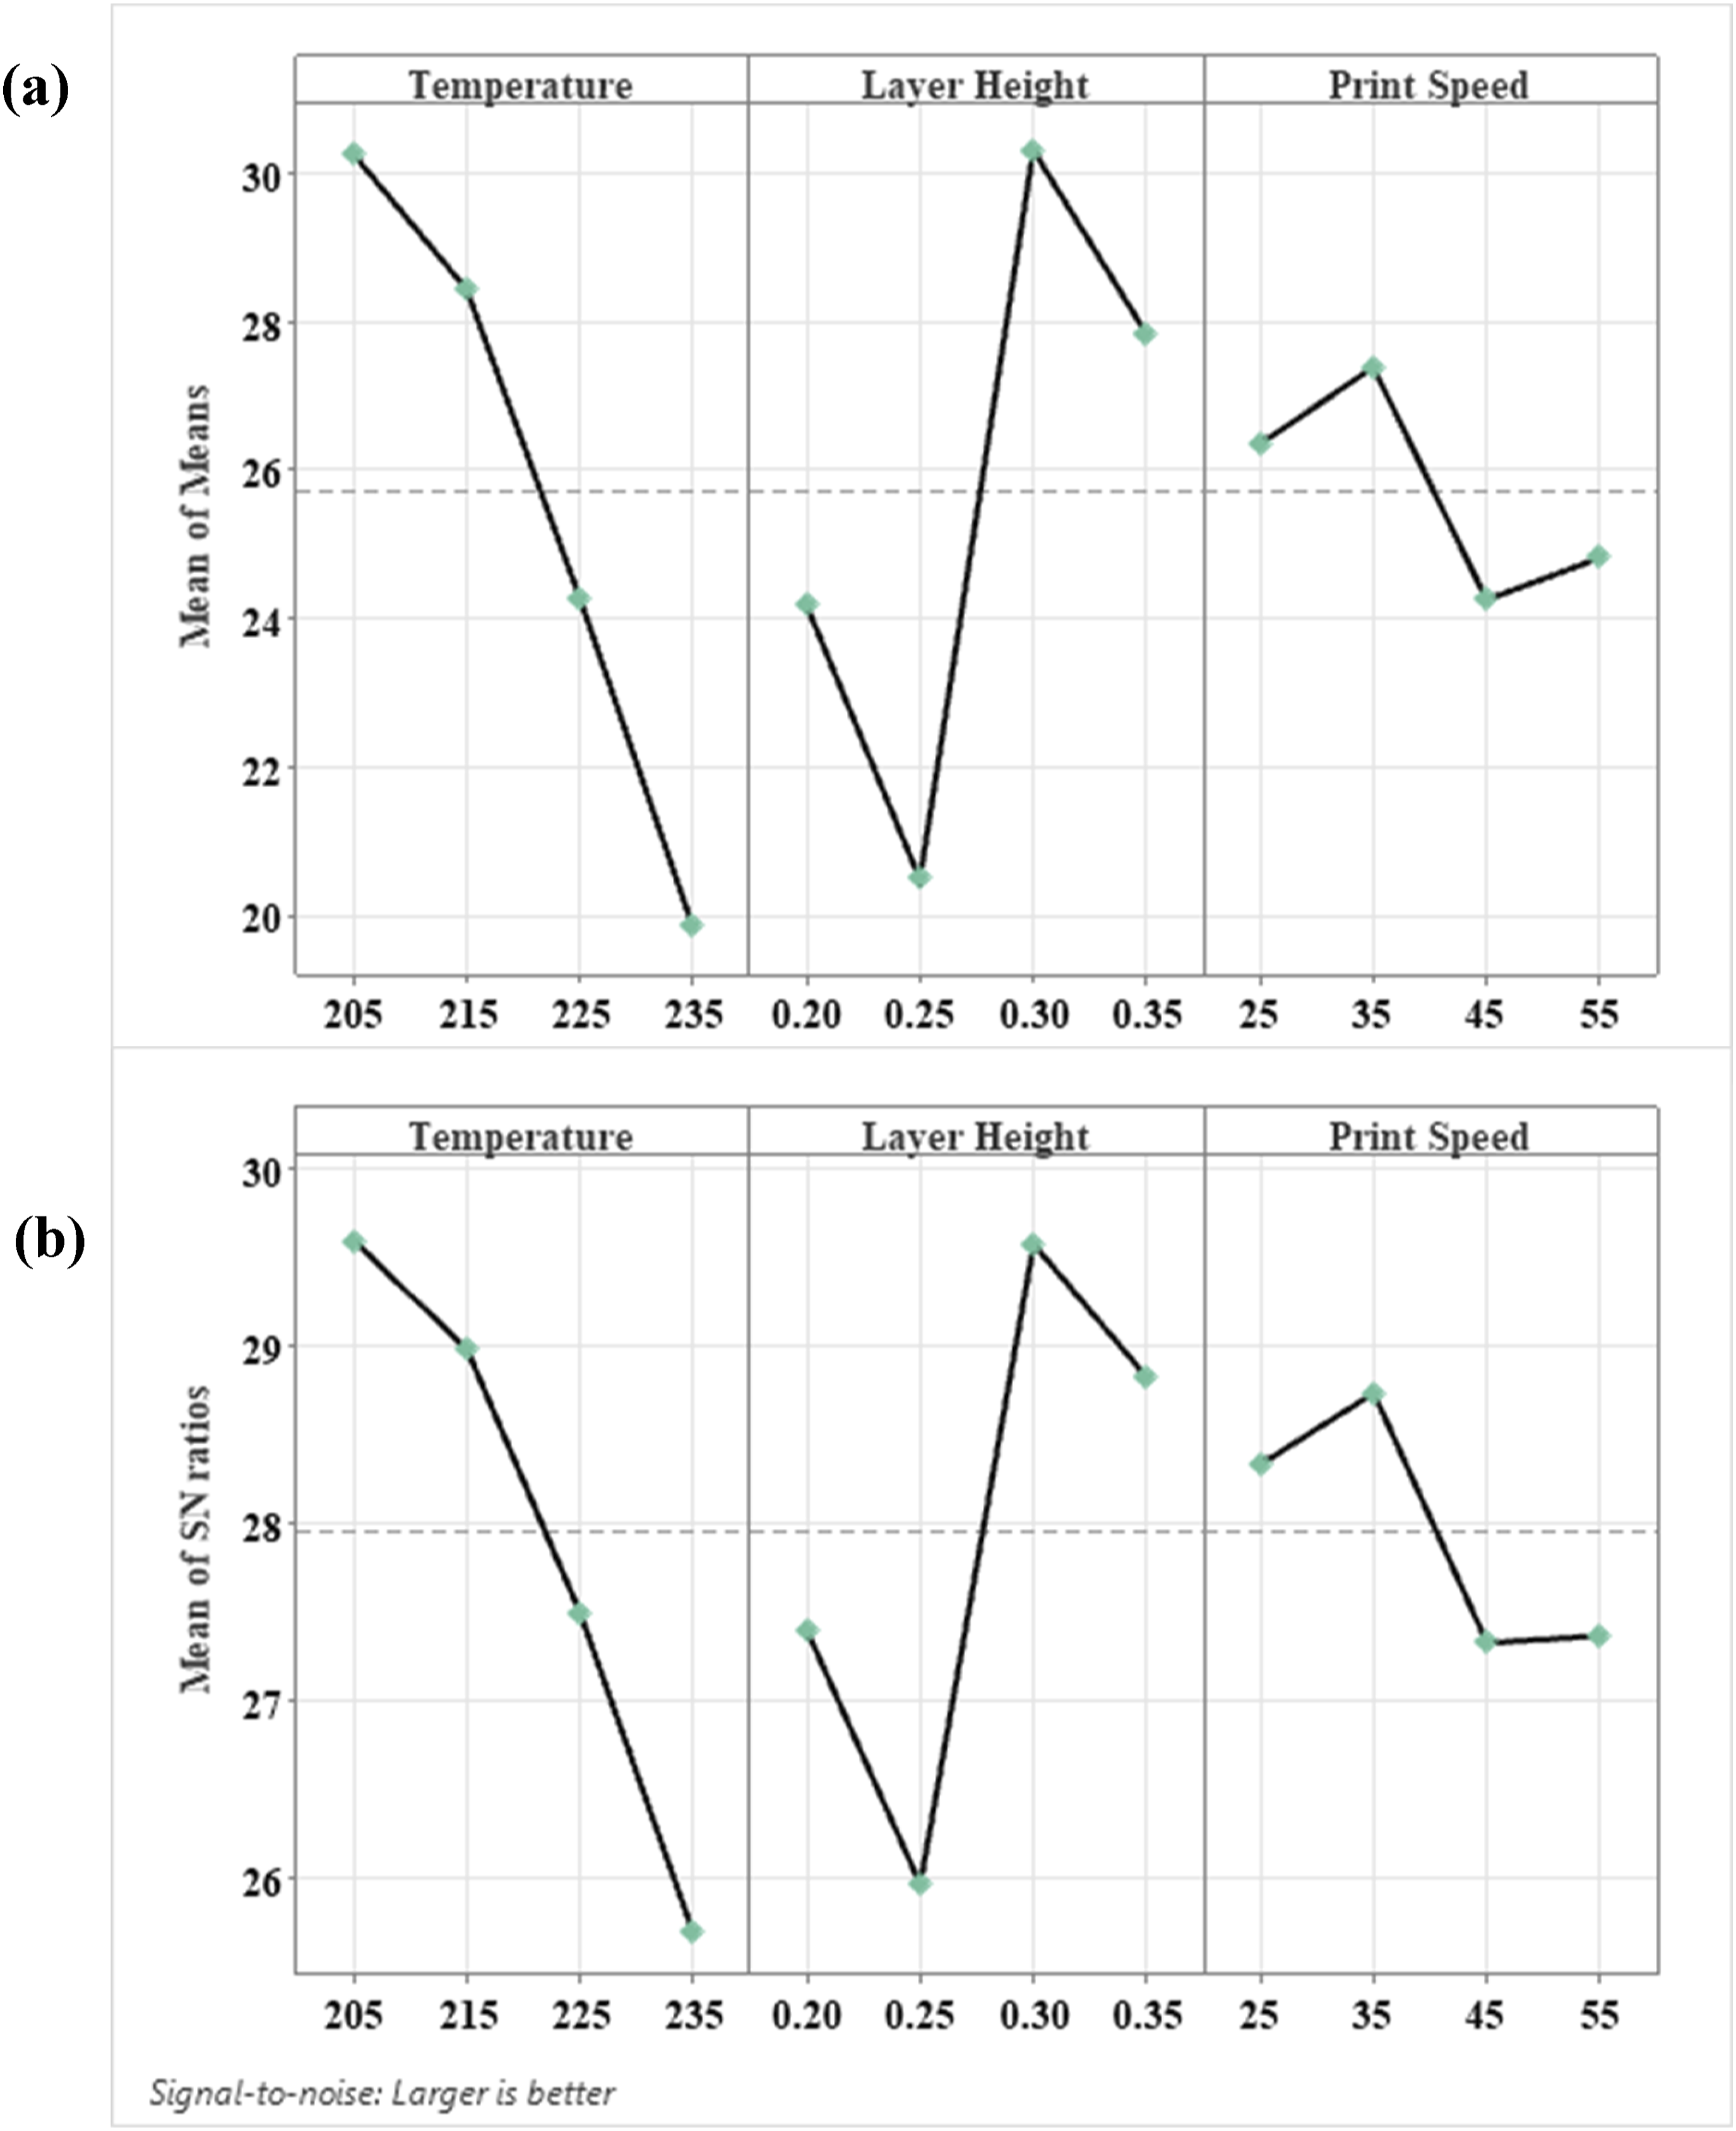
Main effect plots of tensile strength (MPa) of fabric in warp direction for (a) mean of means and (b) SN Ratio.
Response table for means of tensile modulus of fabric (MPa) in warp direction.


Pareto chart for the standard effects on tensile modulus of fabric in warp direction.

Main effect plots of tensile modulus (MPa) of fabric in warp direction for (a) mean of means and (b) SN Ratio.
Tensile properties of fabric in weft direction
Compared to warp direction, the nature of the influence of process parameters on tensile properties in weft direction is different. The results suggest that the strength and modulus are extremely low in weft direction. The reduced properties and the dissimilar influence of parameters are due to the nature of material extrusion for weft yarns. The fabric sample is printed on the printer bed in upright orientation. The warp yarn is constructed with continuous extrusion of material length equal to fabric length. In contrast, small circular deposition of specified layer thickness forms the weft yarns.
28
This difference in yarn construction, as represented by Figure 15, results in lower strength and modulus in weft direction. The behavior of weft yarn under the varying process parameters is also dissimilar to warp yarns. The results are congruous to the findings of Adanur and Jayswal.
7
Elaborated discussion about the warp and weft microstructure differences and their effect on mechanical properties can be found in the references 7,28. Dissimilar material deposition pattern in (a), warp yarn and (b), weft yarn.
Response table for means of tensile strength of fabric (MPa) in weft direction.


Pareto chart for the standard effects on tensile strength of the fabrics in weft direction.
Main effect plots of tensile strength (MPa) of fabric in weft direction for (a) mean of means and (b) SN Ratio.
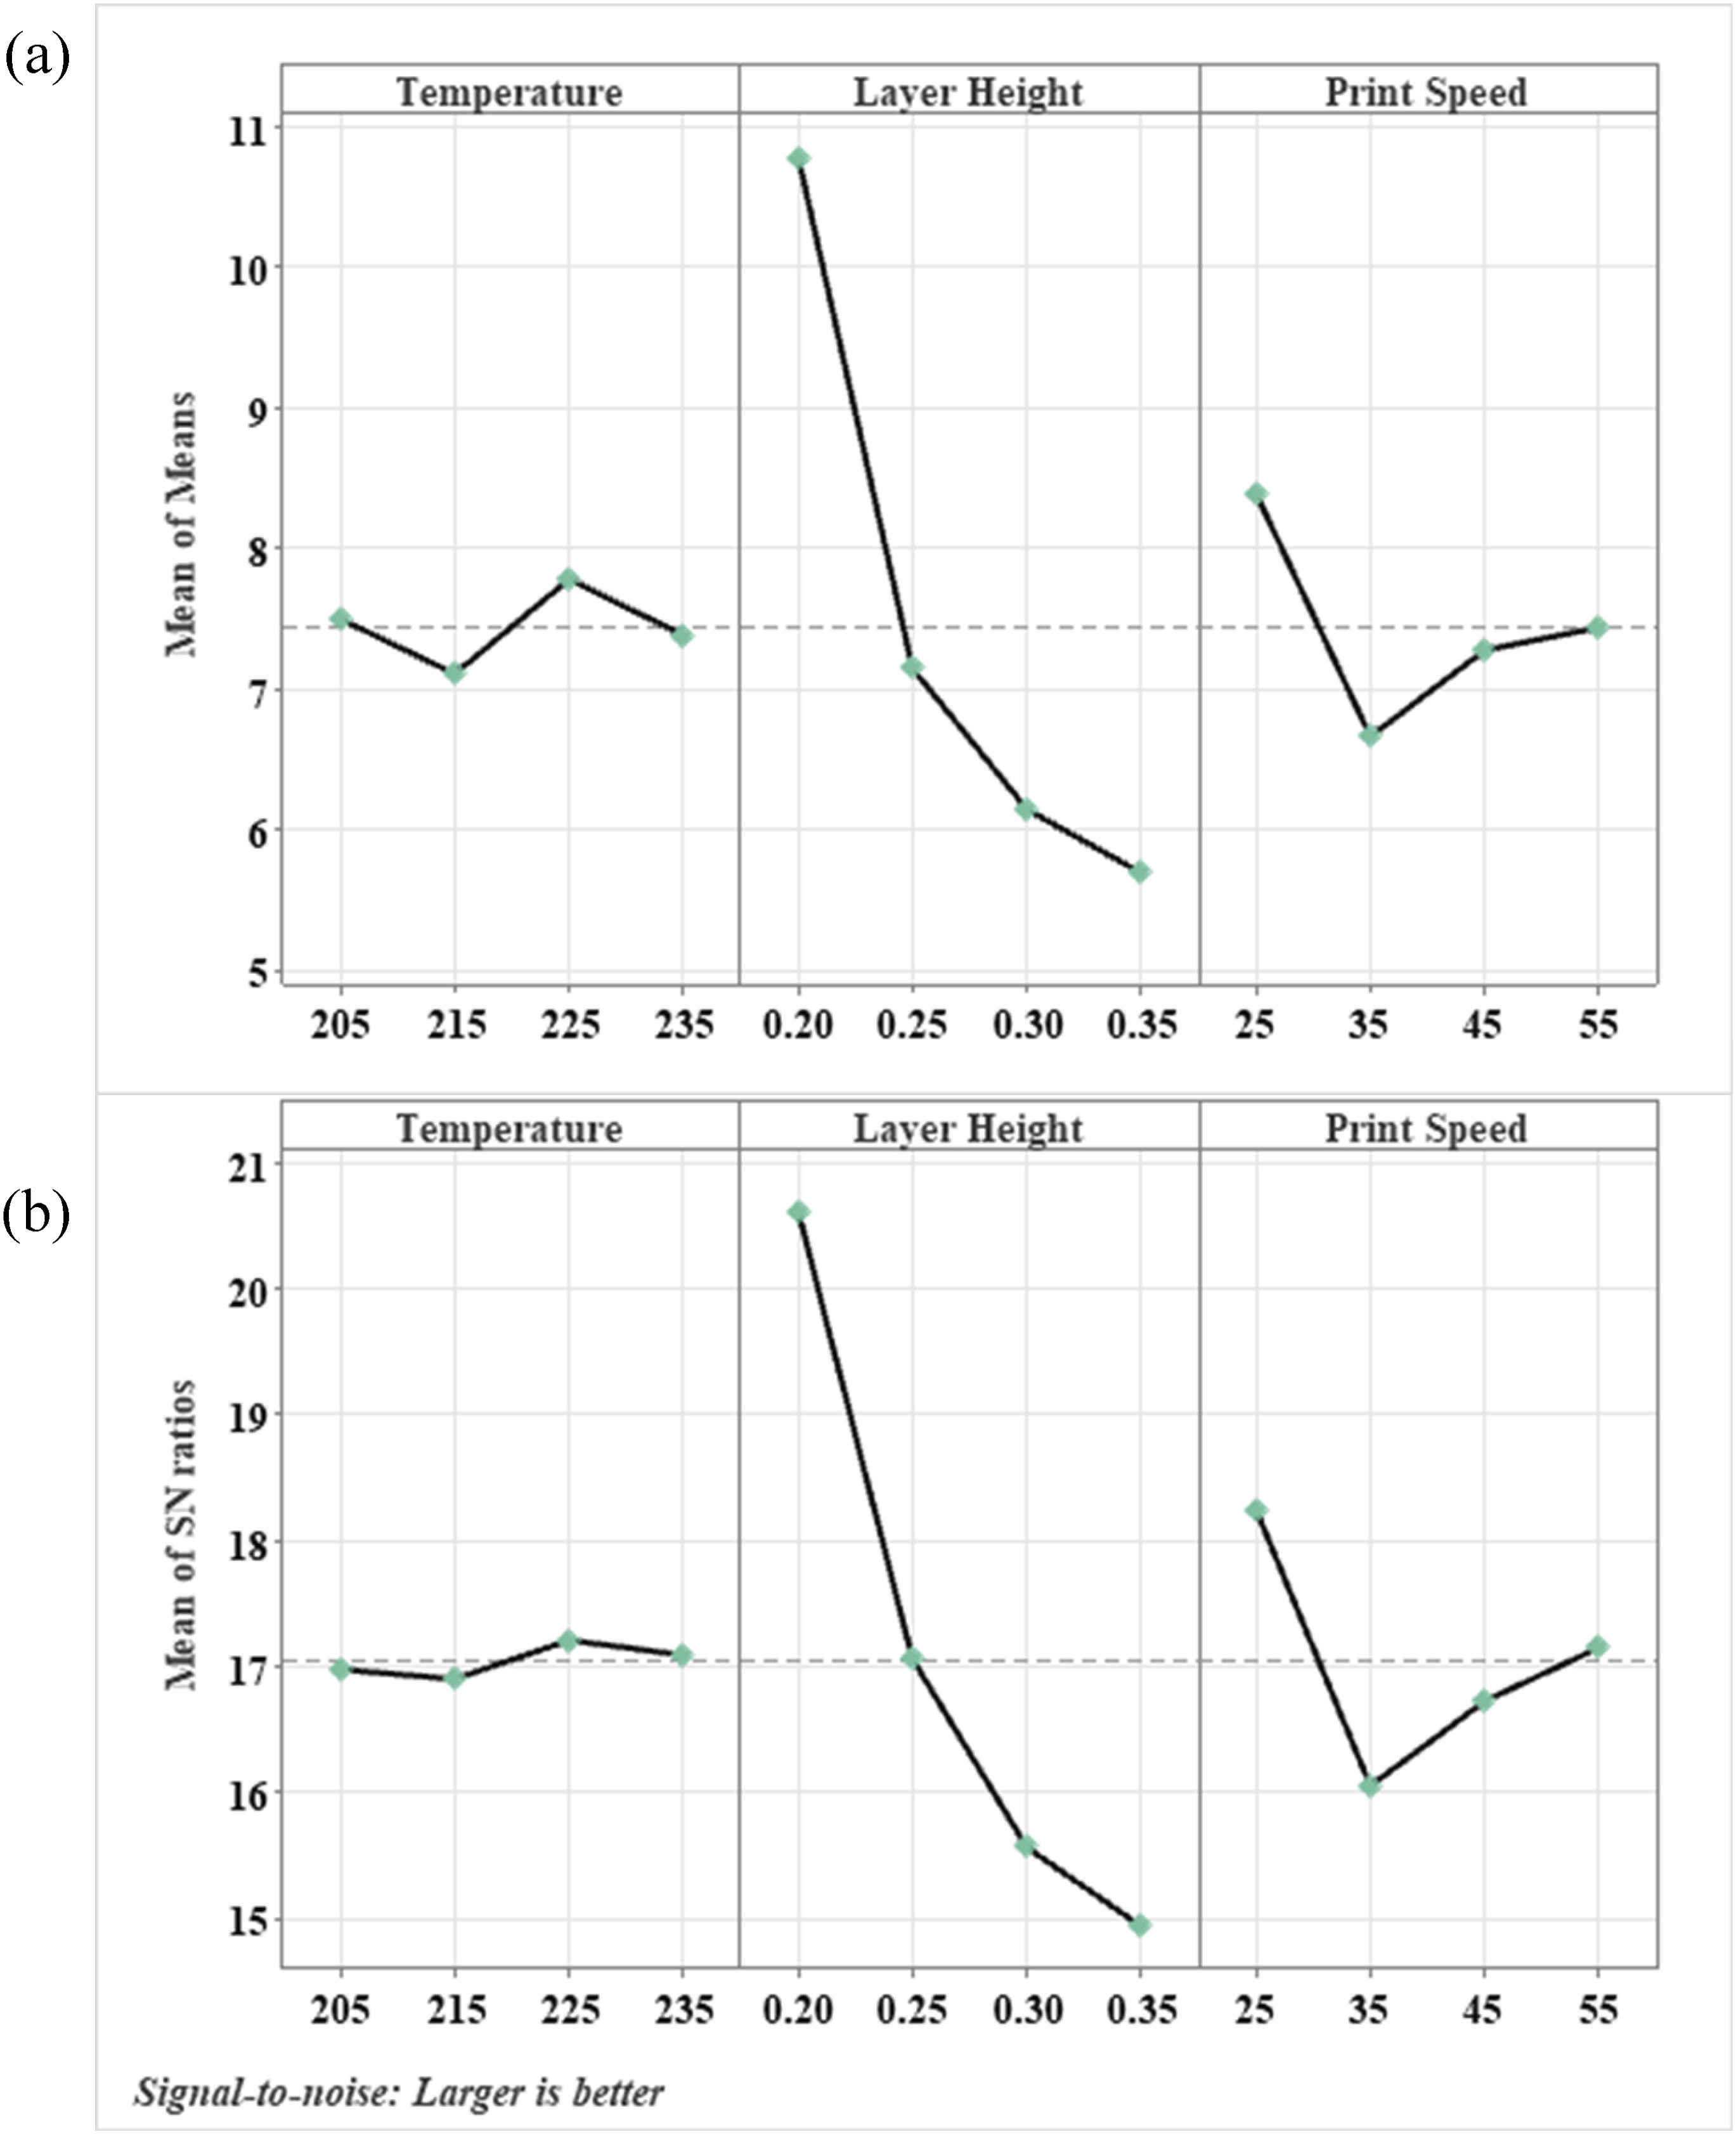
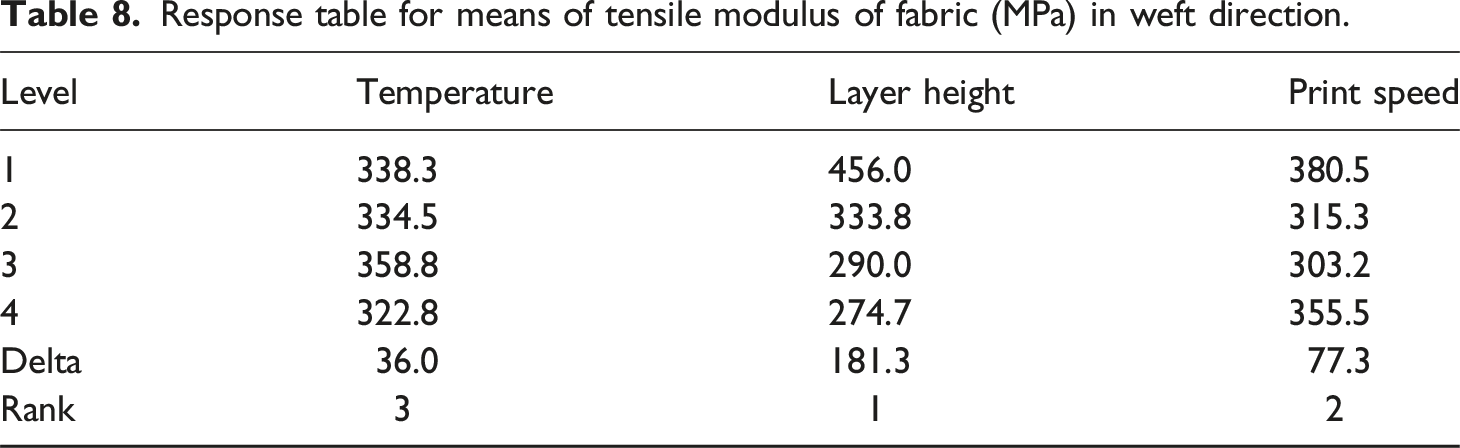
Response table for means of tensile modulus of fabric (MPa) in weft direction.

Pareto chart for the standard effects on tensile modulus of fabric in weft direction.

Main effect plots of tensile modulus (MPa) of fabric in weft direction for (a) mean of means and (b) SN Ratio.
Flexural properties of fabric in warp direction
Response table for means of flexural strength of fabric (KPa) in warp direction.


Pareto chart for the standard effects on flexural strength of fabric in warp direction.

Main effect plots of flexural strength (KPa) of fabric in warp direction for (a) mean of means and (b) SN Ratio.
Response table for means of flexural modulus of fabric (MPa) in warp direction.


Pareto chart for the standard effects on flexural modulus of fabric in warp direction.

Main effect plots of flexural modulus (MPa) of fabric in warp direction for (a) mean of means and (b) SN Ratio.
Flexural properties of fabric in weft direction
Response table for means of flexural strength of fabric (KPa) in weft direction.

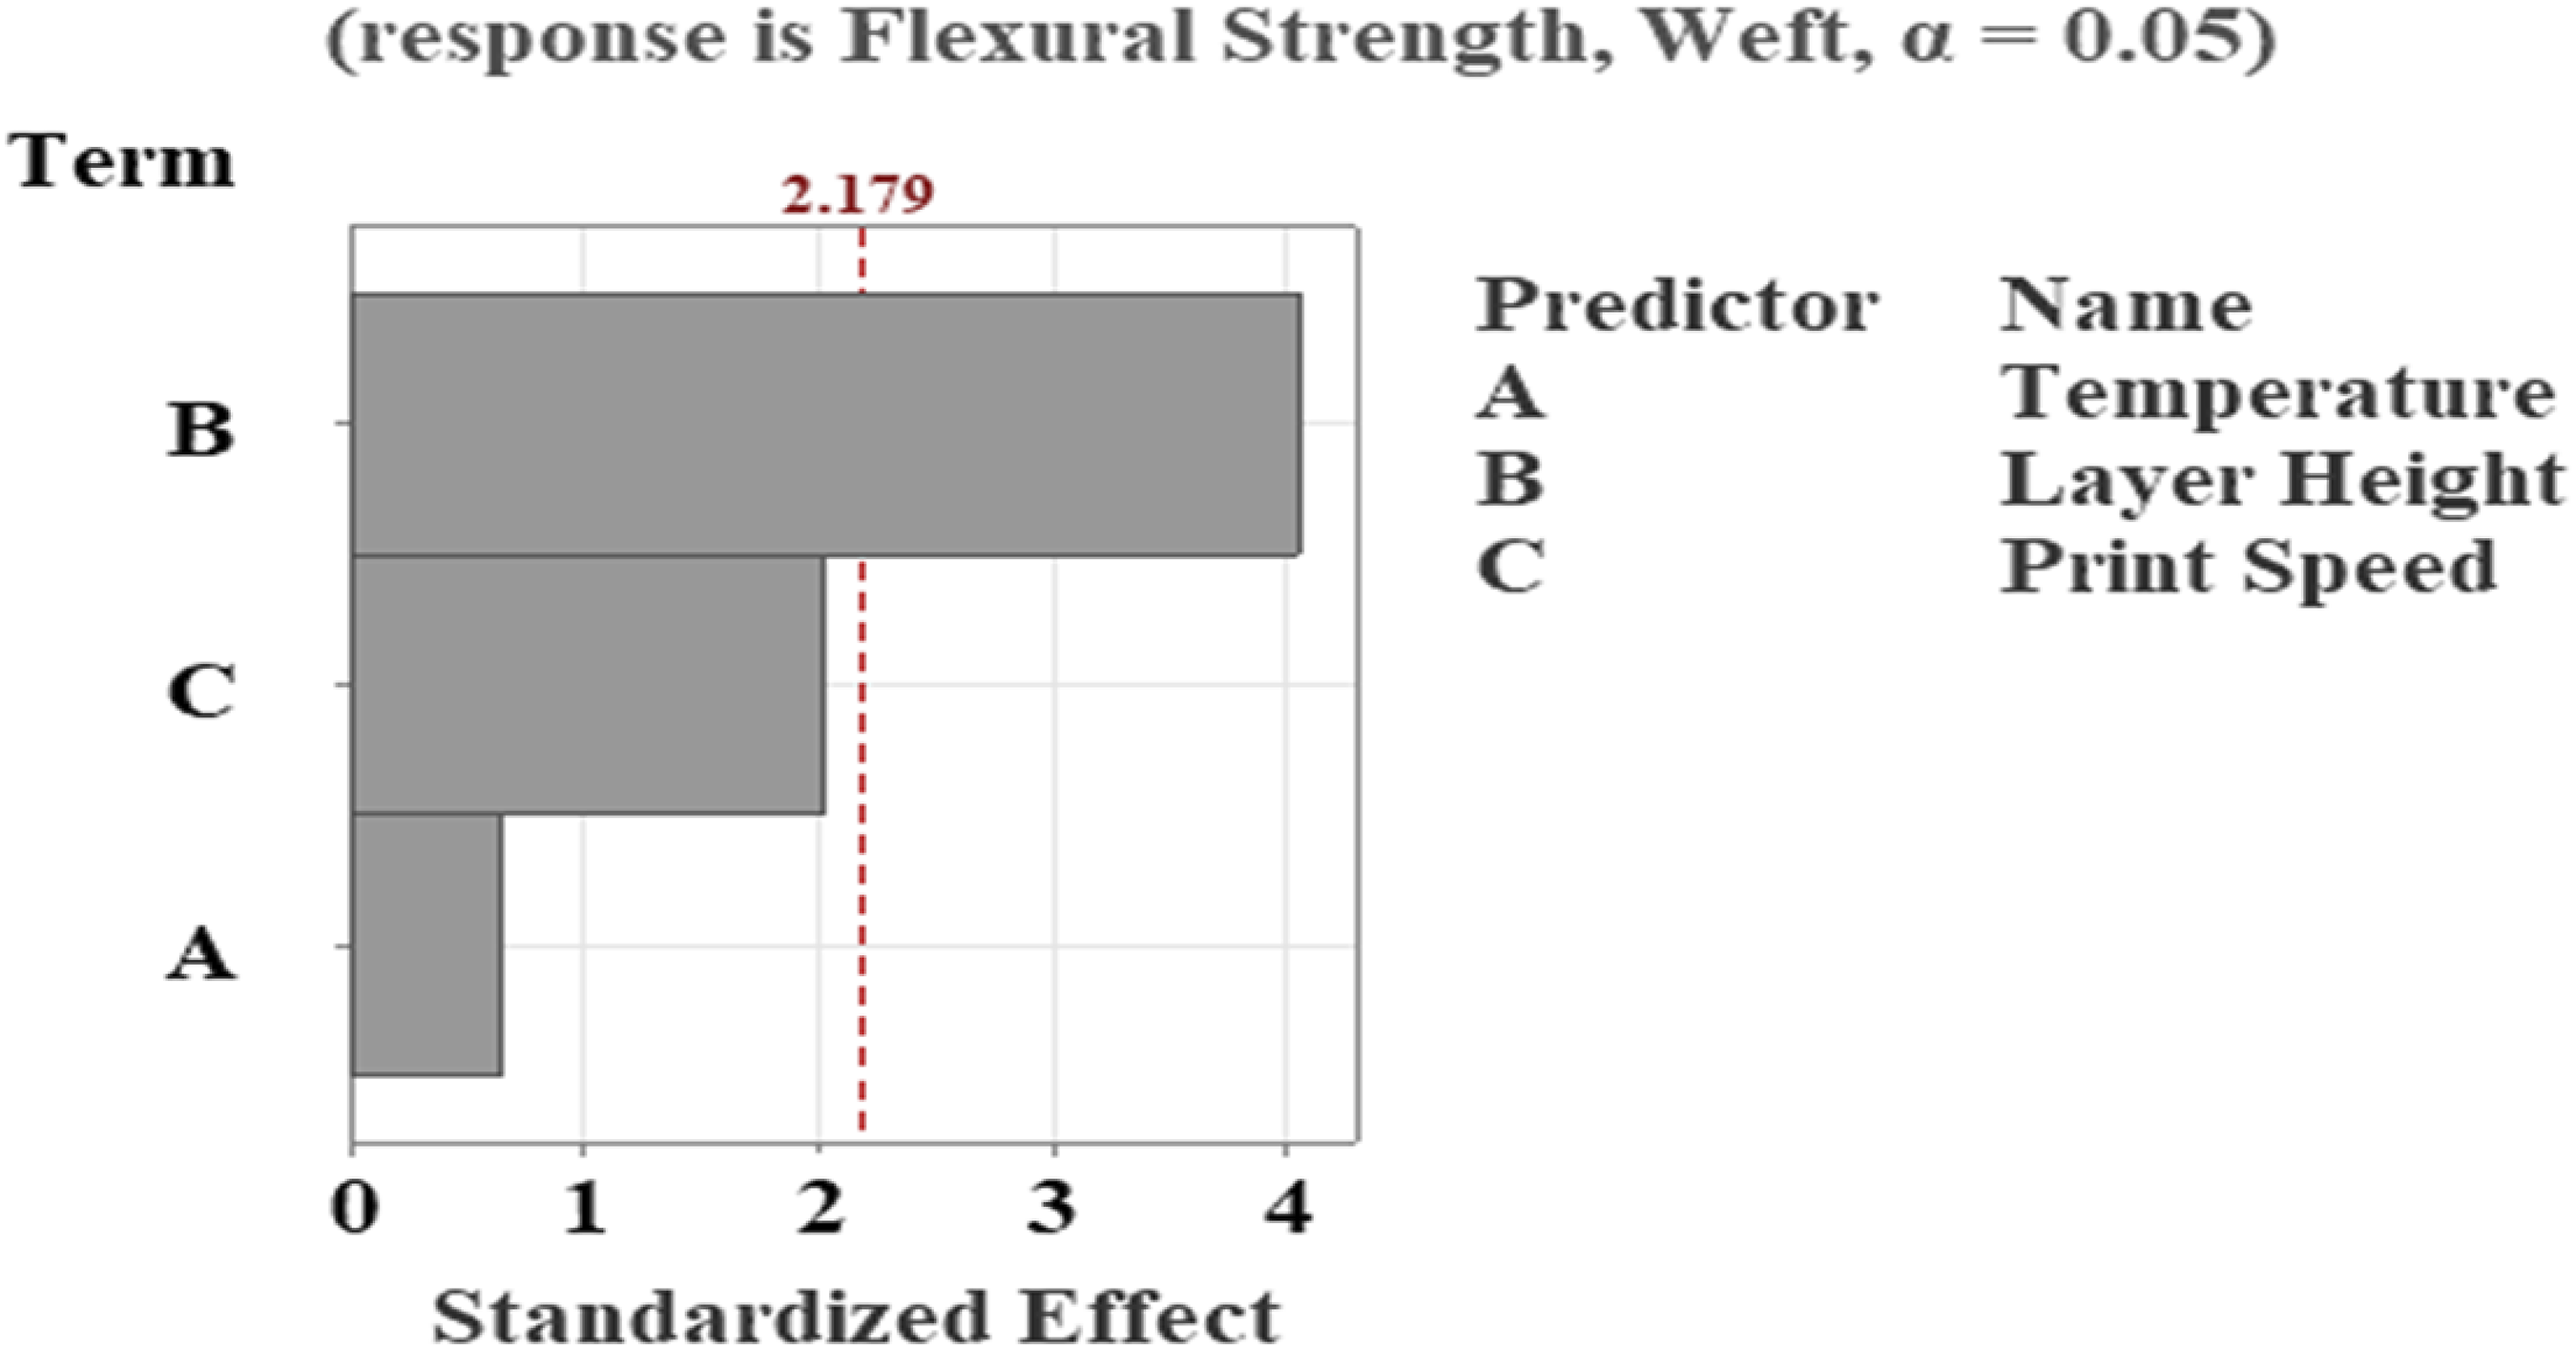
Pareto chart for the standard effects on flexural strength of fabric in weft direction.

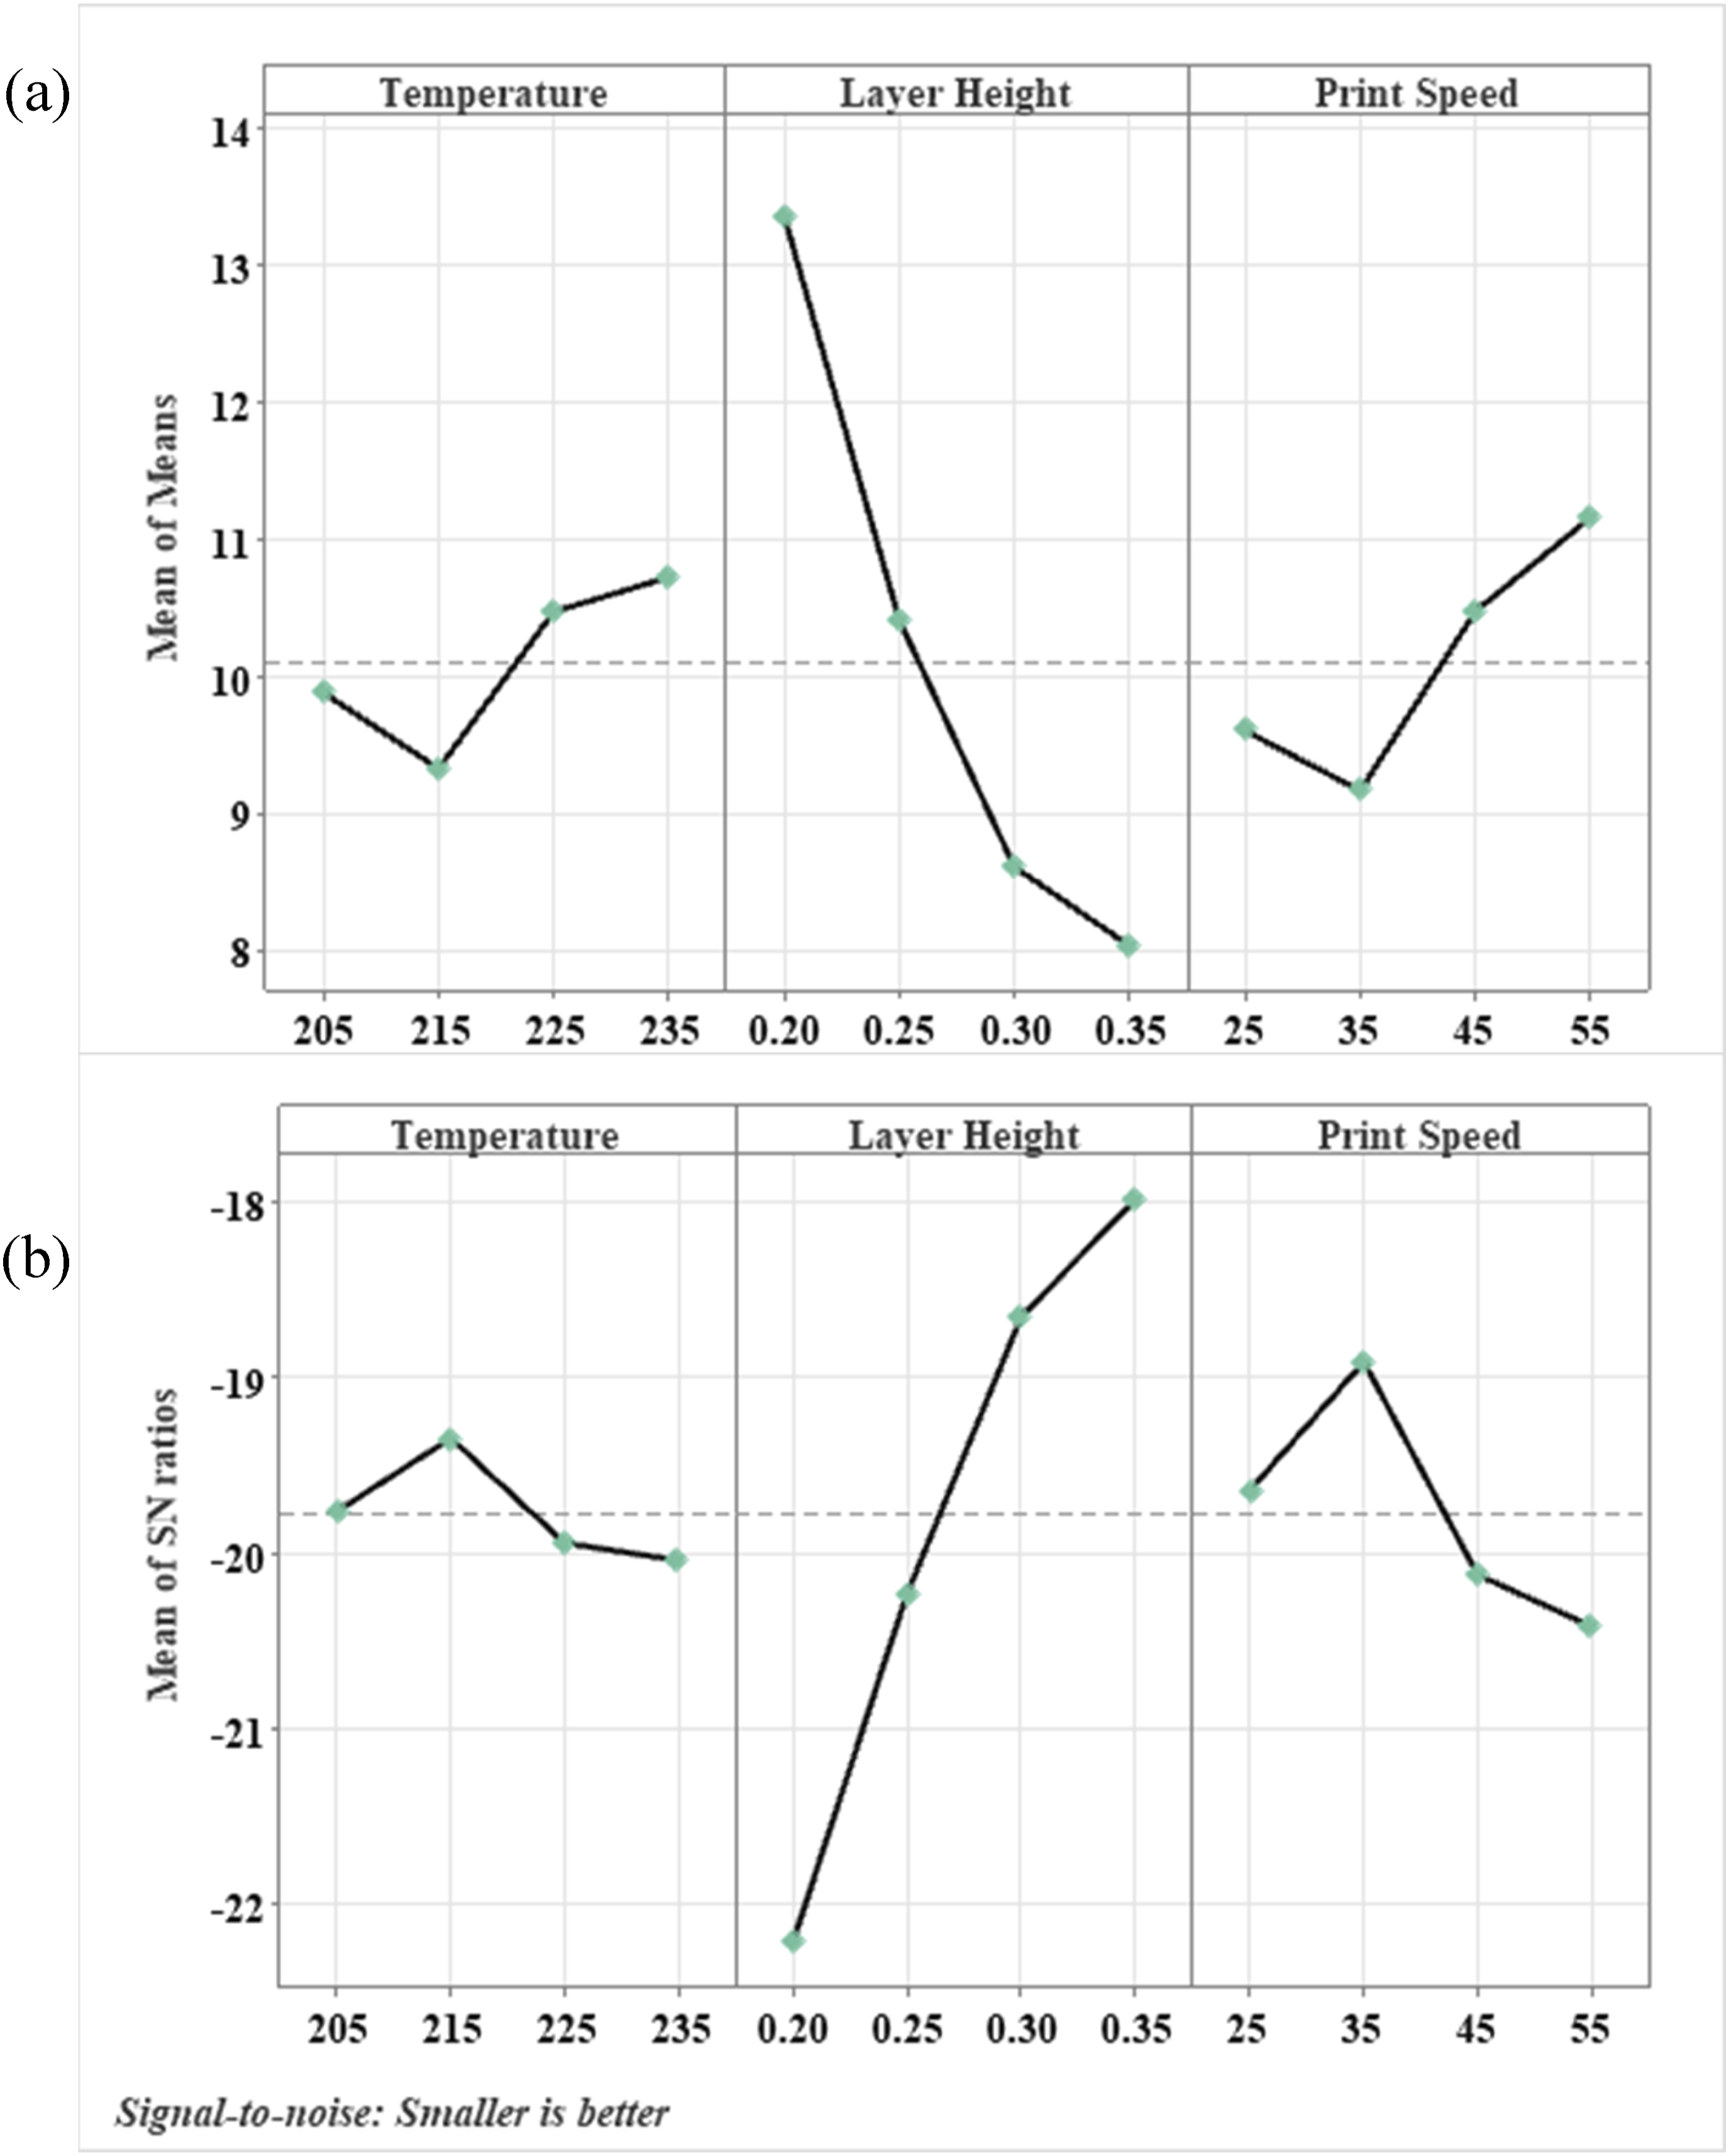
Main effect plots of flexural strength (KPa) of fabric in weft direction for (a) mean of means and (b) SN Ratio.
Response table for means of flexural modulus of fabric (MPa) in weft direction.


Pareto chart for the standard effects on flexural modulus of fabric in weft direction.
Main effect plots of flexural modulus (MPa) of fabric in weft direction for (a) mean of means and (b) SN Ratio.
Optimized parameters for mechanical properties
Optimized tensile and flexural properties of 2/1 twill fabric and process parameters associated with optimized properties.

The results demonstrate that print speed has the least effect on tensile and flexural properties of the structure. Either extrusion temperature or layer height causes the maximum amount of variation. The results also show that the mechanical behavior of the fabric, for both flexural and tensile loading, is considerably different in warp and weft directions. The results also show the noticeable difference in properties of individual yarn and fabric in warp direction. The optimized yarn tensile strength is reported as 50.8 MPa while the tensile strength for fabric is observed as 32.4 MPa. Similarly, the tensile modulus of yarn and fabric are reported to be 388.1 MPa and 874.3 MPa, respectively. The disparity in tensile properties between individual yarn and fabric sample is also reported in one of the earlier research work. 7 The main reason behind this effect is the distribution of load in fabric. The warp yarns are interlaced with weft yarns in the fabric structure which restricts the movement under load which results in a higher modulus in fabric as compared to yarns. Moreover, the results suggest that the optimized flexural strength is substantially lower than the optimized tensile strength; modulus follows the same trend. Tensile strength of fabric in warp direction is 32.456 MPa and flexural strength in warp direction is 1.69 MPa. The difference is observable in the weft direction as well.
Conclusions
This research aims to study the effect of FDM process parameters on mechanical behavior of 3D printed 2/1 twill fabric structures. It summarizes how extrusion temperature, layer height and print speed influence the performance of specimens under tensile and flexural load. Taguchi L16 orthogonal design table is used for experimental design and the results are statistically analyzed in MINITAB software for parameter optimization. The pareto chart for the parameters indicates that not all the factors are significantly important for every mechanical property evaluated. It is observed that the rank of the parameters may vary based on fabric direction (warp or weft direction) or the property being measured. In addition, the level of effect of the parameter can also be different for different property. This observation infers that the interaction between the parameters can also affect the properties of the sample. This could be potential future work in parametric study of 3D-printed fabrics. The current L16 design does not incorporate interaction effects of the parameters which might be important for a better understanding of mechanical properties. Hence, it is recommended to use other experimental design techniques like full factorial experiments in further analysis. The results presented in this work can be useful for selecting optimal parameters for manufacturing these structures. However, one should know that the optimized parameter setting is case specific: different settings for different responses. Nonetheless, this study can pave the way for additive manufacturing of woven fabric structures. Results from this study can be used to control the process parameters and understand the relation between FDM process and resulting part behavior. The study also incorporates the printing time of the part. Understanding of time taken to make a fabric sample and the parameter influencing the time can be significant information while manufacturing sustainable fabrics in commercial scale using FDM.
Footnotes
Acknowledgements
Authors would like to thank the Department of Mechanical Engineering, Auburn University, for supporting this research work. Additionally, authors would like to extend gratitude to Center for Polymers and Advanced Composites (CPAC) for the characterization facilities. We also thank Dr. Ramsis Farag for his assistance during the tensile and flexural test.
Funding
The authors received no financial support for the research, authorship, and/or publication of this article.
Declaration of conflicting interests
The authors declared no potential conflicts of interest with respect to the research, authorship, and/or publication of this article.
Data Availability Statement
The supporting data for the results presented in this article is available from the corresponding author upon request.