
Abstract
Fused Deposition Modeling (FDM) is a widely used additive manufacturing technology for polymer components due to its low cost, ease of processing, and material versatility. However, FDM-produced parts exhibit pronounced anisotropy in mechanical properties owing to interlayer adhesion variations, porosity, and thermal gradients. Polylactic acid (PLA), a biodegradable thermoplastic, is commonly employed in FDM applications, and its tensile strength is highly sensitive to printing parameters. In this study, the effects of printing speed (PS, 100–125–150 mm/s), occupancy (O, 50–75–100%), layer height (LH, 0.2–0.25–0.3 mm), wall thickness (WT, 0.8–1.2–1.6 mm), and nozzle temperature (NT, 175–200–225°C) on the tensile strength of PLA were systematically investigated. To efficiently explore this multi-parameter space, a Taguchi L27 experimental design was implemented, and the contribution and statistical significance of each factor were evaluated via ANOVA. Furthermore, machine-learning predictions were generated using linear and polynomial regression; ensemble tree-based methods (Random Forest and gradient boosting, e.g., XGBoost); artificial neural networks (MLP); kernel-based methods (SVR); instance-based methods (KNN); Gaussian Process Regression (GPR); and hybrid stacking models, all validated through cross-validation. The results of the ANOVA indicated that wall thickness was the most influential factor on tensile strength, contributing 58% of the variance, followed by printing speed, layer height, and infill density, while nozzle temperature, despite being statistically significant, had a limited practical effect. The optimal printing conditions, determined experimentally, were PS = 125 mm/s, O = 50%, LH = 0.3 mm, WT = 1.6 mm, and NT = 225°C. Notably, ensemble and neural network models, such as MLP, XGBoost, and gradient boosting achieved R2 values above 0.99, demonstrating high predictive accuracy and effectively capturing the complex relationships between process parameters and mechanical performance. This study provides a reliable and effective framework for optimizing the mechanical properties of FDM-printed PLA components and for advanced machine-learning-based predictions, thereby making a significant contribution to the additive manufacturing literature.
Keywords
Introduction
Among additive manufacturing technologies, Fused Deposition Modeling (FDM) is one of the most widely employed methods for polymer component fabrication due to its low-cost hardware and user-friendly processing characteristics.1,2 In addition, its broad material availability further contributes to its widespread adoption in both research and industrial applications. 3 However, FDM inherently involves processes such as pronounced thermal gradients, variable interlayer adhesion, and porosity formation, owing to its layer-by-layer fabrication principle. 4 These phenomena result in mechanical properties that are highly dependent on printing parameters and give rise to anisotropy in the structural integrity of printed parts. Consequently, ensuring the predictable and optimized performance of FDM-fabricated components necessitates a systematic analysis of process parameters.5,6
Polylactic acid (PLA) is among the most widely used thermoplastics in FDM owing to its biodegradable nature and ease of processing.7,8 Its relatively low melting temperature further enhances its suitability for material extrusion–based additive manufacturing. 9 The mechanical behavior of PLA, particularly its tensile strength, is directly influenced by key process parameters such as print speed (PS), extrusion temperature (ET), layer height (LH), wall thickness (WT), and nozzle temperature (NT). Variations in these parameters significantly affect melt rheology, interlayer fusion, and internal porosity. Consequently, the development of advanced methodologies for analyzing the process–microstructure–property relationships in PLA has been recognized as a critical research need in the literature.10,11 Several recent studies have further highlighted the importance of combining systematic experimental design with advanced modeling techniques to address these challenges.12,13 This growing consensus underscores the need for robust predictive frameworks capable of handling nonlinear parameter interactions. 14
Due to the highly multivariate nature of FDM, traditional single-factor experimental approaches are both costly and limited in scope.15,16 Therefore, the Taguchi design provides an efficient methodology for evaluating the simultaneous effects of multiple process parameters.17,18 In particular, the Taguchi L27 experimental layout enables the investigation of a five-parameter system across a broad design space, facilitating the identification of optimal parameter combinations.19,20 This structured approach allows for effective exploration of parameter interactions within a limited number of experiments. 21 Moreover, analysis of variance (ANOVA) serves as a critical complementary tool to determine the statistical significance and relative contributions of the parameters, thereby ensuring that the experimental outcomes are robust and statistically valid.22,23
However, the relationships between outputs and process parameters in FDM are often nonlinear, high-dimensional, and complex. Consequently, approaches relying solely on conventional statistical methods are insufficient for detailed modeling and accurate prediction of mechanical behavior. Recent studies have demonstrated that artificial intelligence (AI) and machine learning (ML)-based methods are highly effective in addressing these challenges.24,25 In particular, artificial neural networks (ANN), support vector regression (SVR), multilayer perceptrons (MLP), tree-based methods such as random forest (RF), XGBoost, gradient boosting (GB), and Gaussian process regression (GPR) have been widely employed for predicting mechanical performance in FDM processes. 26
Nonetheless, a significant portion of existing studies focuses on the performance of individual ML models, while systematic comparisons across different model families remain limited. Furthermore, the application of ensemble techniques such as stacking or the development of residual-based hybrid models has received relatively little attention in the literature. In addition, studies that integrate comprehensive machine learning frameworks with classical statistical approaches such as Taguchi–ANOVA are notably scarce.27,28
Therefore, the present study comprehensively addresses the tensile behavior of PLA from both experimental and computational perspectives, aiming to fill the gaps identified in the existing literature. Within this framework, five key process parameters—print speed (PS), occupancy (O), layer height (LH), wall thickness (WT), and nozzle temperature (NT)—were systematically investigated using a Taguchi L27 experimental design.27,28 Analysis of Variance (ANOVA) was employed to determine the statistical significance and contribution ratios of the investigated parameters. In parallel, a machine learning-based predictive framework encompassing a broad range of models was developed using the experimental dataset.29,30 The evaluated models included linear and polynomial regression approaches, as well as tree-based ensemble methods such as random forest (RF), extra trees (ET), gradient boosting (GB), AdaBoost, and XGBoost.31,32 In addition, core- and neighborhood-based regression techniques, including multilayer perceptron (MLP), support vector regression (SVR), and k-nearest neighbors (KNN), were implemented to capture nonlinear relationships.33,34 Finally, advanced modeling strategies based on Gaussian Process Regression (GPR), multilayer stacking regression, and an XGBoost-based residual hybrid model (XGB + MLP_residual) were employed to enhance predictive robustness and generalization capability.35,36
Through this multilayered approach, the nonlinear relationships inherent in FDM processes were comprehensively captured across different model families, enabling the identification of the model that provides the highest predictive accuracy for PLA tensile strength.
The findings of this study are expected to make a significant contribution to the literature by supporting process optimization, enabling more reliable design strategies, and facilitating the development of data-driven manufacturing approaches for PLA materials.
Materials and methods
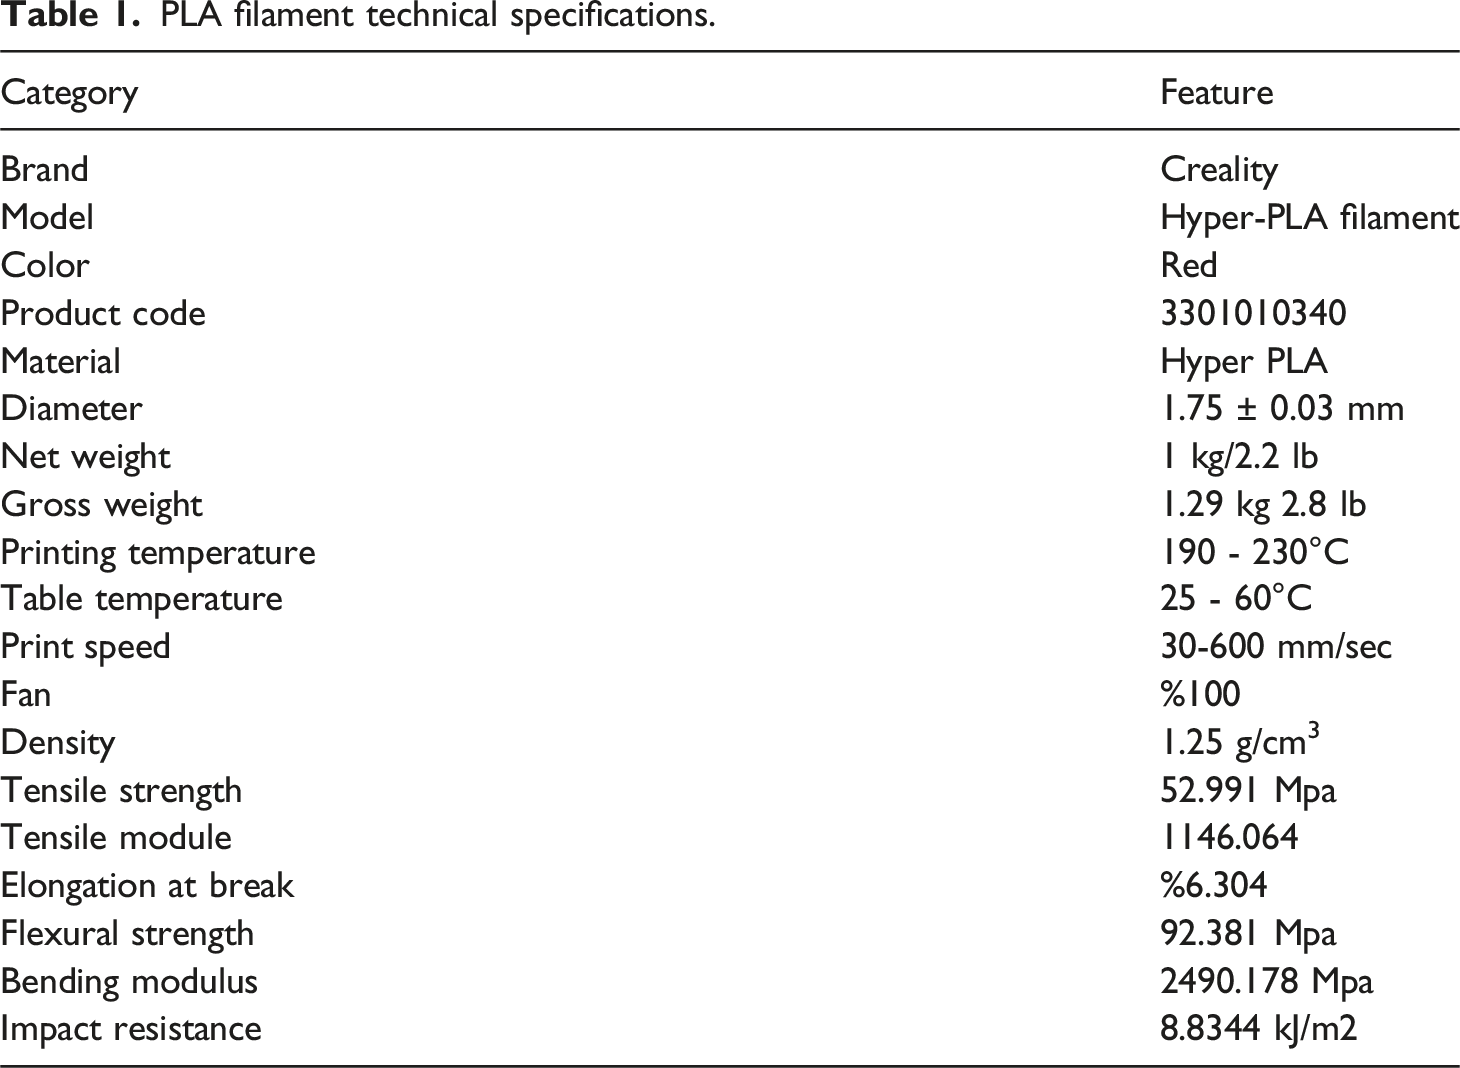
PLA filament technical specifications.
Tensile specimens were fabricated via FDM in accordance with the ASTM D638 standard. The FDM process involves heating the thermoplastic filament within a nozzle and depositing the molten material layer by layer along predefined paths. The specimens were designed in a CAD environment with geometric features defined according to ASTM D638 and subsequently exported in STL format for fabrication.37,38 This workflow, including digital design and file preparation prior to printing, is consistent with commonly adopted practices reported in the literature.39,40 The use of standardized specimen geometry ensures reproducibility and comparability of tensile test results.
The obtained STL files were imported into slicing software, where manufacturing parameters such as PS, O, LH, WT, and NT were defined. The model was then divided into layers, and the corresponding G-code was generated for the printer. The printer fabricated the specimens by melting the material at the specified temperature, speed, and layer thickness.
A total of 81 tensile specimens were fabricated according to the parameter combinations defined in the experimental design and prepared for mechanical testing.
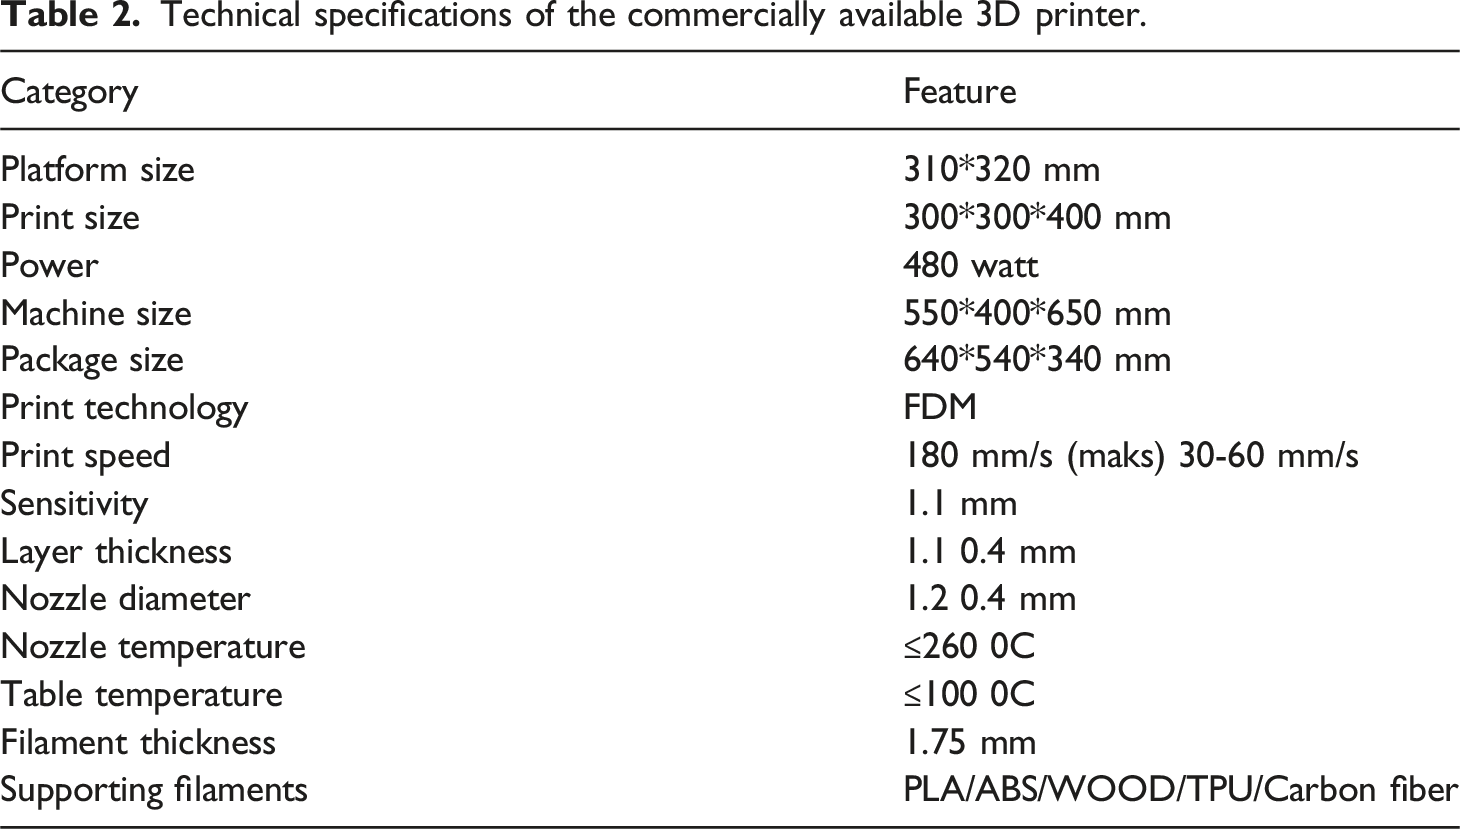
Technical specifications of the commercially available 3D printer.
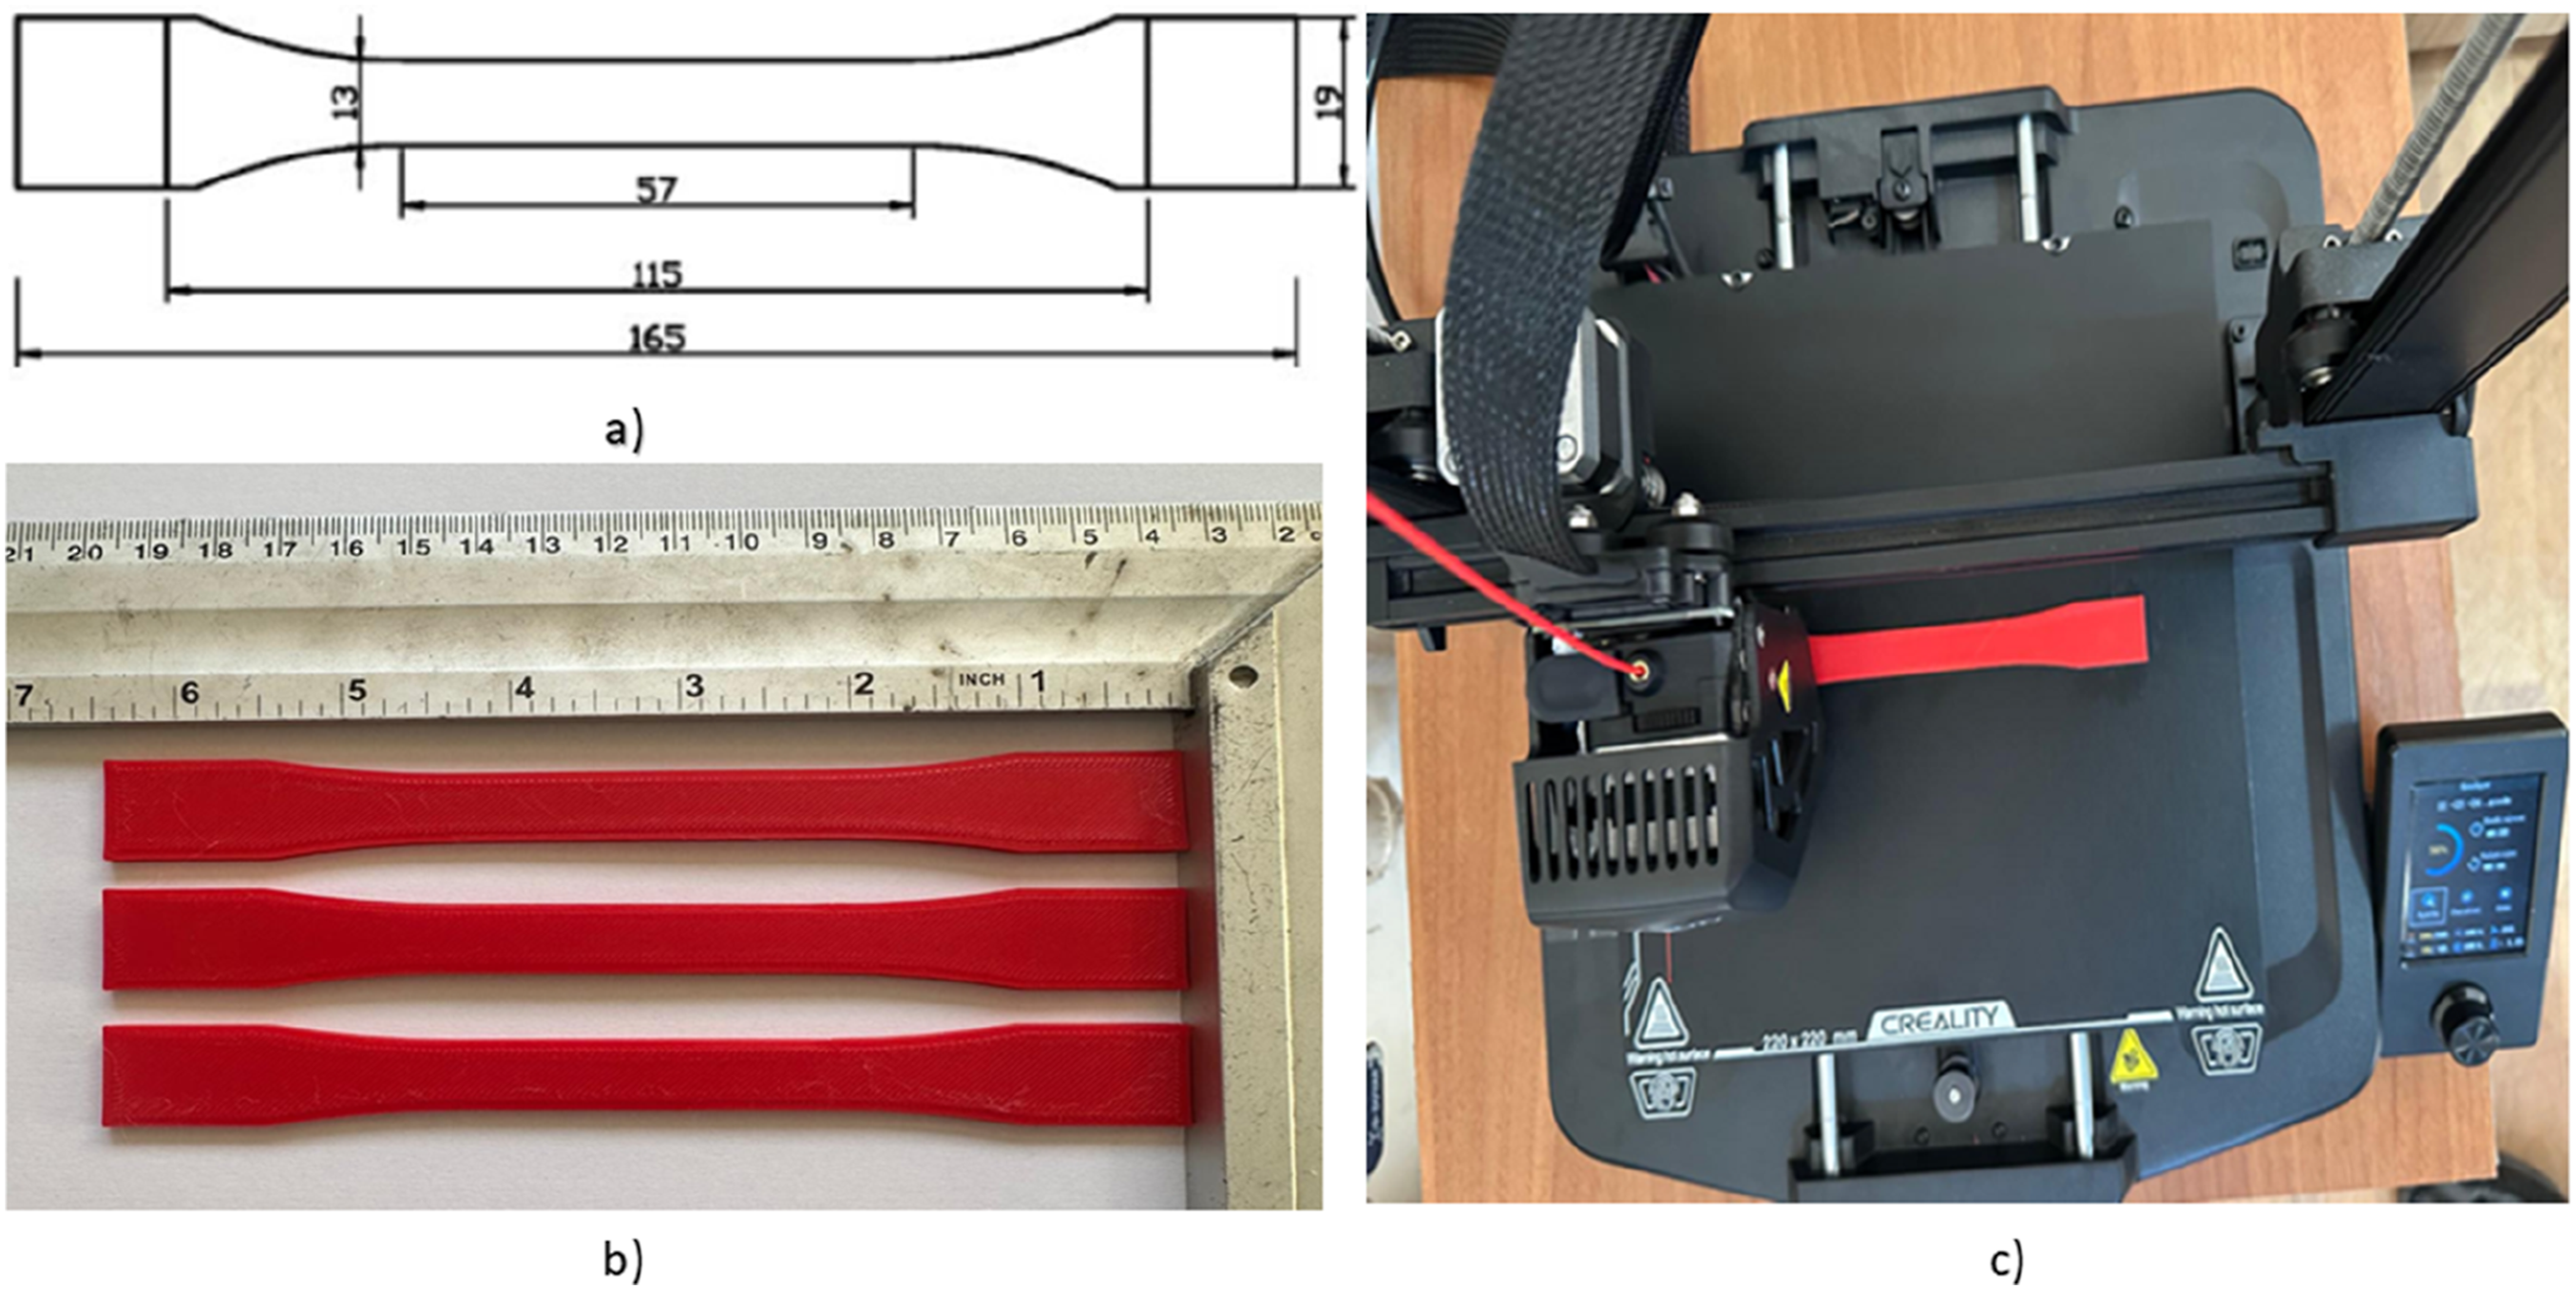
(a) Technical drawing according to ASTM D638, (b) selected tensile specimens fabricated from PLA, (c) Creality 3D printer.
Dataset and experimental design
Levels and factors.
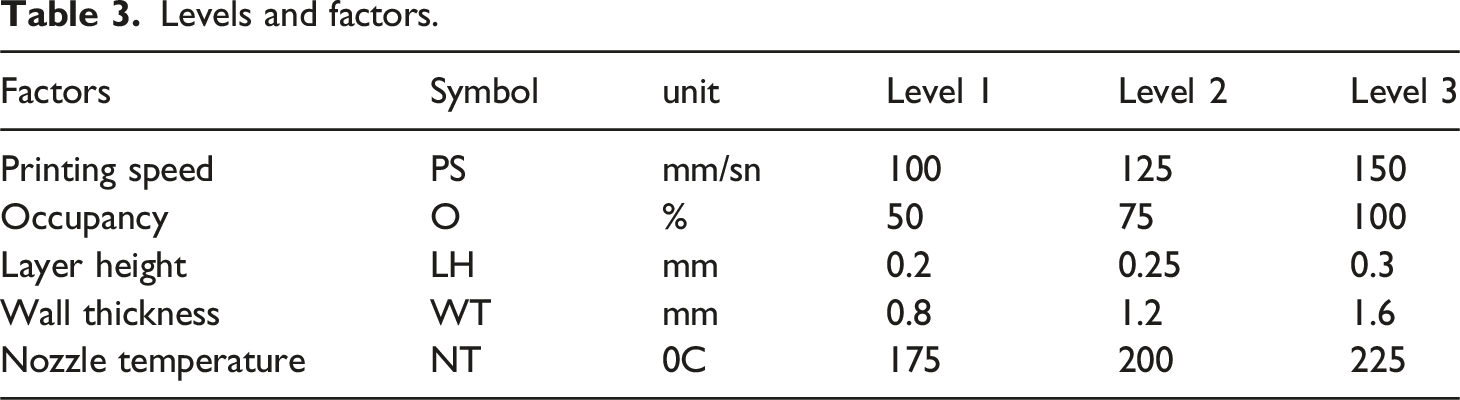
Sample dimensions were determined using the Taguchi method.
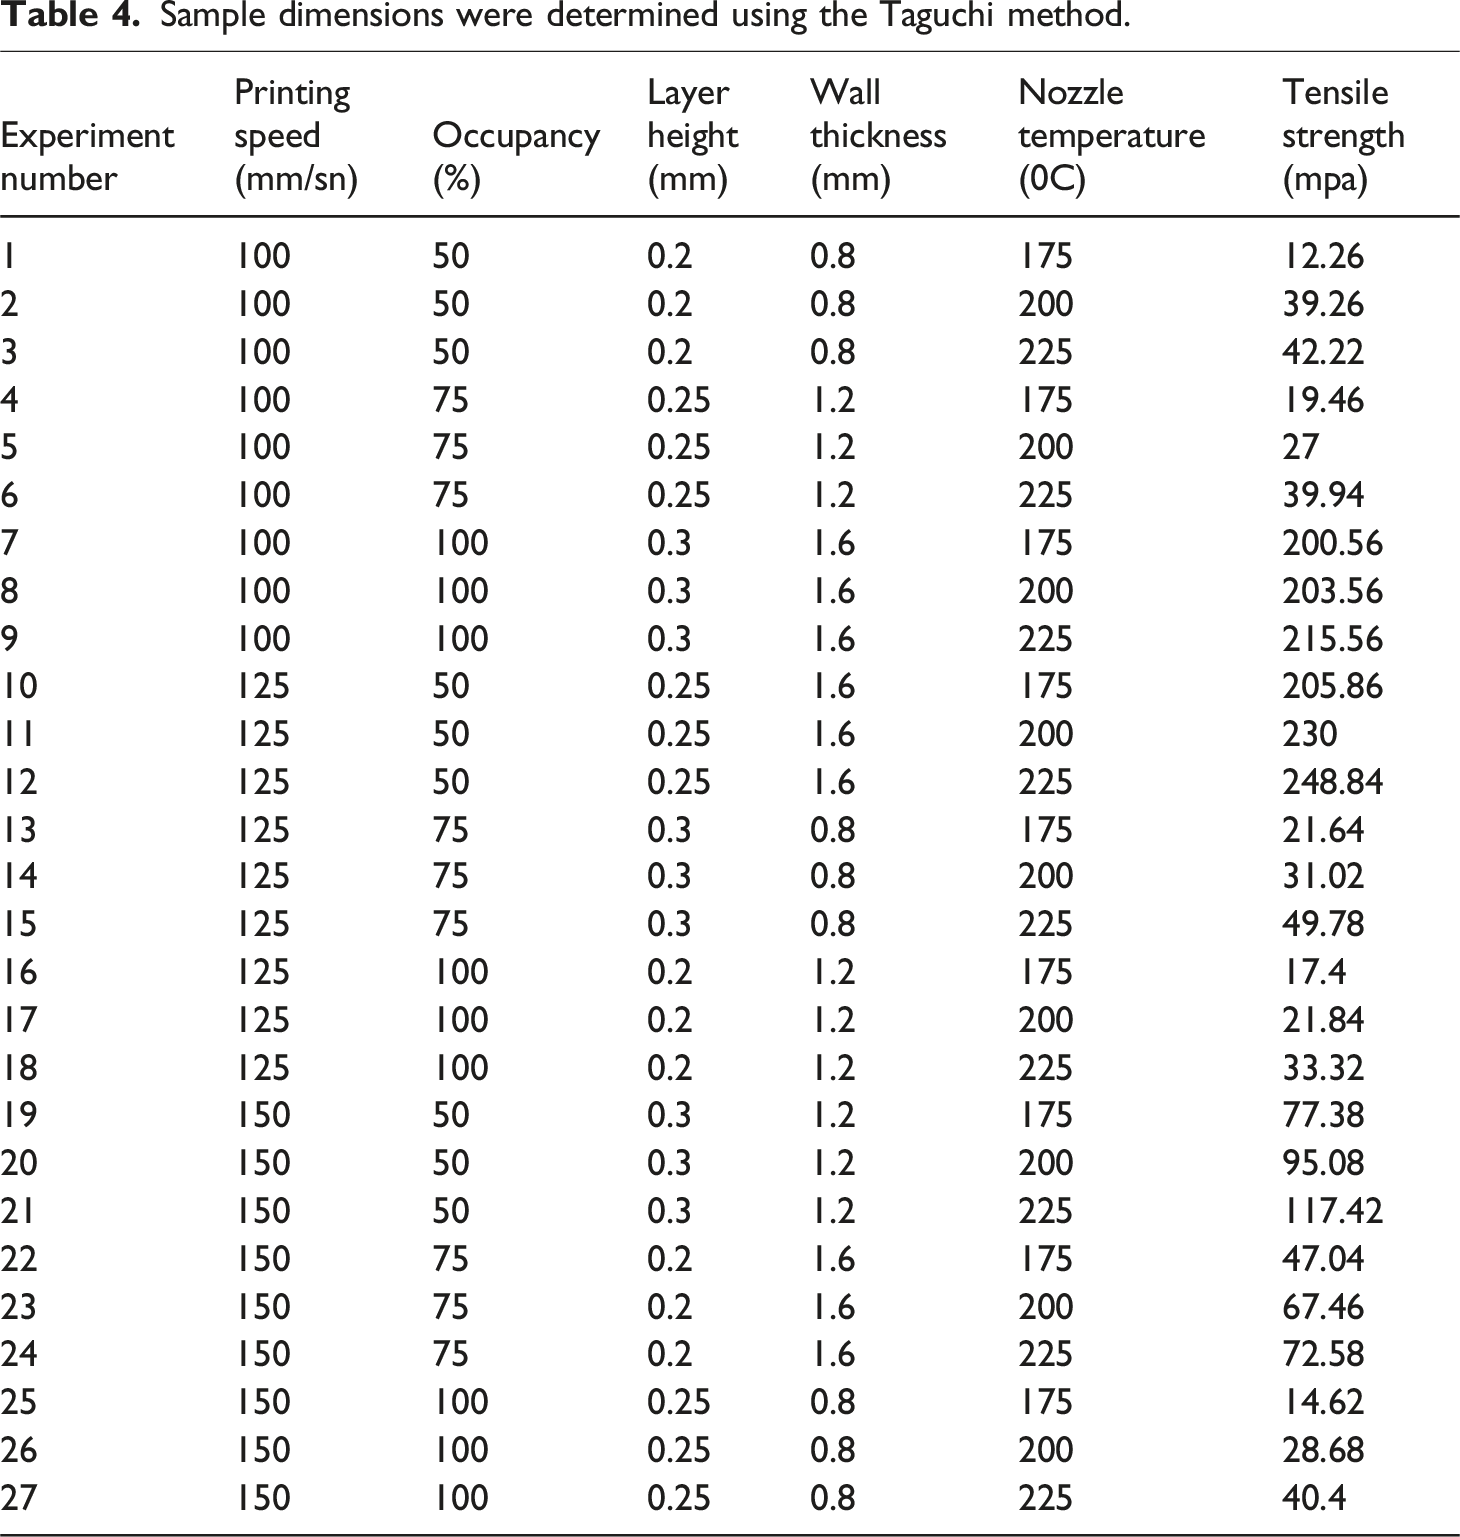
The Taguchi L27 orthogonal array was employed as an efficient experimental framework to investigate the effects of five printing parameters at three levels. Although the Taguchi method does not explicitly model higher-order interactions, the L27 design enables indirect assessment of low-order interactions among key parameters, such as wall thickness (WT), layer height (LH), and occupancy (O), through systematic level-wise variation. The very low residual error (0.35%) and high coefficient of determination (R2 = 99.65%) indicate that the dominant variance in tensile strength is adequately explained within this framework. Moreover, the inherent nonlinearities and interaction effects of the FDM process were explicitly captured using complementary machine learning models, including XGBoost, Gradient Boosting, and MLP, all of which achieved high predictive accuracy (R2 > 0.99). The strong performance of the second-order polynomial model further suggests that the system behavior is primarily governed by low-order nonlinear interactions, supporting the adequacy of the Taguchi L27 design for the present study.
Descriptive statistics and Pearson correlation analysis indicated that LH and PS significantly influence tensile strength, whereas NT has a more limited effect.
Variance analysis
Analysis of variance.
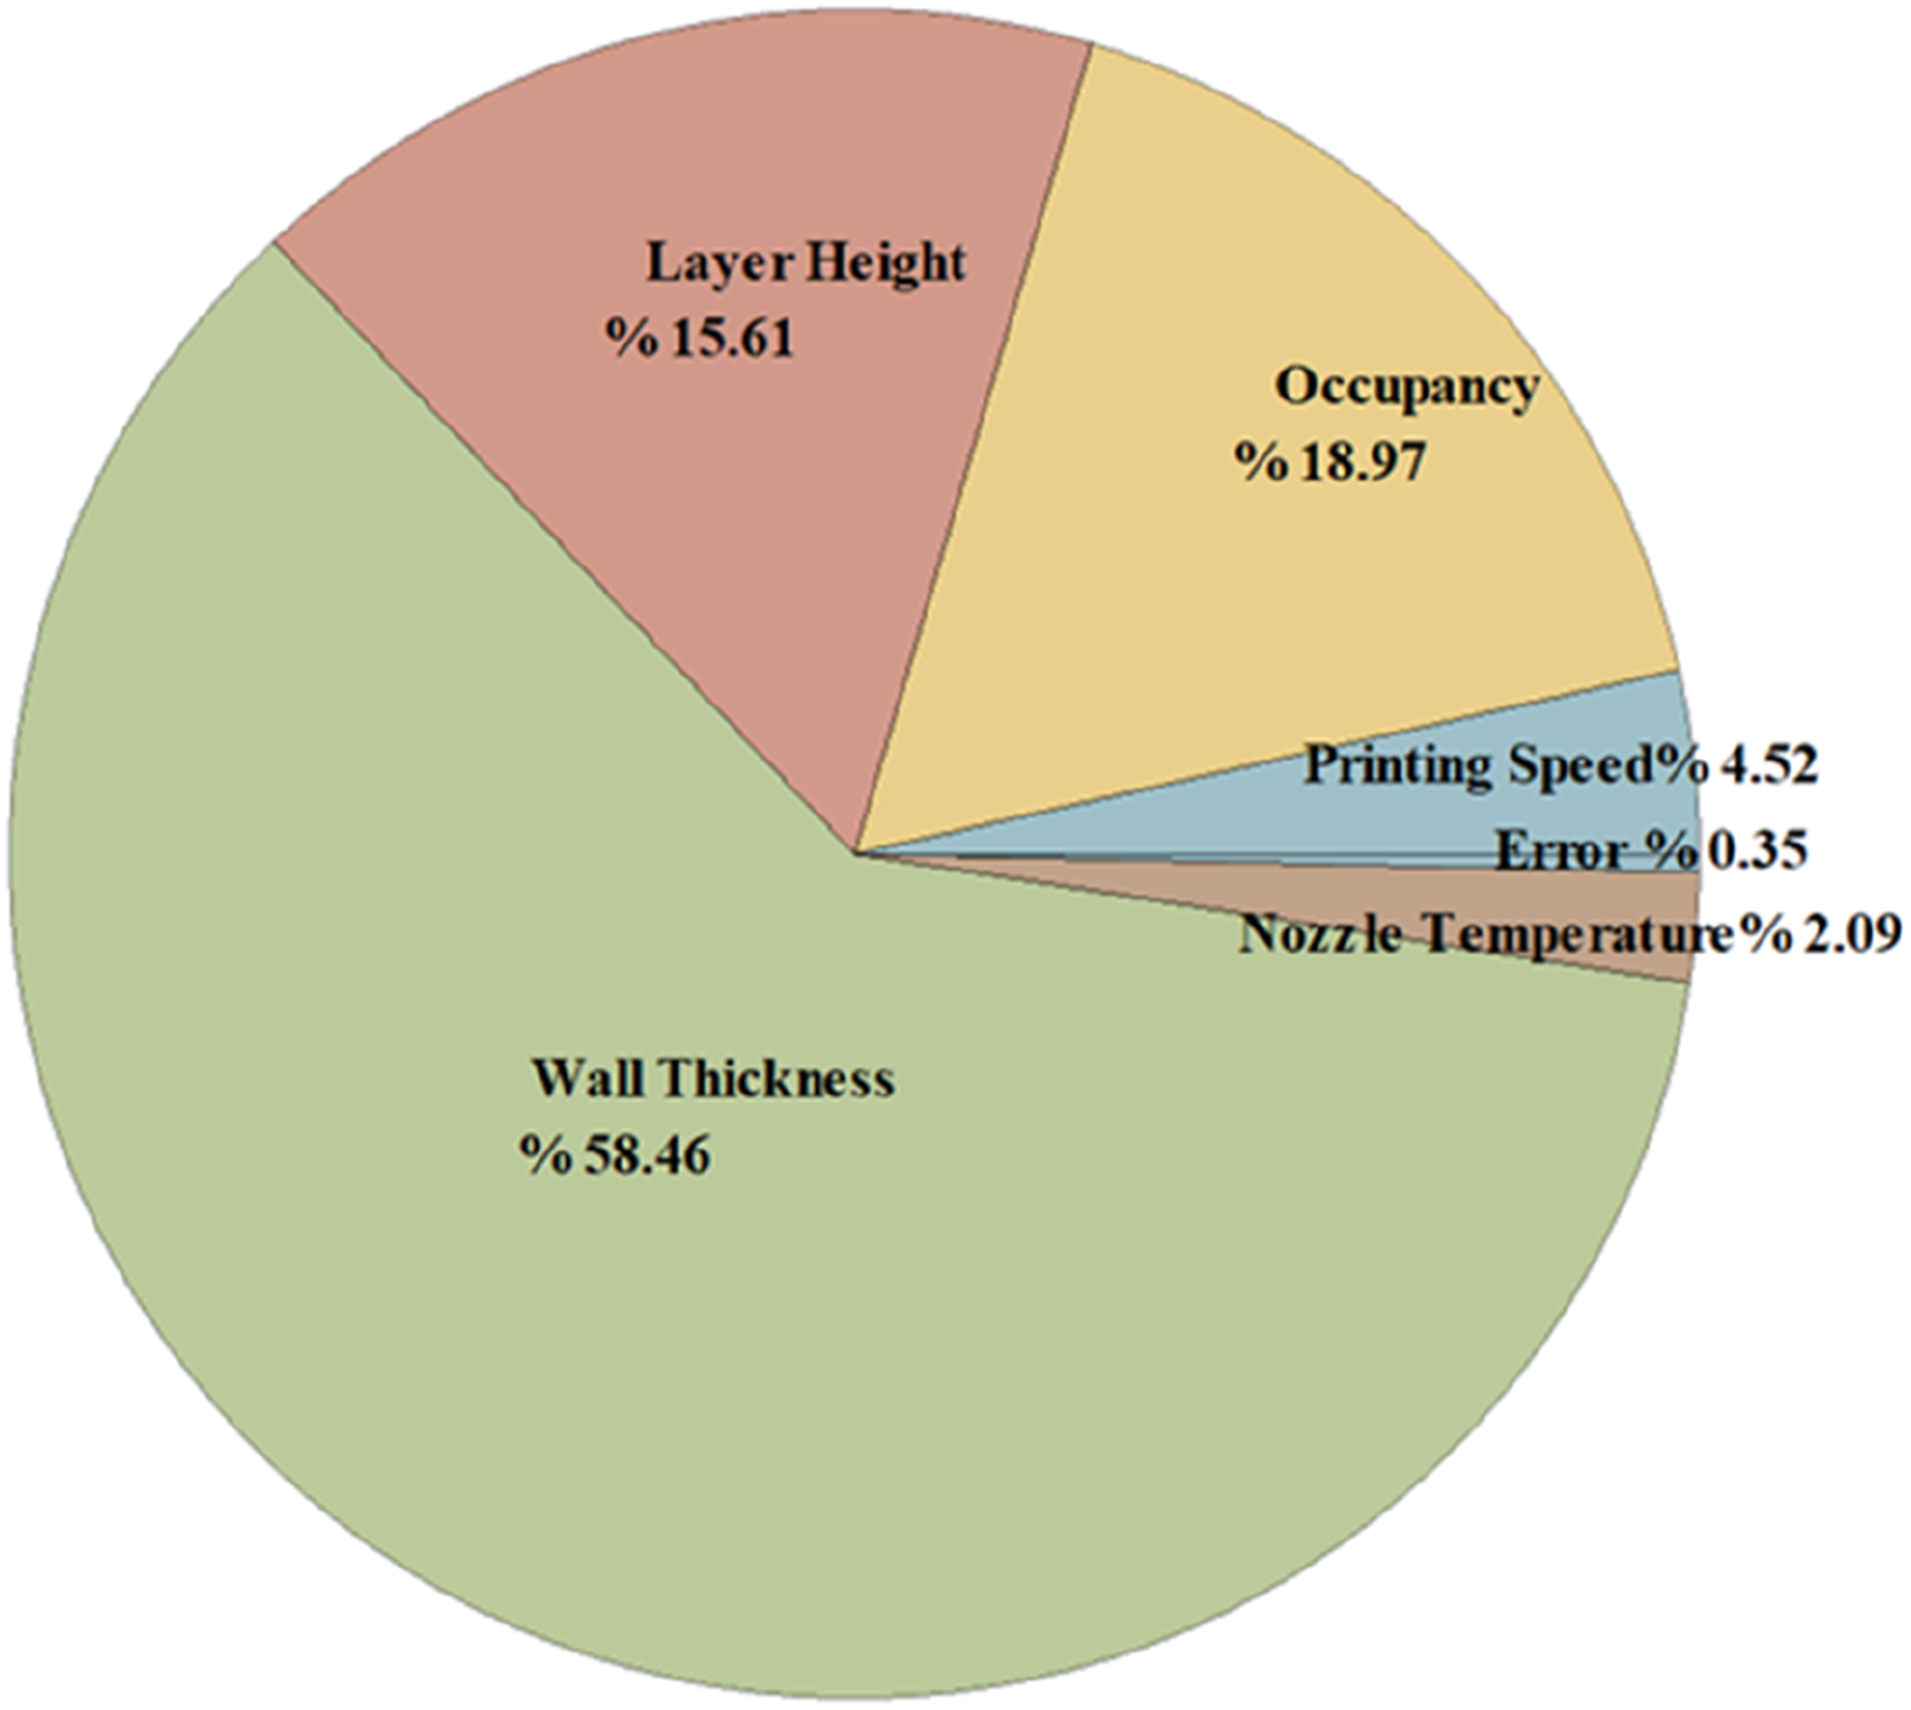
Variance Analysis graph for Tensile Strength Printing Speed, Occupancy, Layer Height, Wall Thickness, Nozzle Temperature.
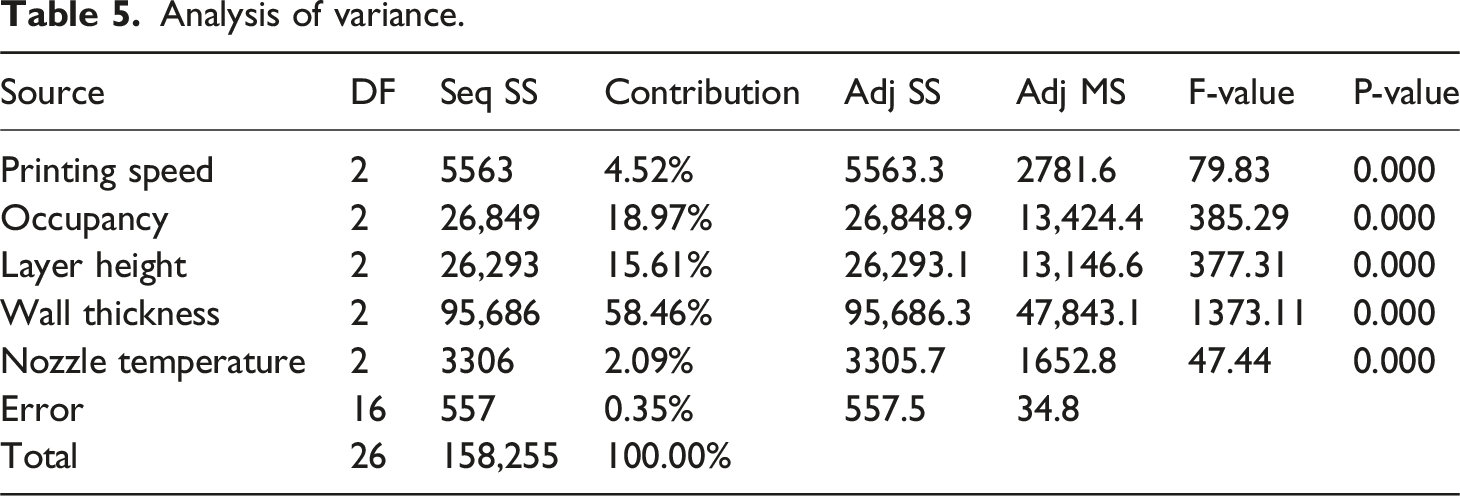
Figure 2 illustrates the percentage contributions of the 3D printing parameters to the results. According to the analysis, WT was the dominant parameter, contributing 58.46%, followed by O (18.97%) and LH (15.61%). The very low error percentage (0.35%) confirms the reliability of the model.
The ANOVA results indicated that the effects of the factors on tensile strength were statistically significant (p < .05). All five factors (PS, O, LH, WT, and NT) had a highly significant effect on the response variable (p < .001). The F-values revealed that WT (F = 1373.11) was the dominant parameter, while O (F = 385.29) and LH (F = 377.31) had similar magnitudes of effect. The mean square of the error term (Adj MS = 34.8) was low, confirming the model’s high explanatory power (R2 ≈ 99.65%).
Coefficients.
Response table for means.
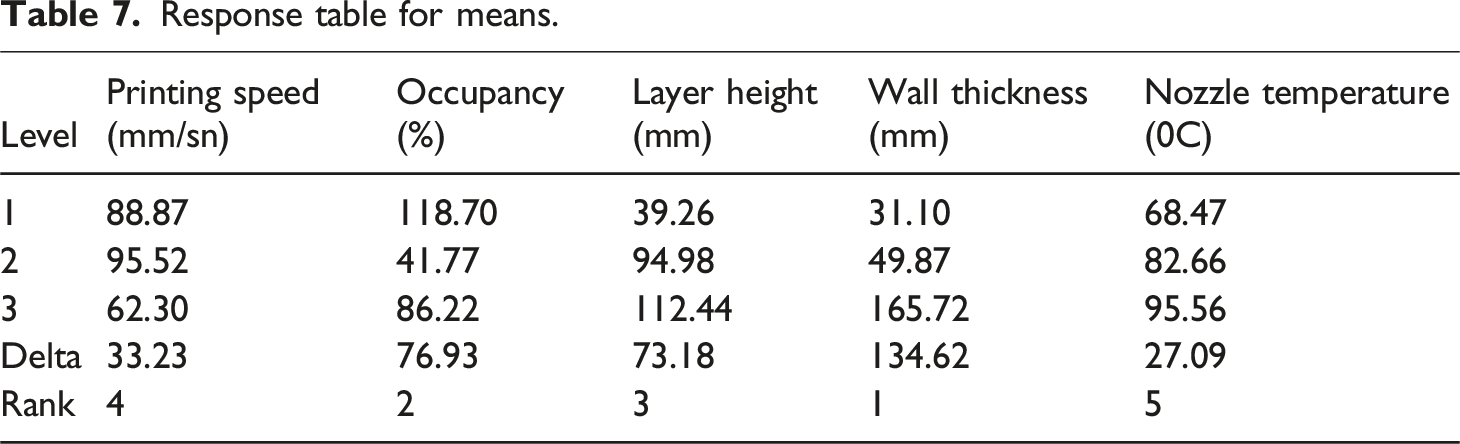
According to Nirmala, 43 the largest S/N ratio yields better results. The response table created according to this principle is shown in Table 7.
Method 1: Small is better. In this method, the aim is to minimize the result, and equation (1) presents the calculation used for this purpose.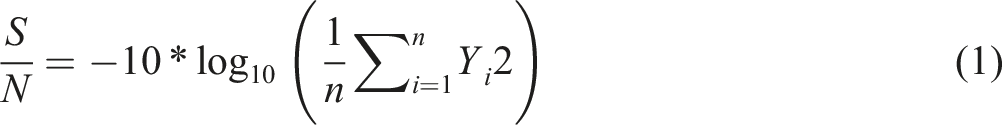
Method 2: Nominal best. In this method, the aim is to reduce the variability outside the intended result, and equation (2) is used for the calculation.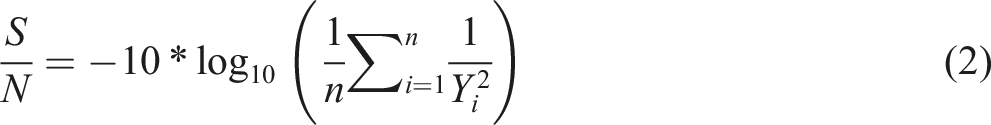
Method 3: A bigger object is better. In this method, the objective is to maximize the result; equation (3) is used for the calculation.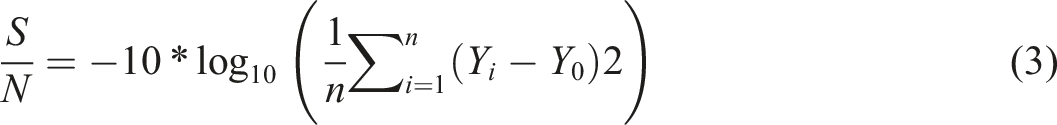
Table of results showing the S/N ratios for compressive strength (larger is better).
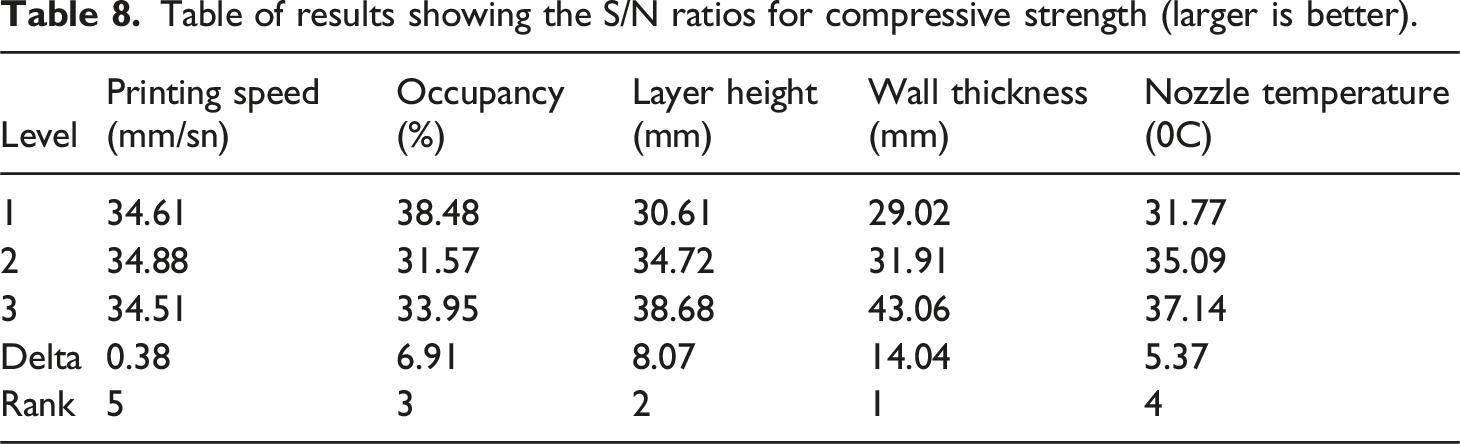
Figure 3 illustrates the main effects of the five factors (PS, O, LH, WT, NT) on tensile strength in the ANOVA model. WT was identified as the dominant factor, with the mean tensile strength increasing from approximately 30 MPa to approximately 165 MPa as its level rose from 0.8 to 1.6. LH and NT also exhibited positive effects as their levels increased, whereas the effects of PS and O were nonlinear and relatively smaller than those of the other factors. Results table showing S/N ratios for tensile strength with respect to PS, O, LH, WT, and NT.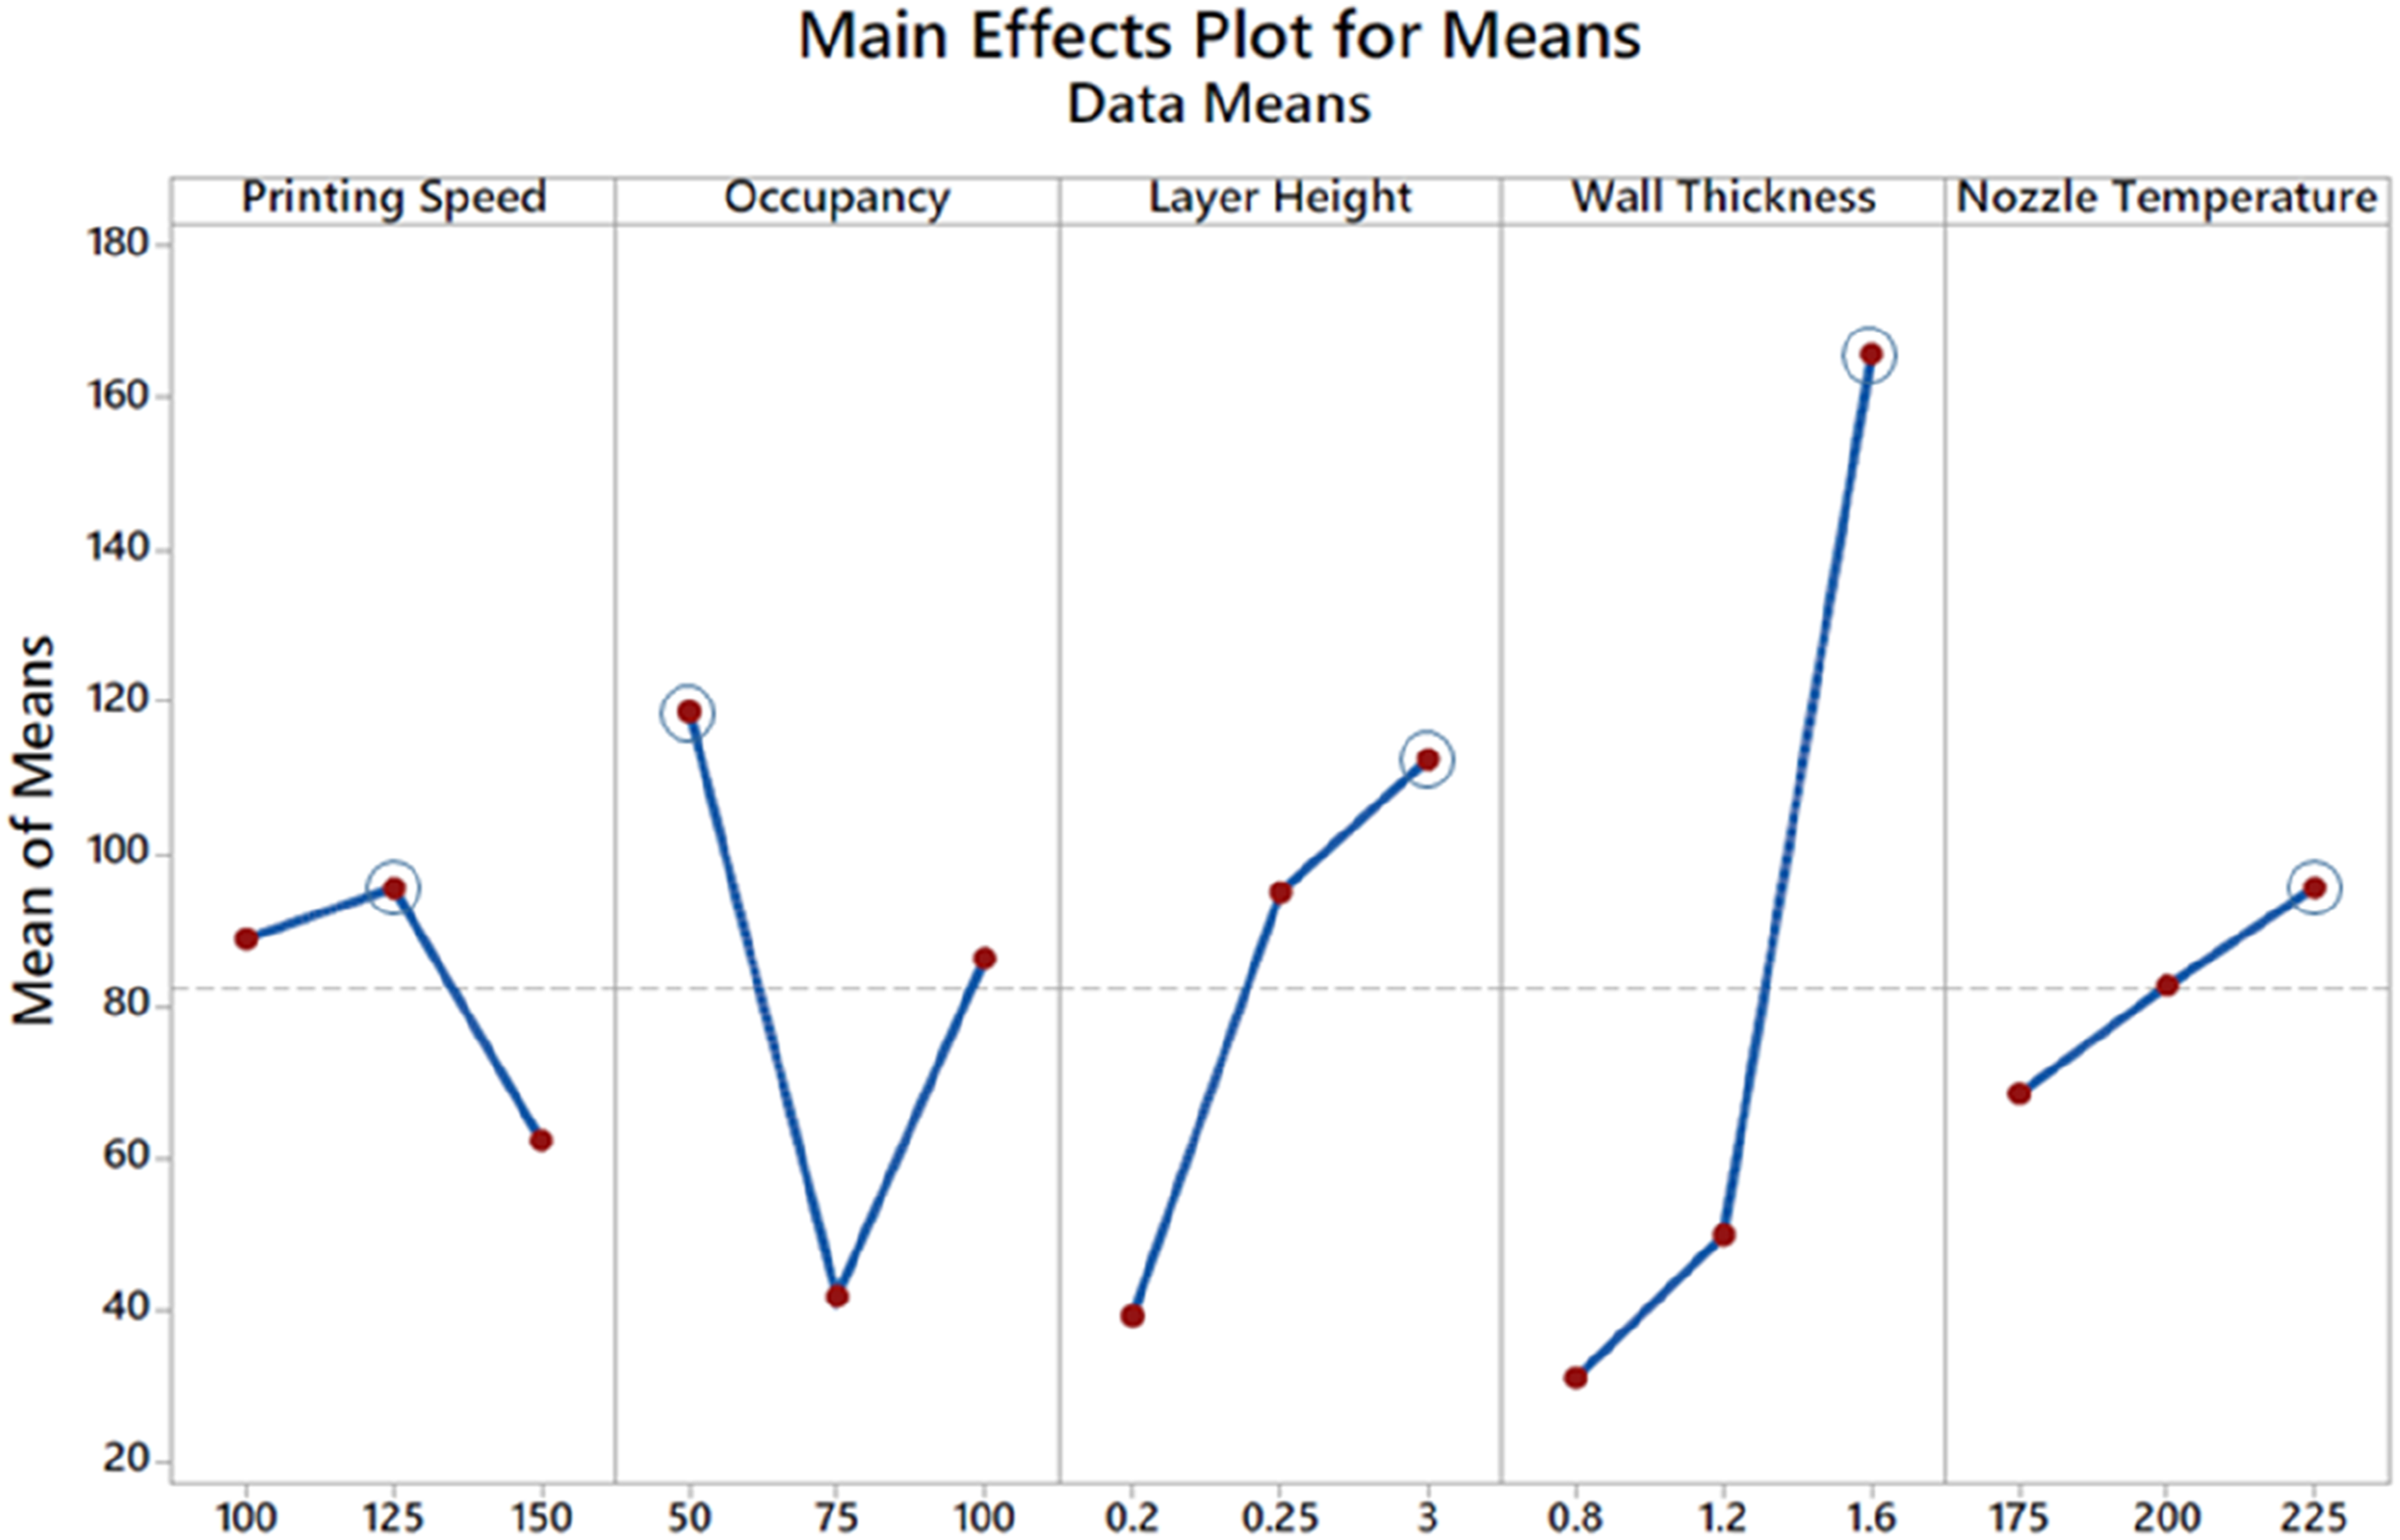
Model summary.
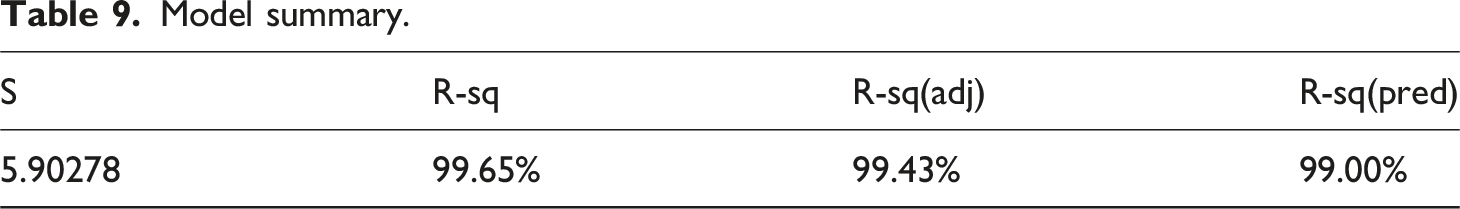
As shown in Table 9, the coefficient of determination (R2) reached a value of 99.65%, indicating a strong agreement between the experimental results and the Taguchi-based predictions. Similar levels of high predictive accuracy have been reported in studies on additively manufactured sandwich composite plates, where Taguchi-based modeling yielded robust correlations between process parameters and mechanical responses.46,47 Comparable high R2 values obtained using statistical and hybrid modeling approaches further support the reliability of such predictive frameworks in additive manufacturing applications.48,49 The consistency of these findings with broader experimental and numerical investigations reported in the literature reinforces the robustness of the present model.50,51 This strong agreement between predicted and experimental values is visually illustrated in Figure 4 and aligns well with previously reported validation results.52,53 Response of tensile strength (MPa).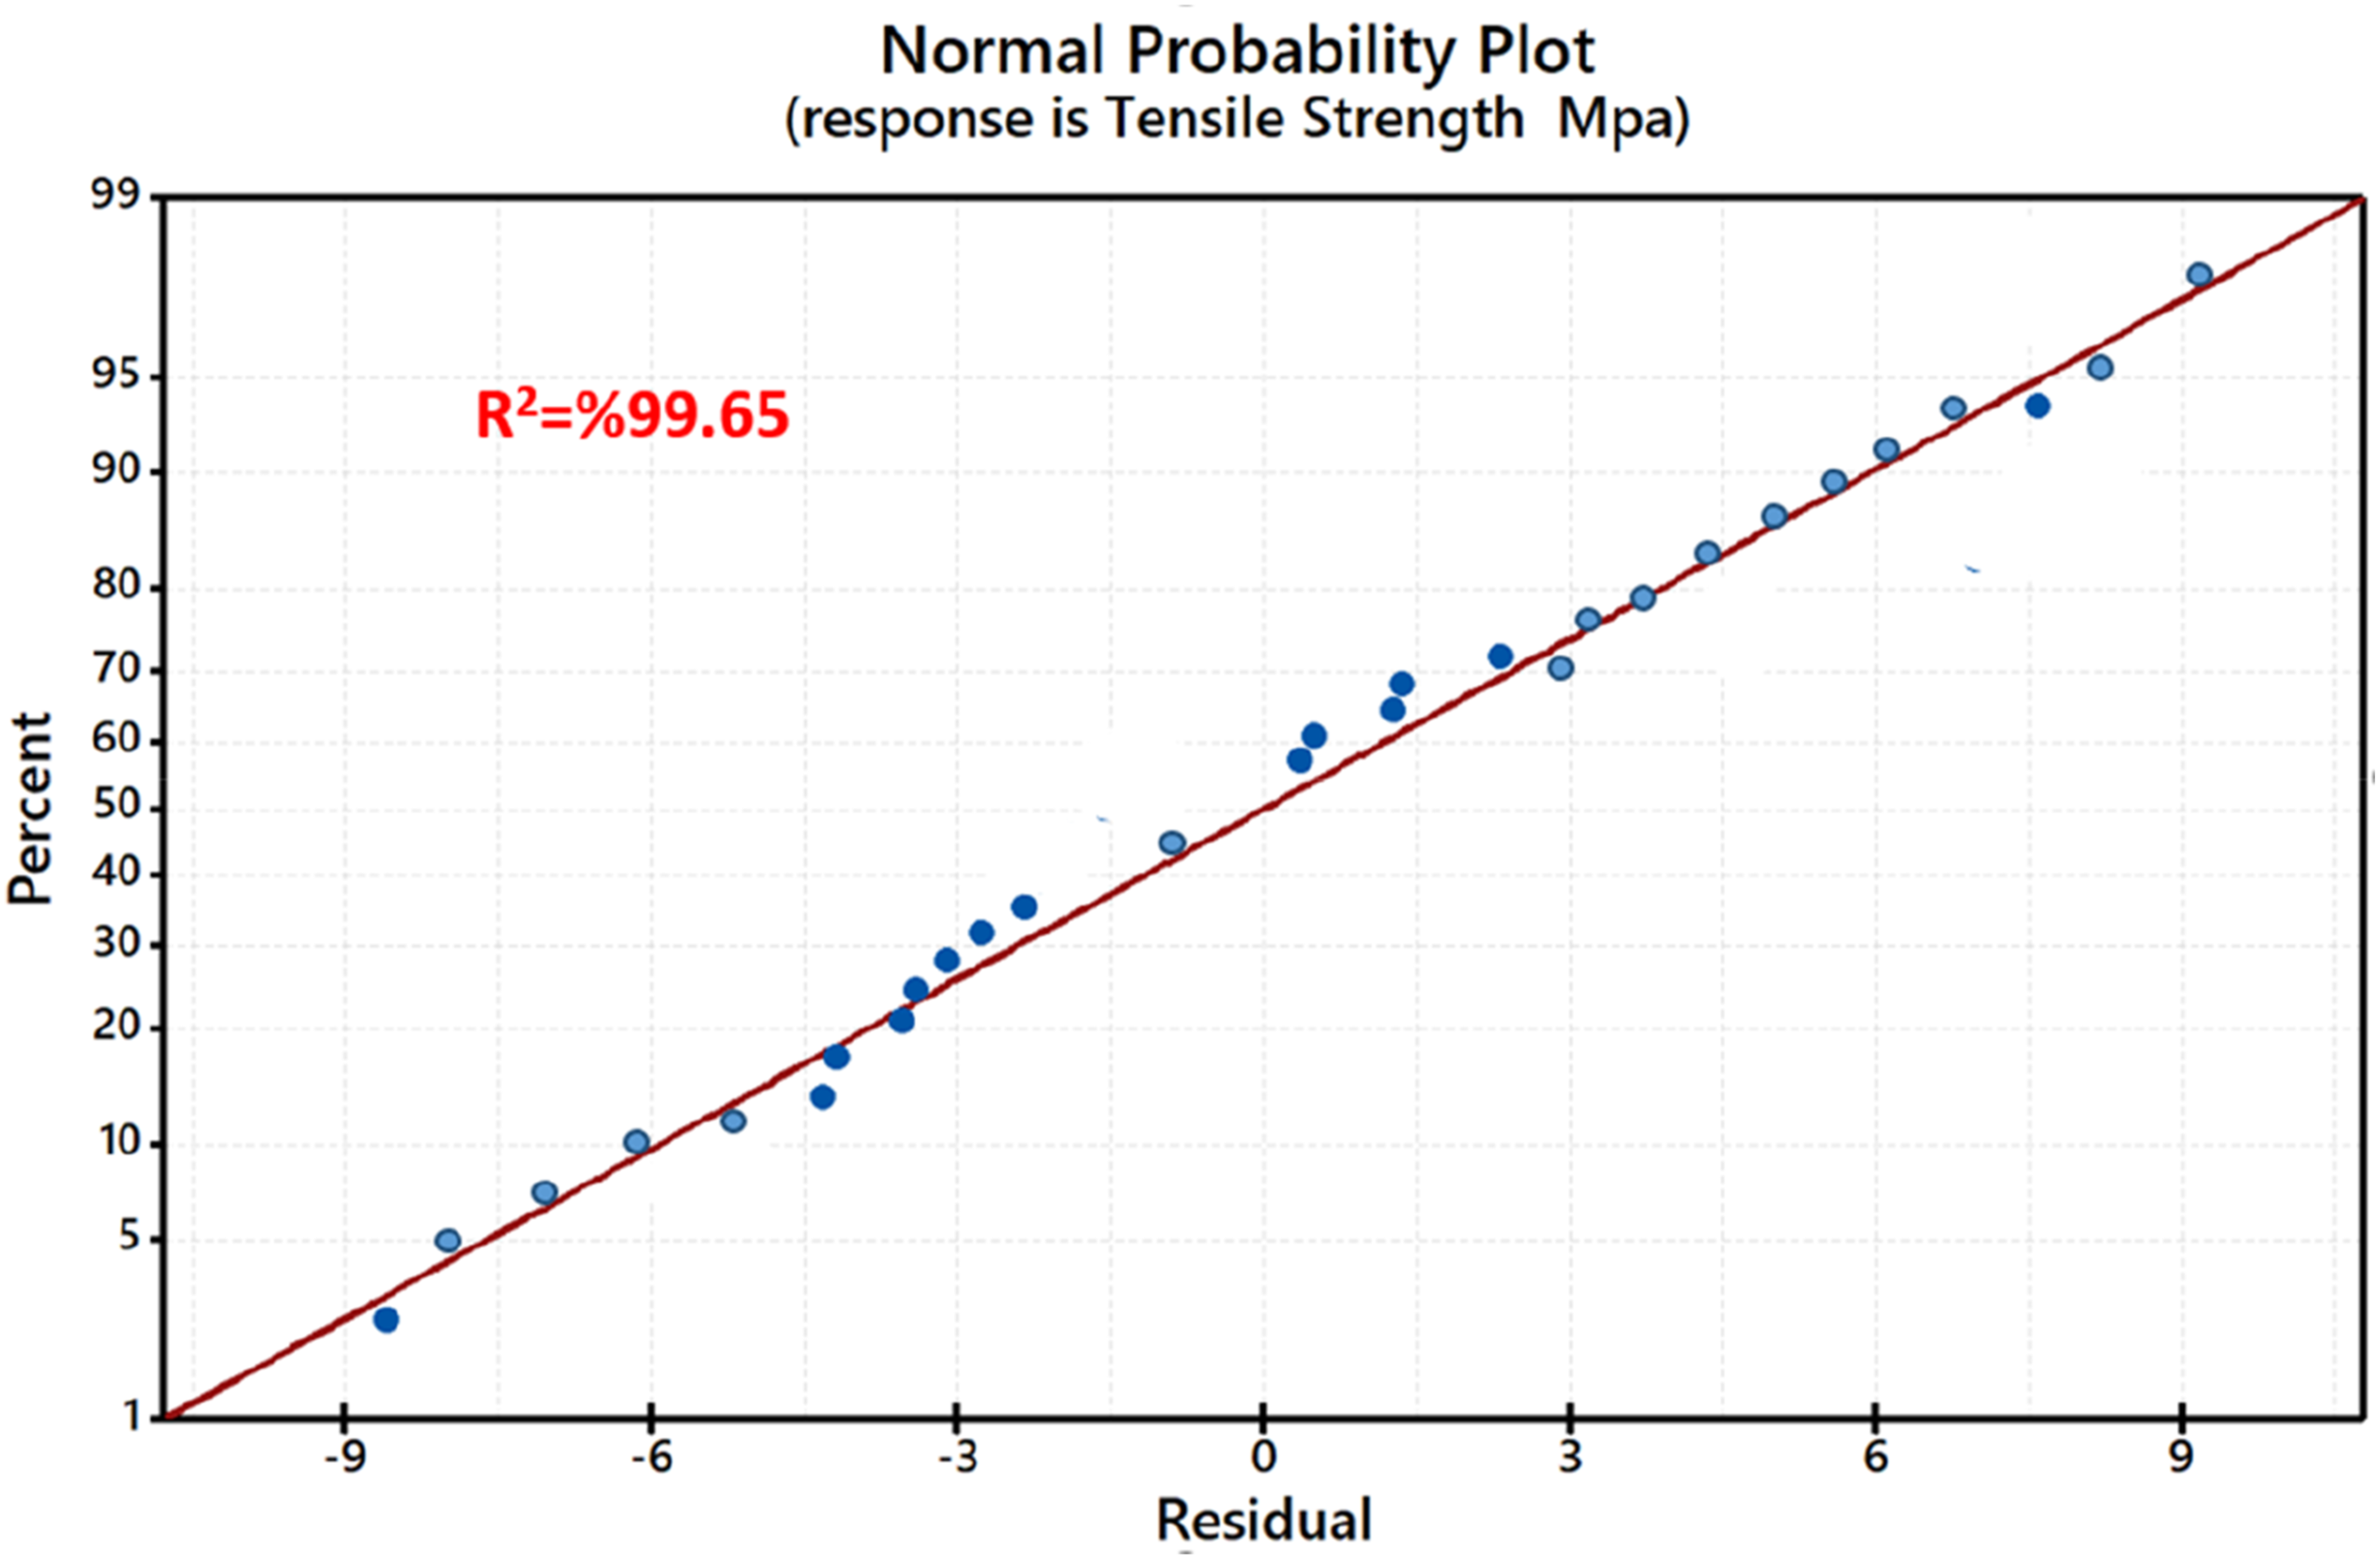
Modeling Procedure
Selected models and their final hyperparameter settings.
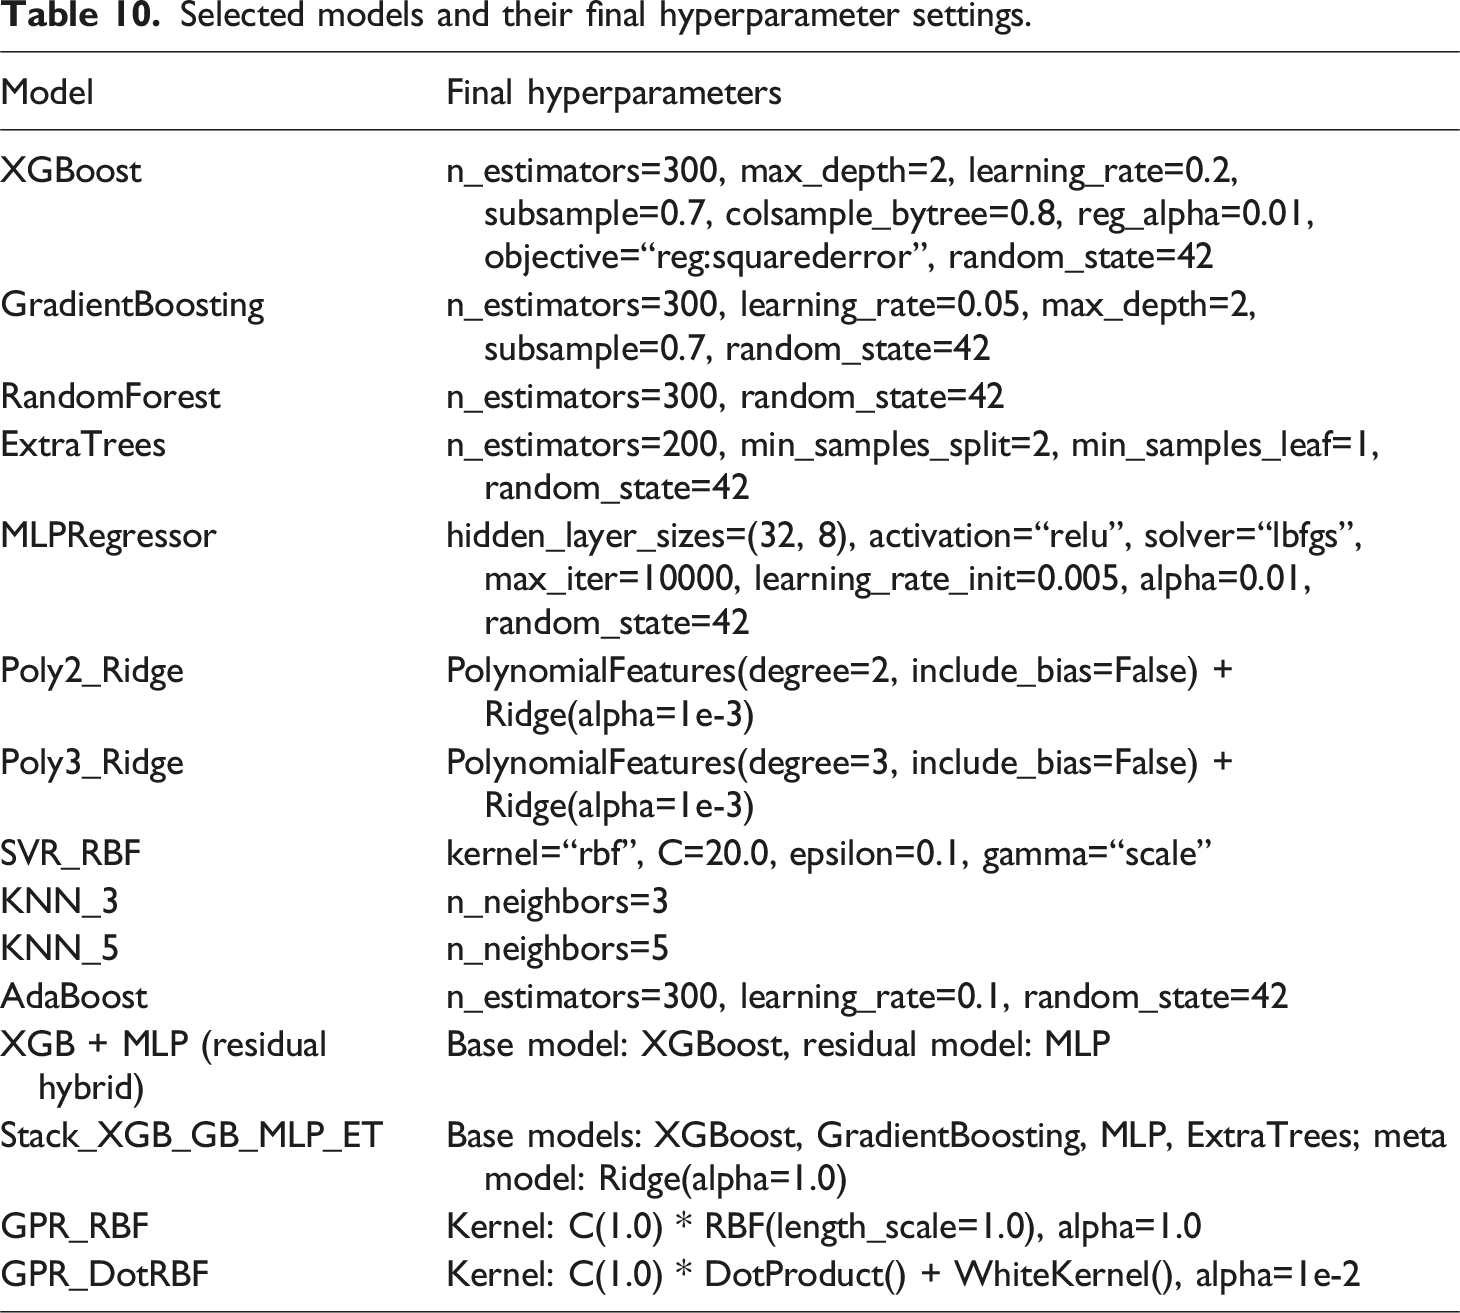
During the modeling phase, a wide range of methods—including linear techniques, tree-based algorithms, artificial neural networks, Gaussian processes, and hybrid ensemble models—was evaluated. To determine the optimal parameters of each model, an initial broad search was conducted using RandomizedSearchCV, followed by a more refined optimization with GridSearchCV within the most promising parameter regions. The optimized parameters for the models are presented in Table 10. Cross-validated R2 and normalized RMSE were used as primary evaluation metrics.
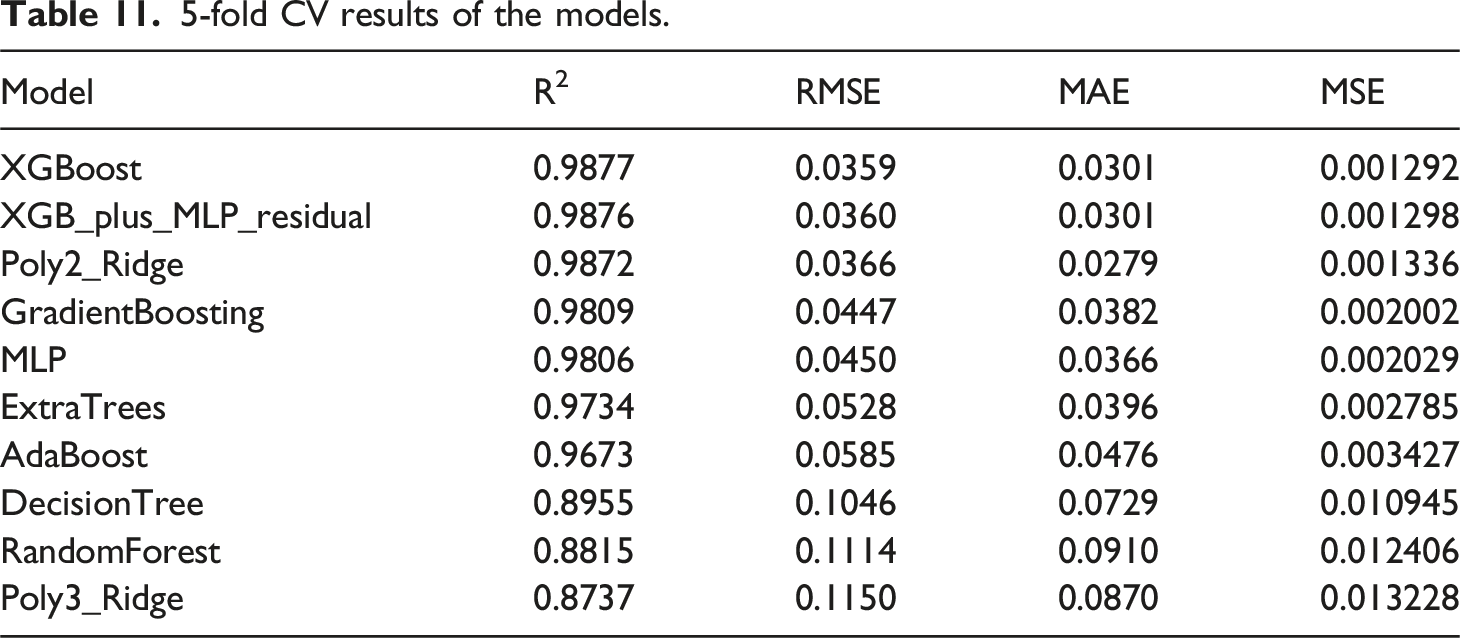
To reliably assess model performance on a small dataset, 5-fold cross-validation, leave-one-out cross-validation, and a 90% training–10% test split were applied. The results indicated that XGBoost, Gradient Boosting, MLP, and Poly2_Ridge outperformed other methods.
The selection of machine learning models was guided by the objective of systematically evaluating algorithms with different learning mechanisms and model complexities, including linear, polynomial, tree-based ensemble, kernel-based, and neural network approaches. This diverse model set enables a balanced comparison between low-bias interpretable models and high-capacity nonlinear learners. To ensure reliable validation under a limited dataset, multiple complementary validation strategies were employed, including 5-fold cross-validation, leave-one-out cross-validation (LOOCV), and an independent 90% training–10% testing split. Overfitting was controlled through strict cross-validation, hyperparameter regularization (e.g., depth limitation, shrinkage, and penalty terms), and the use of simple baseline models for performance benchmarking. The consistent ranking of top-performing models across different validation schemes indicates stable generalization and suggests that model complexity was appropriately matched to the dataset size.
Model Outputs
5-fold CV results of the models.
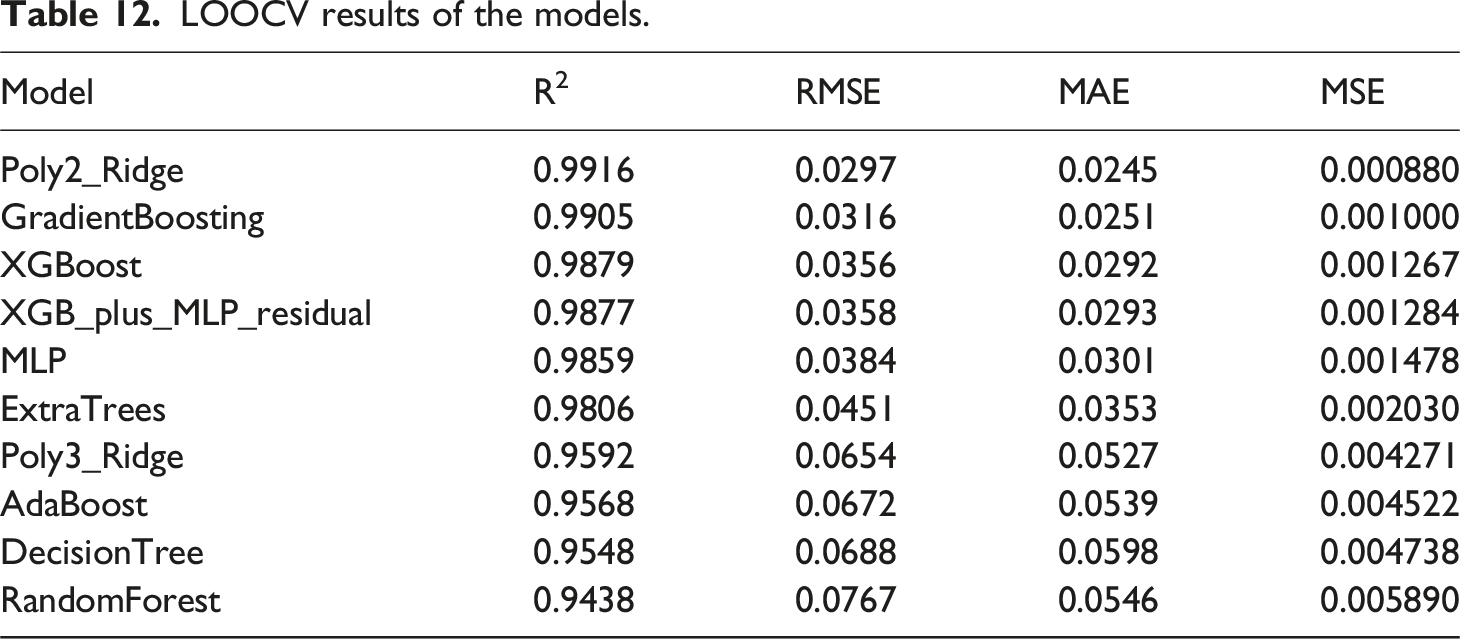
LOOCV results of the models.
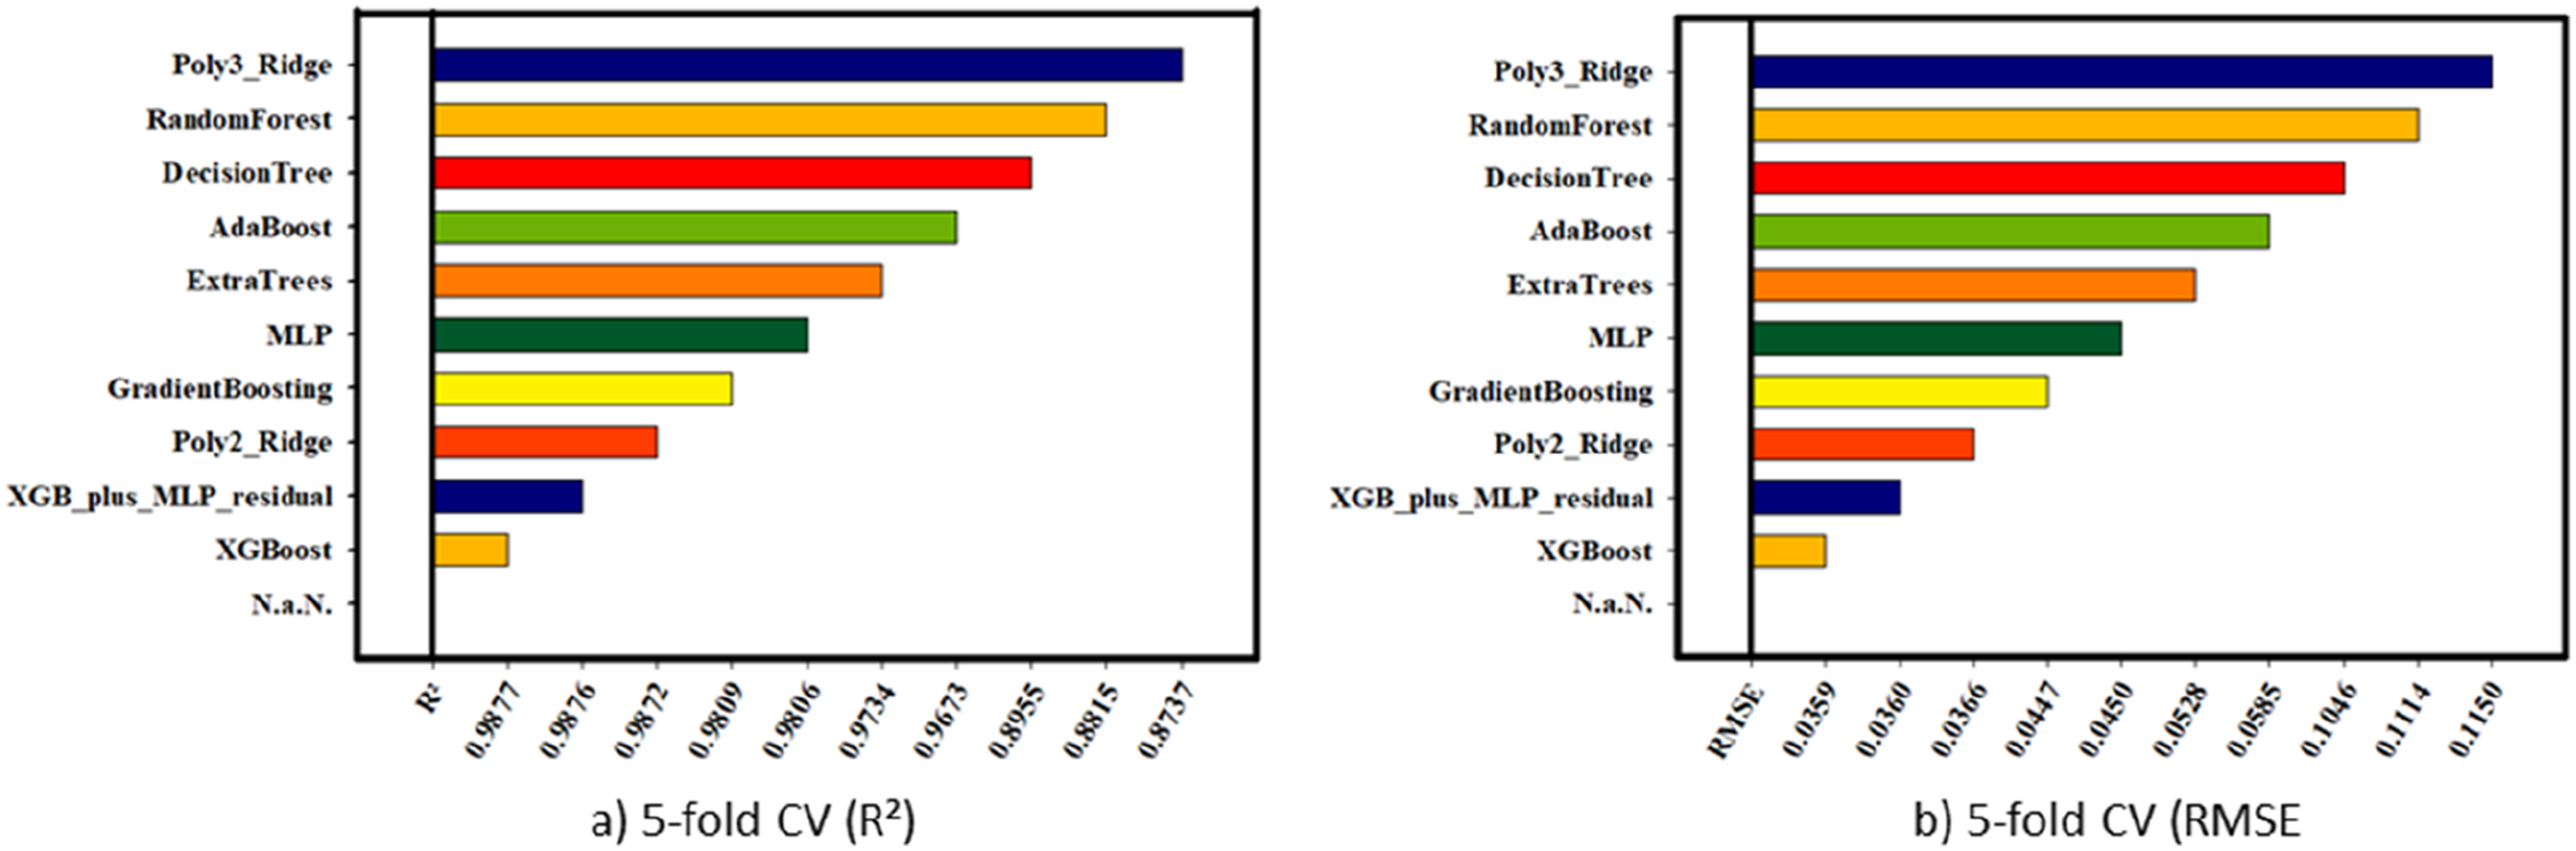
5-fold CV results of the models: (a) R2 values and (b) RMSE values.
In the LOOCV evaluation, the Poly2_Ridge model achieved the highest accuracy with R2 = 0.9916, while GradientBoosting, XGBoost, and the XGB + MLP residual models also demonstrated similarly high performance. The consistent top-ranking performance of the Poly2_Ridge model under both LOOCV and 5-fold CV indicates that the system can be effectively represented by second-order polynomial relationships, and that low-order nonlinearities are dominant, consistent with the Taguchi design. Ensemble and neural network models maintained their rankings under LOOCV, whereas models such as KNN, SVR, and GPR_RBF exhibited a more pronounced degradation in performance when evaluated on the small dataset. The LOOCV results of the models are presented in Table 12, and a graphical representation is shown in Figure 6. LOOCV results of the models: (a) LOOCV (R2), (b) LOOCV (RMSE).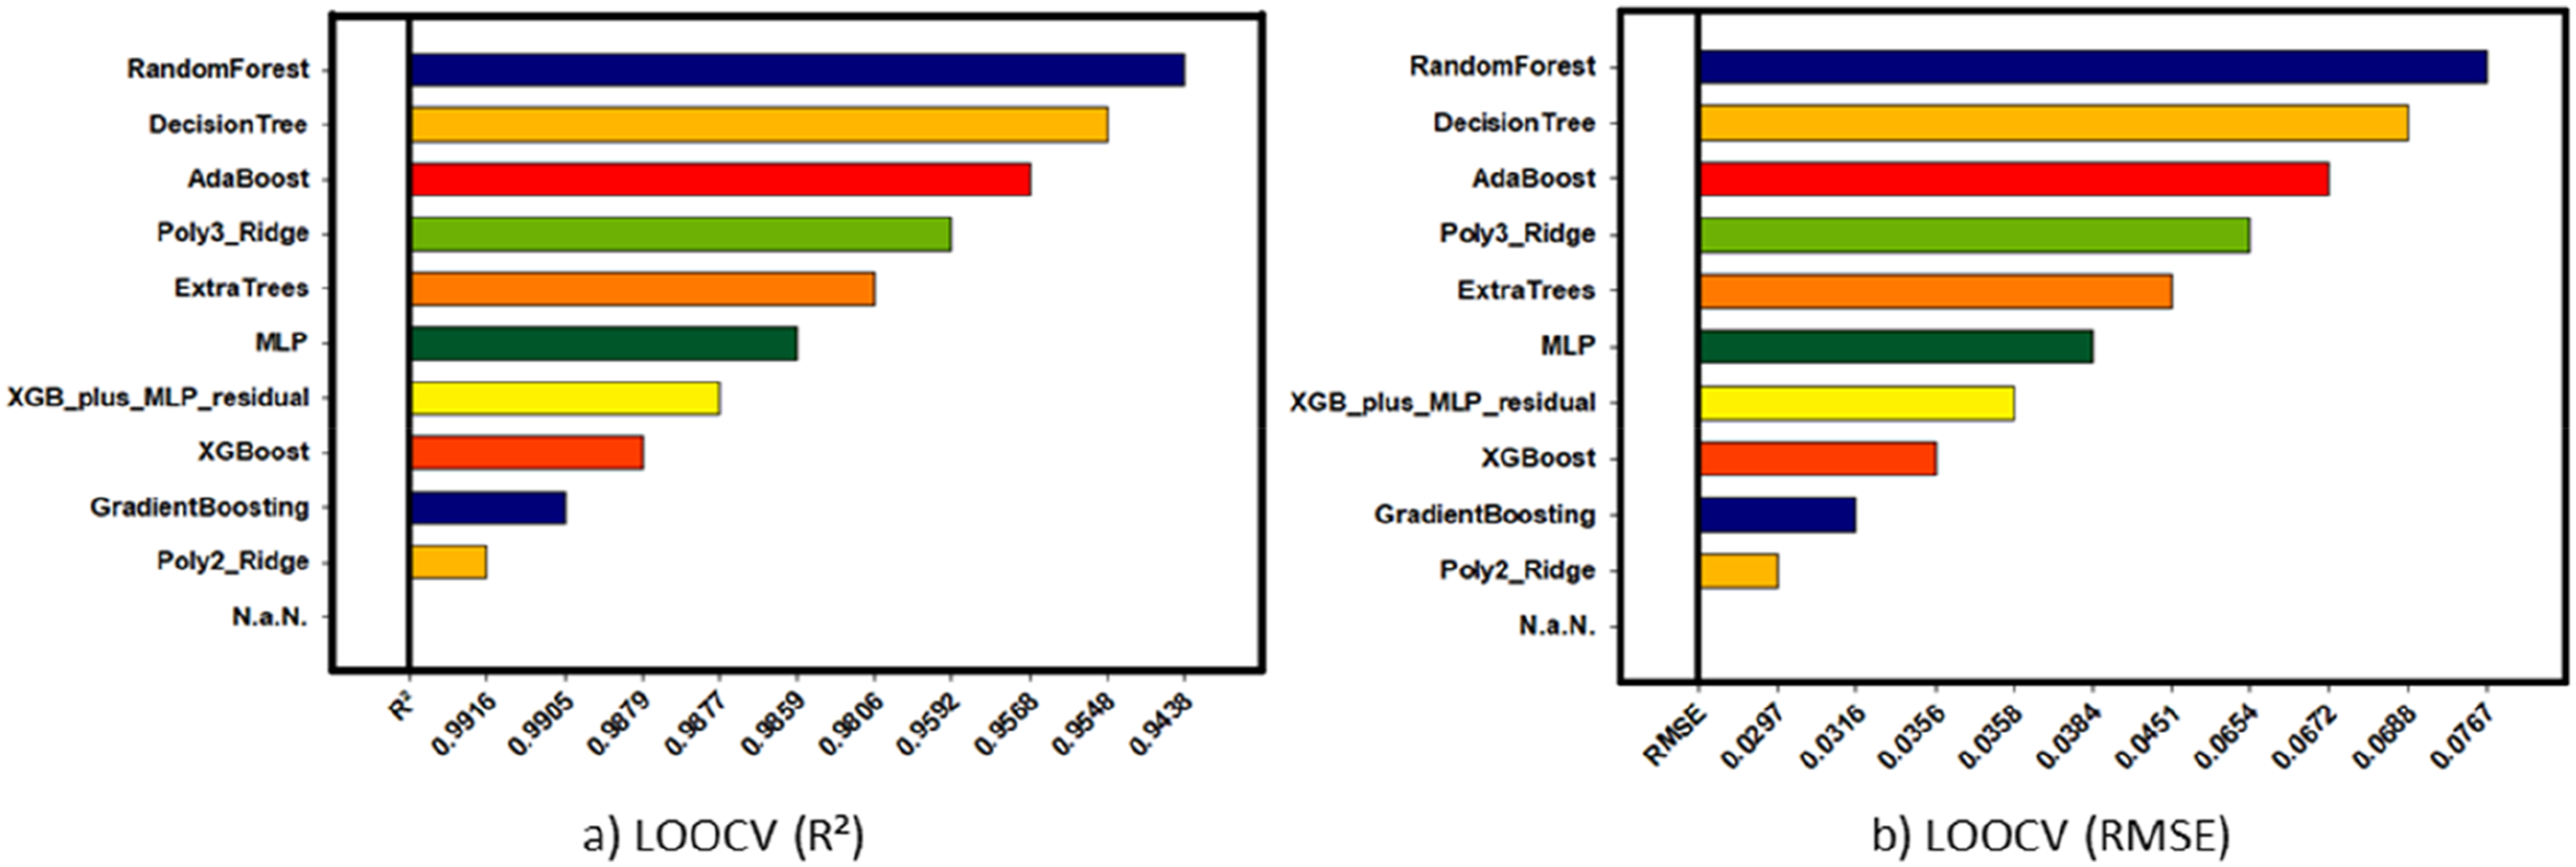
Performance of the models under the 90% training/10% testing split.
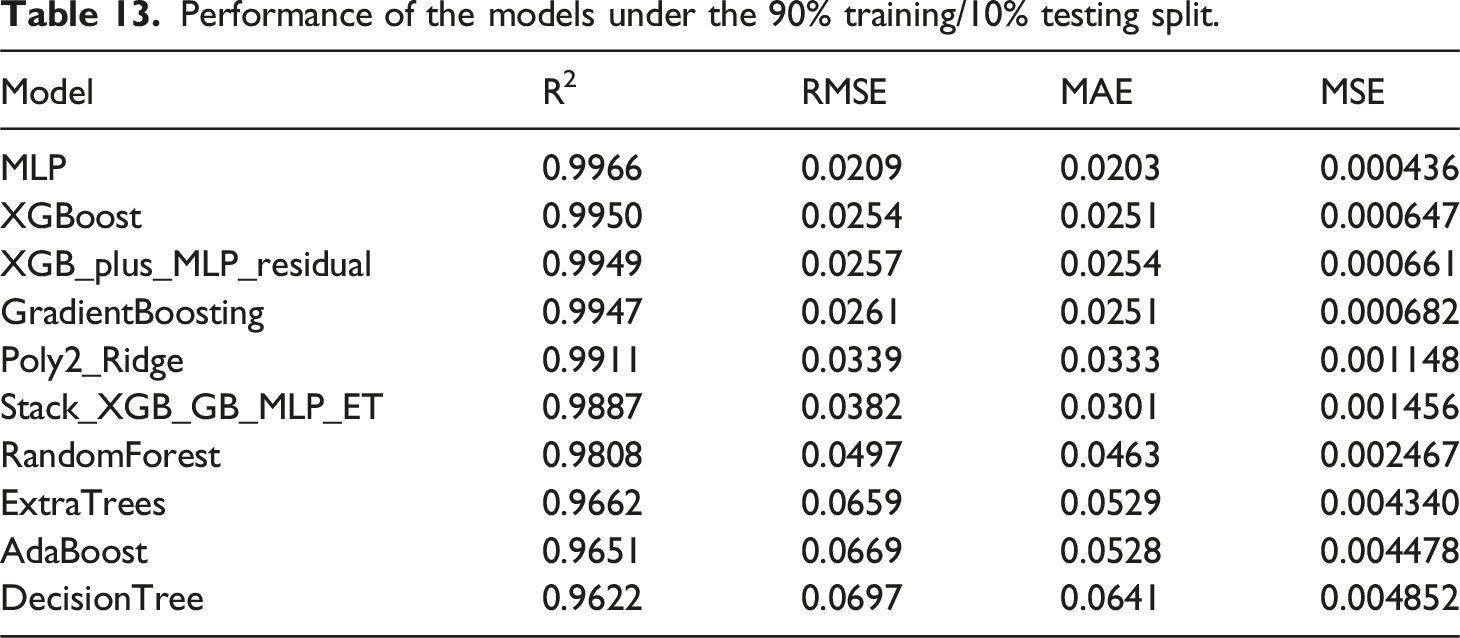
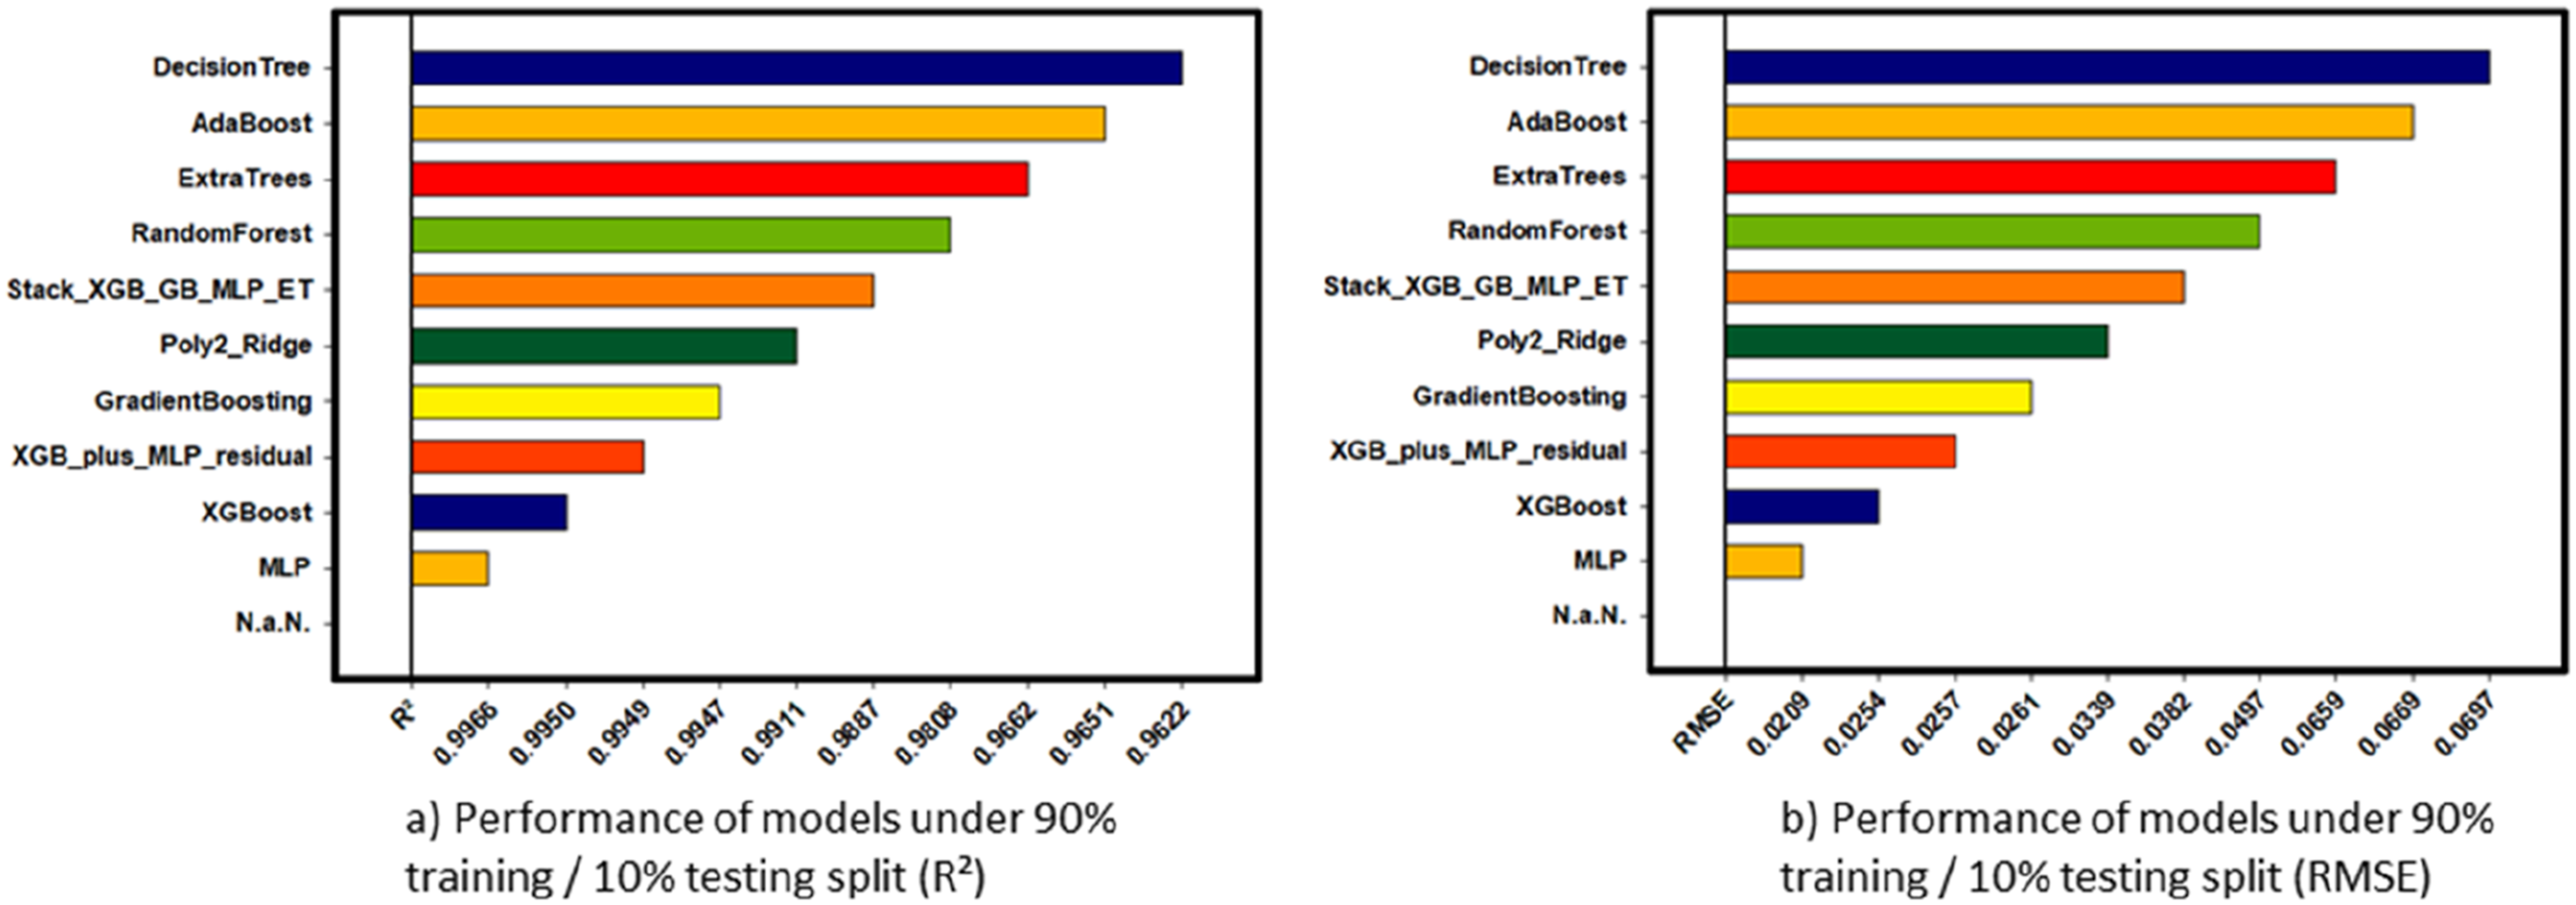
Performance of the models under the 90% training/10% testing split.
Taken together, results from the three evaluation strategies indicate that nonlinear models such as XGBoost, gradient boosting, and MLP consistently achieve high performance on both cross-validation and independent test sets. In particular, XGBoost and MLP achieved R2 values exceeding 0.99, successfully capturing the complex relationships between tensile strength and PS, O, LH, WT, and NT.
The prominence of the Poly2_Ridge model under LOOCV indicates that the system behavior can be largely explained by second-order polynomial terms. This finding is consistent with Taguchi-based analysis of variance, suggesting that the effects of FDM process parameters on tensile strength are primarily characterized by smooth, low-order nonlinearities. Nevertheless, ensemble- and neural network-based models can achieve comparable or even superior accuracy, particularly when trained on the full dataset, due to their more flexible decision boundaries.
The stacking ensemble and certain Gaussian process models failed to demonstrate stable performance with small sample sizes, which suggests that their capacity is excessive relative to the dataset size, thereby increasing the risk of overfitting and performance instability. Similarly, the limited accuracy of KNN and SVR models indicates thatunder the selected hyperparameters and current experimental design, cannot adequately capture the complex interactions of the FDM process.
In conclusion, both Taguchi-based classical statistical analyses and the machine learning models employed in this study consistently indicate that WT is the dominant parameter affecting tensile strength in the FDM process, followed by PS and LH. In addition, the machine learning approaches enable highly accurate predictions across a wide range of experimental parameters, providing a predictive design tool for new manufacturing conditions.
Discussion
In this study, the effects of five critical printing parameters (PS, O, LH, WT, NT) on the tensile strength of PLA fabricated via FDM were systematically investigated using a Taguchi L27 experimental design, ANOVA, and a comprehensive suite of machine-learning models. The findings provide both statistical and computational insights into the complex parameter–property relationships in FDM processes, thereby contributing to the existing literature.
The results of ANOVA and Taguchi S/N ratio analyses clearly established the hierarchy of parameter effects on tensile strength. In both analyses, Wall Thickness (WT) was identified as the dominant factor by a wide margin, exhibiting a contribution of 58.46% and the highest Delta/F value. Wall thickness was found to dominate tensile strength primarily because it directly determines the effective load-bearing cross-sectional area and the continuity of the outer shell, which experiences the highest tensile stresses during loading. In FDM-fabricated parts, the outer perimeters carry a significant portion of the applied tensile load, while internal infill mainly contributes to stiffness rather than ultimate strength. Increasing wall thickness reduces surface-adjacent voids, enhances inter-filament bonding along the loading direction, and limits crack initiation at the specimen surface. In contrast, infill density primarily affects internal porosity, and its influence on tensile strength becomes secondary when a sufficiently thick and continuous shell is present. Similarly, layer height influences interlayer adhesion; however, its effect is constrained by geometric and thermal limits and is overshadowed by the dominant role of shell continuity. This observation is consistent with established FDM literature, which reports wall thickness as a primary determinant of tensile strength, while infill density and layer height play supporting roles within typical processing windows. This finding aligns with engineering intuition, indicating that tensile strength primarily depends on the number of dense, well-bonded filament layers in the outer shell. Increasing WT significantly enhances macroscopic mechanical performance by reducing voids on the specimen’s exterior and maximizing the load-bearing area.
In terms of influence, WT was followed by O and LH. A higher O reduces internal voids (porosity) within the specimen, increasing material density and, consequently, enhancing tensile strength. For LH, the Taguchi analysis indicated that optimum performance was achieved at the third level, 0.3 mm, which may initially appear to contradict commonly accepted FDM principles (where lower LH is generally believed to improve interlayer fusion). However, this outcome should be interpreted in the context of the multifactorial experimental design and strong interactions involving more dominant factors such as WT. A 0.3 mm layer height may have provided faster production while balancing internal voids and thermal gradient effects optimally when combined with the highest WT (1.6 mm). This finding demonstrates that optimal mechanical properties are not always achieved at the ‘ideal’ level of a single parameter, but rather through the best combination of all factors within the study’s parameter ranges. Therefore, the high tensile strength observed at 0.3 mm LH reflects not only the individual effect of LH but also the overall performance of this experimental matrix.
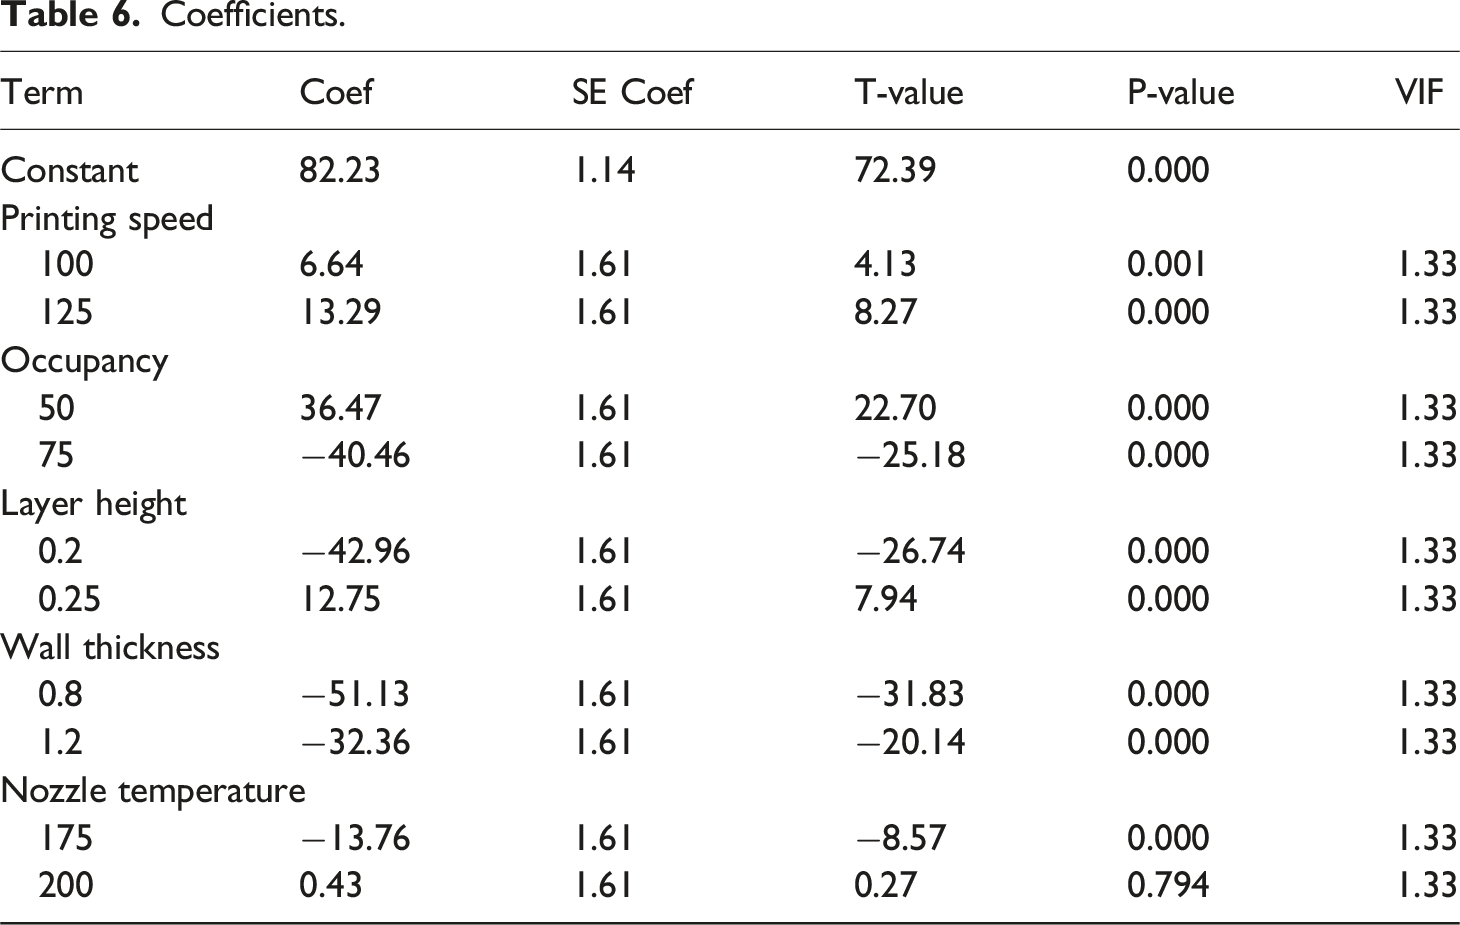
PS and NT were identified as the parameters with the least relative influence on tensile strength compared to the other three factors. In the Taguchi analysis, PS exhibited the lowest effect, ranking fifth. The limited impact of NT can be attributed to the selected temperature range of 175–225°C, which largely ensures the viscosity required for PLA melting and interlayer fusion; this is further supported by the lack of a statistically significant difference in model coefficients at the 200°C level. ANOVA results indicated that NT had a statistically significant effect on tensile strength according to the F-test (p ≈ .000); however, its contribution to variance was only 2.09%, which is minimal compared to the main factors, particularly WT. Therefore, although NT is statistically significant, it is considered the least dominant factor from practical and engineering perspectives. Since the temperature range used in this study was well above the glass transition temperature of PLA, interlayer polymer fusion was sufficient, and variations within this range had a limited effect on tensile strength.
The machine learning models developed to predict tensile strength, which is the study’s second main objective, successfully captured the complexity and nonlinear nature of the relationships identified by the Taguchi–ANOVA approach. Across different validation schemes (5-fold CV, LOOCV, and 90%/10% training–testing split), nonlinear models such as XGBoost, Gradient Boosting, and the Multi-Layer Perceptron (MLP) consistently demonstrated the highest performance.
The machine learning models employed in this study do not merely reproduce the trends identified by the Taguchi–ANOVA analysis, but rather extend them by capturing nonlinear relationships and interaction effects that are not explicitly resolved by classical statistical methods. While Taguchi–ANOVA effectively identifies dominant parameters and their relative contributions, machine learning models provide high-fidelity predictions across the entire parameter space and enable accurate interpolation between experimental points. The consistently high predictive performance of nonlinear models (R2 > 0.99) demonstrates their ability to complement the statistical findings by offering a data-driven predictive tool for unseen process conditions.
The competitive performance of the second-order polynomial (Poly2_Ridge) model under LOOCV indicates that the dominant relationships between FDM process parameters and tensile strength can be effectively represented by low-order nonlinear terms. In relatively smooth and well-structured physical processes such as material extrusion, second-order interactions are often sufficient to capture key geometric and thermal effects without introducing excessive model complexity. Given the limited dataset size, simpler models benefit from lower variance and improved generalization, whereas more complex ensemble and neural network models may exhibit mild instability under leave-one-out validation. This outcome suggests that the underlying process physics is governed primarily by continuous and low-order nonlinear mechanisms rather than highly irregular or chaotic behavior.
In particular, under the 90% training/10% testing split, the MLP achieved the best predictive performance, with R2 ≈ 0.997 and low RMSE, demonstrating that a neural network architecture can successfully capture the complex nonlinear relationships between process parameters and mechanical performance. This high level of accuracy is comparable to the coefficient of determination reported for the Taguchi-ANOVA model (99.65%), indicating that the ML-based predictive framework not only retains the explanatory power of traditional statistical approaches but also enhances predictive capability.
However, the prominence of the Second-Order Polynomial Regression (Poly2_Ridge) model in the LOOCV results (R2 = 0.9916) indicates that a substantial portion of the system behavior can be explained using low-order polynomial terms. This finding suggests that although FDM processes are inherently nonlinear, they do not exhibit excessively high-order complexity that and that simpler mathematical representations can still be effective. Feature importance analysis of the tree-based models further confirmed that WT, PS, LH, and O were the most influential variables, demonstrating methodological consistency between statistical and machine-learning approaches.
The developed hybrid approaches (Stack_XGB_GB_MLP_ET and XGB_plus_MLP_residual) did not surpass the performance of the single best model (MLP), yet they achieved very high R2 values of 0.9887 and 0.9949, respectively. These results indicate that ensemble learning methods provide robust and reliable alternatives for FDM process modeling.
In the test scenario, the MLP model achieved the highest predictive performance (R2 ≈ 0.997), outperforming the Taguchi method, which yielded 99.6% explanatory power. According to the feature-importance analysis of the tree-based models, WT is the most influential parameter for tensile strength, followed by PS, LH, and O. These findings demonstrate that machine learning models not only deliver highly accurate predictions but also quantitatively reveal the relative effects of process parameters on mechanical performance.
In conclusion, this study provides a comprehensive approach to FDM process optimization, not only identifying the most influential parameters but also offering a framework in which the tensile strength of PLA can be reliably predicted using high-performance machine learning models.
The unique contribution of this study lies in the combined use of a Taguchi L27 experimental design and a systematically validated suite of machine learning models to achieve both physical interpretability and high-accuracy prediction within a unified framework.54,55 Unlike many existing studies that rely solely on either statistical analysis or a single predictive model, the present work demonstrates how classical design-of-experiments can be effectively complemented by multiple machine learning approaches to capture nonlinear behavior, interaction effects, and generalizable trends. This dual-level methodology provides not only parameter significance but also robust predictive capability, clearly distinguishing the proposed framework from prior studies.56,57
The proposed modeling framework is subject to several limitations that may affect the generalizability of the results. The experimental data were obtained using a single material (PLA), a specific printer configuration, and a fixed print orientation; therefore, the learned relationships primarily reflect the thermo-mechanical behavior within this particular setup. Previous studies have shown that variations in material properties and extrusion systems can significantly influence interlayer bonding mechanisms and mechanical performance in material extrusion processes.58,59 In addition, differences in cooling conditions and build orientations may alter stress distributions and parameter sensitivities, as reported in related investigations.60,61 While the modeling approach itself is transferable, retraining or recalibration using material- and printer-specific datasets would be required to ensure accurate predictions. Consequently, the present results should be interpreted as system-specific rather than universally applicable, providing a reliable modeling framework rather than a fixed predictive model.
Conclusions
This study thoroughly investigated the sensitivity of the tensile strength of PLA fabricated via FDM to printing parameters using Taguchi analysis, ANOVA, and various machine learning models, yielding the following key findings: (1) Both ANOVA and Taguchi signal-to-noise (S/N) ratio analyses confirmed that, among the five parameters examined, WT had the dominant effect on tensile strength, contributing 58.46%. WT was followed, in order, by O, LH, PS, and NT. (2) The developed ANOVA model exhibited a coefficient of determination (R2 = 0.9965), indicating that the model explains nearly all the variance in the experimental data and is highly reliable. (3) Determination of the Optimum Parameter Combination: According to Taguchi mean-response and S/N ratio analyses, the optimal parameter combination to maximize tensile strength included high WT, high O, and optimum levels of LH, PS, and NT. (4) High predictive accuracy was achieved via machine learning: tree-based architectures (e.g., XGBoost and Gradient Boosting) and neural networks (e.g., Multi-Layer Perceptron (MLP)) predicted tensile strength with R2 values above 0.99. (5) Identification of the Best Predictive Model: Under the 90% training/10% testing scenario, the MLP model achieved the highest performance (R2 = 0.9966), demonstrating its superior capability to model the nonlinear relationships between FDM process parameters and mechanical properties. (6) Confirmation of System Linearity: The strong predictive performance of the Polynomial Regression (Poly2_Ridge) model under LOOCV (Leave-One-Out Cross Validation) suggests that the effects of process parameters on tensile strength predominantly involve second-order nonlinearities.
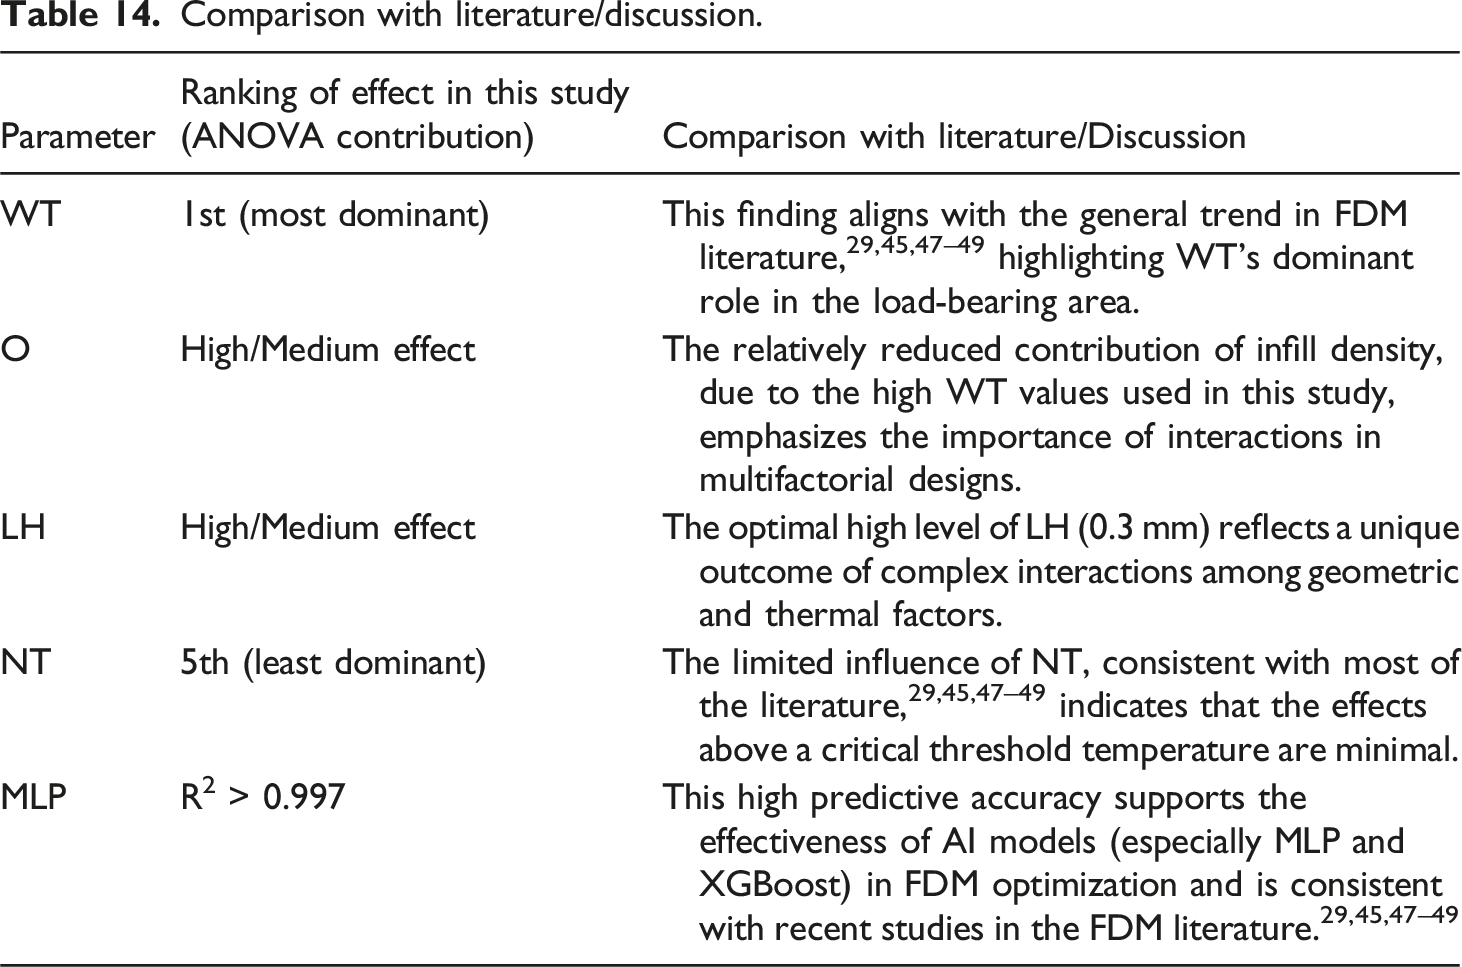
Comparison with literature/discussion.
Recommendations for Future Work
The effects of different print orientations (e.g., 0°, 45°, 90°) and infill patterns (e.g., linear, honeycomb, hexagonal) on tensile strength should be incorporated into the current Taguchi/ML framework to further expand the scope of process optimization. To better understand the physical mechanisms underlying ML predictions, microstructural analyses such as scanning electron microscopy (SEM) should be conducted on both optimal and worst-case specimens. Top-performing models such as MLP and XGBoost should be tested on different thermoplastics (ABS, PETG, ASA) and composite filaments (carbon-fiber-reinforced PLA) to evaluate their generalization capabilities. For multi-objective optimization (e.g., high tensile strength combined with low cost or printing time), ML models should be integrated with evolutionary algorithms, such as genetic algorithms or particle swarm optimization. The potential of more complex methods, including deep learning architectures, for FDM process modeling should be investigated using larger and more diverse datasets.
Footnotes
Acknowledgments
The authors express their gratitude to Cüneyt ÖZDEMİR for generously supporting the conduct of this study, and extend their thanks to the personnel of the Additive Manufacturing and Seismic Isolator Laboratory, Faculty of Engineering, Siirt University, for their valuable contributions.
Declaration of conflicting interests
The author declared no potential conflicts of interest with respect to the research, authorship, and/or publication of this article.
Funding
The author received no financial support for the research, authorship, and/or publication of this article.