
Abstract
Fused deposition modeling (FDM) is the most common method for additive manufacturing of polymers, which is expanding in various engineering applications due to its ability to make complex parts readily. The mechanical properties of 3D printed parts strongly depend on the correct selection of the process parameters. In this study, the effect of three important process parameters such as infill density, printing speed and layer thickness were investigated on the tensile properties of polylactic acid (PLA) specimens. Taguchi design of experiment method is applied to reduce the number of experiments and find the optimal parameters for maximum mechanical properties, minimum weight and minimum printing time. Experimental results showed that the optimum process parameters for the modulus of elasticity and ultimate tensile strength were infill density of 80%, printing speed of 40 mm/s and layer thickness of 0.1 mm, while for the failure strain were the infill density of 80%, printing speed of 40 mm/s and layer thickness of 0.2 mm. Finally, the accuracy of the Taguchi method was assessed for prediction of mechanical properties of FDM-3D printed specimens.
Keywords
Introduction
3D printing is one of the rapid prototyping methods which builds a product based on a 3D model on the computer. 3D printing products are being used in a variety of fields such as automotive, aerospace, engineering and medical.1,2 The manufacturing process of 3D printing is done based on the additive manufacturing (AM) process, where layers are placed one after the other and finally a physical product is produced. Today, the use of AM technology has increased because of its flexibility and design benefits. 3 The main advantage of AM compared to the traditional manufacturing methods is the creation of complex models 4 with a lower weight which significantly reduces the production time.5–7
Among different techniques of 3D printing, fused deposition modeling (FDM) is the most common one which is based on extrusion process, where a solid filament of a thermoplastic polymer such as polylactic acid (PLA) or acrylonitrile butadiene styrene (ABS) melts and feeds to the nozzle to produce parts over a heated or unheated bed. The simplicity and low cost of the FDM process are the main benefits of it, whereas disadvantages such as decency of mechanical properties, dimensional accuracy and surface roughness to the process parameters limit the mass production of products.
8
To stay competitive in the manufacturing market, FDM must produce parts with high quality, short lead time and low manufacturing cost. Thus, it is essential to select and optimize the process parameters to achieve the desired quality characteristics of the printed parts.
9
The main process parameters that affect the quality and final properties of a specimen printed by FDM technique can be divided into three general categories: Slicing parameters: Layer thickness Printing speed Nozzle diameter Printing angle Feed rate Infill density Infill pattern Number of shells Raster orientation Air gap Building orientation: Specimens can be printed and made horizontally, vertically or transversely. Temperature conditions: Includes ambient (printing enclosure) temperature, extruder temperature and platform temperature.
Figure 1 shows a schematic of a FDM 3D printer and some of the aforementioned process parameters.
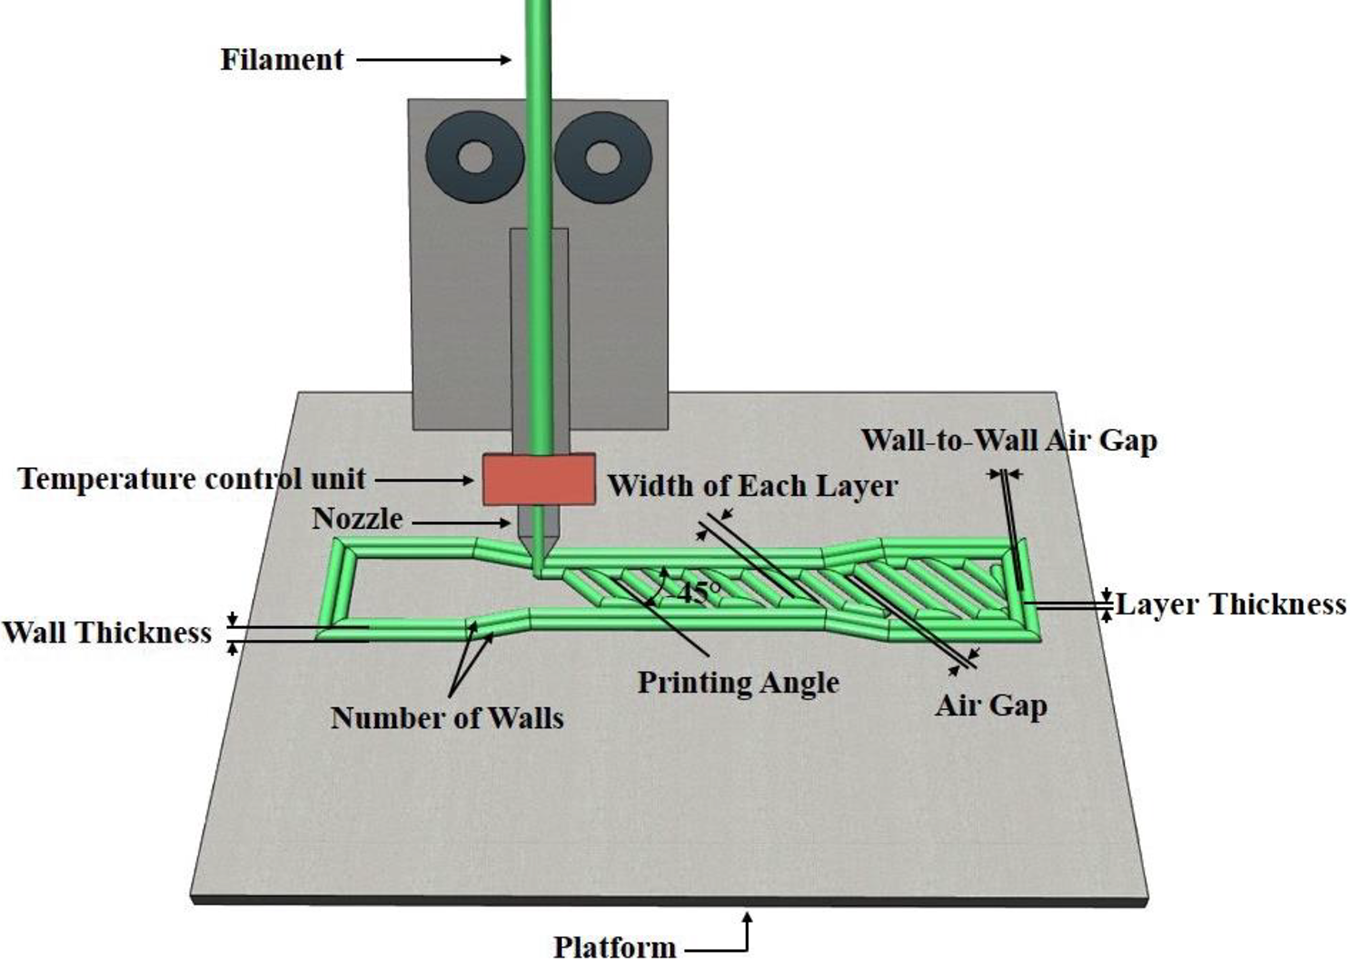
Schematic and process parameters of a FDM 3D printer.
A quite number of studies have been done to analyze the impact of process parameters on the final properties of FDM-3D printed polymer specimens. Dimensional accuracy, surface roughness and mechanical properties were the most studied ones. Since the mechanical properties determine the application and life span of the printed parts, many efforts have been focused on the effect of process parameters on the mechanical properties of the produced parts. 2 Tensile, flexural and compressive strengths are the most evaluated properties, while failure strain has not been evaluated for 3D printed parts.2,10 Yao et al. 1 studied effect of nozzle temperature, layer thickness and printing speed on the mechanical properties of the FDM-3D printed specimens. Several research teams studied effect of printing process parameters including layer thickness, building orientation, printing angle, printing speed, infill density, infill pattern and extrusion temperature on the mechanical properties of the specimens printed by using filaments of PLA11–14 or ABS.15–19 Chacon et al. 20 examined three-point bending of the PLA specimen printed horizontally and found that the best mechanical properties obtained by decreasing the layer thickness and increasing the feed rate. Wang et al. 21 investigated the effects of four FDM process parameters (i.e., printing angel, layer thickness, feed rate, and nozzle temperature) on mechanical properties of FDM-3D printed specimens by doing uniaxial tensile tests and dynamic mechanical analysis of PLA specimens at different temperatures.
Regarding the optimization of process parameters, Design of Experiments (DOE) is a systematic method to determine the influence of input process parameters over a single or set of output responses. Several DOE methods such as Taguchi method,22,23 full factorial designs,16,24 analysis of variance (ANOVA),25,26 bacteria forging technique, 27 and fuzzy logic 28 have been usually used for optimizing the process parameters of FDM system. The Taguchi method is quite different from the conventional methods. This method emphasizes on the quality design when designing products and processes, while conventional methods focus on quality control and inspection during the production process or after the product is manufactured.
Some recent studies have focused on the optimization of 3D printing process parameters. Ahn et al. 29 optimized the process parameters such as raster orientation, air gap, bed width, color and temperature for specimens made by FDM process and ABS filaments using DOE. They also compared the tensile and compressive strengths of 3D printed specimens with injection molded specimens. Lee et al. 30 used Taguchi method to find the optimal FDM process parameters with ABS filament. Sood et al.15,31 investigated the effect of process parameters on the mechanical strength of the specimens by using central composite design (CCD) for DOE and used ANOVA to optimize the parameters for each response. Torres et al. 32 used DOE to optimize the mechanical properties of FDM-3D printed specimen made by PLA. Alafaghani and Qattawi 33 used Taguchi method to investigate the influence of four process parameters such as infill density, infill pattern, layer thickness, and extrusion temperature in the FDM process with PLA filament. Vishwas et al. 34 designed a study based on Taguchi method to reduce the numbers of experiments on the impact of process parameters such as model orientation, layer thickness, and shell thickness of FDM specimens on their properties such as ultimate tensile strength and dimensional accuracy of ABS and Nylon materials. Very recently, Dey and Yodo 10 published a review article on FDM process parameters and optimization of some process parameters by using various methods such as the statistical tools, DOE, and other optimization methods. Bedi et al. 35 used Taguchi method and L9 orthogonal array to optimization of FDM process parameters such as infill density, infill angle and print speed with SiC/Al2O3-reinforced LDPE filament. They also used L18 orthogonal array to optimize the process parameters of twin-screw extruder by working on the same reinforced filament. Kumar et al. 36 in part of their study, used Taguchi L9 orthogonal array and ANOVA method to prepare the feedstock filaments of low-density polyethylene (LDPE) and high-density polyethylene (HDPE) and to optimize the extrusion conditions (i.e., screw temperature, die temperature and screw rotation with three different levels for each parameters.
To summarize, most studies have focused on the effect of print angle, layer thickness, nozzle temperature, infill pattern, and infill density on the strength of FDM-3D printed specimens and fewer attention is paid to the other mechanical properties such as elastic modulus and failure strain as the important properties in engineering design. Also, the most ordinary users, at first sight, would like to change infill density, printing speed and layer thickness (among various process parameters) in order to reduce the printing time, the amount of materials used and consequently costs. They usually keep other parameters as the default value of the slicing software. They may believe the effect of these three parameters on the mechanical properties is not significant. Thus, in this study, the influence of infill density, printing speed and layer thickness were first investigated simultaneously on the elastic modulus, tensile strength, and failure strain of 3D printed specimens and then the best process parameters for optimizing these mechanical properties were selected by using Taguchi DOE method.
Experimental procedure
Process parameters and Taguchi design of experiment method
As shown in Figure 1, the printing process parameters considered in the present work were described below: Layer thickness: Also known as slice height, is the height of the individual deposited layer over the other one to attain the final model. Infill density: It is defined as the percentage of internal volume of solid object that is filled with filament material. Printing speed: It is defined as traveling speed of the extruding nozzle along the platform. In order to find the simultaneous impact of the above process parameters on the tensile properties of the printed parts, it is necessary to define different levels for each parameter and many samples should be produced and tested for the permutation of the various process parameters. The necessity of using DOE is to reduce the number of tests, save time and cost as well as optimizing the manufacturing process parameters. The Taguchi method is usually used on the experimental results to achieve one of the following purposes: Determine optimal conditions Determine the individual effect of each factor Performance estimation under optimal conditions
Taguchi method also uses either Analysis of Variance (ANOVA) method or Signal to Noise ratio (S/N ratio) to achieve the expected results. In order to observe the general effects of each manufacturing process parameter on the ultimate properties, the ANOVA method evaluates the variance between different groups. While in S/N ratio method, the change in response to the nominal value is determined in different noise conditions and the results are evaluated by increasing or decreasing the process parameters according to the average output response. 37 The ANOVA method is mostly used when the percentage of each parameter is considered individually on the output. When the aim is optimization of the multi-response process, S/N method is used which it considers the percentage of contribution and the impact of more than one parameter on the output. 38 Due to these reasons, S/N method is used since the goal of this study is to find the optimal conditions of infill density, layer thickness, and print speed simultaneously.
In this approach, a loss function is used to calculate the deviation between the experimental value and the desired value (based on the average value of mechanical properties obtained from experimental results), which is further transformed into S/N ratio to evaluate the relationship between quality and variability. Accordingly, Taguchi divides desirable qualitative characteristics into three following types to obtain optimal conditions.
The closer to the nominal value, the better.
SNT is used if the purpose is to reduce the variability around a certain value.
The bigger, the better.
SNL is used to maximize the response value.
The smaller, the better.
SNS is used to minimize the response variable as much as possible.
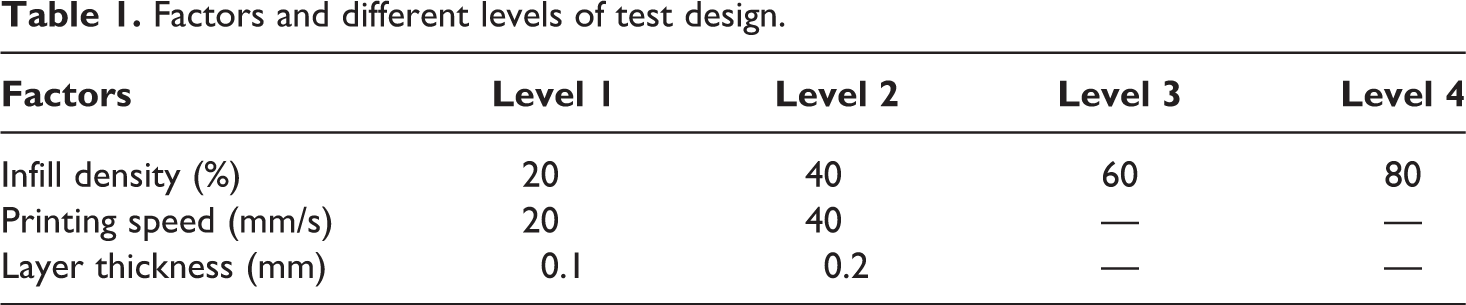
In this work, the data was analyzed using Minitab software based on S/N ratio response of the larger the better type to maximize the tensile properties of the 3D printed parts. As shown in Table 1, infill density with four different levels, layer thickness, and printing speed with two different levels were considered. The range of some process parameters may change according to the technical features of a printer device. For example, most common 3D printers are not able to print at very high speed. At print speeds of 60 mm/s or above, filament would not melt properly and consequently layers would not print well. For this reason, two frequently-used speeds in reality, i.e. 20 mm/s and 40 mm/s were selected. Regarding levels of infill density, they can vary from 0 to 100%. Printed specimens are usually very hollow and unstable at infill density lower than 20%. Infill density of 100% also increases the printing time and specimen weight. For these reasons, four levels of 20%, 40%, 60% and 80% were selected. The slicing software such as Cura usually allows the variation of layer thickness in the range of 0.1–0.3 mm. Layer thicknesses of 0.1 mm and 0.2 mm are two of most commonly used values in reality and their selection depends on the shape and curvatures of the model.
Factors and different levels of test design.
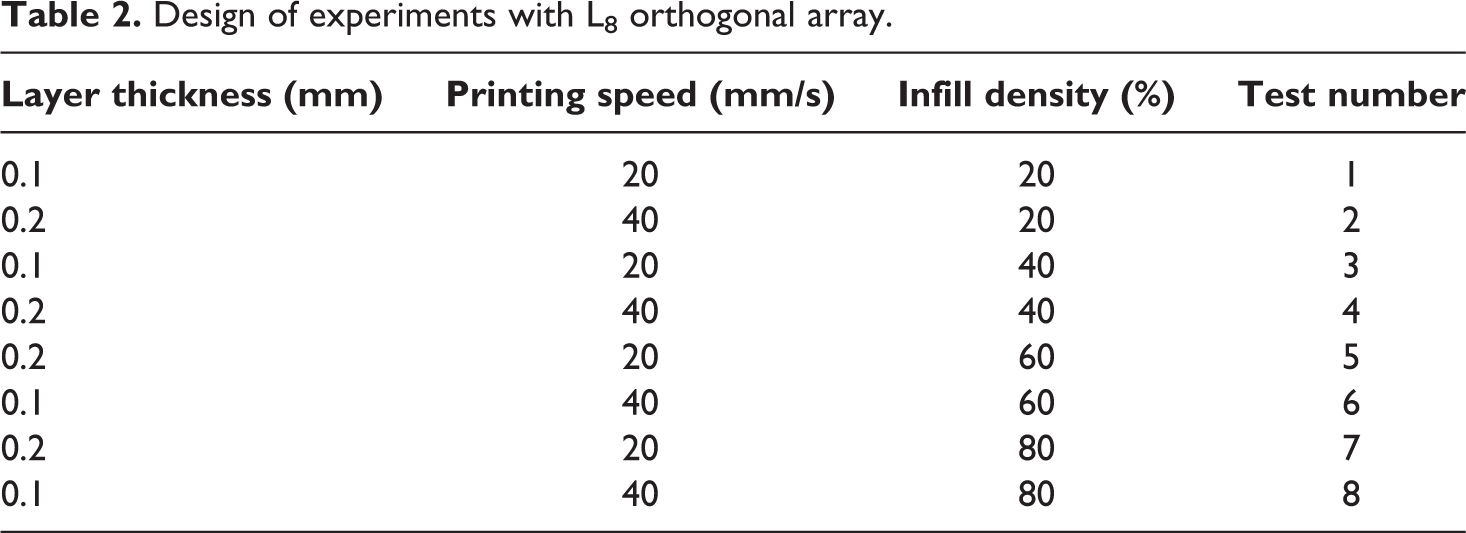
Taguchi method uses a set of orthogonal arrays to design experiments according to the specific rules. Orthogonal arrays allow the main interactions to be performed with a minimum number of experiments. Each array is a pattern for performing experiments and the index of each array indicates the number of experiments required in this pattern. For each case, depending on the number of factors and the levels selected, one or more arrays may be appropriate and the other arrays unusable, or their use may be unnecessary due to increasing the number of tests. One of the most important steps in Taguchi design is how to arrange the factors in the columns of the orthogonal array. Each orthogonal array column refers to a specific factor with two or more levels, and each row represents an experiment. The main purpose of Taguchi method is to study the main effects of factors. Based on the full factorial experiments (four levels for infill density, two levels for print speed and two levels for layer thickness), 16 specimens (41 × 21 × 21) should be made and tested to cover all permutation. It would not be economical in terms of time or amount of filament used. According to the Taguchi method, L8 orthogonal array was selected. L8 array means 8 experiments should be done instead of 16 ones. The Taguchi’s eight experiments and their corresponding process parameters were listed in Table 2.
Design of experiments with L8 orthogonal array.
Specimen preparation
In this study, an in-house made FDM-3D printer that was designed and built at University of Isfahan
6
has been used to print the specimens and Cura software was used to control the printing process parameters. The material used was polylactic acid (PLA) which is a thermoplastic polymer in the shape of filament with 1.75 mm diameter. The PLA filament is provided from YS Company and the grade of PLA used in this study is 4032D. The most important advantages of the PLA filament rather than other filaments are: Lack of gas releasing during printing, so it is possible to print at home, classrooms, and factories without any specific ventilation. It does not require a hot bed. Therefore, there will not be problems like squeezing, cracking and compression during cooling, which is really helpful. The melting point of the PLA filament is between 180–230°C. PLA has a lower melting point than conventional thermoplastics such as ABS, PETG, Nylon, etc.
39
For example, the melting temperature of ABS is between 210–250°C, the melting temperature of PETG is between 220–250°C, the melting temperature of Nylon is about 240–260°C and etc.
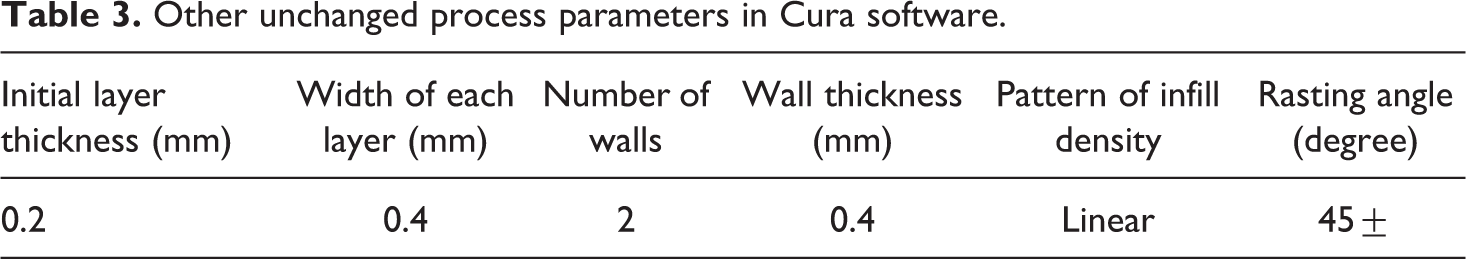
For specimen preparation, the CAD file of a dog-bone tensile specimen (Figure 2) in accordance with Type I of ASTM D638 standard 40 was modeled in Catia™ software and exported as STL format. The imported file then was converted to the G-code to be able to be readable by FDM machine. All other process parameters such as initial layer thickness, width of each layer, wall thickness, raster angle and number of walls were kept constant for all samples which their values were listed in Table 3 (refer to Figure 1). The raster angle was selected ±45° because it has been proved by other researchers that this angle gives better mechanical properties than others. 12 Regarding the infill pattern, the simple pattern is linear among various complex shapes. The default of most printers is linear pattern and most users prefer not to change the default value if they have no information about its effect on the quality. Regarding wall thickness, number of walls, width of each layer and initial layer thickness, these parameters were selected from the recommendations of 3D printer manufacturer and our experiences about the quality of different 3D printed specimens.
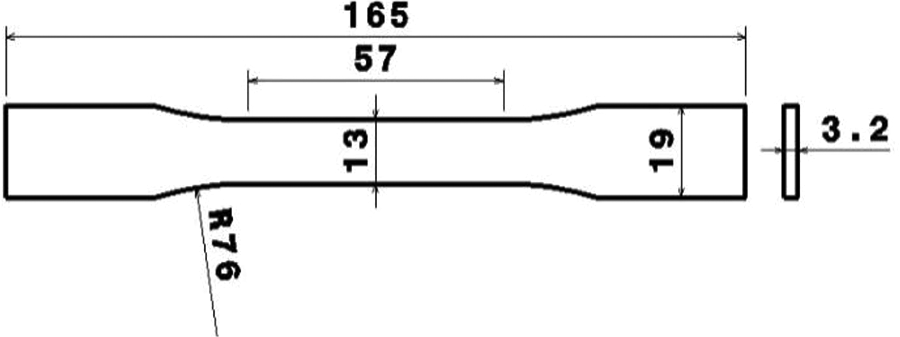
Dimensions of standard specimen (in millimeters) for plastics.
Other unchanged process parameters in Cura software.
As it has been reported repeatedly, the geometry loses some dimensional accuracy during the model conversion process to STL and then to G-code,3,28,41,42 so multiple specimens were printed and the most accrued ones were selected for further analysis.
Tensile test setup
To investigate the mechanical properties of FDM-3D printed PLA specimens, each specimen was tested at room temperature under a quasi-static tensile test with loading rate of 1 mm/min. Three samples were printed and tested for each experiment. The machine used was a STM-150 model with a load cell of 500 kg. An extensometer with 50 mm gauge length was also used to measure the elongation. Figure 3 shows the test setup.
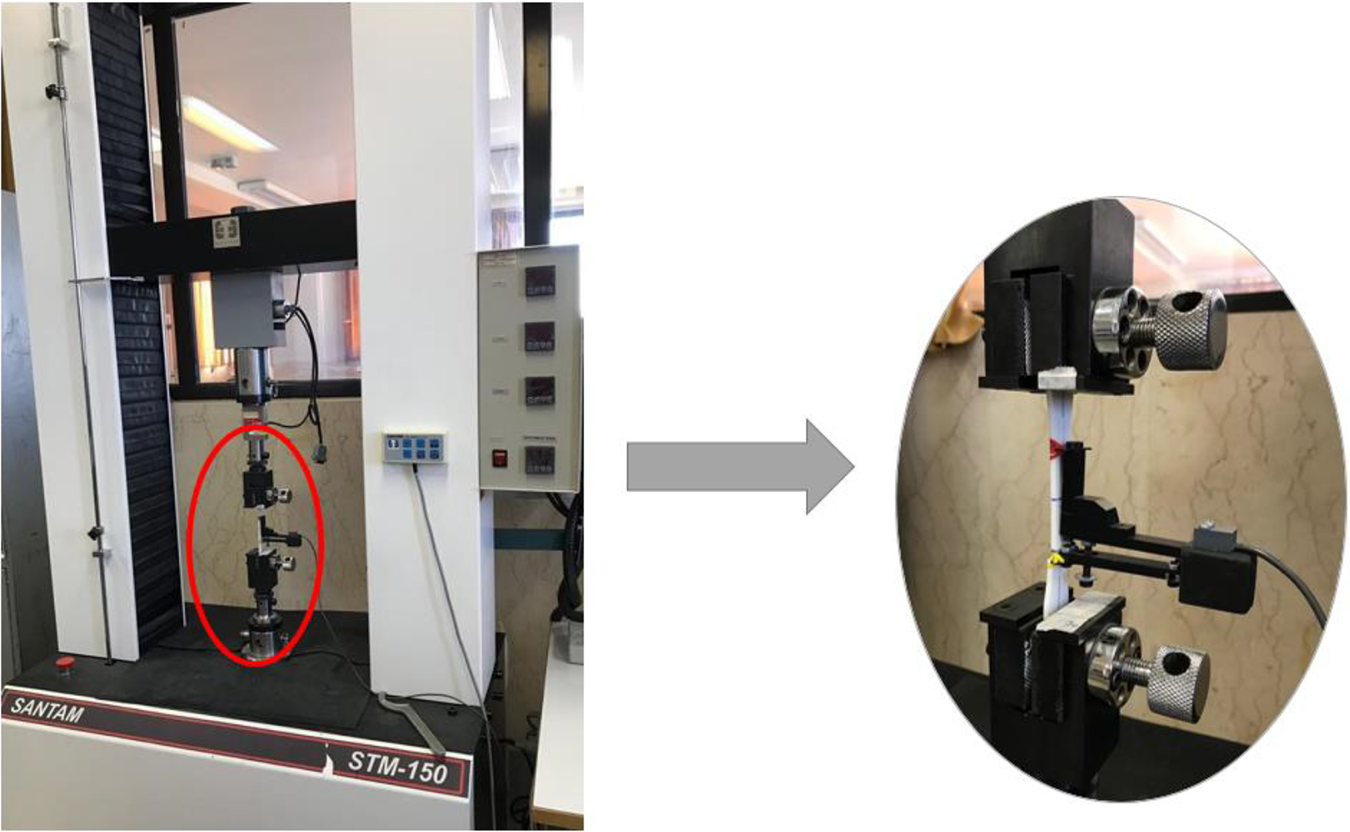
Universal tensile machine.
Results and discussion
Results of Taguchi DOE method
Figure 4 shows the engineering stress–strain curves of the eight experiments listed in Table 2. One of the weaknesses of FDM technique is the low dimensional accuracy of the printed specimens. 28 In order to eliminate the effect of variations in specimen dimensions on the experimental results, five to seven specimens were printed for each Taguchi’s experiment and three specimens with minimum variation in length, width, and thickness were selected for tensile analysis. Results of these three specimens showed relatively good repeatability. Therefore, only one stress–strain curve of three specimens is depicted in Figure 4.
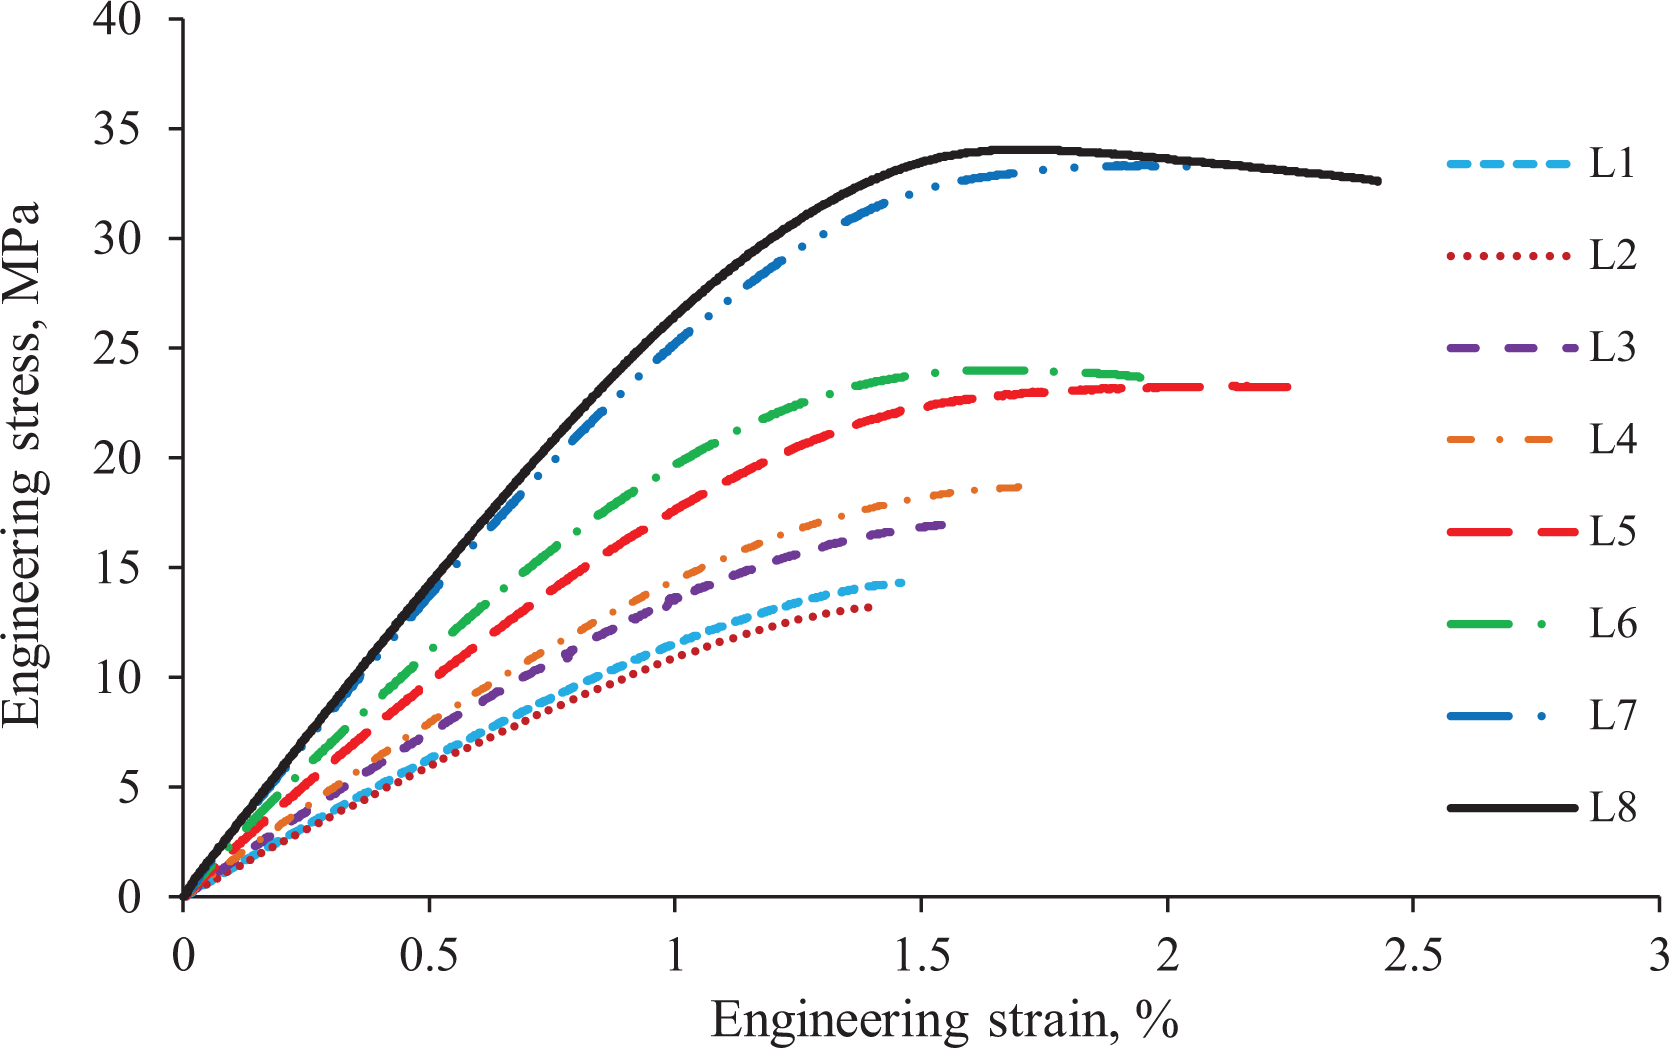
The stress–strain curves of eight experiments designed by the Taguchi method.
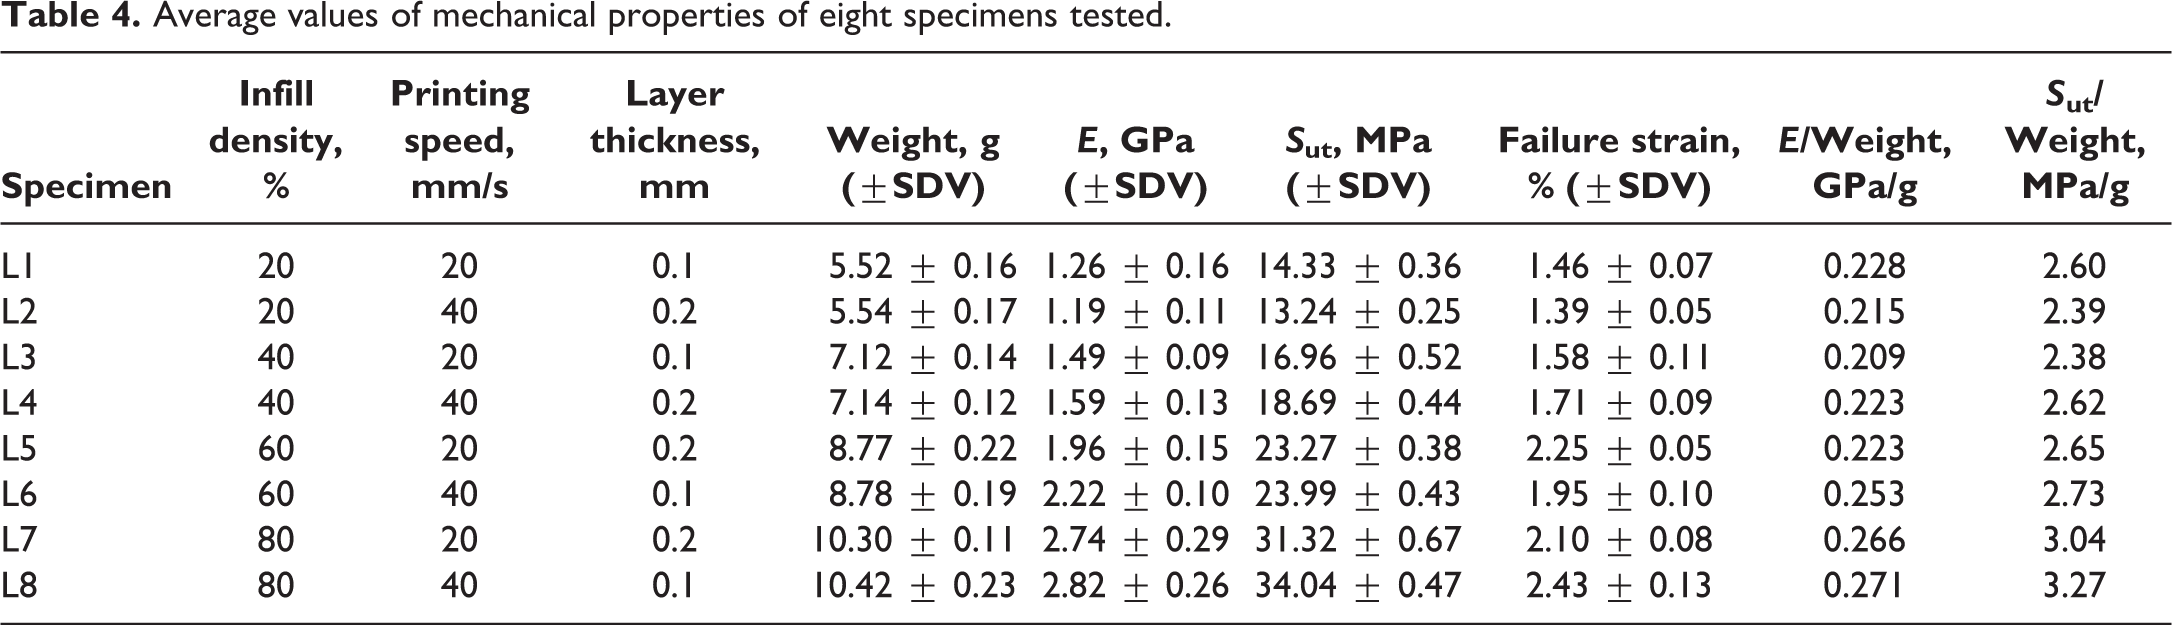
Table 4 summaries the average values of mechanical properties including elastic modulus (E), ultimate tensile strength (Sut), and failure strain for each specimen designed by the Taguchi method. For better understanding, the specific stiffness (stiffness to weight ratio) and specific strength (strength to weight ratio) were reported too. Since the aim of this study was to optimize the process parameters, we did not focus on interpreting the effect of process parameters on the mechanical properties. For instance, samples of L1 and L3 with similar layer thickness and printing speed but different infill density, showed that by increasing infill density, both specific stiffness and strength have decreased while the failure strain has increased. This confirms that elastic modulus, ultimate tensile strength, failure strain, and weight of sample were increased by increasing the infill density. But the amount of increase in stiffness and strength (about 18%) is not as significant as weight increase (about 29%). As shown in Figure 5, at low infill density, the gap between the two rasters is significant and it causes the porosity in the structure. So, specimen weight decreases. When the infill density increases, the amount of air gaps decreases and as a result the specimen weight increases. Also, by decreasing the infill density, the contact and adhesion between the layers decreases and mechanical properties consequently reduce.
Average values of mechanical properties of eight specimens tested.
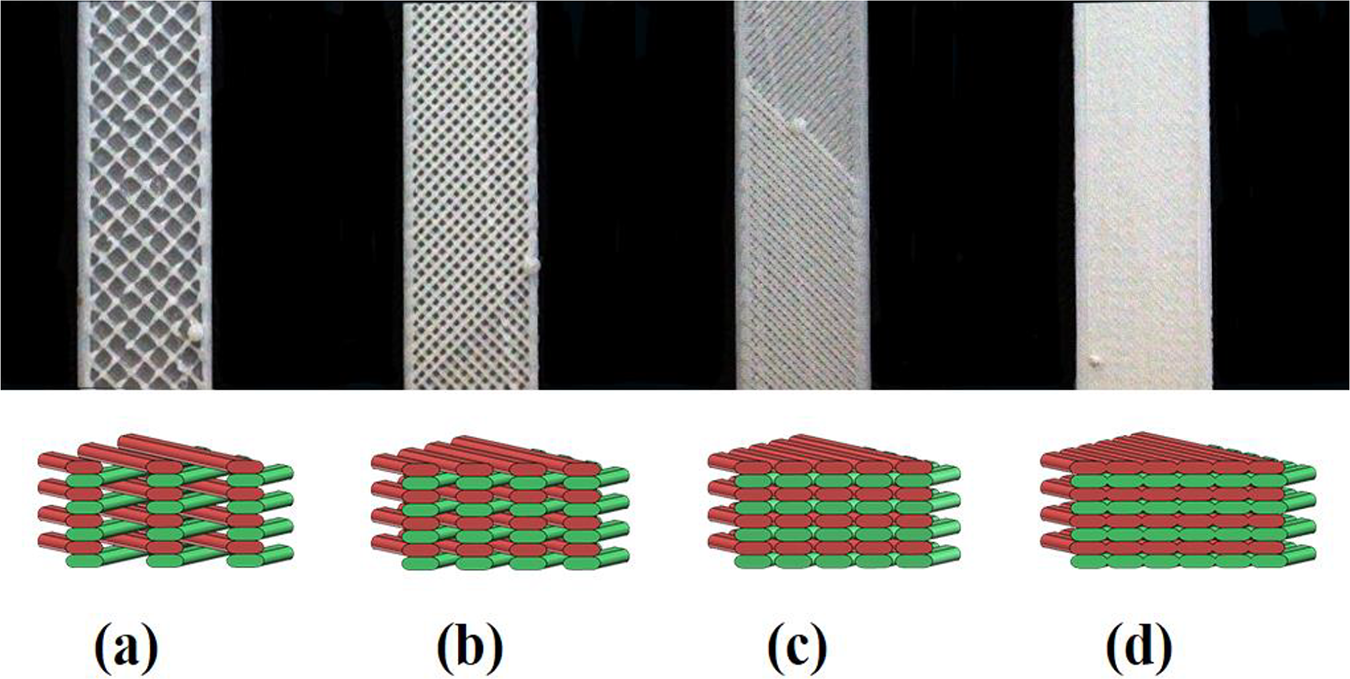
The actual and schematic of layers with different infill density: a) 20%, b) 40%, c) 60%, d) 80%.
Figure 6 shows the fracture cross-section of eight tested specimens. The fracture surfaces of all specimens were perpendicular to the load direction which indicates a quasi-brittle behavior.
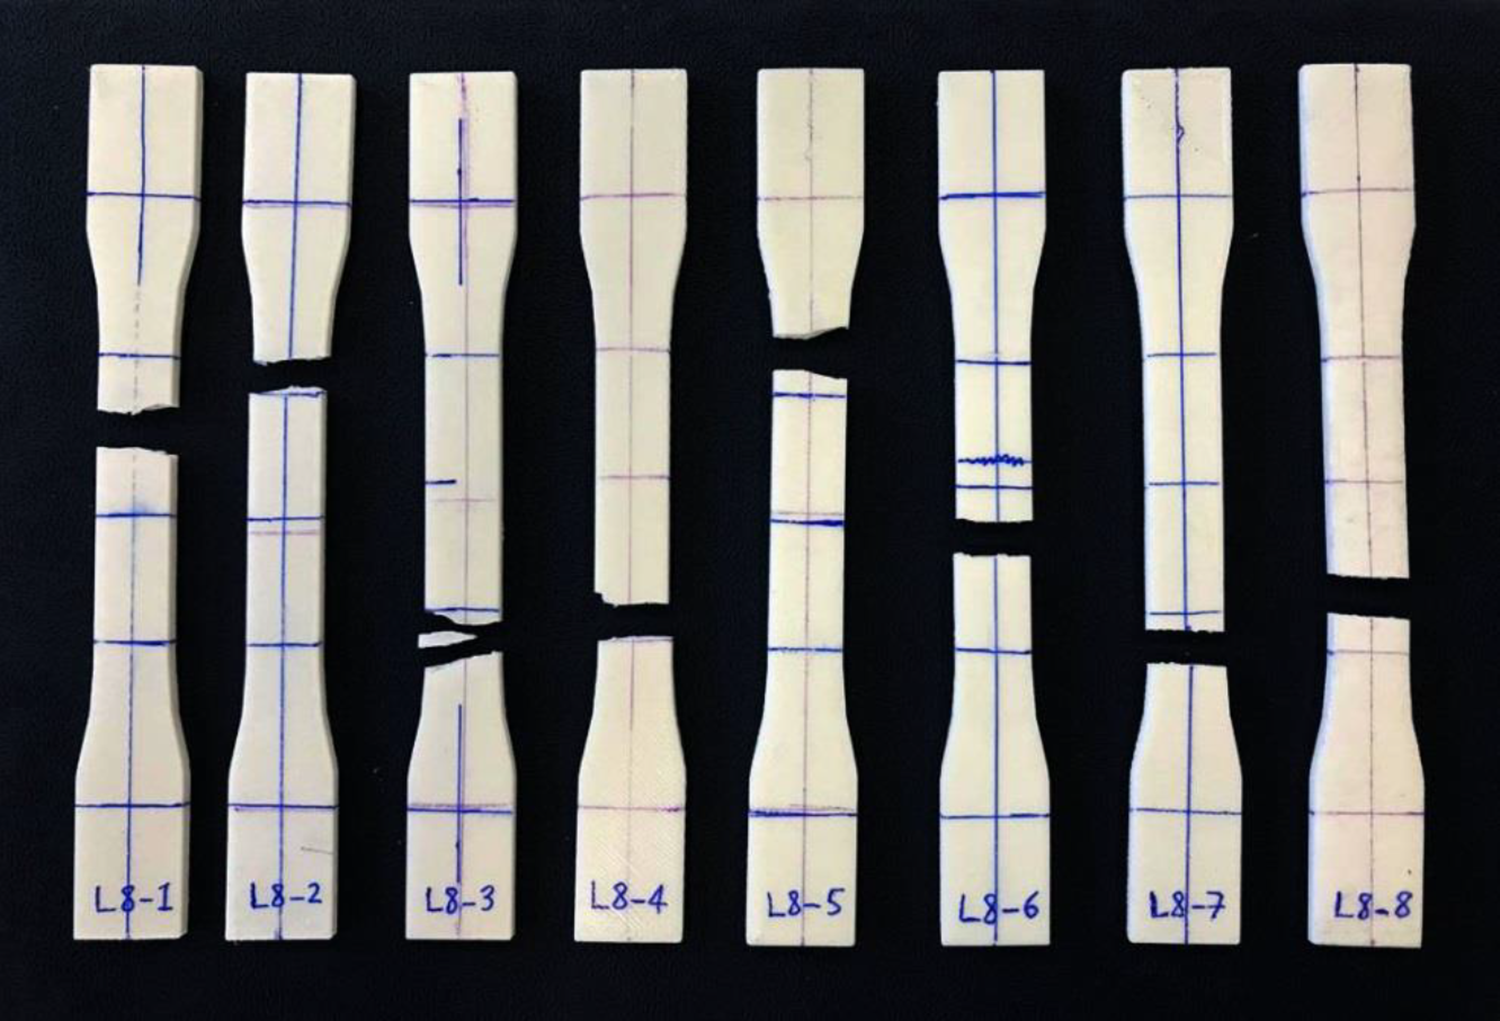
Fracture cross-section of eight specimens designed by the Taguchi method.
Generally, the Taguchi method uses S/N ratio diagrams to analyze the results. The S/N ratio diagram can be interpreted based on one of the three criteria mentioned in section 2.1. In this study, all parameters in the S/N ratio diagrams were analyzed based on “the larger, the better” criterion because our purpose was to maximize the mechanical properties such as elastic modulus, ultimate tensile strength, and failure strain. In S/N ratio diagram, the peak point shows the best condition. Figures 7 and 8 present the S/N ratio diagrams for the elastic modulus to weight (E/W) and strength to weight (Sut/W) ratios. The S/N ratio increases with increasing infill density while stays the same at higher printing speed or layer thickness. According to these two diagrams, it can be seen that some mechanical properties such as modulus of elasticity and ultimate strength in the range of infill density of 20% to 40% do not change too much, but in the range of 40% to 80% include significant changes. That is why that as the infill density increases, the penetration of the layers to each other increase and consequently interlayer strength also increase. Therefore, at high infill densities (i.e., in the range of 40–80%), the mechanical properties improve. The optimal process parameters for maximum elastic modulus and ultimate tensile strength were 80% infill density, 40 mm/s printing speed and 0.1 mm layer thickness.
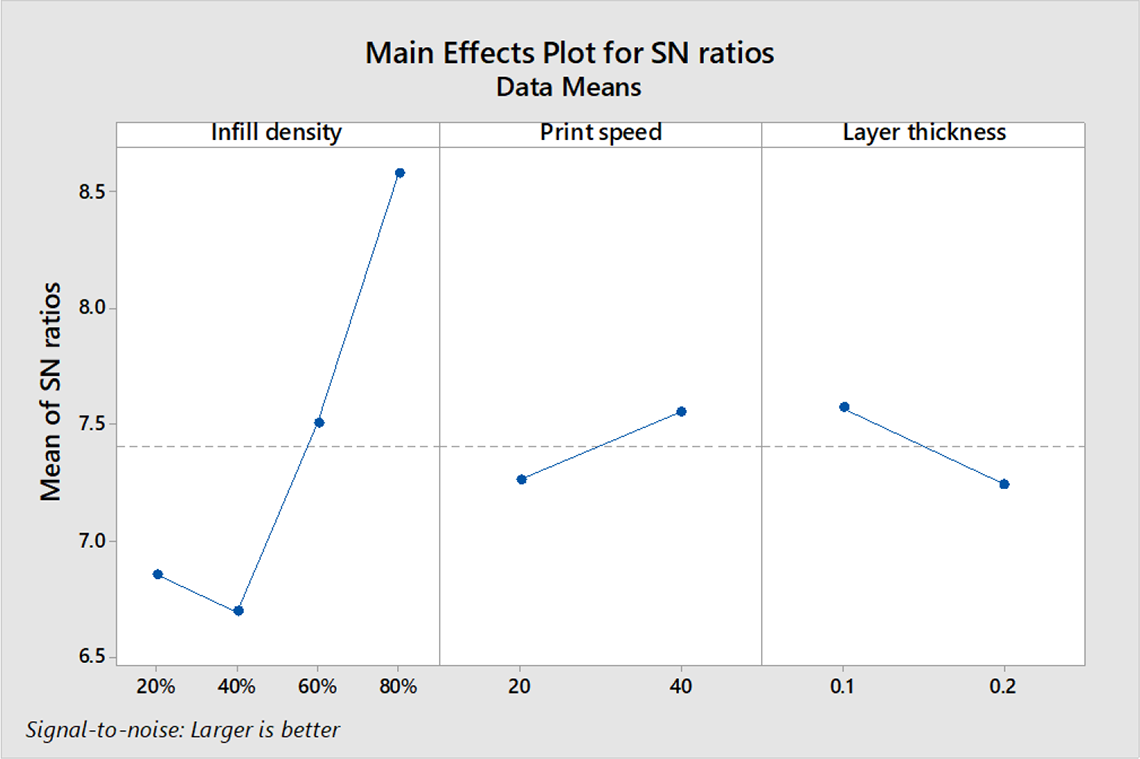
S/N ratio diagrams for the E/Weight parameter.
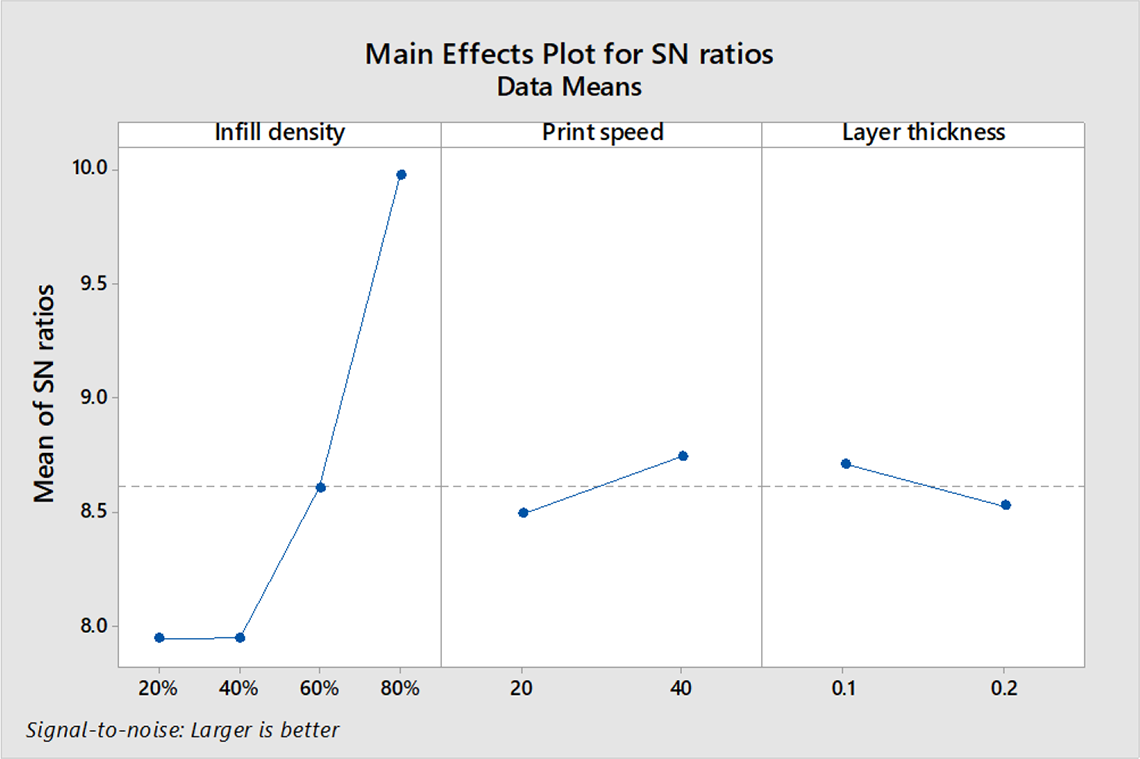
S/N ratio diagrams for the Sut/Weight parameter.
Figure 9 shows the S/N ratio diagram for the failure strain. As seen, the strain to failure only depends on infill density. On the basis of analysis, the optimum process parameters for larger failure strain were 80% infill density, 40 mm/s printing speed and 0.2 mm layer thickness. It should be noted that points 0.1 mm and 0.2 mm were close to the mean value (dashed central line) in Figure 9 and the difference between these two points is very small. It means that the effect of layer thickness on the failure strain is not significant.
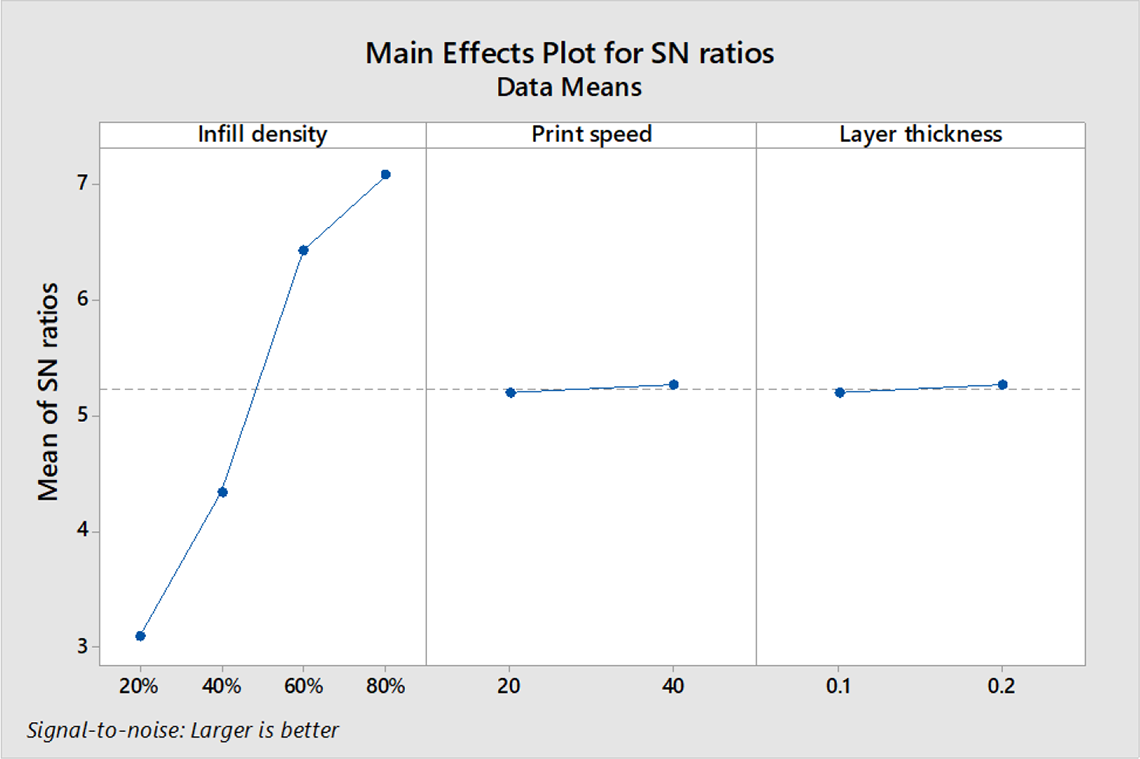
S/N ratio diagram for failure strain.
Validation of predicted properties with experimental results
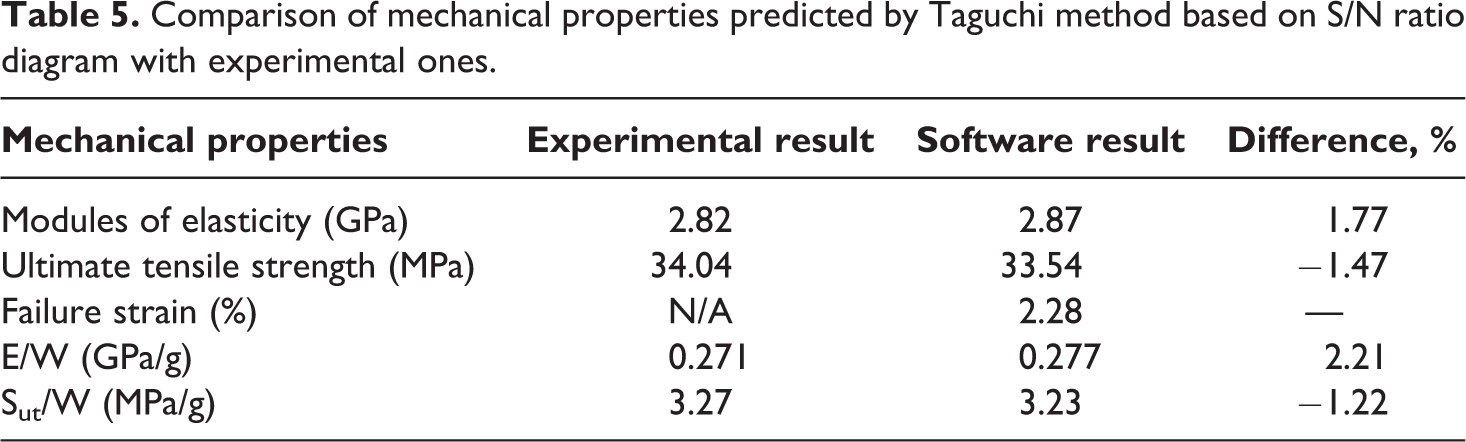
In this section, the accuracy of the Taguchi DOE method in predicting the mechanical properties of FDM 3D printed samples was investigated. Therefore, the values of elastic modulus and tensile strength for the optimum specimen (i.e., a specimen with infill density of 80%, printing speed of 40 mm/s and layer thickness of 0.1 mm) and the value of the failure strain for the optimum specimen (i.e., a specimen with infill density of 80%, printing speed of 40 mm/s and layer thickness of 0.2 mm) was predicted by the Taguchi method and compared to the experimental results in Table 5. The experimental failure strain value is not included in this table because the optimum specimen for the failure strain was not designed per Taguchi method (Table 2). As seen in Table 5, the maximum difference is about 2.2%. In addition to the excellent prediction of the Taguchi method, it is able to predict the mechanical properties of other specimens (of 16 specimens) which are not listed in L8 orthogonal array.
Comparison of mechanical properties predicted by Taguchi method based on S/N ratio diagram with experimental ones.
In order to investigate the accuracy of Taguchi method in predicting the failure strain, a specimen with optimal conditions for the failure strain was printed and tested again. Figure 10 shows the stress–strain curve of this specimen. The average value of failure strain was 2.21 ± 0.05%. The maximum difference between this value and the predicted one by the Taguchi method was about 3.2%. Therefore, it proved that Taguchi method is a reliable method for prediction of mechanical properties of FDM 3D printed specimens with good accuracy.
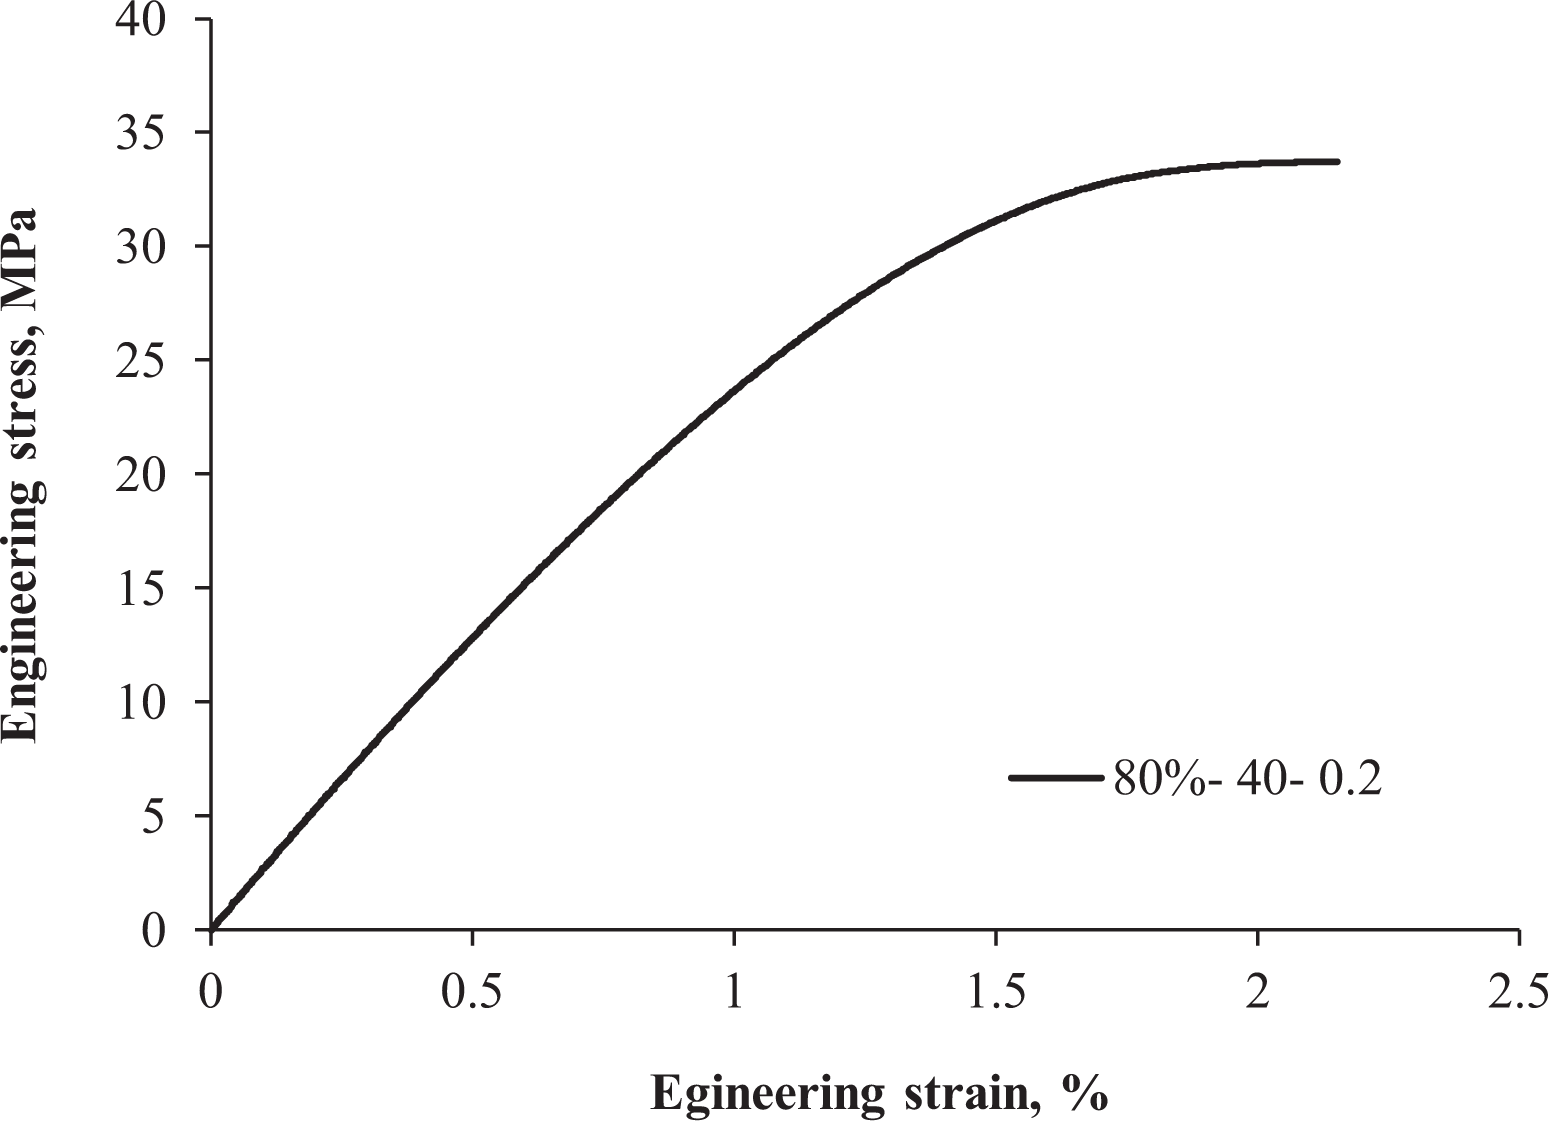
The engineering stress–strain curve of the specimen with infill density of 80%, print speed of 40 mm/s and layer thickness of 0.2 mm (the optimum specimen for failure strain).
Conclusions
In this study, Taguchi DOE method was used to find optimal FDM process parameters for maximum tensile properties of PLA specimens. Among various process parameters, three parameters of infill density, layer thickness and printing speed were chosen because they are common parameters usually changed at first step by engineers to make a lightweight specimen with minimum time and cost. Therefore, it is necessary to investigate simultaneously the effect of these three process parameters on the tensile properties of 3D printed specimens with focus on the failure strain. According to the factors and levels selected, the L8 orthogonal array and the signal to noise ratio (S/N ratio) have been used for the Taguchi method to reduce the number of tests from 16 to 8. The S/N ratio diagrams were analyzed based on the “the larger, the better” criterion. The optimal conditions for both the modulus of elasticity and ultimate tensile strength were infill density of 80%, printing speed of 40 mm/s and layer thickness of 0.1 mm. While the optimal process parameters for the failure strain were infill density of 80%, printing speed of 40 mm/s and layer thickness of 0.2 mm. Also, the accuracy of the Taguchi method in prediction of mechanical properties of FDM-3D printed specimens was assessed. Comparison of experimental elastic modulus, ultimate tensile strength and failure strain by the values predicted by the Taguchi method for the optimum specimens showed that this is a reliable method and is able to predict the mechanical properties of other samples which are not listed at the orthogonal array with excellent accuracy.