
Abstract
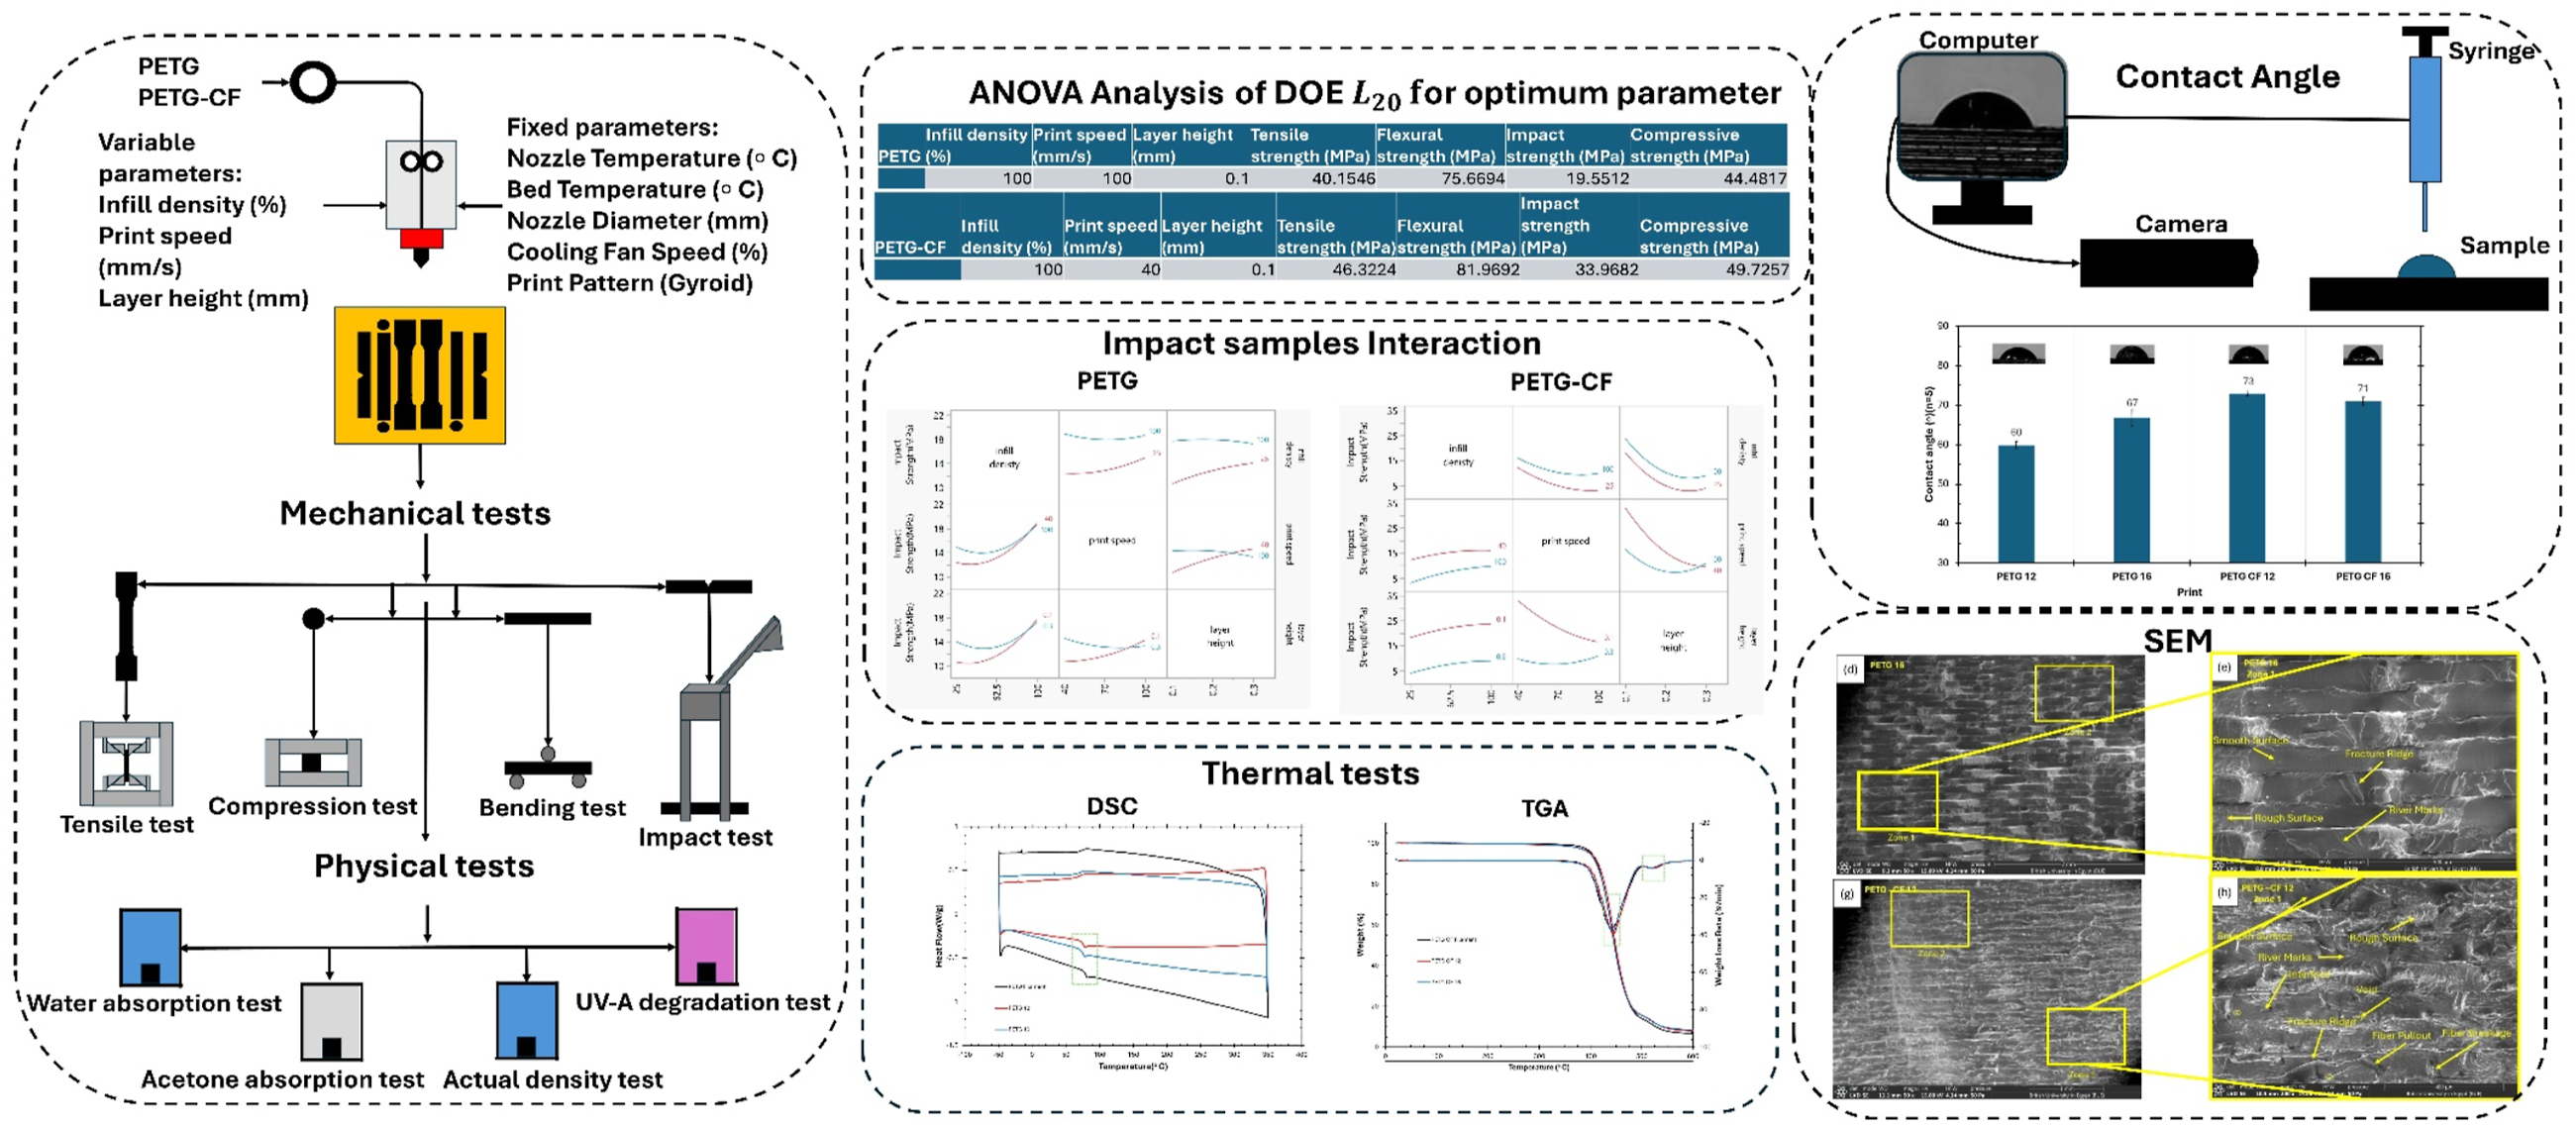
This study presents process optimization of fused deposition modeling (FDM) to enhance the physio-mechanical performance of polyethylene terephthalate glycol (PETG) and polyethylene terephthalate glycol - carbon fiber (PETG-CF) for automotive applications. A Central Composite Design (CCD) is implemented using Response Surface Methodology (RSM) to examine the combination of infill density, print speed, and layer height. Mechanical properties (tensile, flexural, impact, and compression), density, solvent absorption, UV-A resistance, thermal analysis (DSC and TGA), contact angle, and SEM fractography were evaluated. Results show that infill density has the most significant effect on all mechanical properties, while print speed and layer height enhance interlayer adhesion. PETG exhibits warpage at low print speed, but optimized parameters achieve a tensile strength of 40.2 MPa, flexural strength of 75.7 MPa, impact strength of 19.5 kJ/m2, and compressive strength of 44.5 MPa. PETG-CF samples exhibit lower strength due to poor fiber-matrix adhesion. However, the optimized parameter improved mechanical strength, achieving a tensile strength of 46.4 MPa, flexural strength of 81.9 MPa, impact strength of 33.9 kJ/m2, and compressive strength of 49.7 MPa. Water and acetone absorption and UV-A degradation tests confirm structural stability for outdoor applications. This study provides insight into interaction and optimized parameters for durable, lightweight automotive parts with demonstrated chemical resistance from solvent-absorption tests.
Keywords
Highlights
A Central Composite Design is implemented using Response Surface Methodology for optimization. PETG and PETG-CF composites are suitable for automotive applications. Carbon fibers enhanced the mechanical and thermal properties. Infill density had the strongest effect on mechanical properties; speed and layer height improved bonding. Solvent absorption and UV-A tests confirmed the stability for outdoor use.
Introduction
Additive manufacturing (AM) produces three-dimensional products directly from a CAD file. 1 Recently, this technology has important applications in various types of industries, including automotive, aerospace, medical, and defense. Nevertheless, they still require further development in some areas due to the high costs of the necessary equipment and materials. 2 These methods provide shorter processing times and greater flexibility. 3 With AM, different polymer material filaments, such as ABS, PLA, NYLON, PC, TPU, and PET (acrylonitrile–butadiene–styrene, polylactic acid, polyamide, polycarbonate, thermoplastic polyurethane, and polyethylene terephthalate), can be printed efficiently and with high dimensional accuracy. Polyethylene terephthalate (PET) is unique among these polymers due to its extensive applications. Polyethylene terephthalate glycol (PETG) is derived from PET by adding glycol and has better properties, such as higher flexibility, chemical resistance, and impact strength. PETG is suitable for AM applications due to its lower viscosity compared to pure PET and its mechanical properties, which are similar to those of PET. However, it has a slightly higher glass temperature (Tg), approximately 67°C. 4 Due to its semi-crystalline structure, PET deforms and has difficulty with interlayer adhesion during printing. 5
According to previous studies, the most effective parameters for enhancing performance are layer thickness, air gaps, infill density, temperature, and printing speed. Optimizing these factors increases strength, reliability, and overall print quality, indicating AM as a practical manufacturing process for high-performance applications.6,7 Because these parameters interact in non-linear ways, they should be analyzed jointly rather than individually. 8
Recent improvements in process optimization have enhanced the mechanical properties of AM-printed parts, particularly in fused deposition modeling (FDM) technologies. Studies have shown that using statistical and computational design of Experiments (DOE) methods improves print quality and mechanical strength. Deswal et al. 9 optimized process parameters using hybrid statistical tools such as Response Surface Methodology (RSM), Genetic Algorithms (GA), Artificial Neural Networks (ANN), and ANN-GA models. Srinivasan et al. 10 used RSM to determine the tensile strength of ABS printed parts, and as a result, they identified the optimal printing conditions that resulted in improvements in mechanical properties. Selvam et al. 11 used particle swarm optimization (PSO) to improve the strength of AM parts using carbon fiber strengthening and bio-inspired interlock sutures. Naveed et al. 12 used ANOVA-based statistical analysis to optimize 3D printing parameters for high-quality 3D printed parts. Saad et al. 13 used RSM, PSO, and SOS tools to optimize surface roughness, leading to an increase in surface quality. Das et al. 14 studied the crystallization and rheological properties of short carbon fiber-reinforced polyamide 6 (PA6-CF) filaments during the melt layer-by-layer deposition method by focusing on how important printing parameters such as layer thickness, raster angle, and filler pattern affected tensile properties, using the Taguchi method. Also, Moradi et al. 15 focused on optimizing process parameters of nylon parts by investigating the effect of layer thickness, infill density, and number of contours on mechanical qualities, using RSM to discover the best parameter and identifying layer thickness as the most important factor influencing performance. Tuncel et al. 16 used Taguchi and Grey Relational Analysis (GRA) to optimize parameters for ceramic-reinforced PLA, resulting in a 20.55% increase in tensile strength and a 43.75% reduction in production time.
While traditional optimization techniques, such as Taguchi, have proven effective in identifying the optimum parameters, hybrid statistical techniques response surface methodology (RSM), genetic algorithm (GA), grey relational analysis (GRA), particle swarm optimization (PSO), and artificial neural network (ANN), are becoming widely used for more complex materials and printing parameters, resulting in enhance of material performance. 17
In Kumar et al. 18 study of printing parameters for PETG composite reinforced with carbon fiber, it was discovered that printing speed and infill density increased tensile strength and hardness. In contrast, layer height and infill density increased bending strength. Similarly, Wang et al. 19 found that the reduction of layer height increases tensile strength by reducing structural gaps and internal voids. Kovan et al. 20 showed that layer thickness and print orientation have a significant effect on bonding strength, as gaps between filament rasters reduce adhesion qualities. Furthermore, Anitha et al. 21 revealed an inverse relationship between layer thickness and surface roughness, implying that reducing layer thickness enhances print surface quality. Nancharaiah et al. 22 and Valvez et al. 23 confirmed that decreasing layer thickness reduces voids while increasing mechanical properties. In addition, Tuncel et al. 17 revealed that a reduction in layer height results in increasing flexural strength by enhancing layer adhesion and reducing defects.
Kumar et al. 24 studied the effect of different infill densities (25%, 50%, 75%, and 100%) and annealing treatments on PETG and PETG-CF performance. Furthermore, Kumar et al. 25 studied the effect of infill density on the tensile properties of ASA. Similarly, Johnson et al. 26 investigated the effect of different infill densities (15%, 30%, 50%, 90%, and 100%) on the tensile property, indicating that the highest property was achieved with 100% infill.
However, infill density affects the mechanical properties of 3D printed parts, and other parameters have a major impact on the performance. Print speed is also another important parameter in determining the quality and durability of the finished product.27–30 For example, Christiyan et al. 31 discovered that increasing print speed results in a reduction of tensile and bending strength due to poor adhesion. Abeykoon et al. 32 revealed the effect of studying print speed and nozzle temperature to improve the material solidification process. Wang et al. 33 revealed that fiber-reinforced composites have high viscosity, making them unsuitable for high speed. In addition, Wang et al. 34 found that print speeds of more than 30 mm/s are considered insufficient. Higher print speeds result in lower extrusion volume, print quality, and more errors. Lower printing speed, however, provides the material enough time to fuse successfully with the adjacent layer, enhancing the mechanical strength of the printed parts. 35 In addition, Wang et al. 34 found that high printing speed reduces tensile strength because consecutive layers overlap before complete fusion.
In material additive manufacturing (FDM/FFF), the mechanical properties of thermoplastic composites are influenced by the as-built consolidation and interlayer adhesion, not only by process parameters. As mentioned in a previous research, 36 FFF/FDM process parameters affect the quality of the product, highlighting the fundamental function of as-built quality in determining outputs. Because FDM creates parts through deposition of successive layers, the reliability of the component depends on the ability of each newly deposited layer to fuse and form a bond with the previous layer; as described by Mishra et al., 36 the new layer fuses, forming a bond, emphasizing that operating conditions affect final part quality. When fusion is insufficient, voids/gaps and delamination remain trapped; for example, Mishra et al., 36 assigned void gaps to physical gaps and non-uniform extrusion of a semi-molten matrix and showed that increasing print speed decreases density and reduces compressive and flexural strength. In addition, Kam et al. 37 directly linked low mechanical properties to poor interlayer adhesion and porous zones within FDM parts. Accordingly, improving fusion conditions is suggested to improve performance: Mishra et al. 36 discussed modifying delamination by increasing nozzle temperature, thermal settings, particularly nozzle temperature and bed temperature, influence interlayer adhesion due to controlling melt viscosity, interfacial wetting, and the time-temperature window available for polymer-chain interdiffusion before solidification, 38 while other researchers highlighted the importance of wetting and a heated environment, closed chamber printing, to enhance bonding in fiber reinforced systems. In addition, maintaining a warm build environment can reduce thermal gradient and help preserve interlayer bonding continuity, especially for fiber-reinforced thermoplastics, where defects and interfacial weakness are noticeable. This becomes critical for carbon fiber thermoplastic printing, where Chaudhry et al. 39 noted that poor interlaminar strength is associated with pore defects and weak layer adhesion, reinforcing that process optimization should be explained through its impact on defects and interfacial bonding rather than parameters alone.
In recent years, there has been a growing interest in developing the mechanical performance of materials produced by AM, especially for automotive applications. The literature review reveals a research gap in investigating the combined effects of infill density, print speed, and layer height on the mechanical properties. Although the filaments are standard commercial grades, the novelty lies in the integrated multi-response optimization and validation across both neat and CF-reinforced PETG. This study optimizes infill density, print speed, and layer height across PETG and PETG-CF and validates the process using tensile, flexural, impact, and compression tests together with thermal, solvent/UV, density/porosity, and SEM analyses in a single DOE–RSM framework, providing application-oriented parameter windows rather than single-property optimization.
Experimental procedure
Materials
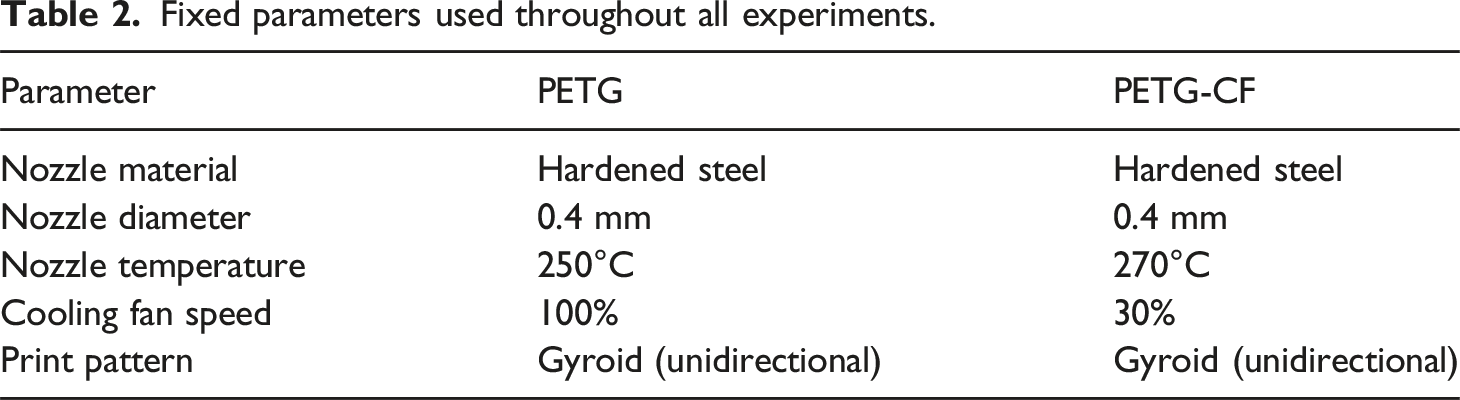
Commercial PETG filament (eSUN) and PETG–carbon-fiber filament (Lynx) were used. Before printing, the spools were dried in an eSUN filament dryer (model eBOX) at 65°C for 6 h for PETG and 70°C for 8 h for PETG-CF, then stored in a desiccant chamber until printing.
DOE using RSM
In this study, Response surface methodology was employed to create a predictive model and improve the mechanical properties. Unlike discrete experimental designs such as Taguchi or complete factorial, RSM considers input parameters as continuous variables, allowing for more exploration and determining optimal parameters with constraints. A Central Composite Design (CCD) with α = 1 was chosen to keep all axial points within the filament manufacturing printing ranges. This procedure allows for the examination of extreme parameters without exceeding the processing parameter range. All statistical analyses were conducted at a 95 % confidence level, and parameters were considered significant when the p-value was below 0.05. The developed models were validated in Minitab using quadratic regression terms, and the predicted responses were compared with experimental results to confirm model reliability.
Three process parameters were chosen as variables due to the previous literature review and their impact on the mechanical properties, namely infill density, print speed, and layer height. PETG and PETG-CF had the same ranges for these parameters, with an infill density range from 25 to 100%, print speed range from 40 to 100 mm/s, and layer height range from 0.1 to 0.3 mm.
The investigated parameter ranges were selected using a two-stage approach to ensure that the DOE was conducted inside a feasible processing window that promotes stable deposition and high interlayer adhesion. First, preliminary trials were used to exclude nozzle temperature conditions that produced unstable extrusion or loss of dimensional stability in samples; for example, Ayari et al. 40 reported that insufficient deposition temperature leads to weak interlayer bonding due to insuffiencet molecular chain fusion and that lower temperature can increase viscosity, reduce filament fluidity, and limit polymer chain interpenetration, promoting porosity/cracks and poor interlayer adhesion, which directly supports the elimination of low temperaute setting that cannot produce consistent bonding. Second, the limits of print speed and layer height were screened to avoid combination that shorten the fusion window and accelerate solidification; as mentioned by Mahesh et al., 41 higher printing speeds and thicker layers cause incomplete bonding and rapid solidification, producing layer irregular micropores that act as crack initiation points and reduce the effective load bearing area, which aligns with selecting speedl layer height renages that minimize void retention. This screening is consistent with the thermal-time relation mentioned by Ayari et al., 40 where increasing the feed rate reduces deposition time per layer and increases cooling rate, thereby reducing chain interdiffusion, and with DOE literature emphasizing that mechanical properties depend on the correct selection of key parameters such as printing speed and layer thickness. 42 In thermoplastic or thermoplastic composite printing, maintaining a high-quality window is essential because failure can be caused by weak layer interfaces. As mentioned by Tanabi et al., 43 premature shear failure is attributed to weak adhesive bonding between the deposited layer, reinforcing that parameter ranges should be justified through their effects on as-built bonding and defect formation rather than parameter value alone. To isolate the effects of selected DOE variables, nozzle and bed temperatures were kept constant during the RSM experiments.
Experimental matrix used in the Central Composite Design (CCD) for Response Surface Methodology (RSM), including 20 experimental runs for evaluating the effects of infill density, print speed, and layer height on the properties.
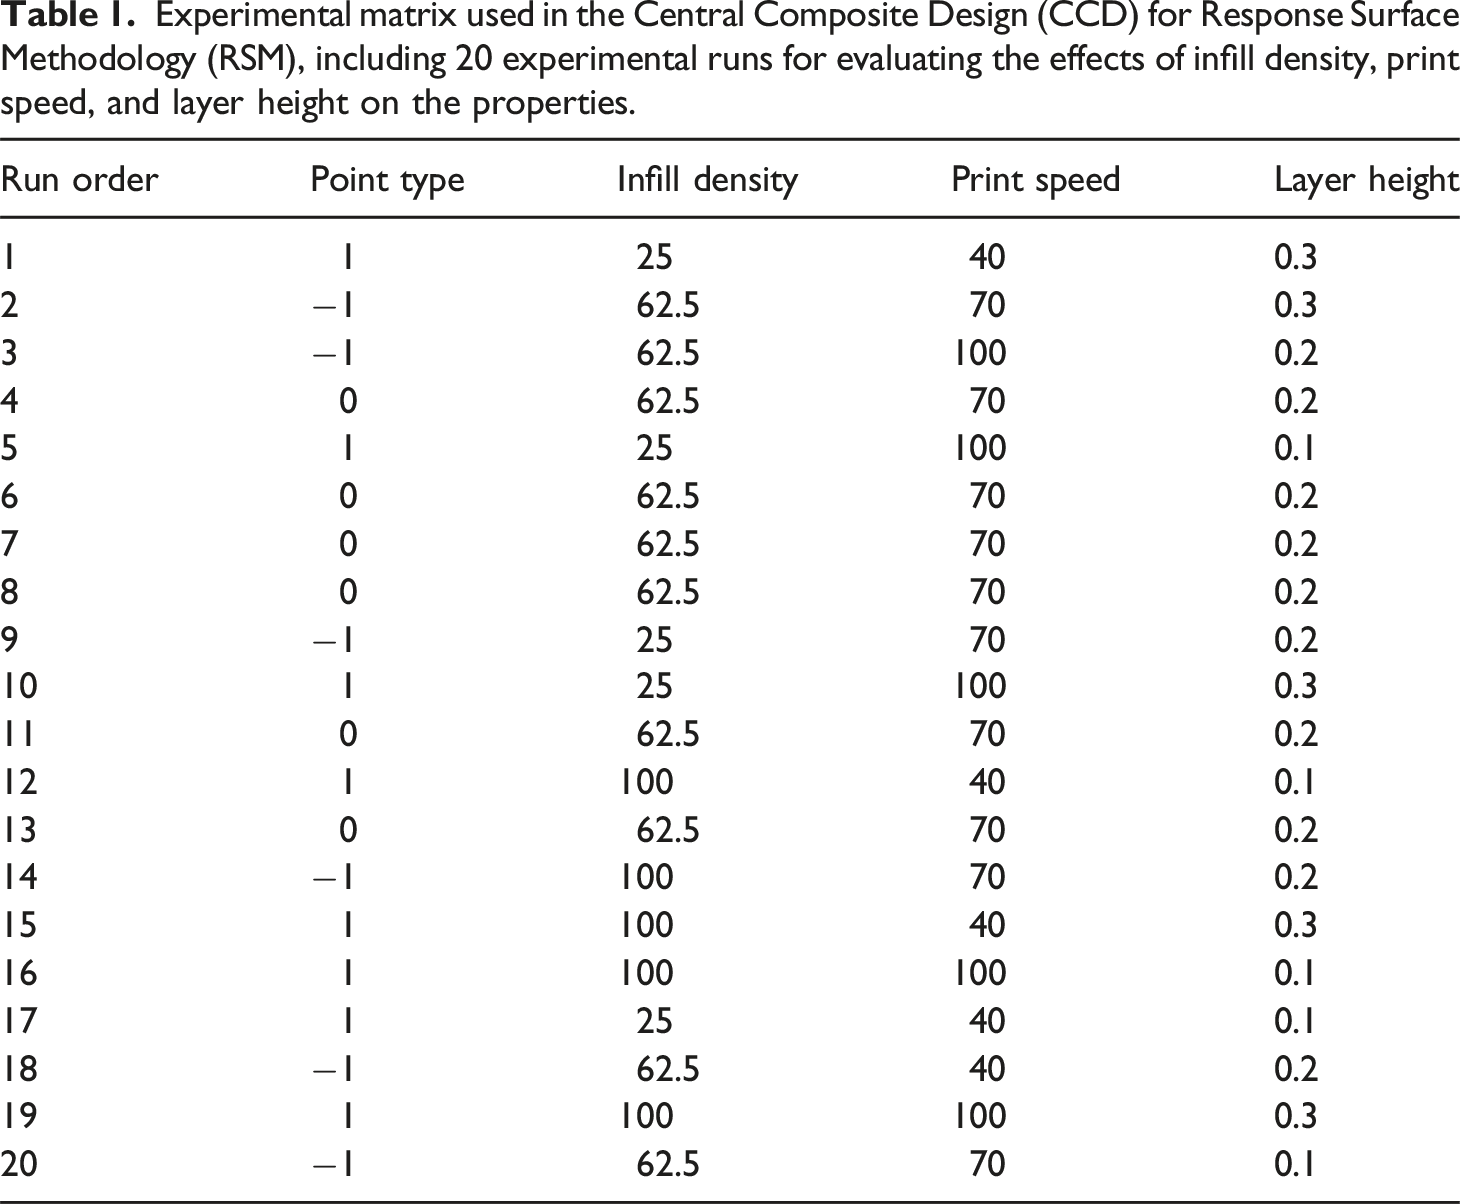
These parameters were sliced to generate G-code in Ultimaker Cura using different parameters. Each parameter was investigated at three coded levels (−1, 0, and 1), allowing for second-order polynomial modeling and interaction analysis.
Fixed parameters used throughout all experiments.
Mechanical tests
The tensile test of the 3D-printed specimens was evaluated according to ASTM D638 using the LR300 LLOYD universal testing machine. A Type I specimen with a gauge length of 50 mm, a width of 13 mm, and a thickness of 3.6 mm was used. The test was conducted at 25°C, with a speed of 0.5 mm/min until fracture. The average values of five specimens were determined.
Flexural properties of the 3D-printed specimens were determined according to ASTM D790 using a three-point bending test on the LRX LLOYD universal testing machine. 44 The length, width, and thickness of the specimen are 80 mm, 10 mm, and 4 mm, respectively. The test was performed at 25°C with a crosshead speed of 2.25 mm/min, and a span length of 60 mm until failure. The average values of five specimens were determined.
Impact resistance of the 3D-printed specimens was carried out at 25°C and according to ASTM D61100 using the notched Charpy method on XJJU-5.5/50J Izod and Charpy impact tester with a 2J for printed PETG and 5J for printed PETG-CF. Each specimen has a length of 63.5 mm, a width of 12.7 mm, and a thickness of 4 mm, with a 45◦ notch and a 2.5 mm notch depth. The average values of five specimens were determined. 45
The compression characteristics of the 3D-printed specimens were examined according to ASTM D695 using the LR300 LLOYD universal testing machine. 46 The specimens were printed in a cylindrical shape, with a diameter of 10 mm and a height of 15 mm. The test was conducted at 25°C with a crosshead speed of 1 mm/min until failure. The average values of five specimens were determined. The d imensions and geometries of the 3D-printed PETG specimens used in this study are shown in Figure 1.
Physical tests
3D-printed cubic specimens of 10 mm in length, width, and height were used to examine the density, solvent immersion, and porosity measurement.
The actual density was measured by measuring the dimensions using a digital micrometer and the mass using a precision balance. The theoretical density was obtained from Ultimaker CURA slicing software based on the print parameters. Immersion tests were carried out to determine the absorption behavior and chemical resistance of 3D-printed samples in distilled water and 99% acetone. Due to the low density of some printed samples, which float during immersion, each sample was placed in a vacuum-sealed plastic bag with distilled water and acetone to provide uniform solvent exposure from all directions and stored at room temperature for 7 days. After the study period, the samples were removed and air-dried for 24 h at room temperature to allow the solvent evaporation. The initial and final masses of the specimen were measured to determine the absorption percentage. Porosity was calculated by comparing theoretical density with the actual density using equation (1).
An aging test was performed with a UV-A lamp to evaluate the ultraviolet (UV) resistance of the 3D-printed samples. The printed cubic specimen with an edge of 10 mm was placed 40 mm from the UV-A lamp for 4 weeks. The mass loss percentage was evaluated by measuring the mass of the specimen before the test, after 2 weeks of exposure, and after 4 weeks of exposure to UV radiation. The interrupted and total mass loss percentages were calculated.
Thermal properties of PETG filament, PETG-CF filament, and selected conditions of printed PETG and PETG-CF were studied using c (DSC) and thermogravimetric analysis (TGA). In the DSC test, a sample of 6.5 mg was in an Aluminum pan sealed by TzeroPress. The test was conducted using DSC Q2000, calibrated by pure indium, and by heating and cooling the specimen from −50°C to 300°C three cycles in a nitrogen atmosphere with a heating rate of 10°C.
47
The crystallization index of PETG was calculated by
Thermogravimetric analysis (TGA) and its derivative (Derivative Thermogravimetry: DTG) were carried out using a TGA Q500 instrument in a nitrogen environment with a flow rate of 50.0 mL/min. The mass of the specimen was around 6.5 mg, and was heated in an alumina pan from 20°C to 700°C with a heating rate of 10°C/minute. 48
A wettability test was carried out to determine the surface properties of selected conditions of printed PETG and PETG-CF samples. A contact angle measurement setup was initiated, with a sample holder platform, a 1 mL syringe positioned vertically above the sample for droplet dispersion, and a camera located opposite the sample setup to record photographs of the droplet. Ossila software was used to measure the contact angle (Ѳ) between water droplets and the sample surface at five different positions. 37 The contact angle was measured as the angle tangent to the liquid-vapor interface and the solid surface at the point of contact. The surface has a contact angle of Ѳ <90° are hydrophilic, whereas those with Ѳ >90° are hydrophobic. 49
The fracture analysis of selected conditions from the impact test was studied using a ThermoFisher Quattro S Field Emission Gun Environment Scanning Electron Microscope (FEG-ESEM, United States). Images were captured at different magnifications to investigate the fracture mechanism. Dimensions and geometries of the 3D-printed PETG specimens used in this study: (a) Tensile test specimen, (b) three-point bending specimen, (c) notched impact specimen, (d) cylindrical compression specimen, and (e) cubic specimen (10 mm × 10 mm × 10 mm).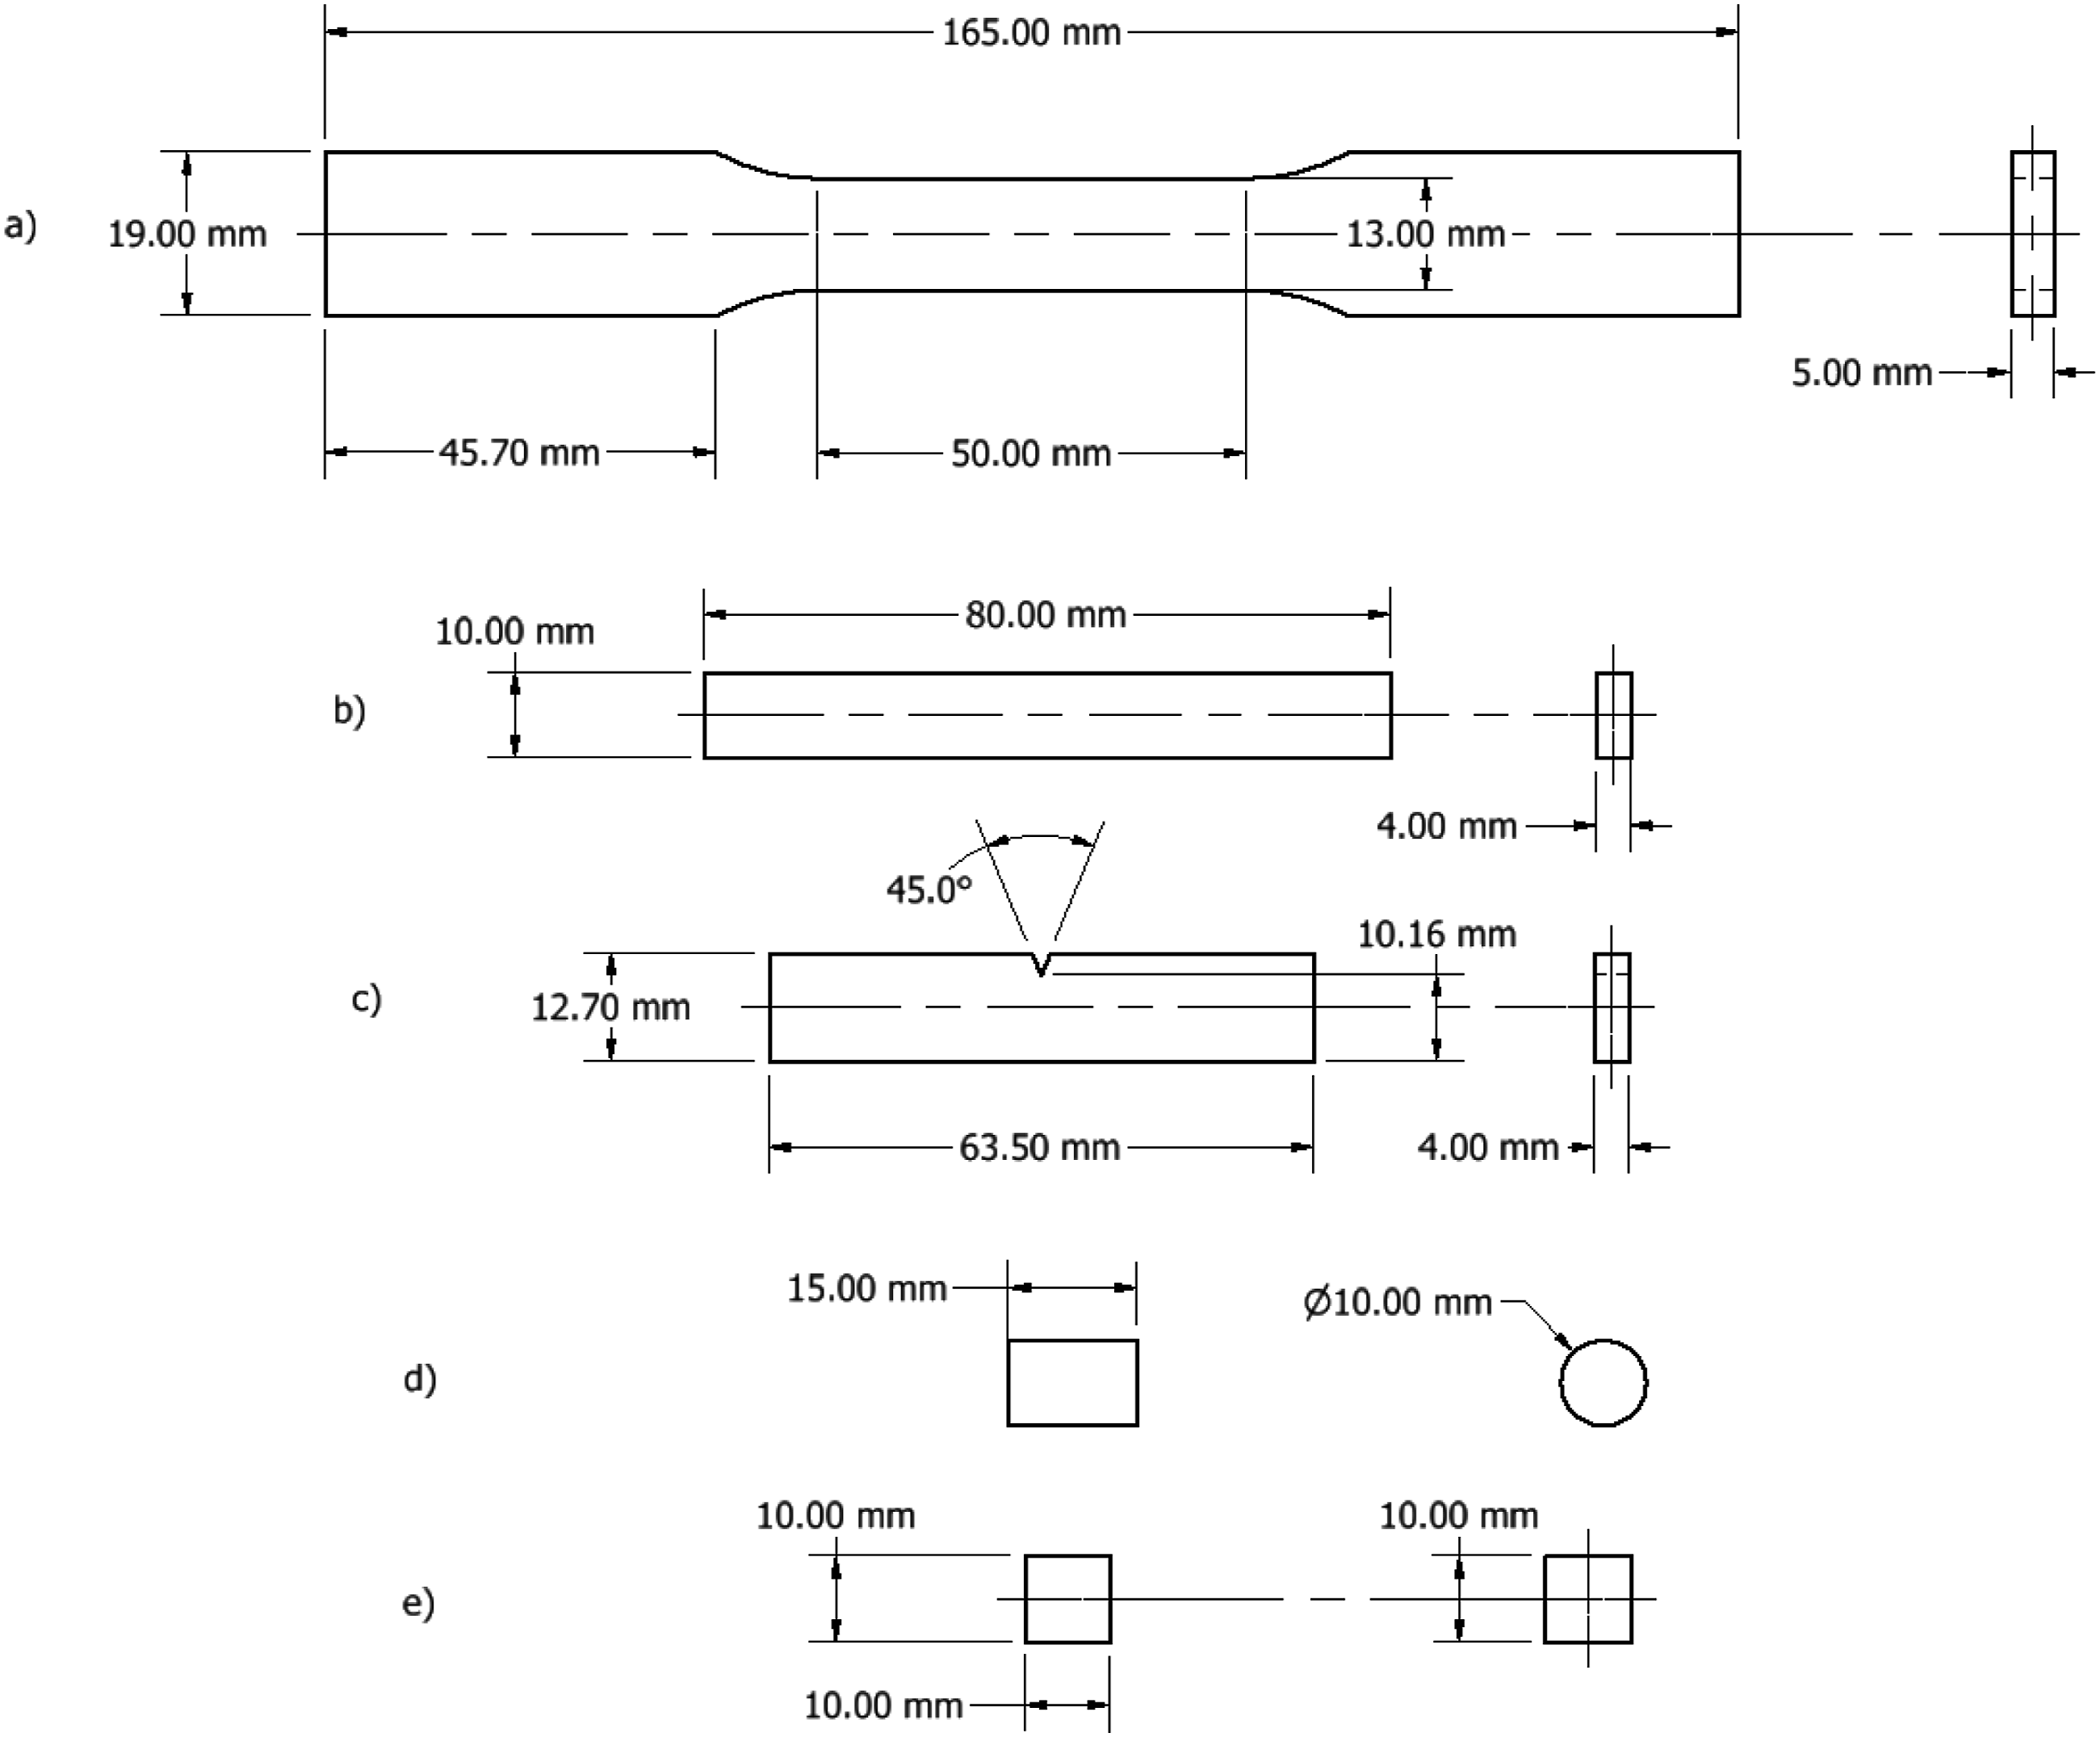
Results and discussion
Anova analysis
Tensile test
PETG ANOVA results, as shown in Supplemental Table 1, indicate that the process parameters have a different impact on the tensile response. Infill density is the most significant factor with the linear term (F = 115.65, p = 0) and quadratic term (F = 5.35, p = 0.043). This indicates that infill density has a major influence on tensile strength and has a parabolic trend with a linear trend. However, the linear term of print speed (F = 0.12, p = 0.738) and the linear term of layer height (F = 0.15, p = 0.703) were determined to be insignificant, indicating a minor influence. In addition, quadratic terms have minimal effect (F = 0.28, p = 0.606) and (F = 0.03, p = 0.87). In Addition, the two-way interactions between the factors did not markedly affect the tensile strength, including interactions such as infill density and print speed (F = 0.45, p = 0.517), infill density and layer height (F = 0, p = 0.95), and print speed and layer height (F = 0.25, p = 0.631).
The PETG-CF ANOVA results, as shown in Supplemental Table 2, remained similar, with the infill density appearing as the most important parameter with both its linear (F = 206.34, p = 0) and quadratic (F = 6.64, p = 0.028). However, the effects of the linear term of print speed (F = 0.99, p = 0.339) or quadratic (F = 1.5, p = 0.249) and linear term of layer height (F = 1.45, p = 0.249) or quadratic (F = 0.89, p = 0.369) are insignificant. Among the two-way interactions, the interaction between infill density and print speed was significant (F = 9, p = 0.013), demonstrating that the benefit of a high or low infill density on tensile strength in PETG-CF depends on the print speed used. However, under the tested conditions, there is no significant interaction between infill density and layer height (F = 4.37, p = 0.063) or print speed and layer height (F = 0.62, p = 0.449).
Bending test
The PETG ANOVA results, as shown in Supplemental Table 3, have a major influence on the linear term of infill density (F = 52.87, p = 0) on flexural strength. On the other hand, the linear term of print (F = 0.25, p = 0.625) and layer height (F = 1.76, p = 0.215) are determined to be insignificant within the study parameter range. The quadratic terms, such as print speed (F = 0.05, p = 0.835) and layer height (F = 0.72, p = 0.416), were all insignificant, including infill density (F = 3.17, p = 0.105). The relation between flexural strength and infill density, in contrast, is linear rather than parabolic. The two-way interactions within the parameters are not significant (F = 0.82, p = 0.513), including infill density and print speed (F = 0.73, p = 0.414), infill density and layer height (F = 0.86, p = 0.375), and print speed and layer height (F = 0.86, p = 0.375).
However, the PETG-CF ANOVA results, as shown in Supplemental Table 4, show a major effect of the linear term of infill density (F = 225.5, p = 0) and layer height (F = 24.45, p = 0.001) on the flexural strength. Linear term of print speed, however, is not significant (F = 2.07, p = 0.181). The quadratic term of infill density (F = 6.91, p = 0.025) is significant, indicating a parabolic relation between infill density and flexural strength. In contrast, the quadratic terms of print speed (F = 0.03, p = 0.875) and layer height (F = 3.53, p = 0.09) are not significant. The interactions between parameters show a significant effect on flexural strength (F = 6.77, p = 0.009), revealing that infill density and print speed (F = 15.64, p = 0.003) are the only significant interactions between parameters. On the other hand, infill density and layer height (F = 0.28, p = 0.611) and print speed and layer height (F = 4.4, p = 0.062) are not significant.
Impact test
PETG ANOVA results shown in Supplemental Table 5 show that the model is significant (F = 3.21, p = 0.042). Among the variables, the linear term of infill density (F = 13.89, p = 0.004) is the only significant factor, indicating its effect on the ability of the material to absorb energy. However, linear terms of print speed (F = 0.7, p = 0.421) and layer height (F = 1.16, p = 0.308) have no significant effect on impact strength. None of the quadratic terms are significant, including infill density (F = 3.69, p = 0.084), print speed (F = 0.39, p = 0.548), and layer height (F = 0.13, p = 0.724). This indicates a weak parabolic relation between factors and impact strength.
There were no significant two-way interactions between infill density and print speed (F = 0.86, p = 0.375), infill density and layer height (F = 1.56, p = 0.241), or print speed and layer height (F = 2.49, p = 0.146). These results demonstrate that infill density has the most major effect on impact strength, with a minor effect on print speed or layer height.
The PETG-CF ANOVA results shown in Supplemental Table 6 show a significant model (F = 33.81, p = 0), showing that all linear parameters had a major effect on impact strength. Layer height was the most significant factor (F = 137.1, p = 0), followed by print speed (F = 38.94, p = 0), and infill density (F = 18.18, p = 0.002). In Addition, the quadratic terms model is significant (F = 22.73, p = 0) with layer height (F = 26.43, p = 0) and print speed (F = 38.94, P = 0) showing significant parabolic effects. However, infill density (F = 38.94, p = 0) is not significant. The two-way interaction model (F = 13.98, p = 0.001) is significant. The only interaction between print speed and layer height was significant (F = 40.77, p = 0), suggesting a combined effect on impact strength. Other interactions, including infill density and print speed (F = 1.12, p = 0.316) and infill density and layer height (F = 0.04, p = 0.852), do not have a significant effect.
Compression test
Anova results of compressive yield strength of PETG, shown in Supplemental Table 7, reveal a significant model (F = 34.41, p = 0), demonstrating that the chosen parameters had a major impact on compression performance. The linear term of Infill density was the most effective factor (F = 281.12, p = 0), indicating its effect on compression strength. Print speed (F = 0, p = 0.963) and layer height (F = 1.18, p = 0.304) were not significant, indicating a minor linear influence on compression strength. The quadratic terms (F = 9.02, p = 0.003) are significant, including only infill density (F = 15.25, p = 0.003). This indicates a parabolic relation between infill density and compressive strength. None of the two-way interactions was significant. The response was not significantly affected by infill density and print speed (F = 0, p = 0.969), infill density and layer height (F = 0.03, p = 0.864), and print speed and layer height (F = 0.35, p = 0.566). These results indicate that compression strength is mainly affected by infill density, which has a low effect on print speed and layer height.
Anova results of compressive yield strength of PETG-CF, shown in Supplemental Table 8, showed a significant model (F = 89.17, p = 0) as the PETG model. Linear term Infill density (F = 744.54, p = 0) is the major contributor to compression strength. Nevertheless, print speed (F = 3.04, p = 0.112) and layer height (F = 4.21, p = 0.067) are not significant. The quadratic terms (F = 14.63, p = 0.001) are significant due to the quadratic effect of infill density (F = 26.94, p = 0), indicating a parabolic relation between infill density and compressive strength. On the other hand, the quadratic terms of print speed (F = 0.06, p = 0.814) and layer height (F = 0.57, p = 0.466) are not significant. There were no significant two-way interactions between infill density and print speed (F = 4.71, p = 0.055), infill density and layer height (F = 2.12, p = 0.176), or print speed and layer height (F = 0.02, p = 0.886). These indicate that, even for PETG and PETG-CF, infill density remains the most important factor affecting compression strength.
Model summary
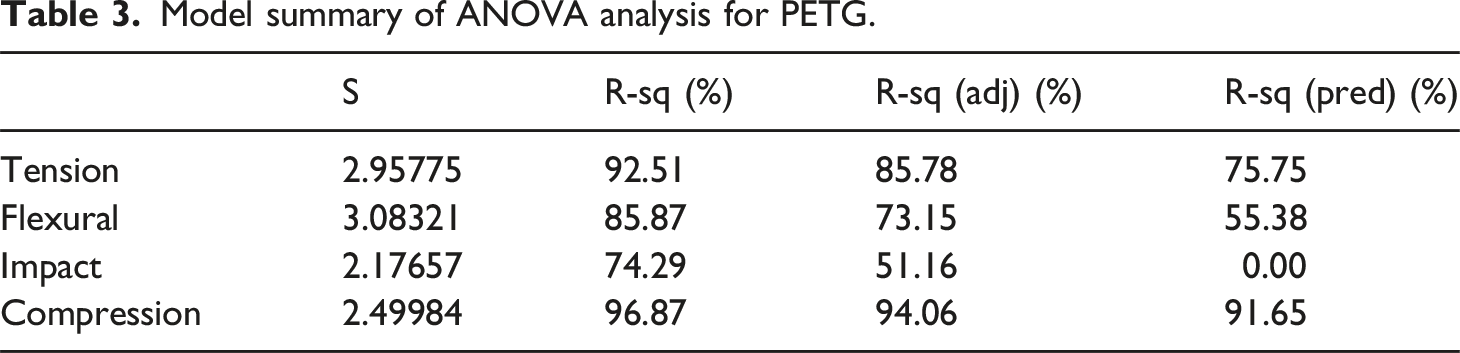
Model summary of ANOVA analysis for PETG.
Model summary of ANOVA analysis for PETG-CF.
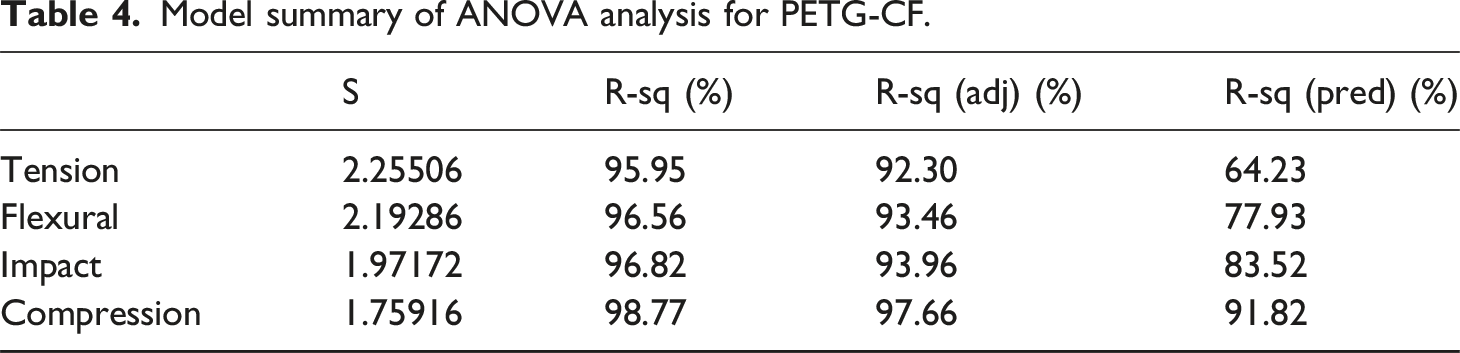
The flexural strength of PETG had an R-sq coefficient of (85.87%), an R-sq (adj) coefficient of (73.15%), and an R-sq (pred) coefficient of (55.38%), indicating an acceptable balance between model fitting and predictive response. In comparison, the Flexural strength of PETG-CF was modeled with a higher coefficient, with an R-sq coefficient of (96.56%), an R-sq (adj) coefficient of (93.46%), and an R-sq (pred) coefficient of (77.93%), showing a higher model fitting and predictive response.
However, the impact strength model remained the most challenging property for both materials. PETG model produced an R-sq coefficient of (74.29%), R-sq (adj) coefficient of (51.16%), and R-sq (pred) coefficient of (0%). Similarly, PETG-CF had a better-fitting model and predictive response with an R-sq coefficient of (96.82%), an R-sq (adj) coefficient of (93.96%), and an R-sq (pred) coefficient of (83.52%). This poor predictive response for PETG is due to the complex nature of the impact results, which include crack propagation, microvoid interactions, and energy absorption mechanisms that the second-order regression model cannot fully cover. Furthermore, the impact strength is affected by internal flaws, layer bonding quality, and specimen dimensions. 50
Notably, PETG demonstrated various mechanical responses compared to PETG-CF. For instance, at lower print speeds, a thicker layer height improves impact strength, while at higher print speeds, a thinner layer height has the same effect. This dual effect reduced model predictability for impact strength. Warpage, which was further studied through SEM, was also found at lower print speeds, introducing another variable to the mechanical properties model. As a result, adding more variables to the model affects the predictive response.
Response surface analysis
Tension test
Figure 2 shows surface plots of the tensile strength of PETG response as a function of infill density, print speed, and layer height. Figure 2(a) and (c) reveal that infill density concerning print speed and layer height has a major impact on tensile strength, but in Figure 2(e), print speed and layer height have a small influence on the strength. According to Anova, increasing infill density improves tensile strength, with 100% infill giving the highest tensile strength, achieving more than 40 MPa at different levels of layer height and print speed. This can be attributed to low void content with high infill density. However, increasing print speed reduced tensile strength.
26
Print speed exceeding 70 mm/s results in a tensile strength of less than 27.5 MPa due to insufficient time for complete bonding. On the other hand, low print speed produces warpage defects due to prolonged heat exposure. The same effect occurs when reducing layer height below 0.2 mm, in which the filament takes more heat energy than needed. Print speed and layer height have a direct connection to the exposure time and heat of filament, affecting the adhesion of printed samples.
39
These results indicate that maximizing infill density is an important factor in increasing the tensile strength of PETG while optimizing print speed and layer height to prevent softening or adhesion loss to the print structure. Response surface plots illustrate the effect of FDM parameters on the tensile strength of PETG and PETG-CF. (a, b) Interaction between infill density and print speed; (c, d) interaction between infill density and layer height; (e, f) interaction between print speed and layer height.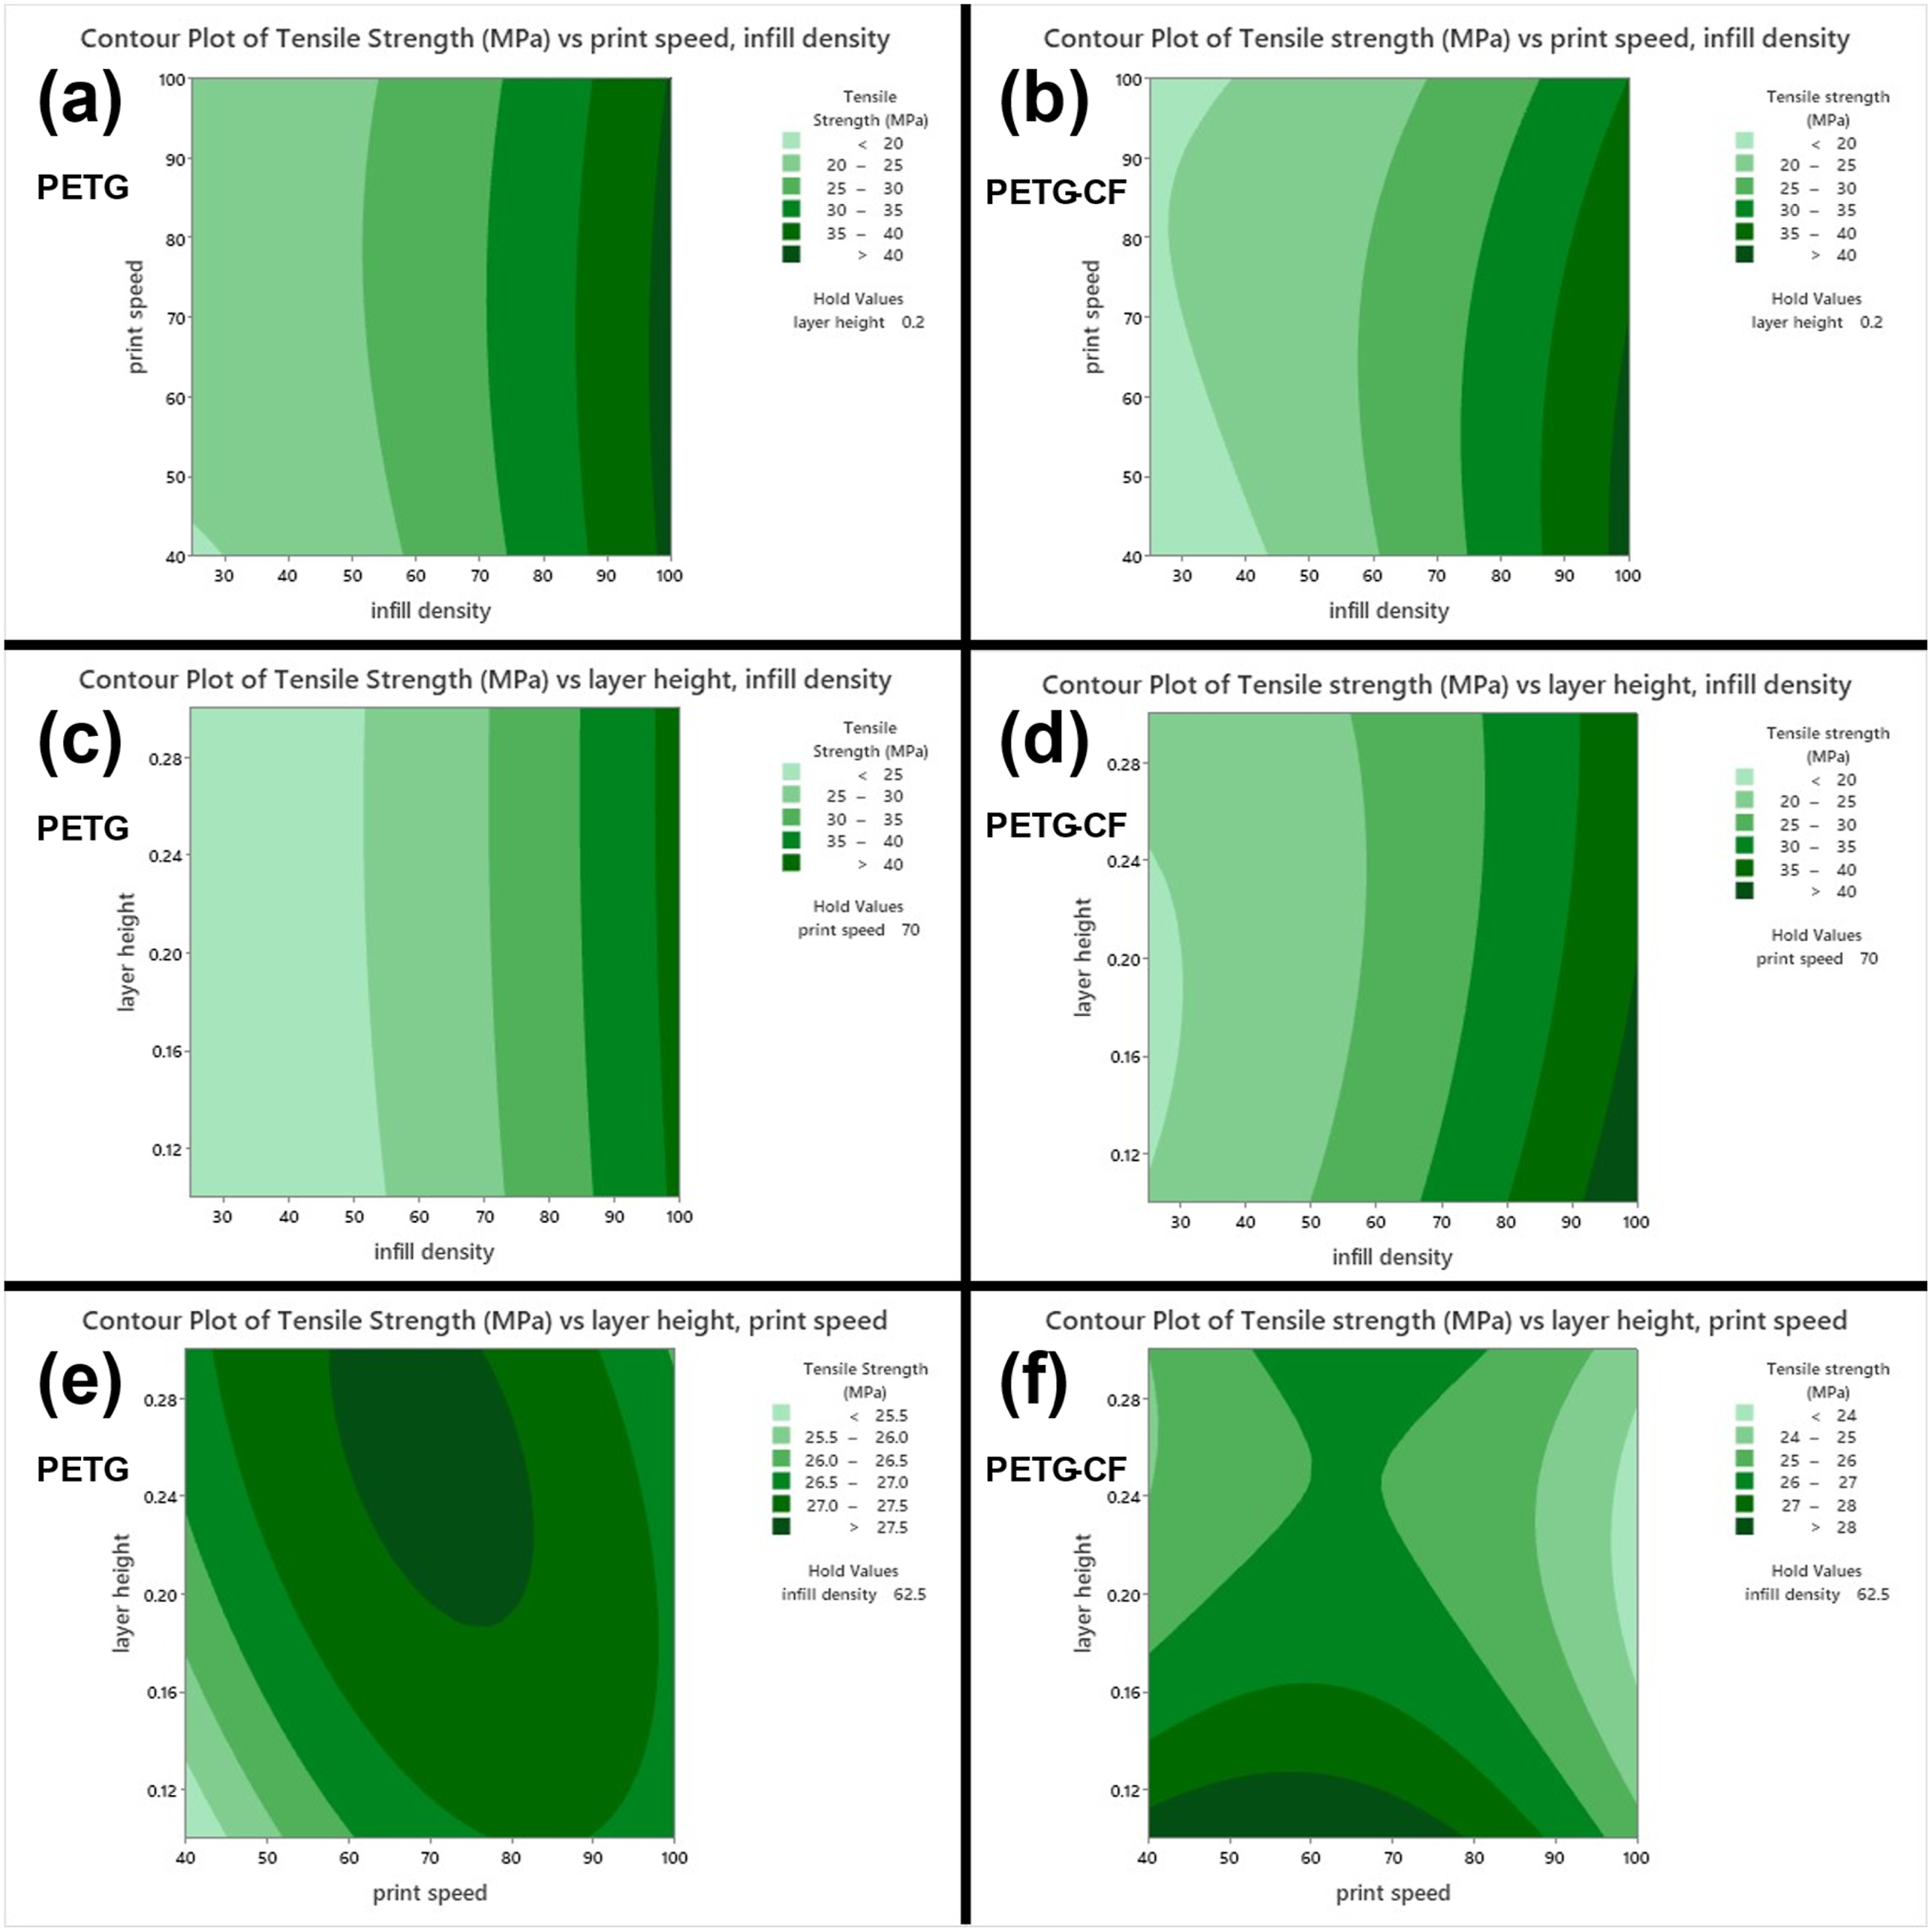
Figure 2(b), (d), and (f) show the surface plot of the tensile strength of PETG-CF concerning infill density, print speed, and layer height. Tensile strength, as shown in Figure 2(b) and (d), is markedly affected by infill density, with low impact of print speed and layer height. The highest strength is obtained at 100% infill density. On the other hand, print speed and layer height have a minor influence on tensile strength. The highest strength is obtained at low print speed and layer height. This can be related to increased interlayer adhesion and decreased void content. To clarify, the tensile strength increased to above 28 MPa when reducing the layer height below 0.12 mm with low to moderate print speed. As mentioned in a previous research, 40 the PETG composite containing carbon fiber demonstrates microstructural irregularities such as fiber fracture and porosity due to fiber agglomeration, which weakens layer bonding. According to the plot, High speed and thicker layer height reduce tensile strength. Batista et al. 80 concluded that PETG-CF had lower tensile strength than PETG due to poor interfacial adhesion under non-optimal print conditions. However, PETG-CF samples printed at lower speeds and with thinner layers have higher strength than PETG, demonstrating that carbon fibers enhance performance only under optimal conditions. More precisely, PETG-CF has higher strength due to prolonged thermal exposure, which improves fusion.
The tensile trend is consistent with the fact that the interlayer strength in the material-extrusion process is controlled by the non-isothermal temperature history of the deposited bead, because a longer time at sufficiently high temperature allows the polymer chain to move across the interface and form a stronger interlayer adhesion. 51
Bending test
Figure 3(a), (c), and (e) reveal the response surface contour plot of the flexural strength of PETG concerning infill density, print speed, and layer height. As shown in Figure 3(a) and (c), a higher infill density (100 %) results in the highest flexural strength, exceeding 72.5 MPa relating to print speed and 75 MPa relating to layer height. These improvements can be associated with low void content and good interlayer adhesion.
22
However, low infill density, with flexural strength below 60 MPa at 30% infill density, increases void content and diminishes interlayer bonding. Similarly, Figure 3(c) shows that lowering layer height from 0.3 mm to 0.1 mm at 100% infill density results in increasing strength from between 70 and 72.5 MPa to more than 75 MPa. According to previous results reported by Valvez et al.,
23
low layer height improves bonding by increasing interlayer contact area and decreasing internal voids. On the other hand, print speed and layer height, as mentioned in the ANOVA analysis, have a minor influence on the flexural strength. The response surface plot, as shown in Figure 3(e), demonstrates that printing at a high speed of about 90 to 100 mm/s at a layer height of less than 0.16 mm enhanced flexural strength to more than 65 MPa due to better heat transfer and good interlayer adhesion. In addition, at high print speed with lower layer height, an optimum heat transfer between layers was achieved, which resulted in appropriate layer adhesion. This illustrates that, while print speed and layer height are not major factors, such as infill density, their combined effects have a noticeable impact on interlayer adhesion and flexural strength. Response surface plots illustrate the effect of FDM parameters on the flexural strength of PETG and PETG-CF. (a, b) Interaction between infill density and print speed; (c, d) interaction between infill density and layer height; (e, f) interaction between print speed and layer height.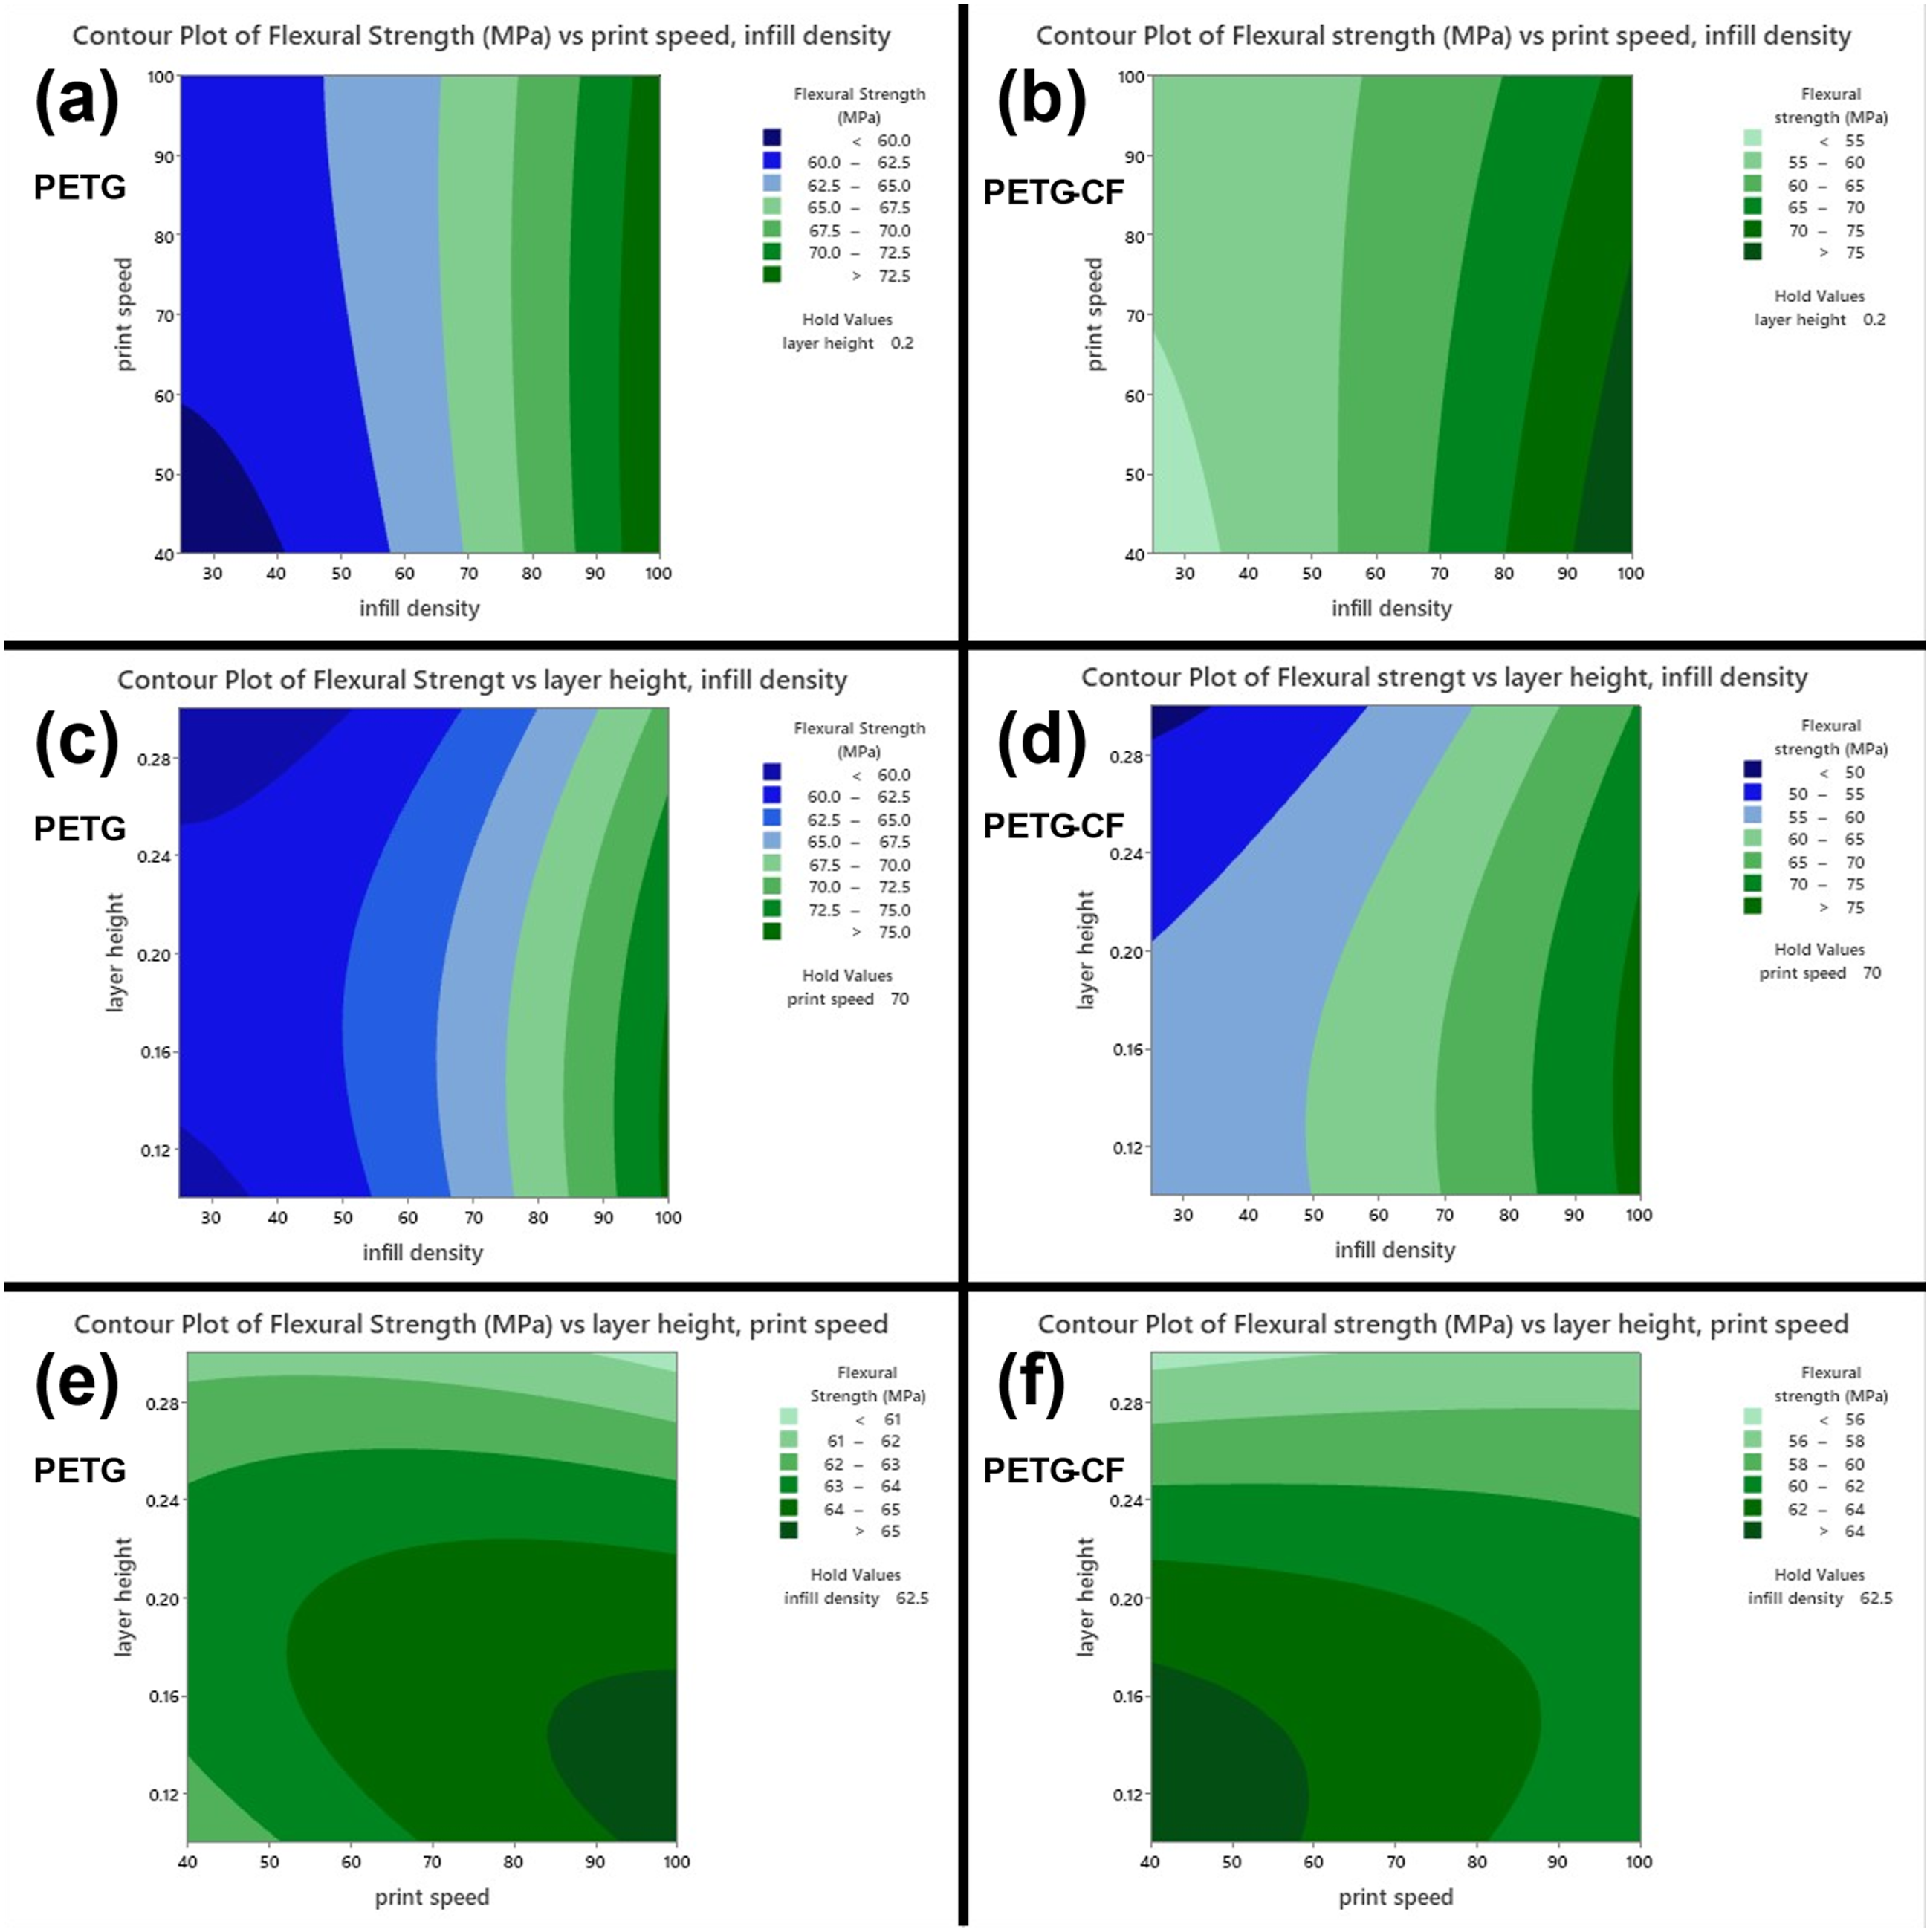
Figure 3(b), (d), and (f) demonstrate the surface response plot of the flexural strength of PETG-CF depending on infill density, print speed, and layer height. PETG-CF shows sensitivity to print speed and layer height combined effects, as with PETG, but benefits from extended thermal exposure due to slower print speed and low layer thickness. In Figure 3(b) and (d), increasing infill density from 30 to 100% concerning print speed and layer height improves flexural strength by more than 75 MPa as obtained at PETG. Meanwhile, Figure 3(f) demonstrates that reducing print speed and layer height improves strength from between 56 and 58 MPa to above 64 MPa. As reported by Valvez et al., 23 reducing print speed and layer height enhances interlayer adhesion and mechanical properties. This effect appears only with PETG-CF due to the effect of carbon fiber on heat distribution and bonding dynamics during the printing process.
Under bending, failure is sensitive to the weakest layer interfaces; therefore, parameter combinations that raise the interface temperature and prolong the time above
Impact test
Figure 4(a), (c), and (e) show the response plot of the impact strength of PETG related to infill density, print speed, and layer height. The figures revealed that the highest impact strength was obtained at 100% infill density, reaching above 18 kJ/m2 associated with print speed and above 17 kJ/m2 associated with layer height. Increasing the infill density enhances strength by reducing porosity and increasing energy absorption during impact tests. Although the results from ANOVA reveal that print speed and layer height have no significant effect on impact strength, their interaction affects impact strength. At low print speed (40 mm/s), printed samples with layer height from 0.26 to 0.3 mm show the highest impact strength of more than 14 kJ/m2, indicating that fewer and thicker layers enhance interlayer bonding. This finding aligns with the findings of Martorelli et al.,
77
which demonstrated that larger layers reduce the number of bonding lines between layers, which may act as a weak point for the printed structure. On the other hand, a high print speed (100%) with layer height from 0.1 to 0.22 mm results in impact strength above 14 kJ/m2. Like the effect of the thicker layer, the thinner layer demands less thermal energy for proper fusion, which is achieved at the highest print speeds. Adjusting layer height and speed interactions markedly affects the impact strength of PETG. Response surface plots illustrate the effect of FDM parameters on the impact strength of PETG and PETG-CF. (a, b) Interaction between infill density and print speed; (c, d) interaction between infill density and layer height; (e, f) interaction between print speed and layer height.
Figure 4(b), (d), and (f) explain the response surface plot of the impact strength of PETG-CF as a function of infill density, print speed, and layer height. As shown in Figure 4(b) and (d), the highest infill density with low print speed and layer height exhibits the highest impact strength, reaching more than 15 kJ/m2 associated with print speed and more than 20 kJ/m2 associated with layer height. As shown in the results, decreasing print speed from 100 to 40 mm/s at a layer height of 0.1 mm resulted in an increase in impact strength from under 10 kJ/m2 to above 30 kJ/m2 due to longer thermal exposure. The same effect appears when decreasing the layer height from 0.3 to 0.1 mm. The decrease in layer height increases the impact strength, indicating that thinner layers are exposed to the optimum thermal exposure to ensure better adhesion. These results demonstrate that the interaction of print speed and layer height has a significant effect on strength. As a result, PETG-CF has lower impact strength than PETG when printed at higher print speed or layer height due to the presence of microvoids and stress concentrations created by the weak adhesion of fiber to the matrix, as observed in SEM images in Figure 12.
Under impact loading, failure is affected by weak interlayer adhesion and voids that act as stress concentration zones; therefore, deposition conditions that promote diffusion and reduce internal voids enhance impact resistance. 53
Compression
Figure 5(a), (c), and (e) show the compressive strength of the PETG response plot with infill density, print speed, and layer height. The results revealed that infill density has the highest impact on compressive strength, with strength below 20 MPa to more than 40 MPa at 100% infill density. These results agreed with the results reported by Kumaresan et al.,
78
which showed that increasing infill density reduces void content and improves interlayer adhesion. ANOVA results reveal the significance of infill density, but print speed and layer height have a minor influence. Figure 5(e) shows the highest compressive yield strength of more than 25 MPa, which was obtained at 100 mm/s print speed and 0.1 layer height. This can be explained as a proper temperature effect at higher speed with low layer height, which improves adhesion and increases the strength.
54
Response surface plots illustrating the effect of FDM parameters on the compressive strength of PETG and PETG-CF. (a, b) Interaction between infill density and print speed; (c, d) interaction between infill density and layer height; (e, f) interaction between print speed and layer height.
Figure 5(b), (d), and (f) show the surface plot of the compressive yield strength of PETG-CF at different infill densities, print speeds, and layer heights. As shown in Figure 5(b) and (d), the highest compressive yield strength was obtained at 100% infill density at low print speed and layer height. These results were supported by the results of Batista et al., 55 who observed that reducing layer height reduces void formation while improving compressive strength. However, Mahesh et al. 79 found that adding short carbon fiber by about 5% and 10% decreases compressive yield strength by 12% and 3% in the presence of poor fiber matrix adhesion. The same phenomenon was observed in this study, where increasing layer height to 0.3 mm and print speed to 100 mm/s results in compressive yield strength of less than 22.5 MPa. As mentioned by Faidallah et al., 76 the addition of carbon fiber itself does not only improves mechanical properties; it must be combined with printing process optimization.
Under compressive loading, the response of FFF parts is controlled by interlayer adhesion and parameter combination, where insufficient fusion can promote layer debonding or delamination and reduce effective load transfer. 56
Optimization and validation of responses
The optimum parameters for each mechanical test for PETG are shown in Figure 6(a)–(d). The highest tensile strength is obtained with 100% infill density, 55.66 mm/s print speed, and 0.3 mm layer height. The highest flexural is achieved with 100% infill density, 87.05 mm/s print speed, and 0.1 mm layer height. The highest impact strength is accomplished with 100% infill density, 100 mm/s print speed, and 0.1 mm layer height. Finally, maximum compressive yield strength is reached with 100% infill density, 100 mm/s print speed, and 0.1 mm layer height. These results are summarized in Table 5, which emphasizes the specific parameter combinations that give the optimum performance for each mechanical test.57–74 Main effect plots showing the influence of infill density, print speed, and layer height on the mechanical properties of (a–d) PETG and (e–h) PETG-CF: (a, e) Tensile strength, (b, f) flexural strength, (c, g) impact strength, and (d, h) compression strength. Optimal process parameter combinations (infill density, print speed, and layer height) that maximize each mechanical property of PETG and PETG-CF based on response surface analysis.
Optimized process parameters and corresponding mechanical properties of PETG and PETG-CF specimens.
The optimum parameter for maximizing each mechanical test of PETG-CF is obtained, as shown in Figure 6(e)–(h). The highest tensile strength is obtained with 100% infill density, 40 mm/s print speed, and 0.1 mm layer height. The highest flexural is achieved with 100% infill density, 40 mm/s print speed, and 0.1064 mm layer height. The highest impact strength is accomplished with 94.7% infill density, 40 mm/s print speed, and 0.1 mm layer height. Similarly, maximum compressive strength is reached with 100% infill density, 40 mm/s print speed, and 0.1 mm layer height. Table 5 summarizes the optimum parameters for each mechanical test for PETG-CF.
The response optimizer for PETG-CF was maximized to optimize all outputs. Table 6 demonstrates that the ideal parameter is 100% infill density, 40 mm/s print speed, and 0.1 mm layer height, resulting in tensile strength of 46.32 MPa, flexural strength of 81.97 MPa, impact strength of 33.96 kJ/m2, and compressive yield strength of 49.72 MPa.
Analysis of the interaction effect on impact strength
Figure 7(a) illustrates the interaction plot of the impact strength of the PETG as a function of infill density, print speed, and layer height. The interaction between print speed and layer height shows that a print speed of 100 mm/s and a layer height of 0.1 mm has obtained maximum impact strength due to proper interlayer adhesion appearing in thinner layers. The same behavior was obtained at a print speed of 40 mm/s and a layer height of 0.3 mm, obtaining maximum strength. This is reasoned in the analysis of the response surface of impact strength due to the printing of thicker layers, which results in a reduction of the number of interfaces, which acts as a weak point. Interaction plots illustrating the combined effects of infill density, print speed, and layer height on the impact strength of (a) PETG and (b) PETG-CF.
In addition, infill density interaction with print speed and layer height indicates that an infill density of 100% results in the highest impact strength at low or high print speed and layer height.
Figure 7(b) illustrates the interaction plots for PETG-CF impact strength. As seen in the interaction between print speed and layer height, printing at a low layer height of 0.1 mm and reducing print speed from 100 mm/s to 40 mm/s resulted in the maximum impact strength. The effect of print speed and layer height combination affects exposure time and enhances interlayer adhesion. Similarly, decreasing layer height from 0.3 to 0.1 mm at 40 mm/s print speed enhances the strength and maximizes impact strength. On the other hand, the interactions of infill density with print speed and layer height have the same effect as PETG. Also, 100 % infill density exhibits the maximum impact strength at a print speed of 40 mm/s and a layer height of 0.1 mm due to the reduction of void content.
Solvent immersion, density, and porosity measurement
Figure 8(a)–(d) shows the effect of infill density, print speed, and layer height on water absorption, acetone absorption, actual density, and porosity of PETG samples. Water absorption decreases with increasing infill density and print speed or decreasing layer height. Acetone absorption has a parabolic trend, peaking at an infill density of 64% and a print speed of 86 mm/s, but decreases with higher infill. Actual density increases linearly with infill density and has almost no effect on print speed and layer height, confirming that infill density is the major factor. Porosity peaks at an infill density of 50% and decreases with increasing print speed, while it has not been affected by layer height. According to the conclusions of Erokhin et al.,
57
PETG resistance to solvent absorption is affected by porosity percentage during printing. Additionally, Moreno Nieto et al.
58
reported that the PETG has low water absorption of about 0.3% after 9 weeks, indicating its suitability for applications requiring dimensional stability and chemical resistance. Main effect plots showing the influence of infill density, print speed, and layer height on the mechanical properties of (a–d) PETG and (e–h) PETG-CF: (a, e) Water absorption, (b, f) acetone absorption, (c, g) actual density, and (d, h) porosity of 3D-printed specimens.
Figure 8(e)–(h) shows the effect of infill density, print speed, and layer height on water absorption, acetone absorption, actual density, and porosity of PETG-CF samples. Water absorption slightly increases with infill density and has an increasing parabolic effect as layer height increases. However, the peaks of water absorption occurred at a print speed of 73.7%. Acetone absorption decreases with increasing infill density and print speed or a decrease in layer height. Actual density increases with increasing infill density and is not affected by print speed or layer height. Porosity has a parabolic trend, which peaks at an infill density of 62.5% and decreases with increasing print speed or decreasing layer height. Erokhin et al. 57 found that porosity has a major influence on the chemical resistance of 3D-printed polymers.
UV exposure testing
Maximum and minimum mass reduction (%) of PETG and PETG-CF samples after 2 and 4 weeks of UV exposure, showing cumulative degradation over time.
The UV exposure test for PETG-CF samples has negligible degradation compared to that of PETG after 4 weeks of UV-A radiation. As shown in Table 7, the maximum mass loss of PETG-CF samples is 0.12% after the first 2 weeks and 0.144% after two other weeks, resulting in a total mass loss of 0.249%. The minimum total mass loss of PETG-CF samples is 0.04%.
From litrature, the PETG exposed to UV showed a minor reduction in mechanical properties and no visual or structural variation after long exposure when compared to materials such as PLA and ABS. The slight mass reduction demonstrates that PETG and PETG-CF are highly resistant to UV degradation, making them suitable for outdoor applications.
Thermal characterization
DSC
From the literature review and standards, the glass transition (Tg) temperature of PETG filament, according to ISO 11357, is from 80 to 81°C.
46
Figure 9 reveals that the Tg temperature from the DSC graphs of the PETG filament is 80.59°C. The Tg of printed samples of PETG drops to around 77°C and can be related to improper bonding between layers. According to Huseynov et al.,
60
it was revealed that when the polymer was cooled below the Tg temperature, and before the next printed layer, interlayer diffusion became weak. This thermal history resulted in reduced molecular entanglement and caused a decrease in the Tg temperature of the printed samples. DSC graph of (a) PETG and (b) PETG-CF samples.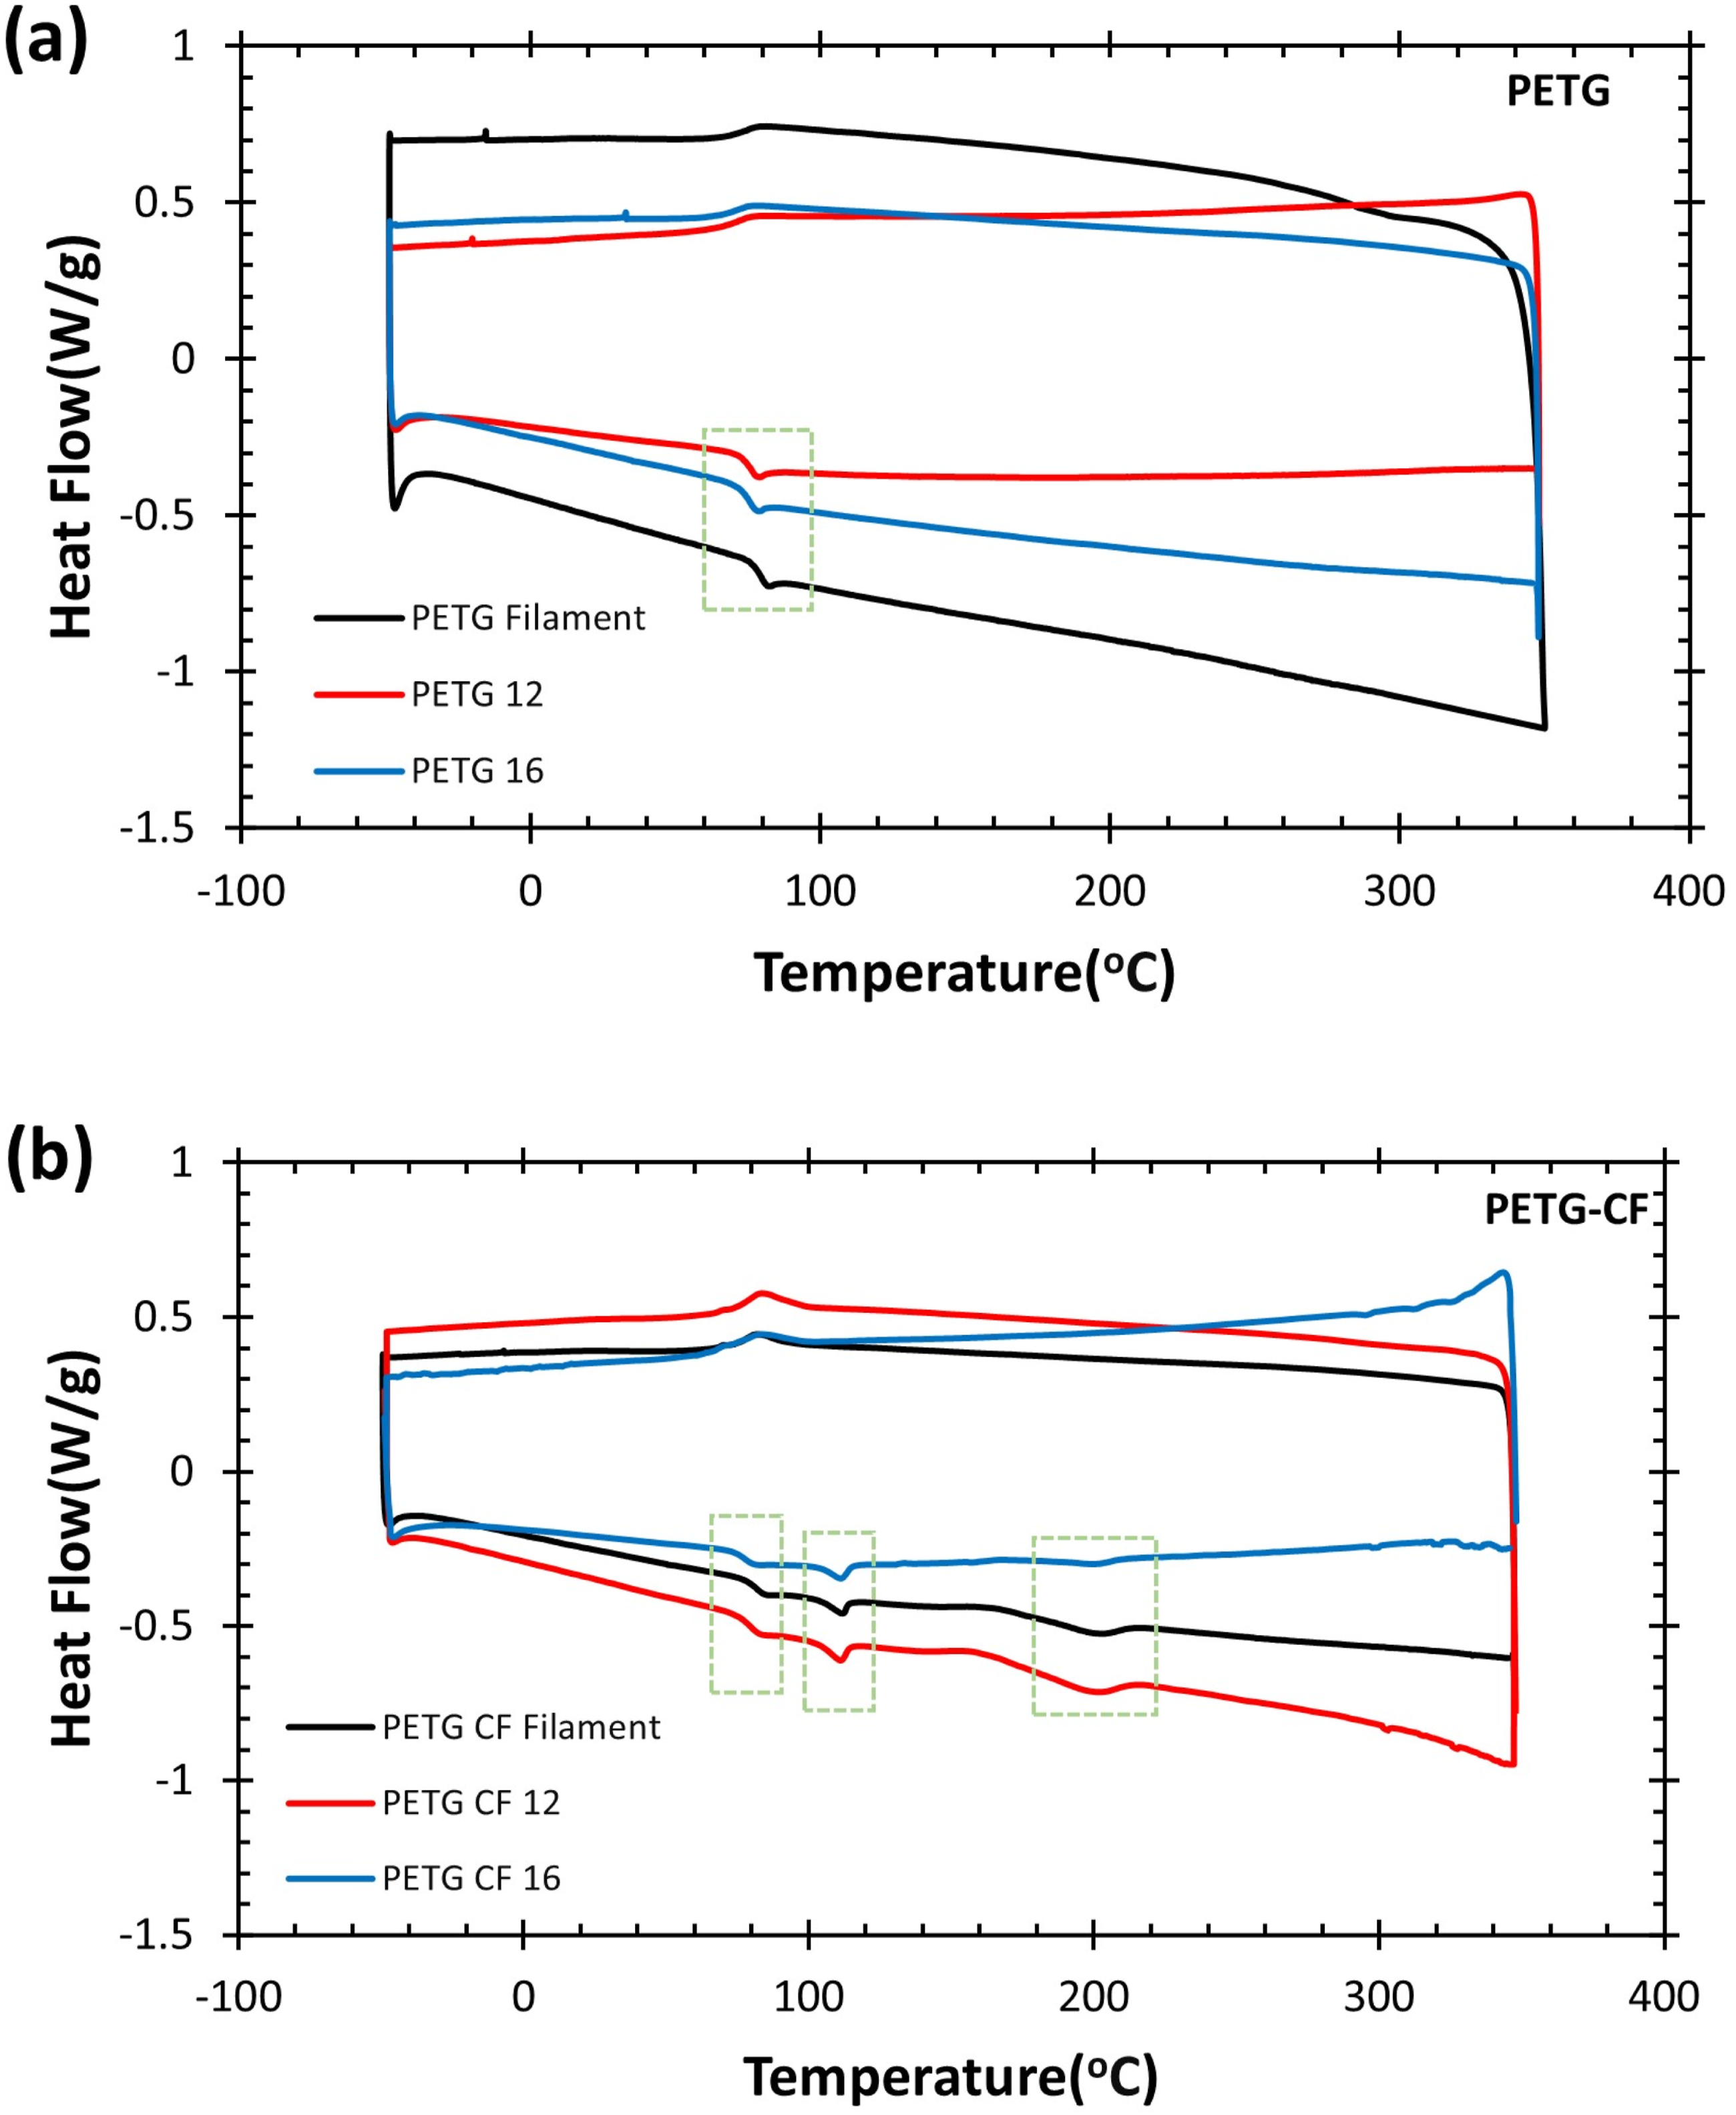
DSC results show that printed PETG samples have a minor increase in crystallinity compared to the filament. This may be due to prolonged heat exposure and slow cooling rate during printing, which causes chain alignment. As demonstrated by Kattan et al., 61 the initial crystallinity of highly drawn PETG was 3%, and after post-processing annealing, the crystallinity did not reach 10%. According to to a previous study, while the crystallinity of printed PETG increased, the onset and peak degradation temperatures were lower than those of the filament due to molecular chain scission that occurred by reprocessing, resulting in less thermally stable crystalline zones.
On the other hand, the results from the DSC for PETG-CF reveal the presence of two endothermic peaks in all specimens. According to Kong and Hay, 63 these double peaks result from the presence of two lamellar structures: a less stable lamella that melts at a lower temperature and a more stable lamella that melts at a higher temperature. The first melting peak results from the melting of defective crystals generated during the cooling process or repeated thermal cycles during printing, but the second peak results from the melting of primary lamellae, which are more thermally stable. Furthermore, the presence of carbon fiber changes the crystallization behavior of PETG. As established by Liu et al., 64 carbon fibers work as heterogeneous nucleating agents, enabling localized crystallization at the fiber-matrix interface.
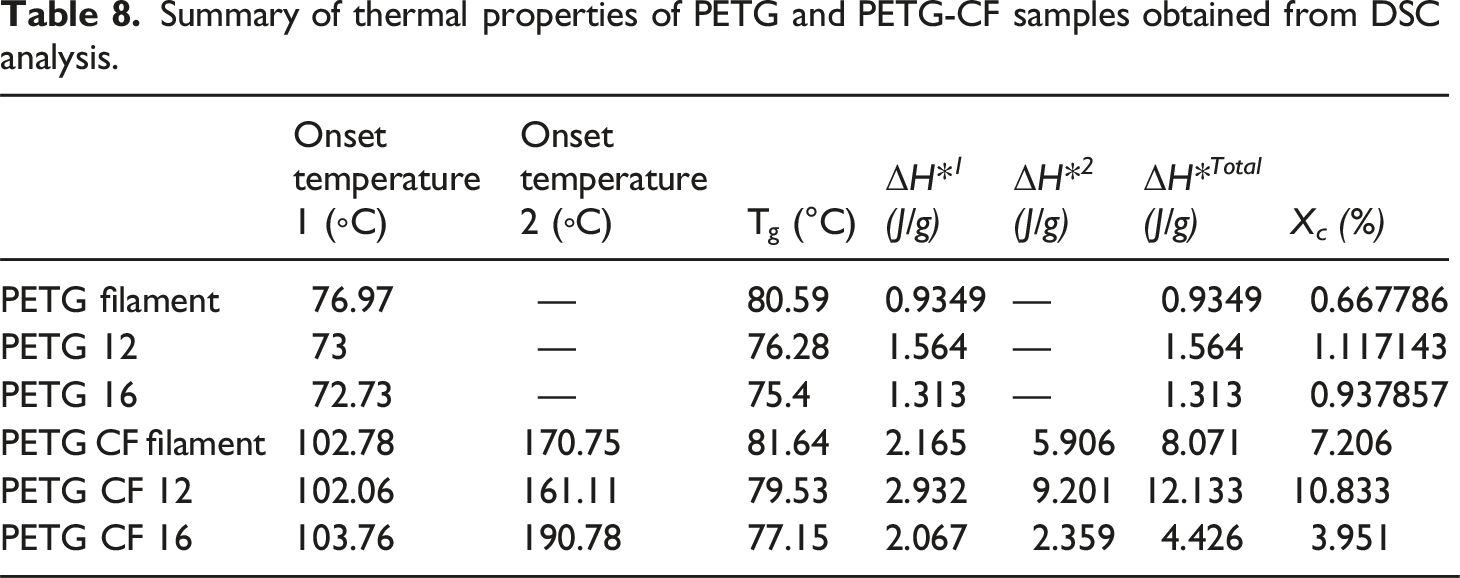
Summary of thermal properties of PETG and PETG-CF samples obtained from DSC analysis.
Thermogravimetric analysis (TGA) of PETG has revealed three degradation steps with different onset and offset temperatures, as shown in Figure 10. For PETG filament, the first degradation step starts from 344.15 to 345.25°C with a weight loss of 0.5439%, followed by the main decomposition step from 410.01 to 456.38°C with a weight loss of 93.08%, and the final step from 536.28 to 574.13°C with a weight loss of 3.921%. On the other hand, PETG 12 and 16 have thermal degradation, with the first degradation step from 323.32 to 350.39°C and from 321.42 to 352.73°C, with a weight loss of 0.4814 and 0.3530% for PETG 12 and 16, respectively. After that, the main decomposition step occurred from 419.41 to 464.09°C and 424.37 to 464.54°C with a weight loss of 92.29% and 91.06% for PETG 12 and 16, respectively. The final step was from 621.33 to 621.91°C and 510.65 to 534.06°C with a weight loss of 3.197 and 1.425% for PETG 12 and 16, respectively. The first degradation indicates the presence of thermal volatilization.
75
According to Turnbull et al.,
65
the primary degradation step is due to thermal degradation of the polymer backbone through chain scission of the ester bond. TGA and DTG graphs of (a) PETG and (b) PETG-CF filaments and samples.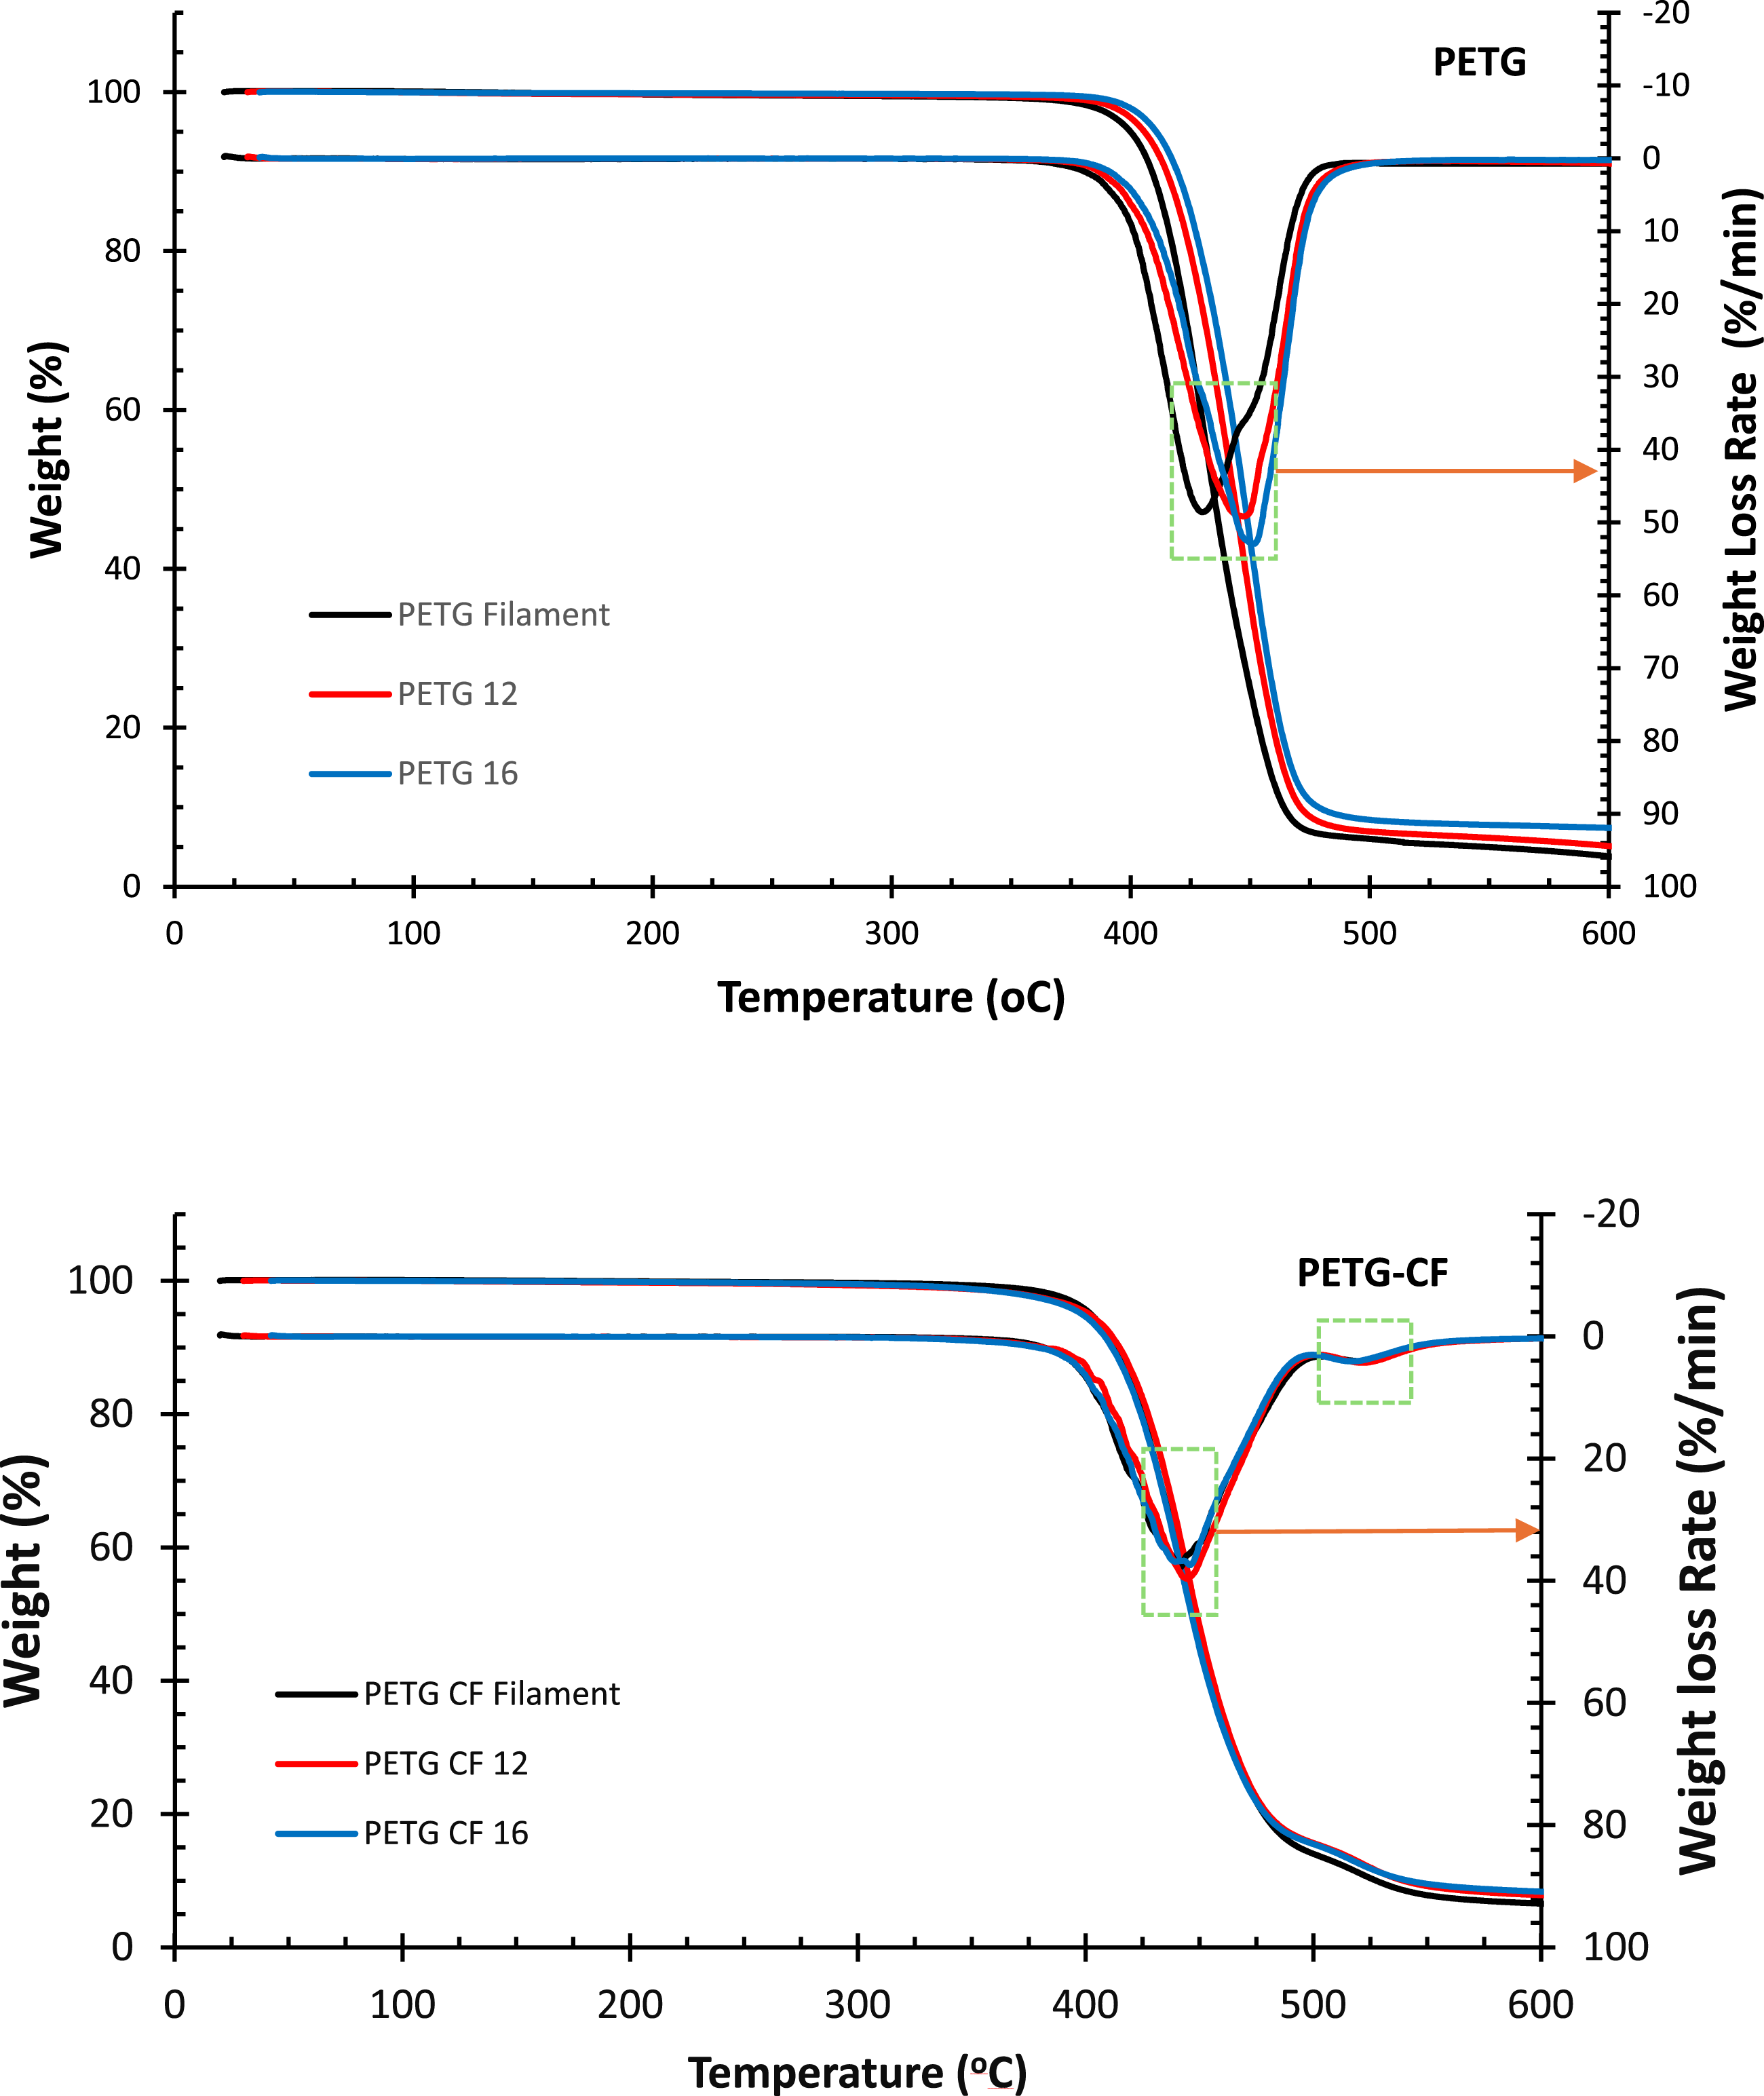
Derivative thermogravimetric analysis (DTG) shows differences between the PETG filaments, 12 and 16 samples. PETG 16 has the highest peak temperature of 451.76°C and a maximum weight loss rate of 52.89 %/min, indicating enhanced thermal stability and interlayer adhesion. 66 PETG 12 has a lower peak temperature of 448.21°C and a weight loss rate of 49.08%/min. These results can be attributed to the warpage effects that cause internal stress, resulting in a decrease in thermal stability. PETG filament has the lowest peak temperature of 429.26°C and a weight loss rate of 48.55% due to the lack of molecular arrangement. These results demonstrate that optimizing printing parameters has an impact on the thermal stability and degradation behavior of printed samples. 66
Thermogravimetric analysis (TGA) of PETG-CF has revealed four degradation steps with different onset and offset temperatures. For PETG-CF filament, the first degradation step was from 231.64 to 348.83°C with a weight loss of 1.317%, followed by the main decomposition step from 415.87 to 464.57°C with a weight loss of 84.32%, the third step from 524.41 to 529.85°C with a weight loss of 6.115%, and the final step from 554.94 to 592.91°C with a weight loss of 2.516%. On the other hand, PETG 12 and 16 have thermal degradation with the first degradation step from 269.46 to 331.62°C and from 265.47 to 326.48°C with a weight loss of 1.492 and 1.332%, followed by the main decomposition step from 419.71 to 465.82°C and 415.29 to 463.08°C with a weight loss of 82.69 and 82.47%, the third step from 513.31 to 527.40°C and 520.20 to 2521.11°C with a weight loss of 5.429 and 4.927%, and final step from 544.97 to 568.44°C and 538.03 to 563.45°C with a weight loss of3.171 and 3.657% weight loss, for PETG 12 and 1, respectively. According to Achagri et al., 67 the third degradation step is caused by the degradation at higher temperatures of residual organic constituents on the carbon fiber surface used during fiber manufacturing to increase matrix adhesion.
Derivative thermogravimetric analysis (DTG) results for PETG-CF filament, PETG-CF 12, and PETG-CF 16 reveal breakdown temperatures ranging from 441.36°C to 445.96°C, showing that PETG-CF maintains thermal stability during printing. According to Bedi et al., 68 reinforcement with carbon-based fillers such as graphene or fibers improves the onset of thermal degradation unless processing flaws are added.
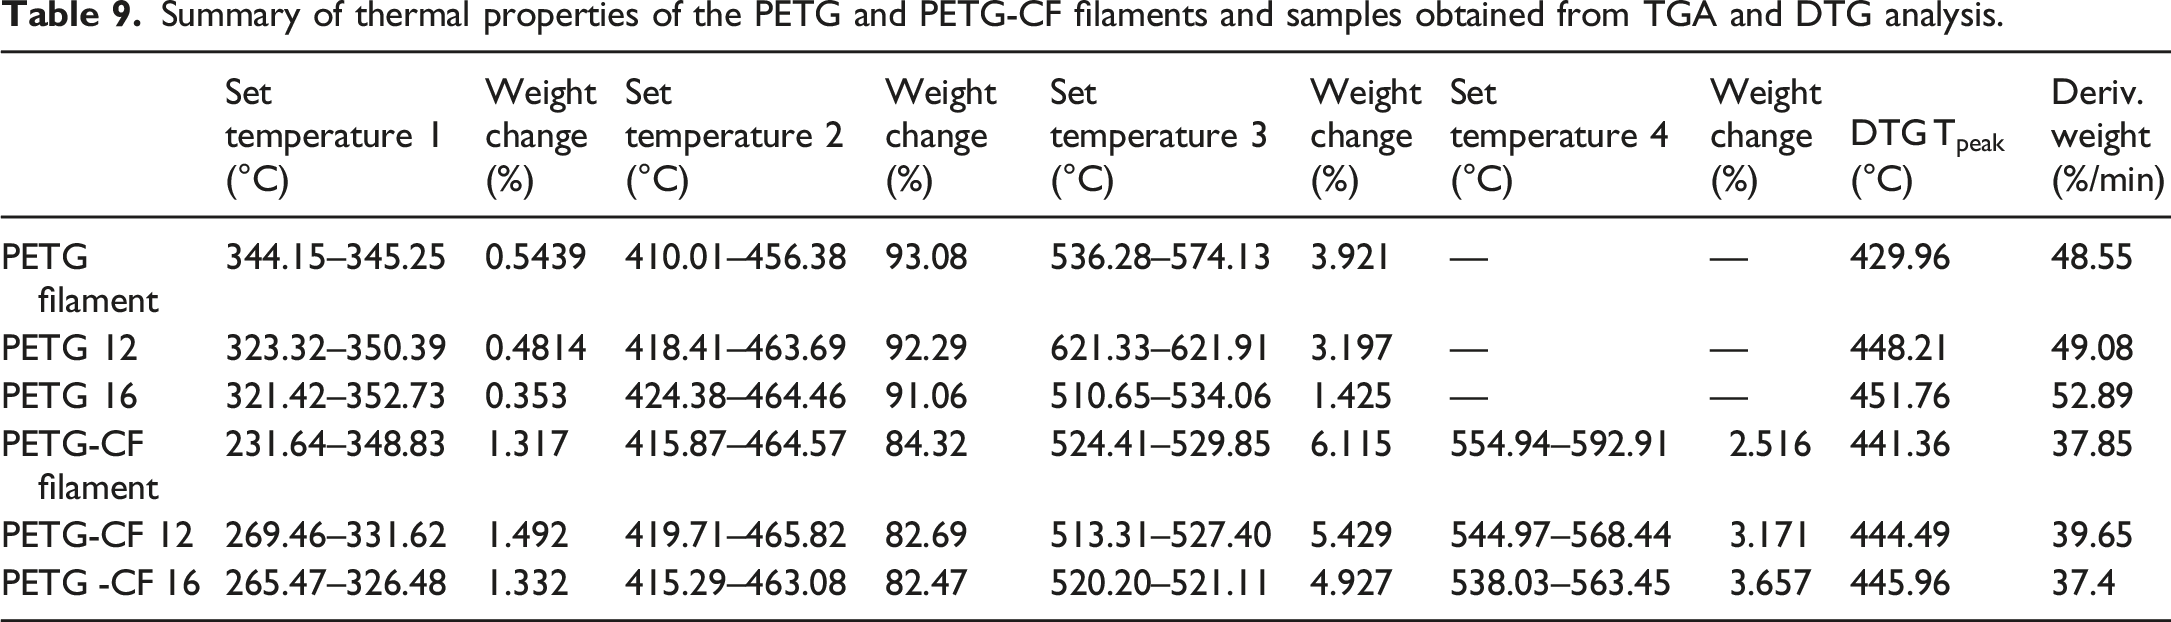
Summary of thermal properties of the PETG and PETG-CF filaments and samples obtained from TGA and DTG analysis.
Contact angle measurement
Contact angle measurements are used to examine the surface wettability of optimized and different print speed samples. As shown in Figure 11, PETG samples have a lower contact angle compared with PETG-CF, indicating higher wettability and surface energy. For PETG samples, the contact angle increases from 60° in PETG 12 to 67° in PETG 16, indicating printing with higher print speed under the same nozzle temperature setting enhanced interlayer adhesion. In contrast, PETG-CF 12 and 16 samples have higher contact angles of 73° and 71°, respectively, indicating a more hydrophobic surface. Carbon fiber has low surface energy and is hydrophobic due to its inert surface structure influenced by van der Waals forces. Wang et al.
69
found that carbon fiber has poor chemical adhesion with thermoplastics and low wettability. It can be concluded that PETG CF 12 exhibits lower wettability than PETG CF 16 due to the slow printing speed and high interlayer bonding. Contact angle measurements of PETG and PETG-CF samples.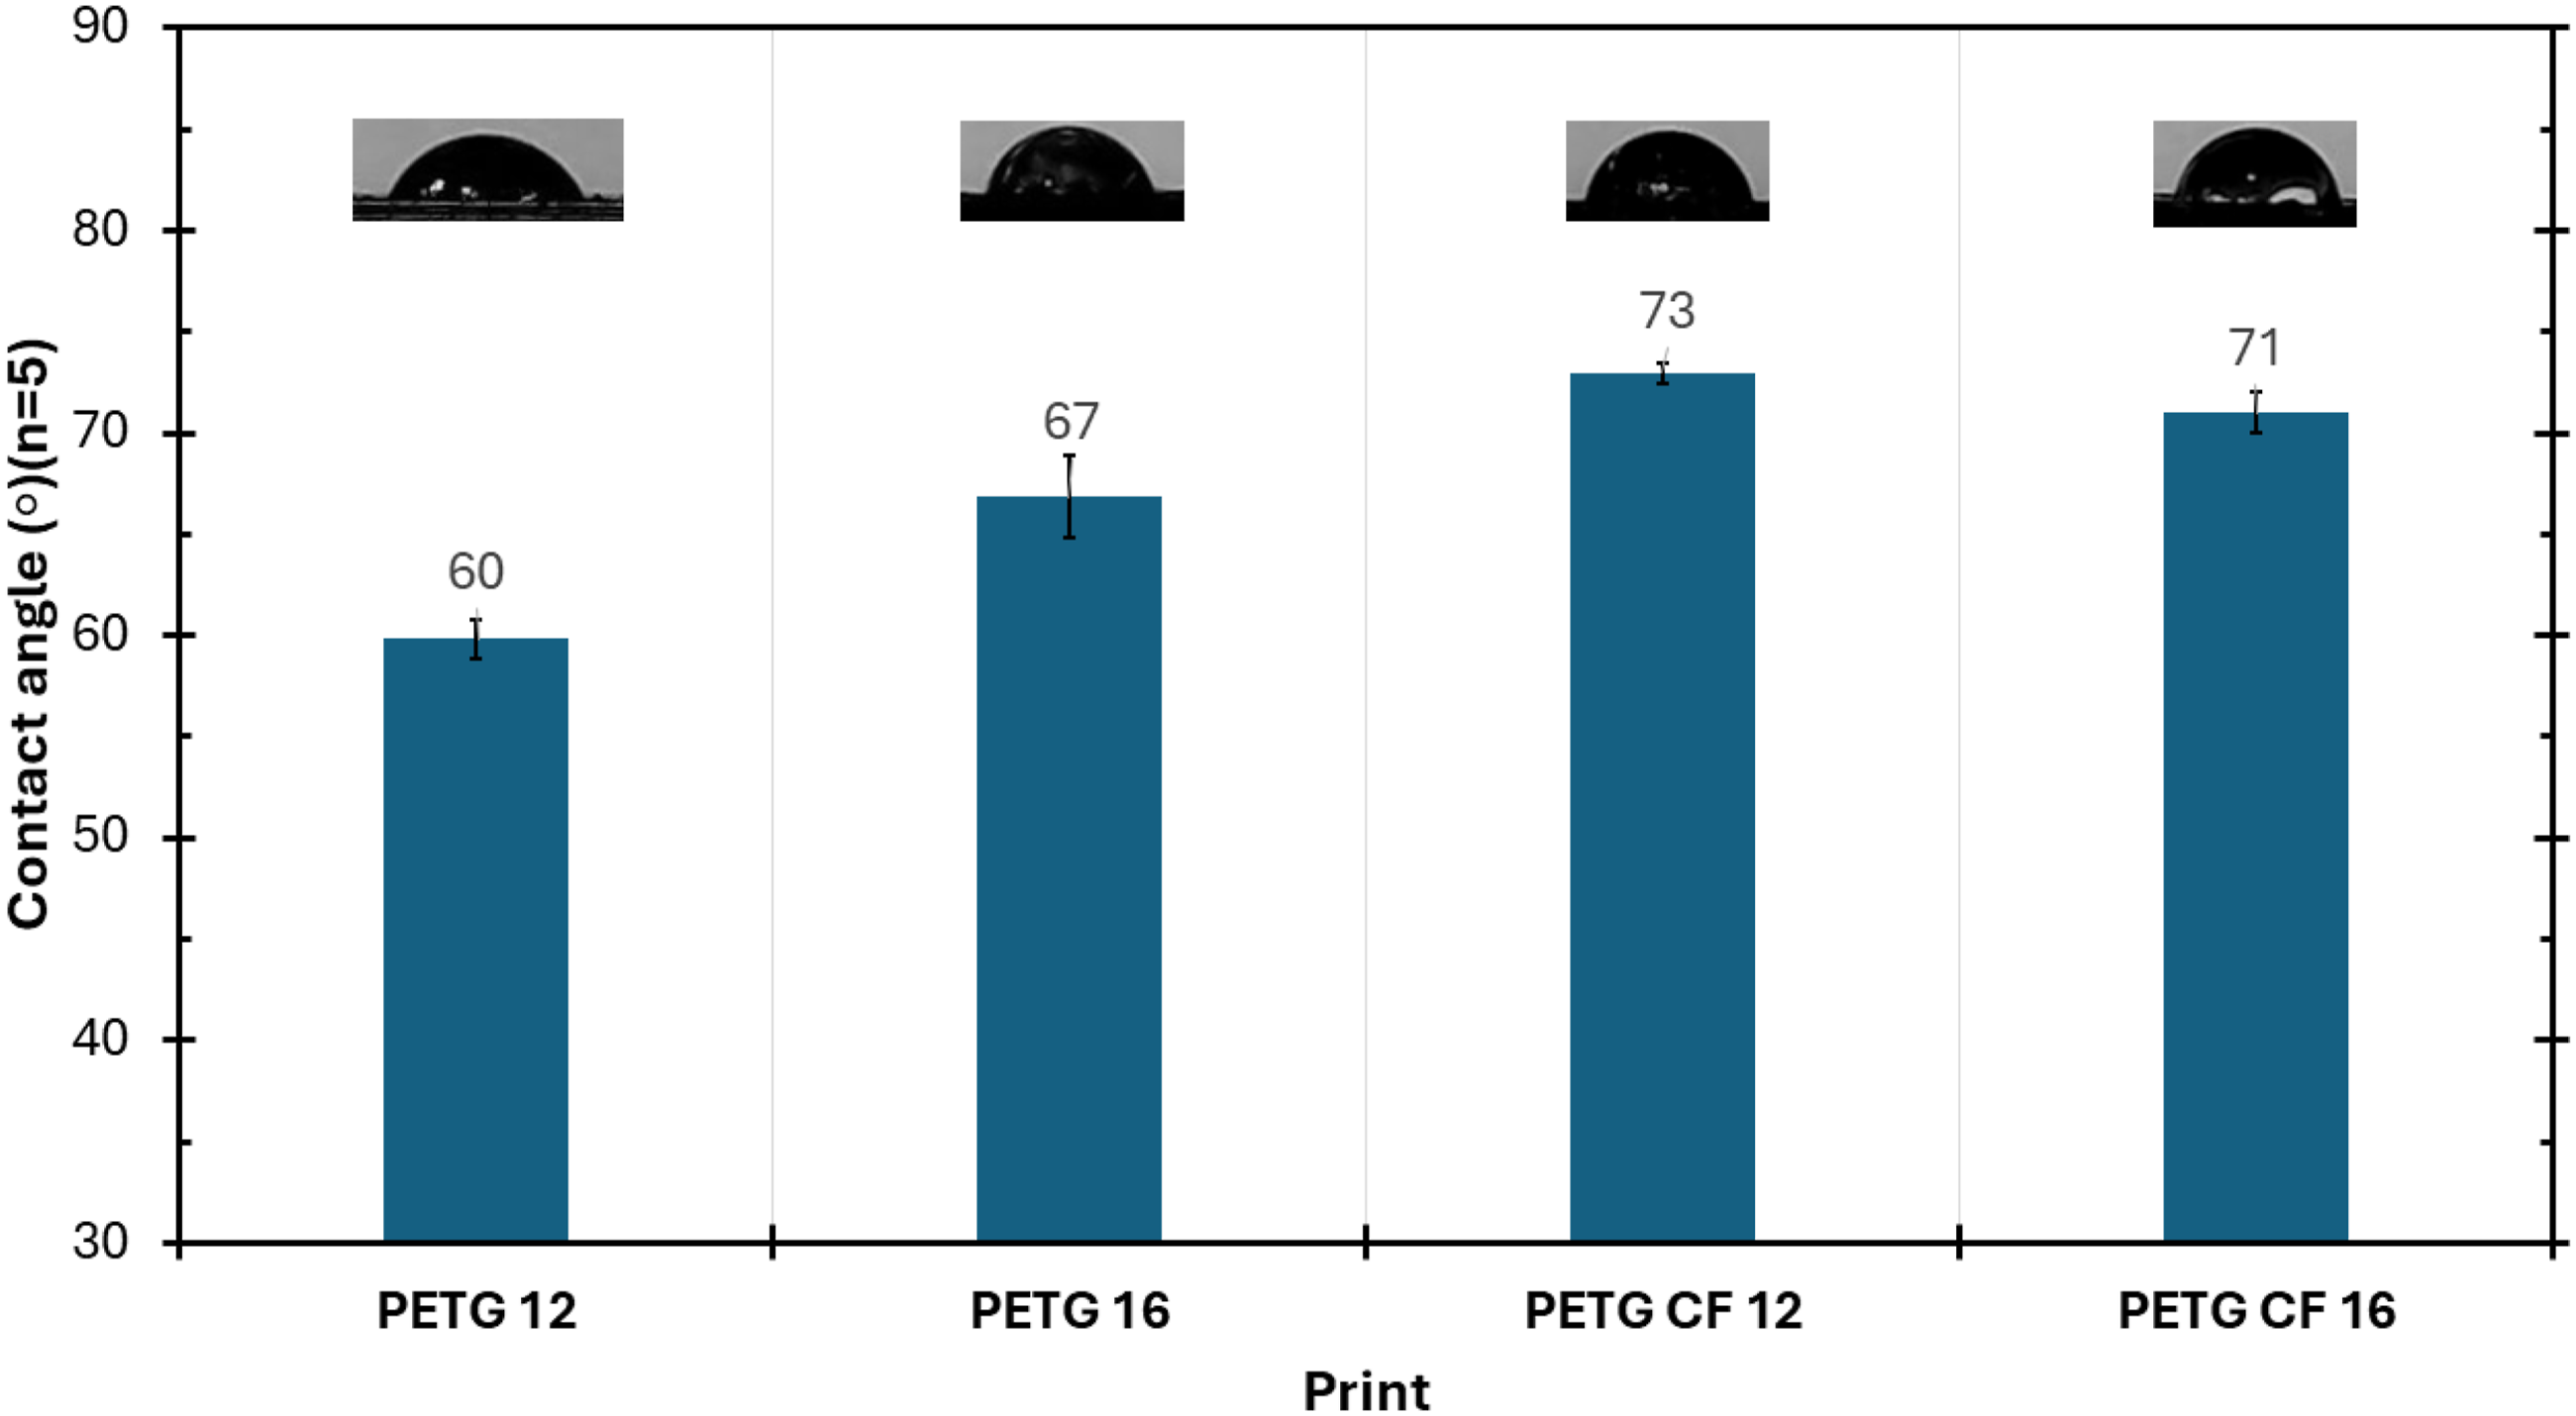
Fractography of impact specimens
Figure 12(a)–(f) shows the secondary electron (SE) images of SEM for the fracture surface of PETG 12 and PETG 16. The fracture surface of the impact specimen of PETG 12 displays a mix of ductile and brittle failure mechanisms. Guessasma et al.
70
found that warpage resulting from uneven thermal shrinkage caused layer misalignment and affected interlayer adhesion. In Figure 12(a), SEM confirms the presence of layer misalignment. In addition, smooth and rough fractures were observed, where a smooth fracture indicates brittle fracture behavior, while a rough fracture shows ductile fracture behavior.
53
On the other hand, Zone 2 shows interlayer delamination and adhesion failure, indicating that the fracture propagates across weak fusion lines rather than the polymer matrix. Balderrama-Armendariz et al.
72
mentioned the interfacial failure modes in FDM-printed thermoplastics, which are anisotropic and multilayered. Insufficient or poor thermal bonding causes crack propagation between layers rather than across them. SE SEM images showing the fractography from impact tests of (a–f) PETG and (g–l) PETG-CF specimens at different magnifications: (a–c, g–i) Print no. 12 and (d–f, j–l) print no. 16.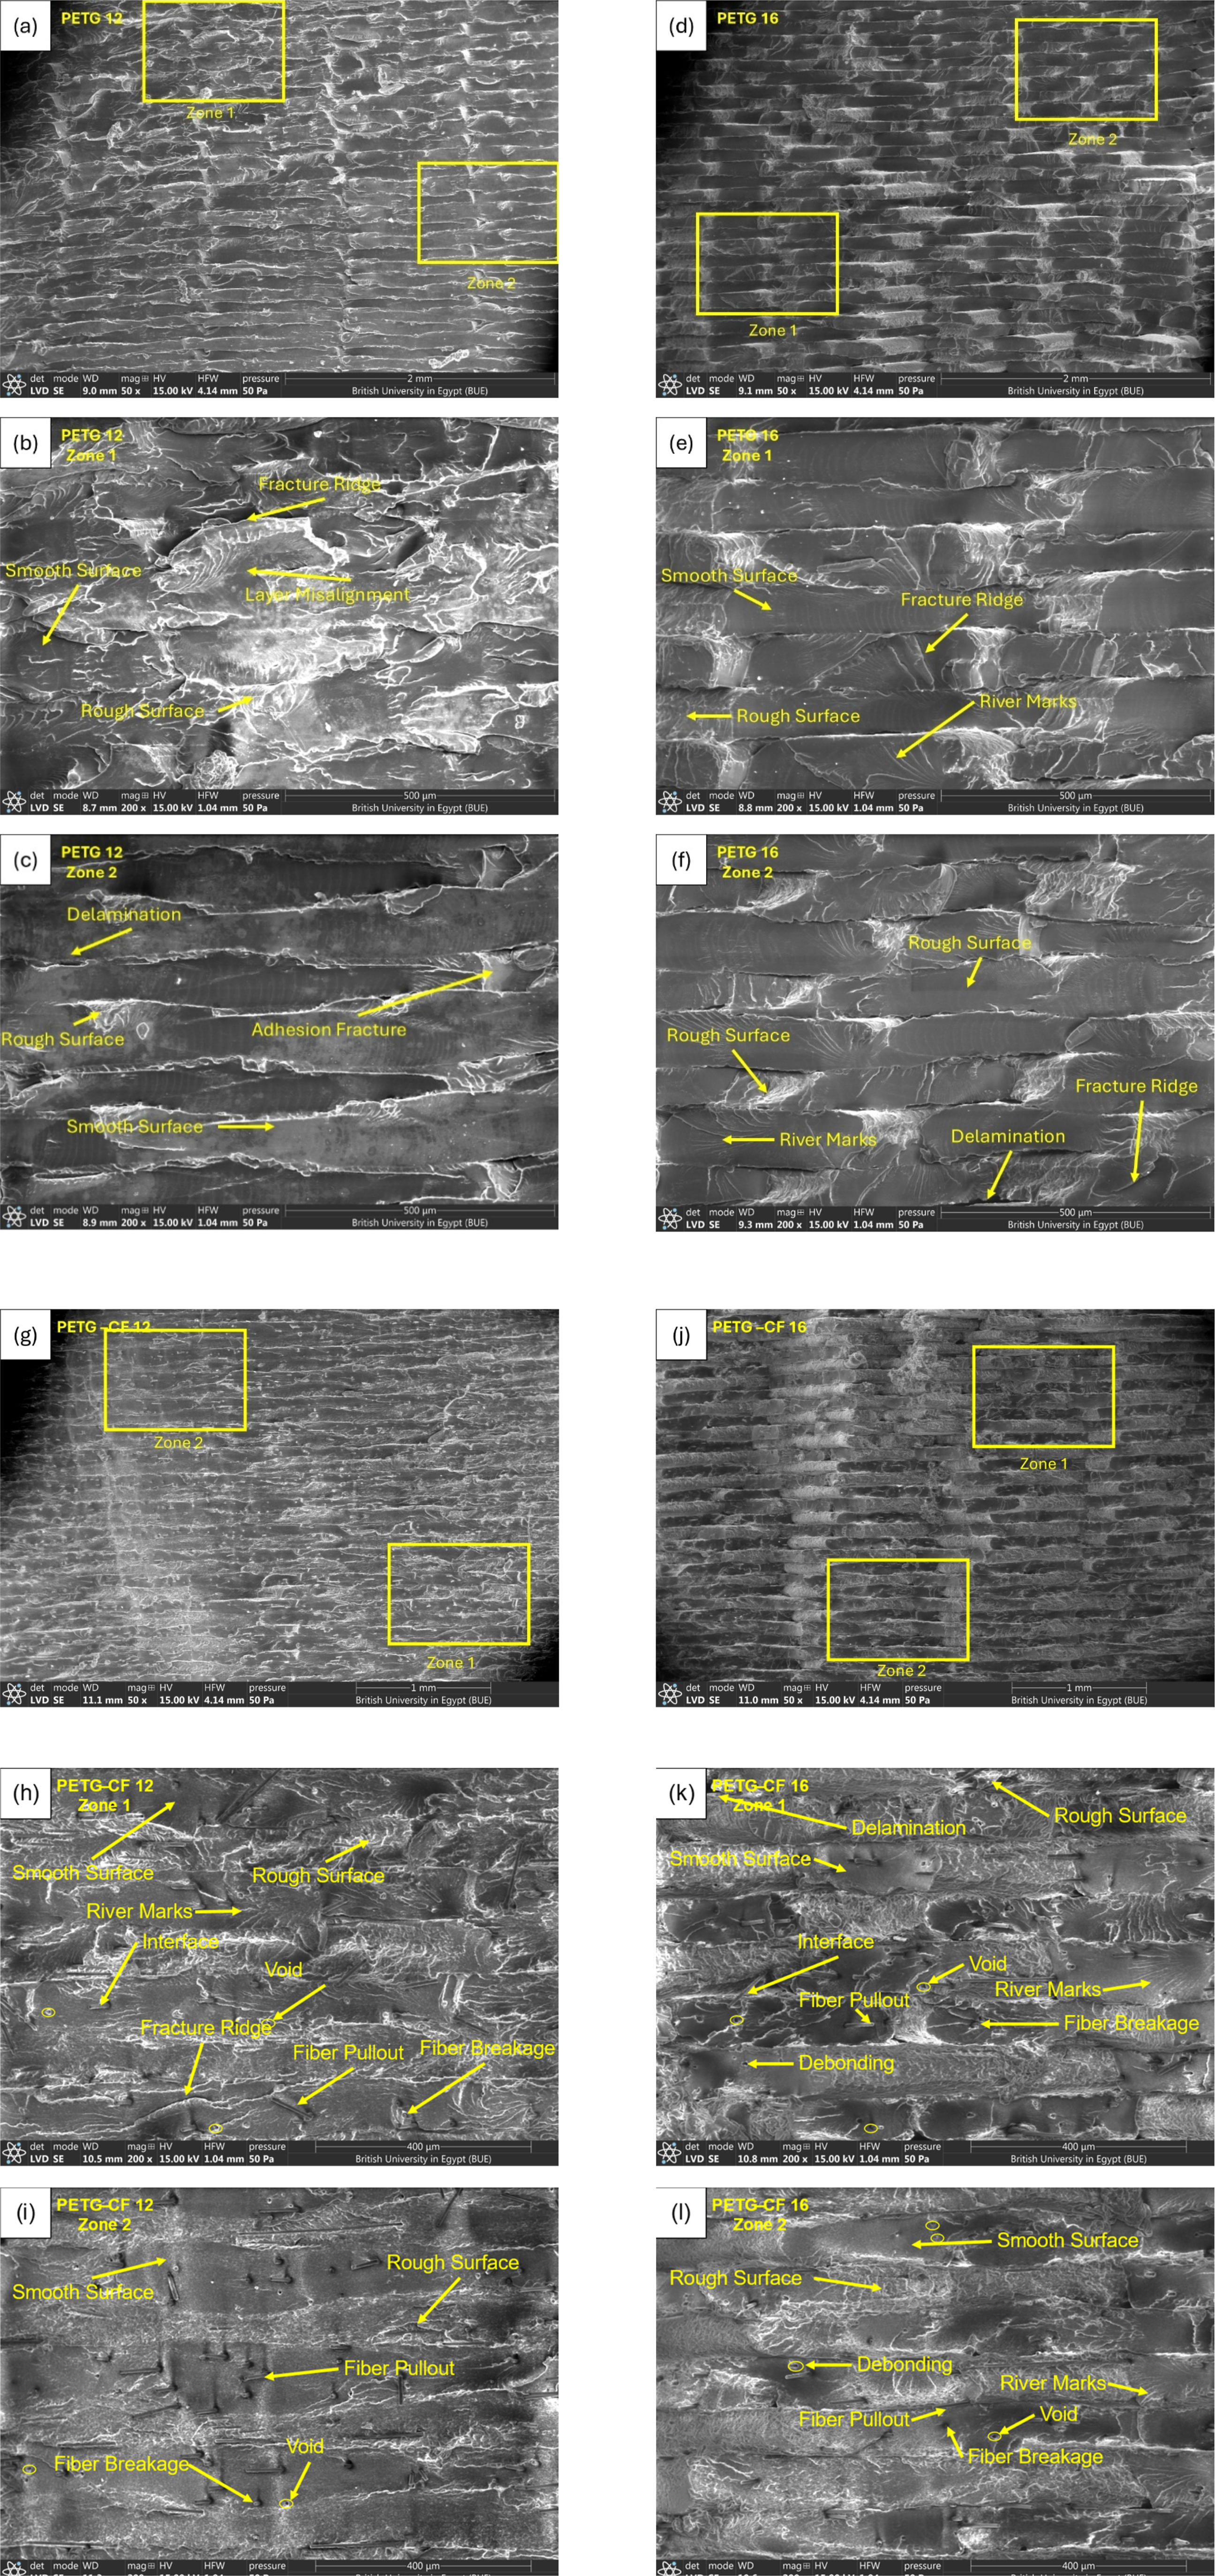
The fractured surface of PETG 16 shows a more homogeneous microstructure than that of PETG 12. In Figure 12(d), the SEM image reveals a well-adhered layer without the presence of layer misalignment as seen in PETG 12 due to its lower print speed. In Zone 1, as shown in Figure 12(e), the fracture surface has a mixture of smooth and rough fractures, indicating a mixed brittle and ductile fracture mode. The fracture ridges and river marks are recognizable, with the river marks indicating the direction of crack propagation. These fracture characteristics indicate enhanced crack propagation and interlayer bonding.
However, Minor delamination appears in Zone 2 in Figure 12(f). The rough fracture and fracture ridge are more present in PETG 16, indicating enhanced ductility and energy absorption. The fracture characteristics of PETG 16 can be attributed to printing at a higher speed under the same nozzle temperature setting, which reduces the time between successive deposition and can maintain a sufficient interfacial bonding temperature, thereby limiting the delamination observed in PETG 12 and improving interlayer integrity.
Figure 12(g)–(l) shows the secondary electron (SE) images of SEM for the fracture surface of PETG-CF 12 and PETG-CF 16. The fracture surface of PETG-CF 12 in zone 1 in Figure 12(g) shows fiber fracture and matrix fracture, indicating enhanced mechanical interlocking and adhesion at the fiber-matrix interface. The smooth and rough fractures indicate a mix of brittle and ductile behavior. On the other hand, Zone 2 in Figure 12(h) contains a few voids and fiber pullouts, indicating enhanced fracture mode. Economides et al. 73 indicated that reduced internal voids and fiber fracture indicate printing with optimum parameters in PETG composite.
On the other hand, the fracture surface of PETG-CF 16 shows more internal defects with the presence of poor adhesion at the fiber matrix interface and voids. In Figure 12(j), zone 1 indicates the presence of a few fiber pullouts, debonding, and voids, indicating poor adhesion of carbon fiber, which has weak adhesion with the PETG matrix. In addition, river marks indicate the direction of crack propagation within the matrix. Kichloo et al. 74 found that higher porosity content and poor fiber matrix adhesion in PETG composites reduce mechanical strength. When compared to PETG-CF 12, PETG-CF 16 has lower mechanical properties. However, PETG-CF 12 demonstrates enhanced matrix fiber interlocking and fewer internal defects, resulting in improved mechanical properties.
Overall, the optimized parameter set exhibits consolidated fracture morphology, characterized by continuous interlayer fusion without voids or porosity defects on the observed fracture surface. This improved quality indicates a stronger interfacial bond and effective load transfer between layers, which is consistent with the optimized conditions achieving the highest combined tensile, flexural, impact, and compressive strength.
Conclusion
This study investigates the effects of infill density, print speed, and layer height on the mechanical performance of PETG and PETG-CF for the automotive industry. Using Response Surface Methodology (RSM) with a Central Composite Design (CCD), predictive models are used through tensile, flexural, impact, and compression tests, in addition to porosity, density, solvent absorption, UV-A degradation, thermal analysis, contact angle measurement, and fracture surface characteristics.
The results confirm that infill density is the major factor affecting all mechanical properties; increasing infill density improves strength due to reduced void content. While PETG has higher tensile strength than PETG-CF in some conditions, its performance is impeded by warpage at low print speeds. However, PETG-CF demonstrates lower strength initially due to poor fiber-matrix adhesion, but optimizing printing parameters improves mechanical strength. The optimized mechanical performance of PETG-CF outperforms PETG in all mechanical tests, achieving tensile strength of 46.3 MPa, flexural strength of 81.9 MPa, impact strength of 33.9 kJ/m2, and compressive strength of 49.7 MPa using an infill density of 100%, a print speed of 40 mm/s, and a layer height of 0.1 mm. On the other hand, the PETG optimized parameter has a tensile strength of 40.2 MPa, flexural strength of 75.7 MPa, an impact strength of 19.5 kJ/m2, and compressive strength of 44.5 MPa using an infill density of 100%, a print speed of 100 mm/s, and a layer height of 0.1 mm.
Differential scanning calorimetry (DSC) results show that printed PETG samples have a minor increase in crystallinity compared to the filament. This is due to prolonged heat exposure and a slow cooling rate during printing, which causes chain alignment. On the other hand, PETG-CF results reveal the presence of two endothermic peaks in all specimens. This enhancement in the crystallinity of PETG-CF in comparison to PETG is due to the presence of carbon fiber. Thermogravimetric analysis (TGA) of PETG has revealed three degradation steps with different onset and offset temperatures. On the other hand, PETG-CF has revealed four degradation steps, the new step of which is caused by the degradation at higher temperatures of residual organic constituents on the carbon fiber surface used during fiber manufacturing to increase matrix adhesion.
Contact angle measurements reveal that PETG-CF has more hydrophobic behavior than PETG, resulting in reduced moisture intake and improved chemical resistance. This appears in solvent absorption results, where PETG-CF has lower water absorption than PETG.
SEM fracture images reveal poor interlayer bonding, voids, or poor fiber-matrix adhesion in non-optimized PETG-CF samples, but improved interlayer adhesion in optimized conditions results in an improvement in mechanical performance.
The interaction between printing parameters is important in determining the final part quality or properties. Lower print speed provides longer thermal exposure and leads to the risk of warpage in PETG. In contrast, PETG-CF benefits from low print speed and smaller layer height, which improves fiber matrix adhesion. The findings show that the presence of carbon fiber only improves mechanical performance when printing with optimized temperature.
In conclusion, the study successfully demonstrates that the mechanical performance, thermal stability, or chemical resistance of PETG can be improved through process optimization. In addition, PETG-CF had higher mechanical properties than PETG when printed using the optimum parameter.
Supplemental material
Supplemental material - Mechanical and thermal optimization of fused deposition modeling of PETG and PETG–carbon-fiber composites
Supplemental material for Mechanical and thermal optimization of fused deposition modeling of PETG and PETG–carbon-fiber composites by Kerolos R Samaan, Rehab Alaa Eldin Sayed, Mohamed Atef, Ahmed H Awad in Journal of Thermoplastic Composite Materials
Footnotes
Declaration of conflicting interests
The authors declared no potential conflicts of interest with respect to the research, authorship, and/or publication of this article.
Funding
The authors received no financial support for the research, authorship, and/or publication of this article.
Supplemental material
Supplemental material for this article is available online.
References
Supplementary Material
Please find the following supplemental material available below.
For Open Access articles published under a Creative Commons License, all supplemental material carries the same license as the article it is associated with.
For non-Open Access articles published, all supplemental material carries a non-exclusive license, and permission requests for re-use of supplemental material or any part of supplemental material shall be sent directly to the copyright owner as specified in the copyright notice associated with the article.