
Abstract
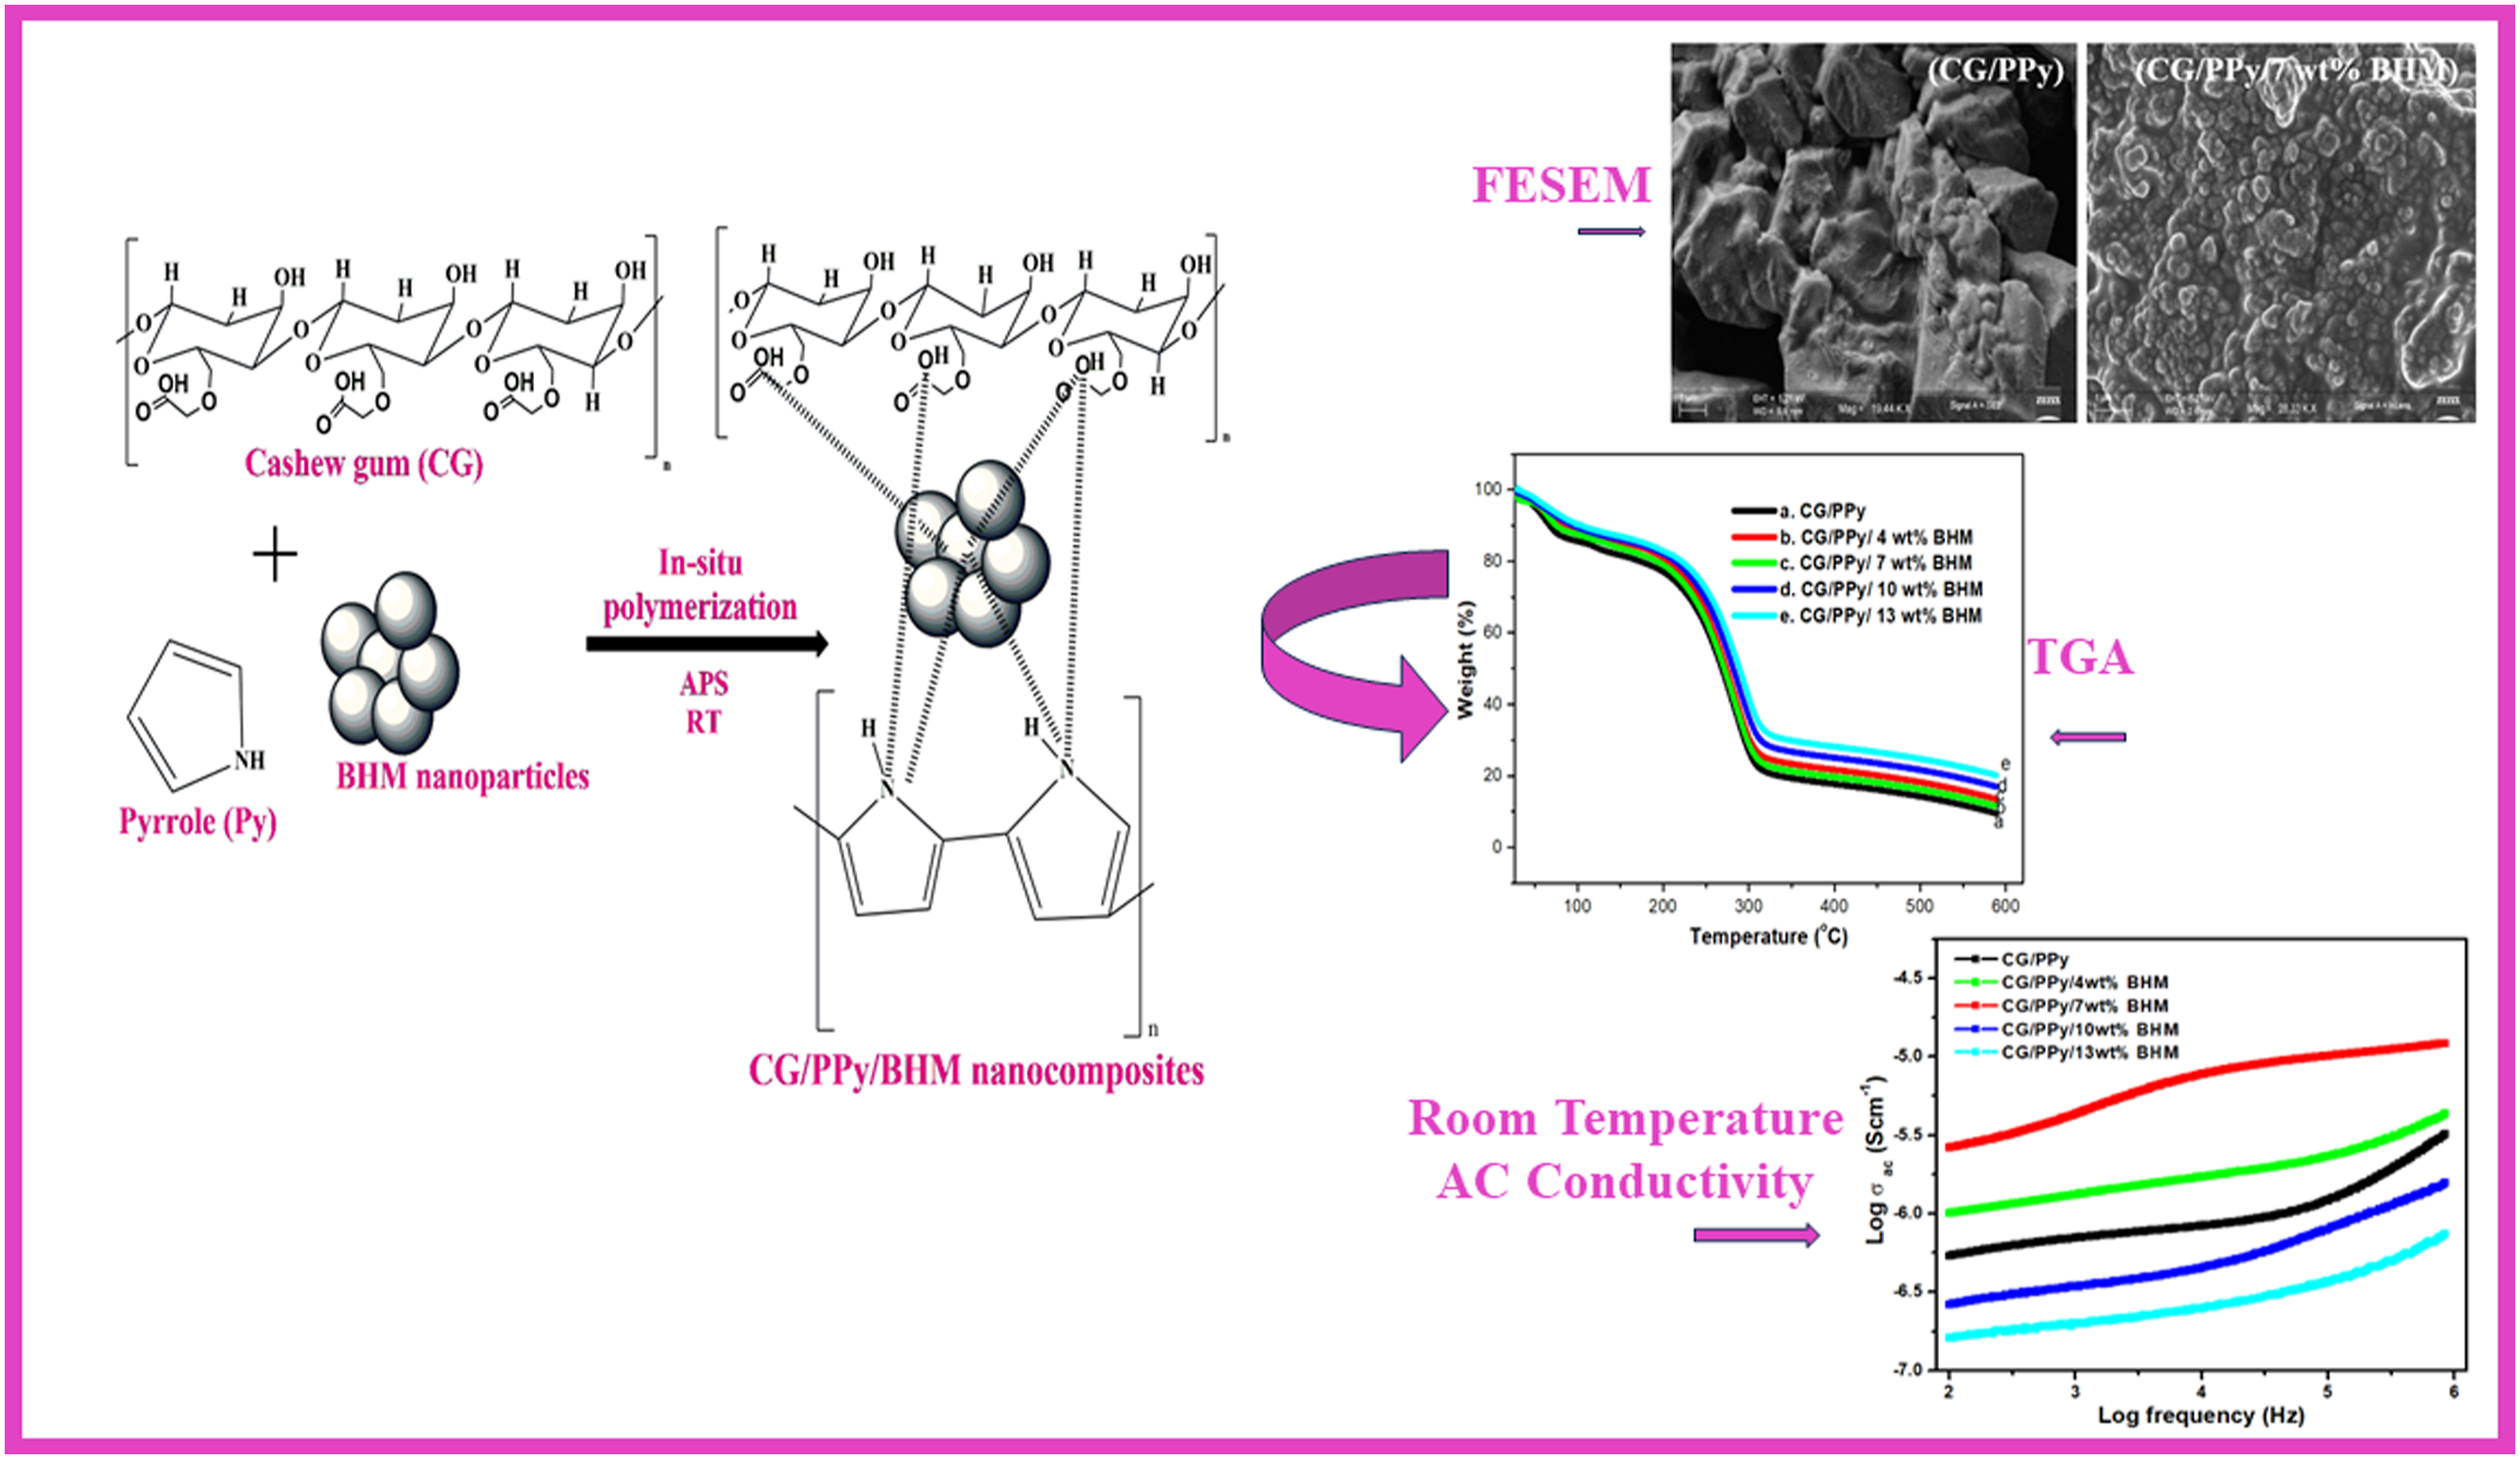
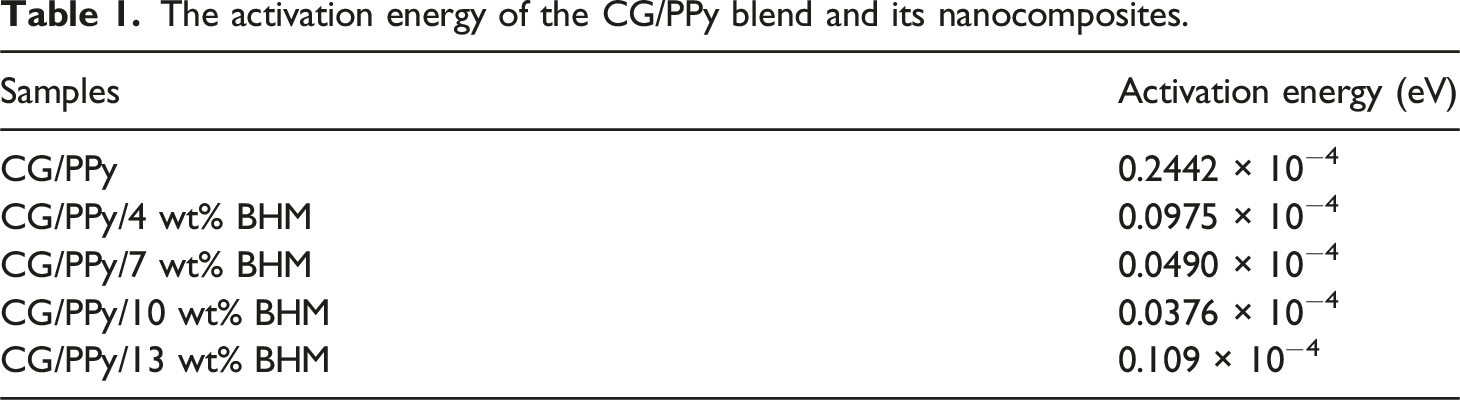
Electrically conducting biopolymer blend nanocomposites based on different contents of boehmite (BHM) reinforced cashew gum (CG) /polypyrrole (PPy) blend is synthesized by an in situ polymerization technique using water as a green solvent. The resulting bio-blend nanocomposites underwent comprehensive analysis concerning their structural, morphology, thermal, and electrical properties, such as dielectric constant, dielectric loss, electric modulus, and AC conductivity. The Fourier transform infrared spectroscopy (FTIR) spectra revealed the presence of metal oxide stretching in the blended nanocomposite at 512 cm−1. Field emission scanning electron microscopy (FE-SEM) confirmed the attachment and uniform dispersion of BHM within the CG/PPy blend at 7 wt% loading, and beyond this loading, the nanoparticles get agglomerated in the biopolymer blend. The glass transition temperature and thermal stability of all the blended nanocomposites are higher than that of the pure CG/PPy blend and these thermal properties increase with the loading of nanoparticles. Conductivity experiments demonstrated that as the nanofiller content increases up to 7 wt%, there is a concurrent rise observed in AC conductivity, dielectric loss, and dielectric constant. There is a substantial difference of 1.21 Scm−1 between the maximum and minimum AC electrical conductivity, at 102 Hz. However, a decrease in electrical properties is observed at the highest loadings of BHM due to the agglomeration of nanoparticles in the polymer blend matrix. The lowest activation energy value (0.049 × 10⁻⁴ eV) is also exhibited by 7 wt% BHM nanocomposites. Furthermore, the electrical properties of both CG/PPy and CG/PPy/BHM nanocomposites exhibited a temperature-dependent behavior, progressively increasing until reaching maximum values. This study suggests that such bio-based polymer dielectrics could be promising materials for various applications, offering enhanced thermal and electrical properties through careful control of nanofiller content and dispersion.
Introduction
During earlier decades, the synthesis and applications of petroleum-based non-renewable polymeric products have been utilized and studied extensively. But the enhanced environmental pollution, crisis, and deterioration paved the way to think differently. An alternative to plastic was the greatest concern of 20th century scientists. So, researchers today work more on the development of biobased renewable polymers obtained from natural sources that protect nature from destruction. 1 Green chemistry and natural gums achieve more significance from this perspective. Natural gums are macromolecular polysaccharides and they are soluble in water. Gummous exudates are non-toxic, biodegradable, biocompatible and low-cost polymers with better rheological properties.2–6 All these characteristics aid us in using them as biodegradable membranes. Amidst the countless available biobased polymers, cashew gum (CG) is more attractive with its many beneficial properties and easy availability. CG was extracted from a cashew tree (Anacardium occidentale) distributed in northeastern Brazil and India. It is composed of galactose (72%–73%), glucose, arabinose, rhamnose, mannose, and glucuronic acid.7,8 These gum polysaccharides have the potential to ameliorate mechanical, physical and biological properties. 9 CG is a non-allergic, ecofriendly byproduct from nature used as a binding agent, emulsifier, stabilizer and thickening agent in the food and biomedical industries.10–12
Conducting polymers (CPs) have earned greater attention and prominence in recent days, attributable to their electrical conductivity, economic importance, optical properties and environmental stability. The demerits of CPs such as poor solubility, mechanical properties, and thermal stability, can be surmounted by the method of blending. Hence, polymer blends attain great attention and applications in diverse fields. 13 Polypyrrole (PPy) is a characteristic conjugated CPs that exhibits amazing electronic characteristics, including conductivity. PPy reveals various astounding properties, including greater environmental stability, electrical conductivity, thermal stability, biocompatibility, mechanical properties, solvent resistance, low cost, and ease of method of synthesis. These factors enable prospective applications in electronic devices, batteries, sensors, and much more.14–16
The inclusion of nanoparticles into the polymer matrix is another widely applied approach for the synthesis of hybrid functional materials. Metal oxide nanoparticles are universally employed as reinforcing fillers for different polymer composites owing to their enormous properties and utilization in gas sensing, antibacterial packaging, optoelectronic devices, etc. Aluminium-based metal oxide nanoparticles are non-toxic and less expensive when compared with other metal oxide nanoparticles.17–20 Oxyhydroxide of aluminum (AlOOH) known as boehmite has many free hydroxyl groups present in it. AlOOH nanoparticles are water-soluble white nanocrystals. On incorporation with CG/PPy, it improves many of the properties of the blend and also overthrows much of the drawbacks of PPy. 21 The polar groups available in BHM nanoparticles can interact effectively with various functional groups present in the blend and thereby adhere to them easily. 22
In this work, we synthesized the CG/PPy blend incorporating boehmite nanoparticles in varying compositions of 4, 7, 10, and 13 wt% through in situ polymerization using a green synthesis approach. This study examines the chemical interaction between BHM and the biopolymer blend using FT-IR spectroscopy. The morphology of the blend nanocomposites is characterized by FE-SEM. The glass transition temperature and thermal stability of the blend nanocomposites are analyzed with respect to different loadings of BHM nanoparticles. Finally, an impedance analyzer is used to investigate the electrical properties, including conductivity and dielectric constant, across various temperature and frequency ranges.
Experimental
Materials and methods
CG was collected from the native trees in and from the premises of the Calicut University campus during the summer season. The CG was purified after dissolving in distilled water, filtered, and then precipitated from ethanol. The purified CG was then dried and grounded in a ball mill and passed through a 90 μ mesh size to get a fine powder with a molecular weight of 1.85 × 10⁴ g/mol. Pyrrole (Merck) was used after purification by distillation. Ammonium persulfate (APS) and cetyltrimethylammonium bromide (CTAB) were procured from Merck India. Deionized water was used for all the synthesis.
Synthesis of CG/PPy biopolymer blend
An eco-friendly conductive biopolymeric blend was synthesized via in situ polymerization of CG with pyrrole monomer. CG was dissolved in distilled water, while pyrrole monomer was dispersed in an aqueous CTAB solution. The CG solution (CG in a 3:1 ratio) was blended with the pyrrole dispersion and stirred on a magnetic stirrer until homogeneity was achieved. Subsequently, an APS solution (0.0175 mol) was slowly added to the blend solution and continuously stirred for 12 h. The resulting blend precipitate was filtered, thoroughly washed with distilled water and ethanol, then dried in a hot air oven at 60°C for 2 days.
Preparation of CG/PPy/BHM biopolymer blend nanocomposites
Biopolymer blend nanocomposites were synthesized by mixing CG and PPy with various contents of BHM nanoparticles by in situ polymerization method in an aqueous medium. The CG was dissolved in distilled water. The pyrrole monomer was dispersed in water with CTAB. This solution was then mixed thoroughly with CG solution (CG:Py in the ratio 3:1) followed by the addition of BHM nanoparticles (0, 4, 7, 10, and 13 wt%) and ultrasonicated for 15 min. APS (0.0175 mol) solution was slowly added to the blend solution and continued the polymerization for 12h. The blend precipitate was then filtered, and washed thoroughly with distilled water and ethanol. It was then dried in the hot air oven at 60°C for 2 days. The schematic representation for the synthesis of CG/PPy/BHM biopolymer blend nanocomposites is given in Scheme 1. The preparation method and the interaction mechanism of CG/PPy/BHM nanocomposites.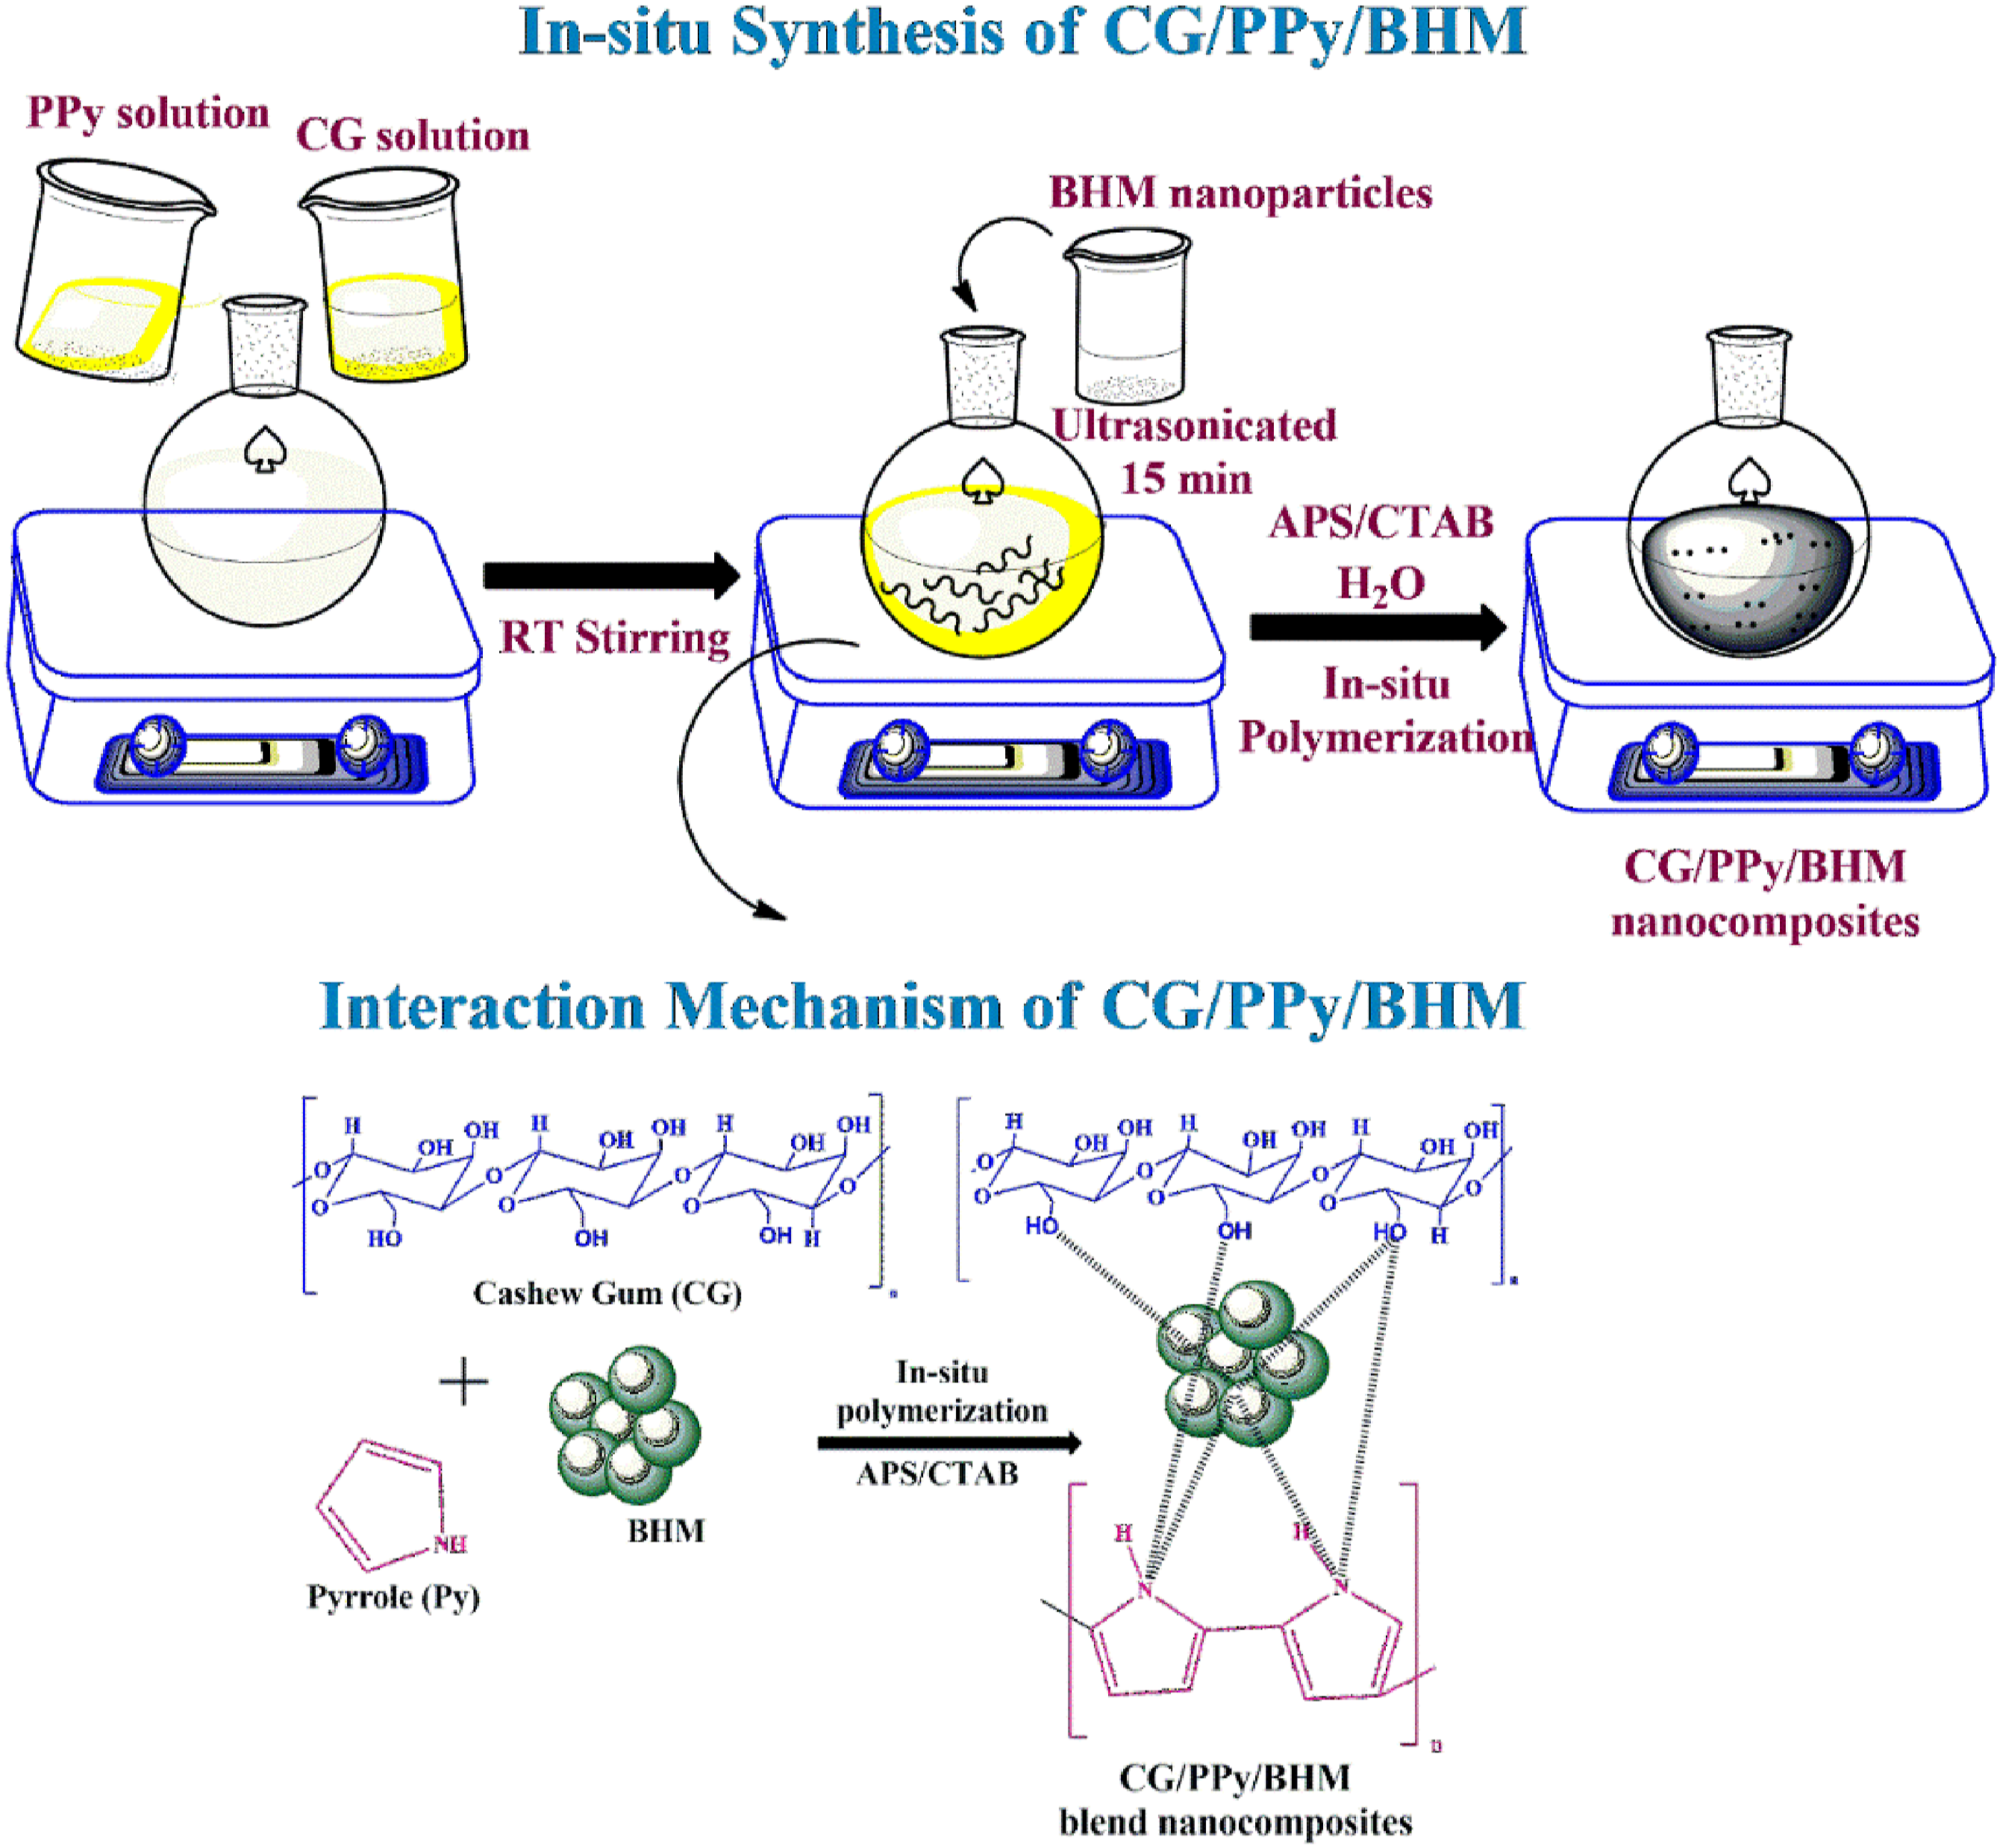
Characterization
Fourier-transform infrared (FTIR) spectroscopy (JASCO 4100) was used to evaluate the infrared spectra in the 400–4000 cm−1 range. The surface morphology and topography of blend nanocomposites were carried out by field emission scanning electron microscopy (FESEM, Carl Zeiss, VP500 model). Thermal transitions of CG/PPy/BHM composites were obtained from a V2 6D TA instrument model 2010. The thermal stability of blend composites was tested at a heating rate of 10°C per min in a Hitachi STA7200 thermogravimetric analyzer. The electrical conductivity measurement was carried out on circular-shaped samples after pelletizing using the LCR meter (HIOKI 3570) over a temperature range of 30°C to 100°C at different frequencies.
Results and discussion
FT-IR spectra
The FT-IR spectra of BHM, CG/PPy blend, and BHM incorporated blend nanocomposites are presented in Figure 1. The bands at 1651 and 1402 cm−1 are attributed to the fundamental vibrations of the PPy ring, those at 1118 cm−1 are due to the = C–H in-plane vibrations.
23
The strong broad absorption band observed in all the synthesized samples, ranging from 3000 cm−1 to 3700 cm−1, is attributed to the O–H stretching vibration of CG, combined with the N-H ring vibrations of PPy within the biopolymer blend nanocomposites.
24
The band observed at 1658 cm−1 corresponds to the C = O stretching vibration of the glucuronic acid present in the CG. The peak at 1403 cm−1 is because of the CH2 scissoring in the CG polymer. On examining the FT-IR of BHM nanoparticles, the observed peaks appeared at 3237 (a broad band), 1641, 1507, 1382, and 1070 cm−1. The peak at 1070 cm−1 allocates the bending vibrations of deprotonated O-H groups.
25
The FT-IR spectra also provide some characteristic peaks of BHM nanoparticles at 1072 cm−1 and 1171 cm−1. These observed peaks correspond to the symmetric and asymmetric Al-O-H bending vibrations respectively.
26
The absorption peak at 840 cm−1 is also evidence of the stretching vibrations of Al-O. The spectrum of CG/PPy/BHM blend nanocomposites exhibits all the characteristic peaks of CG and PPy, albeit with slight shifts in their positioning due to the attachment of BHM into the blend segments. Moreover, the appearance of a new peak at 482 cm−1, corresponding to the Al-O vibration of BHM, in the IR spectrum of the nanocomposites provides strong evidence for the successful polymerization of BHM with CG/PPy. FT-IR spectra of CG/PPy with different compositions of BHM.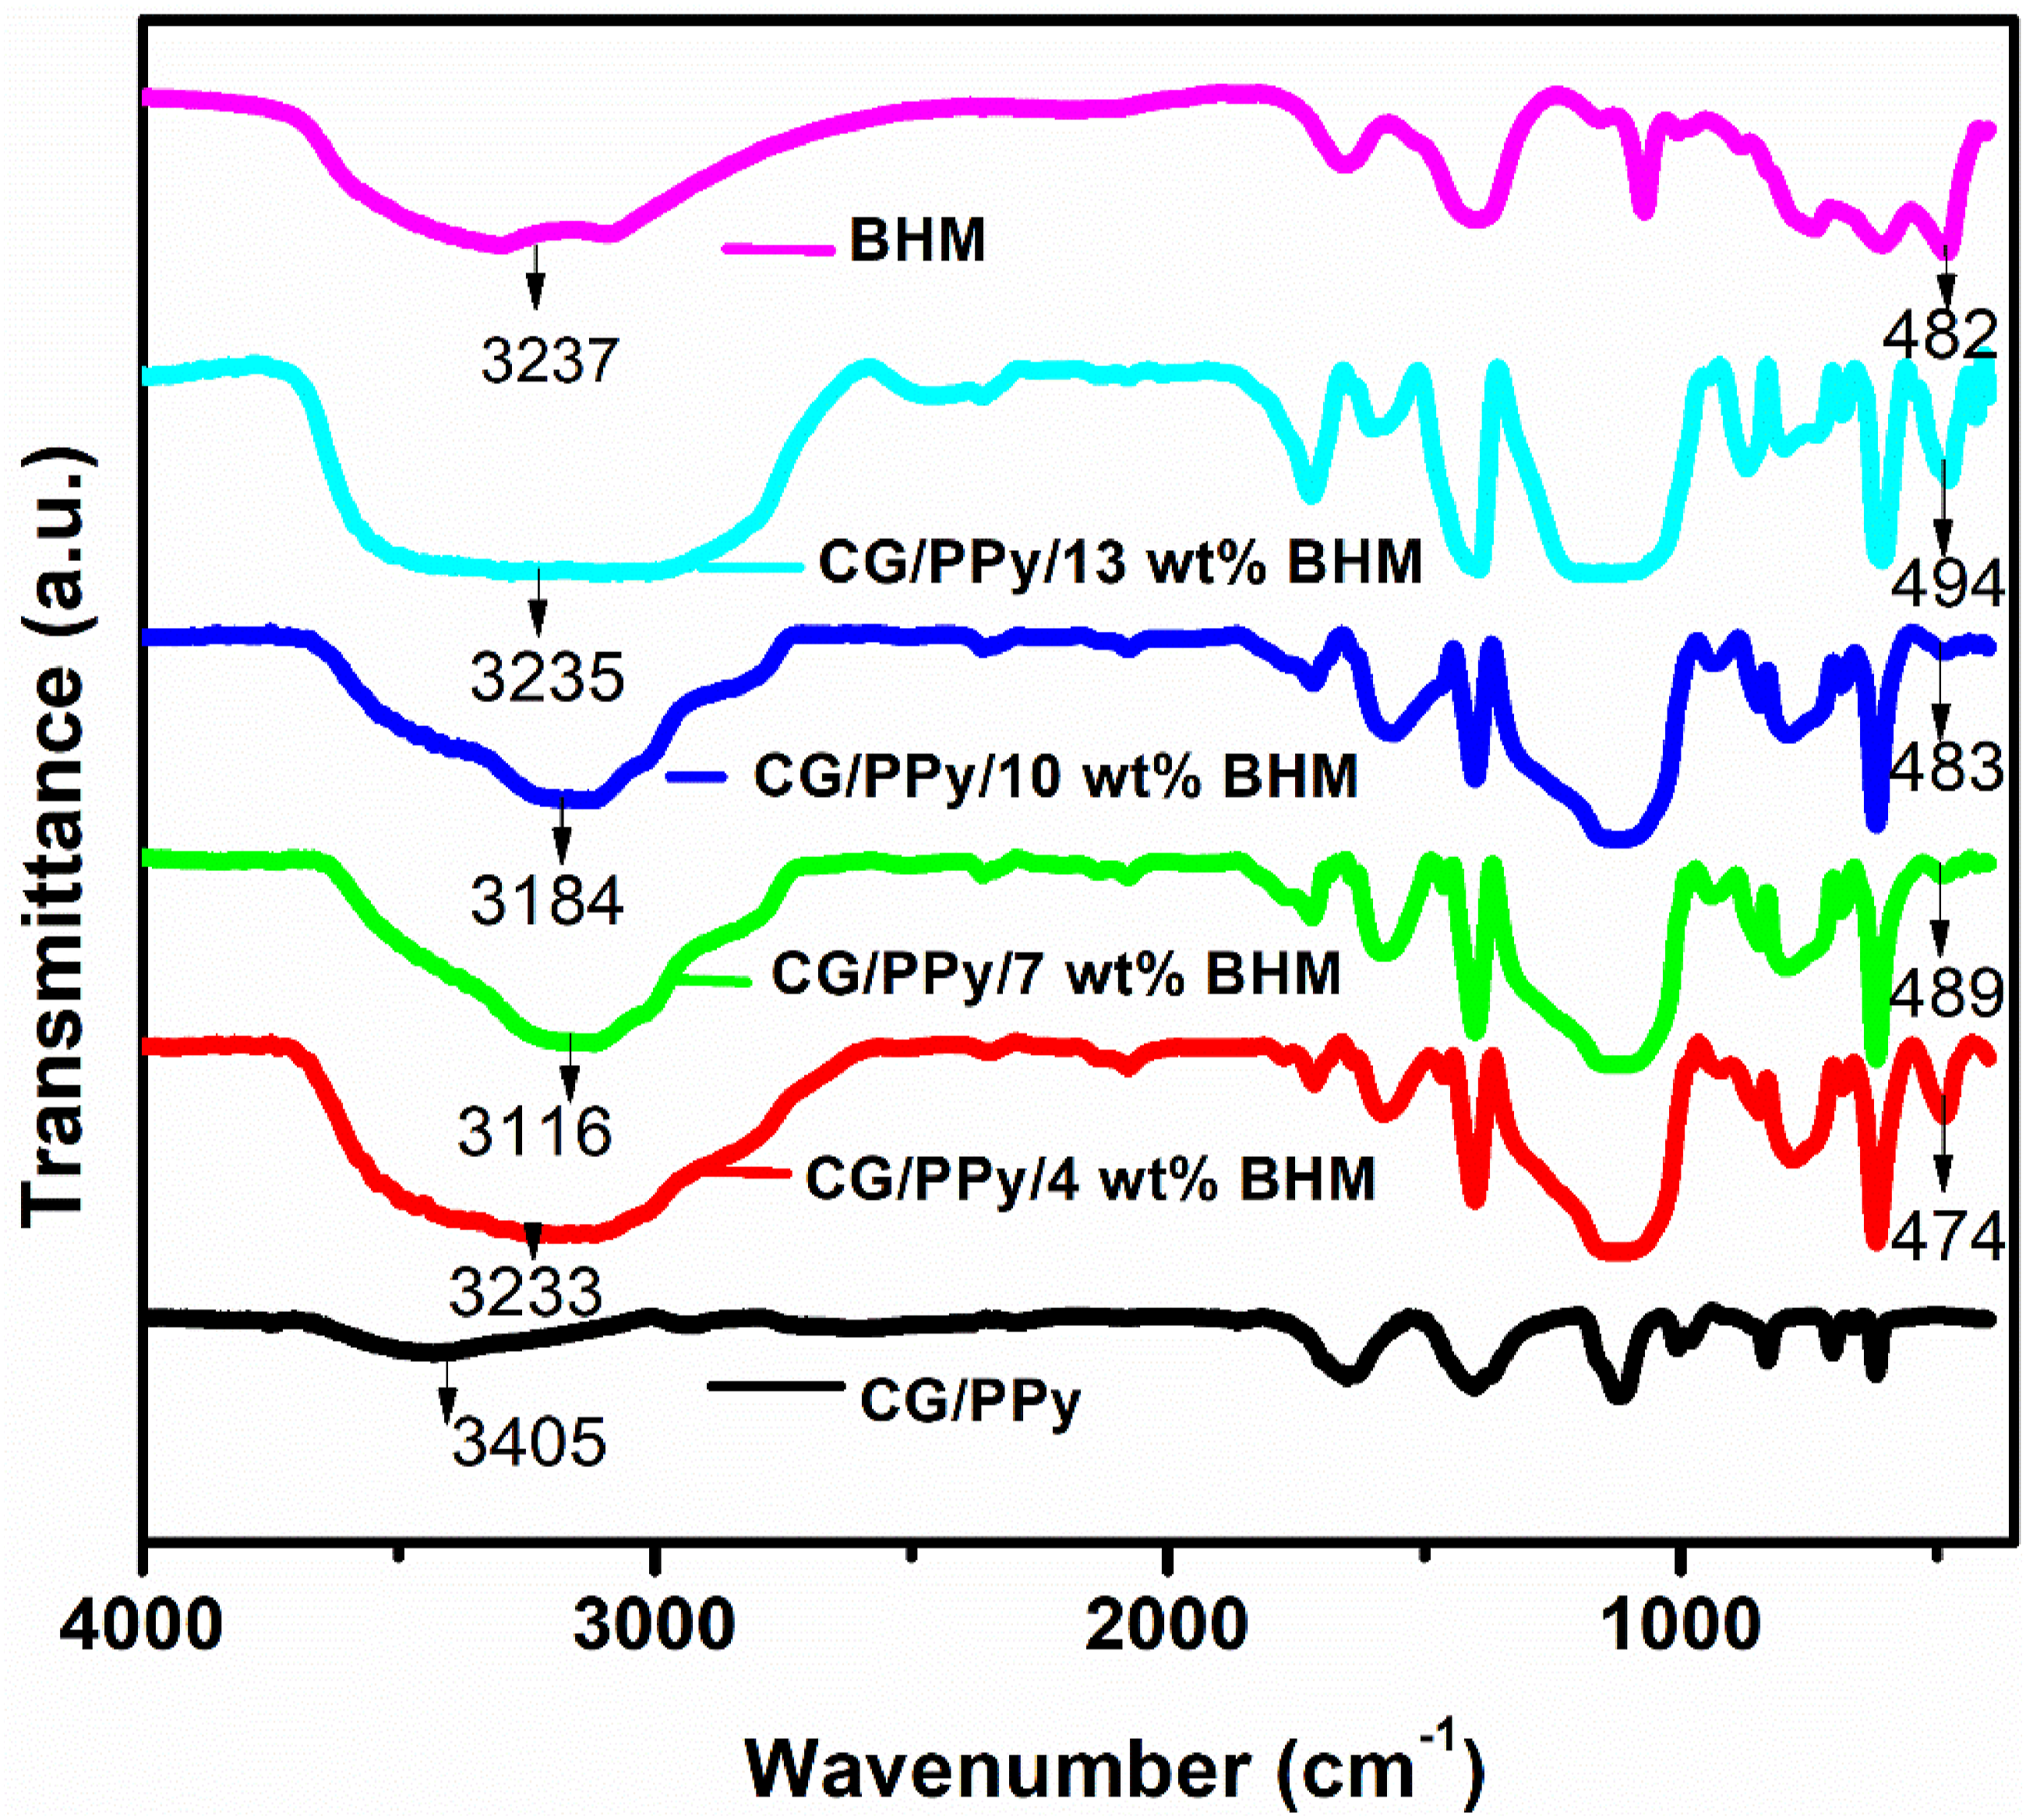
Morphology observations by FESEM analysis
The FE-SEM images of CG/PPy blend and CG/PPy with different concentrations of BHM (4, 7, 10 and 13 wt%) are shown in Figure 2. The CG/PPy blend exhibits an irregular surface with voids (Figure 2(a)), whereas the CG/PPy blend nanocomposites show a different surface morphology due to the presence of BHM (Figure 2(b)–(e)). The changes in the morphology of the blend composites synthesized with the inclusion of nanoparticles can be attributed to the effective interaction between the nanoparticles and the polar functional groups of CG/PPy. These interactions likely enhance the dispersion and integration of nanoparticles within the composite matrix, leading to improved structural and functional properties. Among the blend nanocomposites, the nanoparticles are uniformly dispersed and distributed in the matrix of CG/PPy when the concentration of BHM nanofillers is at 7 wt%. However, as the concentration of BHM nanofillers increases above 7 wt%, the spherical structure of the nanocomposites becomes slightly agglomerated, leading to a non-homogeneous morphology (Figure 2(d) and (e)). This change in morphology suggests the poor dispersion and increased particle agglomeration at higher filler concentrations.27,28 This decrease in interaction is due to the development of increased stress among the nanocomposites prepared. FESEM images of (a) CG/PPy (b) 4 wt% (c) 7 wt% BHM (d) 10 wt% and (e) /13 wt% BHM incorporated CG/PPy.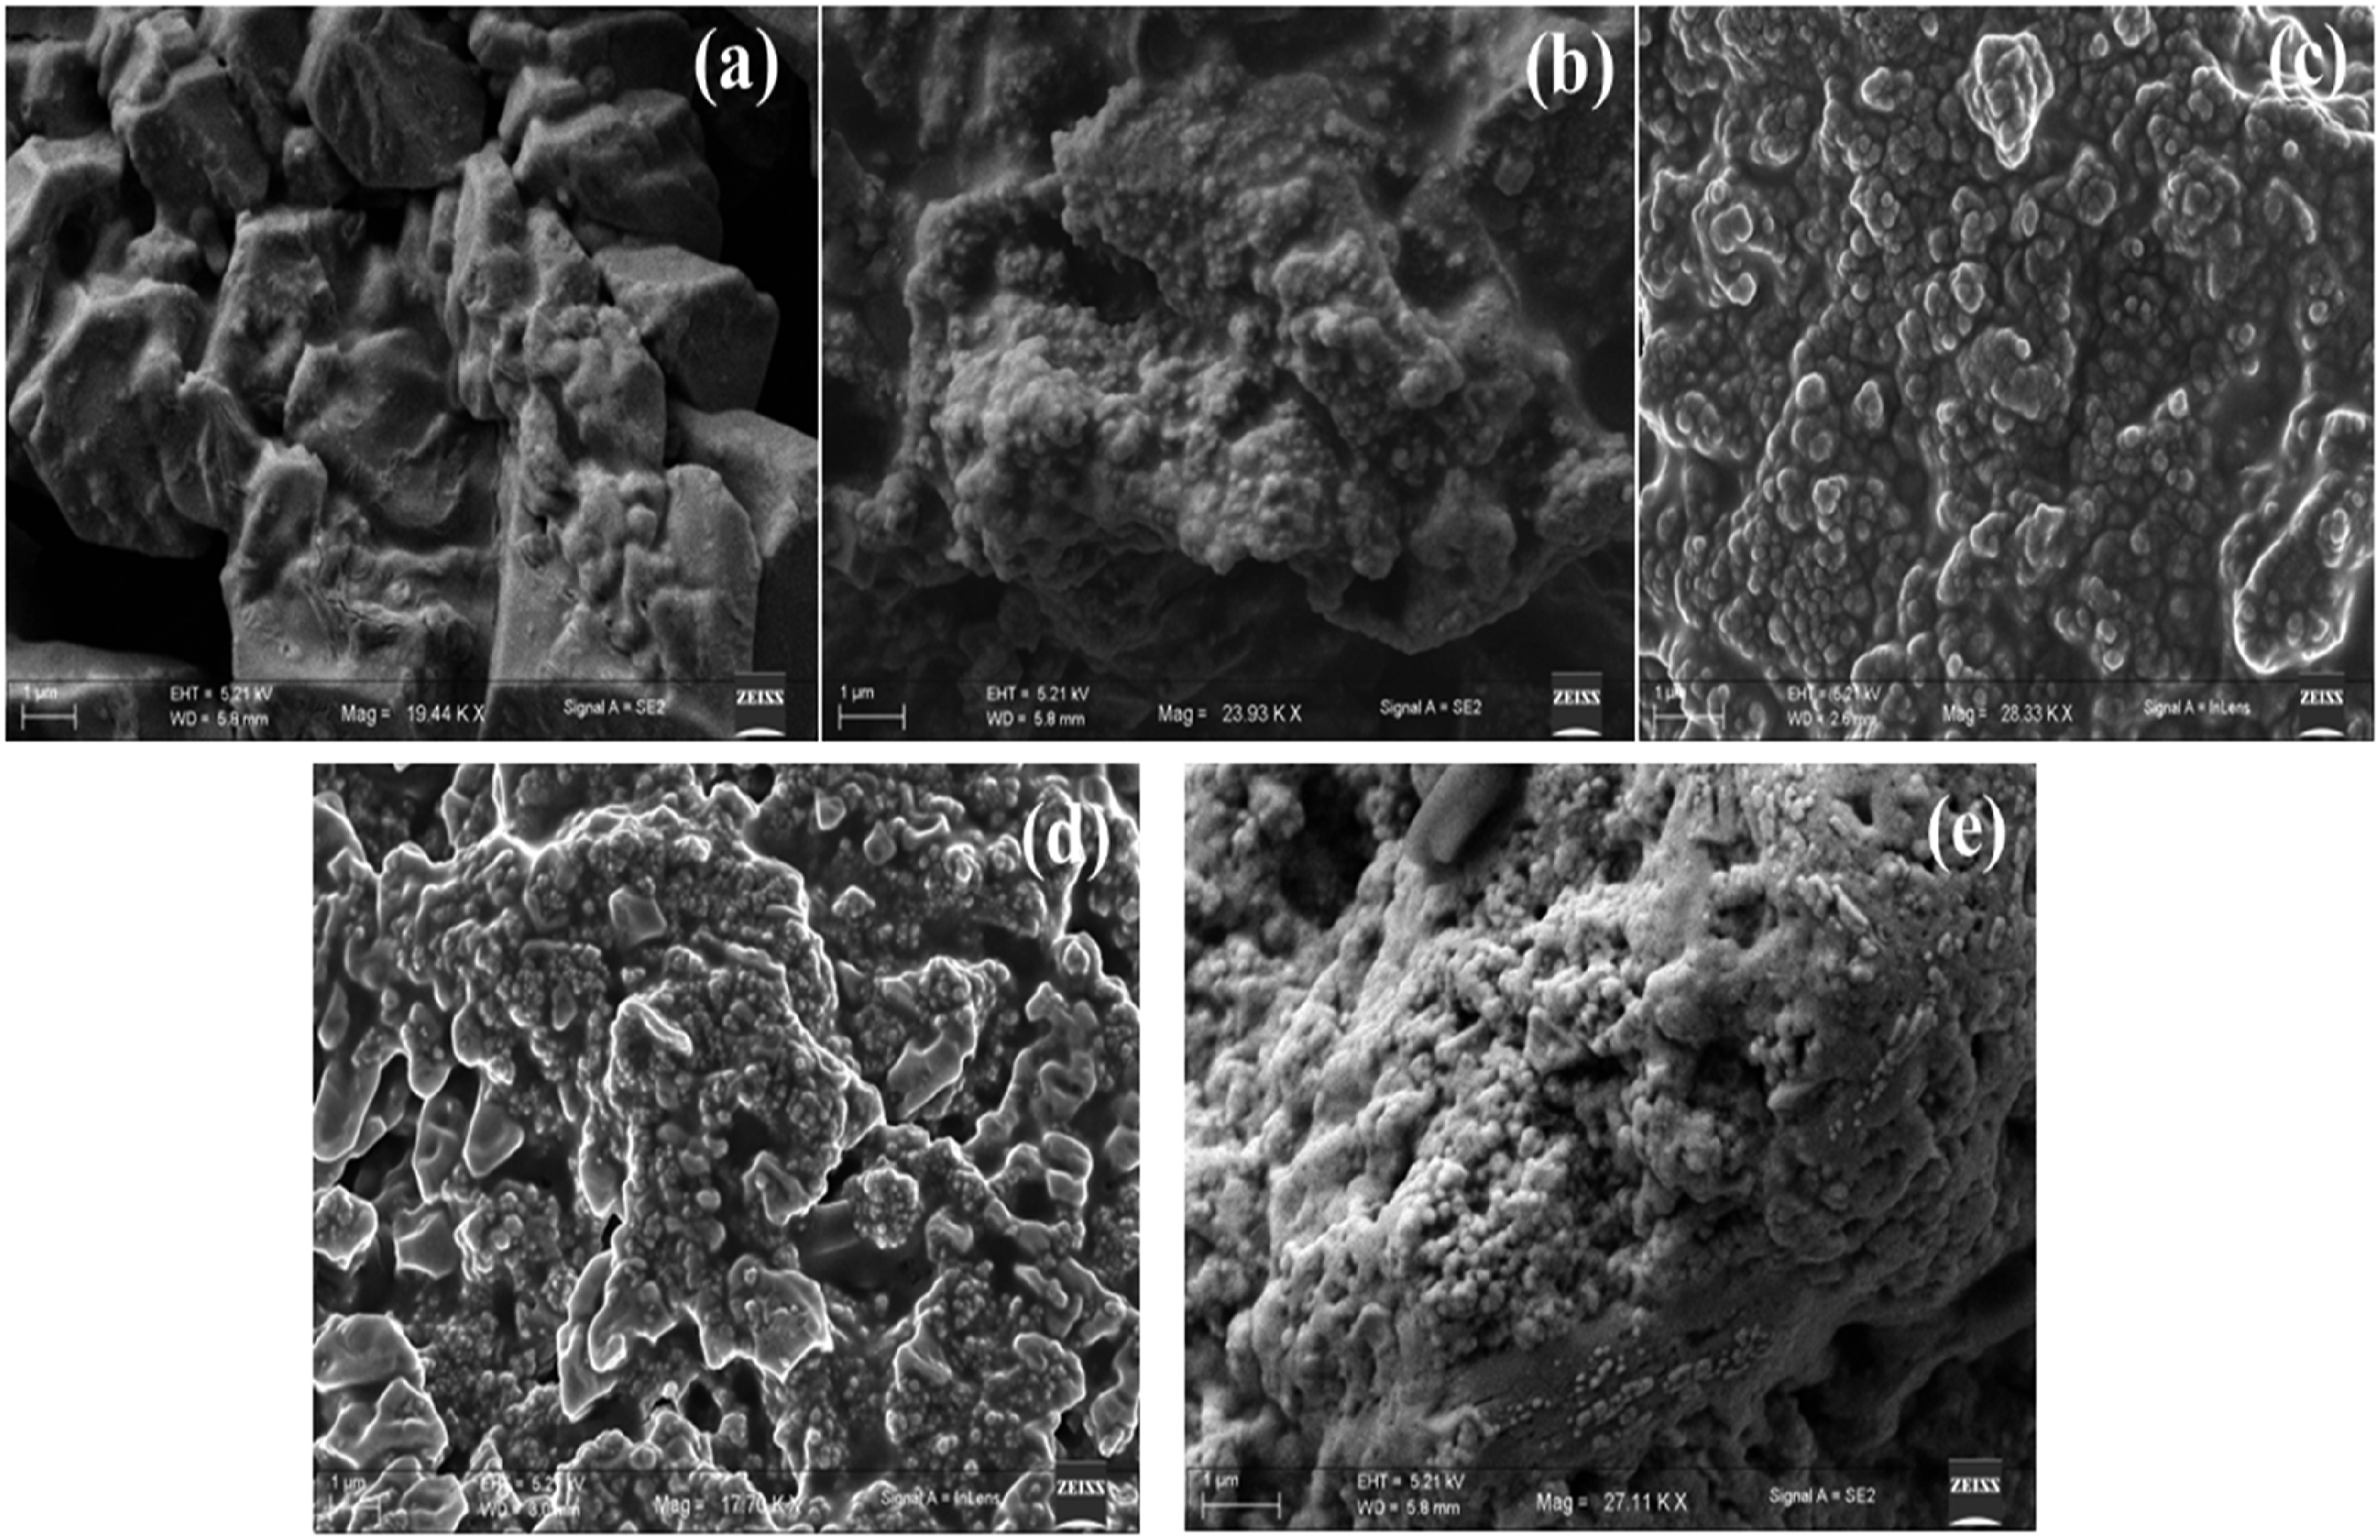
Thermogravimetric Analysis (TGA)
Figure 3 demonstrates the TGA thermographs of the CG/PPy biopolymer blend with different loadings of BHM nanoparticles. The thermal degradation process leads to the decomposition of the synthesized composites when subjected to various temperatures. The exposure to different temperatures may cause bond fission within the molecules, resulting in the breakdown of the composite material.
29
From the TGA curves, it can be observed that as the concentration of BHM nanofillers increases, the thermal stability of the composites also improves. The thermal degradation of the composites occurs in two stages. The first stage is a small initial degradation step, followed by a second stage which involves a major degradation step. The TGA curves display similar patterns of degradation steps or processes for all the samples with different loadings of BHM nanofillers. The initial, smaller weight loss occurs at a temperature range of approximately 59 to 98°C, due to the removal of water molecules entrapped within the matrix. In contrast, the second significant weight loss begins at around 210 to 345°C. This major mass loss for the pure polymer blend occurs at approximately 210°C. However, for the blend nanocomposites with different loadings of BHM nanofillers (4, 7, 10, and 13 wt%), the second significant weight loss occurs at 218°C, 220°C, 222°C, and 226°C, respectively. This indicates that the blend nanocomposites undergo degradation at higher temperatures compared to the parent CG/PPy biopolymer blend. The enhancement in thermal stability can be attributed to the strong adhesion between CG/PPy biopolymer blend and the BHM nanoparticles.
30
This strong adhesion results in better dispersion and distribution of the nanoparticles within the blend matrix, thereby improving the overall thermal stability of the blend nanocomposites. TGA plots for CG/PPy and its nanocomposites.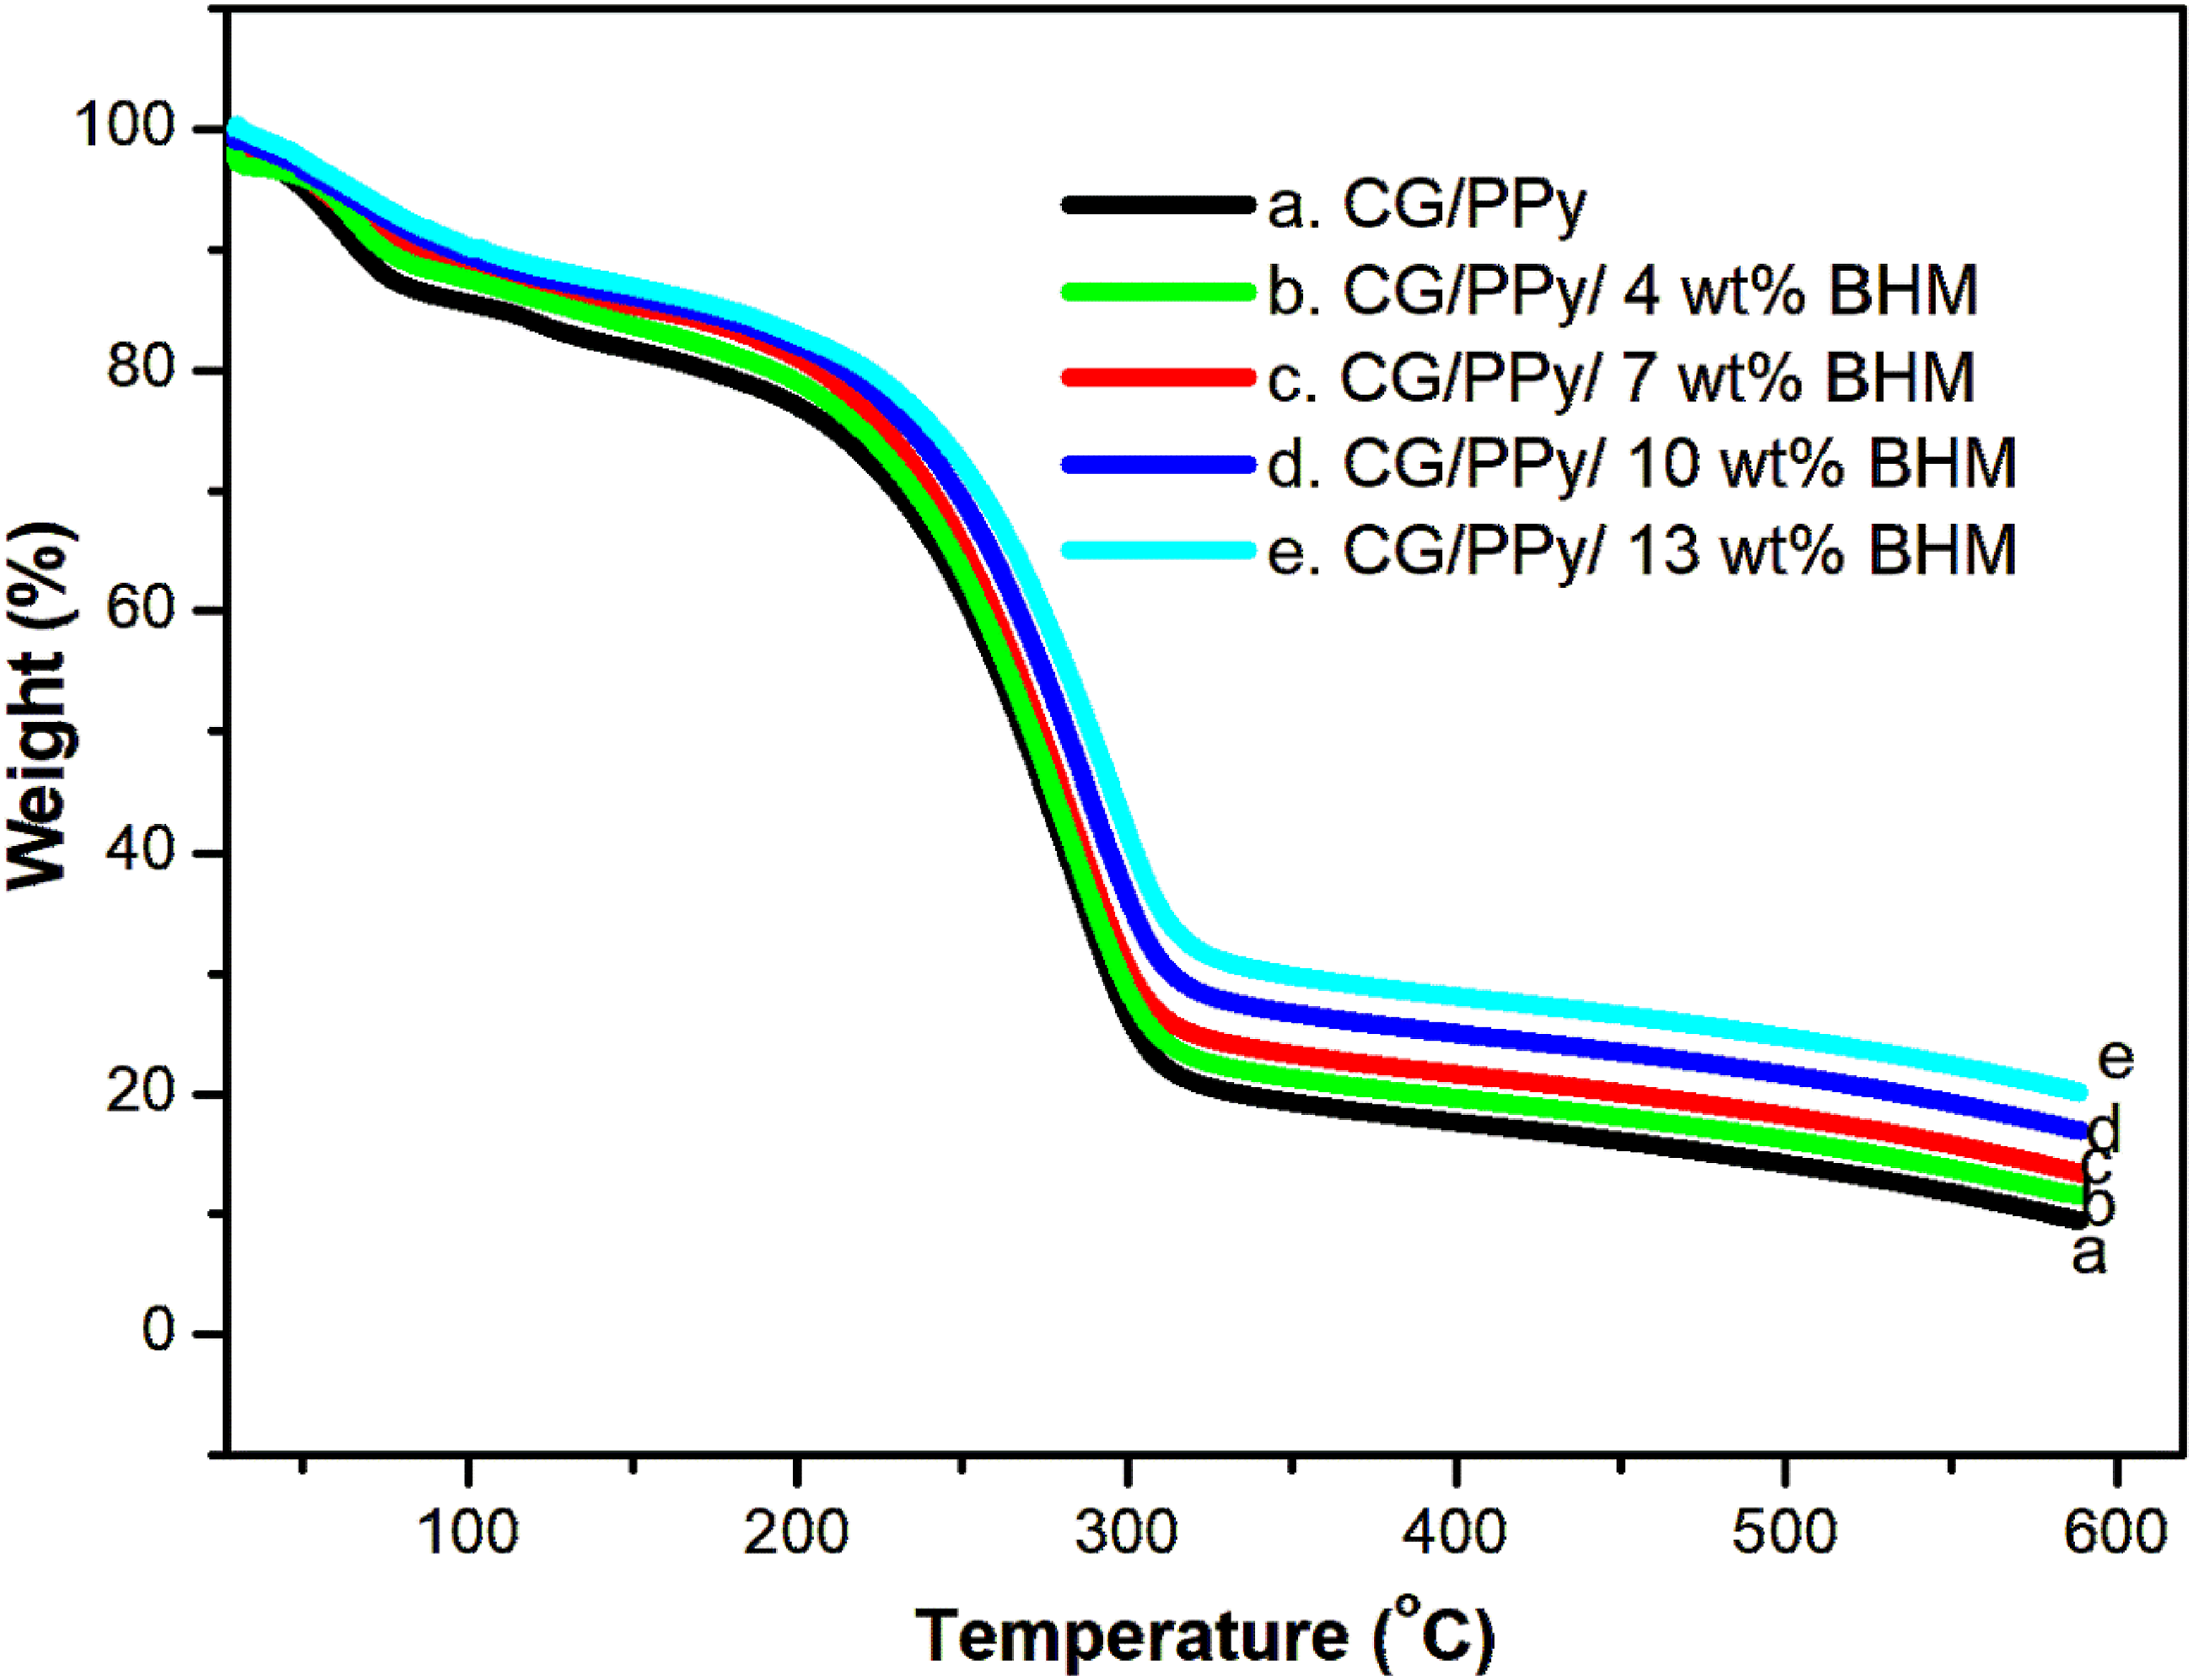
Differential scanning calorimetry (DSC)
Figure 4 shows the DSC results of synthesized CG/PPy and different CG/PPy/BHM biopolymer blend nanocomposites. Herein, all the prepared samples show two endothermic drops. The significant endothermal fall at the initial stage corresponds to the glass transition temperature (Tg).
31
Generally, several factors influence Tg, viz., the nature of nanofillers, the concentration of nanofillers, the interactions between different monomers, and interfacial interactions among polymers and nanofillers.
32
The first endothermal peak of the CG/PPy blend composite is around 89°C, which corresponds to the Tg of the parent biopolymer blend. When BHM nanofillers are added, the Tg value of the CG/PPy blend nanocomposites changes. Specifically, for the CG/PPy blend nanocomposites with 4, 7, 10, and 13 wt% BHM, the Tg values become 90°C, 92°C, 99°C, and 104°C, respectively. The increase in Tg suggests that the presence of BHM nanofillers affects the molecular mobility and mechanical properties of the composite material, leading to a higher glass transition temperature. Focusing on the second endothermal peak, which corresponds to the crystalline melting temperature (Tm), the Tm value for CG/PPy is approximately 260°C. However, with the addition of BHM nanofillers, the Tm values increase. For the samples with 4, 7, 10, and 13 wt% BHM, the Tm values are 264°C, 270°C, 272°C, and 273°C, respectively. This increase in Tm indicates that the presence of BHM nanofillers enhances the thermal stability and crystallinity of the composite material. Moreover, the results obtained from DSC highlight its utility for studying the temperature-related characteristics of various polymers and polymer nanocomposites. DSC results of CG/PPy/BHM biopolymer nanocomposites.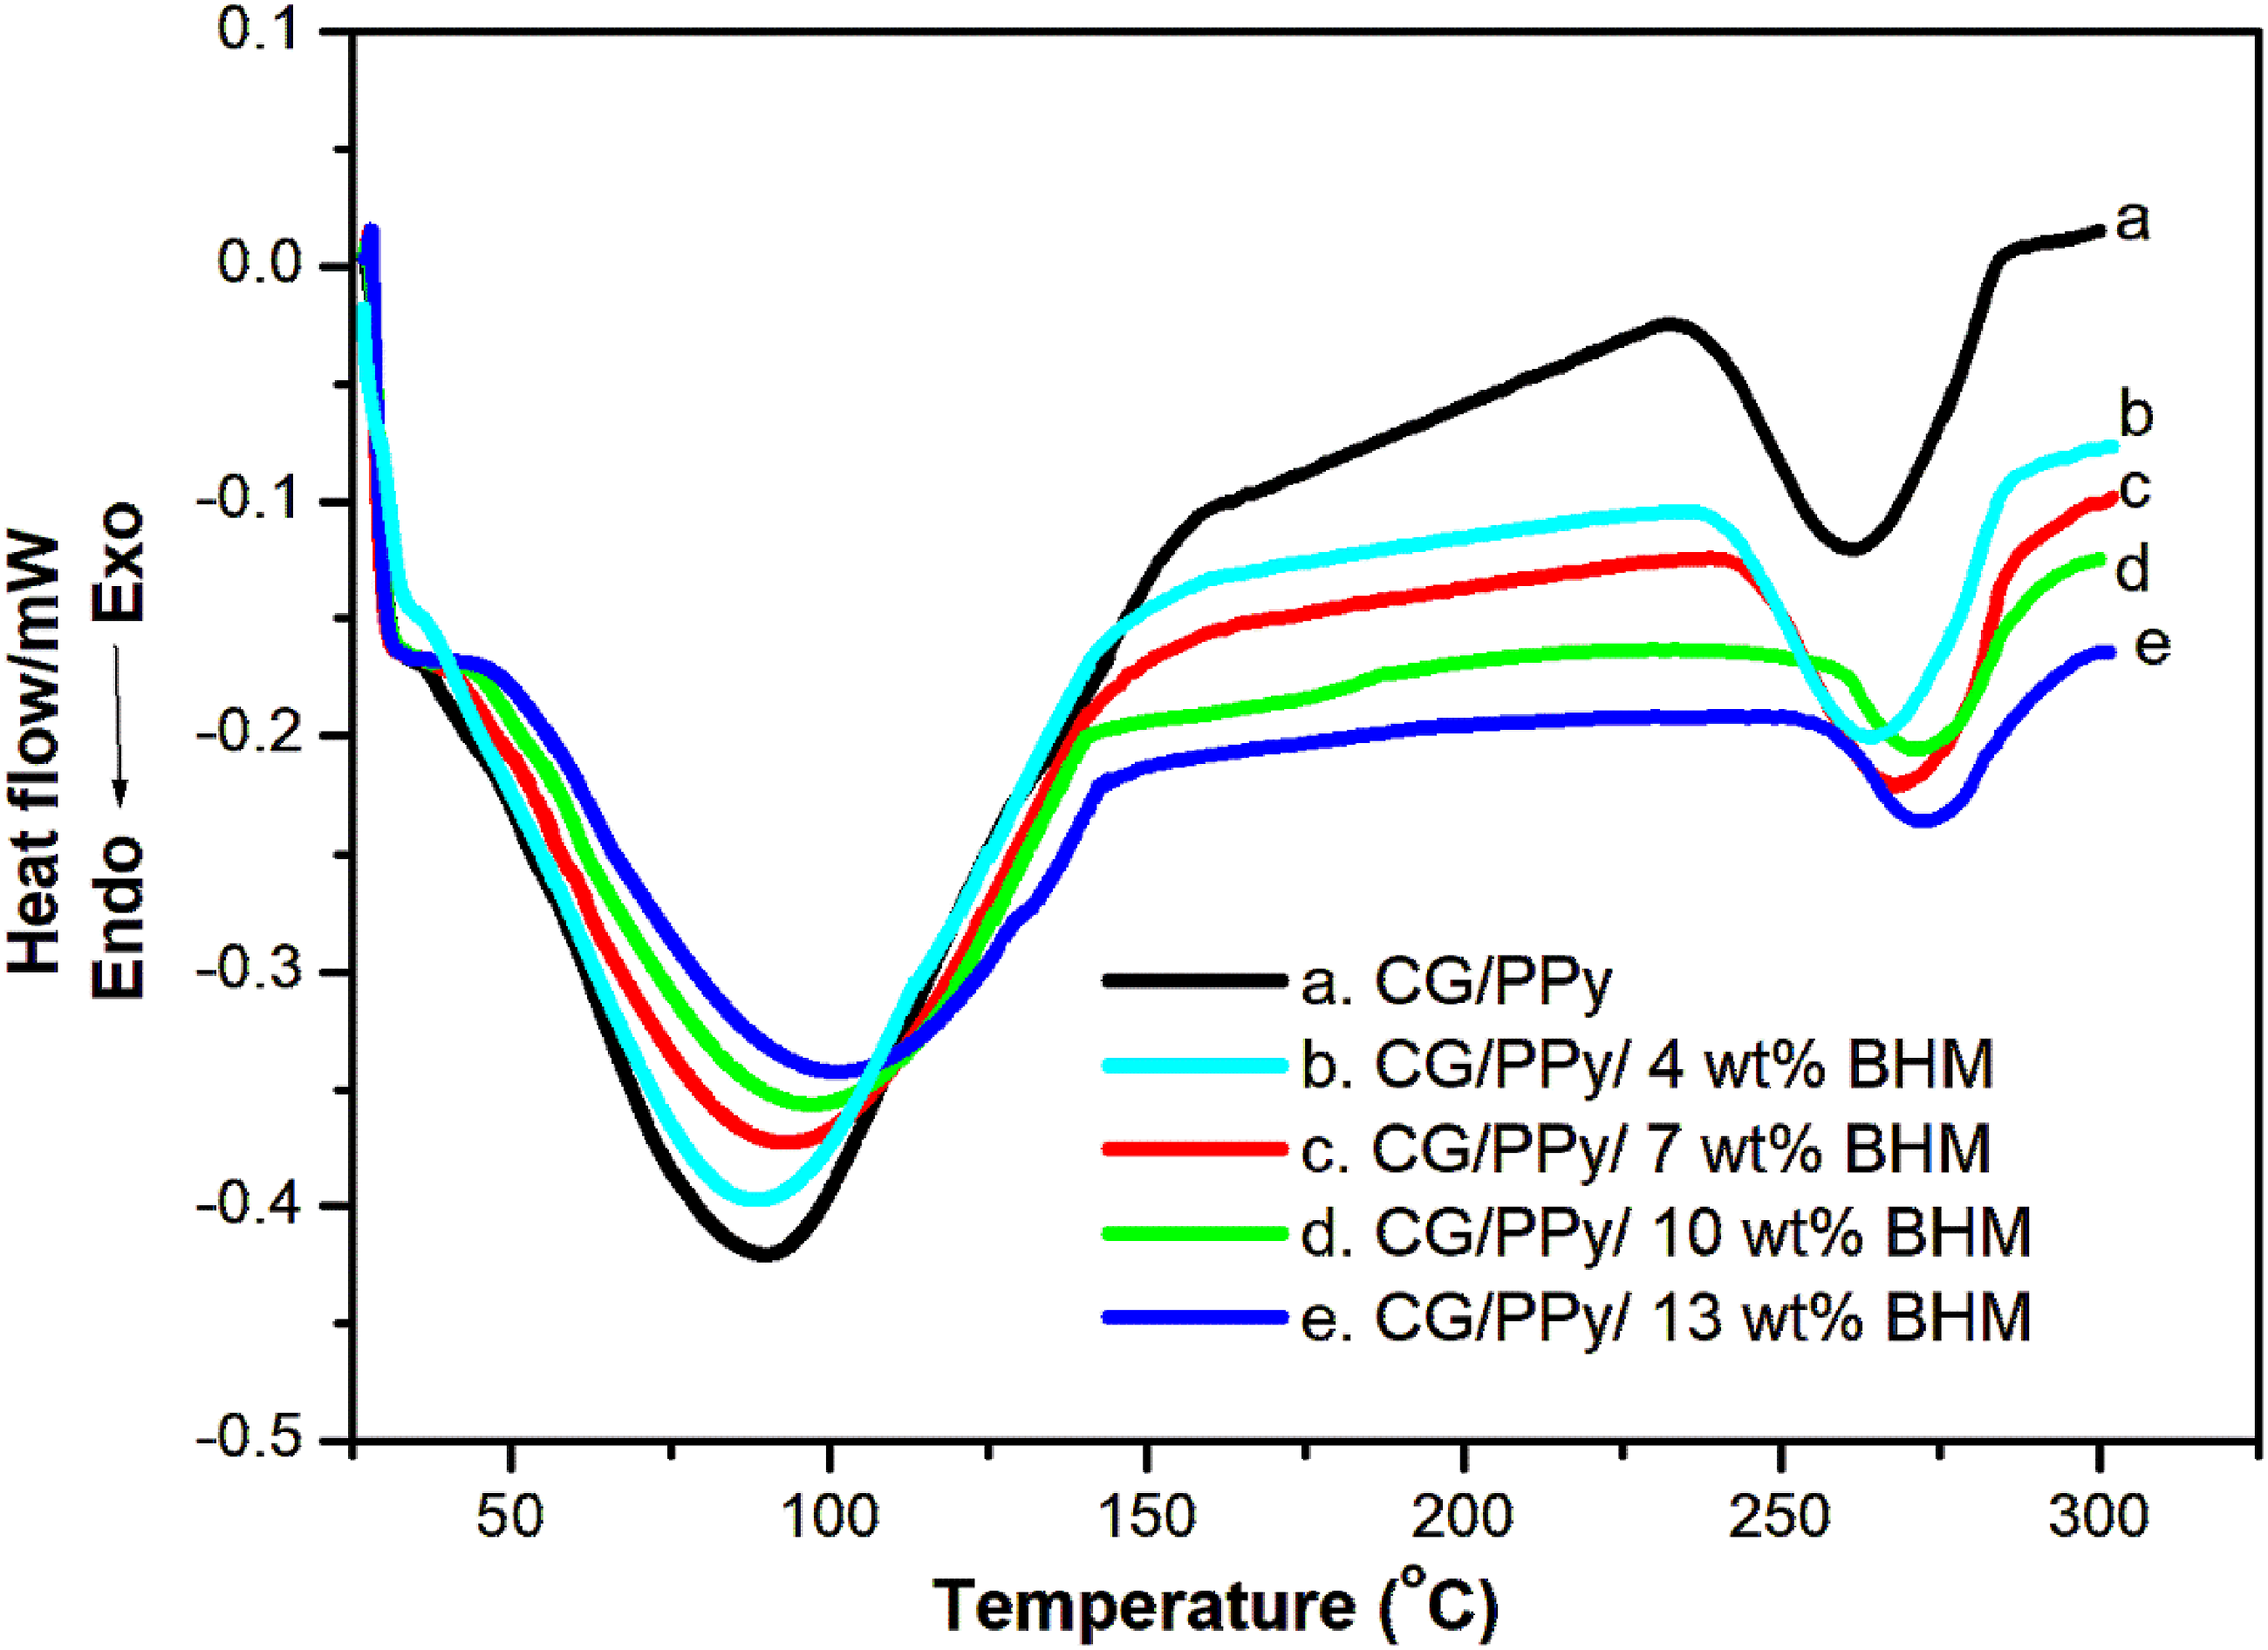
Electrical conductivity studies
Room temperature AC conductivity
The improvement in the AC conductivity with the inclusion of BHM occurs against the frequency at different compositions of BHM is plotted in Figure 5. The conductivity of a given sample can be evaluated using the following equation; Room temperature AC conductivity of CG/PPy/BHM and its nanocomposites.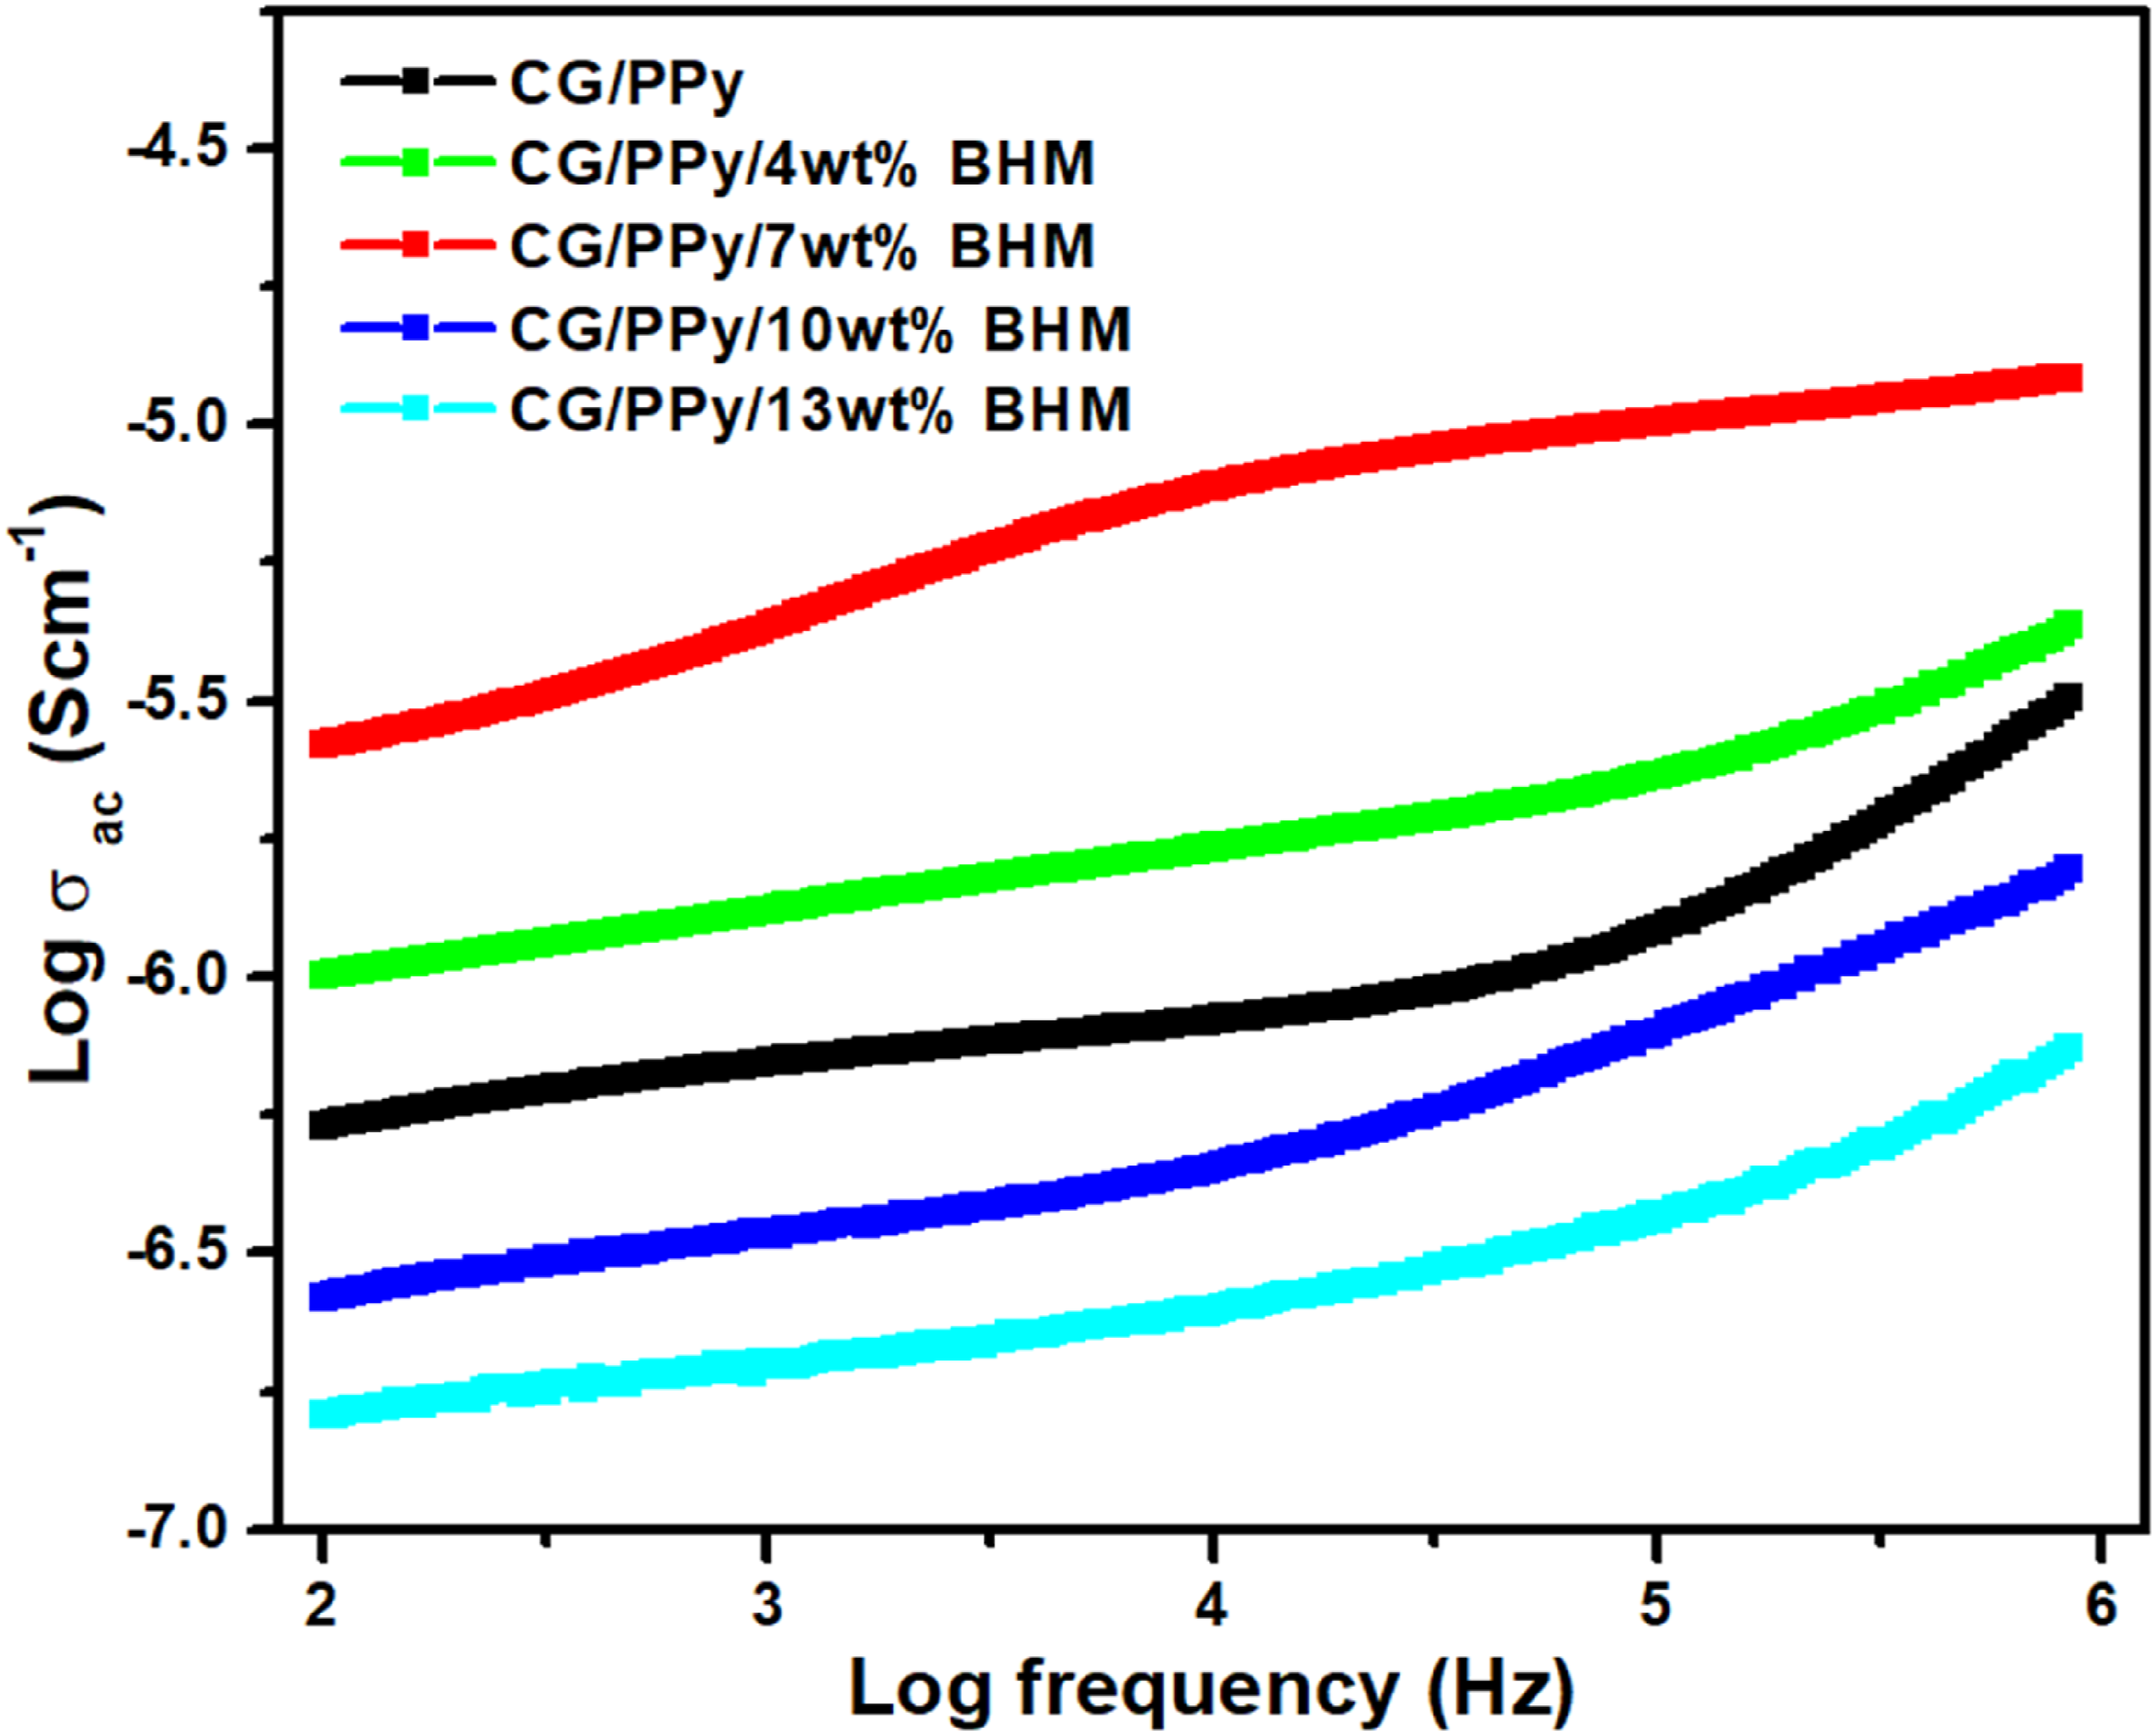

Here, ε0 is the free space permittivity, εr corresponds to the dielectric constant, and ω is the angular frequency. 33 From the figure, it is observed that the AC conductivity of the nanocomposites is higher than the parent CG/PPy blend matrix. Moreover, all the synthesized composites exhibit similar behavior. There is not much variation in the conductivity with frequency during the initial ranges of frequency around 105. Afterward, the AC conductivity slightly increases with an increase in frequency. This is due to the generation of excess charge carriers, such as polarons and bipolarons, within the nanocomposites synthesized. As the frequency rises, the hopping charge carriers also get excited, resulting in an enhancement in the process of conduction. Previous literature describes that as conductivity increases, there is a decrease in resistivity. 34 PPy is a good conducting polymer with astonishing properties, referred to as the most stable polymer among intrinsic conducting polymers. 35 Incorporating BHM nanoparticles into the polymer blend composites assists in enhancing the conductivity of the samples. Improving the interaction between the nanoparticles and the polymer causes an augmentation in the electrical conductivity. 36 From the figure above, it is evident that CG/PPy/7 wt% BHM nanocomposite exhibits the highest conductivity among the different compositions synthesized. The results suggest that the optimal conductivity is achieved at 7 wt%, where the uniform distribution of BHM fillers fosters a more effective filler-polymer interaction. However, as the concentration of nanoparticles increases beyond 7 wt%, the electrical conductivity decreases. This decline can be attributed to the agglomeration of nanoparticles within the composite, which reduces the interaction between the molecules and hinders the flow of electrons, thus lowering the overall conductivity.
Temperature dependent AC conductivity
Figure 6 depicts the temperature dependence of AC conductivity for the polymer CG/PPy blend and BHM nanoparticles included at different frequencies. From Figure 6, it is observed that the maximum AC conductivity is shown by CG/PPy/7 wt% nanocomposite. When there is an elevation in temperature, there is also an increase in conductivity. Other factors affecting the AC electrical conductivity of the polymer are the size, shape, intermolecular interaction, surface area, nanofiller, cluster-forming tendency, the dispersion of nanoparticles within the polymer, and the conductivity of nanoparticles.37,38 As thermal energy increases, it provides additional energy to the charged carriers within the material, leading to enhanced mobility. This increased mobility facilitates greater interaction among the particles within the composite material, which in turn can lead to an increase in conductivity. Therefore, higher thermal energy can contribute to improved electrical conductivity by promoting the movement of charged carriers and facilitating better particle interaction. Temperature-dependent AC conductivity of CG/PPy blend and its nanocomposites.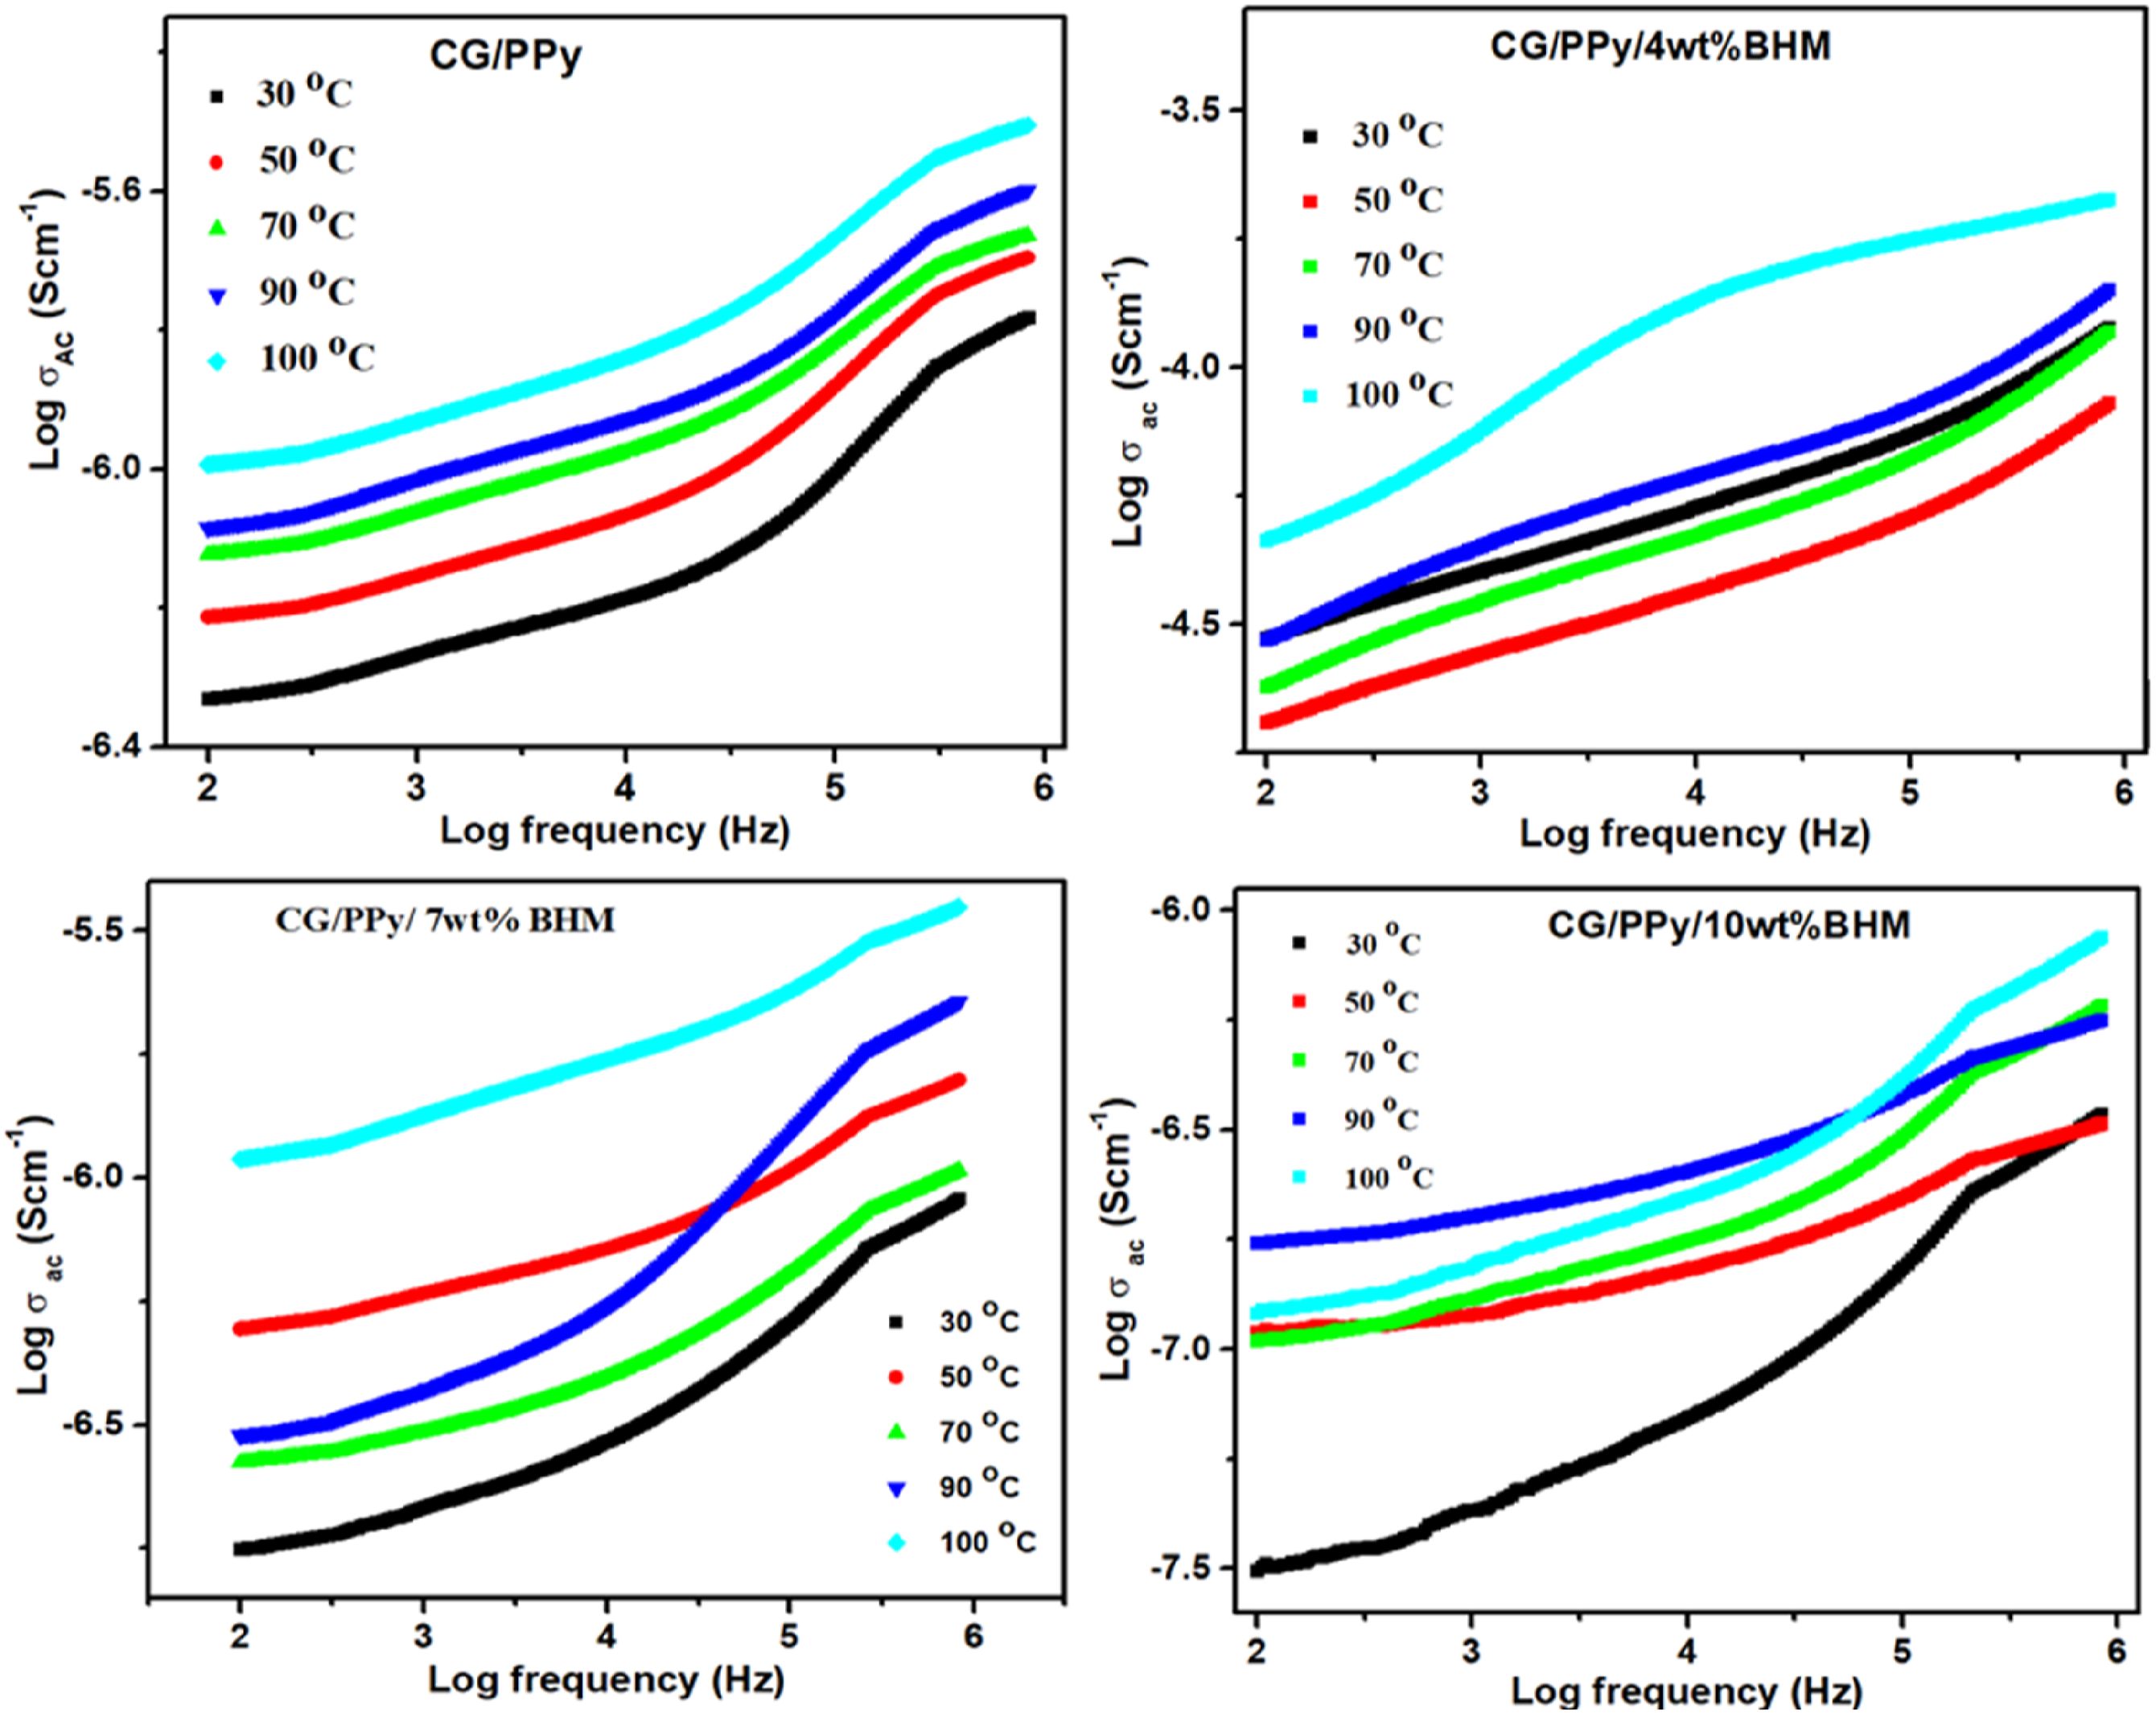
Activation energy
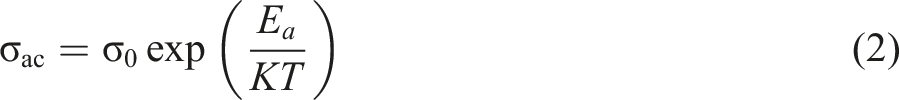
The changes in log σac v/s 1000/T for the CG/PPy polymer blend along with the different compositions (4, 7, and 13 wt) of CG/PPy/BHM blend nanocomposites are represented in Figure 7. All the graphs shown above confirm that all the samples synthesized display linear behavior with temperature and follow the Arrhenius equation as given below: The activation energy for CG/PPy/BHM biopolymer blend nanocomposites. The activation energy of the CG/PPy blend and its nanocomposites.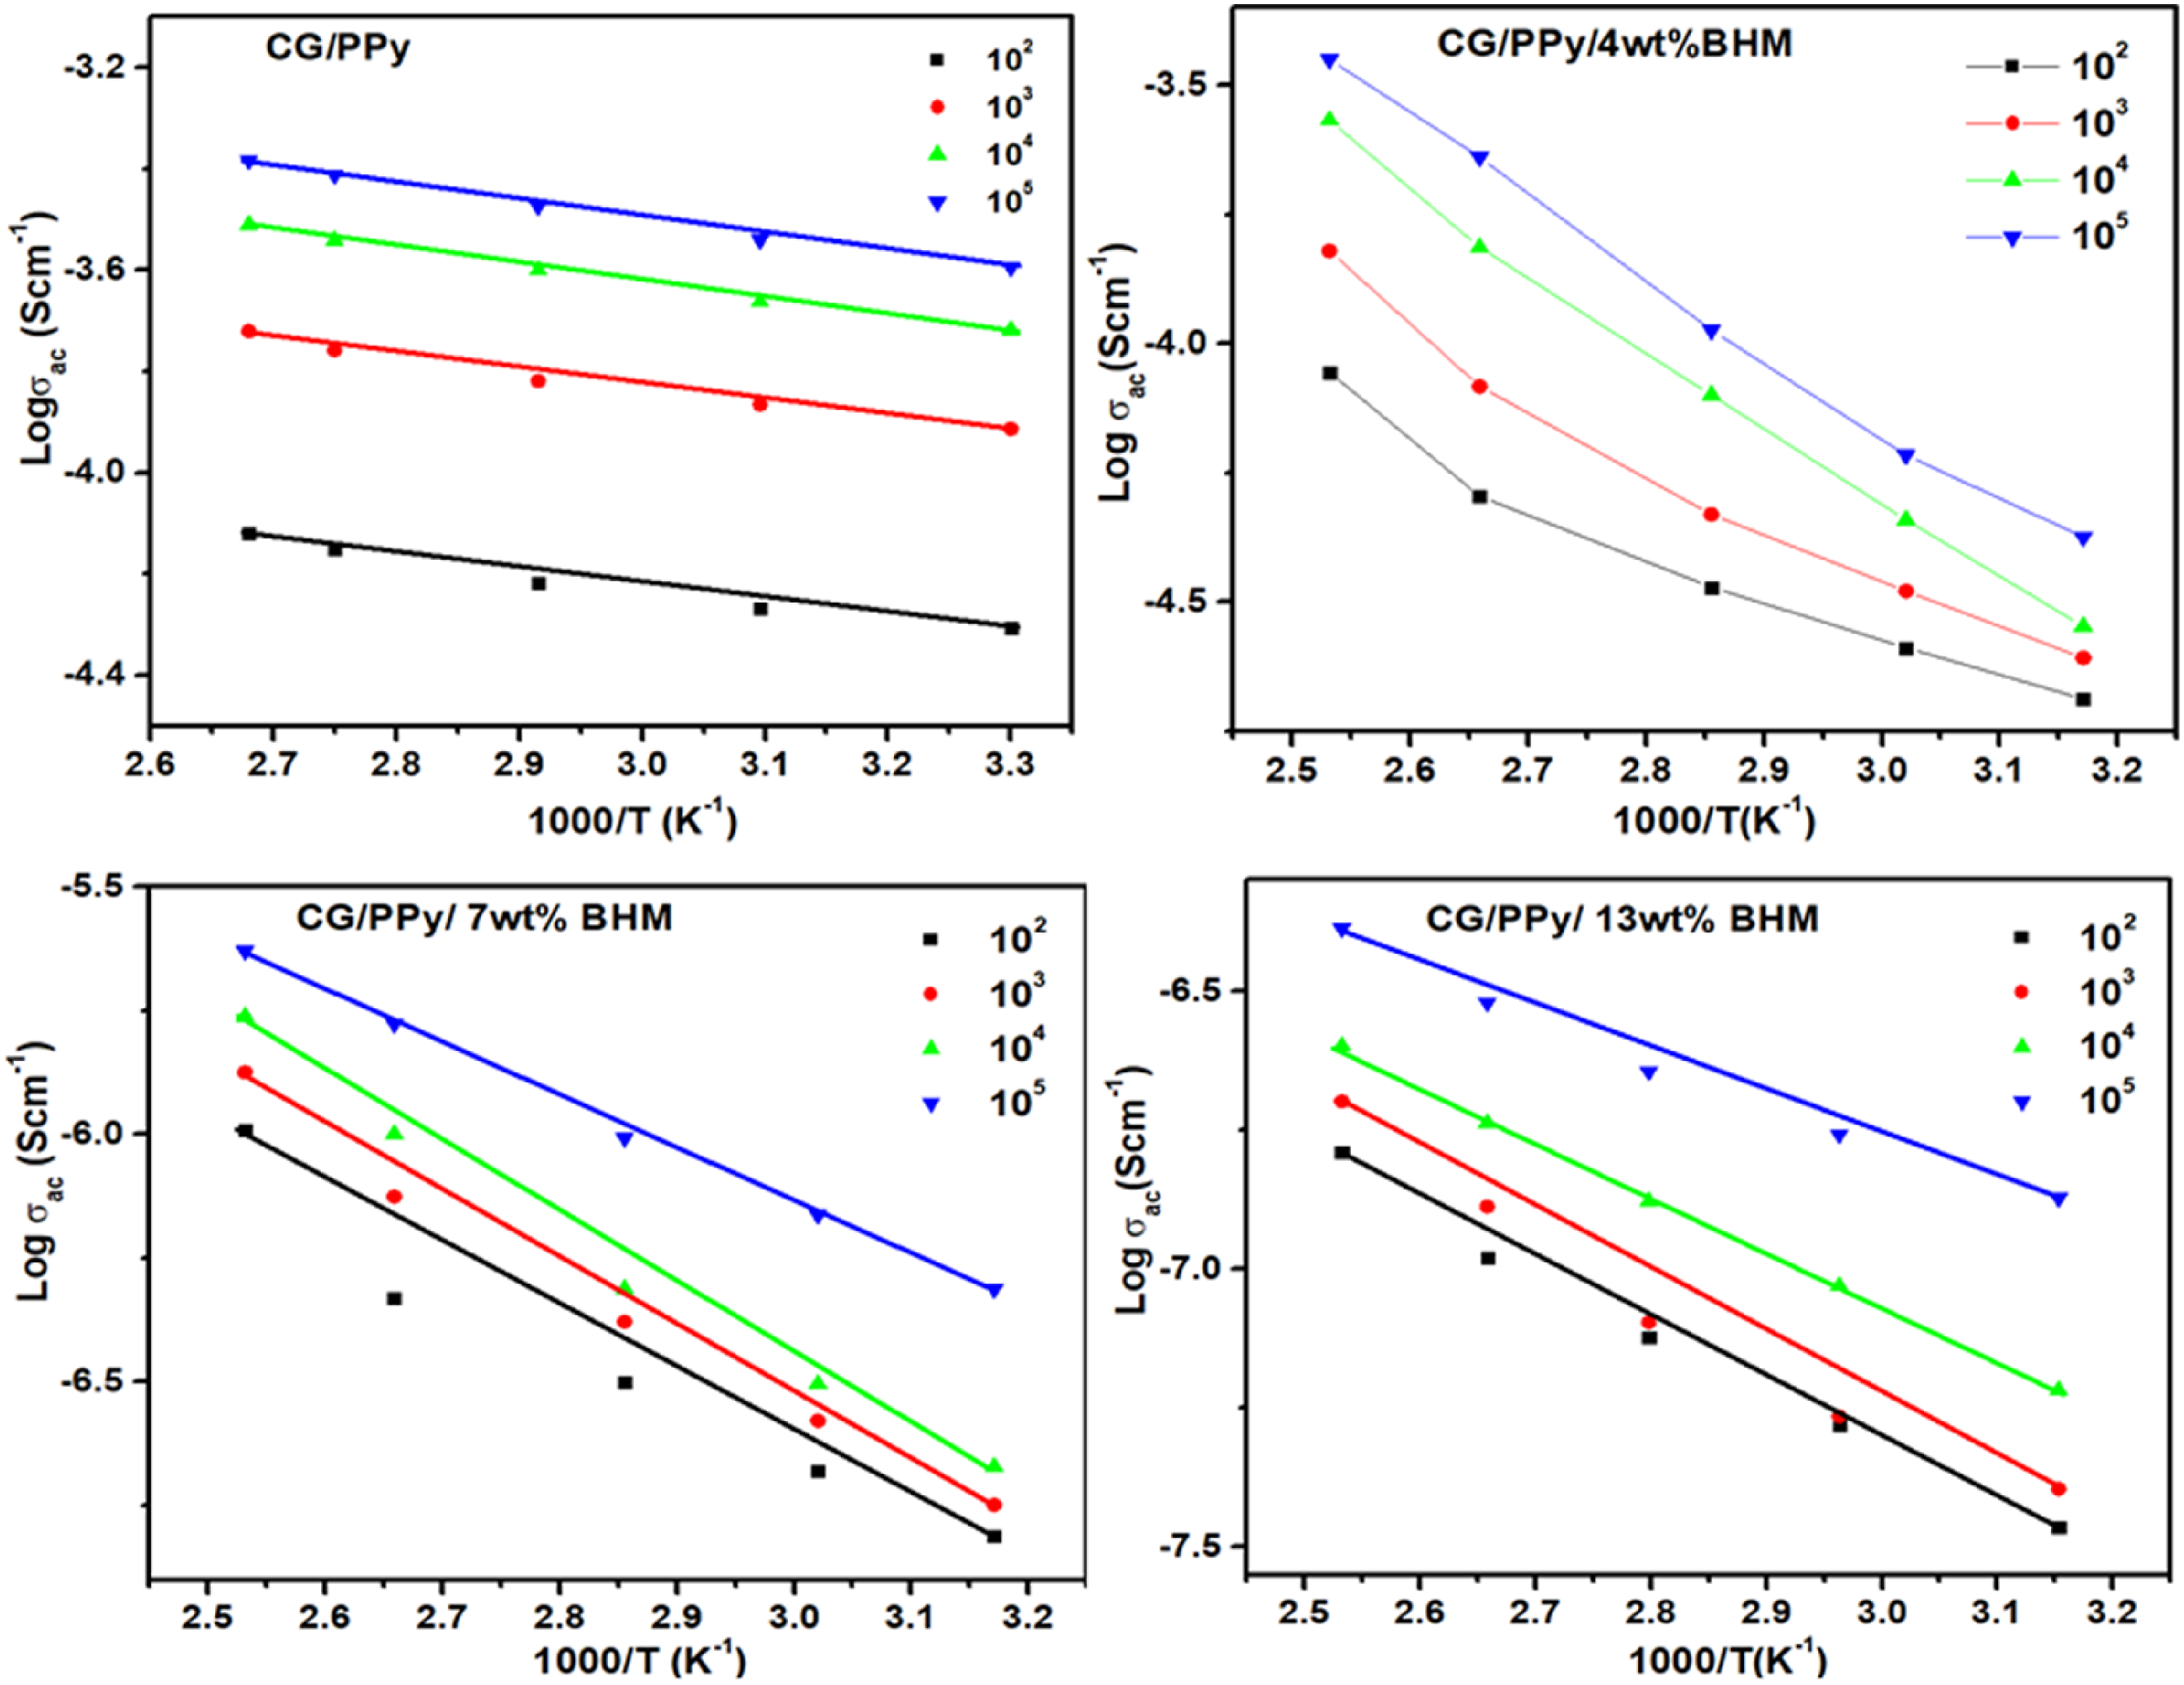
Dielectric behaviour
Dielectric constant at room temperature
The deviations of the dielectric constant as a function of frequency ranging from 100 to 106 Hz at room temperature are exhibited in Figure 8. It is clear that the dielectric constant decreases with an increase in the applied frequency. The dielectric constant is the dielectric property which depends on the polarizability of dipoles.
41
The dielectric constant of all the synthesized nanocomposites attains a constant value after 104 Hz. This is because, as the frequency rises, the molecules are unable to achieve proper orientation and hence show a constant value.
42
It is clear that CG/PPy has a lower dielectric constant than the other nanocomposites. CG/PPy/7 wt% BHM possessed the greatest dielectric constant value among the compositions prepared. This is owing to the intermolecular interaction and polarization of the nanocomposites. The dielectric constant of the composites increases with the increase in concentration of BHM nanoparticles, up to 7 wt%. Afterwards, the dielectric value decreases. This is attributed to the cluster formation and non-uniform dispersion of BHM nanoparticles within the polymer blend. The dielectric constant of CG/PPy/BHM blend nanocomposites.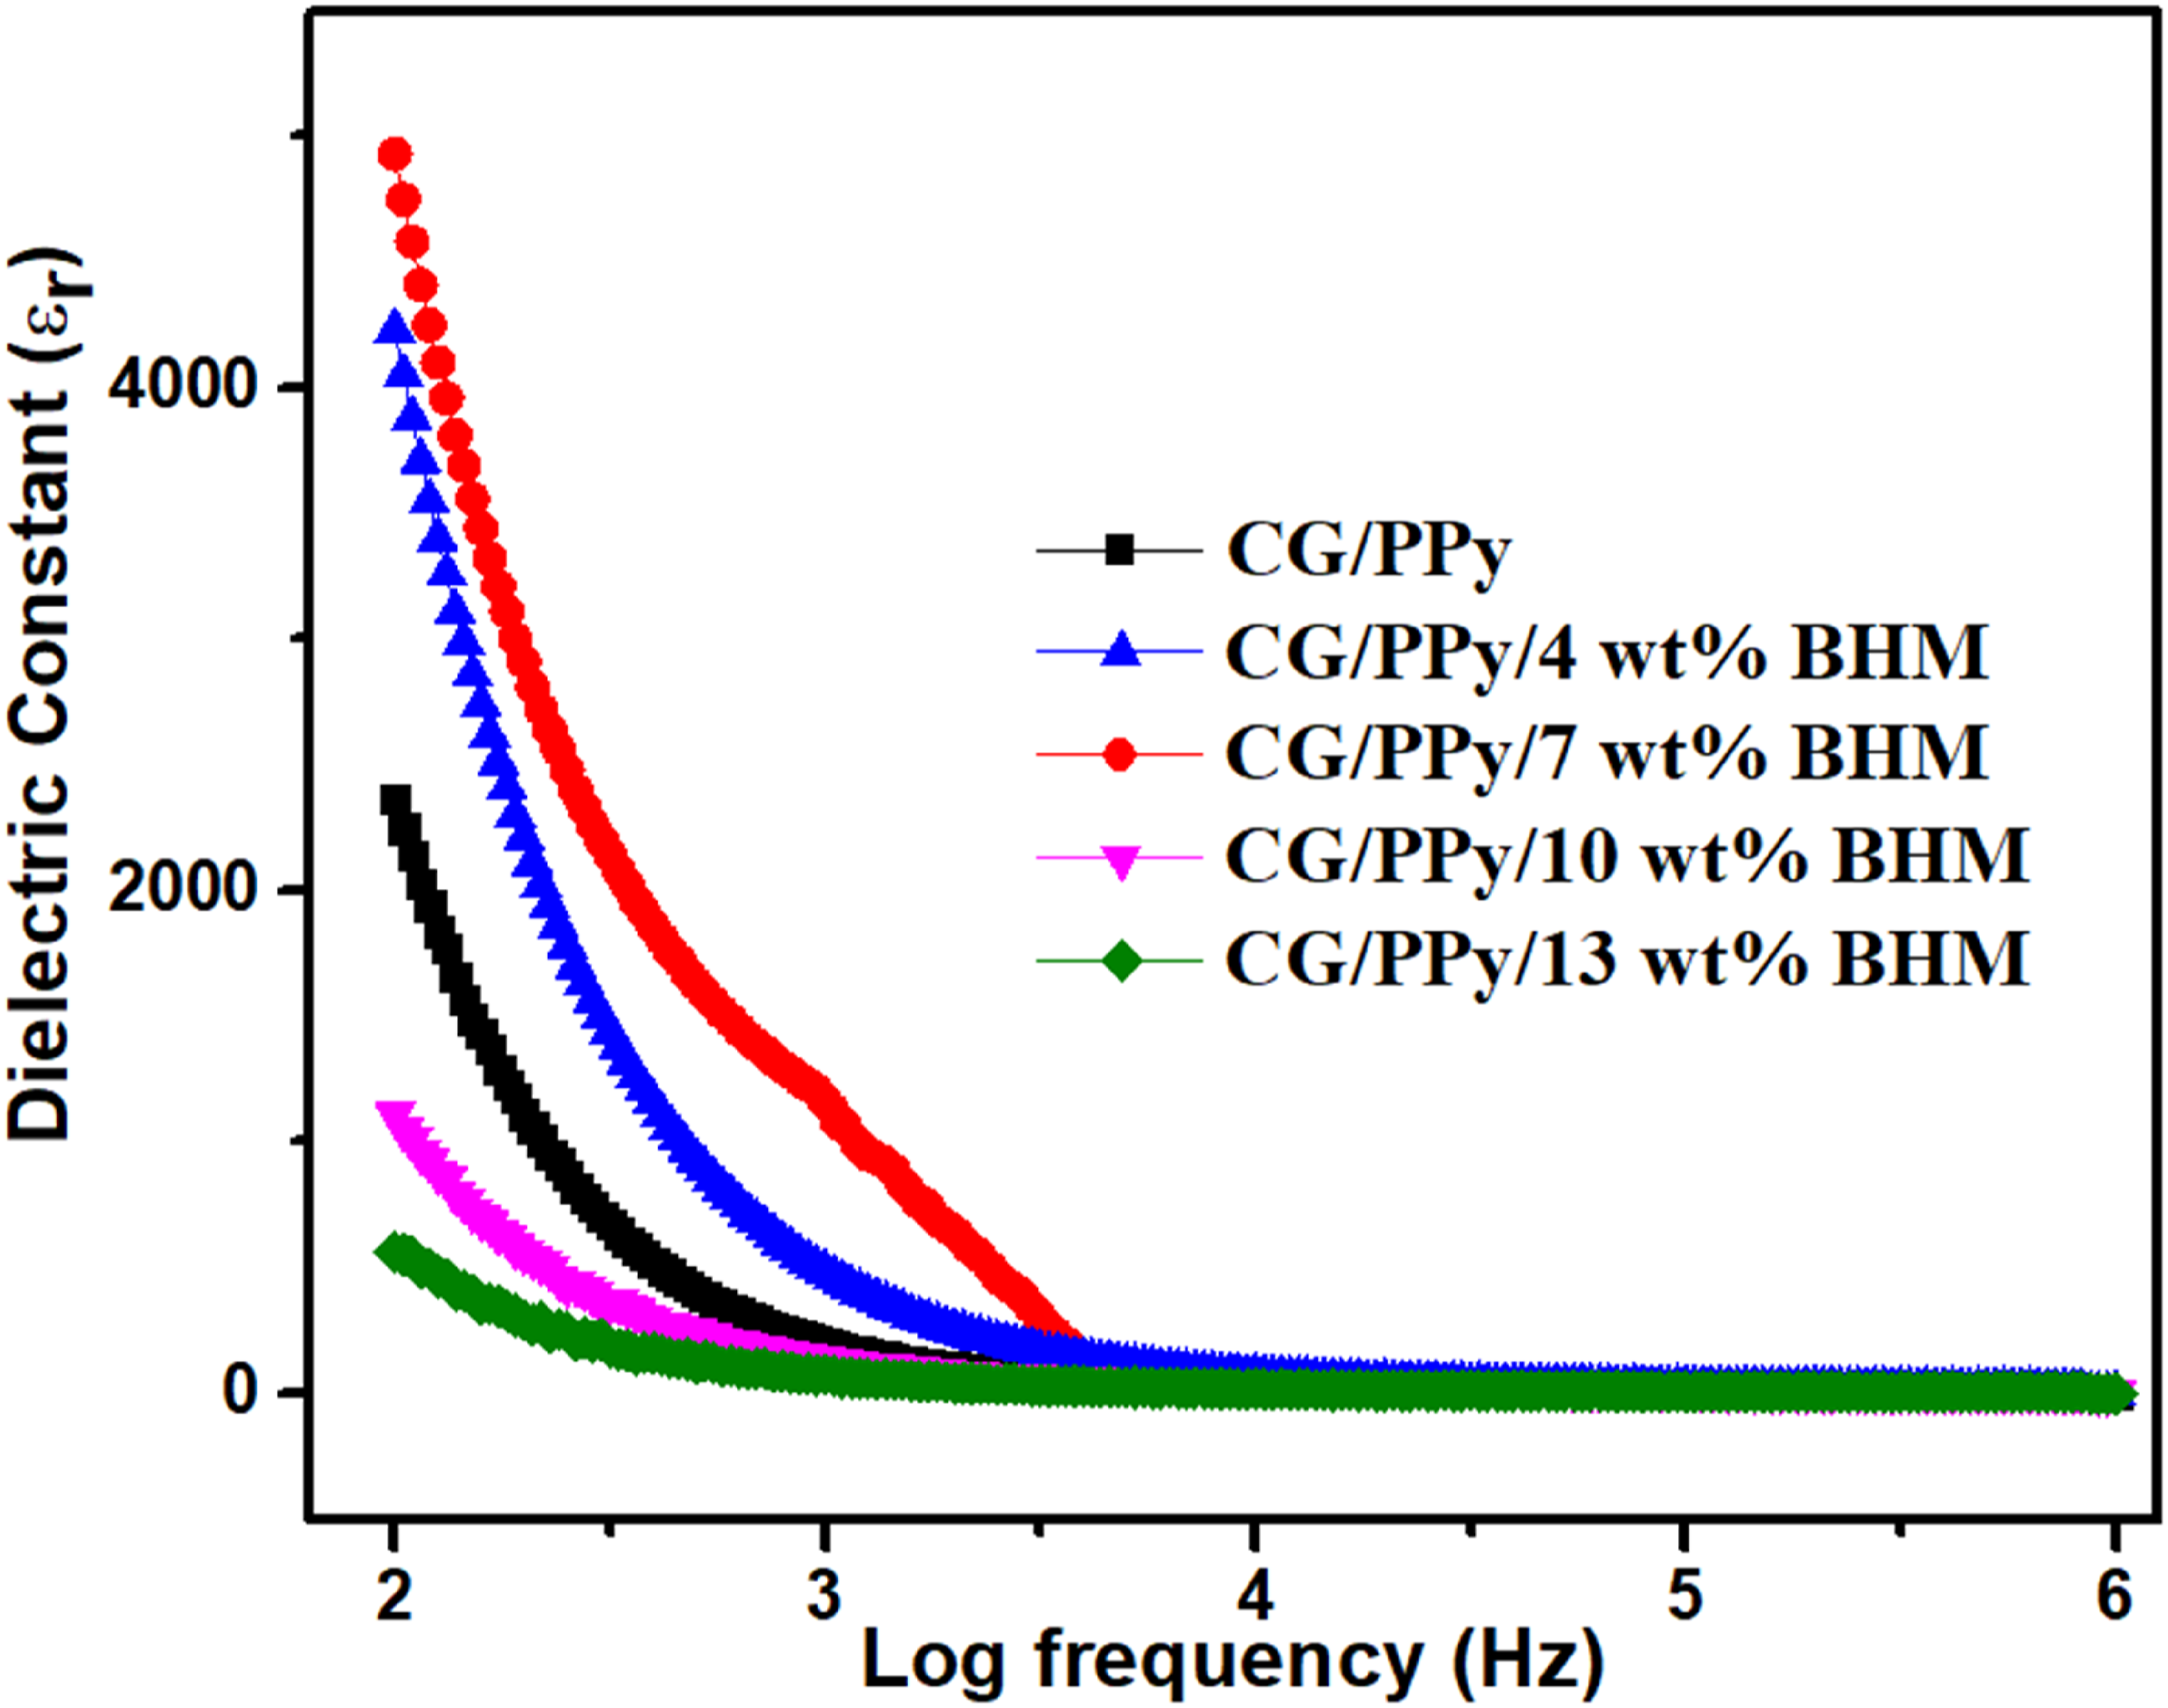
Figure 9 portrays the effect of temperature on the dielectric constant with frequency for CG/PPy and its different (4, 7, and 10 wt%) BHM nanocomposites. It is observed that the dielectric constant value decreases with an increase in frequency and obtains a constant value at higher frequencies. In the present analysis, a prominent increase in dielectric constant is shown for BHM nanocomposites when compared with the parent. The strong intermolecular interaction between the polymer and the BHM nanoparticles can reduce the cohesive forces, improving the nanocomposites’ dielectric constant. The dielectric constant increases as the temperature rises from 30°C to 100°C. All the samples show the maximum dielectric behavior at higher temperatures. The temperature escalation causes the molecules to achieve a higher level of interaction between them, hence increasing their dielectric behavior.
43
Temperature-dependent dielectric constant of CG/PPy/BHM nanocomposites.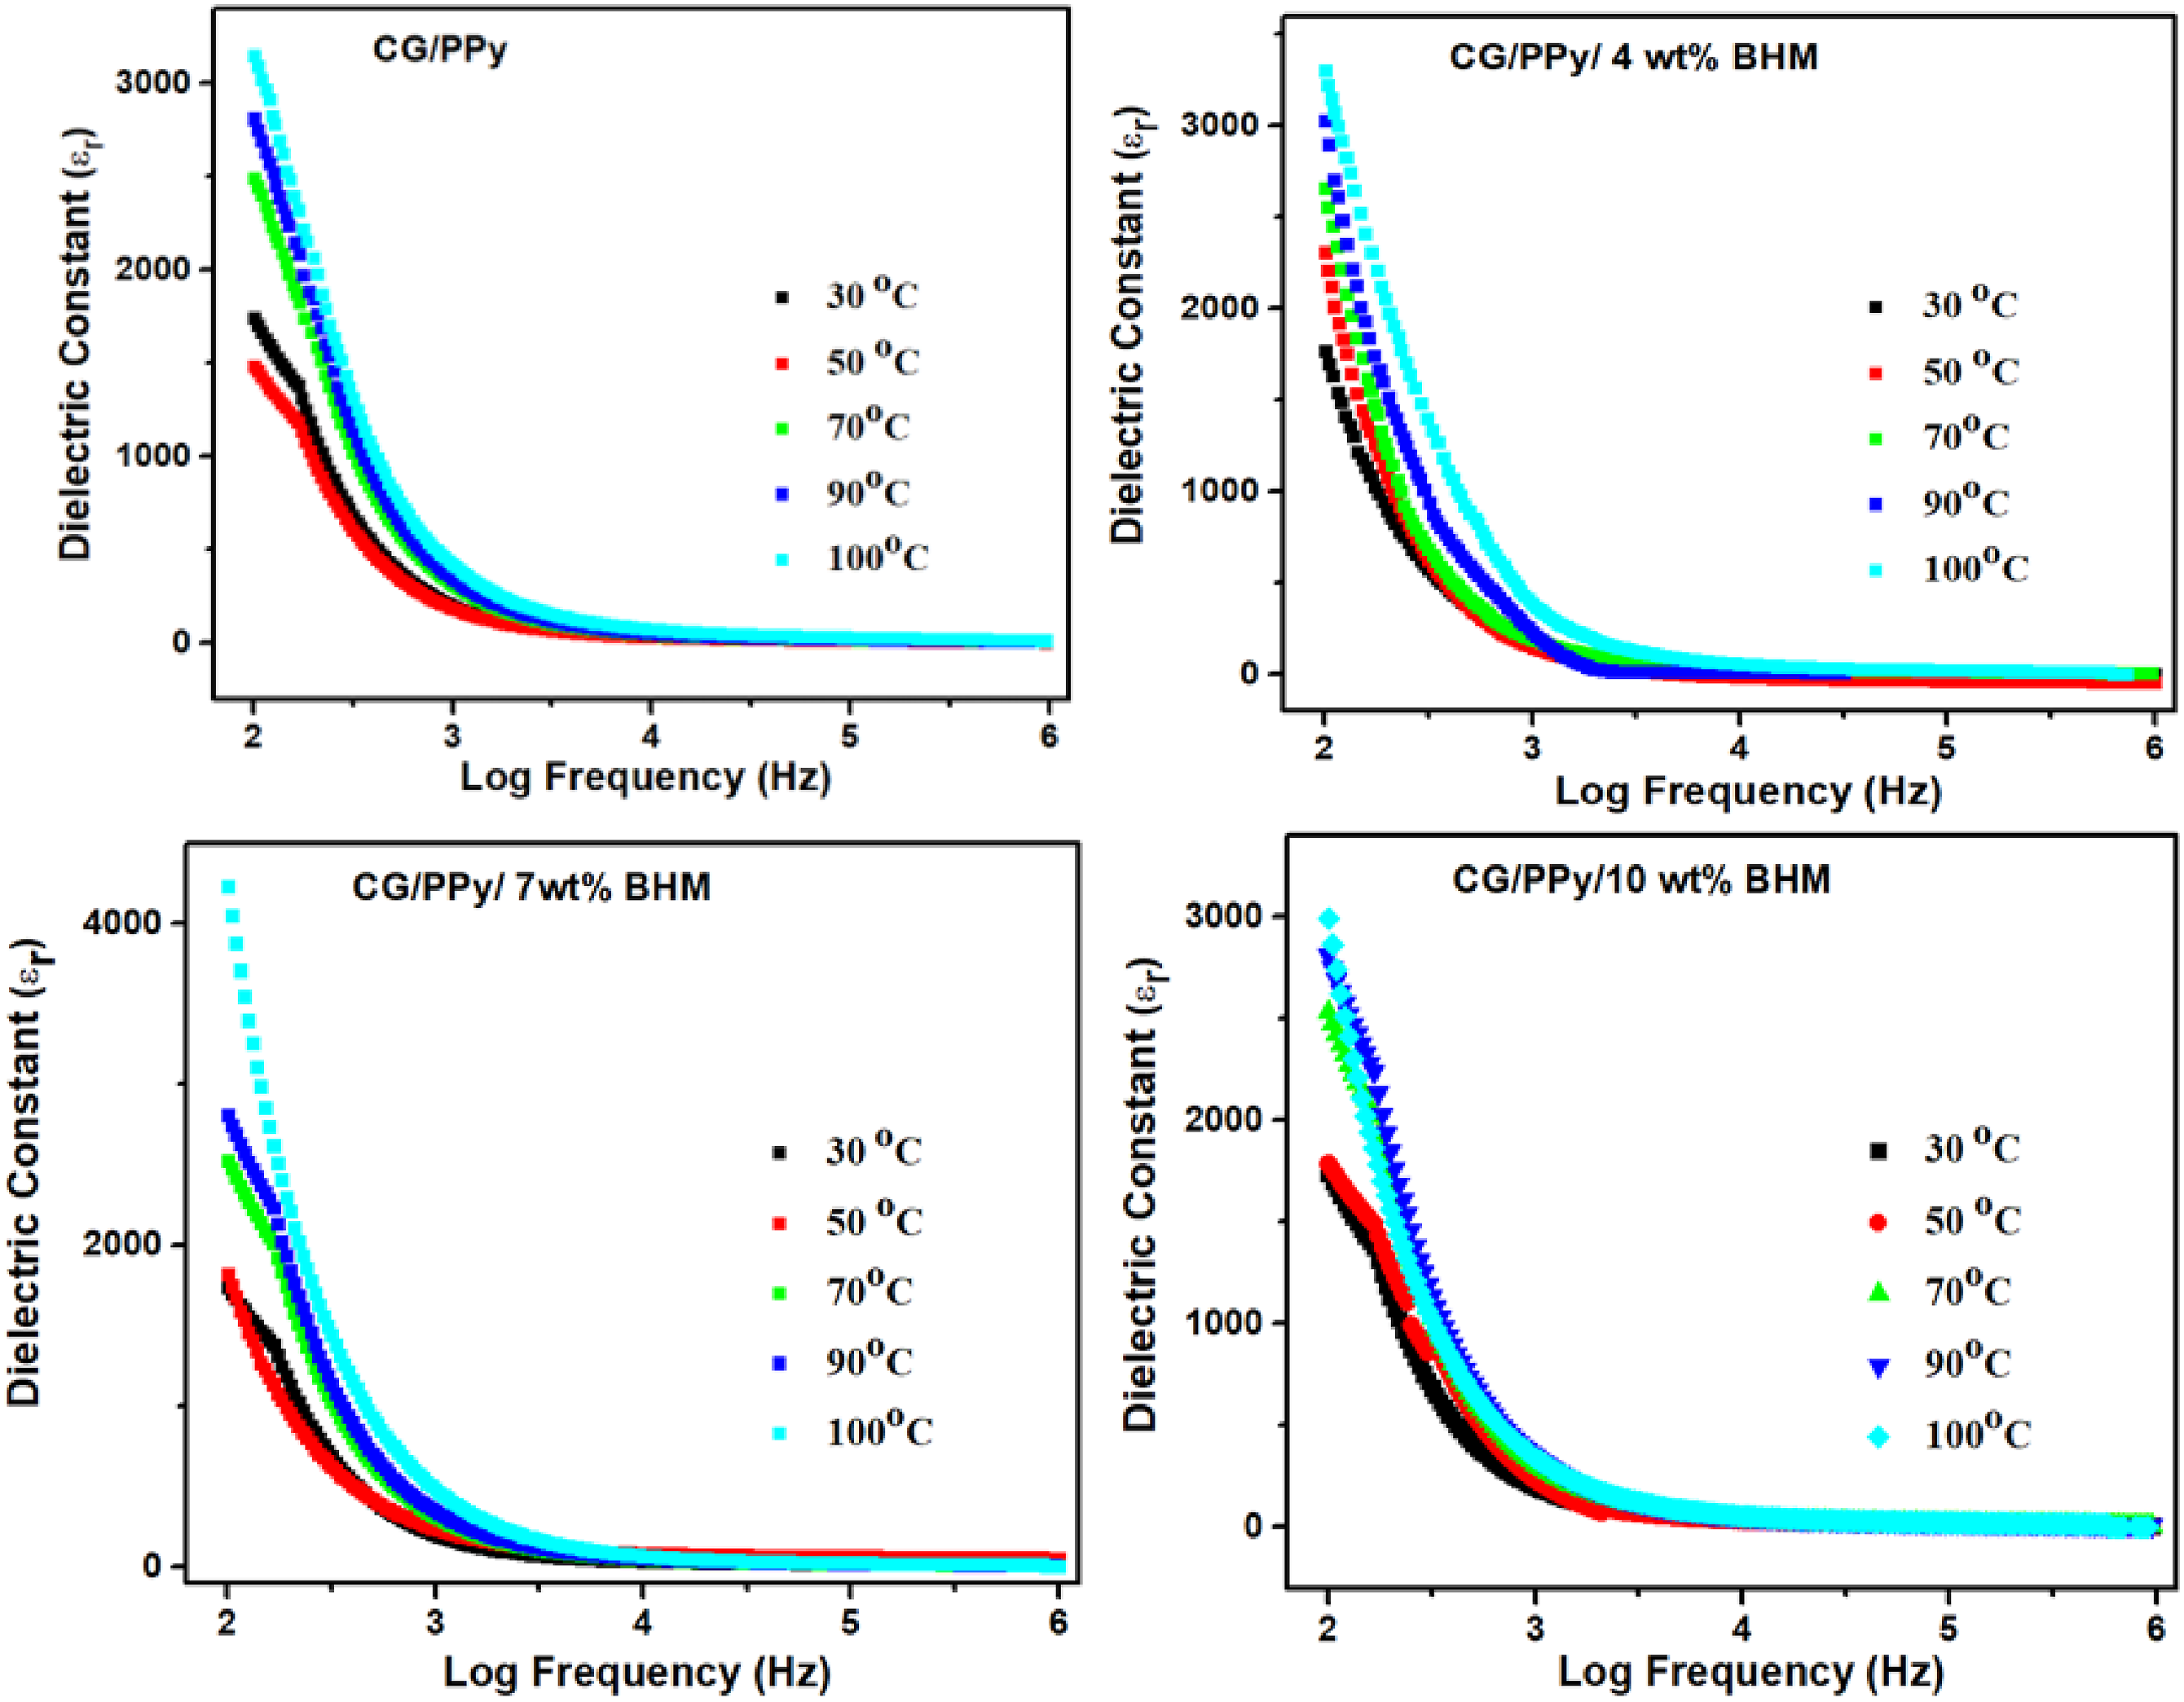
The dielectric loss tangent (tan 
Figure 10 represents the plot of the temperature dependence of dielectric loss tangent (tan δ) as a function of frequency for a CG/PPy polymer blend with different concentrations of BHM nanoparticles. The dielectric loss of the blend containing 7 wt% BHM nanoparticles shows the highest value compared to both the pure blend and other compositions. The dielectric loss of nanocomposites arises due to the mobility of the monomers and the polymer chain, the polarization, and the intermolecular interactions.
33
Another significant factor that influences the tan δ values is thermal energy. In this study, all nanocomposites, including the pure polymer blend, exhibit the highest dielectric loss tan δ value at the maximum temperature. Effect of temperature on dielectric loss of CG/PPy blend and CG/PPy/BHM nanocomposites.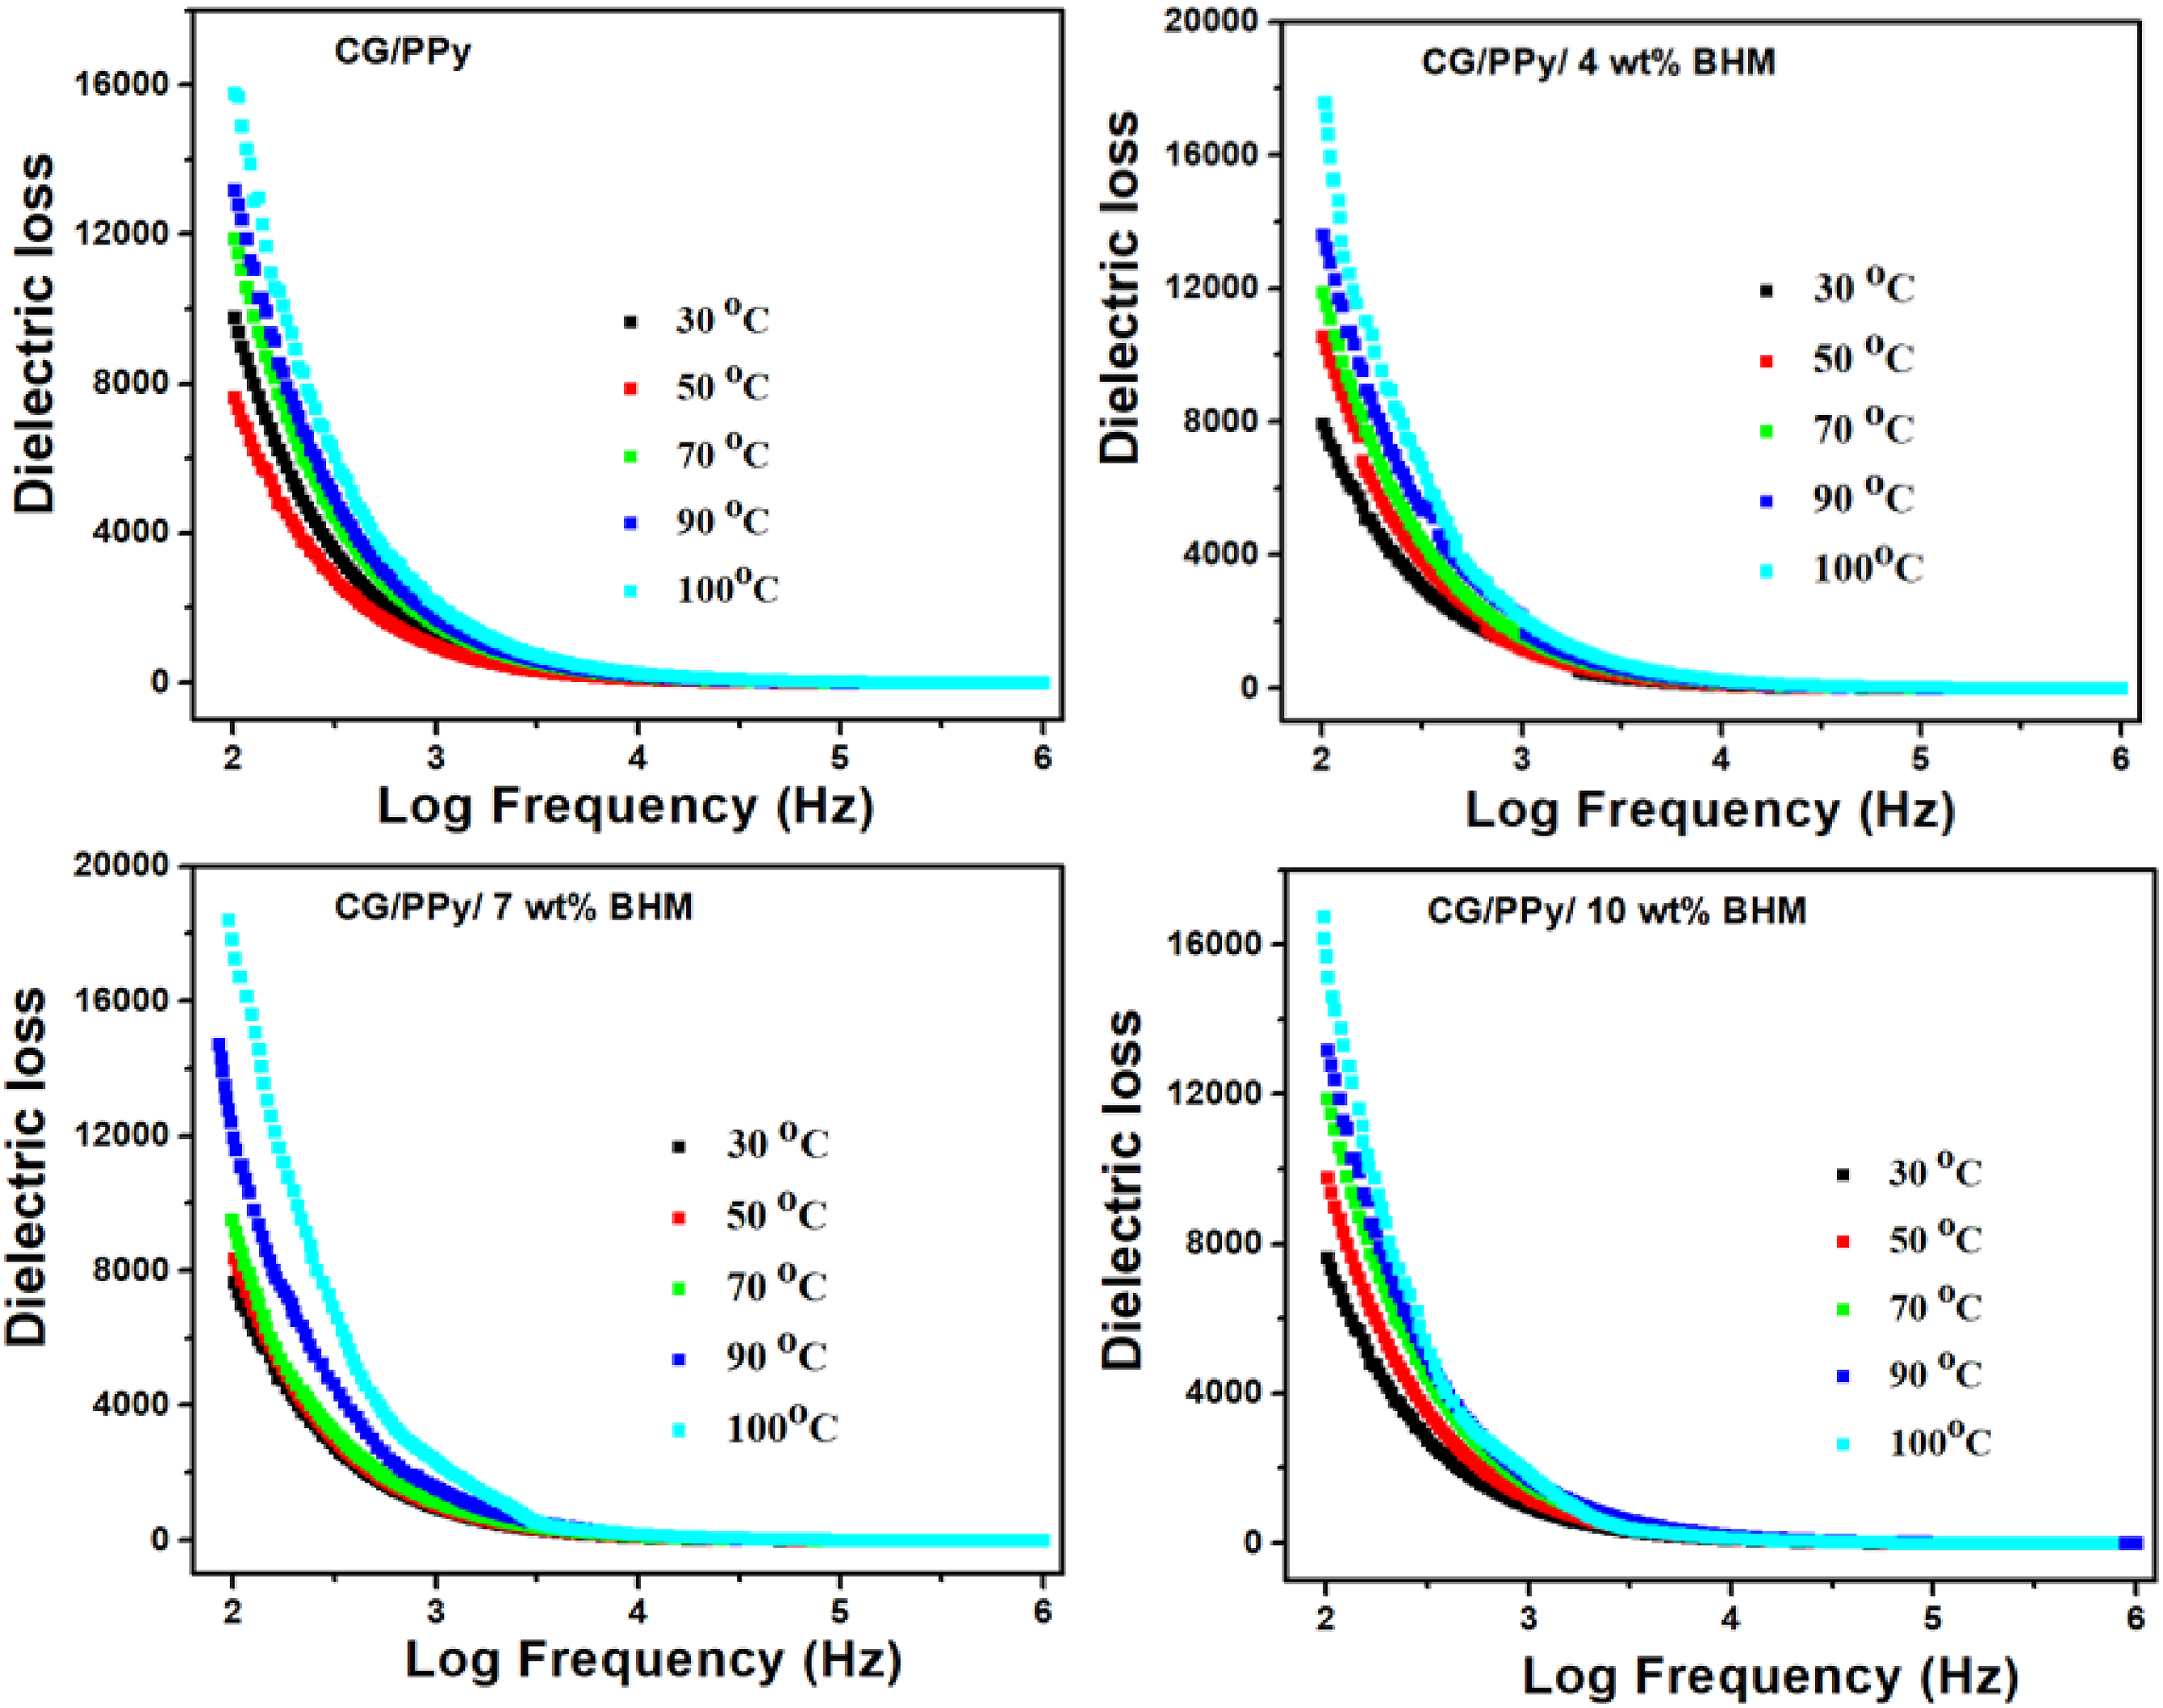
Impedance analysis
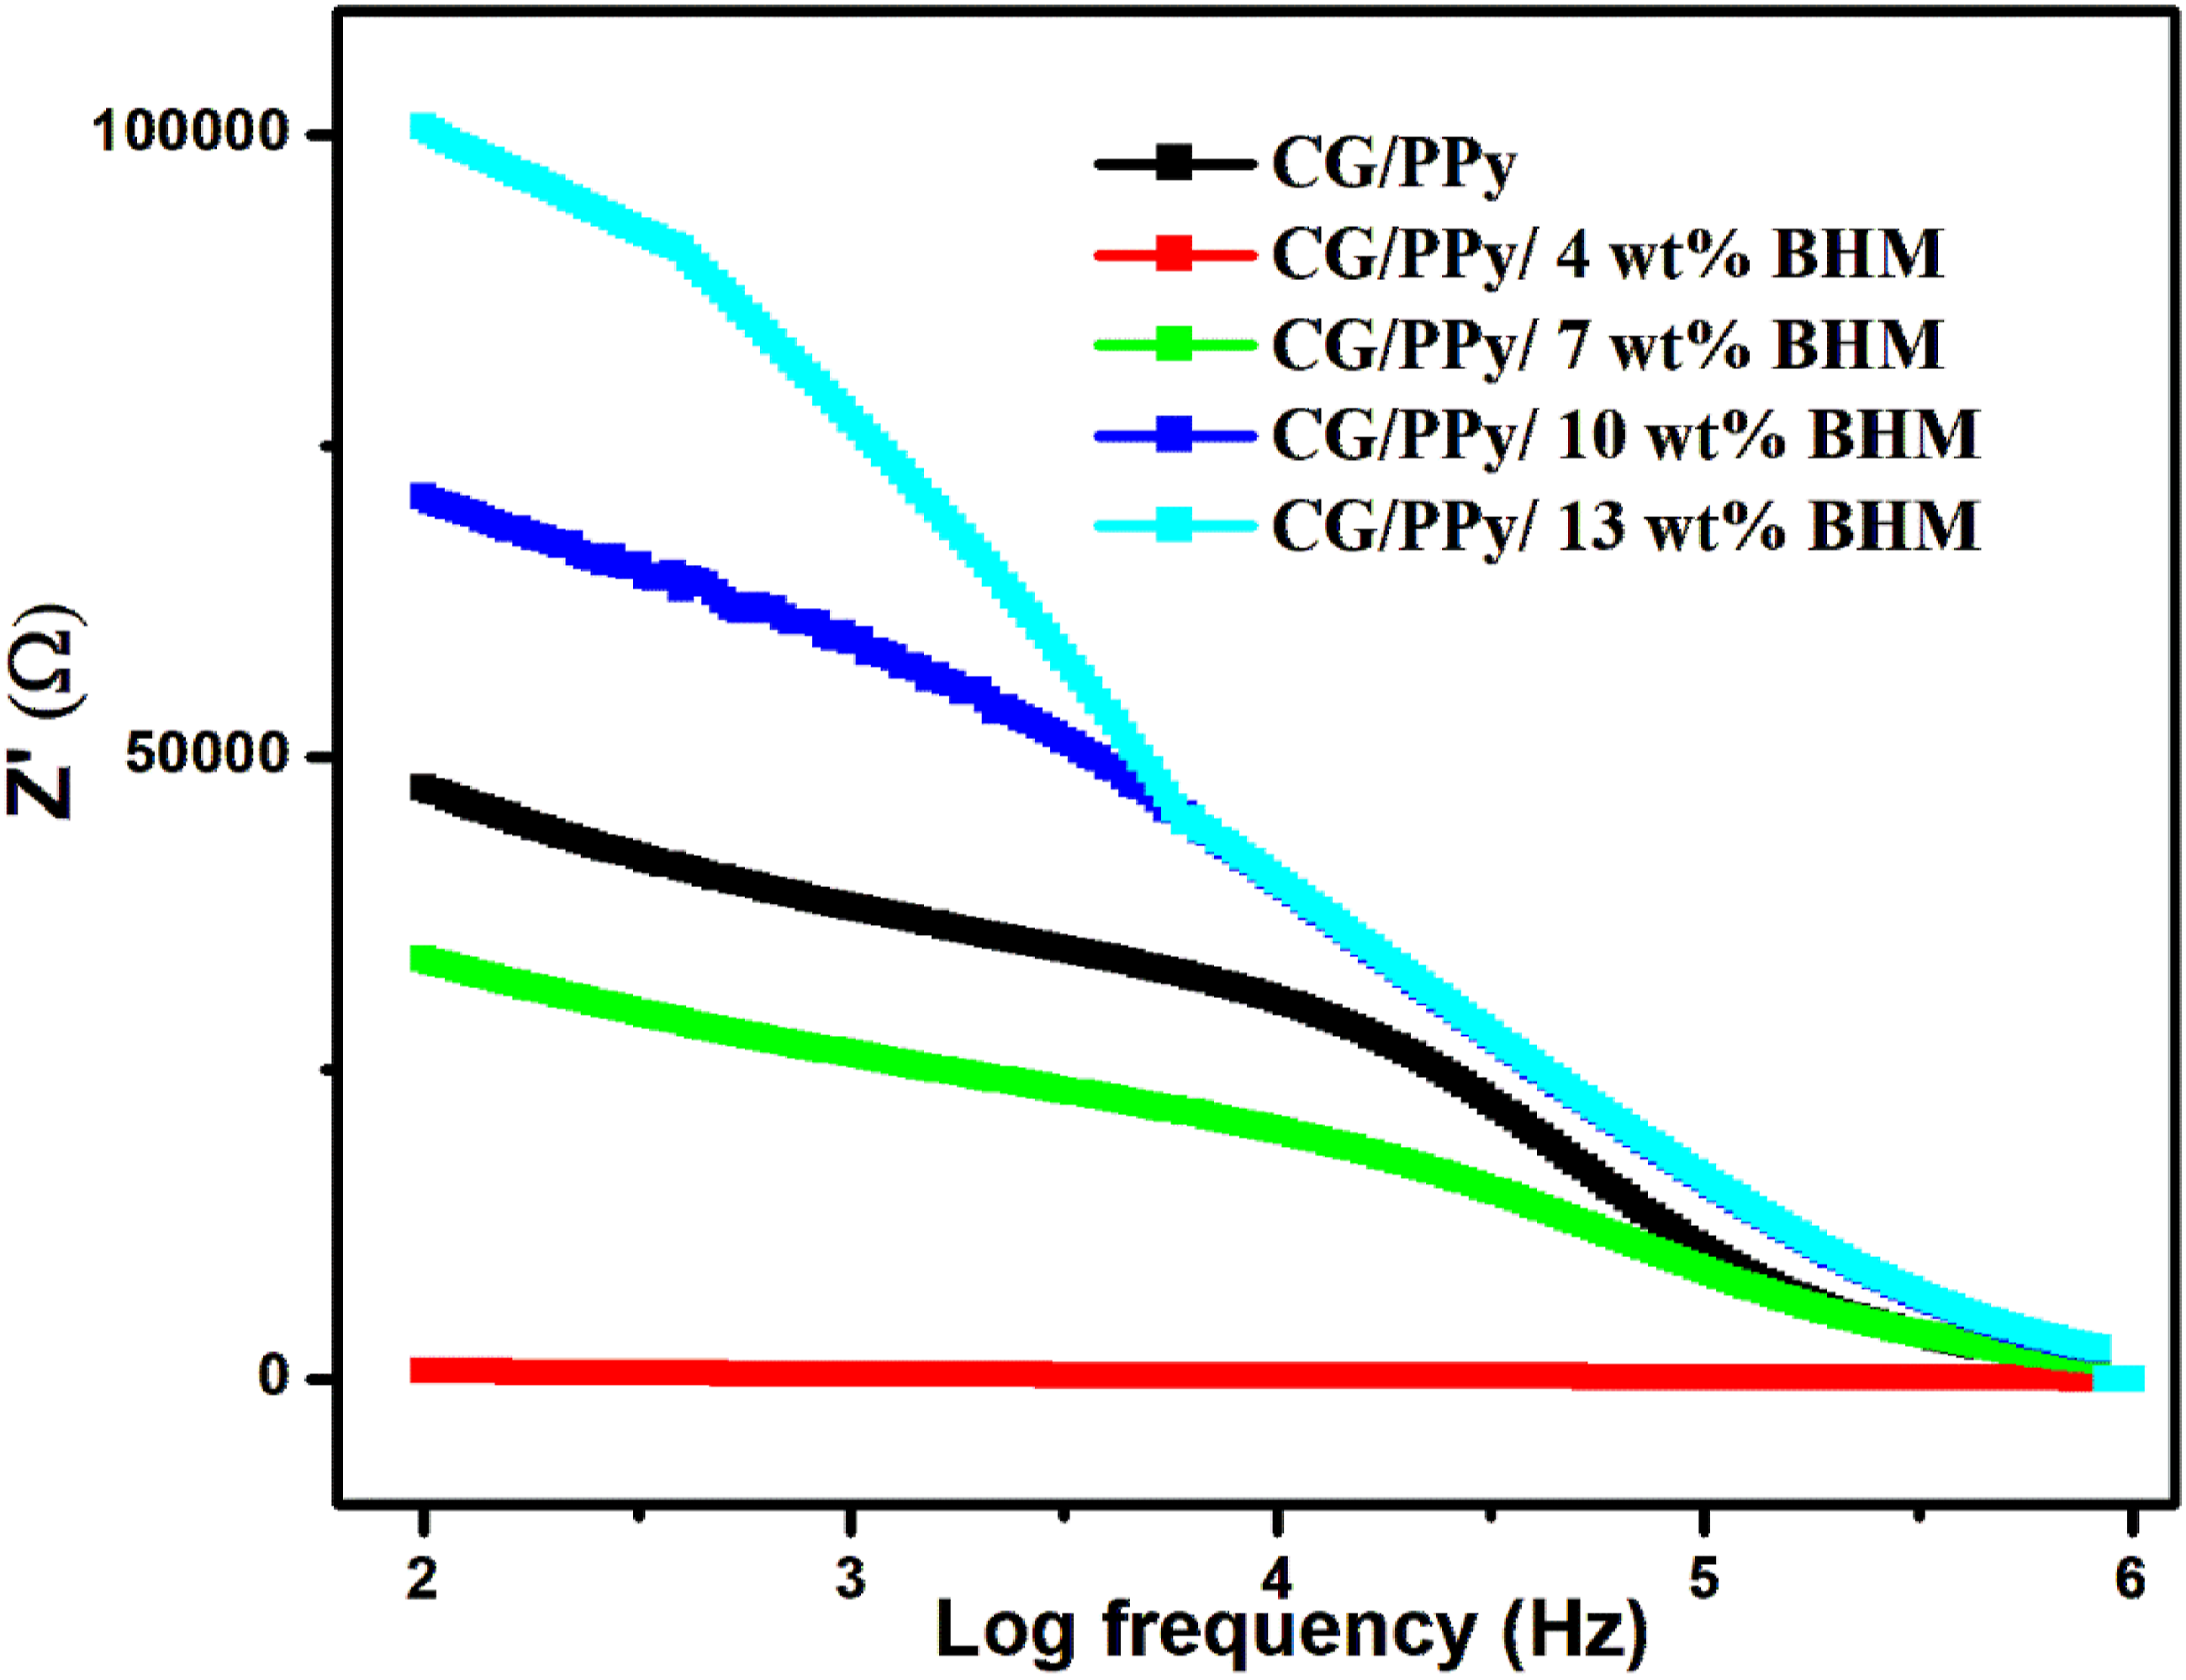
Room temperature impedance
Figure 11 represents the impedance, which is the resistance of a conducting material to the alternating current, and measuring impedance is a significant methodology for investigating the electrical properties of the polymer nanocomposites.
44
During impedance analysis, impedance is considered a complex function Z*, which is determined using the relation,
45
Impedance analysis of CG/PPy/BHM nanocomposites.
Impedance analysis at different temperatures
Impedance analysis as a function of frequency at different temperatures ranging from 30 to 100°C for CG/PPy and CG/PPy/BHM polymer blend nanocomposites with different BHM (0, 4, 7, and 10 wt%) concentrations is pictured in Figure 12. Temperature is one of the most important aspects to consider while evaluating resistivity.
46
The figure illustrates that as temperature increases, impedance also rises. This pattern is consistent across all prepared samples. At lower frequencies, both the polymer blend and nanocomposites demonstrate higher impedance, which then gradually decreases before stabilizing at a constant value. Both the real (Z′) and imaginary (Z″) parts of impedance are connected. The real impedance (Z′) is higher at higher temperatures and lower frequencies. There is a decrease in Z′ with a reduction in temperature and at higher frequencies, Z′ tends to attain a constant value irrespective of the different temperatures applied. Temperature dependence on impedance for CG/PPy blend and its nanocomposites.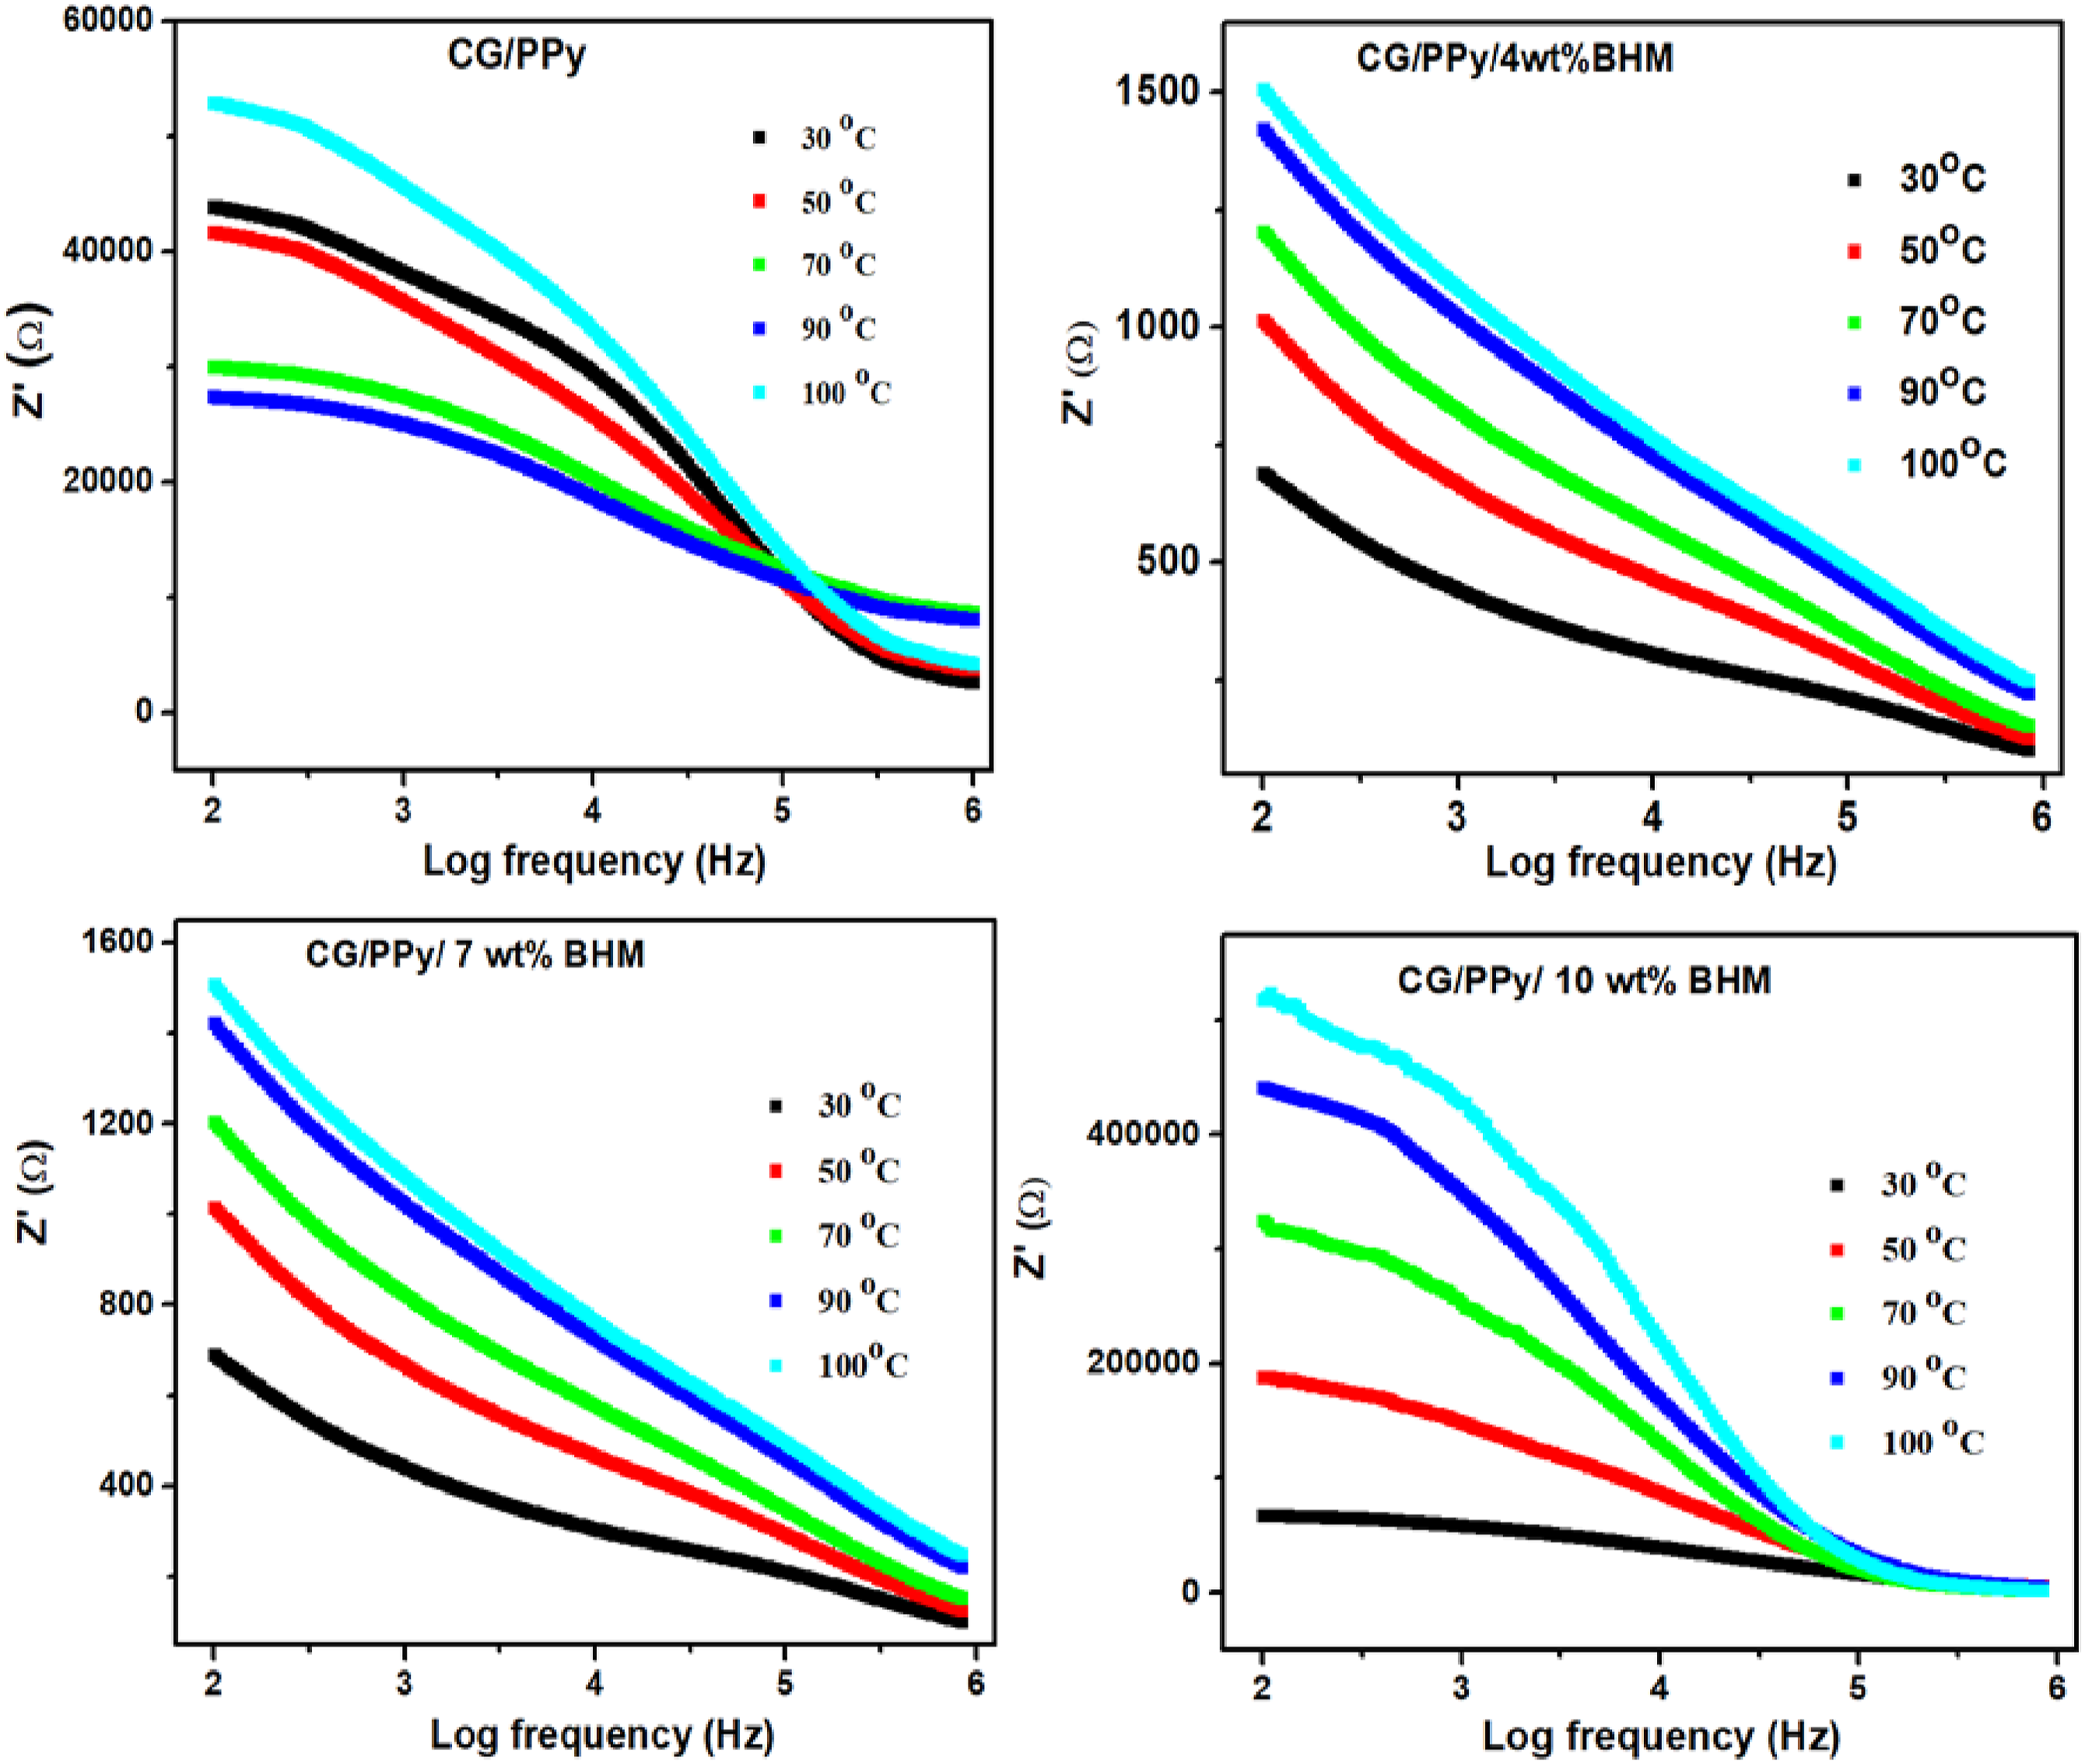
Conclusion
In this study, a series of nanocomposites based on CG/PPy blend with BHM nanofillers were prepared by a one-step polymerization technique, to tune their structural, thermal, and electrical characteristics to assess their potential usage in a variety of technological applications. The FT-IR spectra revealed the functional groups of CG and PPy, as well as the interaction of BHM nanoparticles with the CG/PPy host blend matrix. The FE-SEM analysis revealed the irregular morphology of the control (CG/PPy) and the uniform dispersion of nanoparticles within the blend matrix at a loading of 7 wt%. TGA indicates enhanced thermal stability of CG/PPy biopolymer blends upon the incorporation of BHM nanoparticles. The glass transition temperature of the CG/PPy blend increases with the loading of nanoparticles, suggesting its potential utility in studying temperature-related characteristics across various applications. The electrical conductivity studies and their results revealed that the incorporation of nanoparticles significantly enhanced the AC electrical conductivity of the composites. The activation energy determined from the Arrhenius plot indicates a minimum energy of 0.049 × 10⁻⁴ eV for the 7 wt% blend nanocomposite. The dielectric properties increased with the addition of BHM nanoparticles and the maximum dielectric properties were observed for 7 wt% loading. The impedance analysis manifests the semiconducting nature of the biopolymer CG and the conducting property of the PPy. The promising findings suggest that the CG/PPy/BHM biopolymer blend holds substantial potential for utilization as a nanocomposite for developing capacitive energy storage devices. Future research needs to focus on tailoring the nanoparticle dimensions and morphology for targeted applications, investigating charge transport mechanisms, scaling up production, and assessing biocompatibility and environmental impact for practical applications.
Footnotes
Declaration of conflicting interests
The author(s) declared no potential conflicts of interest with respect to the research, authorship, and/or publication of this article.
Funding
The author(s) received no financial support for the research, authorship, and/or publication of this article.
Data availability statement
The data that support the findings of this study are available from the corresponding author upon reasonable request.