
Abstract
Novel nanocomposites of polypyrrole (PPy) dispersed with iron oxide (Fe2O3) particles have been synthesised by in situ chemical oxidative polymerisation of pyrrole in the presence of ammonium persulfate (APS) as an oxidising agent. The concentration of Fe2O3 was varied between 10-50wt% of PPy. The simultaneous polymerisation of pyrrole and oxide addition led to the complete synthesis of nanocomposites. A maximum dielectric constant of ∼28500 was observed at 20wt% of Fe2O3. The nanocomposites were characterised by X-ray diffraction (XRD), Fourier-transform infrared spectroscopy (FTIR), scanning electron microscopy (SEM) and transmission electron microscopy (TEM). XRD analysis confirmed the structure and crystallinity of the nanocomposites, and a strong interaction between PPy and Fe2O3 particles was observed by FTIR technique. SEM and TEM images showed that Fe2O3 particles had been coated with PPy by establishing a network during the polymerisation process. The values of dielectric constant were obtained from capacitance measurements. The value of dielectric constant for nanocomposites with 20wt% of Fe2O3 was observed to be almost 12 times that of the pure PPy matrix. The high value of dielectric constant indicated a high packing density of Fe2O3 particles in PPy matrix. These nanocomposites have potential applications in electronic or biomedical devices.
Introduction
Research into conjugated polymers demonstrated that all polymers need not be insulators 1 . These conjugated polymers have great scientific and technological significance due to their novel electrical, optical, electronic and optoelectronic characteristics2,3. In the neutral state these materials demonstrate insulating or semiconducting characteristics4–6 and find applications in different fields like, solar cells7,8, sensors 9 , organic light emitting diodes10,11 and optoelectronic devices 12 .
Doping with metal oxides is one of the several ways to optimise the properties of these materials by carefully controlling the dopant into the polymer matrix 13 , resulting in new unique properties that cannot be achieved by single material14,15. The inorganic materials due to their high surface to volume ratio are expected to alter the properties of organic polymer matrix rapidly. Above all, the main idea to synthesise these organic-inorganic networks is to obtain the unique composite materials demonstrating optimized properties between those of the organic and inorganic materials.
Among various polymers, polypyrrole (PPy) has reasonable thermal and environmental stability, significantly high electrical conductivity and simple route of synthesis16–18. PPy has potential applications in electronic and electrochromic devices such as solar cells, super capacitors, energy storage19–21, batteries, sensors22–24, microwave absorption 25 , antistatic coatings 26 , charge storage 27 , gas separation membranes 28 and capacitors 29 . Its optical, electrical and mechanical properties can be improved by carefully doping of metal oxides in the PPy matrix30–32.
However there is not much research done on the dielectric properties of PPy-Fe2O3 nanocomposites. Herein we report the synthesis of the organic-inorganic composites by chemical oxidative polymerisation with different iron oxide contents in the polymer. The effects of concentration of filler metal oxide have been studied by exploring their structural, morphological and dielectric characteristics in order to assess the applications of such nanocomposites for electronic and related fields.
Experimental
Materials
All the chemicals were purchased from reputable companies. Pyrrole (analytical grade, 99%) was purchased from Sigma-Aldrich, stored at 5°C and vacuum distilled prior to use. APS and Fe2O3 were supplied by Merck. All other supplementary chemicals and solvents such as acetone, hydrochloric acid (HCl), chloroform and methanol were obtained from Fluka and used as received. Ultrapure deionised water (Seralpur delta) was used during all synthesis procedures.
Synthesis of PPy and PPy-Fe2O3 Nanocomposites
The chemical oxidative polymerisation method was carried out for the synthesis of PPy and PPy-Fe2O3 nanocomposites as described earlier 33 . Vacuum distilled pyrrole (10 g) and ammonium persulfate (APS) (12.25 g) were dissolved separately in deionised water for synthesis of PPy-Fe2O3 nanocomposites. The pyrrole mixture was acidified gradually by dropwise addition of HCl (5 mL). At the next stage, 10wt% Fe2O3 (1 g) ultrasonically dispersed in deionised water was added to the pyrrole solution and the mixture was well stirred for 3 h. Afterwards, the solution of APS was added dropwise by dropping funnel into the mixture containing pyrrole, HCl and Fe2O3 under vigorous stirring. Same synthesis procedure was adopted for other concentrations of Fe2O3 i.e., 20, 30, 40 and 50 wt%. The prepared nanocomposites were designated as P-1, P-2, P-3, P-4 and P-5 respectively The suspension of obtained composites left overnight in fume hood. After ensuring the complete polymerisation, the suspensions were successively filtered and washed with deionised water. The precipitate was then dried under vacuum at 70°C for 24 h. To achieve complete homogeneity of the constituents, the dried precipitates were well crushed and ground for 1hour by an A-grade mortar and pestle, cleaned with acetone and deionised water. Pellets of the ground powder were prepared using a hydraulic press with a pressure of 30 kN applied for 2 min before further characterisation.
The powder X-ray diffraction patterns of samples were obtained by using an automated diffractometer, Bruker-AXS D8, using Cu Kα radiation. The operating voltage and current of the machine were maintained at 40 kV and 30 mA respectively. The samples were mounted on standard holders and diffraction spectra were recorded over the range of 10–60 degrees (2-theta) with a counting time of 3 s and step size 0.10 degree. Molecular structure was analysed through FTIR spectra recorded by Perkin Elmer FTIR spectrometer in the range from 500 to 3500 cmr
1
. The surface morphology of nanocomposites was observed by an EVO50 ZEISS scanning electron microscope and a Philips CM 12 transmission electron microscope respectively. For the measurement of dielectric properties a Wayne Kerr LCR meter Model 4275 was used in the frequency range from 20 Hz to 20 MHz. The obtained data were transformed into dielectric constants by applying the relation:

X-ray Diffraction (XRD)
XRD patterns reveal that pure PPy is amorphous
34
and PPy-Fe2O3 nanocomposites are polycrystalline in nature due to the existence of crystalline material i.e., Fe2O3 whose diffraction pattern is shown in

XRD pattern of Fe2O3

XRD patterns of (a) PPy (b) P-1 (c) P-2 (d) P-3 (e) P-4 (f) P-5
The variation in crystallite size of the nanocomposites as a function of Fe2O3 concentration was estimated by means of the Scherrer relation:

Here d is crystallite size for individual peak, K is the unit cell geometry dependent constant, whose value is typically between 0.85 to 0.99, λ is the wavelength of incident X-ray, β is the line broadening at full width at half maximum (FWHM) of the individual peaks and θ is the Bragg angle. For crystallite size measurement, the strongest peak corresponding to the (104) plane was selected. The average value of crystallites observed to be in the range from 18 to 36 nm. A slight shift in diffraction angle of the (104) diffraction peak is observed for all nanocomposites with respect to the Fe2O3 pattern as reported earlier
36
. The structural parameters for nanocomposites are listed in
Structural parameters for Fe2O3 and PPy-Fe2O3 nanocomposites


FTIR spectra of (a) PPy (b) P-1 (c) P-2 (d) P-3 (e) P-4 (f) P-5
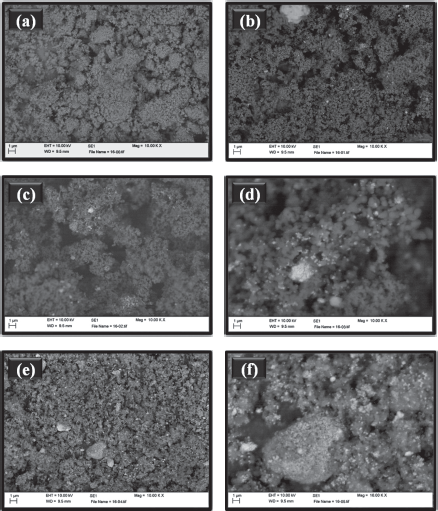
(a) SEM image of PPy (b) SEM image of P-1 (c) SEM image of P-2 (d) SEM image of P-3 (e) SEM image of P-4 (f) SEM image of P-5
For detailed surface characterisation of PPy-Fe2O3 nanocomposites, transmission electron microscopy of selected samples was carried out. The morphology shown from
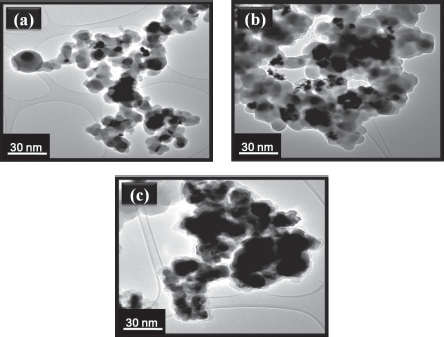
(a) TEM image of P-1 (b) TEM image of P-3 (c) TEM image of P-5
The dielectric constant (ε’) of a material refers to its capacity to store energy in the presence of an electric field, while the dielectric loss (ε”) expresses a concomitant loss or dissipation of energy45,46. Under the influence of an applied electric field, a conductive material always experiences the induction of two types of currents: (i) displacement current and (ii) conduction current 47 . The former type of current arises from localised bound charges, responsible for electronic, ionic, orientational and space charge polarisation (ε’) within the material. The latter type is typically induced due to mobile charges and is responsible for dielectric losses (ε”) within the material 48 .
In composite materials, heterogeneity of organic and inorganic material would result in the domination of space charge polarisation, whereas in conjugated polymer system, polarons and/or bipolarons are mobile and free to hop between different sites along the polymer chain. The space charge polarisation arises from the restricted mobility of bound carrier dipoles, which leads to a form of orientational polarisation
49
, responsible for a decreasing value of ε’ with an increase in frequency.

Variation in ε’ as function of frequency for (a) PPy (b) P-1 (c) P-2 (d) P-3 (e) P-4 (f) P-5
After 1 kHz, the sharp decrease in ε’ slowed down and became linear presented no further reasonable change in higher frequency regions. The decrease in ε’ at higher frequency region is due to the dielectric relaxation response of the material
53
. The dielectric relaxation usually occurs due to delayed molecular polarisation within the external applied field
54
. P-2 nanocomposite exhibits the highest values of ε’ among all the samples, which might be due to the strong interaction between PPy and Fe2O3 particles
55
. The obtained ε’ values of PPy are 2408 and 371 at 20 Hz and 1 kHz respectively, whereas for the case of P-2 nanocomposite higher values of dielectric constant are obtained i.e., 28500 and 4169 at 20 Hz and 1 kHz respectively. For the higher frequency regions ε’ remained persistent, because induced moments could no longer synchronise themselves with the applied field in that frequency range. The dependence of ε’ on concentration of Fe2O3 is shown in
Dielectric loss (ε”) response to frequency in PPy and PPy-Fe2O3 nanocomposites is shown in
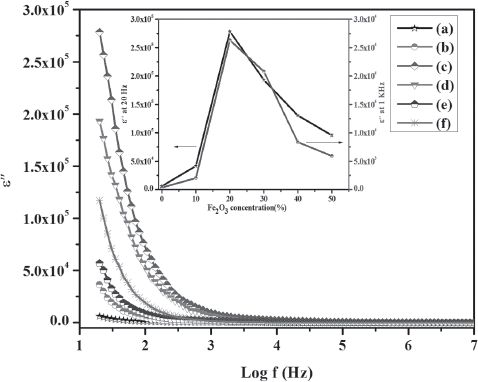
Variation in ε” as function of frequency for (a) PPy (b) P-1 (c) P-2 (d) P-3 (e) P-4 (f) P-5
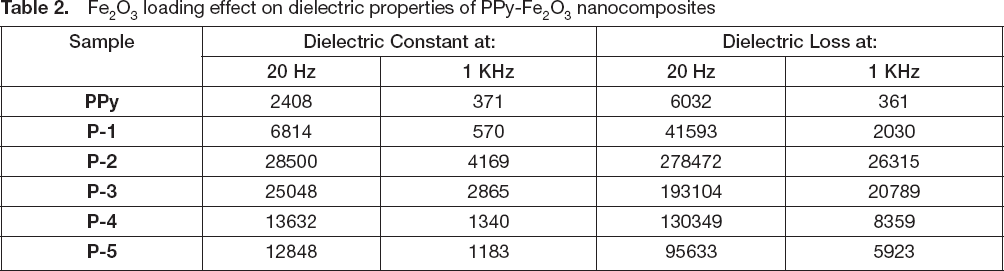
The values of ε” for PPy are 6032 and 361 at 20 Hz and 1 kHz respectively, whereas in the case of P-2 nanocomposite these values are 278472 and 26315 at 20 Hz and 1 kHz respectively. The observed values of ε’ and ε” for all the samples are listed in
Fe2O3 loading effect on dielectric properties of PPy-Fe2O3 nanocomposites
The ratio of ε” to ε’ is a measure of energy dissipation of a material, denoted as “tan δ” provides the basic information about an efficient energy absorbing material. The dependence of tan δ on frequency for PPy and PPy-Fe2O3 nanocomposites is presented in

Variation in tan δ for (a) PPy (b) P-1 (c) P-2 (d) P-3 (e) P-4 (f) P-5
PPy-Fe2O3 nanocomposites have been prepared by incorporation of Fe2O3 particles into a PPy matrix. A uniform dispersion of the Fe2O3 particles and strong interaction between the PPy and the Fe2O3 particles have been observed by XRD and FTIR respectively. An increasing trend of the dielectric constant up to 20wt% and then a gradual decrease up to 50wt% of Fe2O3, has been observed, with a maximum almost 12 times that of pure PPy. The surface morphology clearly reveals the presence of evenly-dispersed Fe2O3 particles in the PPy matrix, in accordance with their proportion and the successful formation of nanocomposites. The synthesised nanocomposites could be helpful in applications such as fabricating charge storing devices, electromagnetic interference (EMI) shielding and decoupling capacitor applications.
Conflicts of Interest
The authors declare that they have no conflict of interest.
Footnotes
Acknowledgement
The authors would like to acknowledge the Higher Education Commission (HEC) of Pakistan for their financial support under International Research Support Initiative Program (IRSIP) vide letter number 1- 8/HEC/ HRD/2015/4026.