
Abstract
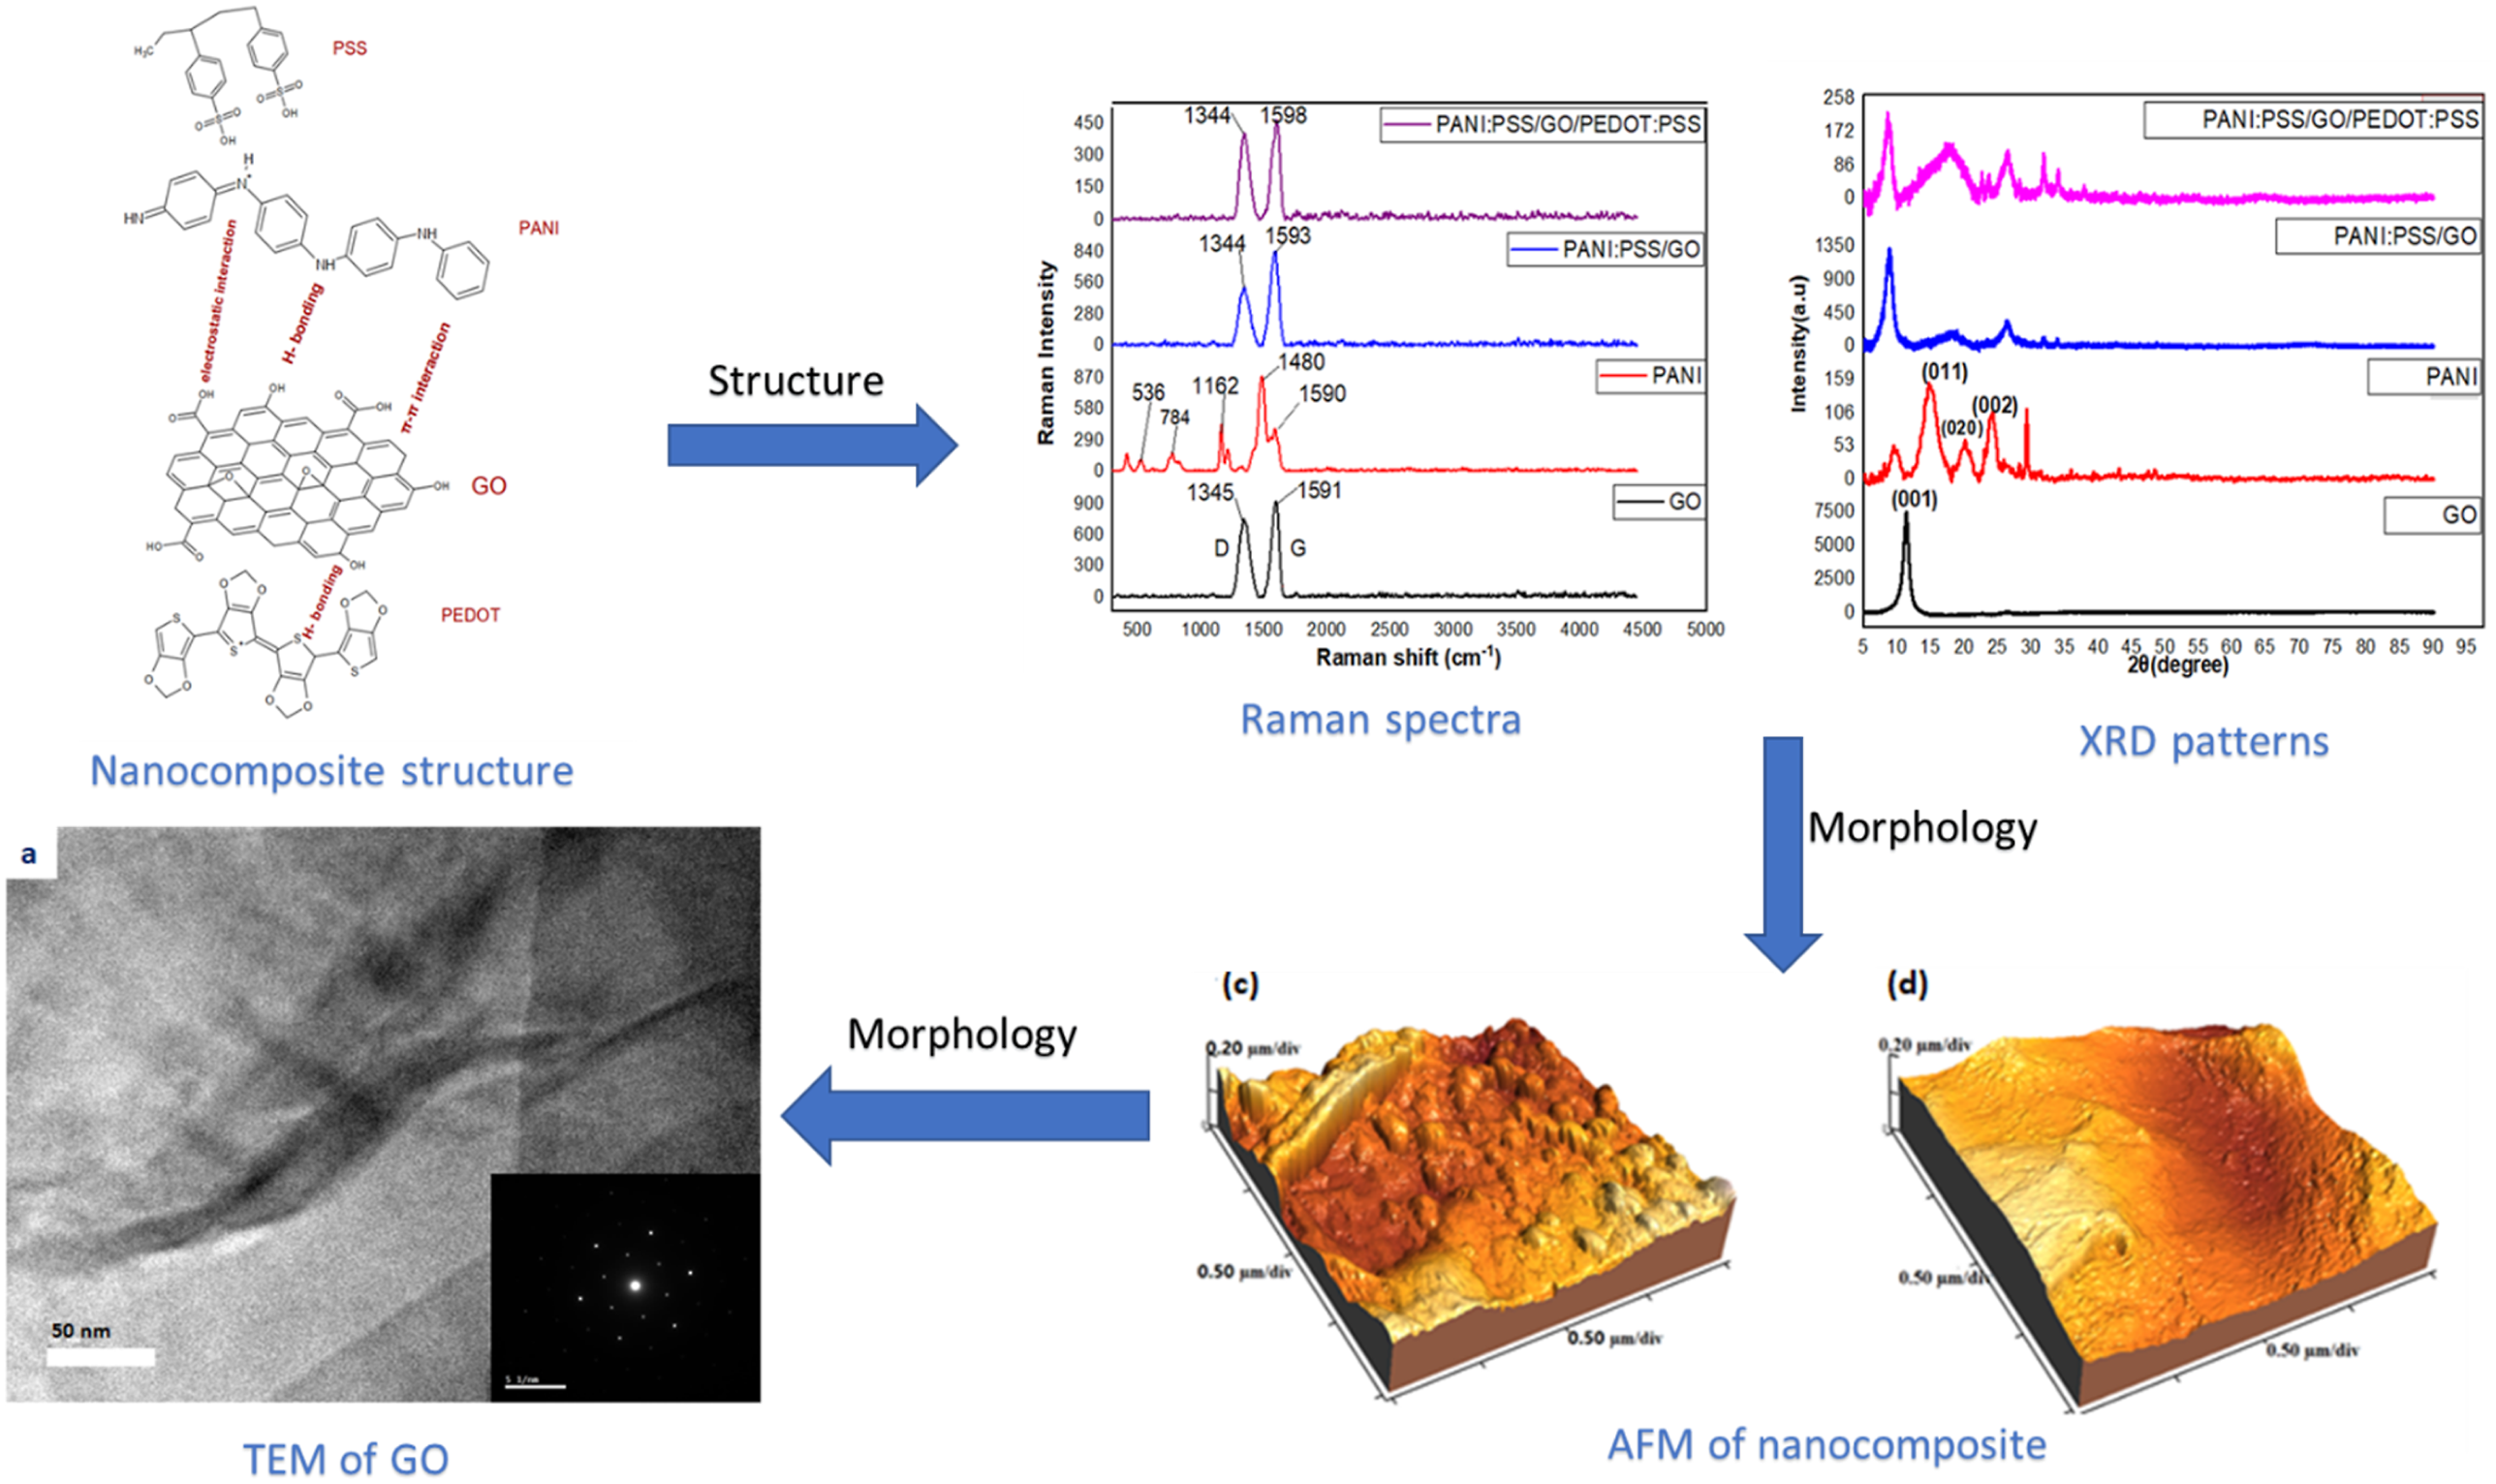
In this study, we Prepared a new composite of graphene oxide (GO), polyaniline (PANI) and poly(3,4-ethylenedioxythiophene) that can be used for non-enzymatic glucose sensing. Graphene oxide was prepared using modified Hammer’s method and PANI was prepared using Chemical oxidative method. PANI:PSS/GO and PANI:PSS/GO/PEDOT:PSS nanocomposites were synthesized by physical mixing at room temperature. Characterization was carried out using several analytical techniques to ensure the correct preparation and study the structure of the prepared nanocomposites and its individual components. Raman spectroscopy showed successful preparation of (GO) with high D:G ratio. XRD spectroscopy confirmed the interlayer spacing of graphene oxide increased by 26.9% and 34.6% respectively for both composites allowing the polymer to diffuse in-between the graphene layers and enhance its conductivity. EDX illustrated the chemical composition of nanocomposites with the atomic percentage. The surface morphology was also investigated using SEM and HRTEM proved the formation of homogenous surface due of the nanocomposites. Atomic force microscopy (AFM) proved the reduction in surface roughness by 17.5% and 20.7% of PANI:PSS/GO and PANI:PSS/GO/PEDOT:PSS nanocomposite respectively.
Introduction
Graphene oxide (GO) is a water-soluble graphene derivative which obtained by oxidation of graphite in a mixture of strong acid and oxidizing agent. 1 The oxidation process results in partial breaking of the sp2 hybridized structure of graphite and increasing the distance between carbon layers. 2 GO possesses both hydrophobic part from pristine graphite structure and hydrophilic part with oxygen containing functional groups such as hydroxyl, epoxy, carbonyl, and carboxyl groups on the basal plane and at the edge, generated by oxidation process.3,4 GO is commonly produced by using the Brodie, Staudenmaier, and Hummers methods with minor modifications. 5 The hydrophilic nature of GO due to the oxygen containing functional groups gives good water dispersibility and biocompatibility, which are highly important features in bio-applications. These properties of GO have provided a lot of opportunities for the development of novel biological sensing systems.
Electronically conducting polymers (intrinsically conducting polymers, ICPs) are sort of organic polymers that have high conductivity due to delocalized π-electrons moving easily within the backbone to construct an electrical pathway for mobile charge carriers. 6 Conducting Polymers (CPs) have electrical and optical properties similar to metals and semiconductors but retain the properties of polymers. Surface functionalization and/or doping can rapidly contain the characteristics of CPs. 7 Doping can increase the number of charge carriers and improve conductivity dramatically. The synthesis of CPs-based composites utilizes the advantages of CPs and overcome some limitations especially the solubility. 8 The conductivity and solubility of CPs are controllable by modifying their chemical structures. For example, polymers can obtain good solubility and processability by introducing specific functional groups. The biocompatibility of nanostructured conducting polymers than bulk polymers attracted more attention over the years and the number of studies on conducting polymers has fast expanded, and a great progress has been made. 7
Polyaniline (PANI) has high stability and suitability during the formation of composite structures.9,10 (–NH) groups over the PANI structure offer protonation, deprotonation and good physicochemical properties. 11 PANI also has the dual ability of acting as a binder as well as a conductive additive, providing its long-chain structure with good electrical conductivity. 12 It is the most adaptable conducting polymer due to its low cost, high specific energy and environmental friendly. 13 The Emeraldine-base form (EB-PANI) is a semiconductor, which is converted to conducting Emeraldine-salt form (ES-PANI) after protonation. Aniline hydrochloride oxidative polymerization in the presence of ammonium persulfate followed by deprotonation of the polyaniline hydrochloride with ammonia is the most commonly used chemical method for neutralization.14,15 This conversion of the emeraldine base resulted in better dispersion in organic solvents, compared with the emeraldine salt that has poor dispersibility in organic and inorganic solvents.
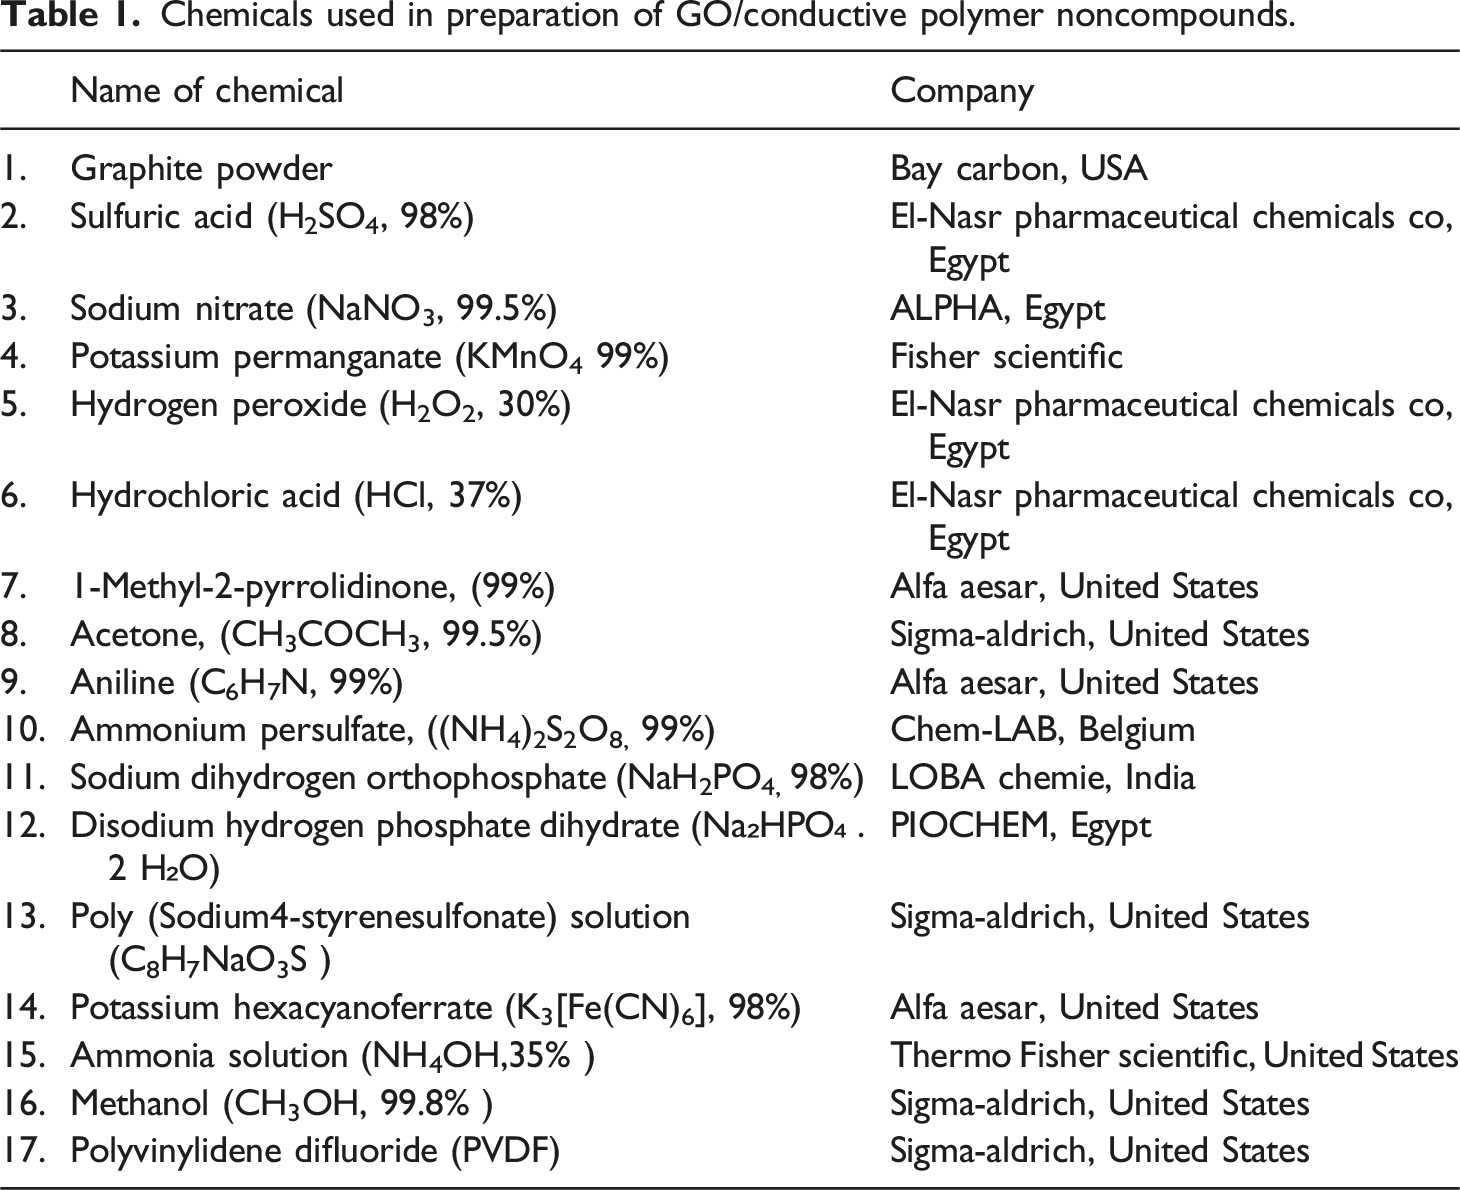
Chemicals used in preparation of GO/conductive polymer noncompounds.
Materials and methods
Preparation of GO
The modified Hummers method 23 was utilized to prepare GO. In this procedure, 4.0 g of natural graphite was mixed with 16.0 g of sodium nitrate in glass beaker. 100 mL of sulfuric acid was added to the mixed powder. The mixture was vigorously stirred for 20 min using magnetic stirrer while being cooled in an ice water bath. 24.0 g of KMnO4 was added drop by drop through 50 min to the above mixture. The mixture was kept at 0°C for another 2 h. The prepared mixture was then transferred to a sand-bath, and was heated at 35°C and kept at this temperature for 30 min. As the reaction progressed, the mixture gradually thickened. 320 mL of deionized water was added slowly to the mixture, and the temperature was raised to 98°C. The temperature was maintained for 15 min, and then the reaction mixture was cooled to room temperature. 560 mL of deionized water was added as further dilution step. 80 mL of Hydrogen peroxide was then added to the above suspension to remove the residual permanganate and to oxidize the manganese dioxide to colorless manganese sulfate. After the treatment with peroxide, the suspension turned into bright yellow. The suspension was filtered and washed twice with 1 L of 5%(v/v) diluted hydrochloric acid. Then, the suspension was washed with 5 L of deionized water three times. The final precipitated GO solution was vacuum dried at 60°C for 3 days to get the final GO flakes. Different chemicals are used in preparation of Graphene Oxide/Conductive Polymer Nanocomposites as shown in Table 1.
Preparation of polyaniline hydrochloride
The chemical oxidative polymerization of aniline was carried out in an aqueous acidic solution as shown in Figure 1(a). 13.5 g of Ammonium persulphate as oxidizing agent was dissolved in 1 M hydrochloric acid with continuous stirring for 15 min in an ice bath. 20 mL of aniline was also dissolved in pre-cooled 1 M hydrochloric acid with stirring for 15 min in an ice bath. Acidic solution of the ammonium persulphate was then added drop by drop to the aniline solution to prevent the temperature from exceeding 5°C. The mixture was left for 24 h with a continuous medium stirring rate to ensure the completion of polymerization process in an ice bath to keep the temperature ≤5°C. At the end of the polymerization process, a green powder of polyaniline hydrochloride (Emeraldine Salt) was produced. The powder was collected on a filter paper using vacuum pump and washed twice consecutively with distilled water, methanol, and acetone until filtrate became colorless, then dried at room temperature for 24 h.24,25 Preparation of polyaniline green emeraldine salt (a) and blue emeraldine base (b).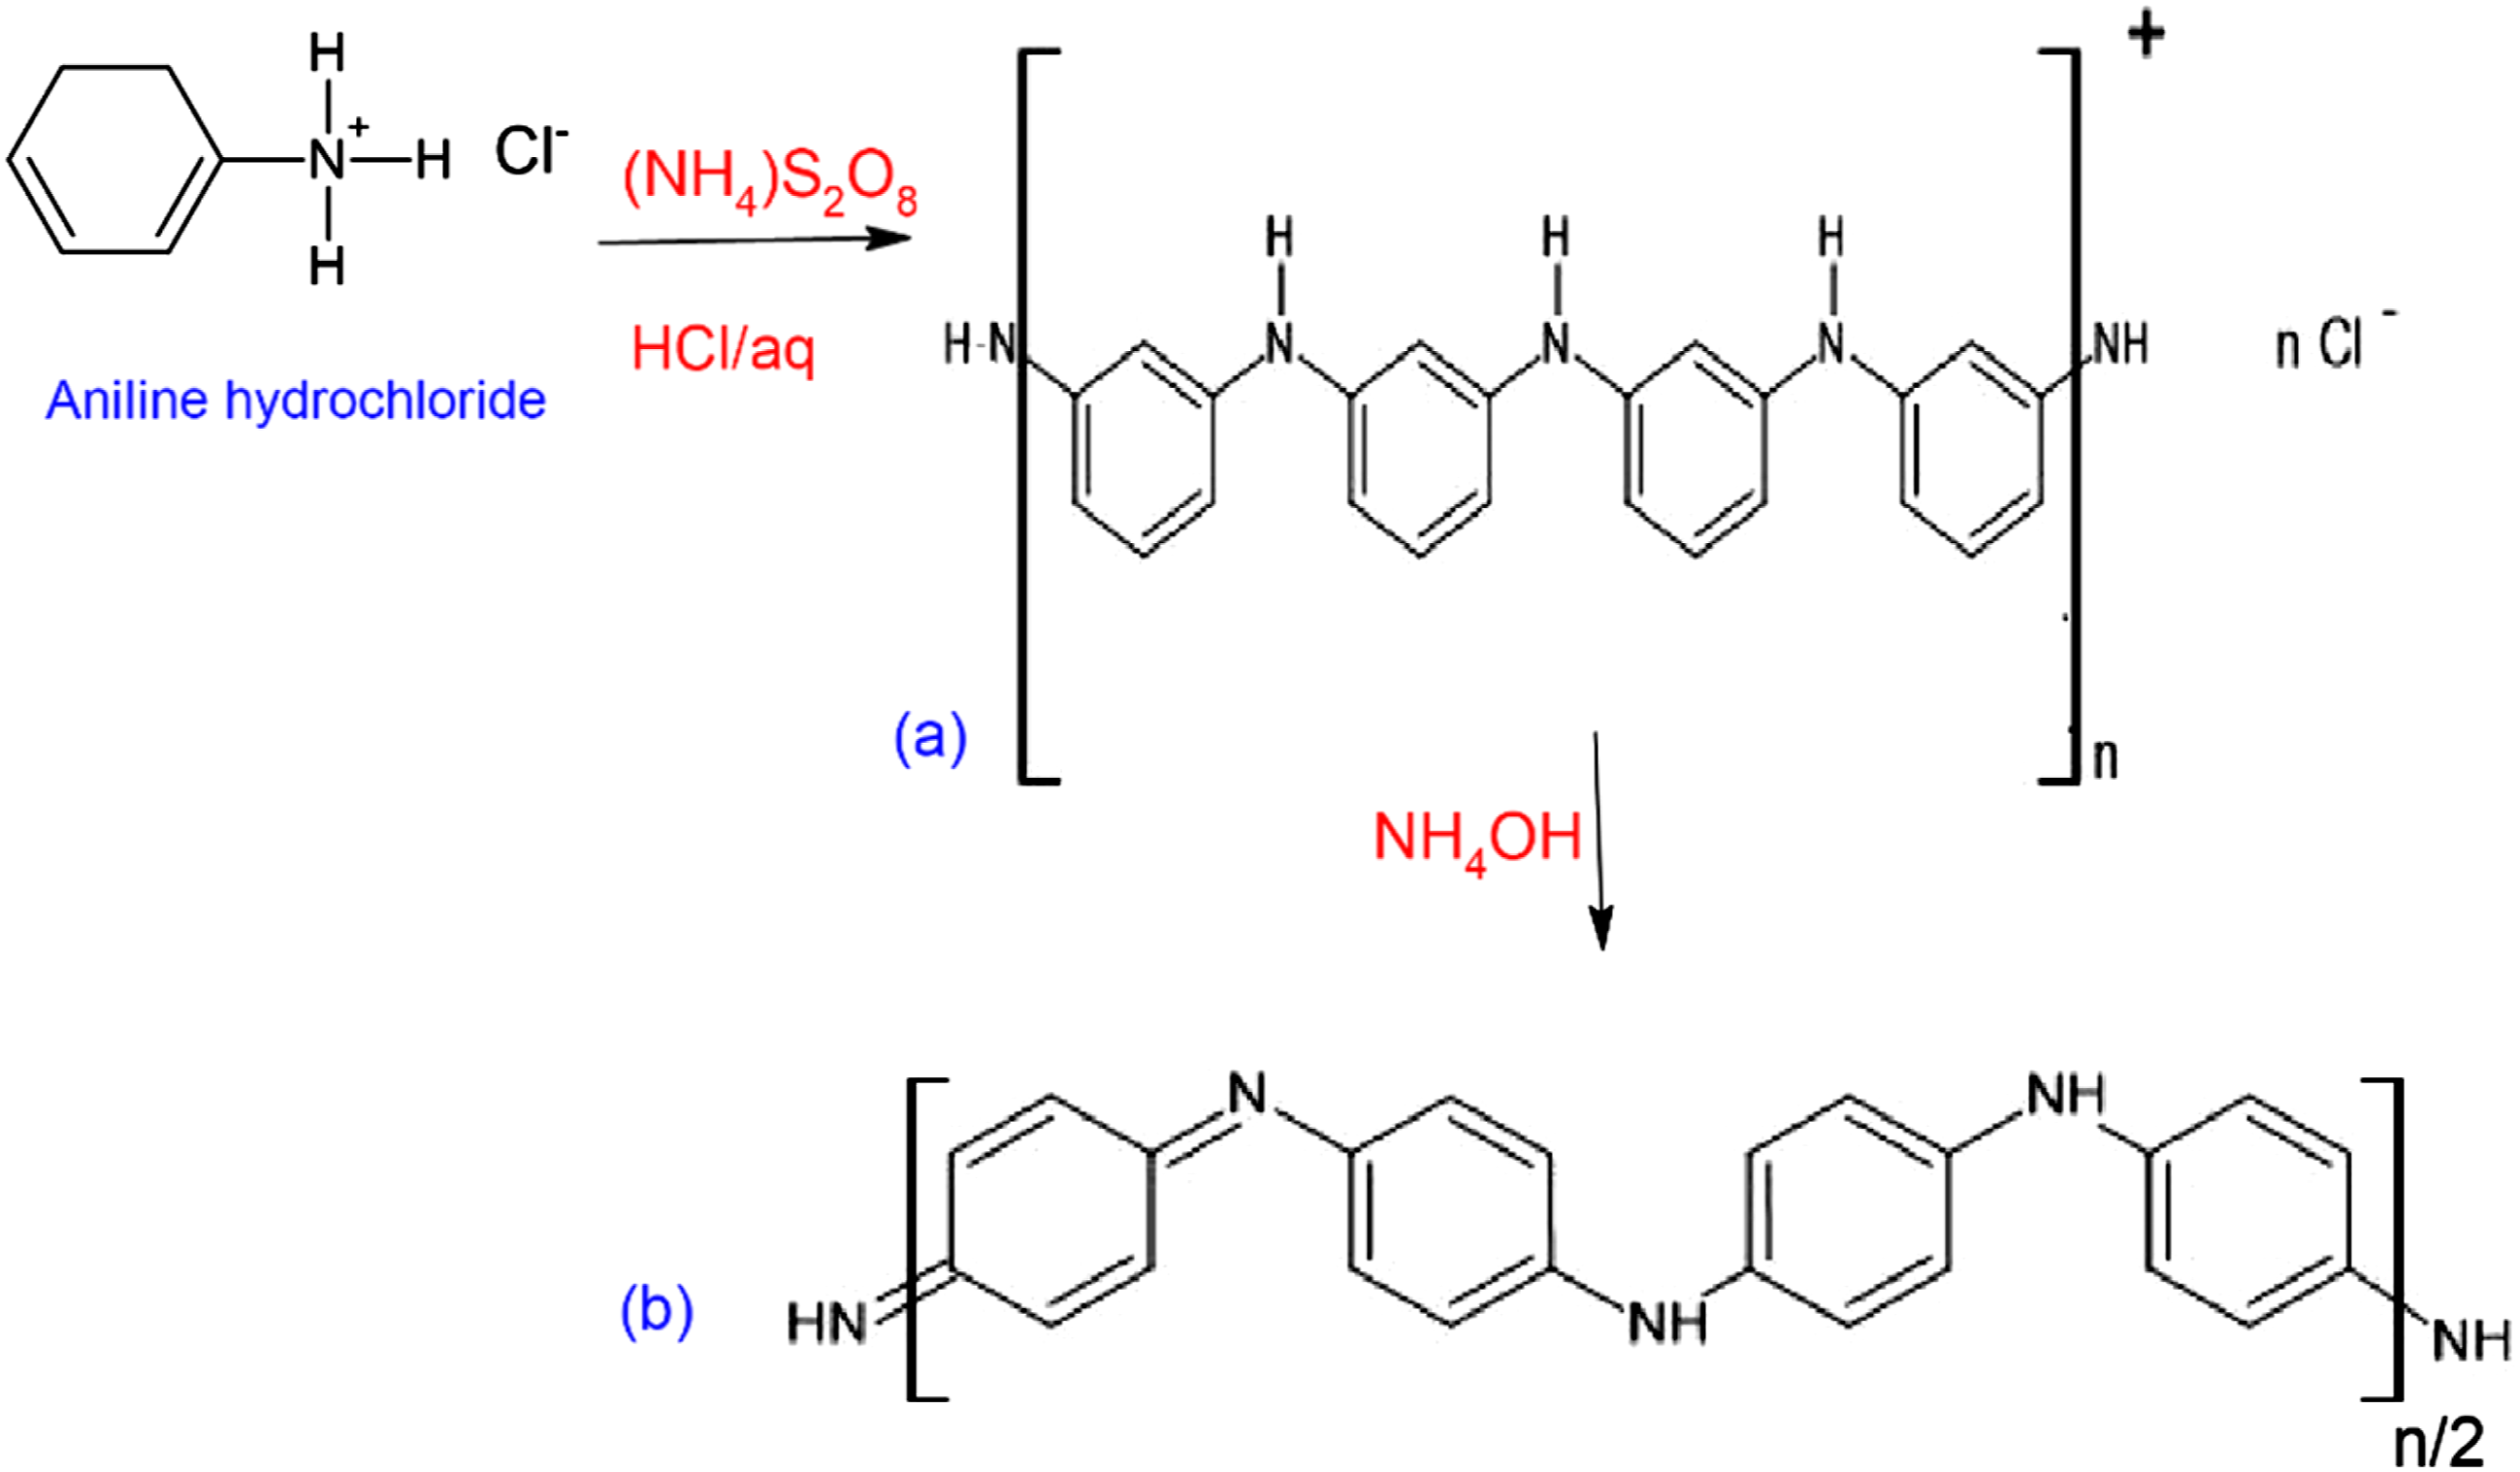
Preparation of undoped polyaniline (PANI)
Green Emeraldine Salt was undoped with 10% (v/v) ammonia solution, stirred for 1.30 h as shown in Figure 1(b) and blue powder of polyaniline base (PANI-EB) was resulted. 24 The powder was then collected on a filter paper using vacuum filtration and washed twice with distilled water, methanol and acetone, then was dried at 50°C for 24 h. The conversion of the emeraldine base resulted in high stability and better dispersion in organic solvents, compared with the emeraldine salt that has poor dispersibility in organic and inorganic solvents.
Synthesis of nanocomposites
PANI:PSS/GO nanocomposite was prepared with three ratios (1:2.5:0.28 wt%), (1:2.5:0.5 wt%) and (1:2.5:1 wt%) by changing graphene oxide ratio. Then PANI:PSS/GO/PEDOT nanocomposite was prepared by adding 30 µl of PEDOT to PANI:PSS/GO. Finally, 5 mL of (1-Methyl-2-pyrrolidinone) were added to the prepared mixtures by using magnetic stirrer for 30 min to achieve homogeneity.
Fabrication of biosensor electrodes
Graphite sheet with area (1 cm × 1 cm) was used as substrate. The working electrodes were prepared by physical mixing 90% of PANI, PSS,GO and PEDOT as active materials and 10 % of polyvinylidene difluoride (PVDF) to enhance adhesion property of nanocomposite. Then using sonication for 30 min. Drop casting the nanocomposites solution on a substrate and dry in oven at 60°C for 4 h.
Characterization techniques and measurements
Ultra violet-visible (UV-VIS) spectroscopy
Optical properties of GO and PANI are investigated by Ultra Violet-Visible (UV-VIS) Spectroscopy. The absorption spectra of GO and PANI are obtained by using UV-Visible spectrophotometer (Evolution 300 double beam scanning UV-visible spectrophotometer, Thermo scientific, USA) in the range of 200-800 nm with Deuterium lamp.
Fourier transformed infrared spectroscopy (FTIR)
The chemical structural of GO, PANI, PANI:PSS/GO and PANI:PSS/GO/PEDOT:PSS nanocomposites were confirmed by Fourier transforms infrared spectroscopy (Spectrum BX 11 Infrared spectrometer FTIR LX 18-5255 Perkin Elmer, USA) to obtained the FTIR for each prepared material. Powder forms were grinded with KBr powder at ratio 1:10. The powder mixture was pressed in a hydraulic press to form translucent pellets through which the IR beam of the spectrometer can pass. The spectra were recorded in the wavenumber range of 4000-400 cm−1.
X-ray diffraction (XRD)
The crystal phases structure for GO, PANI and PANI:PSS/GO and PANI:PSS/GO/PEDOT:PSS nanocomposites were determined by X-ray diffractometer (XRD-7000, Empyrean diffractometer/Panalytical, Germany) with CuKα radiation powder operating at 40 kV and 30 mA with a scan rate of 10°/min over a range of 2Ɵ between 5° and 95°. The Bragg’s law formula equation is used to measure the space between diffraction planes by using the equation
Raman spectroscopy
Raman spectra provide a non-destructive, fast, and reliable tool for GO, PANI, PANI:PSS/GO and PANI:PSS/GO/PEDOT:PSS nanocomposites and were recorded using microscope equipped triple monochromatic combined with a peltier cooled charge coupled device detector system (Senterra, Bruker, Germany). The spectra were acquired in the back scattering geometry while the 532 nm line of an Argon laser source was focused on the sample for excitation at a power of 2 mW. The phonon frequencies were obtained by fitting lorentzian line shapes to the experimental peaks after background subtraction.
High resolution transmission electron microscope (HRTEM) with energy dispersive x-ray spectrometry (EDX) system
The microstructure of GO, PANI, PANI:PSS/GO and PANI:PSS/GO/PEDOT:PSS nanocomposites were investigated using high resolution transmission electron microscope HRTEM (JEOL JEM 2100 F-Japan) microscope equipped with field emission gun (FEG) at an accelerating voltage of 200 kV was used for HRTEM analysis of samples . The samples were prepared with sonication of samples in 5 mL of ethanol and drop was placed on 5 nm carbon film coated copper grid. EDX was used to examine the elemental analysis of graphite sheet nanocomposite.
Scanning electron microscope (SEM)
The surface of different prepared films are investigated with scanning electron microscopy (SEM “JEOL JSM-6360 LA”, Japan) to examine the morphology and the homogeneity of the surface of graphite sheet, GO, PANI. PSS and PANI:PSS/GO and PANI:PSS/GO/PEDOT:PSS nanocomposites. Thin films of gold are sputtered onto the samples to get charge free surfaces. Characterization is performed at 20 kV acceleration voltages with a working distance of 25 mm under different magnifications.
Atomic force microscope (AFM)
AFM was operated in contact mode using Silicon Nitride probe model MLCT manufactured by Bruker, Germany. (Autoprobe cp-research head manufactured by Thermomicroscope) for graphite sheet, GO, PANI and PANI:PSS/GO and PANI:PSS/GO/PEDOT:PSS nanocomposites to identify the surface roughness.
Results and discussion
Optical properties
The UV–Vis. Absorption spectrum curves from 380 nm to 500 nm. Figure 2 shows the UV-Vis. Spectrum of GO. It is observed that GO shows a clear broad absorption peak giving a maximum value at 232 nm, corresponding to the conjugated aromatic double bonds (C = C) attributable to π-π* transition.
26
Another small peak appears at 300 nm as a shoulder band, corresponding to the carbonyl bonds (C = O) with n-π* transition confirming the formation of GO.
27
UV-VIS spectra (a) GO in distilled water, (b) PANI-base in Normal Methyl pyrrolidinone (NMP).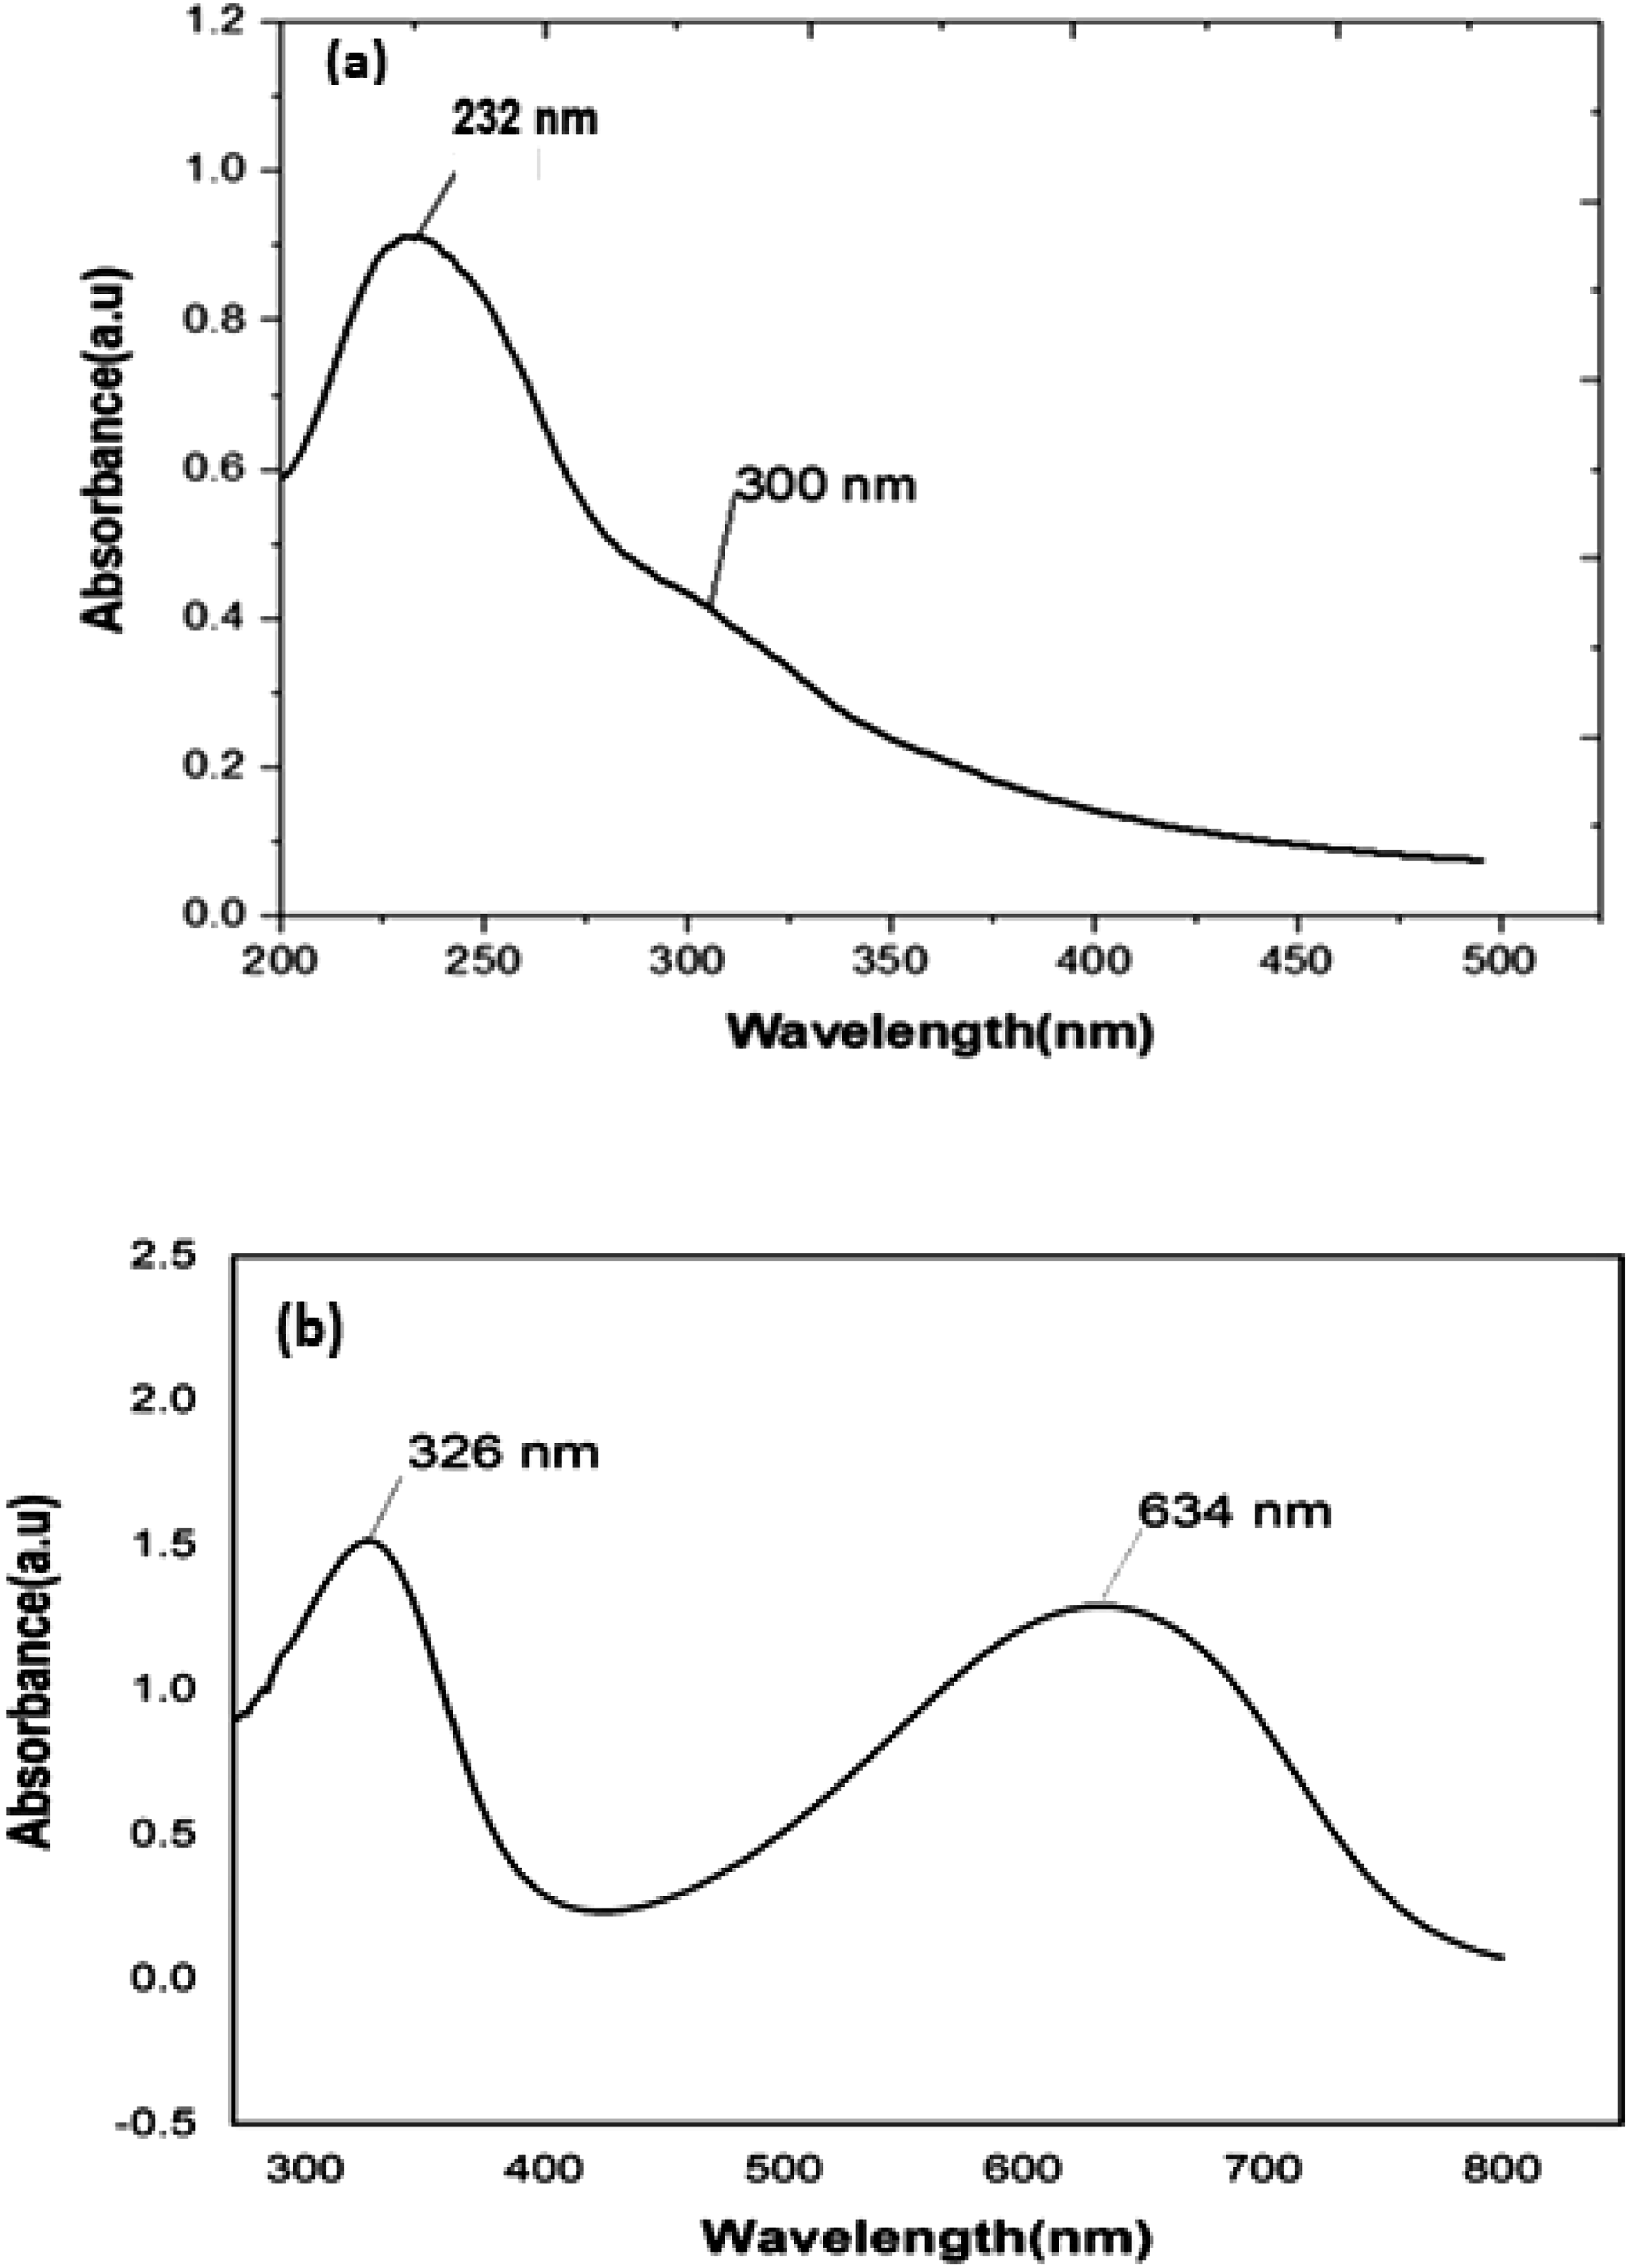
Figure 2 shows the UV-Vis pattern of Polyaniline. The spectrum has two peaks, one at 326 nm and another one at 634 nm. The first peak represents the aniline moiety and the second represents the benzenoid group and the lone pair of electrons belonging to the nitrogen atom. This in turn leads to a π-π* interactions of the molecule and this shows that polyaniline is a conducting polymer. The second peak represents the electronic excitation from the highest occupied molecular orbital (HOMO) of benzenoid rings to lowest unoccupied molecular orbital (LUMO) of quinoid rings. This determines the electrical conductivity and optical absorbance of polyaniline.27,28
FTIR analysis of GO, PANI, PANI:PSS/GO and PANI:PSS/GO/PEDOT:PSS
The FTIR spectra of GO, PANI, PANI:PSS/GO, and PANI:PSS/GO/PEDOT:PSS nanocomposites are shown in Figure 3. The spectrum for GO shows a broad peak at 3437 cm−1 corresponding to the O-H stretching of water molecules absorbed onto the GO. This oxygen-containing functional group provide GO with good dispersion in water.
29
This proves the hydrophilic nature of GO and its suitability to be used as sensor in aqueous solution. The presence of absorption peak at 1630 cm−1 can be attributed to the aromatic C = C stretching vibration. The absorption peak at 1050 cm−1 were corresponds to epoxy C-O stretching vibration. The presence of oxygen-containing functional group proves that the graphite has been successfully oxidized into GO.
29
FTIR spectra of GO, PANI, PANI:PSS/GO, PANI:PSS/GO/PEDOT:PSS.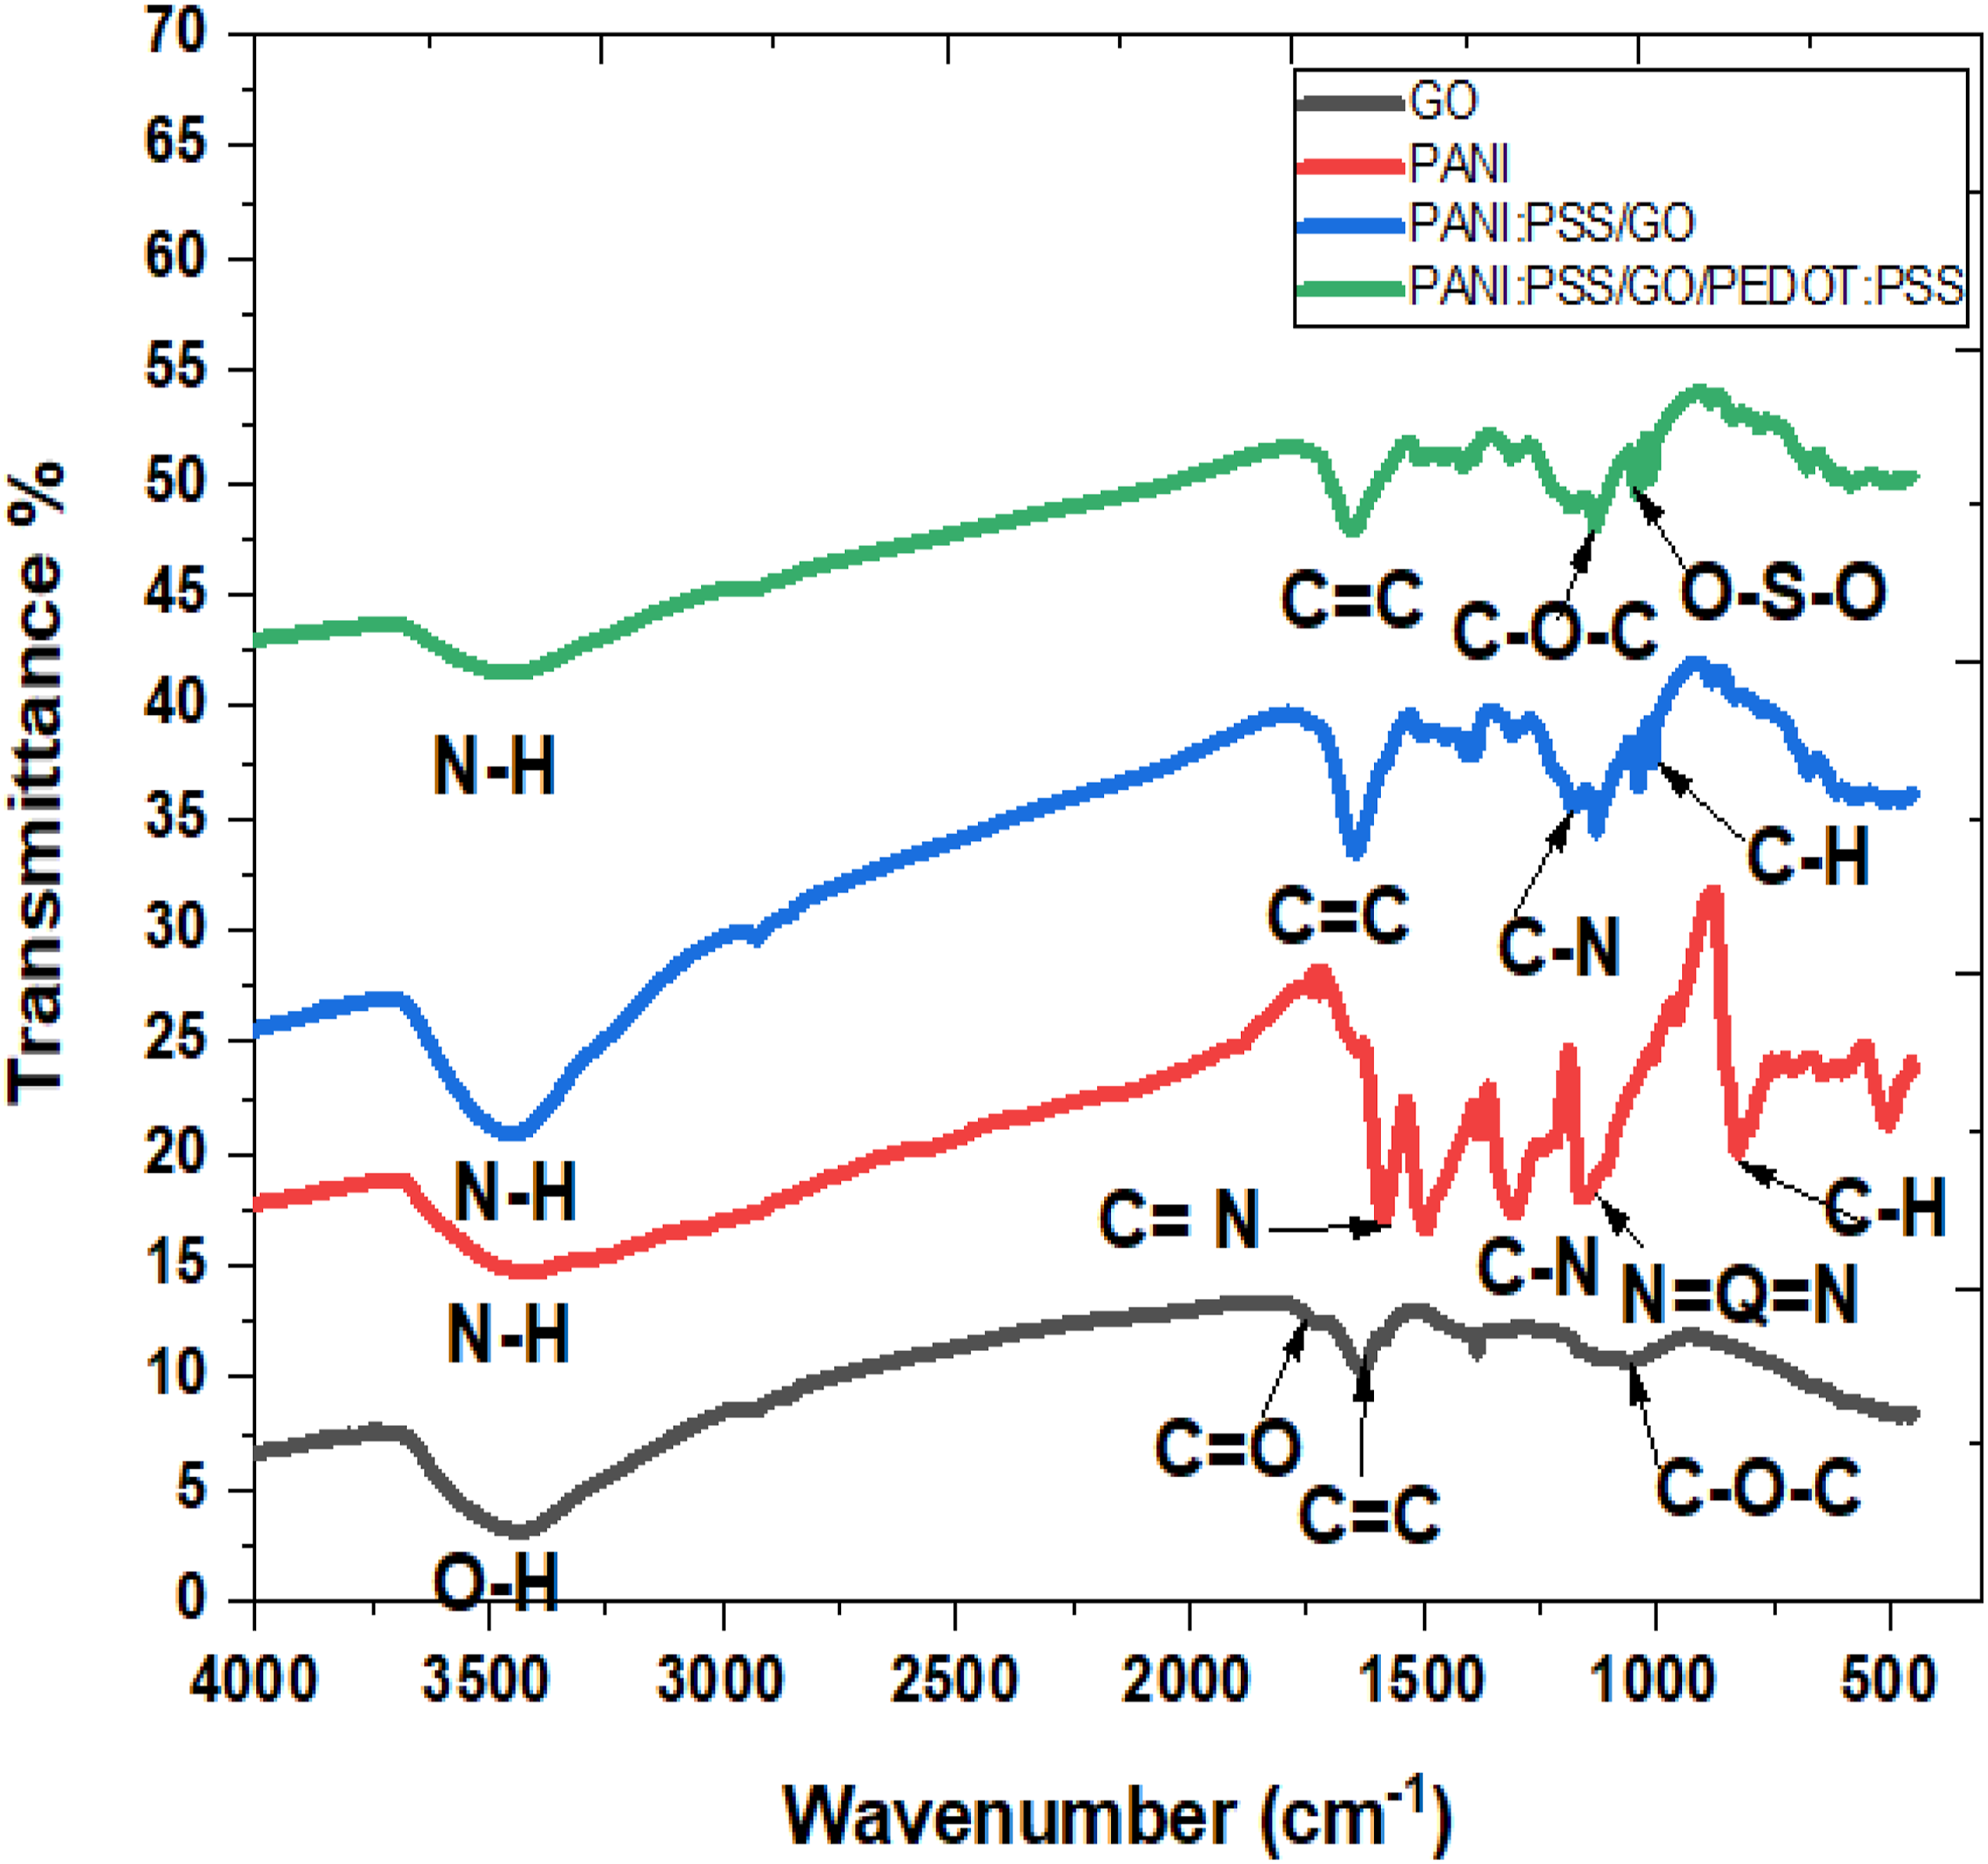
The FTIR spectrum of PANI-base has the broad band at 3432 cm−1 and indicates the widening of N − H bond of the aromatic ring of PANI.
30
There are characterizing peaks for PANI like the benzenoid band around C = N (quinonoid) vibration around 1586 cm−1 and another peak refers to the N = Q = N stretching peak at 1133 cm−1.30,31 For FTIR of PANI:PSS/GO has the peak at 3462 cm−1 which is referred to the N–H stretching , shifts to high wavenumber and is enhanced due to the contribution of O–H stretching peak of the GO.
32
The band at 1636 cm−1 is due to the stretching deformations of the C = C bonds of the benzene ring. This band compares to the corresponding one for GO presents a shift to lower wavenumbers indicating π – π interactions between π electrons of the benzene rings of GO with the π electrons of the PANI
32
which can be illustrated with the mechanism of the interaction suggested in Figure 4. Schematic diagram showing different types of the interaction between nanocomposite components (GO/PANI/PEDOT).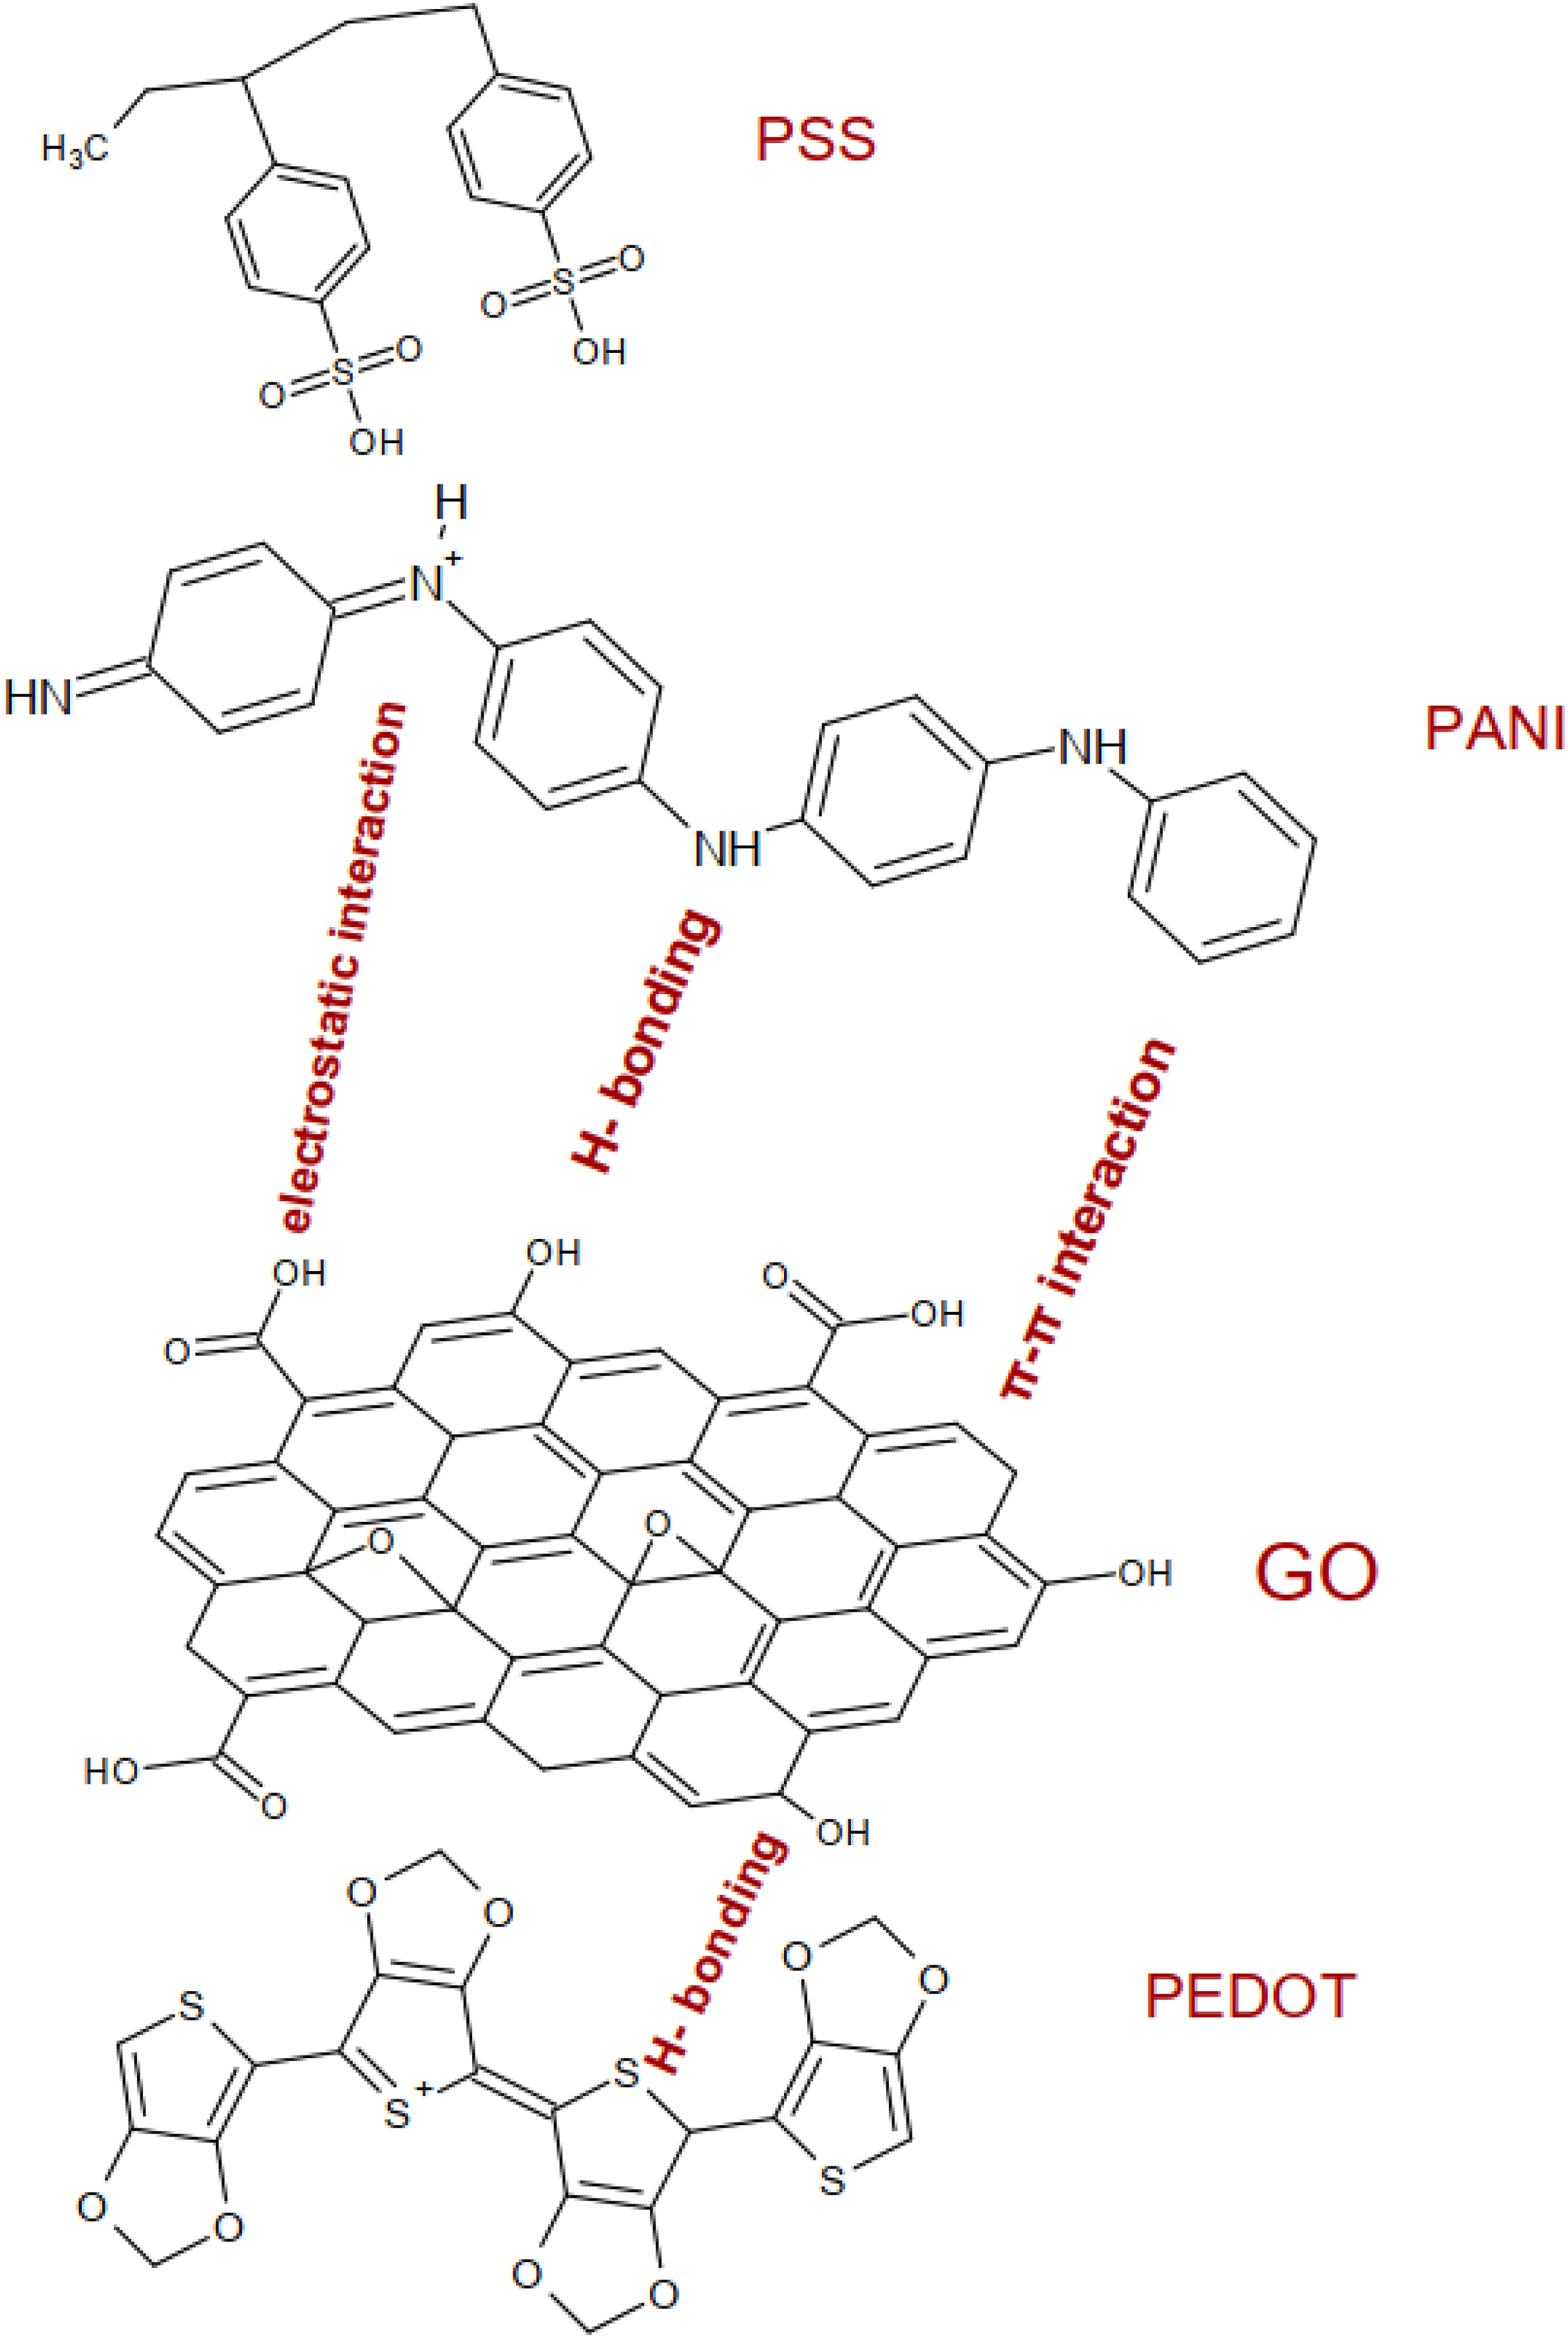
The bands at 1141 and 1494 cm−1 could be attributed to the N − Q − N − Q stretch of the quinonoid (Q) ring, and N = Q = N vibration of quinonoid ring. The band at 1300 cm−1 assigns to of C–N stretching vibrations due to emeraldine 33 become at 1180 cm−1. The band at ∼800 cm−1 can be attributed to the out of plane bending vibration of C–H groups, while the peak of C−H groups has been appeared at 1010 cm−1 that conforms the synthesis of nanocomposite. 32 PANI:PSS/GO/PEDOT:PSS nanocomposite has N-H peak at 3467 cm−1 which is shifted to slightly higher wavenumber. The C = C peak is enhanced at 1658 cm−1 due to the formation of nanocomposite. The peak of O-S-O at 1036 cm−1 of PSS and C-O-C band of PEDOT at 1254 cm−1 are confirmed the structural modifications of PEDOT:PSS.17,18
Raman spectroscopy
Raman spectroscopy is a widely used non-destructive structural analysis technique for carbon-based nanostructures. The Raman spectra of GO, PANI, PANI:PSS, and PANI:PSS/GO/PEDOT:PSS are presented in Figure 5. The spectrum of GO presents a disorder (D) band at 1345 cm−1 and a crystalline (G) band at 1591 cm−1 is assigned to in-plane vibration of sp2 carbon.
33
These characteristic bands can be used to correlate the structural properties of the carbon.
34
The ratio of the intensities (IG/ID) 1591/1345 = 1.18 refers to the occurrence of the complete oxidation and high quality of GO.35,36 Raman spectra of GO, PANI, PANI:PSS, and PANI:PSS/GO/PEDOT:PSS.
In the pure PANI, the characteristic bands appear at 1590 and 1480 cm−1, which are assigned to the C = C stretching vibration of the quinonoid ring and C–H bending vibration of the benzene ring in the backbone of PANI, respectively. The band at 1162 cm−1 is attributed to symmetrical C–H in-plane bending vibrations. The peaks observed at 784 cm−1can be refer to benzene ring deformations and the band at 536 cm−1. 36
The PANI:PSS/GO and PANI:PSS/GO/PEDOT:PSS nanocomposites have slightly shift to higher wavenumber of the G band to 1593 cm−1 and 1598 cm−1, respectively . This is due to the doping of the carboxyl group of GO and the π – π interaction between PANI and GO sheets. 37 There are no peaks appear from PANI, due to the peaks of PANI are too weak and over-lapped with the GO peaks. The GO peaks are predominant in nanocomposites due to activity of GO. 38
XRD analysis
XRD was used to determine the crystalline structure and to investigate the interlayer spacing of the synthesized materials. The interlayer changes and the crystalline properties of synthesized GO was determined by Bragg’s law equation (1).
XRD patterns are shown in Figure 6 for GO, PANI, PANI:PSS/GO and PANI:PSS/GO/PEDOT:PSS nanocomposites. The XRD pattern for GO shows a strong and sharp crystalline peak at 2θ = 11.3° corresponding to the (001) crystal plane with a d-spacing of 0.78 nm. This large interlayer spacing of GO was due to the existence of oxygenated functional group on GO during the oxidation treatment of graphite powder and also the intercalation of water molecules and proves the formation of GO.
39
PANI has three broad peaks that refers to the formation of the semi-crystalline nature.
40
XRD patterns of GO, PANI, PANI:PSS/GO and PANI:PSS/GO/PEDOT:PSS.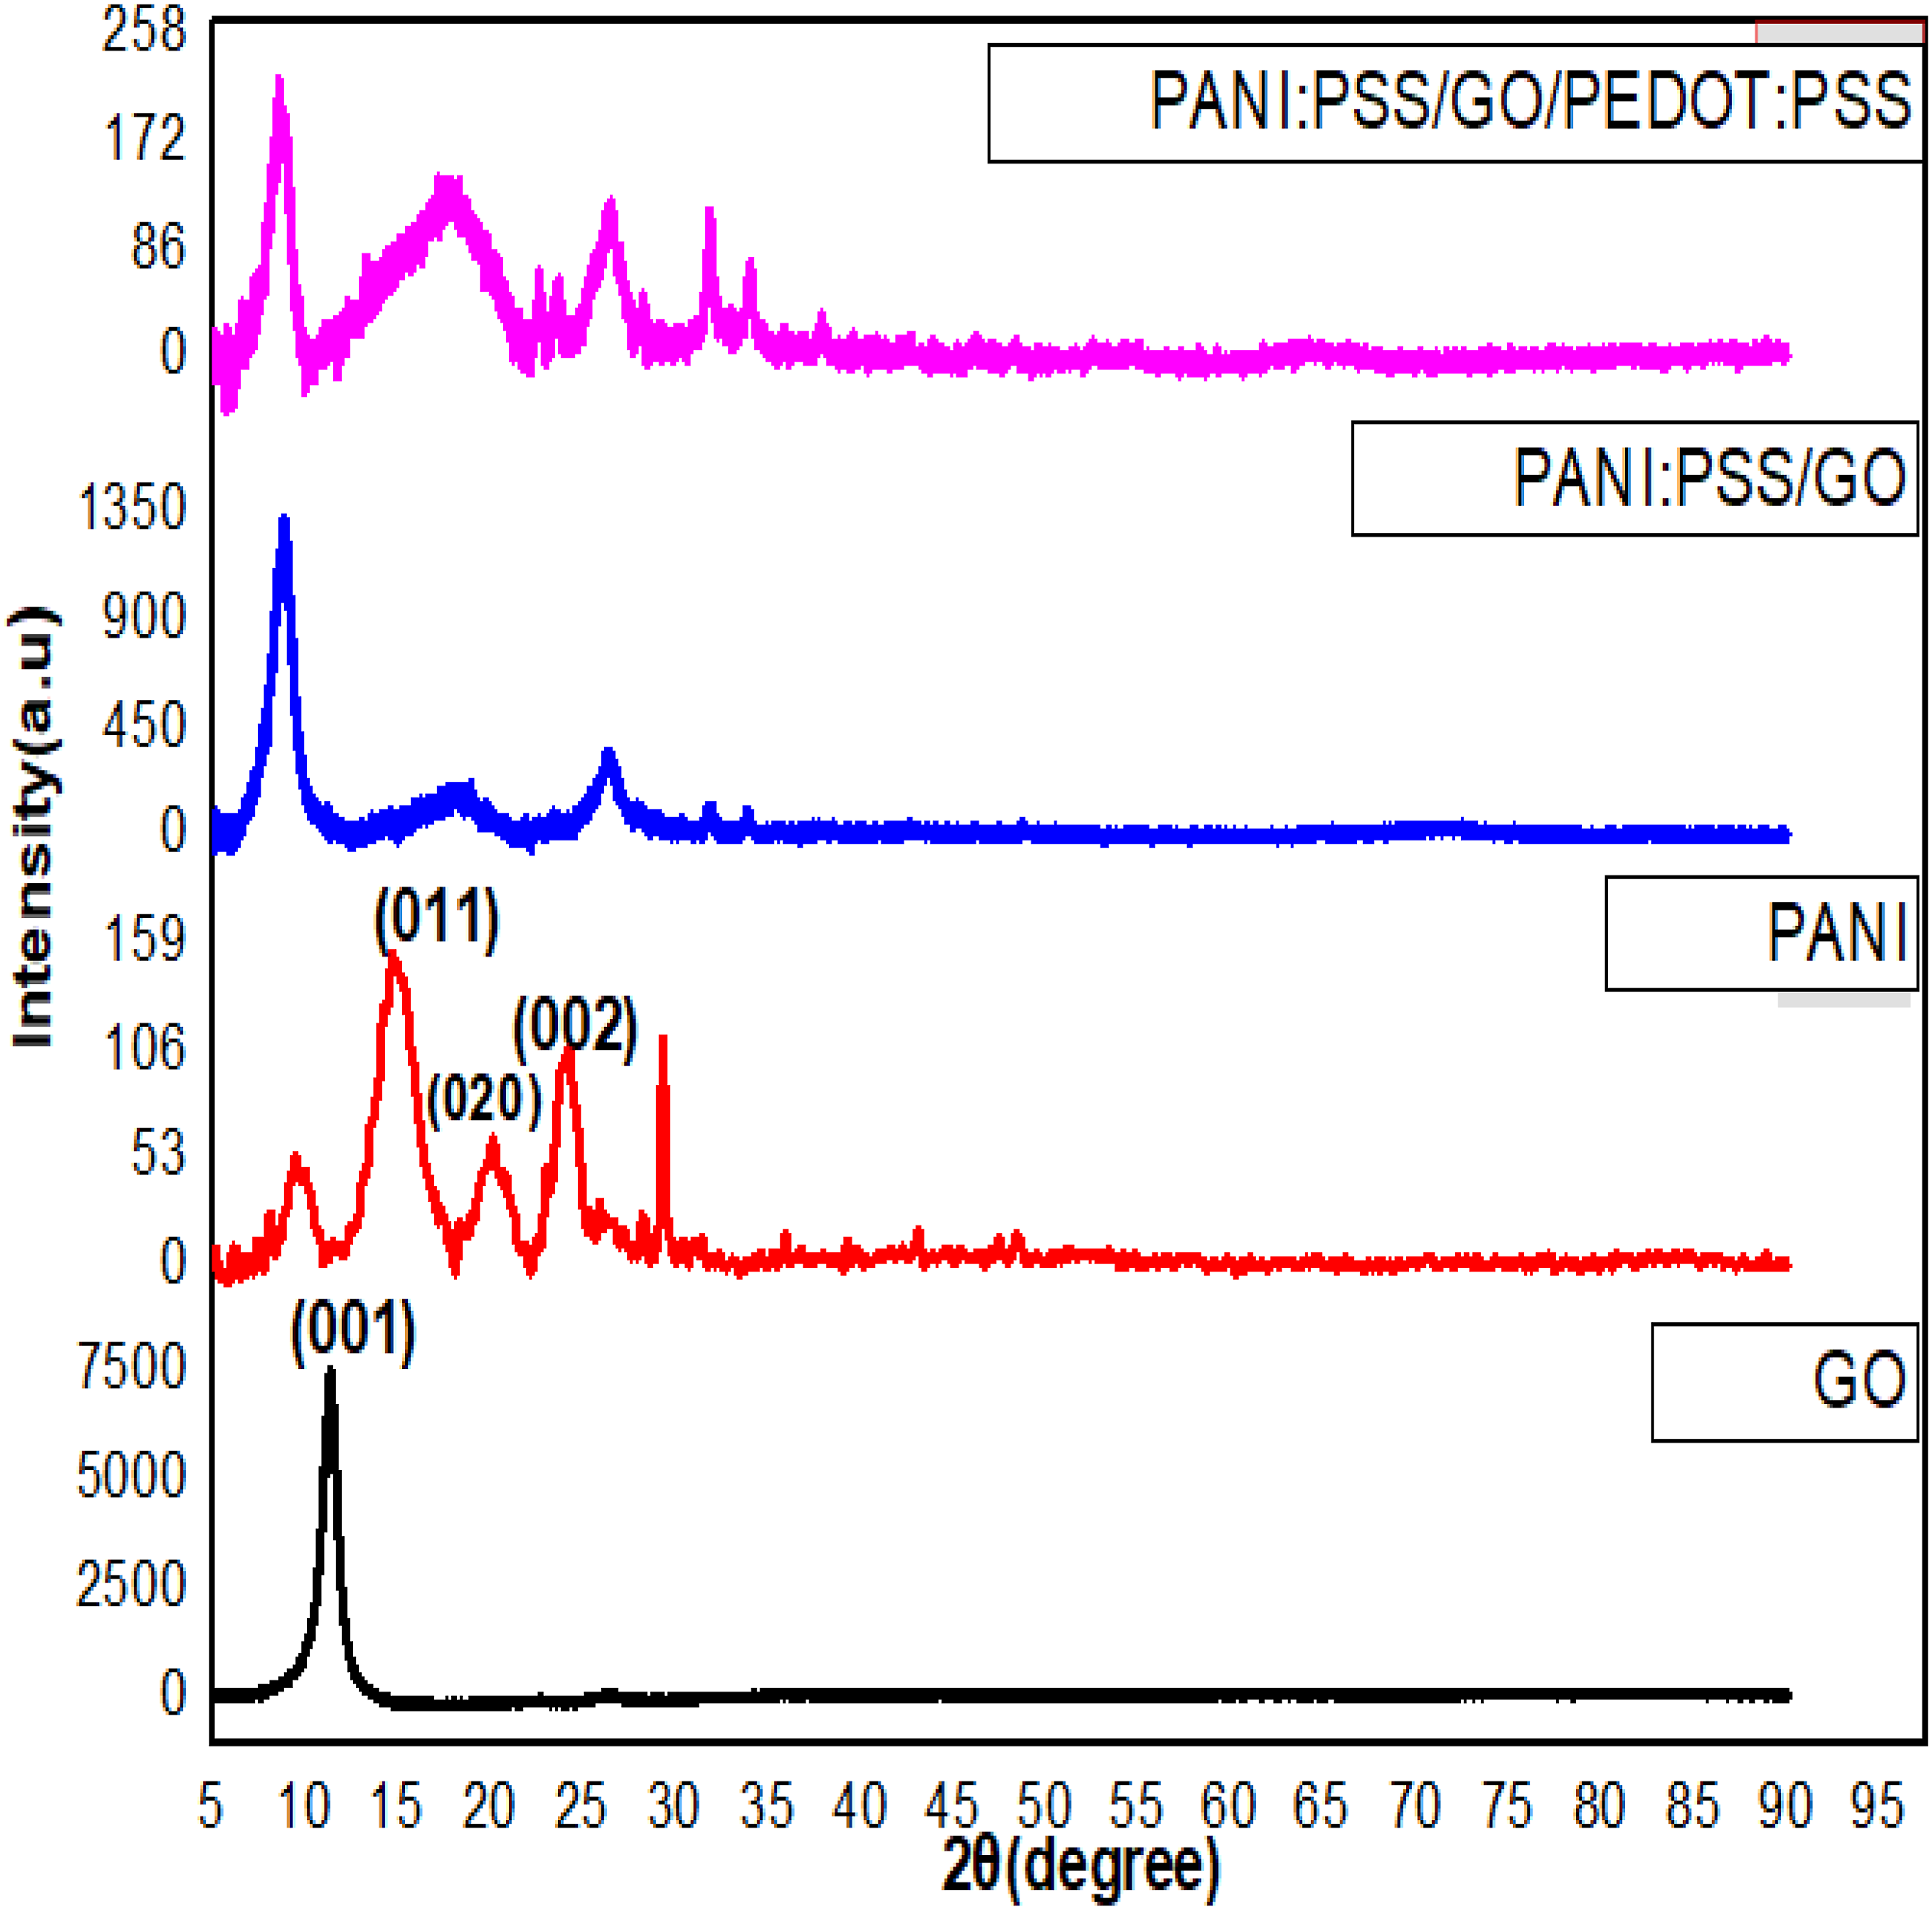
The PANI:PSS/GO nanocomposite has 2θ at 8.92°, 18.27°, 26.21°with d-spacing equal 0.99, 0.48 and 0.34 nm . It is worthy to notify that GO sheets shift to larger an interspacing distance due to the intercalation of PANI with the GO sheets.
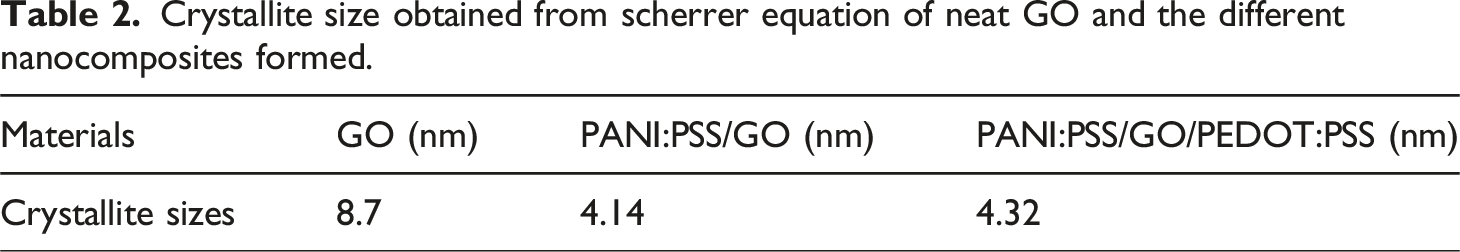
The PANI:PSS/GO/PEDOT:PSS nanocomposite has 2θ at 8.4°, 17.8°, 26.5°, 31.8°, and 33.9°, respectively. The d-spacing are confirmed to be 1.05, 0.49, 0.33, 0.28, and 0.26 nm, respectively. As 2θ decrease the d-spacing increase which confirm the presence of PANI and PEDOT:PSS in the GO sheets to form the composite. The calculated crystallite sizes of GO, PANI, PANI:PSS/GO and PANI:PSS/GO/PEDOT:PSS nanocomposites can be calculated from Scherrer equation: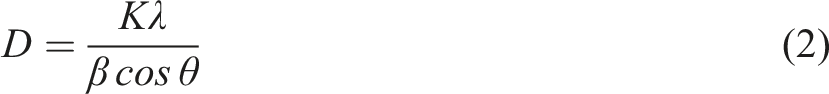
Crystallite size obtained from scherrer equation of neat GO and the different nanocomposites formed.
SEM analysis
SEM analysis was performed to visualize the surface morphology and lateral dimensions of GO, PANI:PSS, PANI:PSS/GO and PANI:PSS/GO/PEDOT:PSS as shown in Figure 7. The SEM image of GO appears as thin layers with sheets as illustrated in Figure 7(a). The thin layers of GO are attributed to the extensive oxidation of graphite structure which overcomes the weak Vander Waal’s forces in between packed graphite layers and expands the stacked layers of graphite.
42
SEM images of (a) GO, (b) PANI:PSS, (c) PAN:PSS/GO, (d) PANI:PSS/GO/PEDOT:PSS.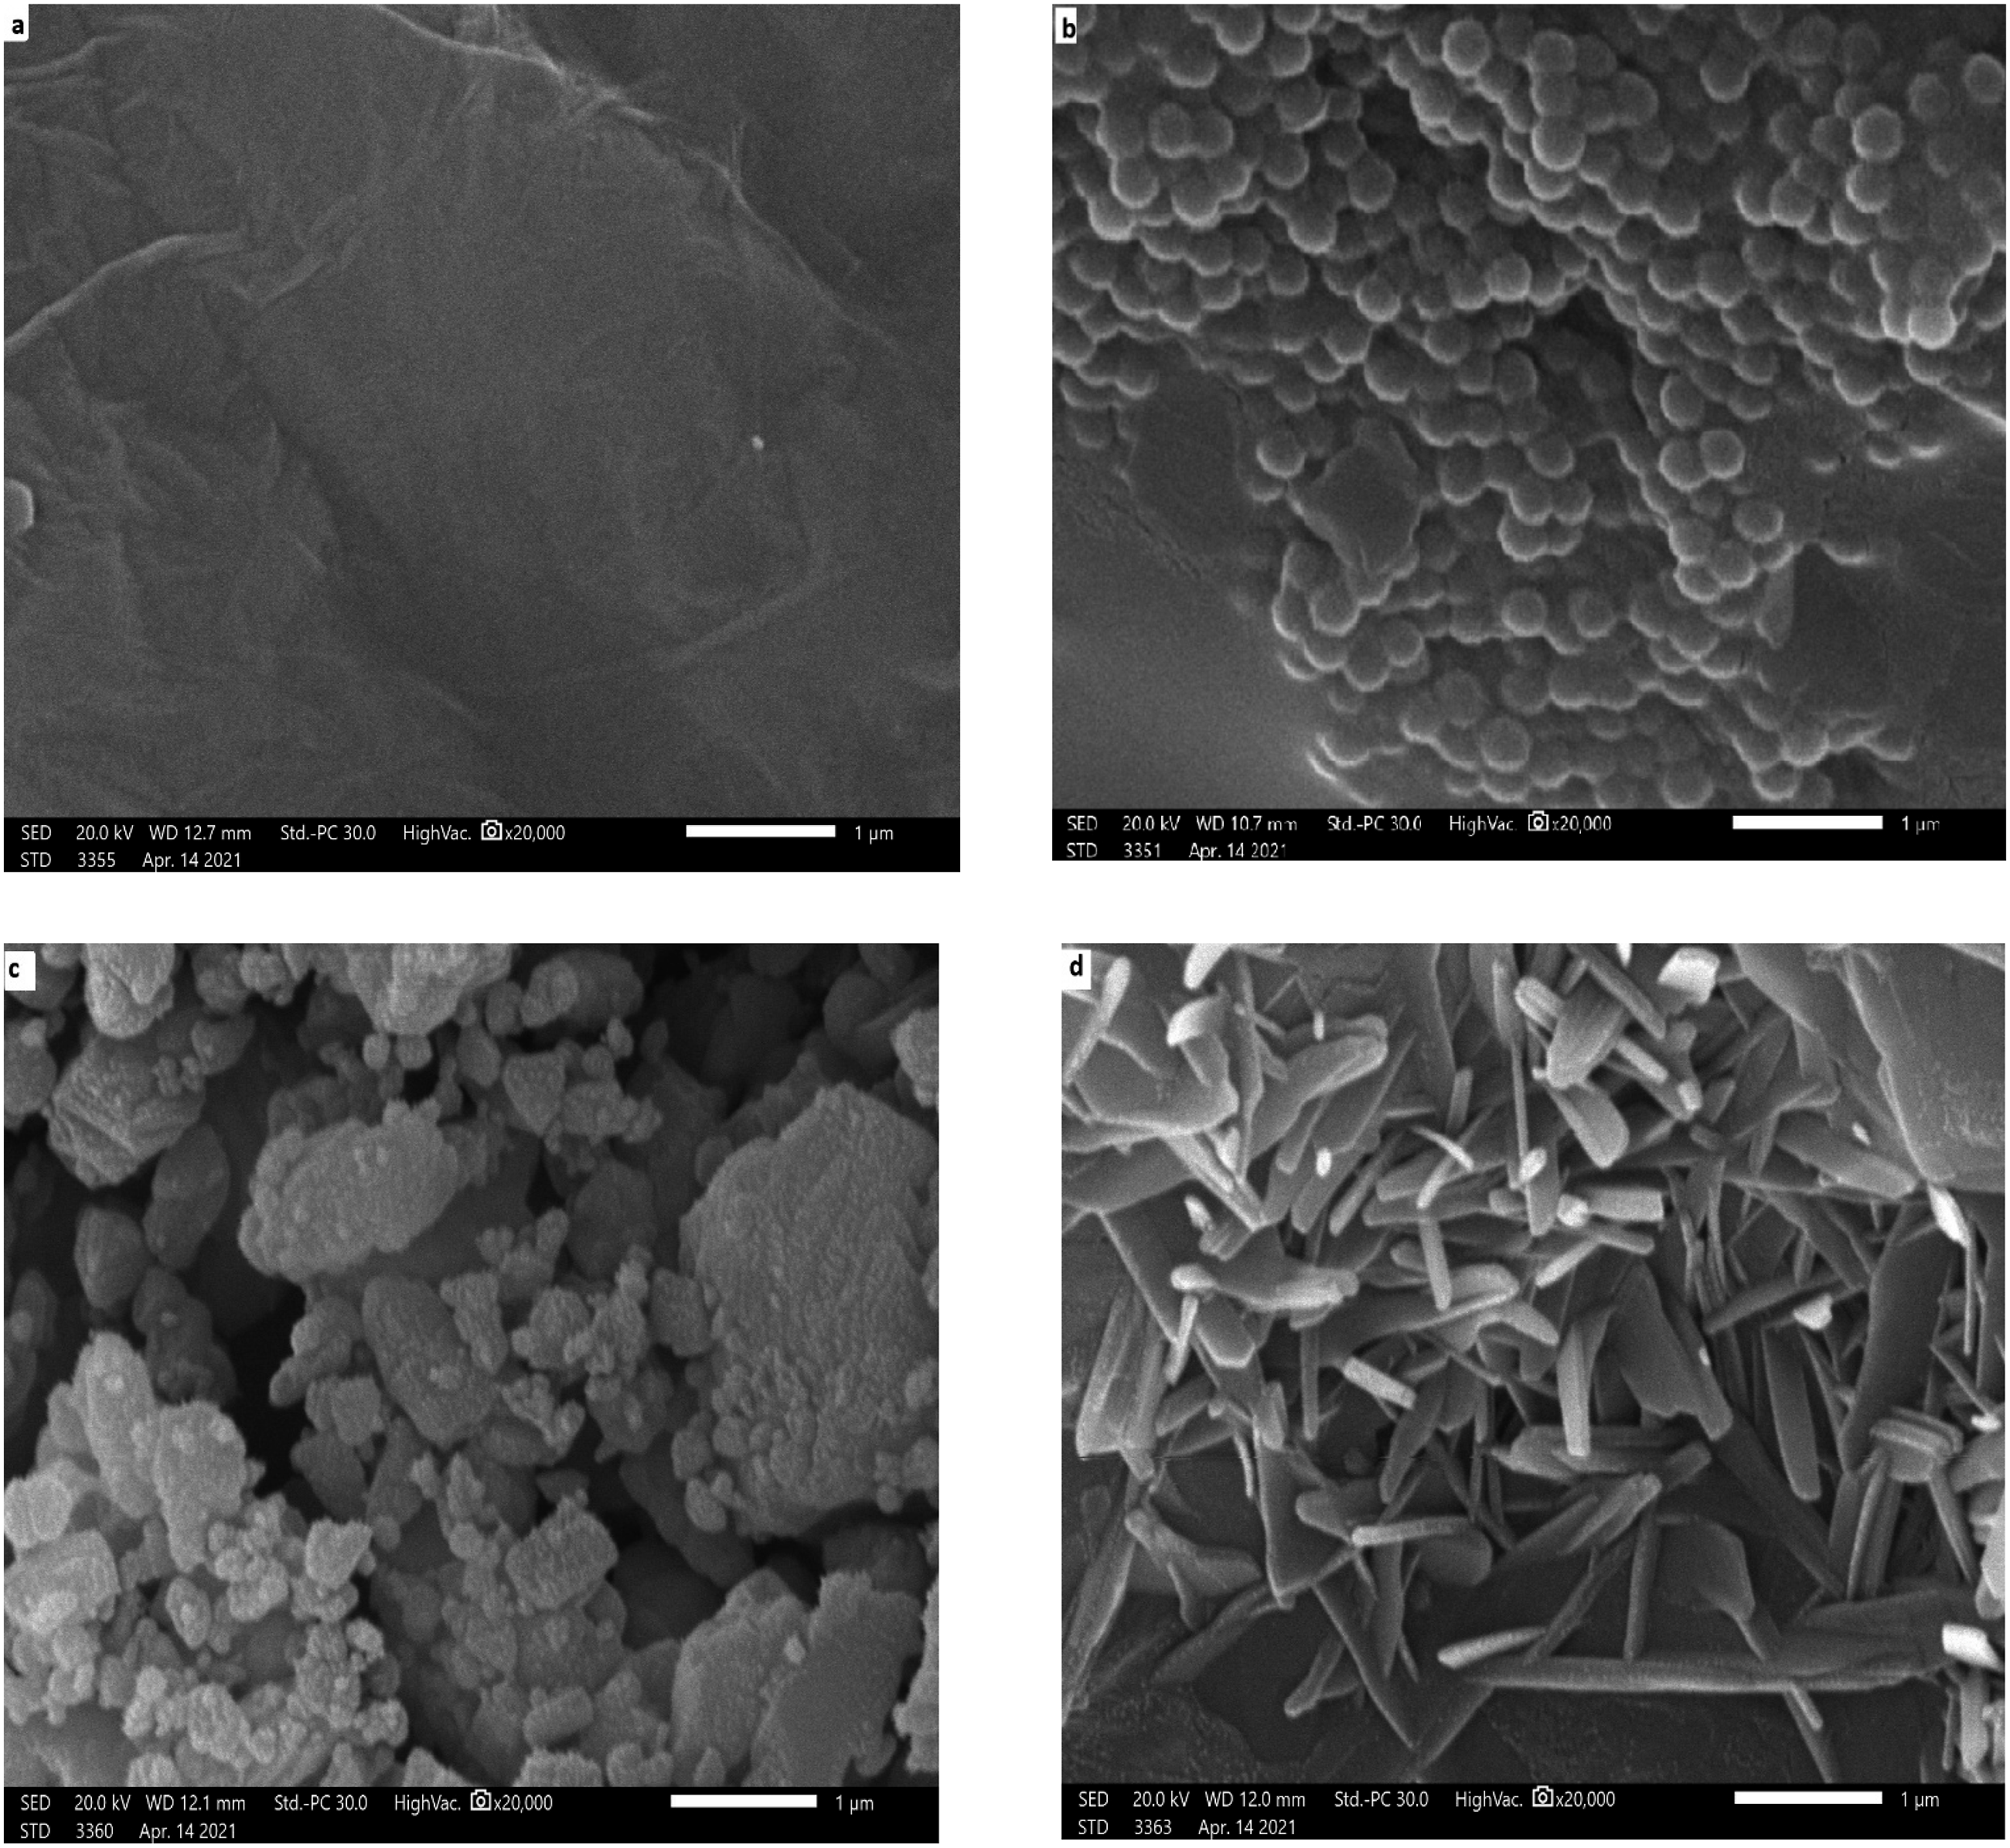
Figure 7(b) represents the PANI:PSS with homogenous spherical particles and aggregates in the form of large globules, which was also observed in earlier studies. 43
Figure 7(c) PANI:PSS/GO has two separated phases. The first one is of distorted spherical structures of PANI:PSS. The second one is of large aggregated plates an aggregation region due to the presence of GO in the nanocomposite.
Figure 7(d) illustrates PANI:PSS/GO/PEDOT:PSS modified structure due to PEDOT:PSS with fibrillary structures. 44 SEM images confirms the formation of homogenous nanocomposite of PANI:PSS/GO and PANI:PSS/GO/PEDOT:PSS.
AFM analysis
The AFM was utilized to analyze the surface morphology of material structure and to reinforce the SEM analysis. Here we discus only one value, the maximum peak and valley roughness (Rp-v).
Figure 8 shows Rp-v of GO, PANI:PSS, PANI:PSS/GO and PANI:PSS/GO/PEDOT:PSS nanocomposites with 2D and 3D images. The Rp-v of GO, PANI:PSS, PANI:PSS/GO and PANI:PSS/GO/PEDOT:PSS are 494.6 nm, 798.9 nm, 407.9 nm and 391.9 nm, respectively. In the PANI:PSS composite PANI is more rigid than PSS due to the π-π conjugated molecular structure of PANI. The PANI:PSS/GO and PANI:PSS/GO/PEDOT:PSS have the lowest values of Rp-v. 3D AFM images of (a) GO (b) PANI:PSS (c) PANI:PSS/GO (d) PANI:PSS/GO/PEDOT:PSS showing different surface morphology and surface roughness for all nanomaterials/nanocomposites.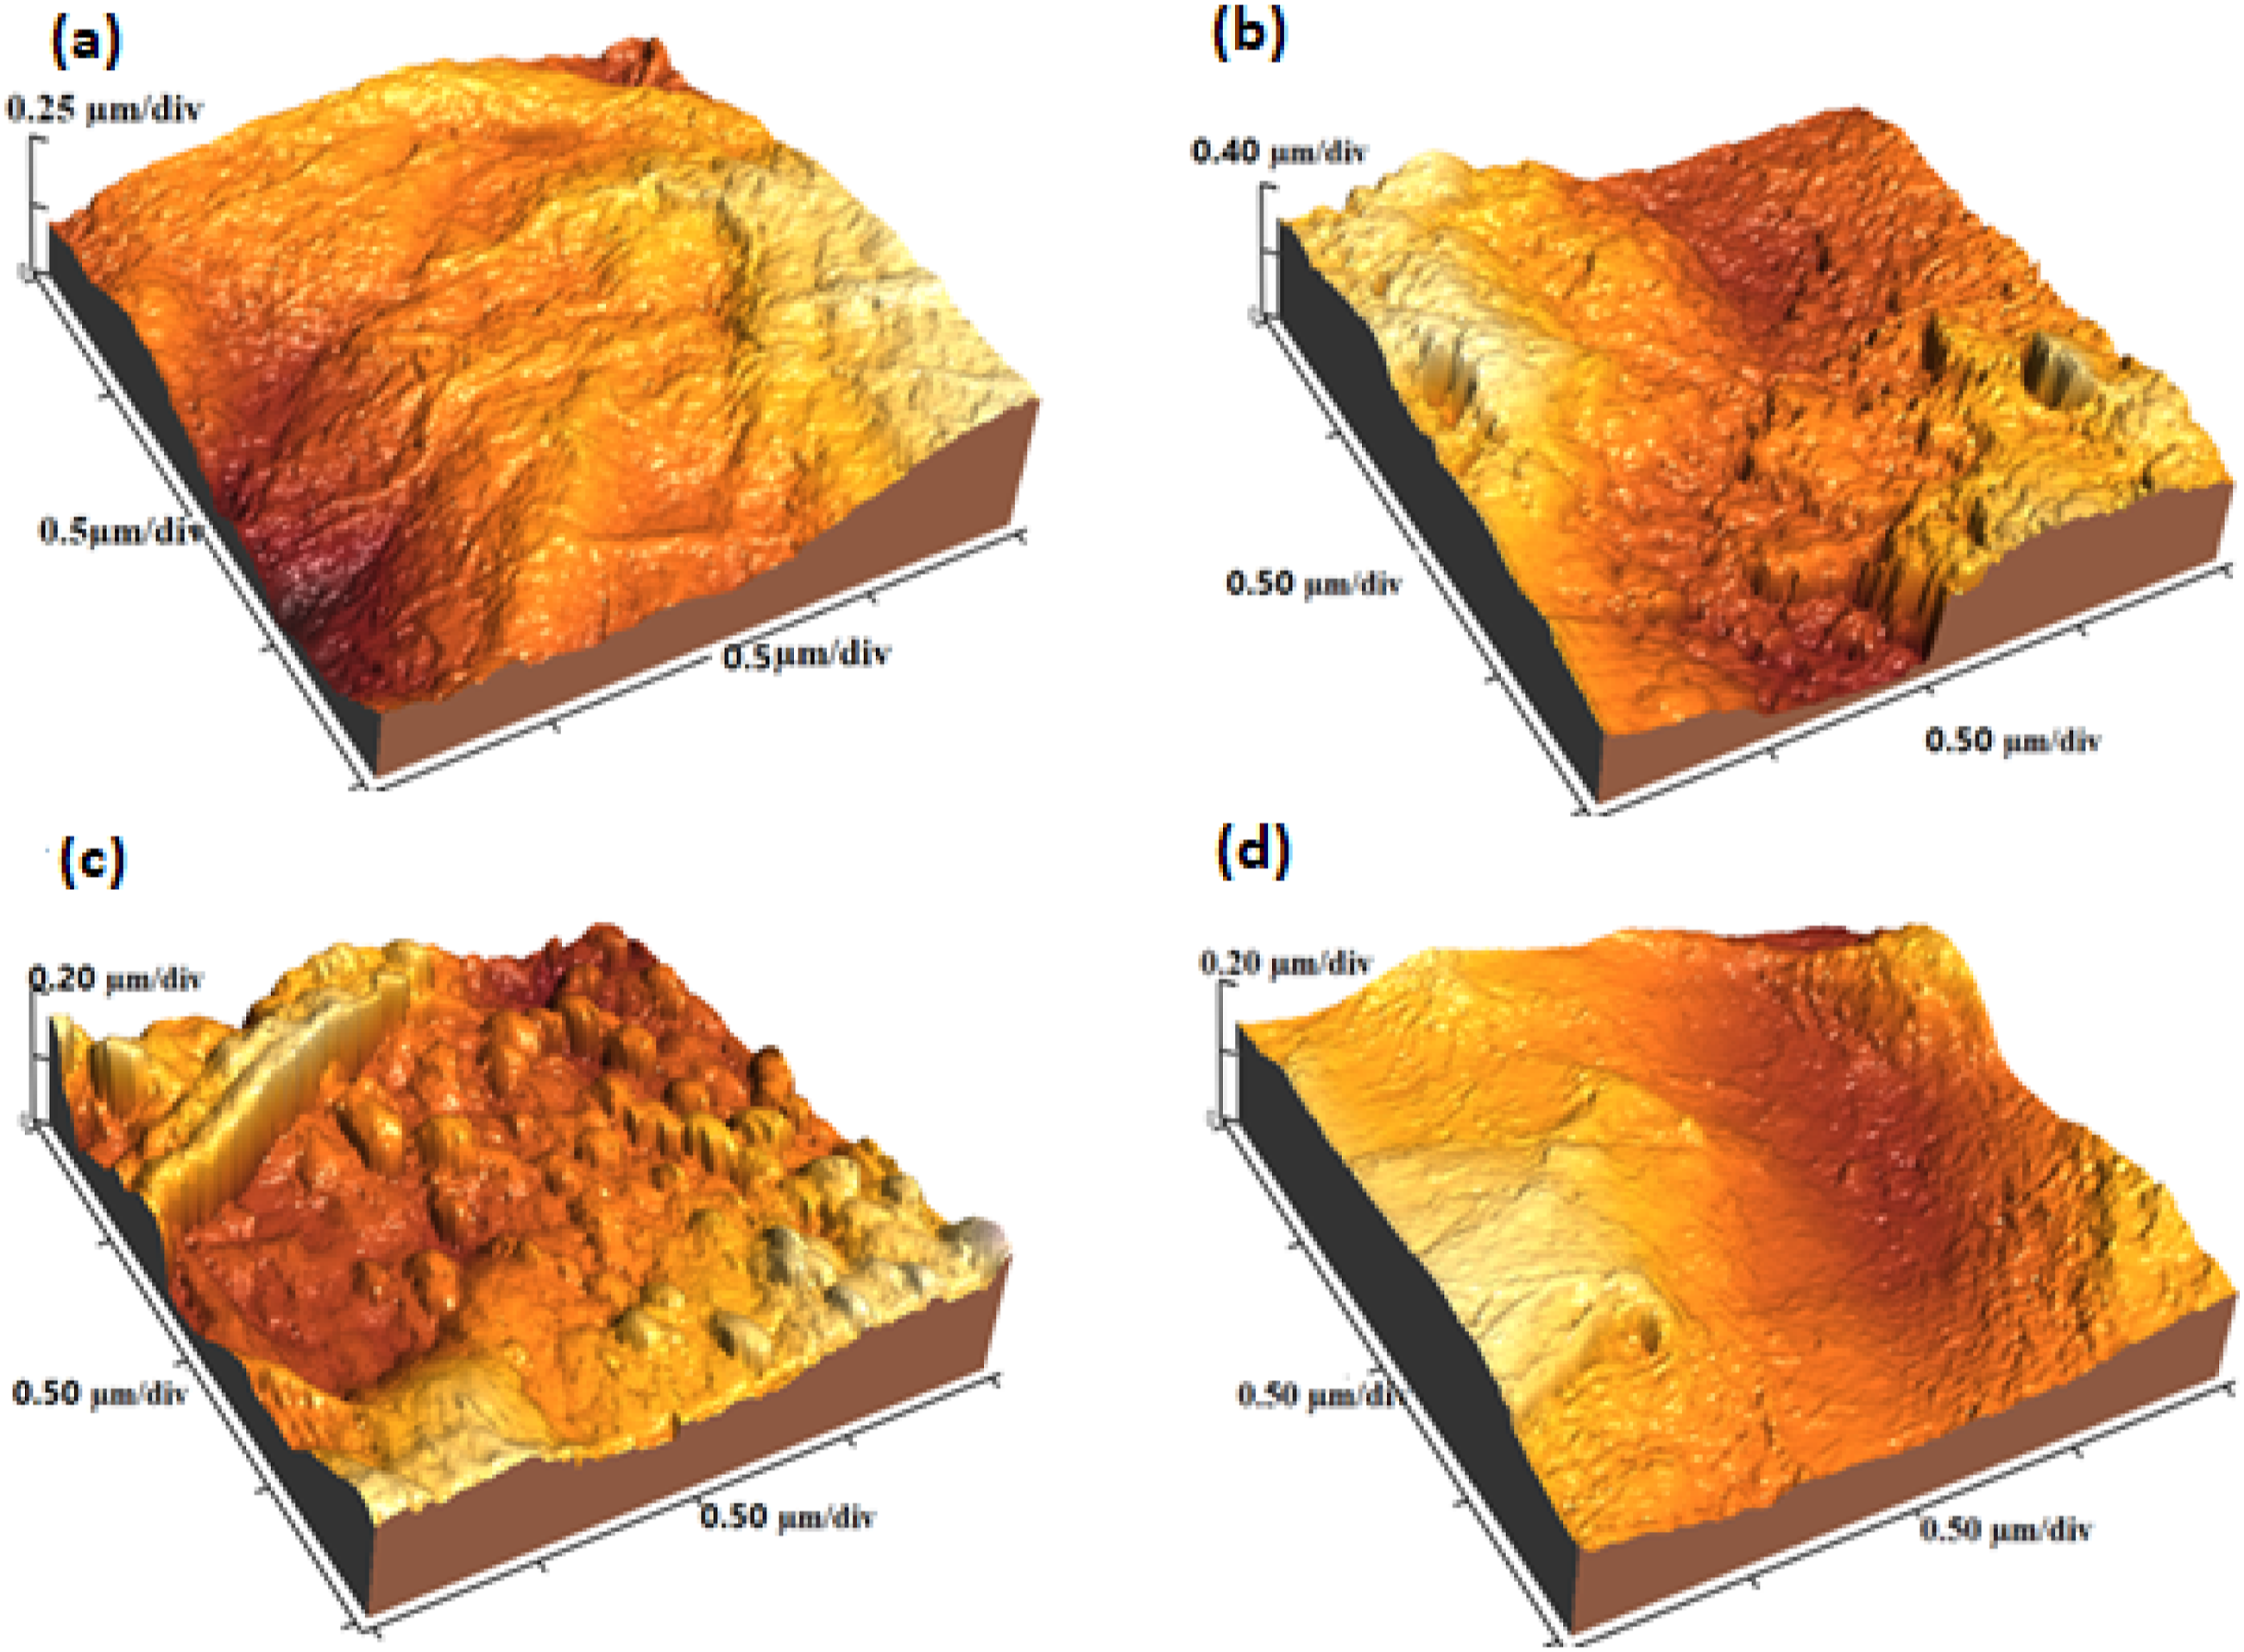
TEM analysis
Figure 9(a) shows HRTEM image of GO which has a wrinkled sheet-shape structure (flakes) while the PANI-EB Figure 9(b) shows mostly spherical uniform composition of nanosheets.
45
The Selected area electron diffraction (SEAD) patterns (insert Figure 9(a) and (b)) proves the crystalline structure of GO with hexagonal crystal and semi crystalline structure of PANI. EB.39,46,47 HRTEM images of (a) GO (b) PANI-EB (c) PANI:PSS/GO with particle size from 10 nm to 60 nm (d) PANI:PSS/GO/PEDOT:PSS with particle size range 10 -100 nm. (Insert represent the SAED of GO and PANI).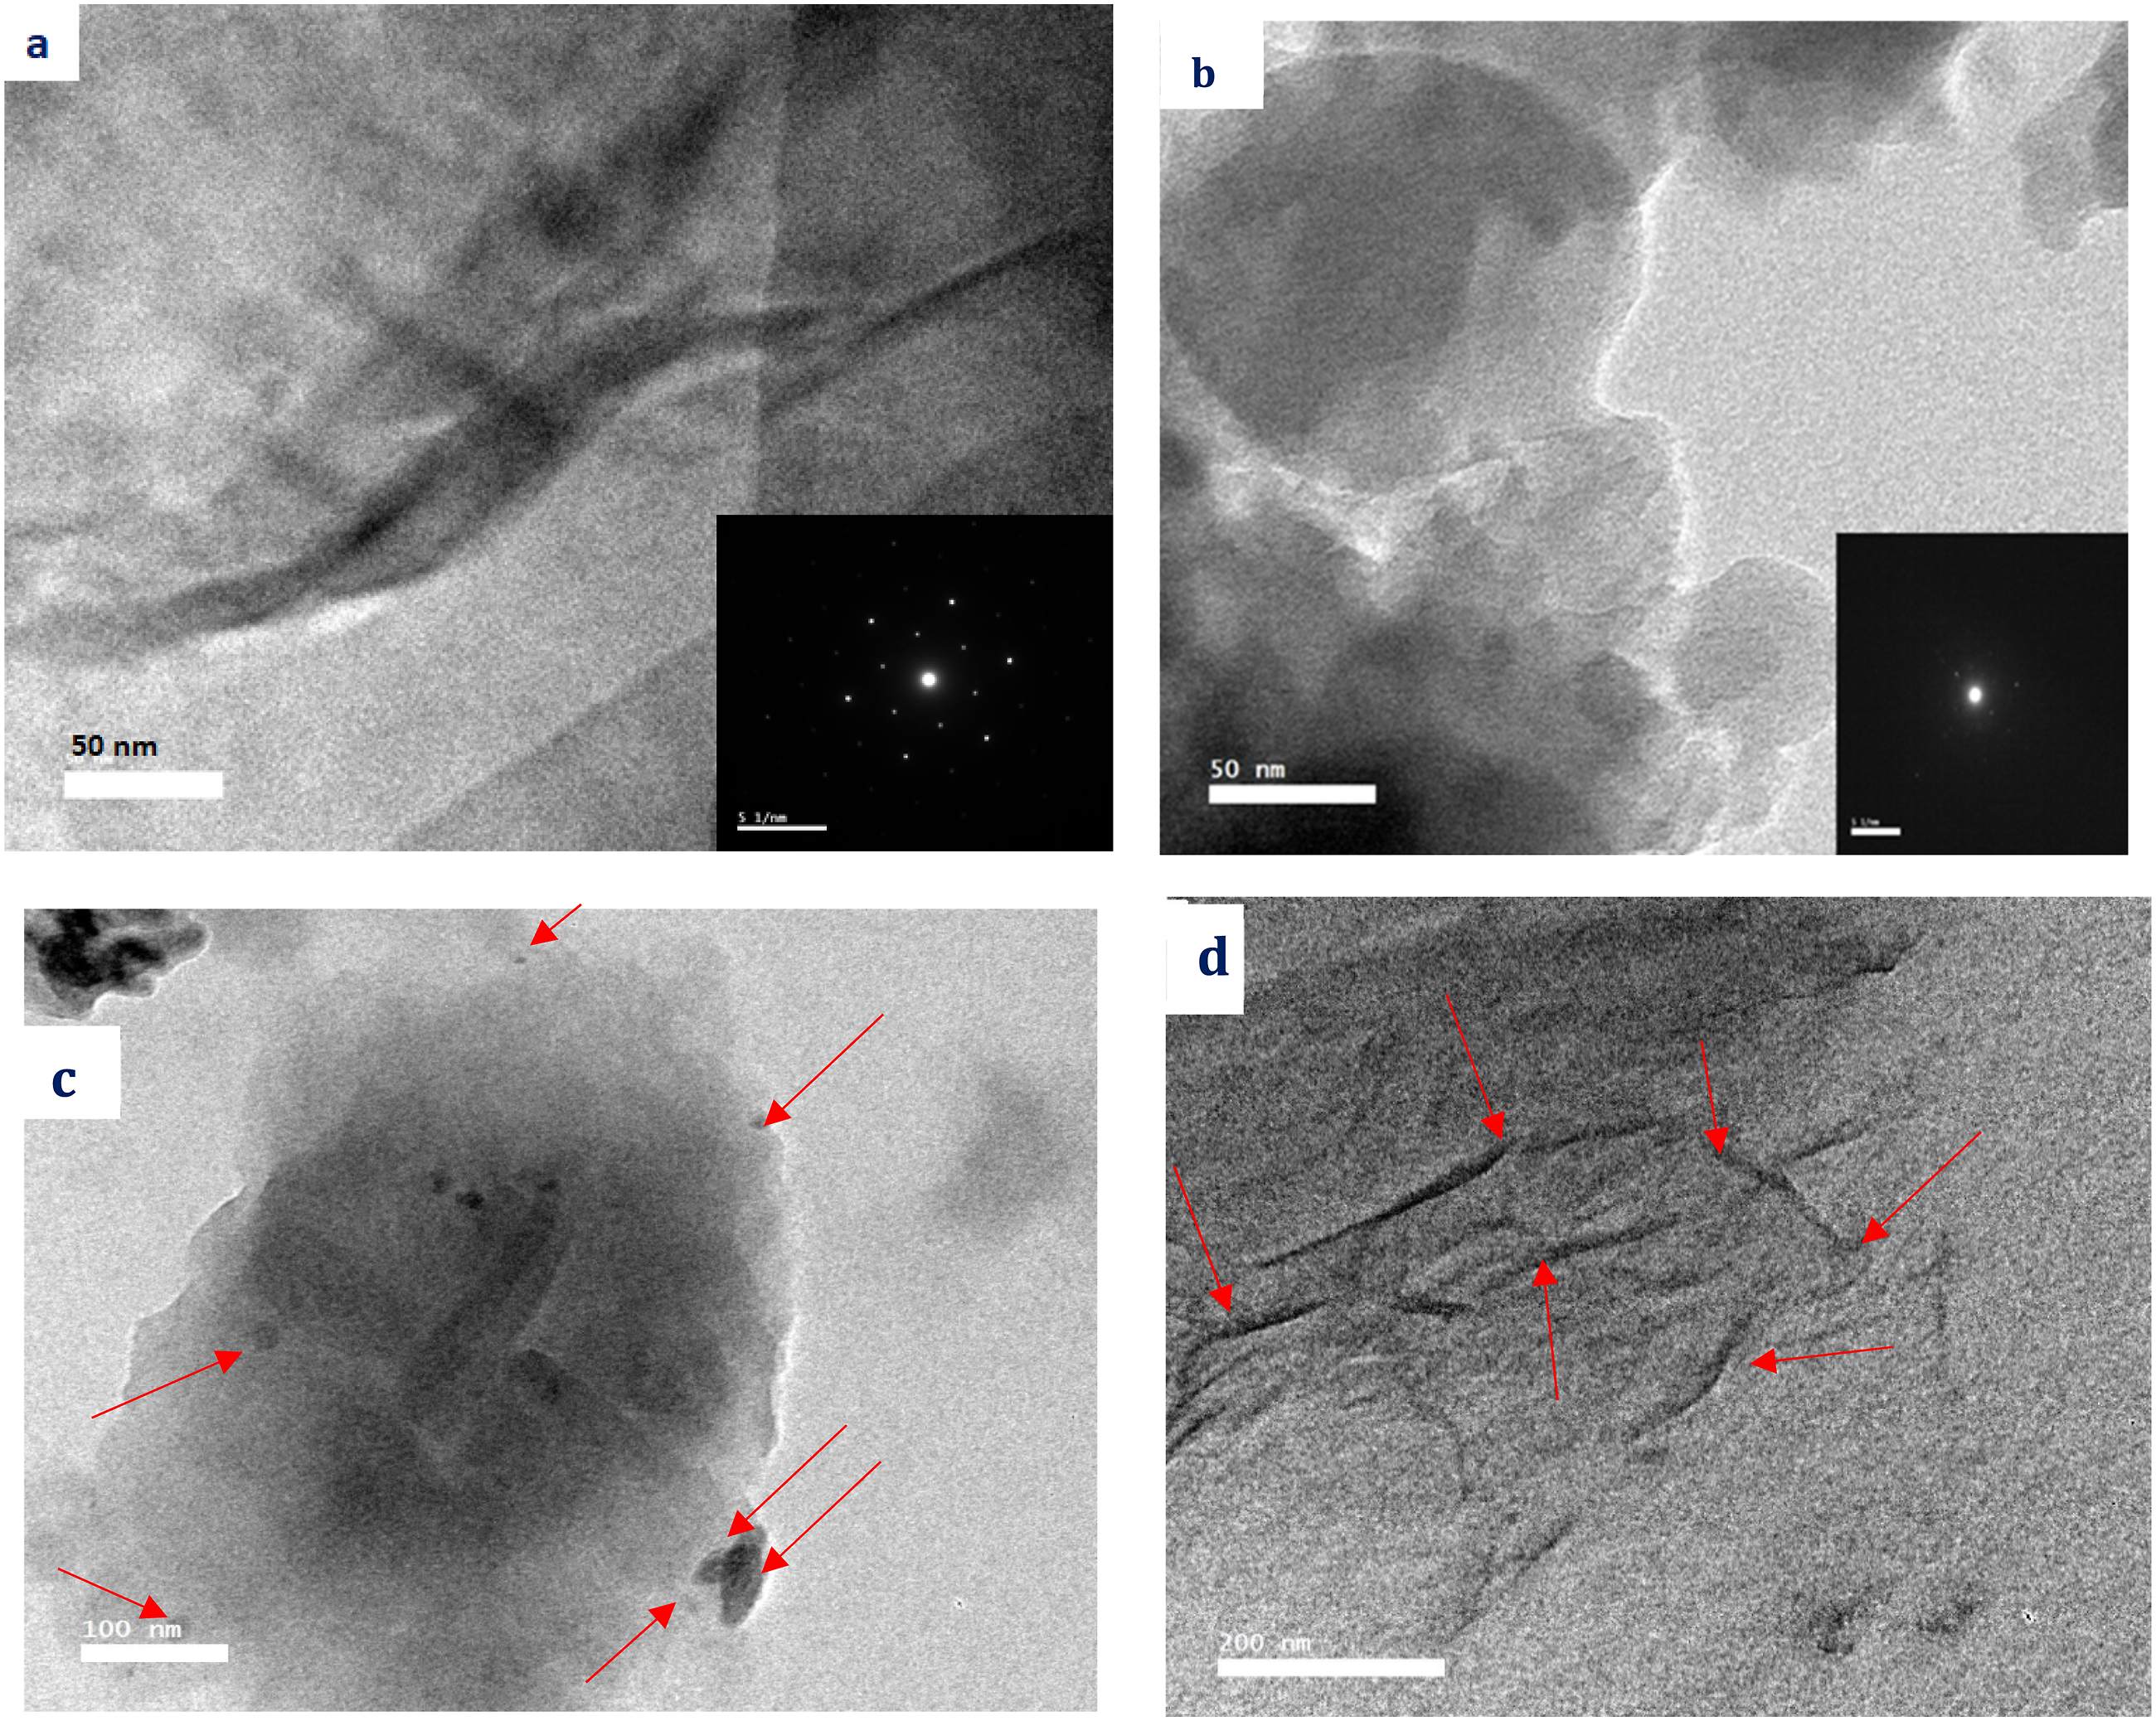
The PANI:PSS/GO, Figure 9(c) shows the GO uniformly distributed among the polymer matrix with particle size ranging from 10 nm to 60 nm. A uniform distribution of GO on PANI:PSS/GO/PEDOT:PSS with particle size range 10 -100 nm can be observed in Figure 9(d). The semi crystalline structure shown of nanocomposite obtained uniform distribution of graphene oxide in the polymer matrix in all cases.
Figure 10 shows EDX patterns demonstrate the quantitative and elemental composition of carbon, oxygen, nitrogen and sulfur (in atomic %) presented in from the same areas shown in Figure 9. The presence of S displays the successful attachment of the doping species onto the polymer. EXD results of PANI:PSS/GO/PEDOT:PSS show 90.44, 3.52, 1.04, and 6.04% of carbon, oxygen, and sulfer, respectively. These data confirm the successful formation of a PANI:PSS/GO/PEDOT:PSS composite. EDX images of (a) GO (b) PANI-EB (c) PANI:PSS/GO (d) PANI:PSS/GO/PEDOT:PSS showing elemental composition of different nanocomposites.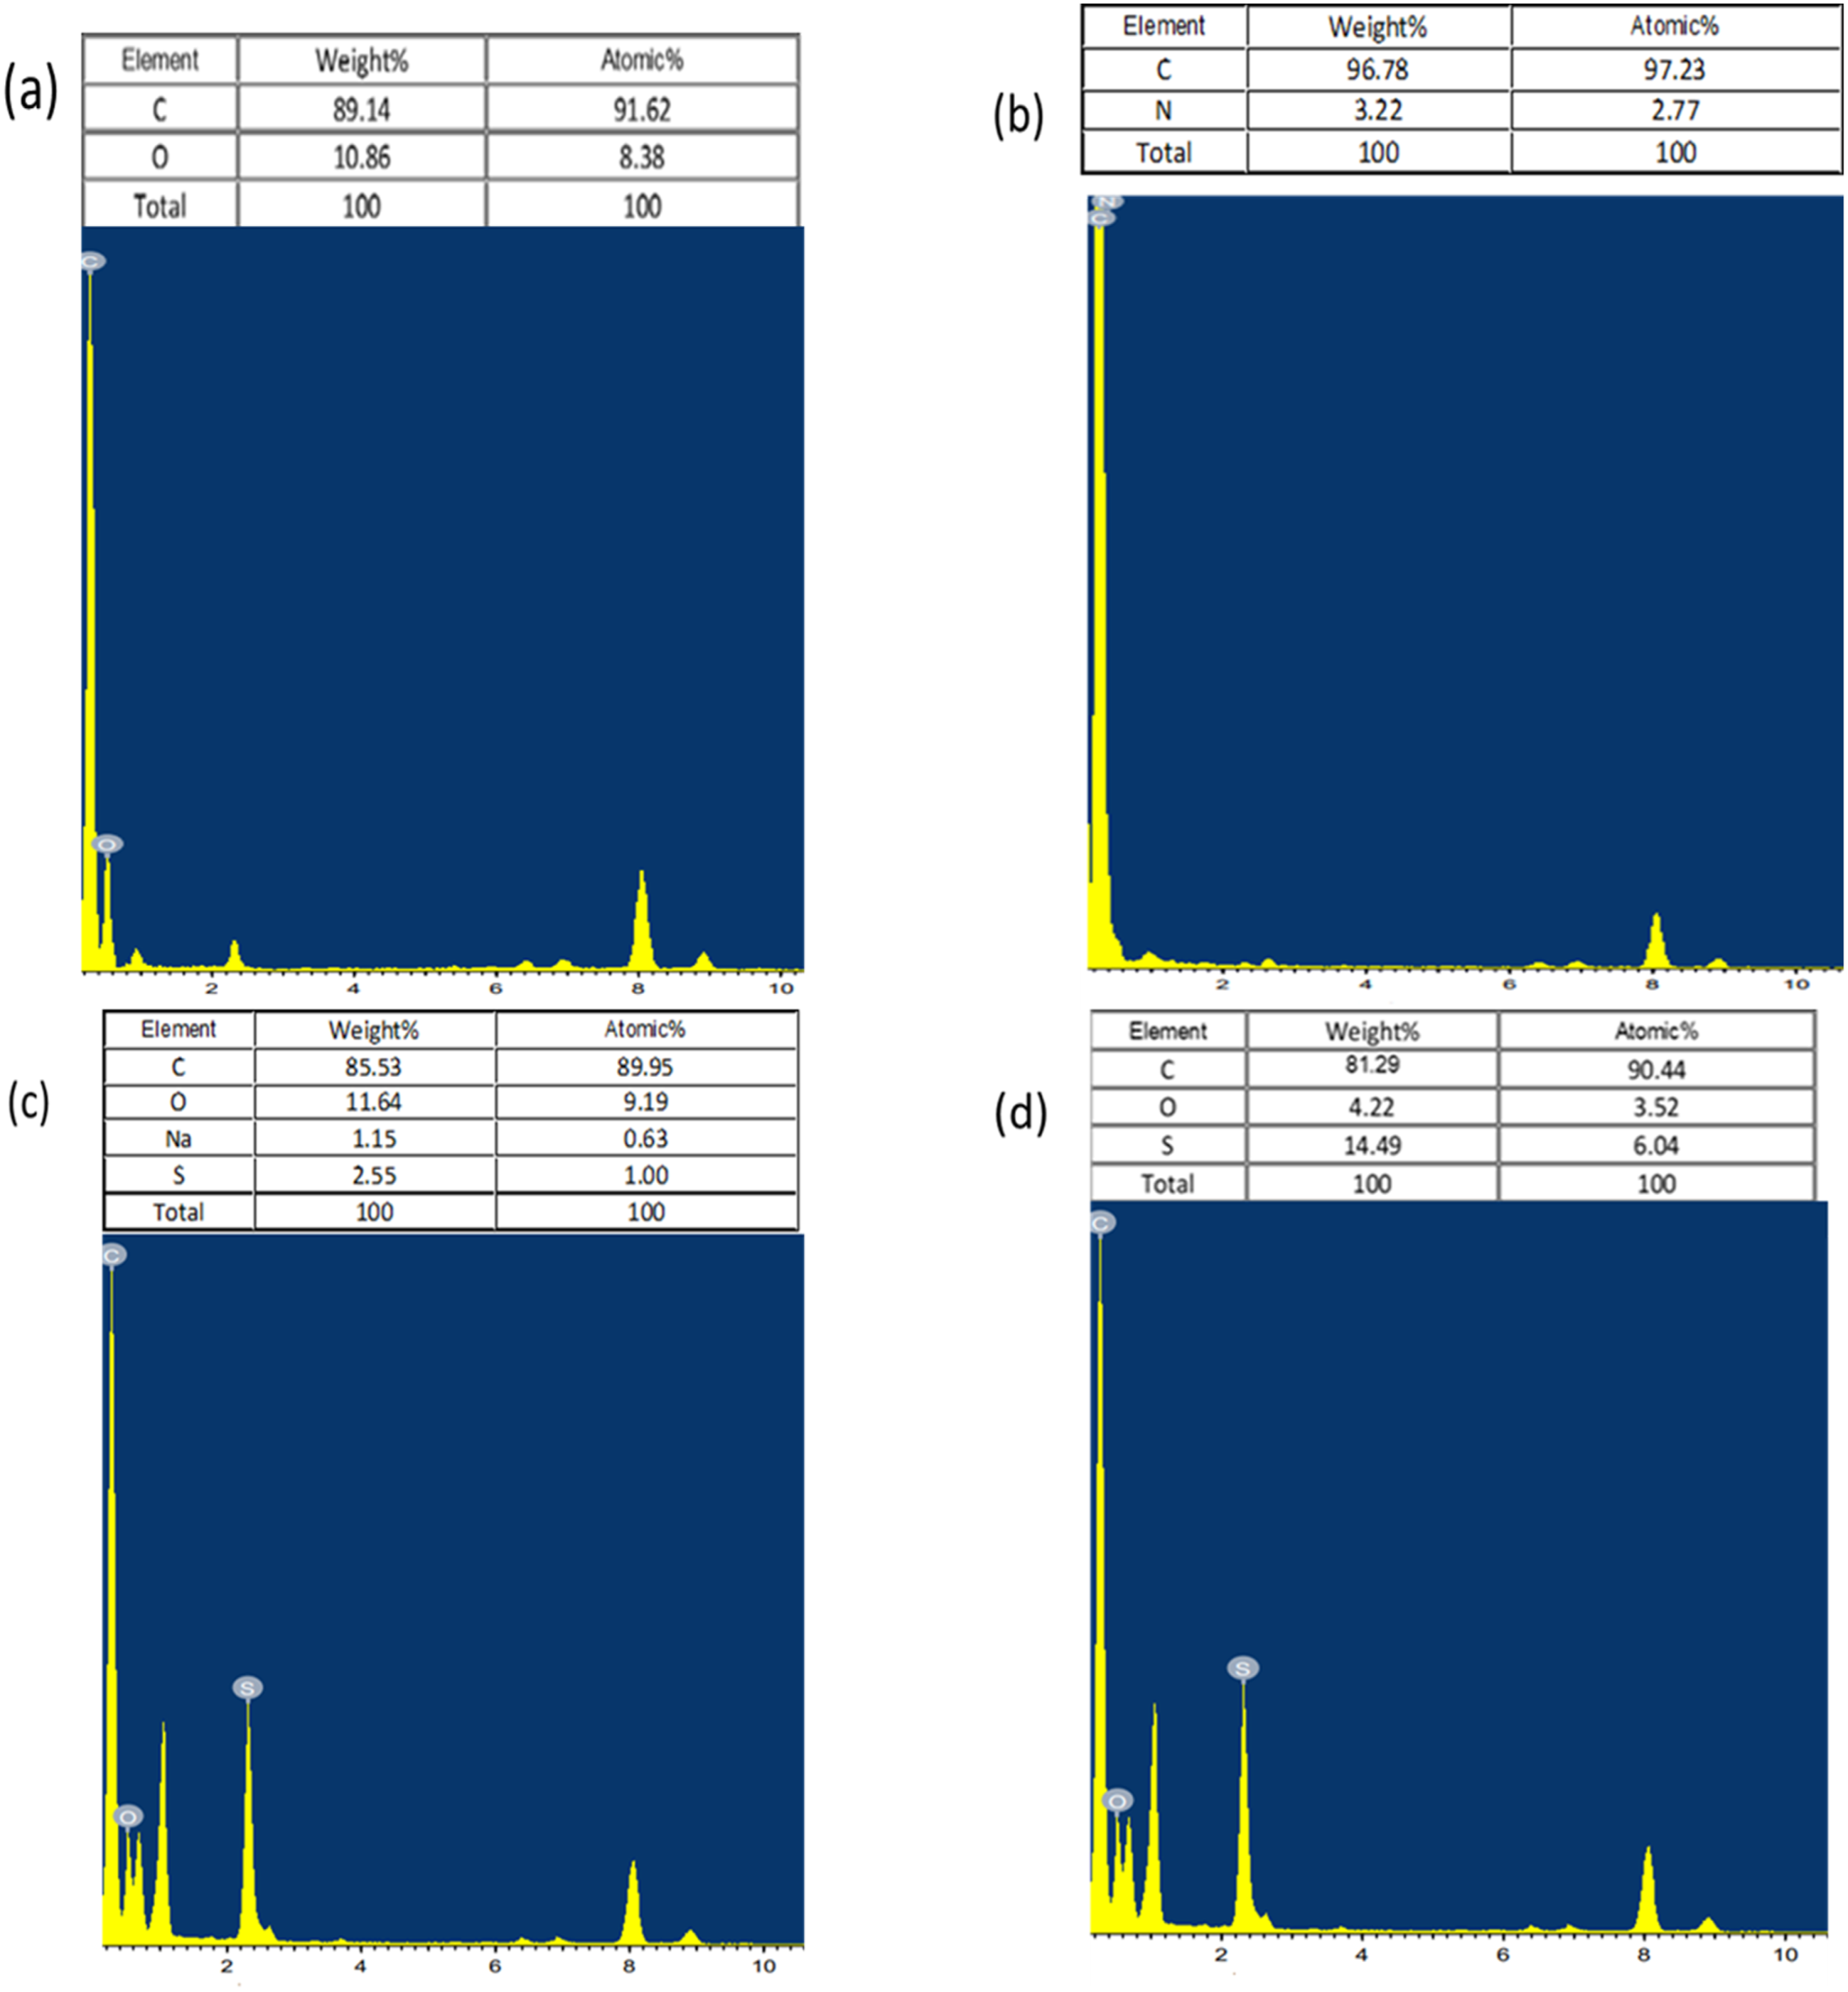
Electrochemical performance of prepared nanocomposite
The electrochemical activity of GO/PEDOT/PSS electrode can be determined by using cyclic voltammetry technique in 0.1 M Potassium hexacyanoferrate electrolyte at different scan rate 10, 25, 50 and 100 mV/s, Figure 11(a). As scan rates increase, the anodic and cathodic current increase. Figure 11(b) confirms the direct relation between the anodic peak current and the square root of scan rates with a regression coefficient (R2) of 99%. This confirms that the electrodes prepared are suitable for electrochemical sensing. These electrodes will be used for nonenzymatic glucose sensing in next publication.
48
(a) Cyclic voltamograms of GO/PEDOT:PSS at various scan rates (b) The linear regression between the anodic peak current and the square root of scan rate.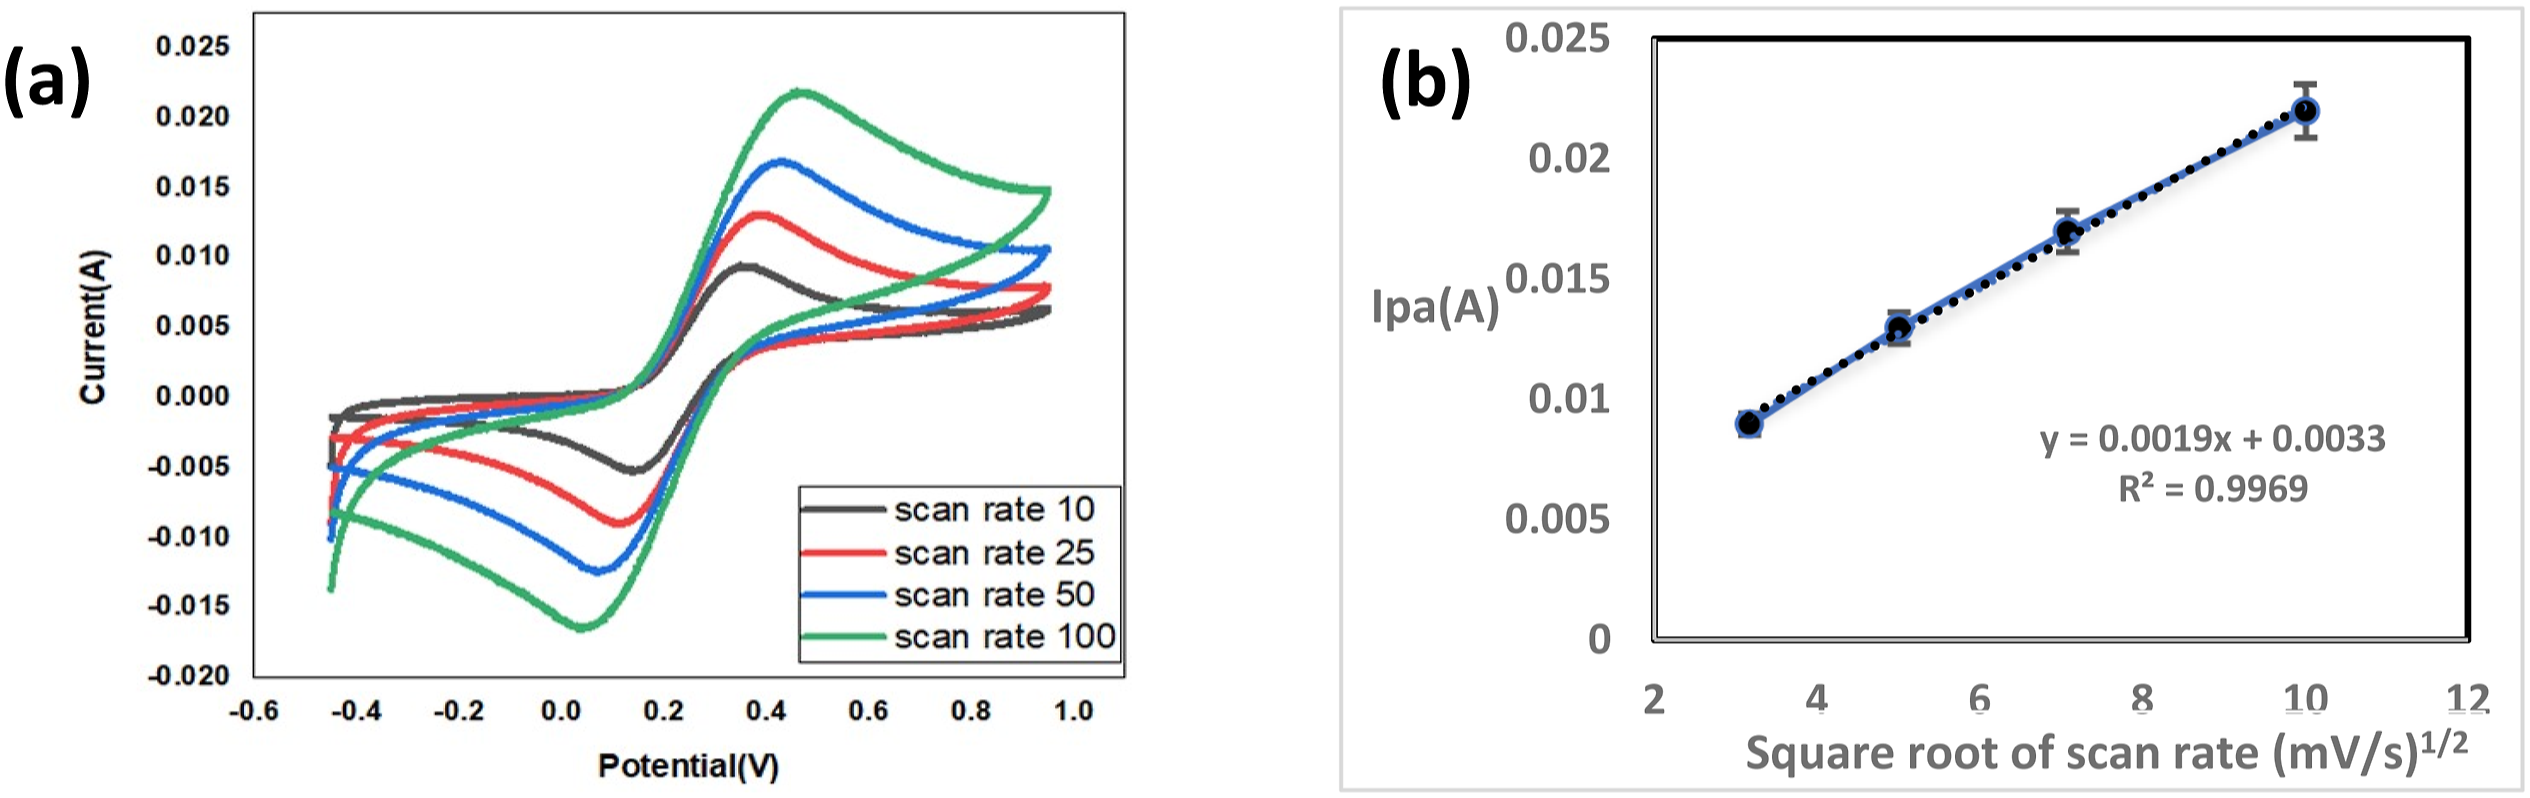
Conclusion
Structures of the GO and modified GO/PANI, GO/PANI/PEDOT nanocomposites were confirmed by Raman spectroscopy and XRD and proved that interlayers spacing between graphene layers increased due to the entry of the polymer in-between the Graphene sheets increasing the d-spacing by 26.9% and 34.6% respectively for both nanocomposites. Raman spectroscopy showed very well-prepared Graphene oxide (high D:G ratio). The GO peaks are predominant in nanocomposites due to activity of GO over the conductive polymer.
FTIR analysis proved the structure of the functional groups present on the electrode surface. The surface morphology was also investigated using SEM and HRTEM and proved the formation of homogenous surface due to the formation of the nanocomposites. The surface roughness was investigated used AFM and minimal roughness of the composites were found to be achieved using PANI:PSS/GO/PEDOT:PSS nanocomposites that was reduced by 20.7%. The prepared electrodes showed excellent electrochemical response in standard electrolytic solution. This shall enable them to be used as working electrodes for non-enzymatic electrochemical sensing of glucose as will be discussed later.
Footnotes
Acknowledgements
The author SY is grateful to Dr. Ahmed Ali Said at King Abdullah University of Science &Technology, Saudi Arabia, for his effort and help in preparation of graphene oxide.
Declaration of conflicting interests
The author(s) declared no potential conflicts of interest with respect to the research, authorship, and/or publication of this article.
Funding
The author(s) received no financial support for the research, authorship, and/or publication of this article.