
Abstract
Single layer graphene oxide (GO)–polyamide 6 (PA6) nanocomposites were produced via the in situ polymerization of ∊-caprolactum dissolved in a water-based dispersion of single layer GO. As prepared GO and nanocomposites containing 0, 0.035, 0.076, 0.44 and 0.65 wt% GO in PA6 were characterized using transmission electron microscopy (TEM), X-ray photoelectron spectroscopy (XPS), atomic force microscopy (AFM), Raman thermal analysis and tensile testing. XPS, AFM and TEM analyses confirmed that the modified Hummers method used to prepare the GO resulted in sheets of oxidized single layer graphene. It was observed using AFM that the in situ polymerization resulted in an efficient poly chain grafting and a reduction in the lateral dimensions of the sheets. The GO/PA6 nanocomposites showed an increased degradation temperature relative to neat PA6, which is an indicative of high levels of interfacial interaction and dispersion. It was observed that the addition of GO reduced the average PA6 molecular weight and acted as nucleation agent for α-form crystallinity while suppressing the formation of γ-form crystals. Mechanical reinforcement was also observed, with a tensile strength of 60.6 MPa recorded for PA6, rising incrementally with increased GO loading to 64.9 MPa at 0.65 wt%.
Introduction
Graphene consists of single-atom-thick, sp 2 bonded two-dimensional carbon layers and has attracted remarkable attention since the discovery of free-standing two-dimension sheets in 2004, due to its unique electrical, thermal and mechanical properties. 1 –7 Graphene is likely to display a stiffness and strength similar to that of in-plane graphite and carbon nanotubes (approximately 1 TPa and 200 MPa, respectively), and therefore graphene has great potential as a high-performance/low-cost polymer reinforcement. 8 As graphene can be readily functionalized, it is an ideal nanofiller material, and it has been reported that enhanced mechanical and electrical properties are observed at much lower loadings than that previously reported for nanoclay-reinforced composites. 9 Graphene also displays unique electrical properties such as ballistic transport and an observed room temperature quantum Hall effect, and it offers the ability to impart electrical conductivity to polymers at low percolation concentrations. 4,5,6 In addition, graphene also possesses high thermal conductivity and initial reports suggest that it shares the exceptional fire-retardant properties previously reported for CNT-reinforced thermoplastics. 10
A number of approaches have been used to both process graphite into a nanoparticulate form and disperse the resulting material in a polymer to form a composite. Expanded graphite (EG) is produced on an industrial scale by heating intercalated graphite. The resulting sheets are typically 30–50 nm thick and have been used to create a range of nanocomposites via in situ polymerization, including polyamide (PA6)/EG, 11 poly(methyl methacrylate) (PMMA)/EG, 12 polystyrene (PS)/EG 13 and polyaniline (PAN)/EG. 14 For example, PA6/EG prepared by in situ polymerization of ultrasoni-cally fragmented EG in ∊-caprolactum resulted in a well-dispersed composite with an electrical percolation threshold of 0.75%. 11 Polymer/EG nanocomposites have also been prepared using solution casting and melt processing techniques. The weak bonding between the graphene planes within the EG is a limiting factor in the mechanical performance of composites produced using the material.
One approach to generate single graphene layers is via graphene oxide (GO) dispersions in water. GO consists of sheets of oxidized graphene (which can be later reduced to a more graphene-like state using hydrazine or thermal treatments) and is produced from graphite on a laboratory scale by acid treatments. 15 –18 In this state, graphene can exist stably as single sheets and is highly oxygenated having hydroxyl and epoxy functional groups on the basal plane and carbonyl and carboxyl groups on the edges. 19,20 The presence of these oxygen moieties renders the sheets hydrophilic, permitting their stable dispersion in water. 21 –23 Stankovich et al. used GO to produce an electrically conductive graphene/PS nanocomposite with a conductivity percolation threshold of 0.1% by casting a solution in dimethylformamide (DMF) of hydrazine reduced phenyl isocyanante-treated GO and PS. 6 This was the first report of an electrically conductive composite containing single layer graphene, stimulating research efforts in the area. 24 Previous studies have shown that solvent casting suitably functionalized CNT using hazardous solvents such as DMF or N-methylpyrrolidone typically results in high dispersion and enhanced mechanical performance. 25 However, solvent casting is not generally acceptable for high volume commercial production due to environmental and health and safety concerns.
Drying GO tends to result in restacking of the graphene sheets. Rapidly heating such dried GO to temperatures between 600 and 1100°C either under vacuum or in an inert atmosphere forces the sheets apart as the intercalated oxygen decomposes into gaseous products. However, this approach does not result in single-atom-thick graphene sheets. For example, Pan et al. reported an average sheet thickness of approximately 10 nm when producing PA6 nanocomposites using such material. 26 The thermal treatment also renders the material, often referred to as functionalized graphene sheets (FGS), electrically conductive as it has returned to a more graphitic state, and subsequent dispersion using sonication in a suitable solvent can be used to improve exfoliation. 27,28 Several studies have produced conductive films based upon this material. 29,30 Ramanathan et al. have reported PAN, polyacrylamide and PMMA nanocomposites incorporating FGS produced by solvent casting. 31 It was noted that the addition of FGS resulted in a larger shift in the glass transition temperature together with enhanced mechanical performance compared with EG or single-walled nanotube nanocomposites. Other groups have also produced FGS nanocomposites using PS and silicone matrices. 32,33 Steurer et al. employed an additional thermal treatment at 700–1000°C to lower resistivity, yielding what was referred to as thermally reduced GO. Nanocomposties with percolation thresholds of 3–8 wt% were produced using this material via melt processing with styrene-acrylonitrile, polycarbonate, polypropylene (PP) and PA6. 34
Since 2009, several groups have reported in situ approaches to prepare single layer GO composites using PMMA, polypyrrole and PP. 35 –37 In addition Lee et al. have used an atom transfer radical polymerization method to attach styrene, butylacrylate or methyl methacrylate polymer brushes to GO. 38 This functionalized material was then used to prepare polymer composites by solvent casting. 38 These recent studies are characterized by their ability to produce composites containing single-layer graphene reinforcement.
In this study, we used in situ polymerization to produce composites of single-layer GO in PA6. Several previous studies have prepared CNT/PA6 nanocomposites via a similar in situ polymerization method. 39 –41 PA6 is a commercially important semi-crystalline engineering thermoplastic commonly referred to as nylon 6. Xu and Gao previously used in situ polymerization to prepare PA6 composites containing up to 10 wt% GO. 42 However, the method applied by Xu and Gao involved drying the GO which was produced using the Hummers technique. It has been previously reported that drying and reducing GO thermally tends to result in restacking of the sheets and that dispersing this dried material in a polymer is challenging. 6 In this study, the in situ polymerization of a dispersion of single-sheet GO in a monomer/water solution was used to produce graphene composites, removing the need for drying of the GO dispersion. Water is frequently used as an initiator in the ring-opening polymerization of ∊-caprolactum to produce PA6. It is therefore possible to form a homogeneous polymerizable solution by ultrasonically mixing GO/water dispersion and ∊-caprolactum. A similar approach has been previously used by Zhang et al. to prepare PA6 composites containing up to 2 wt% GO. 43 However, the study reported herein investigates the previously unreported effect of in situ polymerization on the dimensions of the GO sheets and investigates the mechanical properties of such composites. The effect of adding GO on the polymerization process has also been studied by measuring the molecular weight distribution using gel permeation chromatography (GPC).
Experimental
Preparation of GO dispersions
GO was produced by a modified-Hummers method. 22 Graphite flake of 5 g (Sigma-Aldrich, Dorset, England, code 332461), 3.8 g of sodium nitrate and 169 ml of concentrated sulfuric acid (H2SO4) were placed in an ice-cooled flask and stirred, while 22.5 g of potassium permanganate was added over a 1 h period. The material was removed from the ice bath and further stirred for 5 days until a dark brown slurry was obtained which was rinsed twice using distilled water. To lower the viscosity and hence increase the settling within the slurry necessary for purification, 500 ml of 5% H2SO4 was added over a 1 h period while being stirred. Subsequently, 25 ml of 30% H2SO4 was added drop wise and further mixed for 2 h to further oxidize partially reacted material. Upon settling, the flask was decanted hence removing the impurities. The mixture was further purified by resuspending and precipitating the remnant solids in a 500-ml aqueous solution of 3% H2SO4 and 0.5% hydrogen peroxide; upon settling (2 days), the supernatant was again removed from the precipitate to purify the GO precipitate. This process of suspension, precipitation, decanting and resuspending was repeated two further times to remove the contaminants. The resulting 500 ml dispersion had a solid content of 3.7 mg ml−1 and was used to prepare the PA6/GO samples after adjusting the pH to 7.0 using ammonia solution. GO concentrations of 3.7, 7.6, 43.6 and 65.3 mg ml−1 were prepared by evaporating the pH-adjusted GO/water dispersion in a vacuum oven at 40°C for periods of up to several weeks. These dispersions were used to prepare composites with nominal 0.037, 0.076, 0.44 and 0.65 wt% GO assuming full conversion of the ∊-caprolactum to PA6.
In situ polymerization of GO/PA6 nanocomposites
To prepare the polymerizable solution, 5 g of GO/water dispersion was tip sonicated with 50 g of ∊-caprolactum for 40 min at 80°C. Polymerization was then carried out in a conical flask on a temperature-controlled hot plate with magnetic stirring under an argon atmosphere using 10 wt% 6-aminocaproic acid as an initiator. The polymerization temperature was maintained at 150°C for 30 min, 200°C for 30 min, 225°C for 30 min and then finally 250°C for 5 h. The resulting nanocomposite was poured into boiling water and subsequently washed for 2 h in boiling water five times to remove any unreacted monomer. The process yielded approximately 4.8 g of material, and the samples were then dried overnight in a vacuum oven at 85°C. In order to determine the effect of sonication and in situ polymerization on the GO sheets, free PA6 in the composite was removed using a suitable solvent. In order to remove free PA6, 1 g of 0.65 wt% GO/PA6 composite was dissolved overnight in 50 ml of 85% formic acid and the resulting solution was centrifuged in 10 ml batches at 4000 r min−1 for 4 h. Of which, 9.8 ml was then decanted from each tube and the volume was made back up to 10 ml using formic acid. This washing process was then repeated to remove any remaining free PA6 from the PA6-grafted GO sheets prior to atomic force microscopy (AFM) testing.
X-Ray photoelectron spectroscopy
X-Ray photoelectron spectroscopy (XPS) of the samples was carried out using a Axis Ultra DLD spectrometer (Kartos Analytical Ltd., UK). Spectra were recorded by employing monochromated aluminium Kα X-rays (hν = 1486.6 eV) operating at 15 kV and 10 mA at a pressure of 2.66 × 10⁻⁶ Pa. A hybrid lens mode was employed during analysis (electrostatic and magnetic), with an analysis area of approximately 300 × 700 μm 2 and a take-off angle of 90° with respect to the sample surface. Sample charging effects on the measured positions were corrected by setting the lowest component of the C1s spectral envelope to 285 eV.
Atomic force microscopy
Samples for AFM analysis were prepared by drying the GO dispersions onto a treated silicon substrate. The measurements were carried out with a Dimension DI 3100 SPM system (Veeco Instruments Inc., USA) operated in tapping mode using TESP silicon probes (approximately 40 N m−1 stiffness, ∼300 kHz resonant frequency). The images were acquired using gentle tapping set points at 1 Hz scanning frequency.
Raman spectra
The samples were excited using the 633 nm line of helium–neon laser and the Raman spectra were collected in a backscattering geometry, in a charge-coupled device camera, using an ISA Labram 300 Raman spectroscope (Horba Ltd., Japan). The spectra were taken for a 20s period between 1000 and 2000 cm−1, and the laser spot size and laser power on the samples were approximately 1 µm and 2 mW, respectively.
Transmission electron microscopy analysis
Samples of GO were prepared by drying diluted GO/water dispersion onto a holey carbon grid. The GO/PA6 composites samples were prepared using an ultramicrotome fitted with a diamond knife. The images were obtained at 200 kV using a model 2010 TEM (Jeol Ltd., Japan).
Thermal analysis
Thermogravimetric analysis (TGA) was conducted using TA Instruments (USA) model Q500 with a sample size of approximately 10 mg in a flowing nitrogen atmosphere over the temperature range of 20–600°C at 5°C min−1. Differential scanning calorimetry (DSC) was carried out using a TA Instruments DSC model Q100. The approximately 5 mg samples were dried overnight at room temperature under vacuum, stored in a desiccator and conditioned in the DSC at 50°C for 2 min prior to analysis to remove any absorbed water. 44 Two samples for each sample type were run from 20°C to 300°C at 10°C min−1 under a flowing nitrogen atmosphere.
Gel permeation chromatography
Gel permeation chromatography (GPC) was carried out using a HFIP gel guard plus 300 × 7.7 mm (Polymer Laboratories (PL), International Ltd., UK) column at 40°C with a nominal flow rate of 0.8 ml min−1. The sample of 20 mg was dissolved in 10 ml of 1,1,1,3,3,3,-hexafluoro-2-propanol with 25 mM sodium triflouroacetate (NaTFAc). The solutions were left overnight to dissolve and then filtered through a 0.45-μm polytetrafluoroethylene filter. The GPC system was calibrated using a PMMA standard and the results are expressed as PMMA equivalent molecular weights. The results of duplicate runs are reported.
Tensile testing
ISO 527 type 5A dog bone samples for tensile testing were injection moulded using a Thermo Fisher Scientific (USA) Minijet II with cylinder and mould, temperatures and pressures of 255°C, 55°C, 200 bar and 100 bar, respectively. A total of 5 samples were tested according to ISO527 for each sample type using a Zwick Z100 machine fitted with a calibrated load cell at a cross head speed of 100 mm min−1.
Results and discussion
An ultraviolet–visible (UV/Vis) absorption spectrum of the GO/water dispersion as produced by the Hummers method displayed a characteristic GO peak at approximately 230 nm. 45 UV/Vis studies also revealed that the maximum stability of the optimum GO/water dispersion was achieved by adjusting the pH to 7 using ammonia. A maximum solubility of approximately 0.6 mg ml−1 was observed, which is in general agreement with that previously reported in literature. 45,46 XPS was used to investigate the surface chemical state of GO and the C1s spectra is shown in Figure 1. The spectrum clearly indicates a considerable degree of oxidation with peaks at 285, 286.9, 287.3 and 288.9 eV attributed to C–C, C–O–C, C–OH, and C(O)O, respectively. 46,47 Equivalent peaks were also observed in the O1s spectra. The abundance of epoxide (C–O–C) functionality in particular is indicative of basal plane oxidation and is a characteristic of highly exfoliated GO. 47
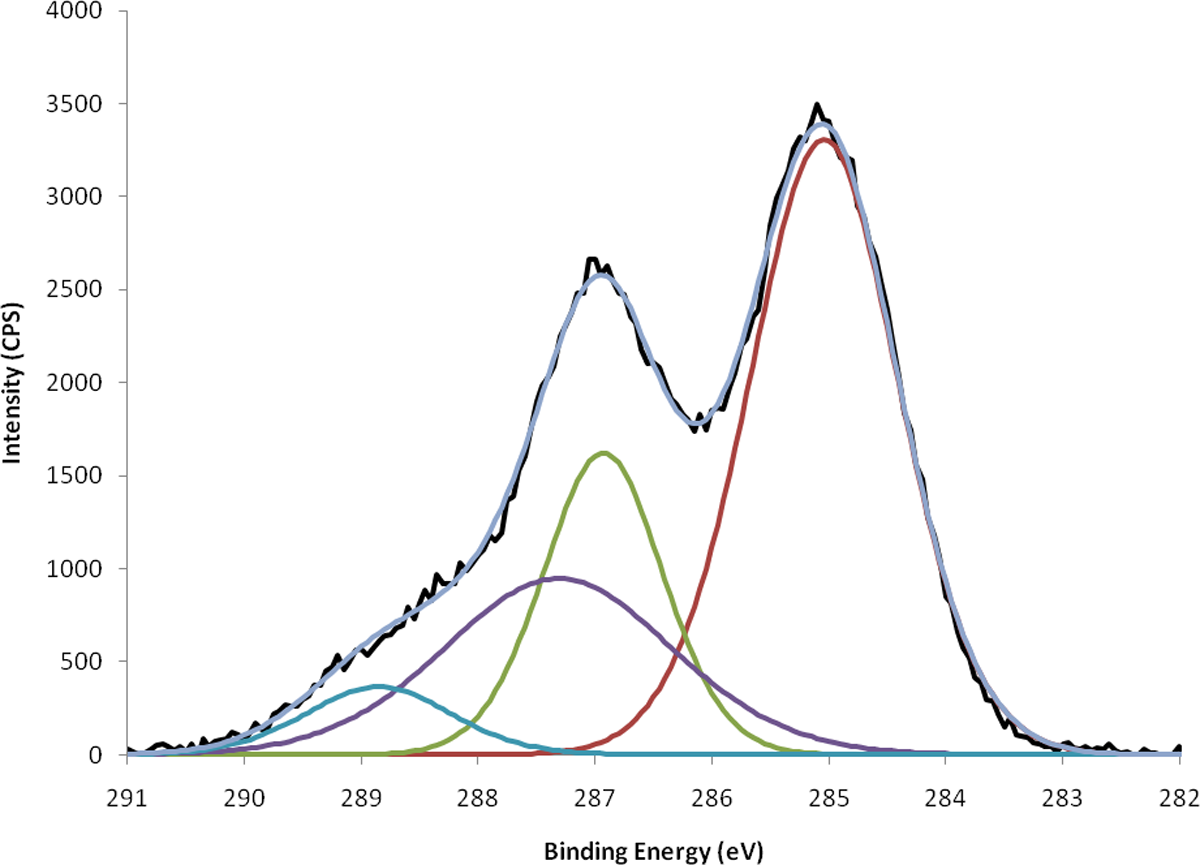
The C1s spectra of graphene oxide.
A tapping mode AFM image (Figure 2) shows a number of GO sheets prior to sonication and in situ polymerization, with typical lateral dimensions of the order of 0.1–0.5 μm. The AFM studies revealed that the GO dispersions consist almost exclusively of single-layer GO sheets. This is in contrast to the EG and FGS graphite stack materials which result from thermal preparation techniques. Figure 3 depicts a higher magnification AFM image of the GO sheet appearing in the bottom centre of Figure 2. An average sheet thickness of 1.5 nm (Figure 3) was recorded, which corresponds to a single GO layer. The theoretical thickness of dry single layer of GO is approximately 0.78–0.82 nm, which agrees closely with x-ray diffraction (XRD) measurements of GO stacks. 30,48 However, the measured thickness increases when GO is deposited on a substrate due to absorbed water and wrinkling effects, with reported average thicknesses measured by AFM of 1.3–1.81 nm for a single layer. 49,50 The PA6-grafted GO sheets obtained from the 0.65 wt% composite have a constant thickness of approximately 9 nm as a result of the polymer chain attachment (Figure 4). Xu and Gao reported a similar thickness of approximately 8 nm for GO sheets grafted with PA6 which had been removed from composites prepared using dried GO material. 42 Comparing figure 2 and 4 it can be seen that the sonication and in situ polymerization have significantly reduced the average sheet size and generated a large amount of smaller sheet fragments. This effect has not been previously reported.
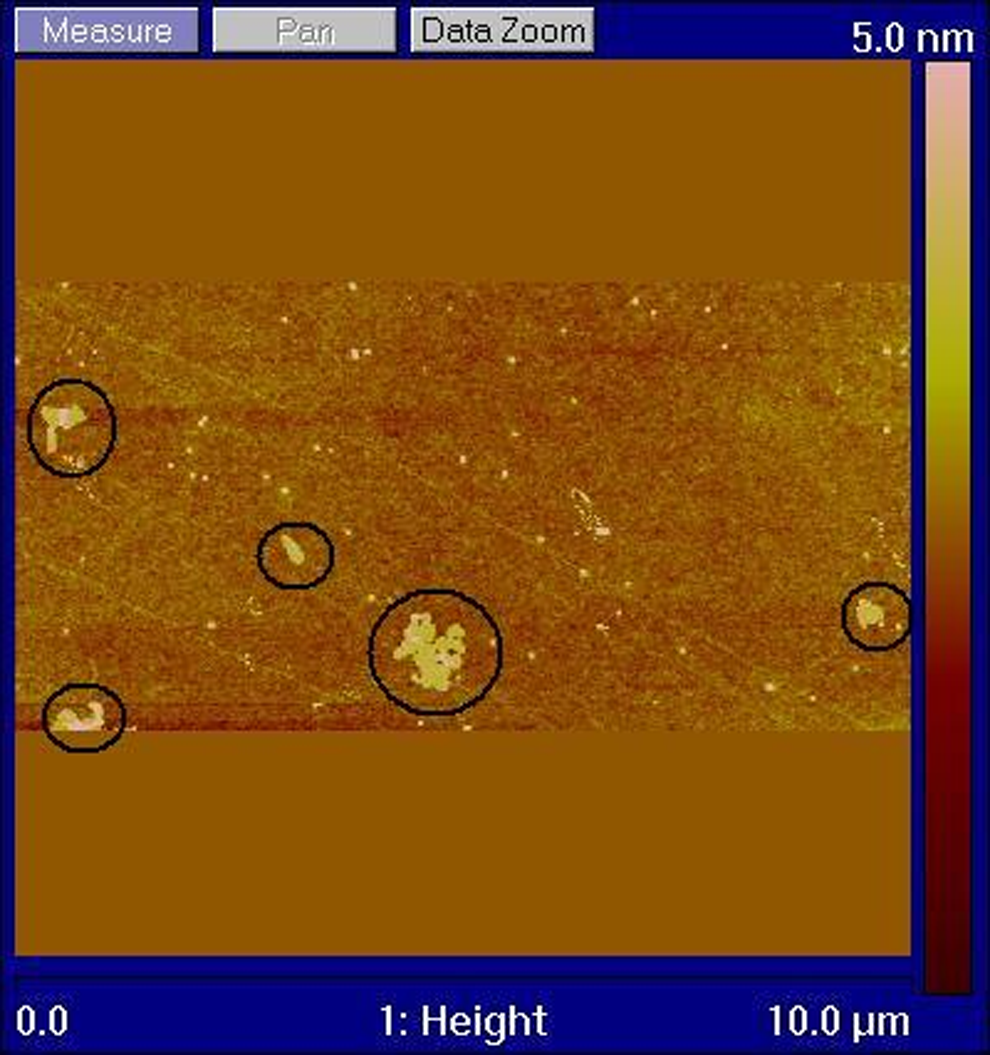
Atomic force microscopy tapping mode image of GO sheets on silicon.
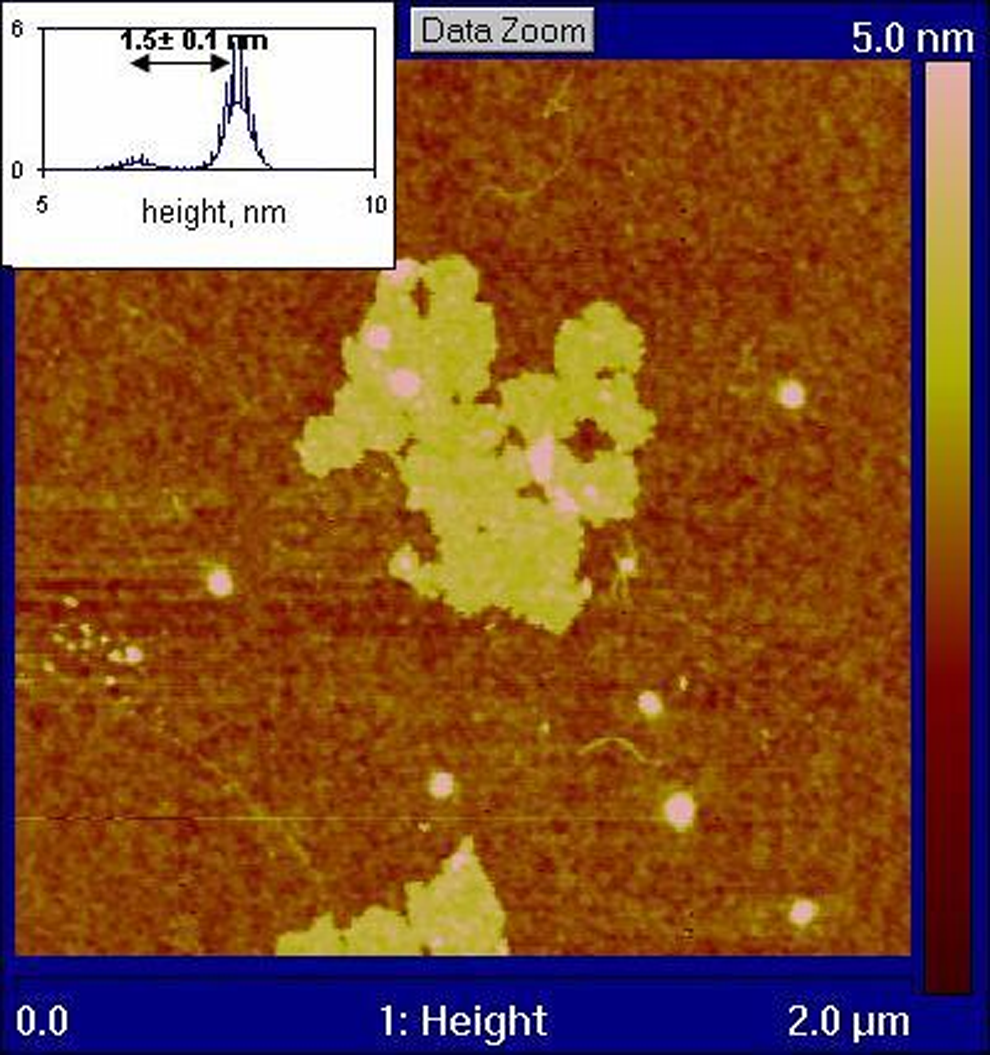
High magnification image of the flake circled in Figure 2 with height distribution.
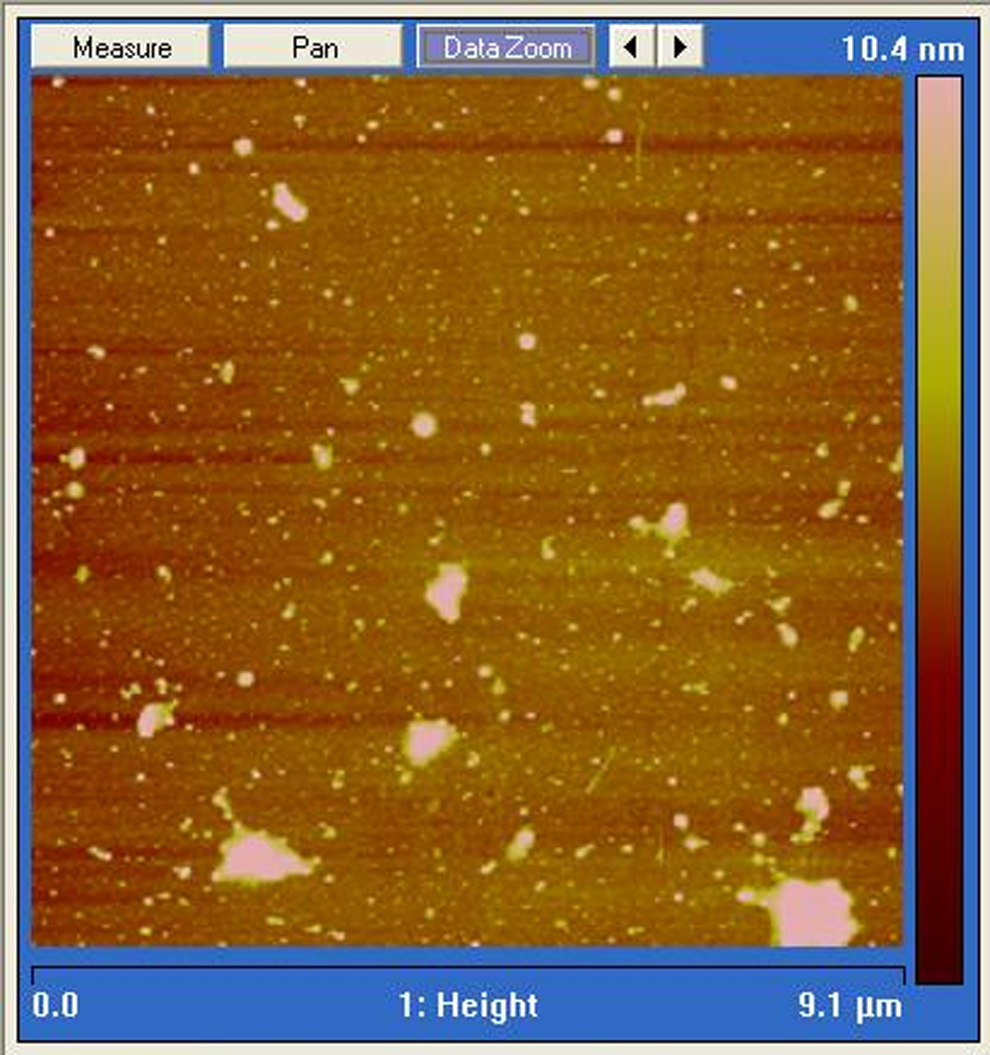
Atomic force microscopy image of polyamide-6-grafted graphene oxide sheets.
Raman spectra were also used to characterize the GO prior to in situ polymerization. The Raman spectra of GO and graphite are shown in Figure 5, illustrating the development of a prominent D band (1351 cm−1) and broadening of the G band in the GO as compared to the graphite precursor. Similar differences between the Raman spectra of graphite and GO have been reported previously. 51 In carbon materials, a prominent D band and broadening of the G band as observed in Figure 5 are universally recognized as indicative of disorder, probably resulting from both folds in the graphene sheets and the disruptive presence of oxygen. 52 It has been reported that the G band is less prominent than the D band after the reduction of GO by hydrazine, which also renders the insulating GO electrically conductive. 51 A shift in the peak position of the G band from 1580 to 1592 cm−1 is also observed in Figure 5 as a result of the graphite to GO transformation. This shift has been previously observed in single-layer GO and was attributed to the development of C=C. 53
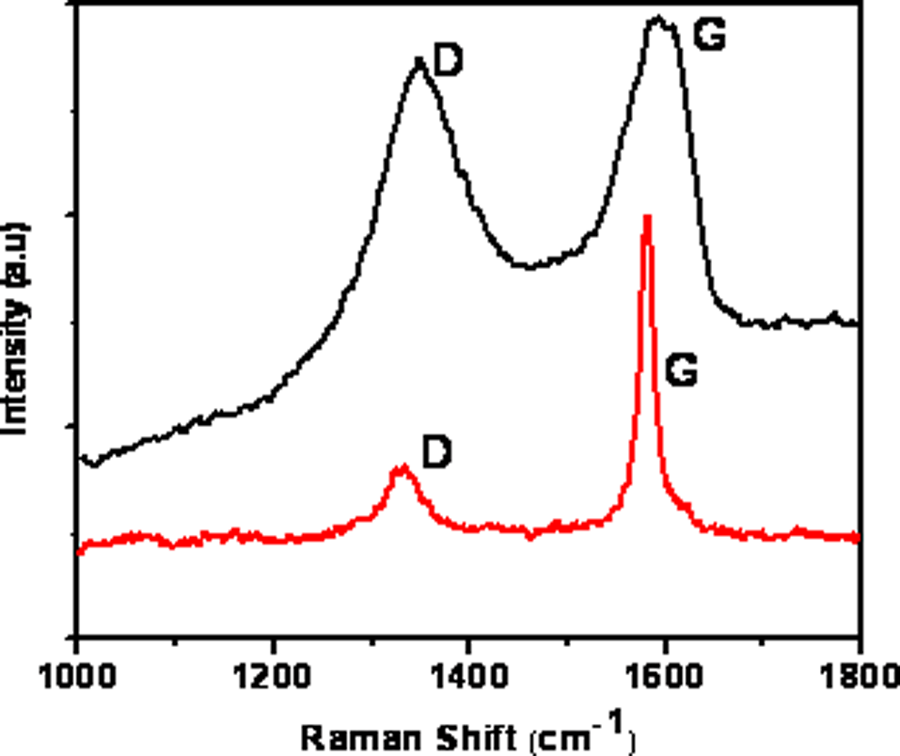
The Raman spectra of graphite (top) and the graphene oxide (bottom).
Transmission electron microscopy (TEM) bright field images of GO dispersion deposited onto a holey carbon grid confirm that the GO consists of individual, thin, crumpled sheets (Figure 6). The distribution of the GO in the resulting 0.44 wt% nanocomposite shows that high level of dispersion has been achieved (Figure 7). In agreement with the AFM results, it can be seen that the sonication and polymerization have reduced the sheet size compared with the ‘as-synthesized’ GO. This may be partly due to the effect of sonication. 54
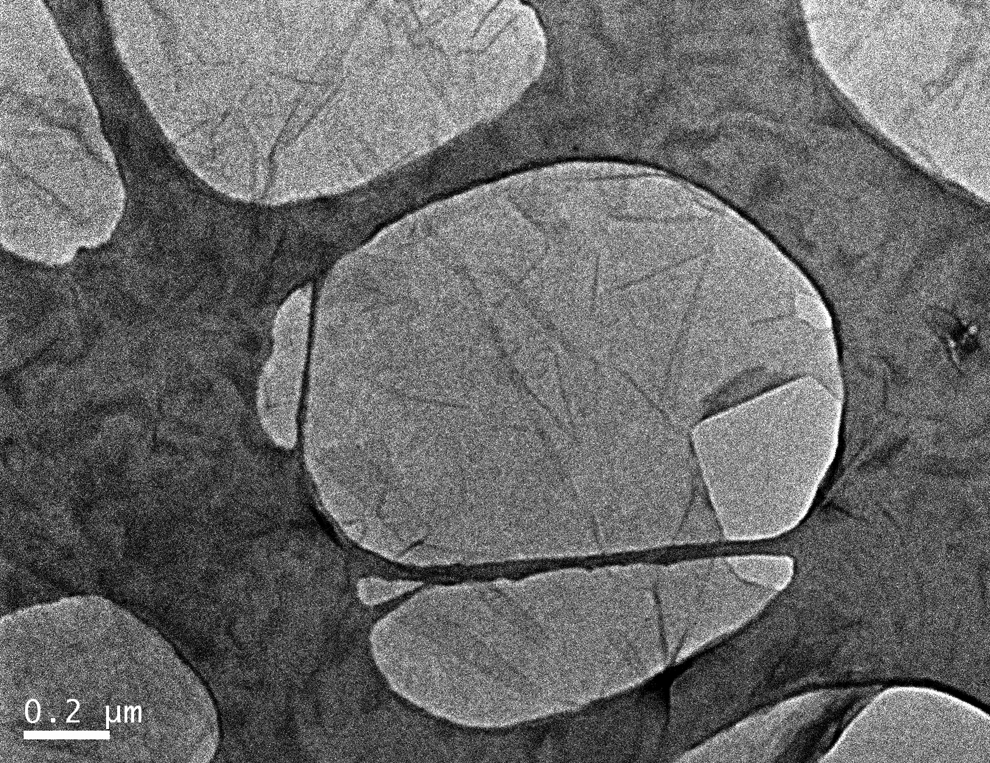
Transmission electron microscopy image of graphene oxide sheet.
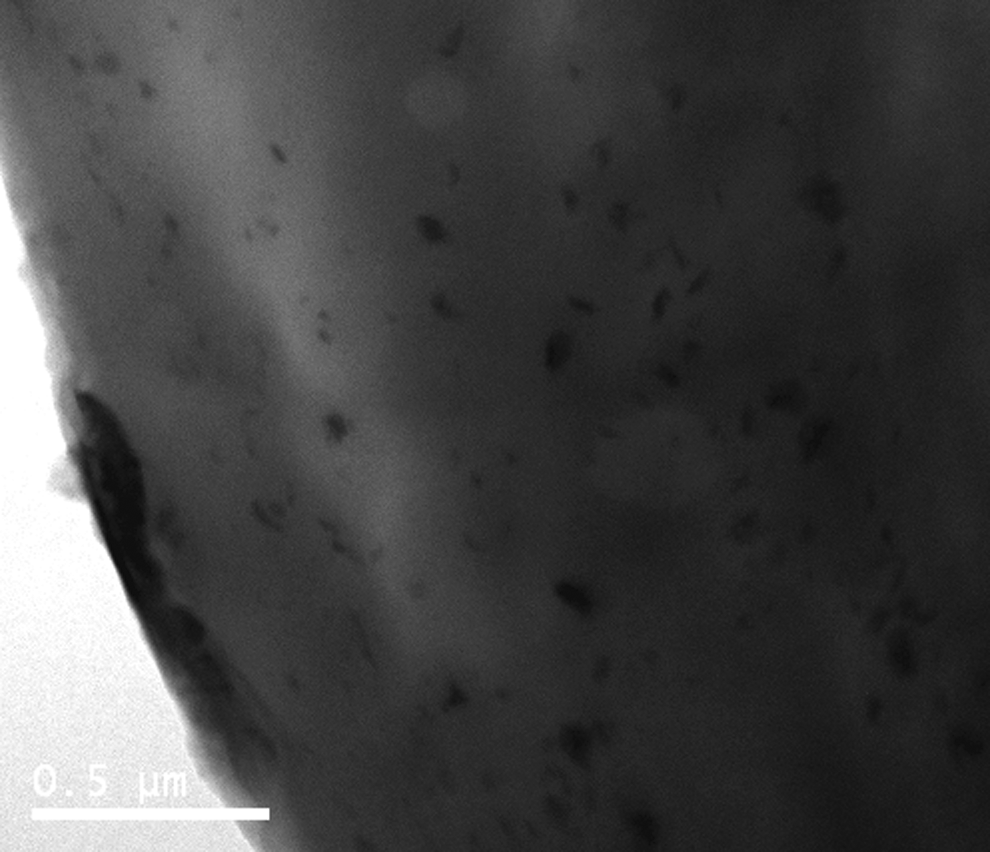
Transmission electron microscopy image of 0.44% polyamide-6/graphene oxide.
Some reduction in the GO towards graphene may occur due to thermal effects during the polymerization process, which is conducted at temperatures of up to 250°C under an inert atmosphere. It has been observed via TGA that rapid thermal decomposition of GO begins at around 200°C in air. 6 While heating in a nitrogen environment results in an approximately 30% weight loss at around 200°C resulting from the desorption of carbon monoxide and carbon dioxide. 55 Xu and Gao report a similar step in the TGA analysis of GO with a weight loss of approximately 35% at 220°C, which is also attributed to the decomposition of oxygen moieties. 42 They also reported that this characteristic weight loss step was not observed in PA6 nanocomposites containing up to 10 wt% GO. 42 This lack of a weight loss step at approximately 220°C and a shift towards lower wavelengths in the Raman G band was attributed to the thermal reduction of GO during polymerization. A similar effect was reported by Zhang et al. with the TGA weight loss step associated with the loss of oxygen not observed with GO removed from PA6/GO composites. Zhang et al. also reported a comparable improvement in electrical conductivity for composites prepared using GO and reduced GO prepared by heating at 1050°C, which also suggests that GO is reduced during in situ polymerization. Several previous studies that have reported electrical conductivity in composites prepared using GO have used more aggressive reduction methods. In these cases, either chemical reduction using hydrazine or heating to 600–1100°C were used to produce electrically conductive graphene which was then dispersed in polymer. 6,27,28 The binding of polymer chains to the oxygen sites on the GO during in situ polymerization may further reduce conductivity and interfere with any subsequent reduction. Further analysis is required to fully investigate the influence of in situ polymerization on the oxidation state of GO and the effect on the physical, chemical and electrical properties of the GO.
Referring to Table 1, it was observed that the addition of GO caused an increase in the degradation temperature of the GO/PA6 composites compared with the PA6 (0%). The TGA traces of 0% and 0.65 wt% GO/PA6 shown in Figure 8 indicate that the onset temperature for degradation has been increased by some 6-7°C with the addition of GO. Similar improvements in thermal degradation have been reported in other nanocomposite systems as indicative of strong adhesion between the additive and polymer, and excellent dispersion.
11,55
For example, it has been reported that the addition of FGS results in an increase in degradation temperature in polyvinylidene fluoride and PMMA, which was attributed to interfacial effects, whereas thicker EG results in a reduction in thermal stability.
56,57
DSC recorded the main melting peak (T
m) at 222–224.7°C for both the PA6- and GO-containing samples (Table 1). Typical DSC traces of PA6 and PA6-containing 0.65 wt% GO are shown in Figure 8. It can be seen that the DSC trace of the PA6 contains two T
m peaks with the main peak corresponding to the α-form crystal and the smaller peak that is some 5°C lower corresponding to the more thermodynamically stable γ-form. Only the melting peak associated with α-form crystals is observed in the GO-reinforced samples. It has previously been reported that the γ-form occurs in quenched PA6 samples while a more thermodynamically mixture of α and γ crystals is observed in annealed samples.
58
Xu and Gao also reported that GO addition interferes with the formation of γ-form crystals due to confinement of the PA6 chains.
42
The heat of fusion (ΔH
m) values associated with the melting of the crystalline regions are also shown in Table 1. It can be seen that the ΔH
m of the pure PA6 of approximately 73 J g−
1 is lower than the range of 85–97 J g−
1 measured in the samples containing GO. Using a value of 230 J g−1
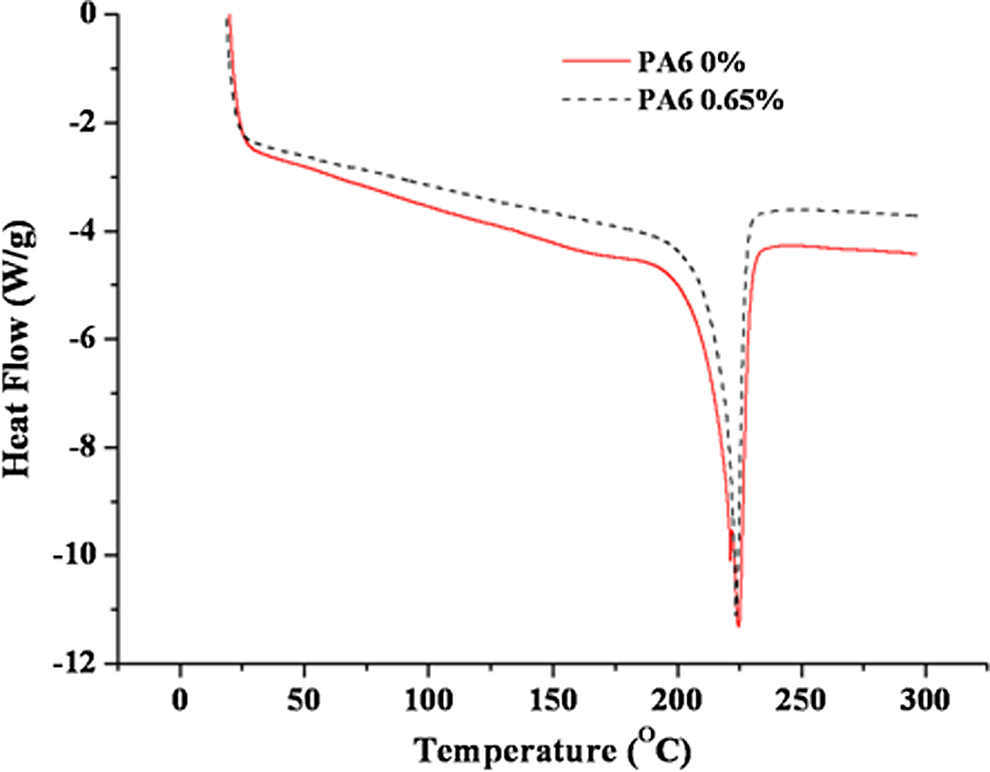
Differential scanning calorimetry of polyamide-6 (solid line) and polyamide-6-containing 0.65 wt% graphene oxide (dotted line).
T m and ΔH m by DSC and degradation onset temperature by TGA of PA6/GO nanocomposites with various loadings of GO.
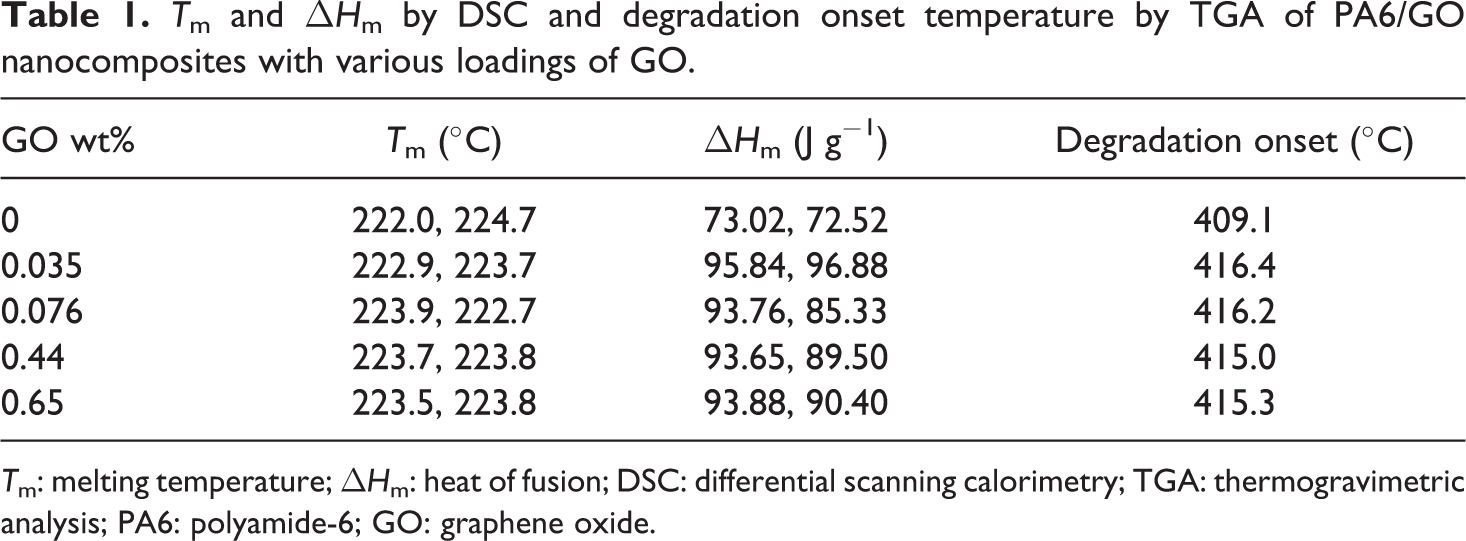
T m: melting temperature; ΔH m: heat of fusion; DSC: differential scanning calorimetry; TGA: thermogravimetric analysis; PA6: polyamide-6; GO: graphene oxide.
GPC was conducted in order to investigate the effect of GO addition on the polymerization process. It can be seen from Figure 9 that the addition of GO leads to a shift in molecular weight distribution, with the peak in the distribution occurring at lower values in the composite samples. Carboxylic acid groups on the GO sheets act to terminate propagating chains during the condensation polymerization reaction leading to a smaller molecular weight. Similar effects have also been observed during the in situ polymerization of PA6 composites containing acid-treated CNT. 59 Xu and Gao also observed via viscometry that higher GO loadings can alter the in situ polymerization process yielding a lower molecular weight PA6. 42 It is also interesting to note that the molecular weight distributions of the samples with high GO loadings (0.44 and 0.65 wt% GO) display a larger tail of high-molecular-weight PA6. This is likely to be a result of reduced chain mobility during the later stages of polymerization suppressing termination reactions. Previous studies of in situ polymerized PA6 nanocomposites based on CNT and GO have tended to measure only average molecular weight via viscometry. Viscometry is not capable of measuring such molecular weight distribution effects as the technique provides only an average molecular weight value. Also the high speed centrifugation generally used prior to viscometry to remove the filler may also remove some of the high molecular weight polymer fractions from the sample.
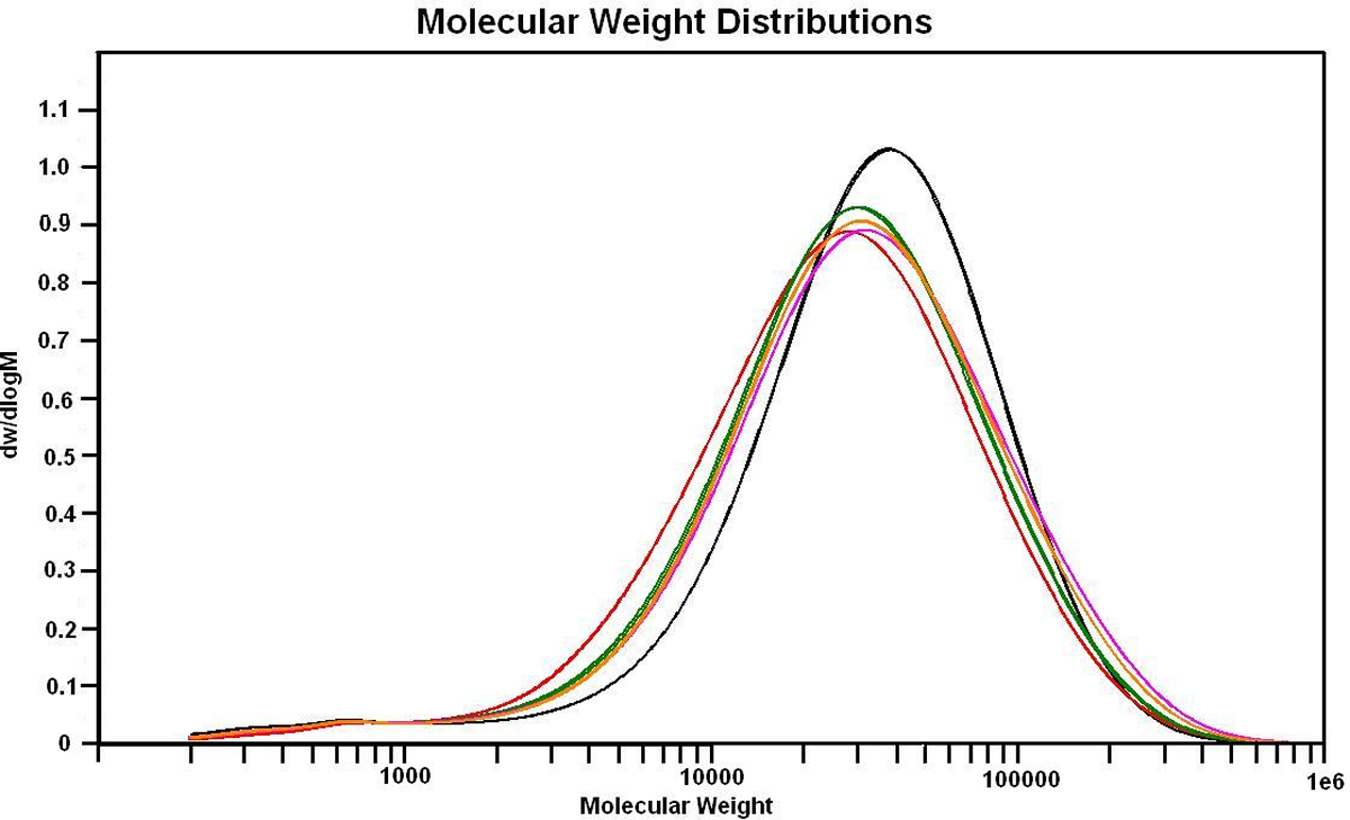
Gel permeation chromatography traces with replicates showing the molecular weight distribution of PA6 (black), PA6/0.076wt% GO (green), PA6/0.035 wt% GO (red), PA6/0.44 wt% GO (pink), PA6/0.65 wt% GO (black).
Figure 10 illustrates the relationship between ultimate tensile strength (UTS) and GO loading. An UTS of 60.6 MPa was measured for pure PA6 (0% GO) rising incrementally to 64.9 MPa for 0.65 wt% GO (95% CI of +/− 1.5 MPa). This is an encouraging level of reinforcement given the very low loading levels used. In addition, the injection-moulded specimens were visually uniform with no evidence of agglomerates and increasing levels of black pigmentation was evident at higher loading levels. Xu and Gao reported a 2.1-fold increase in tensile strength with the addition of 0.1 wt% GO; however, the melt spinning technique employed causes filler alignment greatly improving mechanical performance. 42
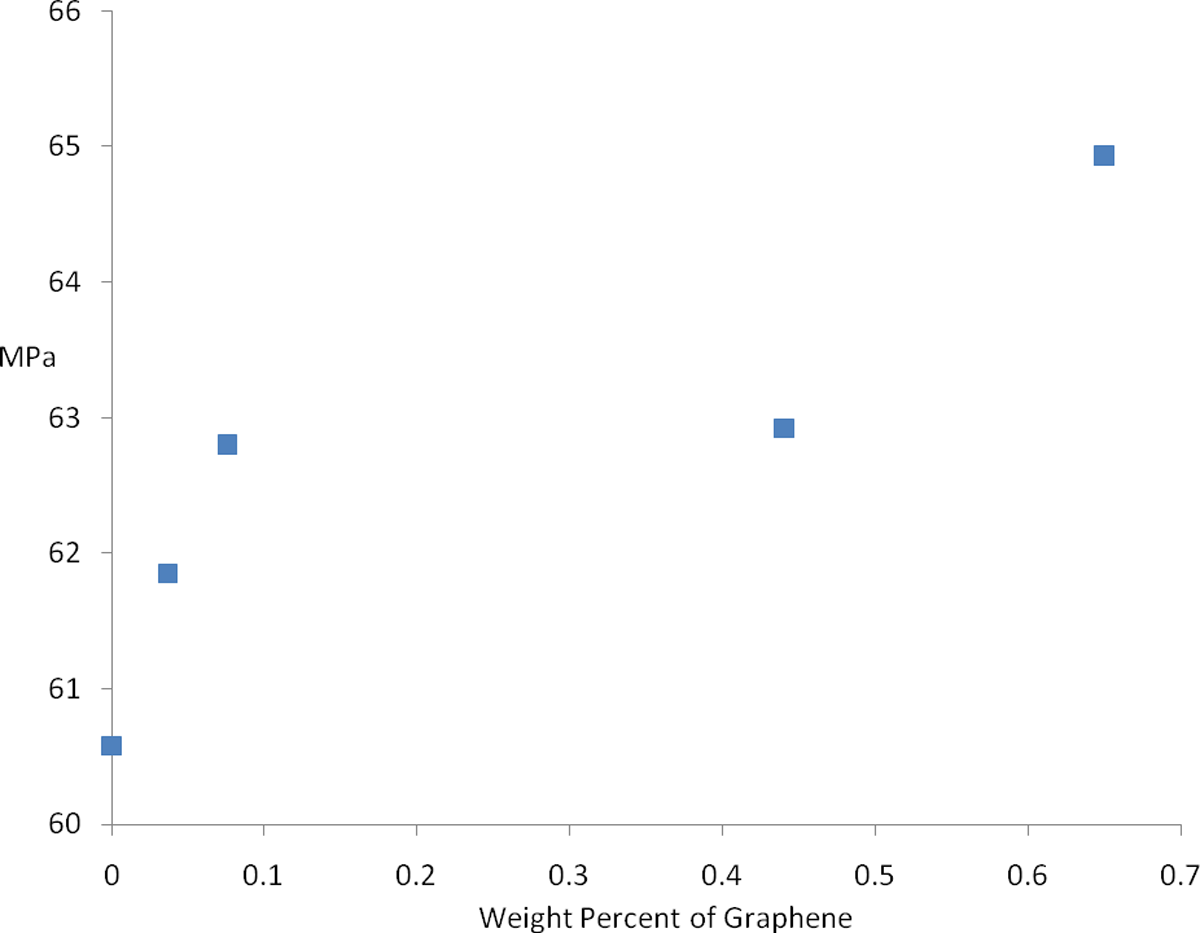
Influence of graphene oxide loading on tensile strength in mega Pascal.
Summary
PA6 nanocomposites containing highly dispersed oxidized graphene were prepared by in situ polymerization. The technique apparently maintained the single layer nature of GO in the nanocomposite by direct synthesis of the polymer in the presence of the GO/water dispersion. A range of techniques have been used to demonstrate the presence of single-layer GO in the water dispersion used to prepare the polymerizable master solution. The resulting nanocomposite-contained GO sheets with reduced lateral dimensions as compared to those present in the GO solution. Fine dispersion of the GO sheets throughout the PA6 matrix and strong interfacial adhesion has been achieved, as evidenced using TGA, TEM and tensile testing. The presence of GO also influenced the PA6 crystallinity and reduced the average molecular weight. Future work will concentrate on studying the influence of in situ polymerization on the GO properties and on further modifying the graphene chemistry to enhance surface polymerization.
Footnotes
Acknowledgements
The authors acknowledge the Nanotechnology and Integrated Bioengineering Centre (NIBEC) at the University of Ulster, UK for supporting the work. They are also grateful to Mr Vimal Sharma and Dr Susanta Roy for conducting the polymerization assisting with conducting the Raman analysis, respectively.
Funding
TEM imaging was carried out at Oxford University with the assistance of Dr L. Karrlson under EPSRC grant number EP/F01919X/1.