
Abstract
Polymeric materials usage is rising, and they are exposed to some effects such as temperature, light, water throughout their lifetime. Increase in use of polymer has led to waste problems. From an environmental point of view, recycling (reprocessing) of polymers is one of the viable solutions to diminish waste issues. Thus, in this work, the effect of reprocessing for aged glass fiber reinforced polycarbonate/acrylonitrile-butadiene-styrene (PC/ABS) composites having different glass fiber content was determined on the mechanical properties (tensile, impact, flexural), melt flow index and morphology. Virgin glass fiber reinforced PC/ABS specimens were exposed to two environments, namely artificial accelerated ageing in a QUV chamber for up to 336 h and natural ageing in Gebze (Turkey) for up to 1 year between January 2018 and January 2019 to determine the influence of a long-term outdoor exposure on the properties. After these ageing steps, naturally and UV aged specimens were ground and the ground specimens were mixed with virgin glass fiber reinforced PC/ABS at ratios of 25%, 50% and 75% by weight. The mixed materials were re-molded to fabricate test specimens and then characterized. In brief, in current research, the mechanical, rheological, and morphological properties of virgin, aged in outdoors for 12 months, aged in UV chamber for 336 h and blends of virgin-aged glass fiber reinforced PC/ABS composites were studied. Because there is no research regarding natural and UV ageing of PC/ABS having different glass fiber content, this study represents an important contribution to determining behavior of these composites after ageing. From experimental study, in general, it was found that mechanical properties decreased with natural and UV ageing, but some retention in properties could be achieved with the incorporation of pure polymer.
Introduction
Polycarbonate/acrylonitrile-butadiene-styrene (PC/ABS) is an amorphous blend commonly utilized in molding thin-walled plastic housings for electronic and communications devices. This blend has replaced PC as it provides more advantageous properties than the single polymeric system. Combining the strength of PC and the flexibility of ABS, PC/ABS blends have better stiffness than traditional high-impact PC or ABS alone and, more significantly, are easier to process than PC.1,2
Glass fiber is a traditional reinforcement and has good mechanical properties, corrosion resistance, fire resistance, good heat resistance and low water absorption. 3 It has been declared that reinforcement with glass fiber can improve mechanical properties of polymeric materials.4–7 But glass fiber reinforced polymer composites are vulnerable to environmental conditions during manufacturing and service conditions. 3 In addition, during storage, polymeric material may be exposed to various environmental conditions; the worst one is exposure to sunlight. 8 Hence, it is important to evaluate the polymer properties under various weathering conditions. Weathering phenomenon is caused by sunlight, temperature, rain, humidity, industrial pollutants and biological effects and it is complex process in which harmful factors (moisture, oxygen, temperature, UV light) together contribute material properties accelerating degradation process. A database of changes in physical and mechanical properties due to weathering conditions should be established to ensure the reliability of thermoplastic products for outdoor use. 9 Outdoor weathering is a time-consuming process. Therefore, accelerated weathering experiments are used to determine weathering behavior of polymeric materials. In the literature, ageing of PC/ABS has been performed by various ageing tests. But to the best of our knowledge, there is no research regarding UV and natural ageing of PC/ABS having different glass fiber amount. Thermal ageing of PC/ABS blends containing 25, 60 and 75% PC was investigated by Guest and Van Daele. 10 The influences of boiling water on the morphological, thermal and mechanical properties of PC/ABS blends were determined by Li et al. 11 Tang and Lee-Sullivan 1 observed physical ageing behavior of PC/ABS blend employing differential scanning calorimetry (DSC) and Fourier transform infrared spectroscopy (FTIR). Pickett et al 12 investigated the influences of irradiation conditions (spectral power distribution, light sources, irradiance and light/dark cycles) on the UV weathering of PC/ABS blends. Researchers focused on the influences of hygrothermal conditions on moisture uptake behavior2,13 and specific heat capacity 14 of PC/ABS blends. Thermal and hygrothermal ageing effects on the stress relaxation behavior of PC/ABS blend were also determined by these researchers. 15 Rajan et al. 16 compounded three different ultraviolet absorbers with PC/ABS blend and accelerated ageing of blends was performed. In another study, researchers compounded three different UV absorbers and two different UV stabilizers with PC/ABS blend and accelerated ageing of blends was conducted. 17 Li et al. 18 studied the UV ageing characteristics of ABS/PC blend by FTIR. Wee et al. 9 developed a model to examine weathering-induced degradation of PC/ABS blends under different UV irradiance and temperatures. Amza et al. 19 investigated the influence of accelerated ageing on the mechanical properties of 3D printed PC/ABS parts.
In this research, the mechanical, rheological, and morphological properties of virgin, aged in outdoors for 12 months, aged in UV chamber for 336 h and blends of virgin-aged glass fiber reinforced PC/ABS composites were studied. Because there is no research about natural and UV ageing of PC/ABS with different glass fiber amount, this research represents an important contribution to determining behavior for these composites after ageing.
Experimental
Materials
In this research, 10 wt% (JOBABLEND® P18-004), 20 wt% (JOBABLEND® P18-005) and 30 wt% (JOBABLEND® P18-006) glass fiber reinforced PC/ABS were employed as polymeric materials. This blend contained 70% PC and 30% ABS by weight.
Processing
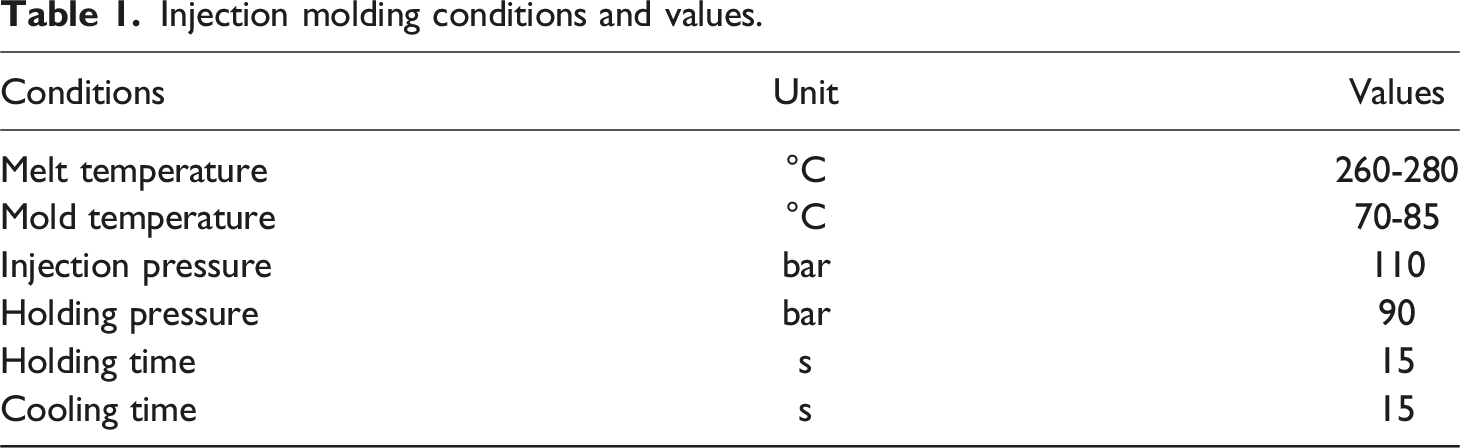
The experiments were performed in accordance with the procedure given in Figure 1. All samples were produced via injection molding process. Before injecting molding process, polymeric pellets were dried in an oven (Binder FD56) at 100°C for 4 h. Then, the test samples were produced by a YIZUMI UN90A2 injection molding machine at constant conditions (Table 1). While determining these conditions, technical information forms received from raw material producer companies were used. Dumbbell-shaped tensile, prismatic-shaped flexural and prismatic-shaped with notch impact samples were manufactured according to ISO 527-1,
20
ISO 178
21
and ISO 180
22
standards, respectively. A mold with four-cavity capable of fabricating two tensile samples, an impact sample and a flexural sample was utilized to produce the test samples. These unaged samples were denoted as “I”. All tests were carried out on these unaged samples. Experimental procedure. Injection molding conditions and values.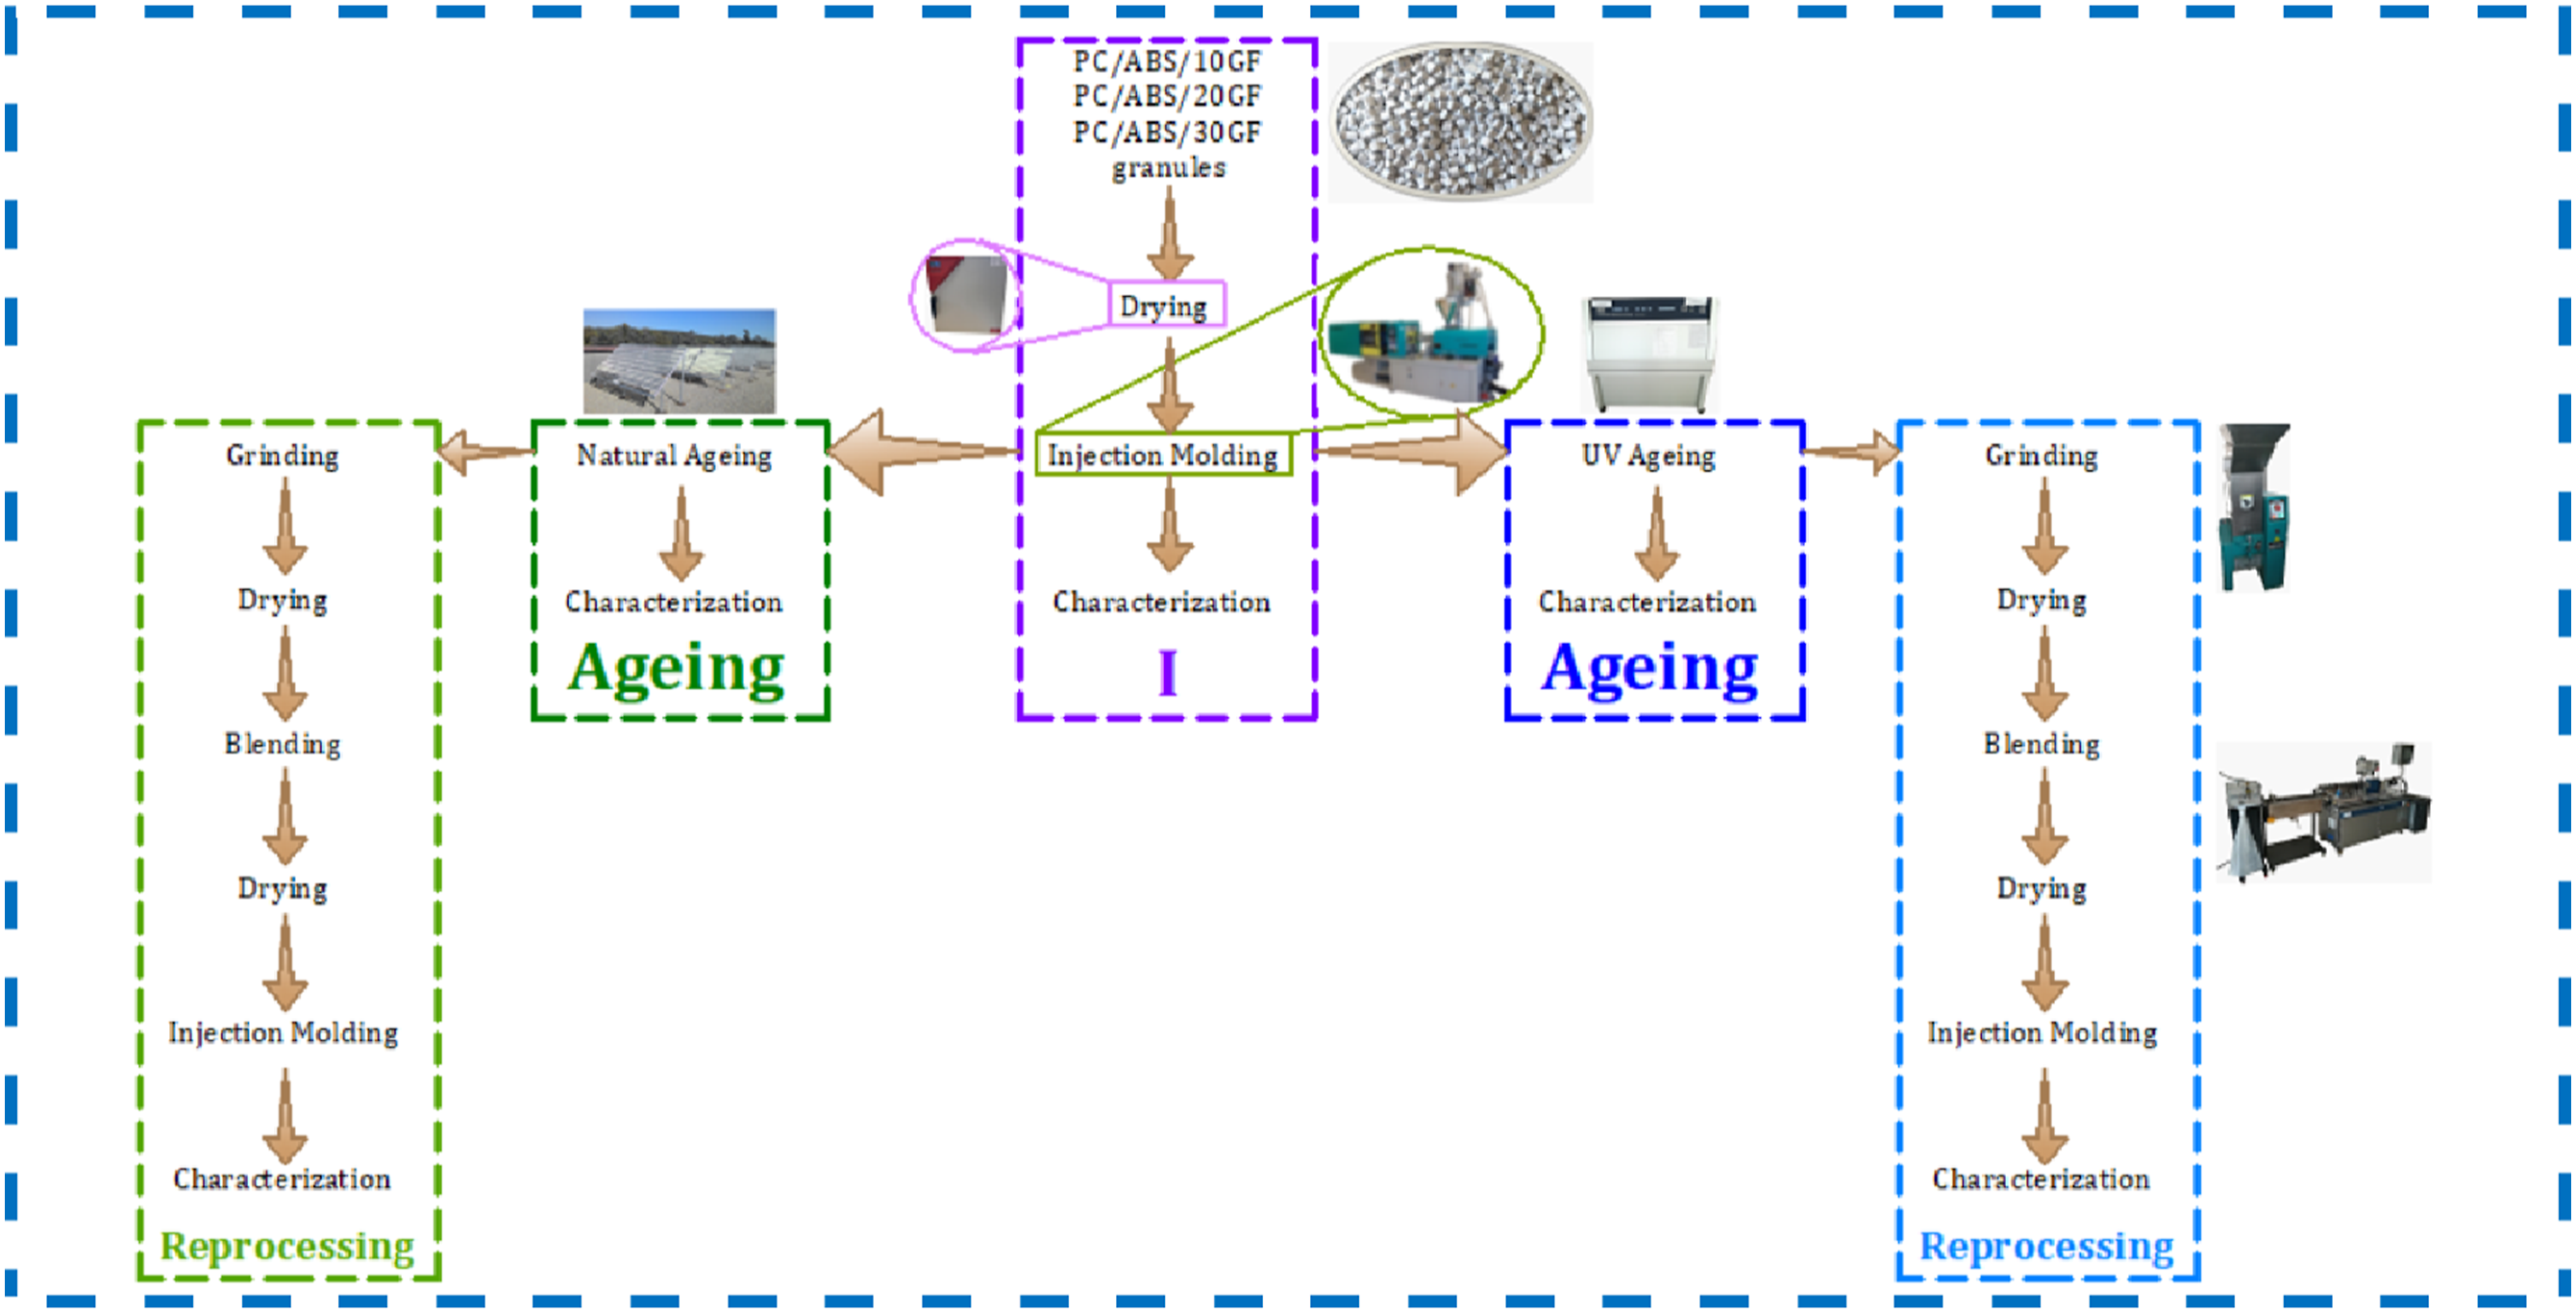
Ageing
Natural ageing (outdoor weathering)
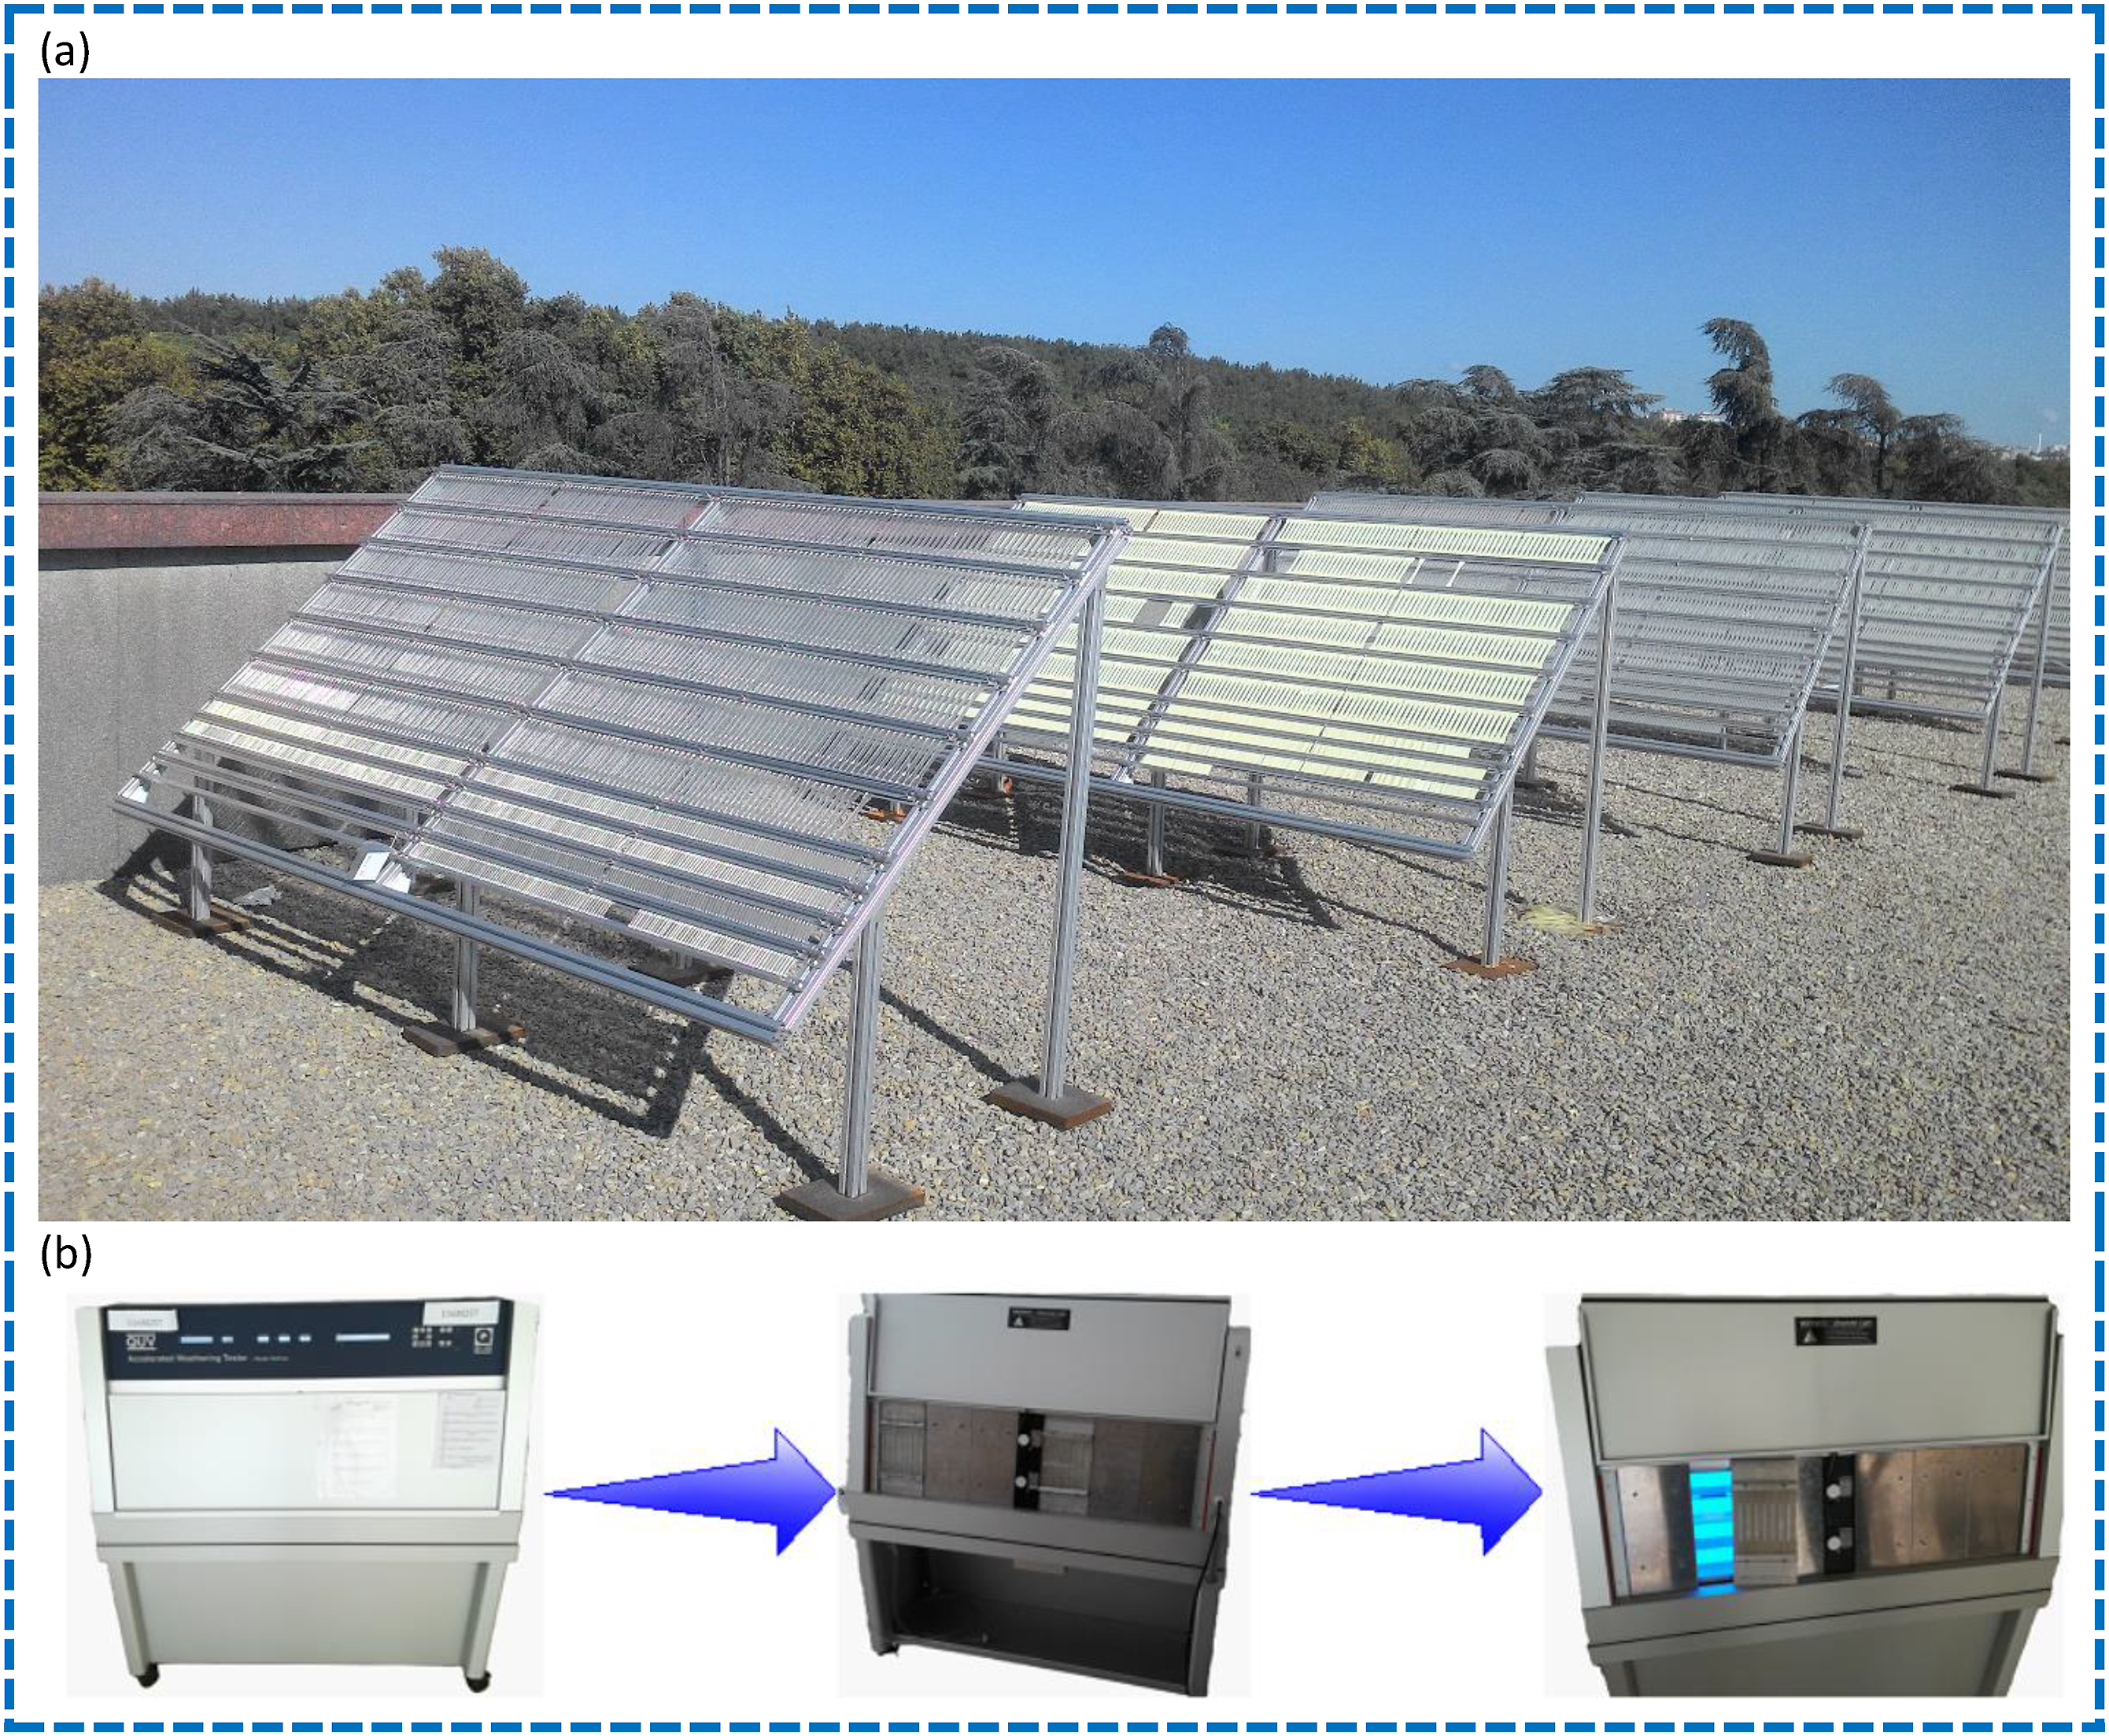
Some produced samples were placed on the roof of Mechanical Engineering Department building in Gebze Technical University, Gebze, Turkey, for outdoor weathering. Natural ageing was performed on a rack which was made installation in accordance with ISO 877-1
23
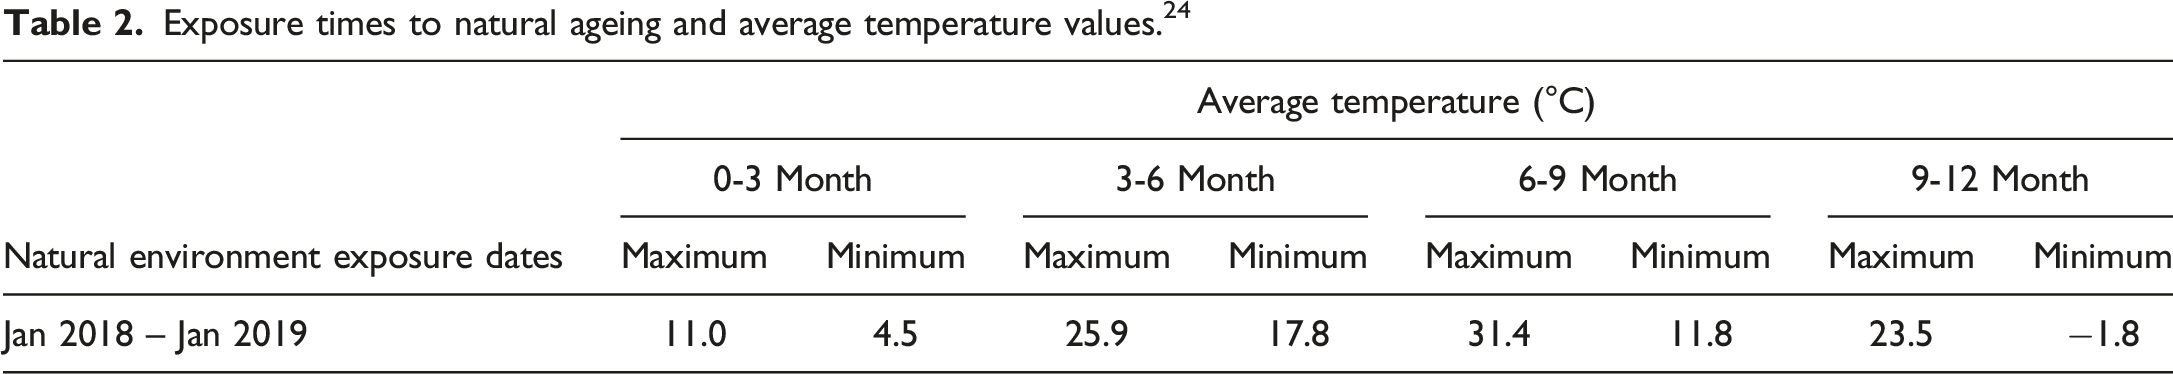
standard (Figure 2(a)). The rack was installed in Gebze region (Turkey) and the samples were clamped at both ends with aluminum plates, placed on the rack and directed at a 45° angle to the south to ensure that the samples placed on it were exposed to maximum sunlight. Outdoor weathering was carried out from January 2018 to January 2019 for 1-year duration allowing for the contribution of each season. Samples were collected at specific time intervals (after 3, 6, 9 and 12-months exposure). The temperature values recorded in Gebze during the time the samples were exposed to the outdoor weathering are presented in Table 2.
24
Minimum and maximum temperatures were recorded as −1.8 and 31.4°C, respectively. After natural ageing, all tests were performed on aged glass fiber reinforced PC/ABS samples. Test samples were periodically removed and stored in the dark in a dry, clean, air-tight container at 25°C before visual and mechanical examination. All tests and observations were implemented to five different samples for each exposure time. Ageing equipment. (a) Rack employed for natural weathering. (b) QUV/se model accelerated weathering test chamber. Exposure times to natural ageing and average temperature values.
24
Artificial ageing (UV ageing)
Some fabricated samples were exposed to artificial accelerated ageing by a QUV/se model accelerated weathering test chamber for 336 h (Figure 2(b)). This chamber was designed to create a combination of moisture, temperature and UV light conditions and can reproduce the damage caused by sunlight and dew. The QUV chamber reproduces the effect within days or weeks that would take months or years to determine the relative shelf life of materials exposed outdoors. UV ageing was conducted in accordance with ASTM G 154 25 standard. To hold the samples in place during accelerated ageing process, aluminum panels were designed. An 8-h cycle was employed and repeated several times for total exposure duration of 48, 144 and 336 h. This cycle was composed of two steps: a 4-h of UV irradiation (irradiation level = 0.68 W/m2) at followed by a 4-h of condensation (water spray stage without UV irradiation) operation. For example, cycle was repeated 6 times for 48 h total exposure duration. 50°C was used as a temperature for UV irradiation and condensation. At UV exposure, UV-A type fluorescent lambs with 340 nm wavelength providing an irradiance of 0.68 W/m2 was employed to simulate the daylight, which reproduces the most relevant part of the solar spectrum between 290 and 350 nm. After UV ageing, samples were removed from chamber. Removed samples were dried with a paper towel then held in the room temperature before tests. All tests and observations were implemented to five different samples for each exposure time.
Reprocessing
Naming of the samples.
Analysis
Mechanical tests
Effect of ageing on stress-strain behavior was determined by universal testing machine. Tensile tests were carried out in accordance with ISO 527-1 20 standard by Instron 5569 universal testing device at the speed of 5 mm/min. Three-point flexural tests were performed according to ISO 178 21 standard by Instron 5569 device with a crosshead speed of 5 mm/min. The rectangular cross-section flexural test sample rested on two supports 60 mm apart and was loaded via a loading nose in the middle of the supports. Impact tests were conducted with respect to ISO 180 22 standard by Instron CEAST 9050 device with 2.75 J hammer. Prior to impact tests, a notch at the dimensions of 2 mm × 45° was cut on the samples. Samples manufactured by injection, aged in outdoor environment, and aged in UV chamber were kept in a closed environment at room temperature (23 ± 3°C) for 24 h before tests. All mechanical tests were performed at room temperature. Five samples were chosen randomly to determine the properties for each test and mean of these five measurements were taken into consideration as final values. The standard deviation between samples was found to be low as demonstrated in the graphs of results.
Rheological test
Melt flow index (MFI) was determined via Devotrans-EA3 device with respect to ISO 1133-1 26 standard at the temperature of 260°C and the weight of 5.2 kg. Samples for MFI were obtained by crushing of tensile test samples. All tests were conducted at room temperature (23 ± 3°C). Five measurements were carried out and average of these five measurements were taken as final values. The standard deviation between samples was found to be low as demonstrated in the graphs of results.
Scanning electron microscopy
Scanning electron microscopy (SEM) observation was performed by means of Philips XL 30 SFEG with an acceleration voltage of 15 kV to evaluate the fracture surface of tensile samples after tensile tests and surface of tensile samples. Prior to examinations, samples surface was coated with a thin layer of gold (∼30 nm thickness) by a Quorum SC7620 sputter coater to avoid electrical charging during examination, making them more conductive and visible. SEM samples were achieved after tensile tests and fractured surfaces and non-affected surface were observed by SEM. Samples were fixed and rigidly placed on a circular metallic sample holder with sticky carbon tape. SEM images were acquired in a high vacuum for secondary electrons at 100x and 1000x magnifications.
Results and discussion
Visual examination
Images of PC/ABS/10 GF tensile test samples taken before and after natural ageing are demonstrated in Figure 3. As a result of visual examination of the PC/ABS/10 GF samples, color change (yellowing in color) was clearly observed in the samples due to the natural ageing effect. PC/ABS/10 GF composites, which were opaque and white after molding, changed in appearance after natural ageing for 6, 9 and 12 months. Changes in appearance became more severe after 6 months natural ageing. The outside layer of samples became more yellowed in appearance over time. From SEM images of samples, as the natural ageing period increased, more cracks and separated fibers appeared on the side surface. With natural ageing, glass fibers became more evident on the polymer surface. Visual and SEM images for surface of PC/ABS/10 GF composites aged naturally for (a) 0 months (It means unaged PC/ABS/10 GF composite.), (b) 3 months, (c) 6 months, (d) 9 months and (e) 12 months.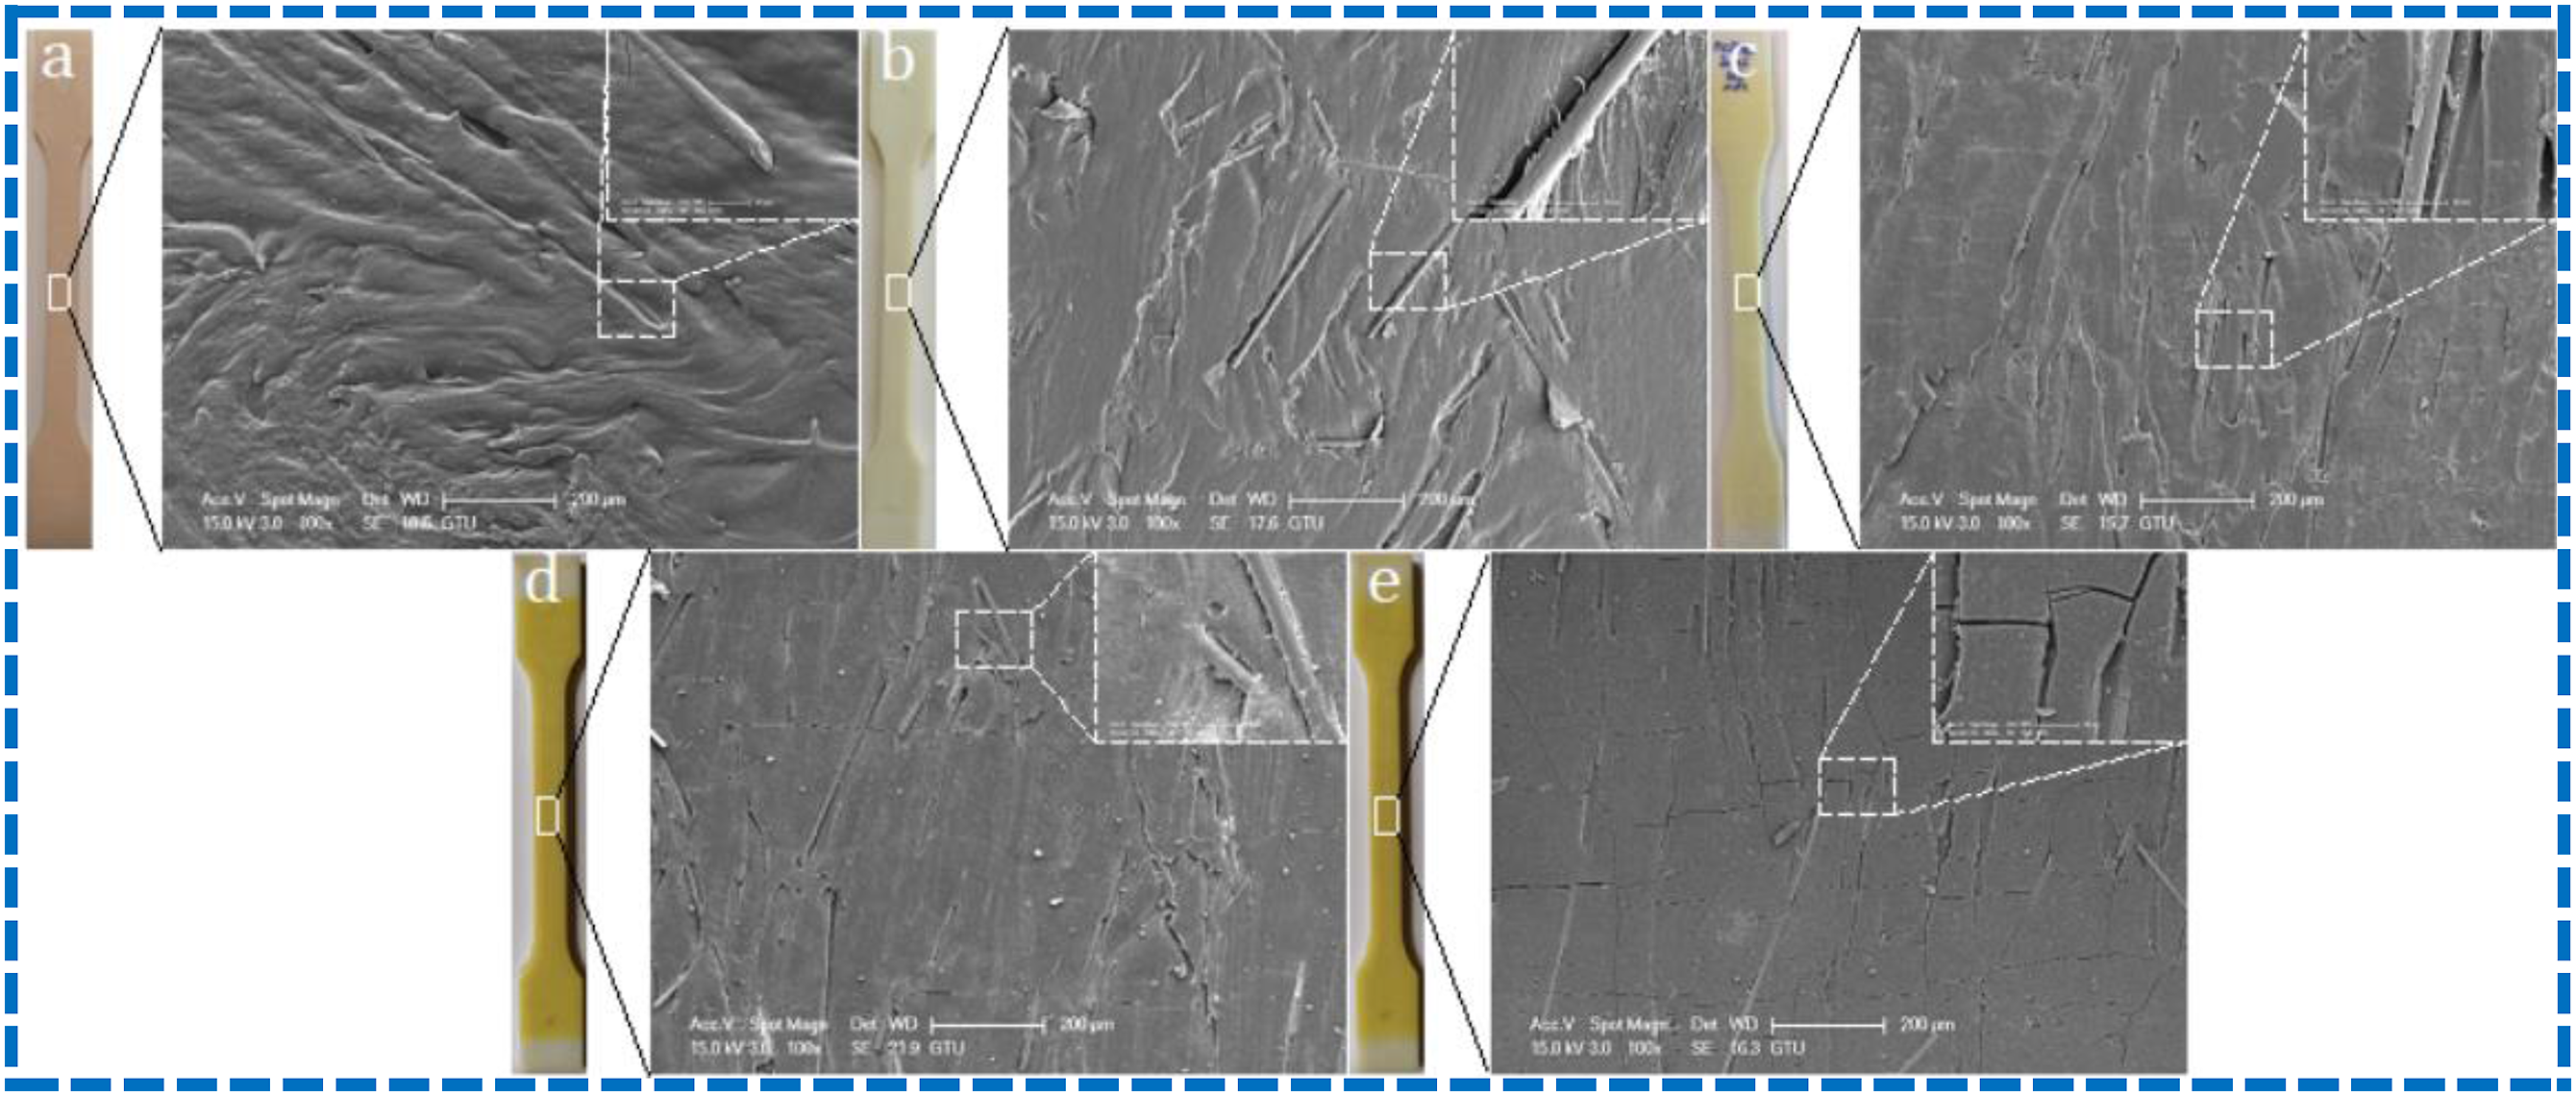
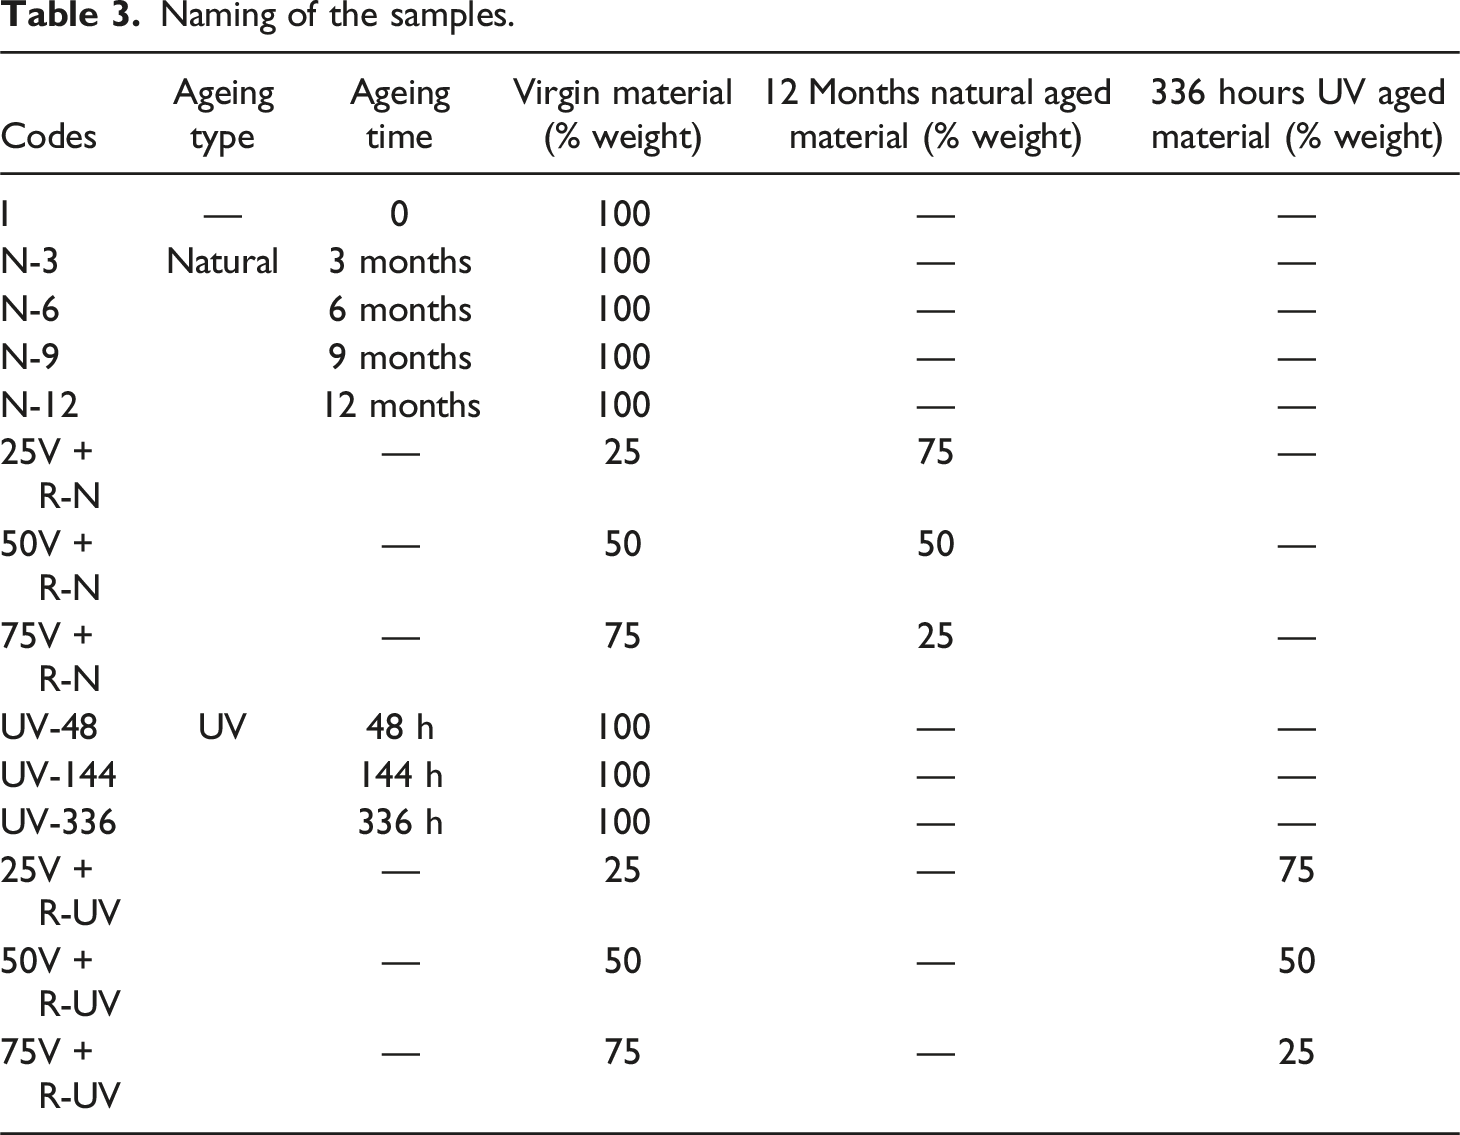
Images for tensile samples produced by reprocessing of PC/ABS/10 GF samples after 12 months natural ageing then mixing them with pure PC/ABS/10 GF are demonstrated in Figure 4. As a result of visual examination of the samples reprocessed after natural ageing then mixed with pure PC/ABS/10 GF at different ratios, a color darkening of the samples was observed. As the aged material ratio decreased and the pure material ratio increased (75V + R-N), the colors of the samples became lighter. Visual images for surface of PC/ABS/10 GF composites aged naturally for (a) 0 months (It means unaged PC/ABS/10 GF composite.) and (b) 12 months. Visual images for blends of virgin-naturally aged PC/ABS/10 GF composites. (c) 25V + R-N, (d) 50V + R-N and (e) 75V + R-N.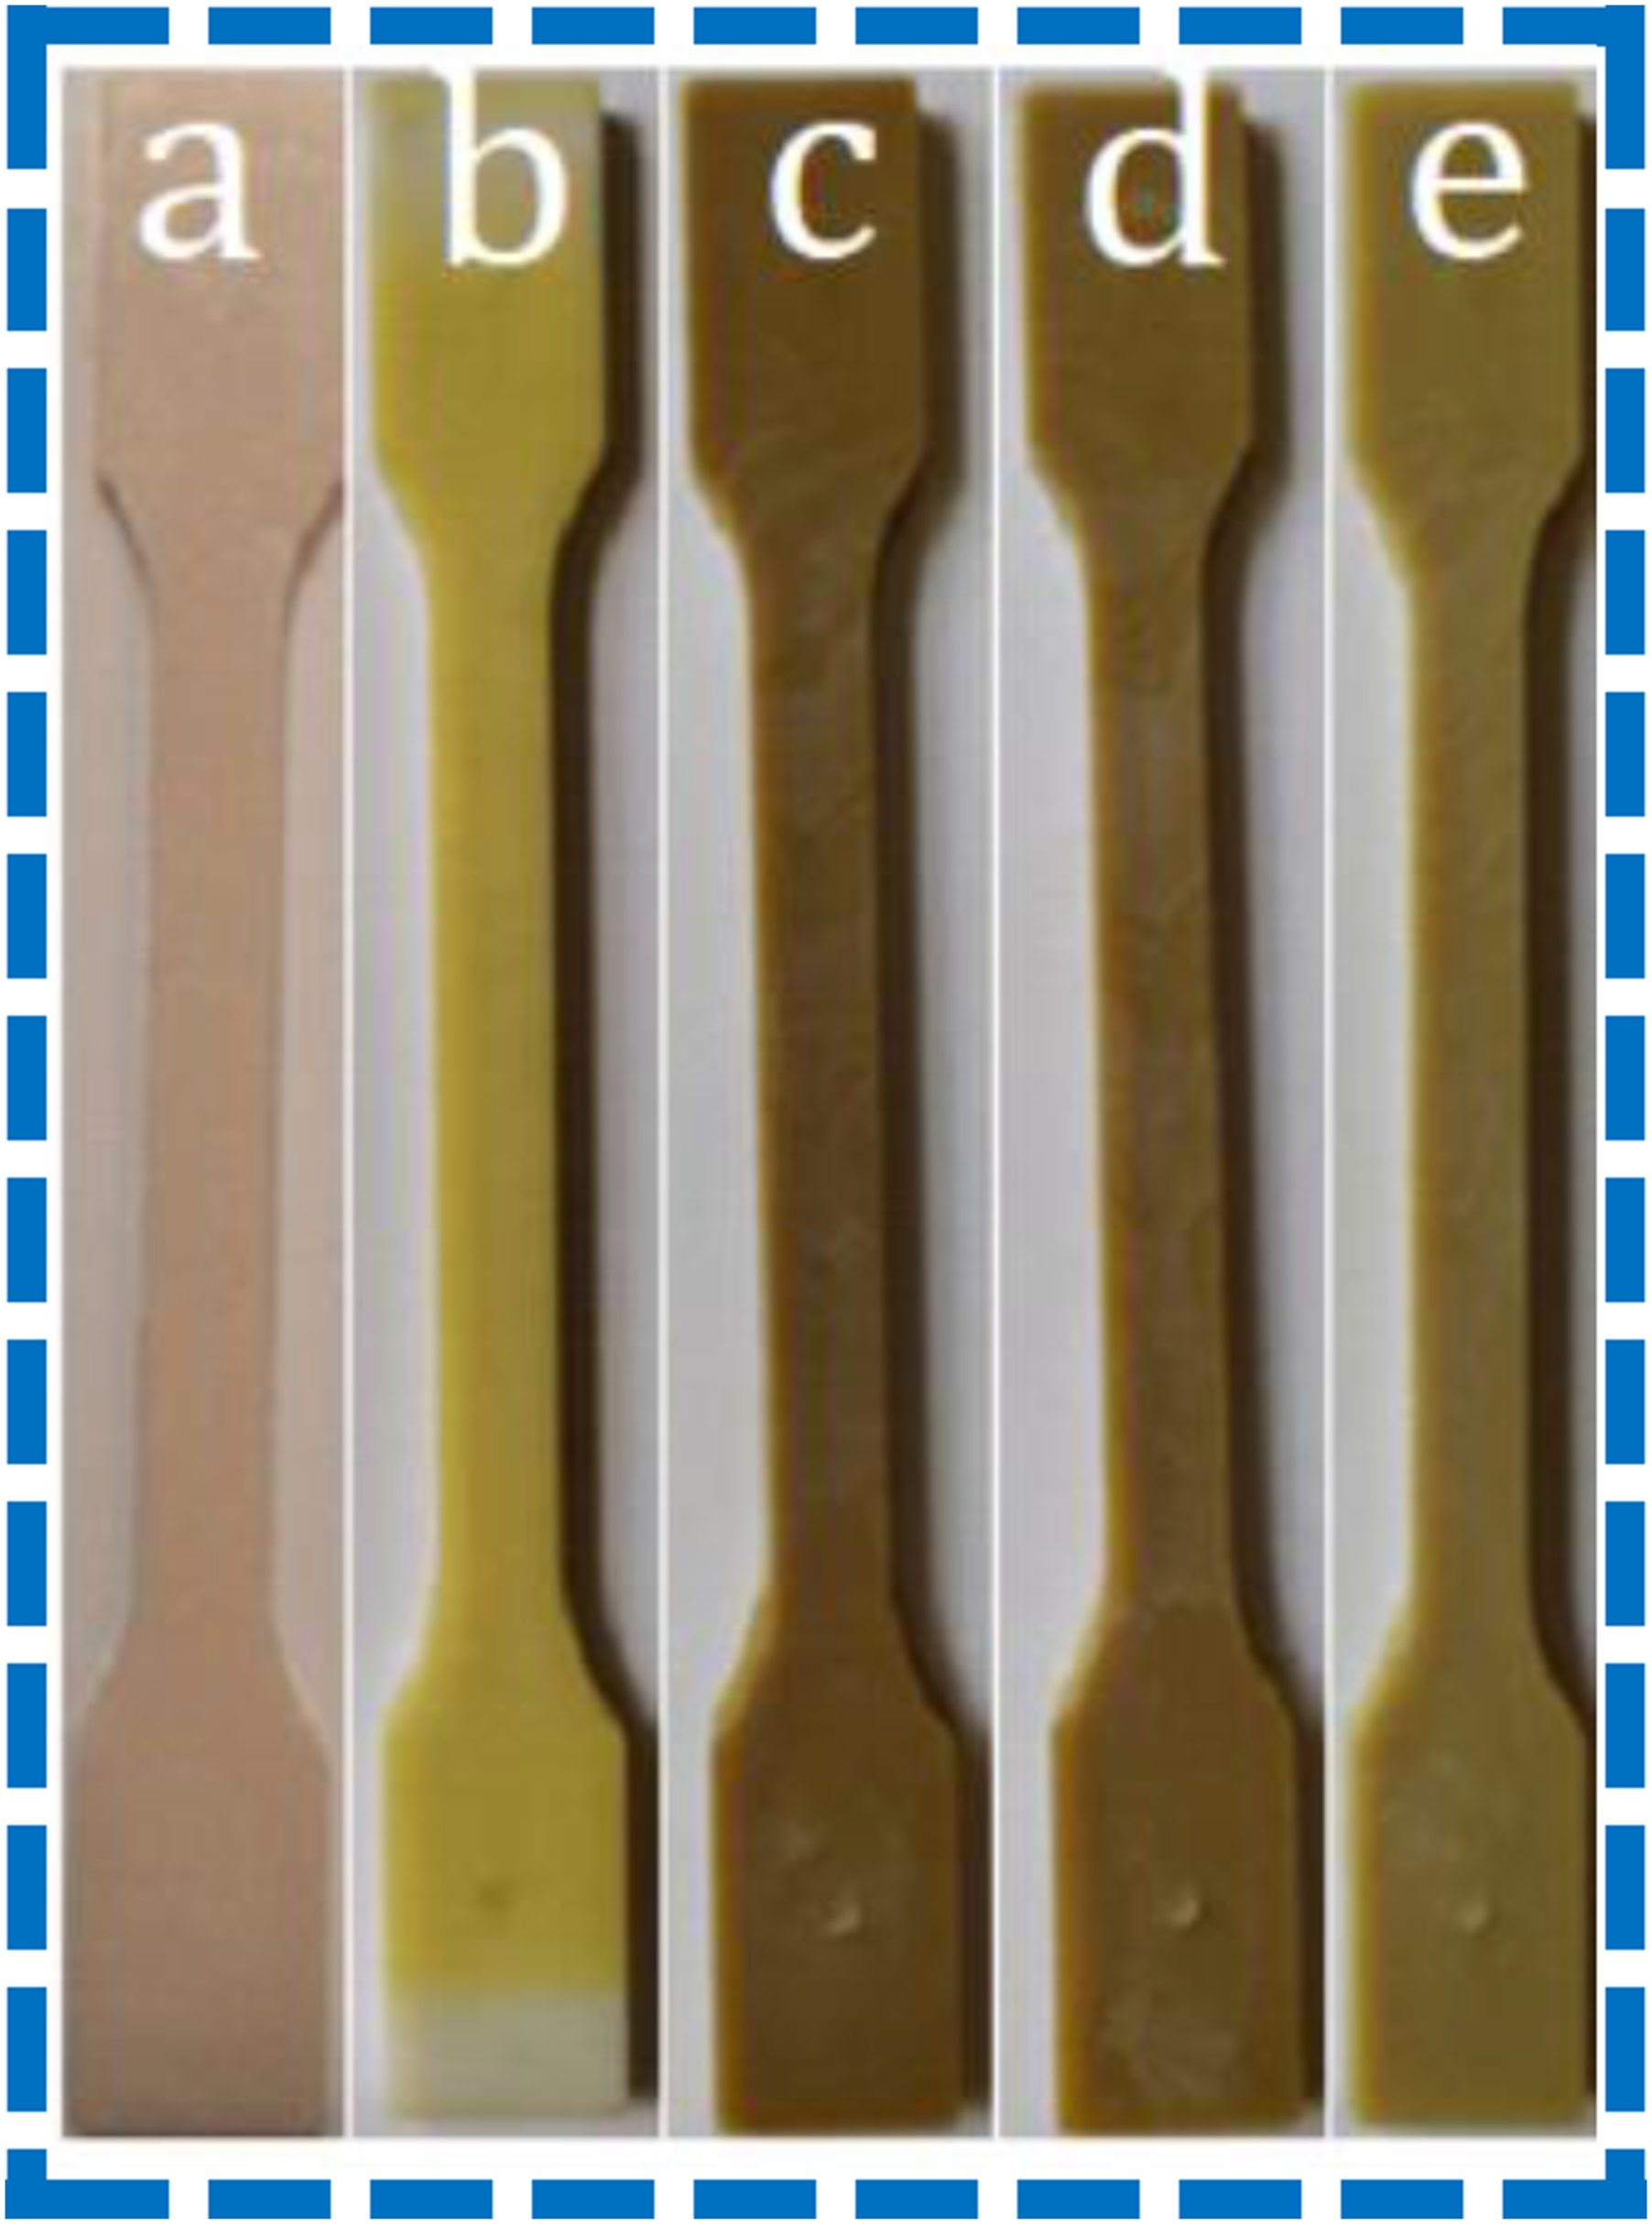
Images of PC/ABS/10 GF tensile test samples obtained before and after UV ageing are demonstrated in Figure 5. Color change (yellowing in color) due to UV ageing was clearly seen. From SEM images, no change was observed on the surfaces of the samples after UV ageing. Visual and SEM images for surface of PC/ABS/10 GF composites aged artificially for (a) 0 h (It means unaged PC/ABS/10 GF composite.), (b) 48 h, (c) 144 h and (d) 336 h.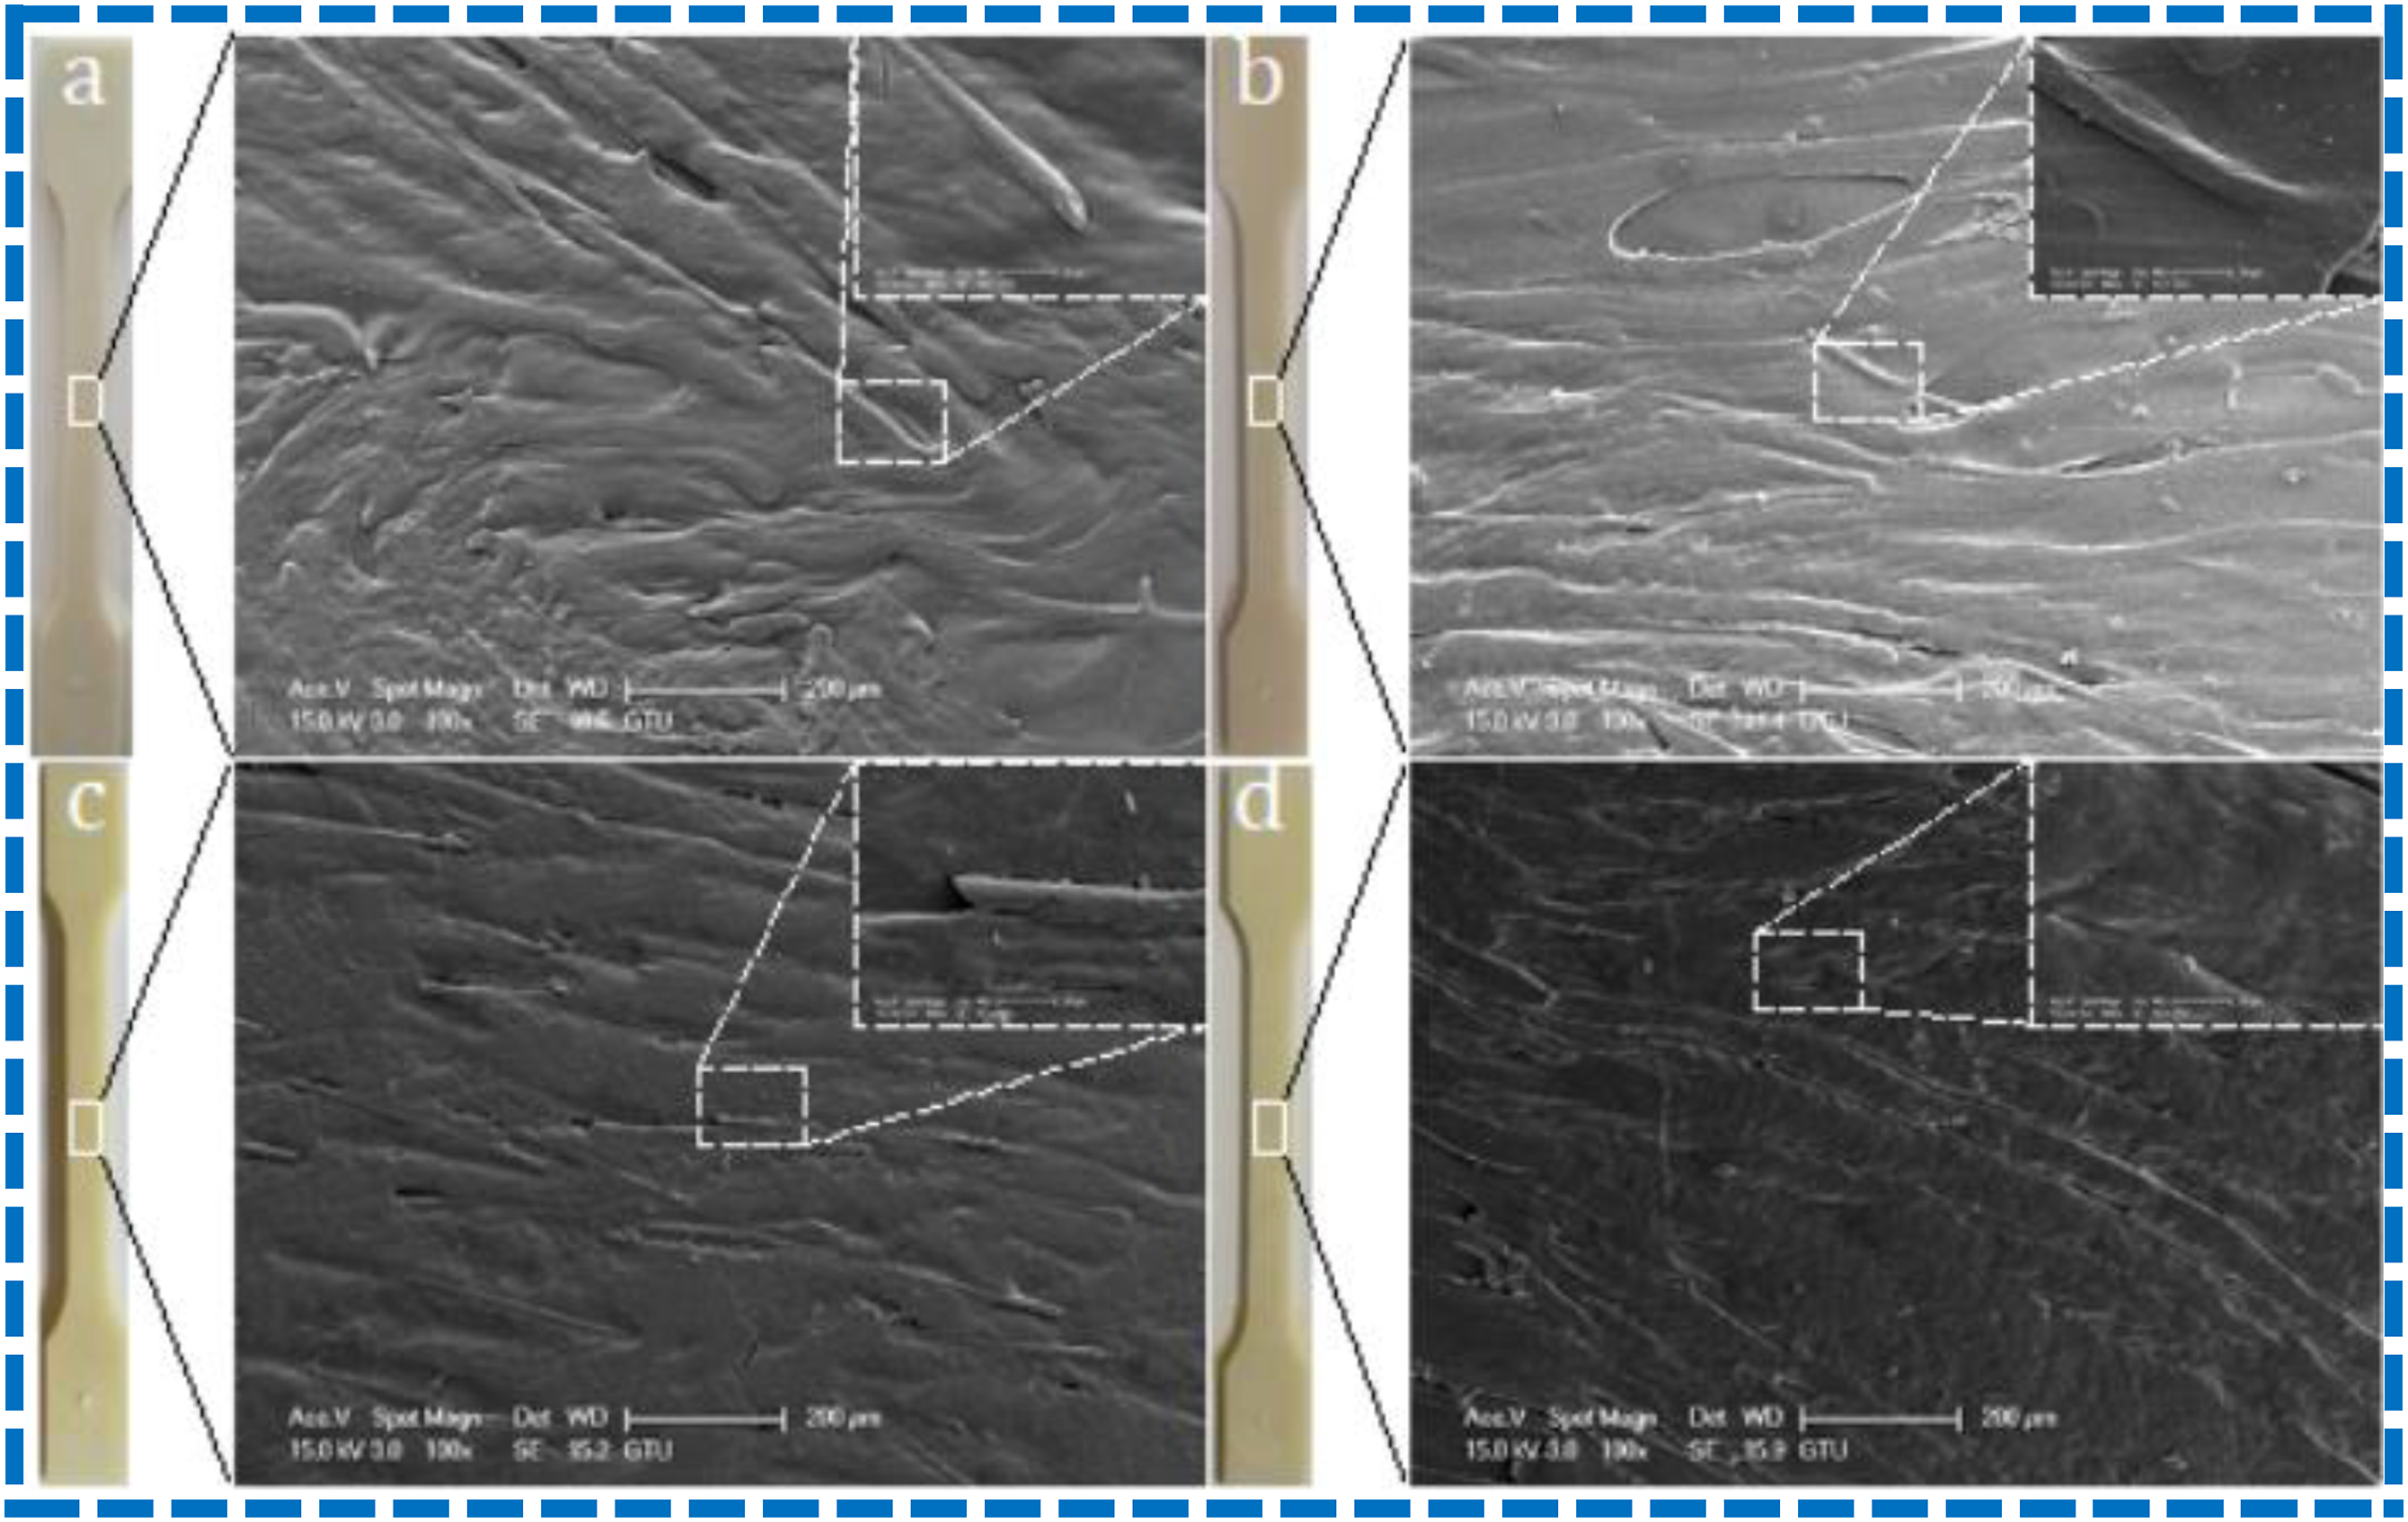
Images for tensile samples produced by reprocessing of PC/ABS/10 GF samples after 336 h UV ageing then mixing them with pure PC/ABS/10 GF are demonstrated in Figure 6. As a result of visual examination of the samples reprocessed after UV ageing then mixed with pure PC/ABS/10 GF at different ratio, a color darkening of the samples was observed. As the aged material ratio decreased and the pure material ratio increased (75V + R-UV), the colors of the samples became lighter. Visual images for surface of PC/ABS/10 GF composites aged artificially for (a) 0 h (It means unaged PC/ABS/10 GF composite.) and (b) 336 h. Visual images for blends of virgin-artificially aged PC/ABS/10 GF composites. (c) 25V + R-UV, (d) 50V + R-UV and (e) 75V + R-UV.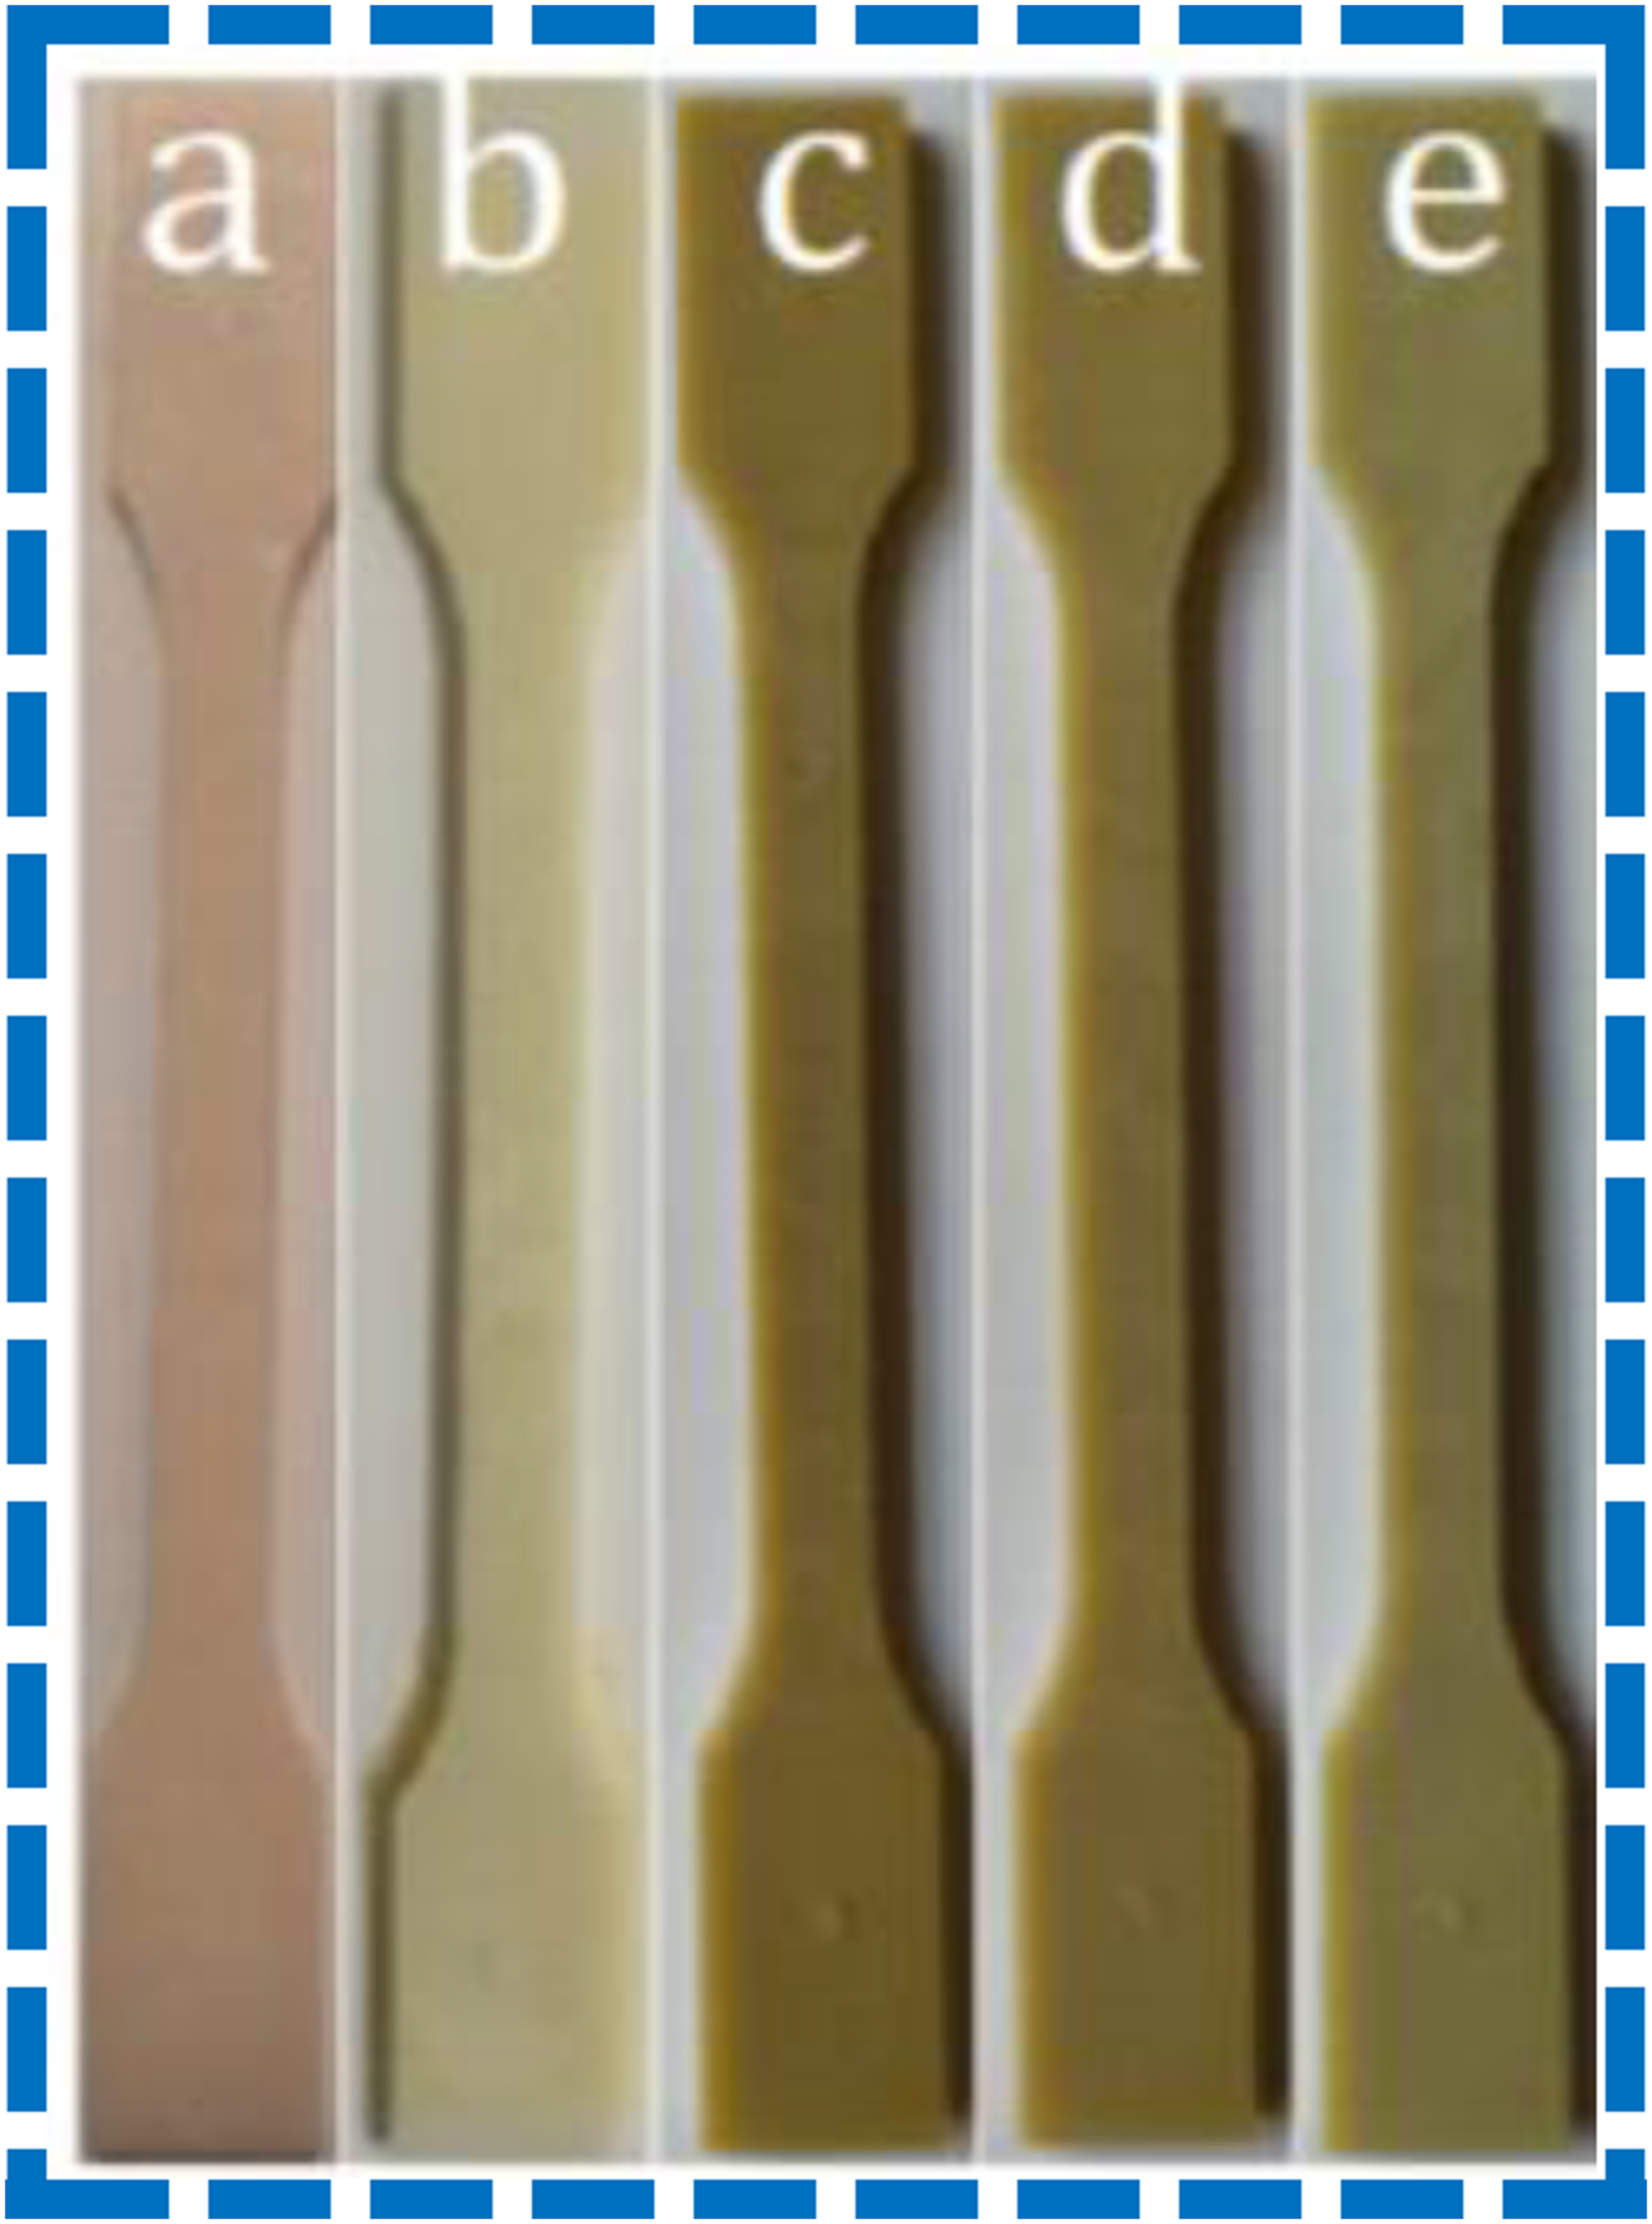
Images of PC/ABS/20 GF tensile test samples obtained before and after natural ageing are given in Figure 7. As a result of visual examination of the PC/ABS/20 GF samples, color change (yellowing in color) was clearly observed in the samples. PC/ABS/20 GF composites, which were opaque and white after molding, changed in appearance after natural ageing for 6, 9 and 12 months. Changes in appearance became more severe after 6 months natural ageing. The outside layer of samples became more yellowed in appearance over time. From SEM images of samples, as the natural ageing period increased, more cracks and separated fibers appeared on the side surface. With natural ageing, glass fibers became more evident on the polymer surface. Visual and SEM images for surface of PC/ABS/20 GF composites aged naturally for (a) 0 months (It means unaged PC/ABS/20 GF composite.), (b) 3 months, (c) 6 months, (d) 9 months and (e) 12 months.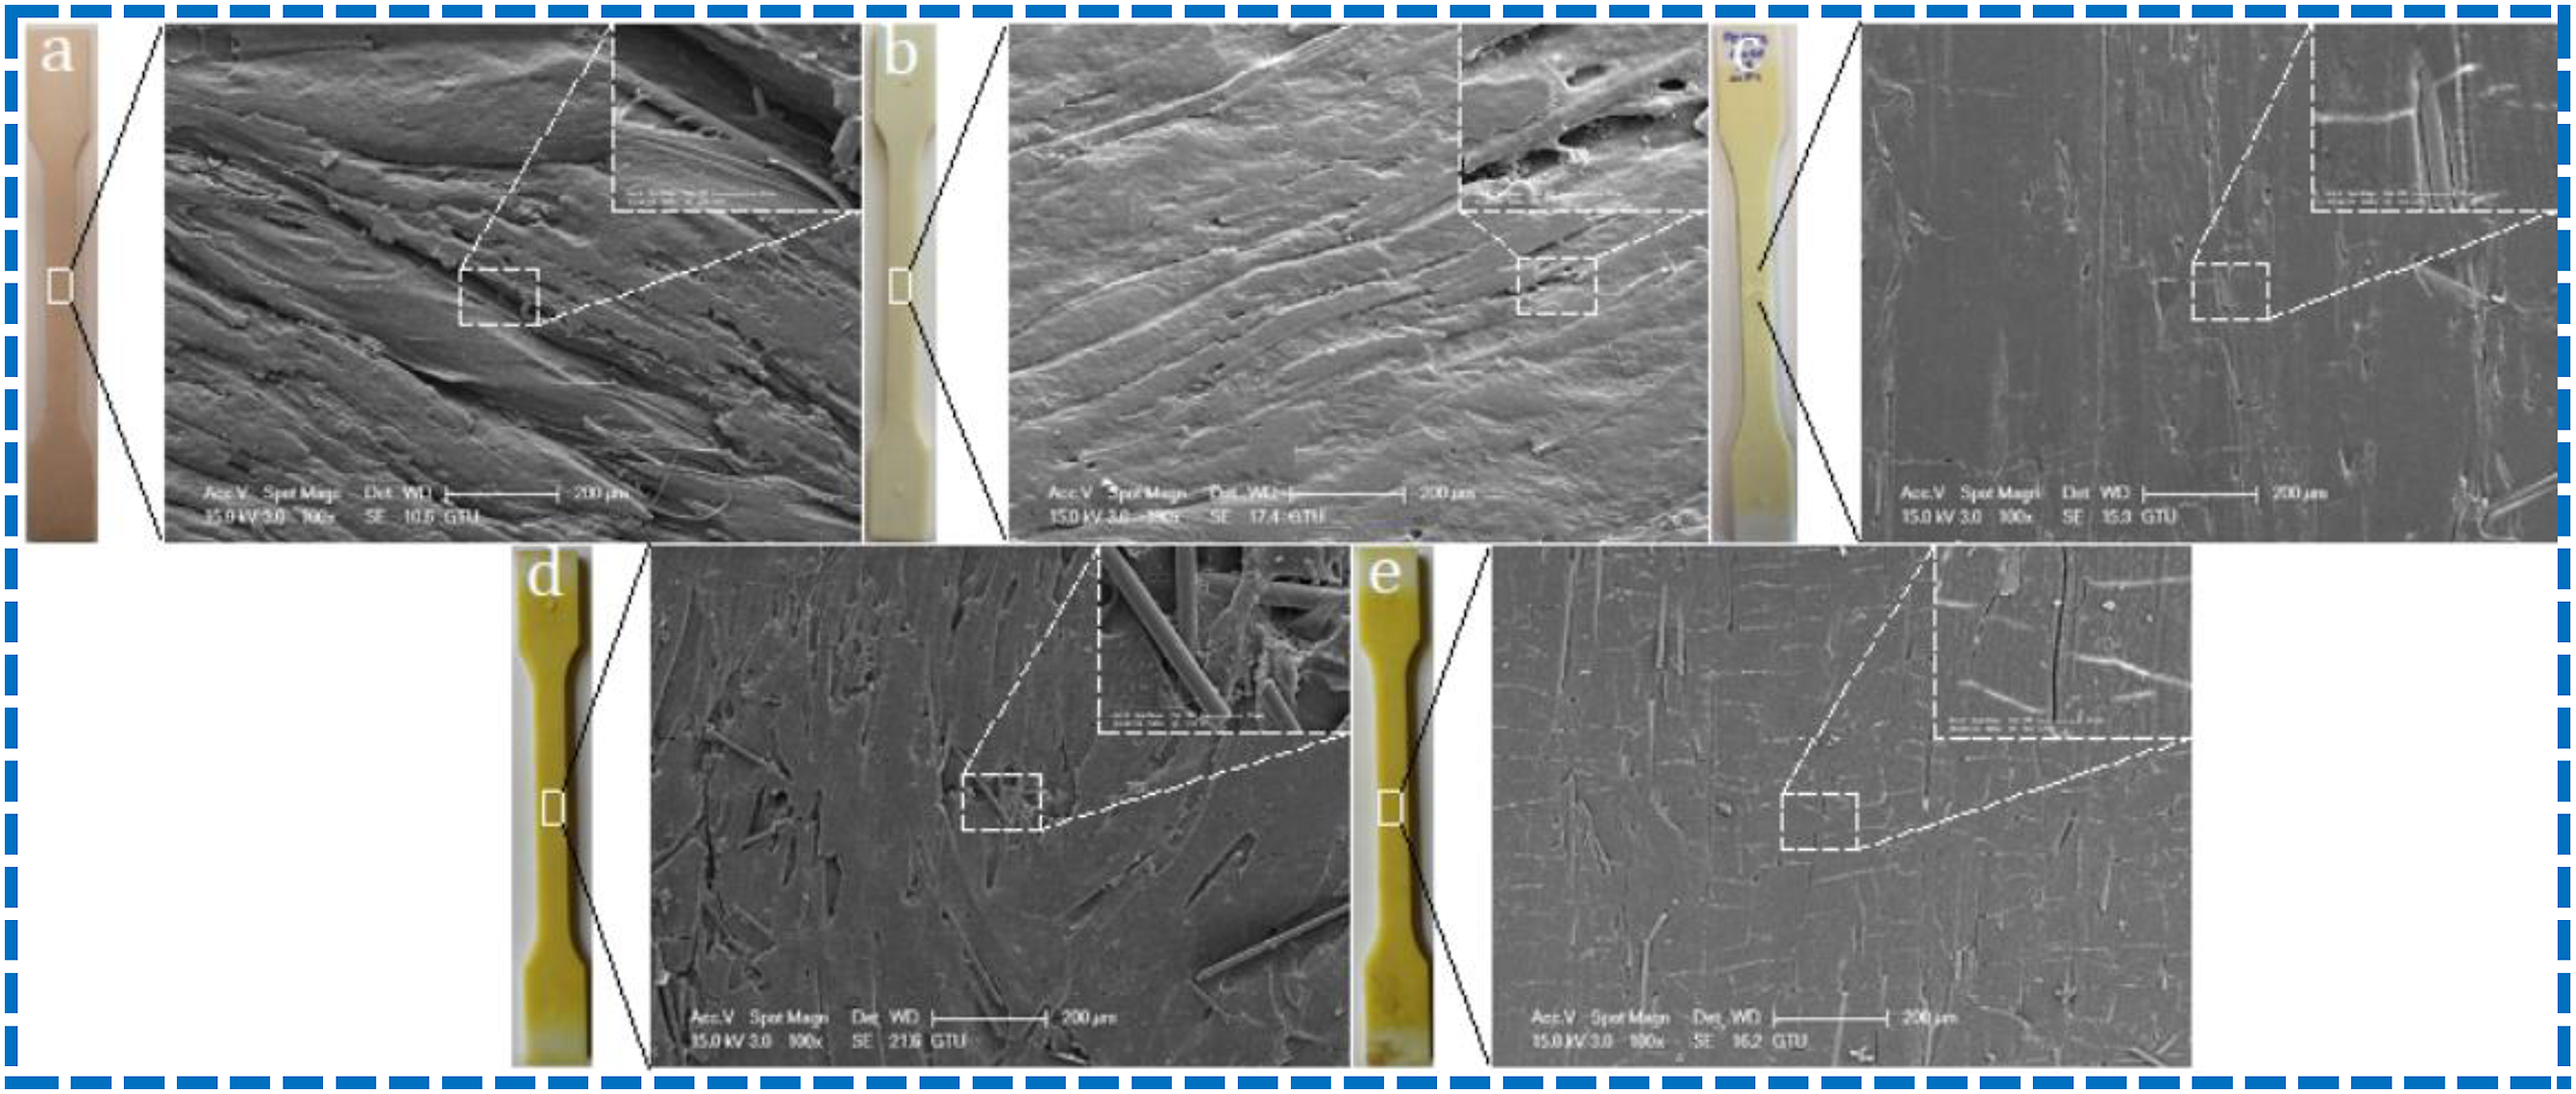
Images for tensile samples generated by reprocessing PC/ABS/20 GF samples after 12 months of natural ageing then mixing them with pure PC/ABS/20 GF are presented in Figure 8. For the samples reprocessed after natural ageing then mixed with pure PC/ABS/20 GF at different ratios, a color darkening of the samples was observed. As the aged material ratio decreased and the pure material ratio increased (75V + R-N), the colors of the samples became lighter. Visual images for surface of PC/ABS/20 GF composites aged naturally for (a) 0 months (It means unaged PC/ABS/20 GF composite.) and (b) 12 months. Visual images for blends of virgin-naturally aged PC/ABS/20 GF composites. (c) 25V + R-N, (d) 50V + R-N and (e) 75V + R-N.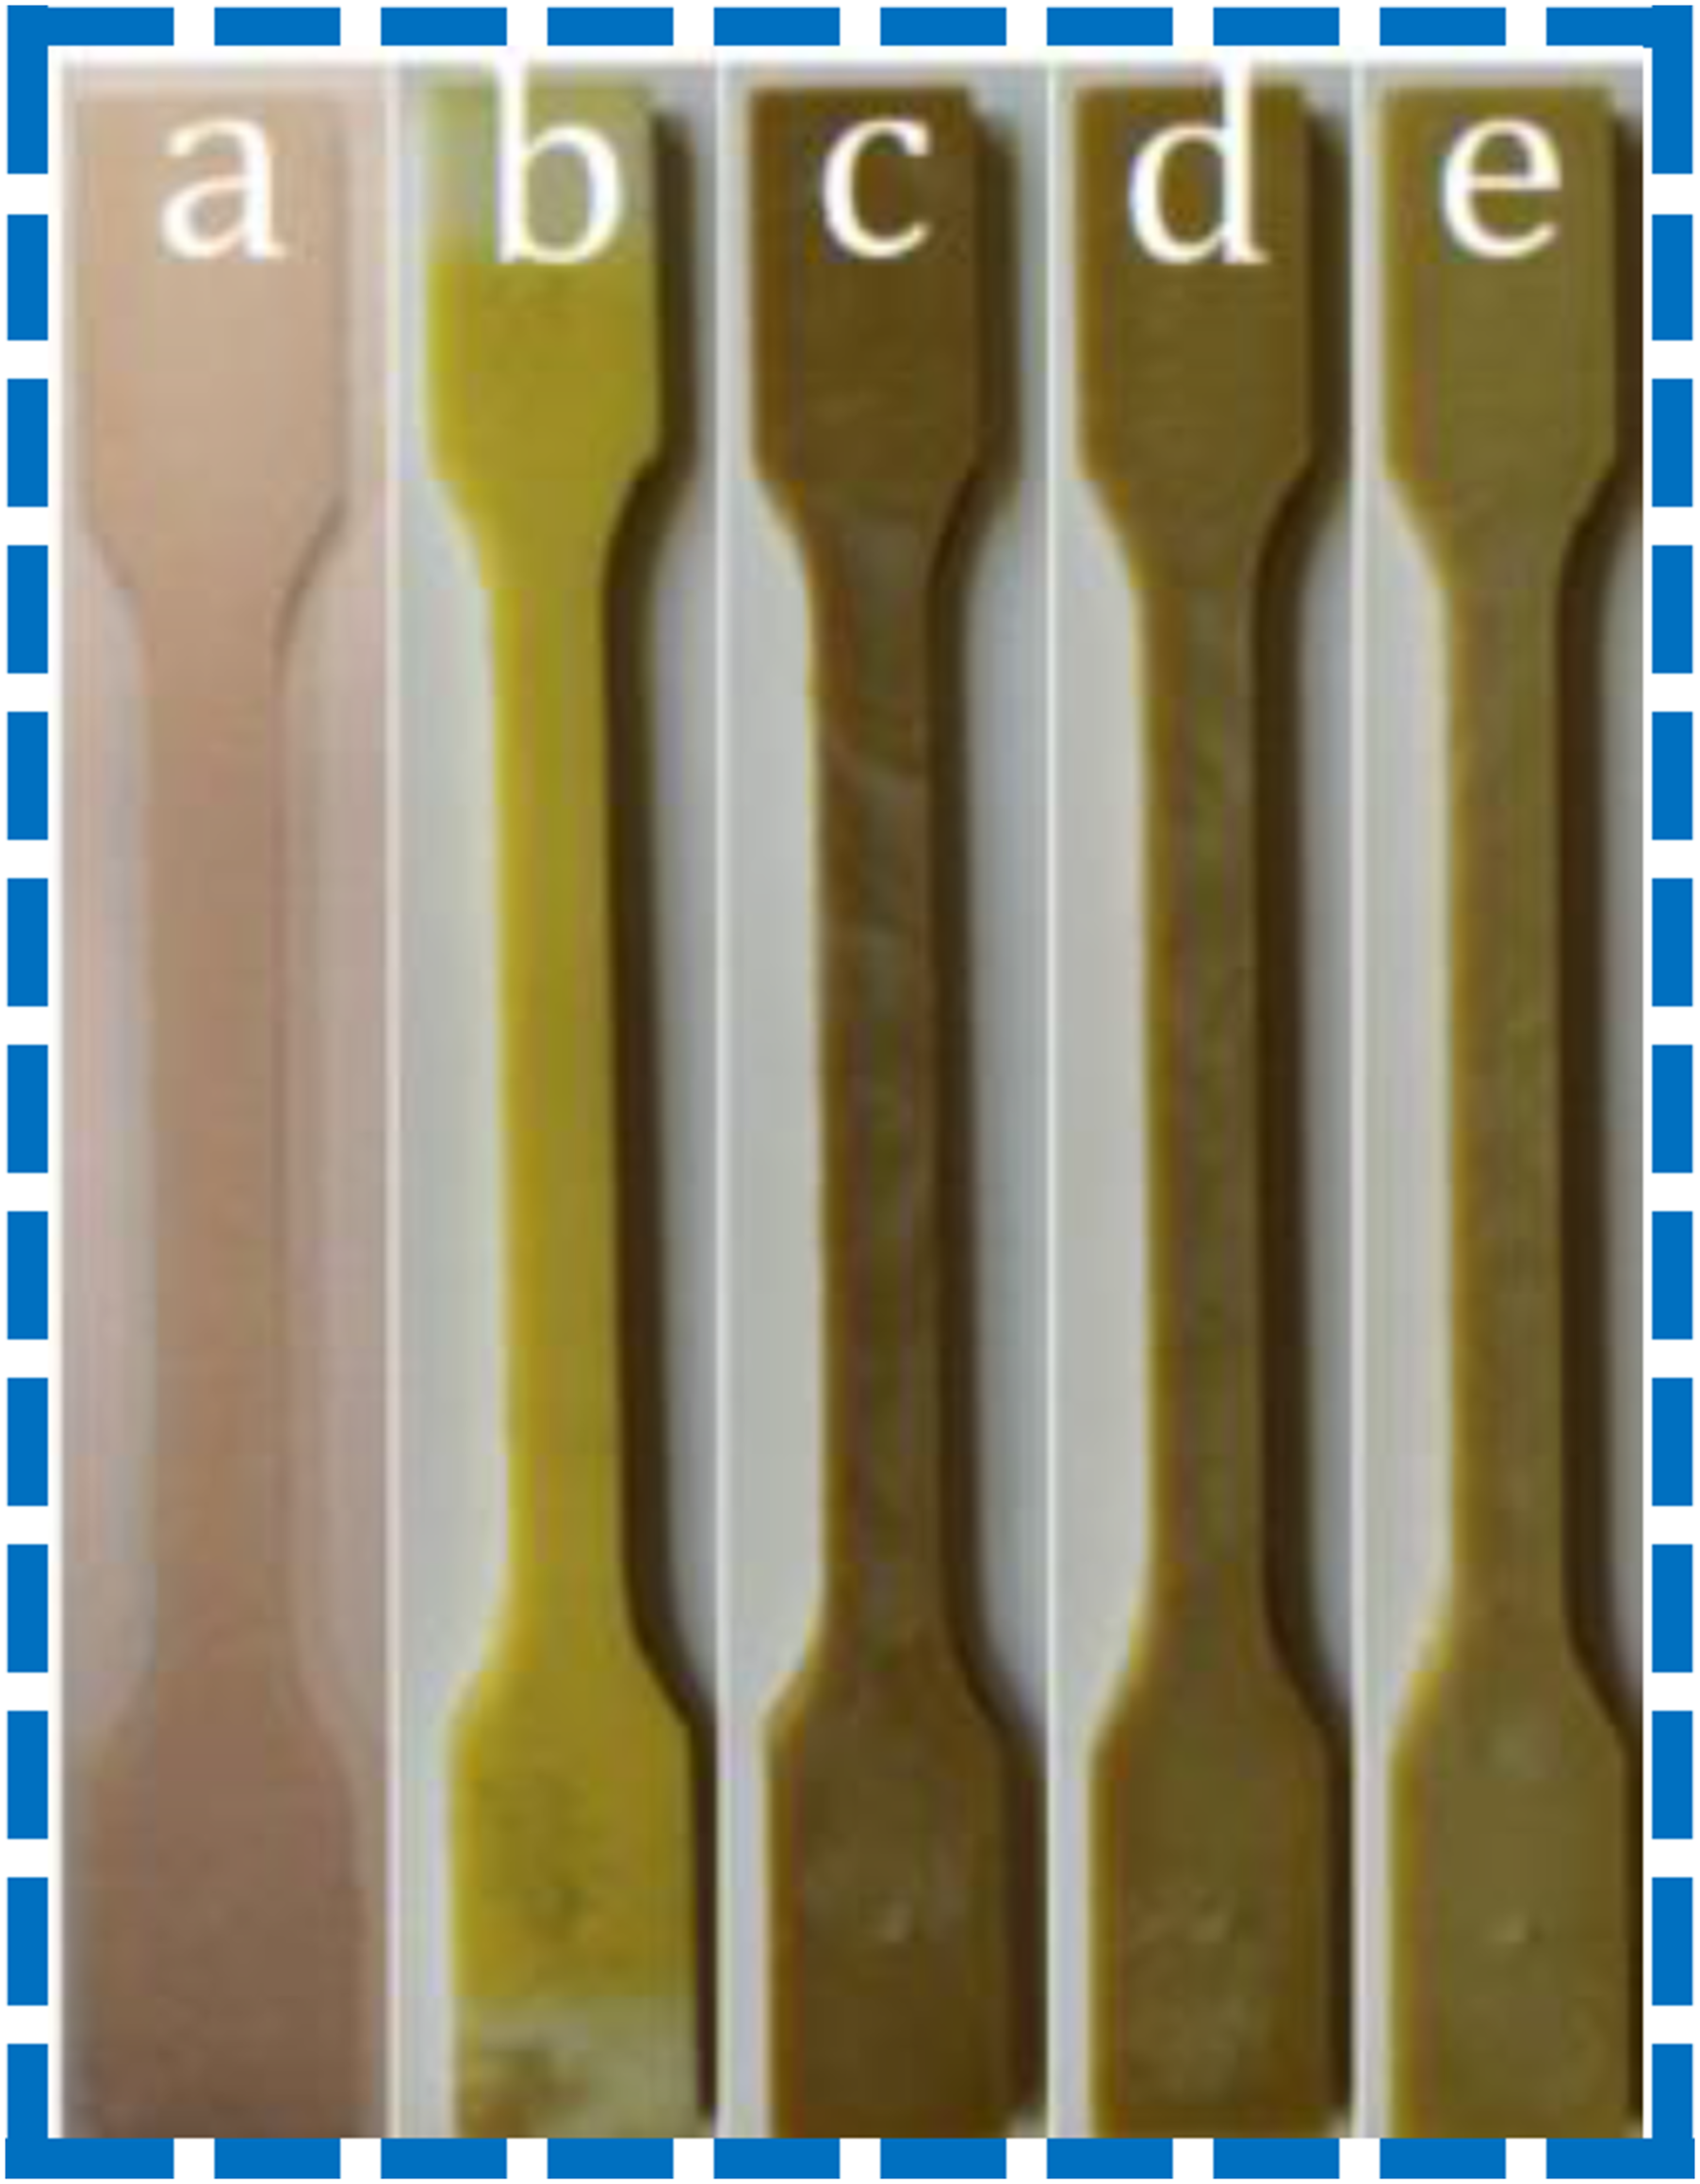
Images of PC/ABS/20 GF tensile test samples obtained before and after UV ageing are demonstrated in Figure 9. Color change (yellowing in color) was clearly observed with UV ageing. From SEM images, no significant change was observed on the surfaces of the samples after UV ageing. Visual and SEM images for surface of PC/ABS/20 GF composites aged artificially for (a) 0 h (It means unaged PC/ABS/20 GF composite.), (b) 48 h, (c) 144 h and (d) 336 h.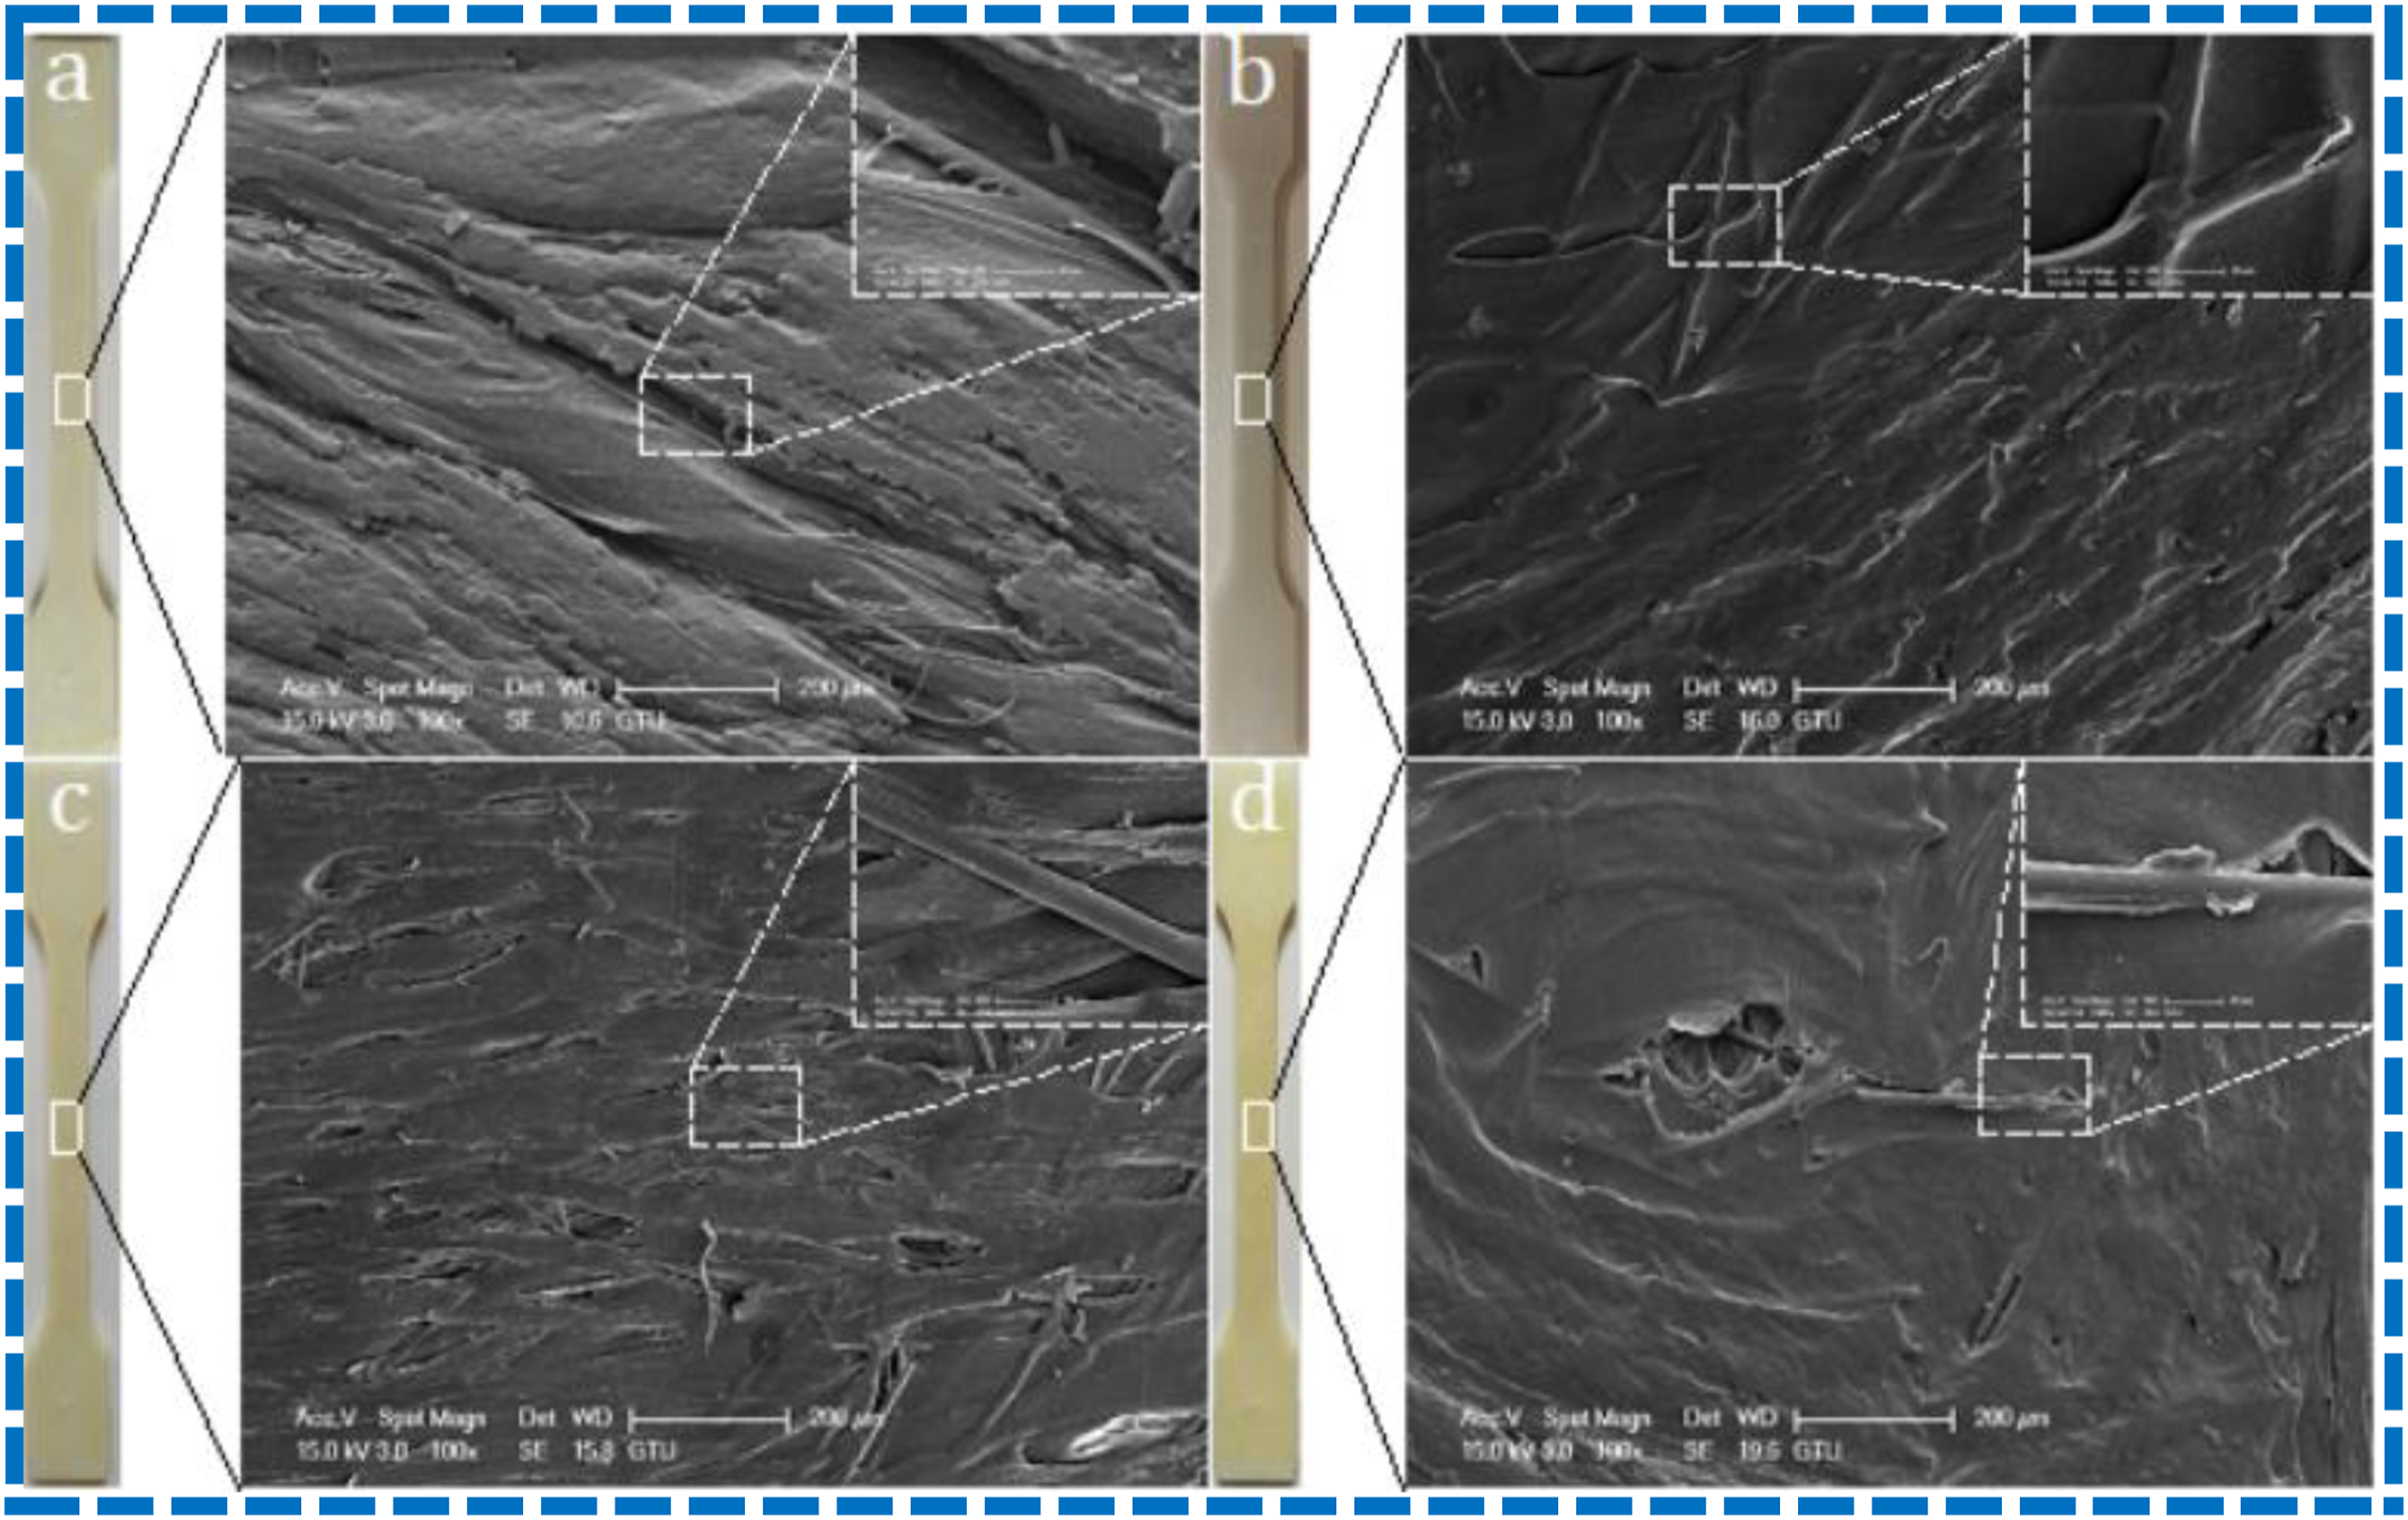
Images for tensile samples produced by reprocessing PC/ABS/20 GF samples after 336 h UV ageing then mixing them with pure PC/ABS/20 GF are given in Figure 10. Darkening was observed in the colors of the samples reprocessed after accelerated ageing and mixed with pure PC/ABS/20 GF at different ratios. Visual images for surface of PC/ABS/20 GF composites aged artificially for (a) 0 h (It means unaged PC/ABS/20 GF composite.) and (b) 336 h. Visual images for blends of virgin-artificially aged PC/ABS/20 GF composites. (c) 25V + R-UV, (d) 50V + R-UV and (e) 75V + R-UV.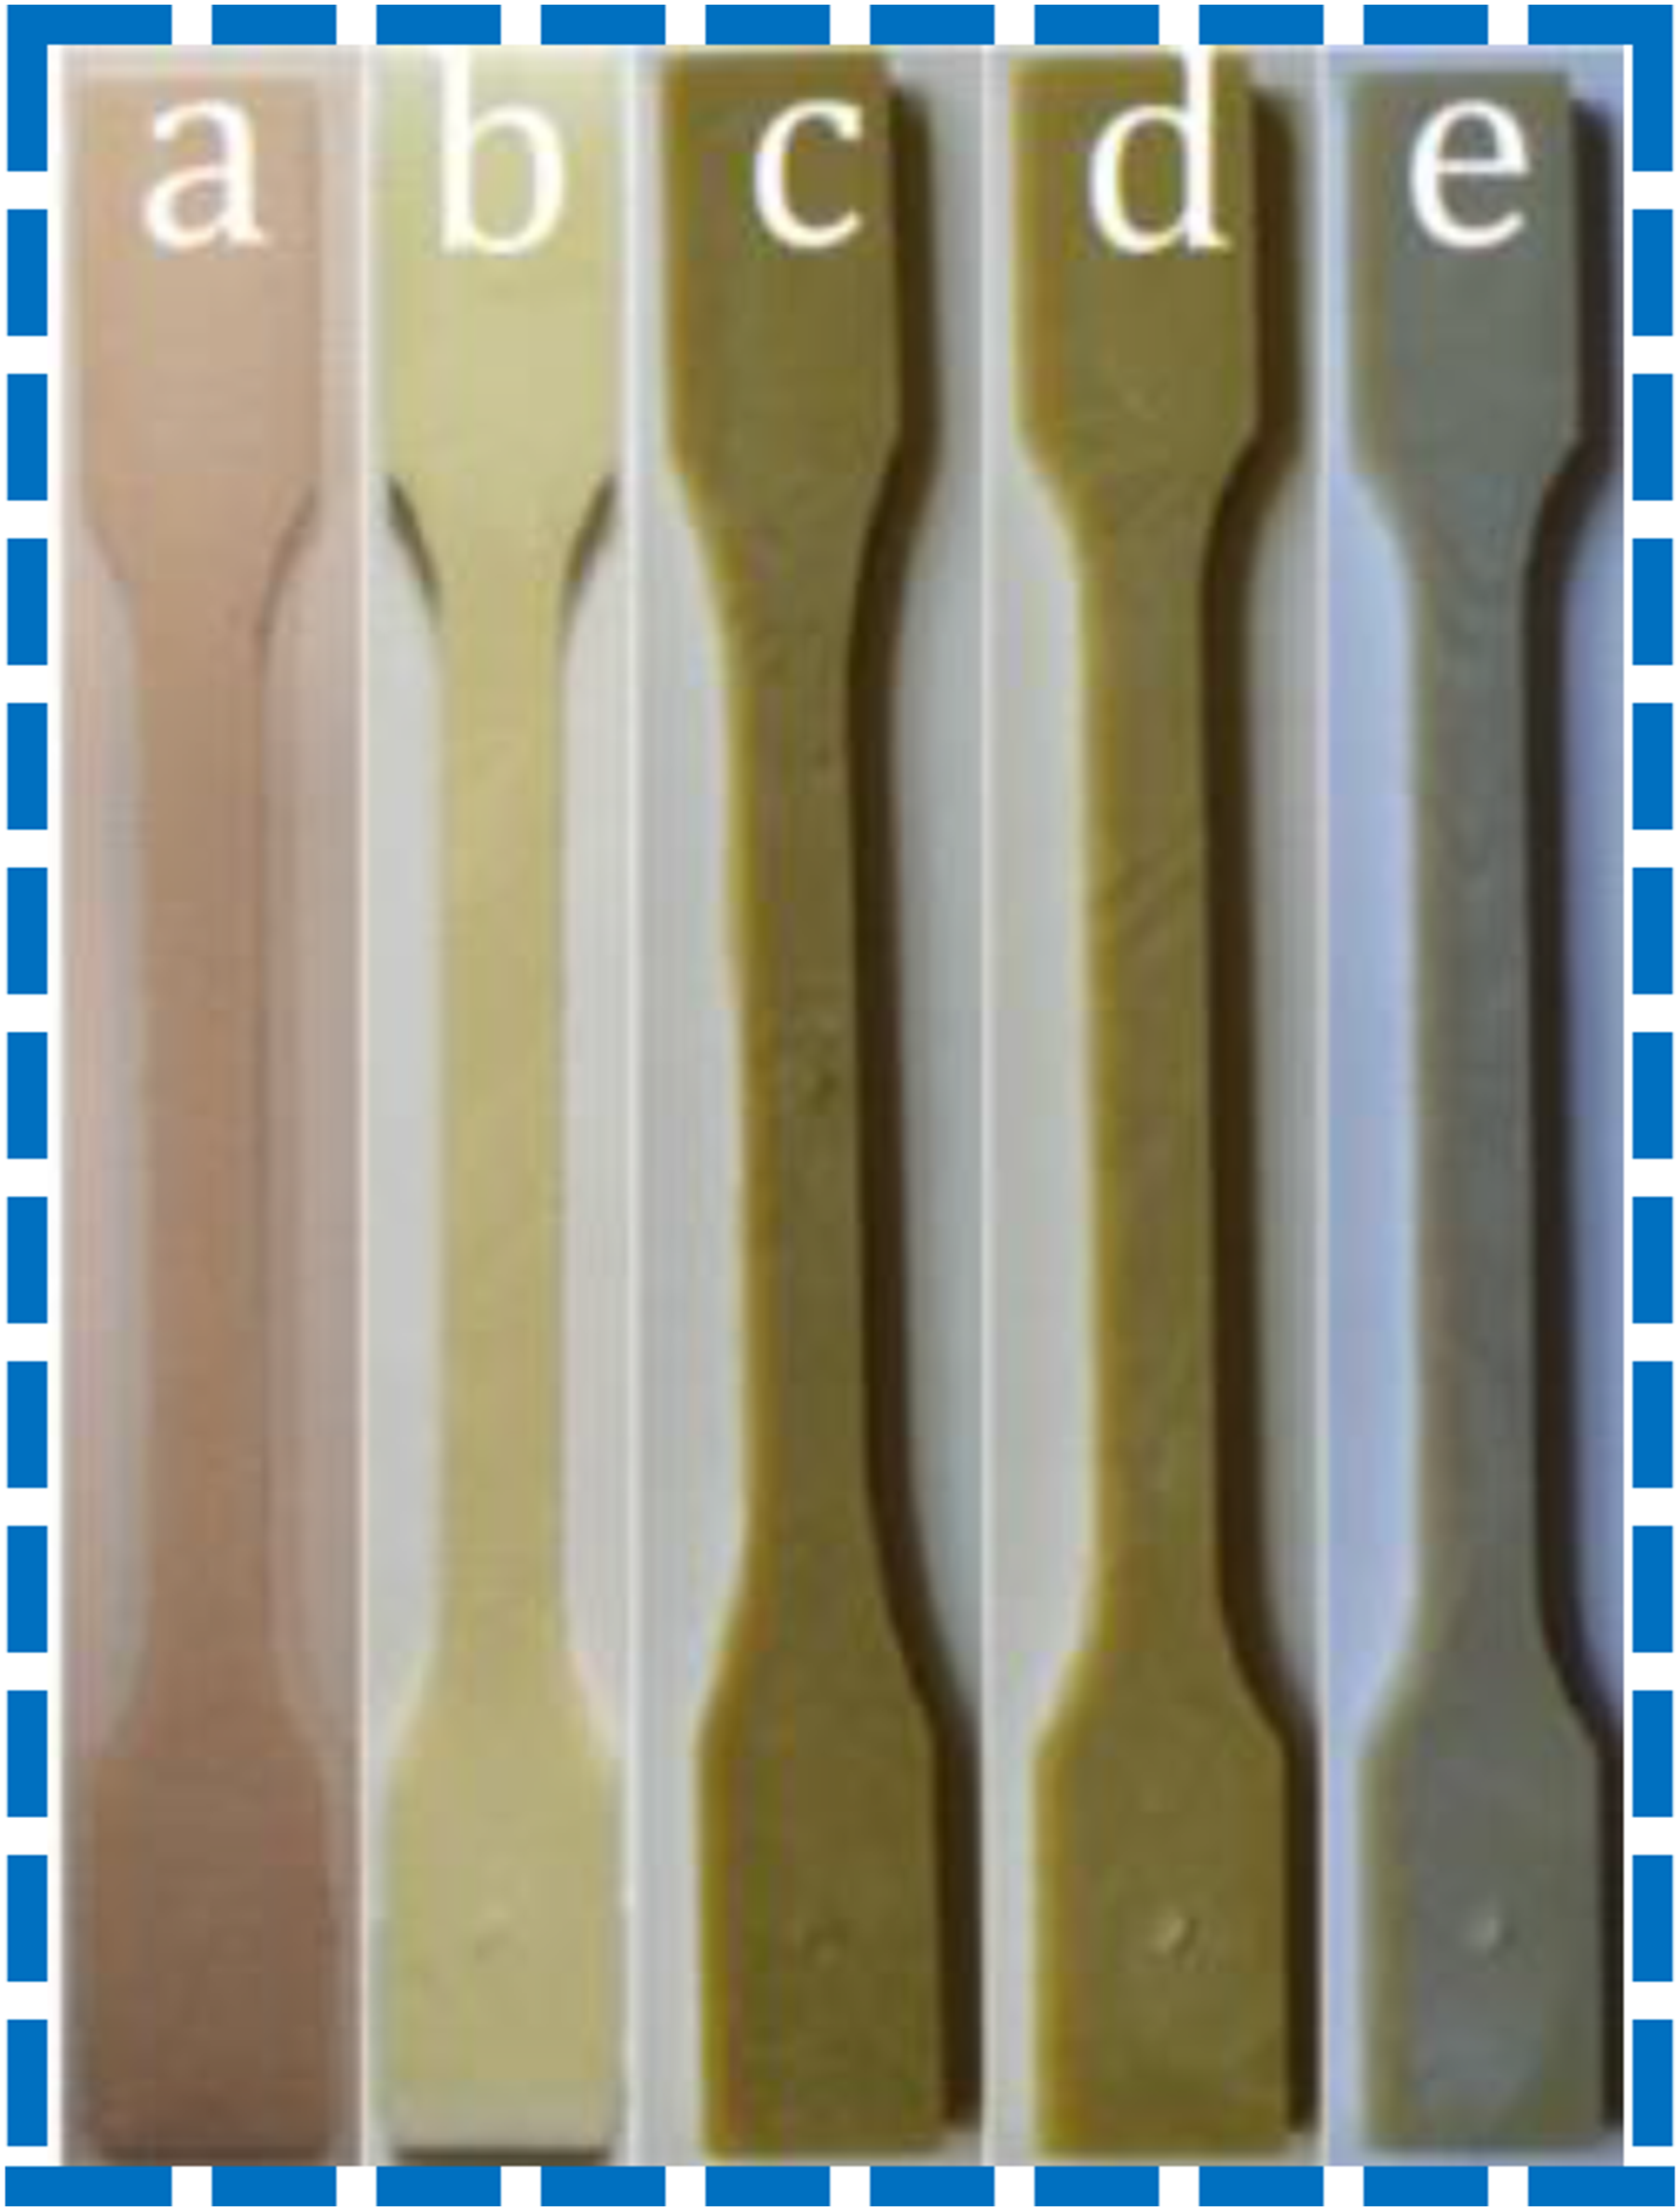
Images for PC/ABS/30 GF tensile test samples taken before and after natural ageing are presented in Figure 11. Color change (yellowing in color) was clearly seen in the samples with natural ageing. When the surfaces were examined with SEM, glass fibers became more evident on the polymer surface with natural ageing. Visual and SEM images for surface of PC/ABS/30 GF composites aged naturally for (a) 0 months (It means unaged PC/ABS/30 GF composite.), (b) 3 months, (c) 6 months, (d) 9 months and (e) 12 months.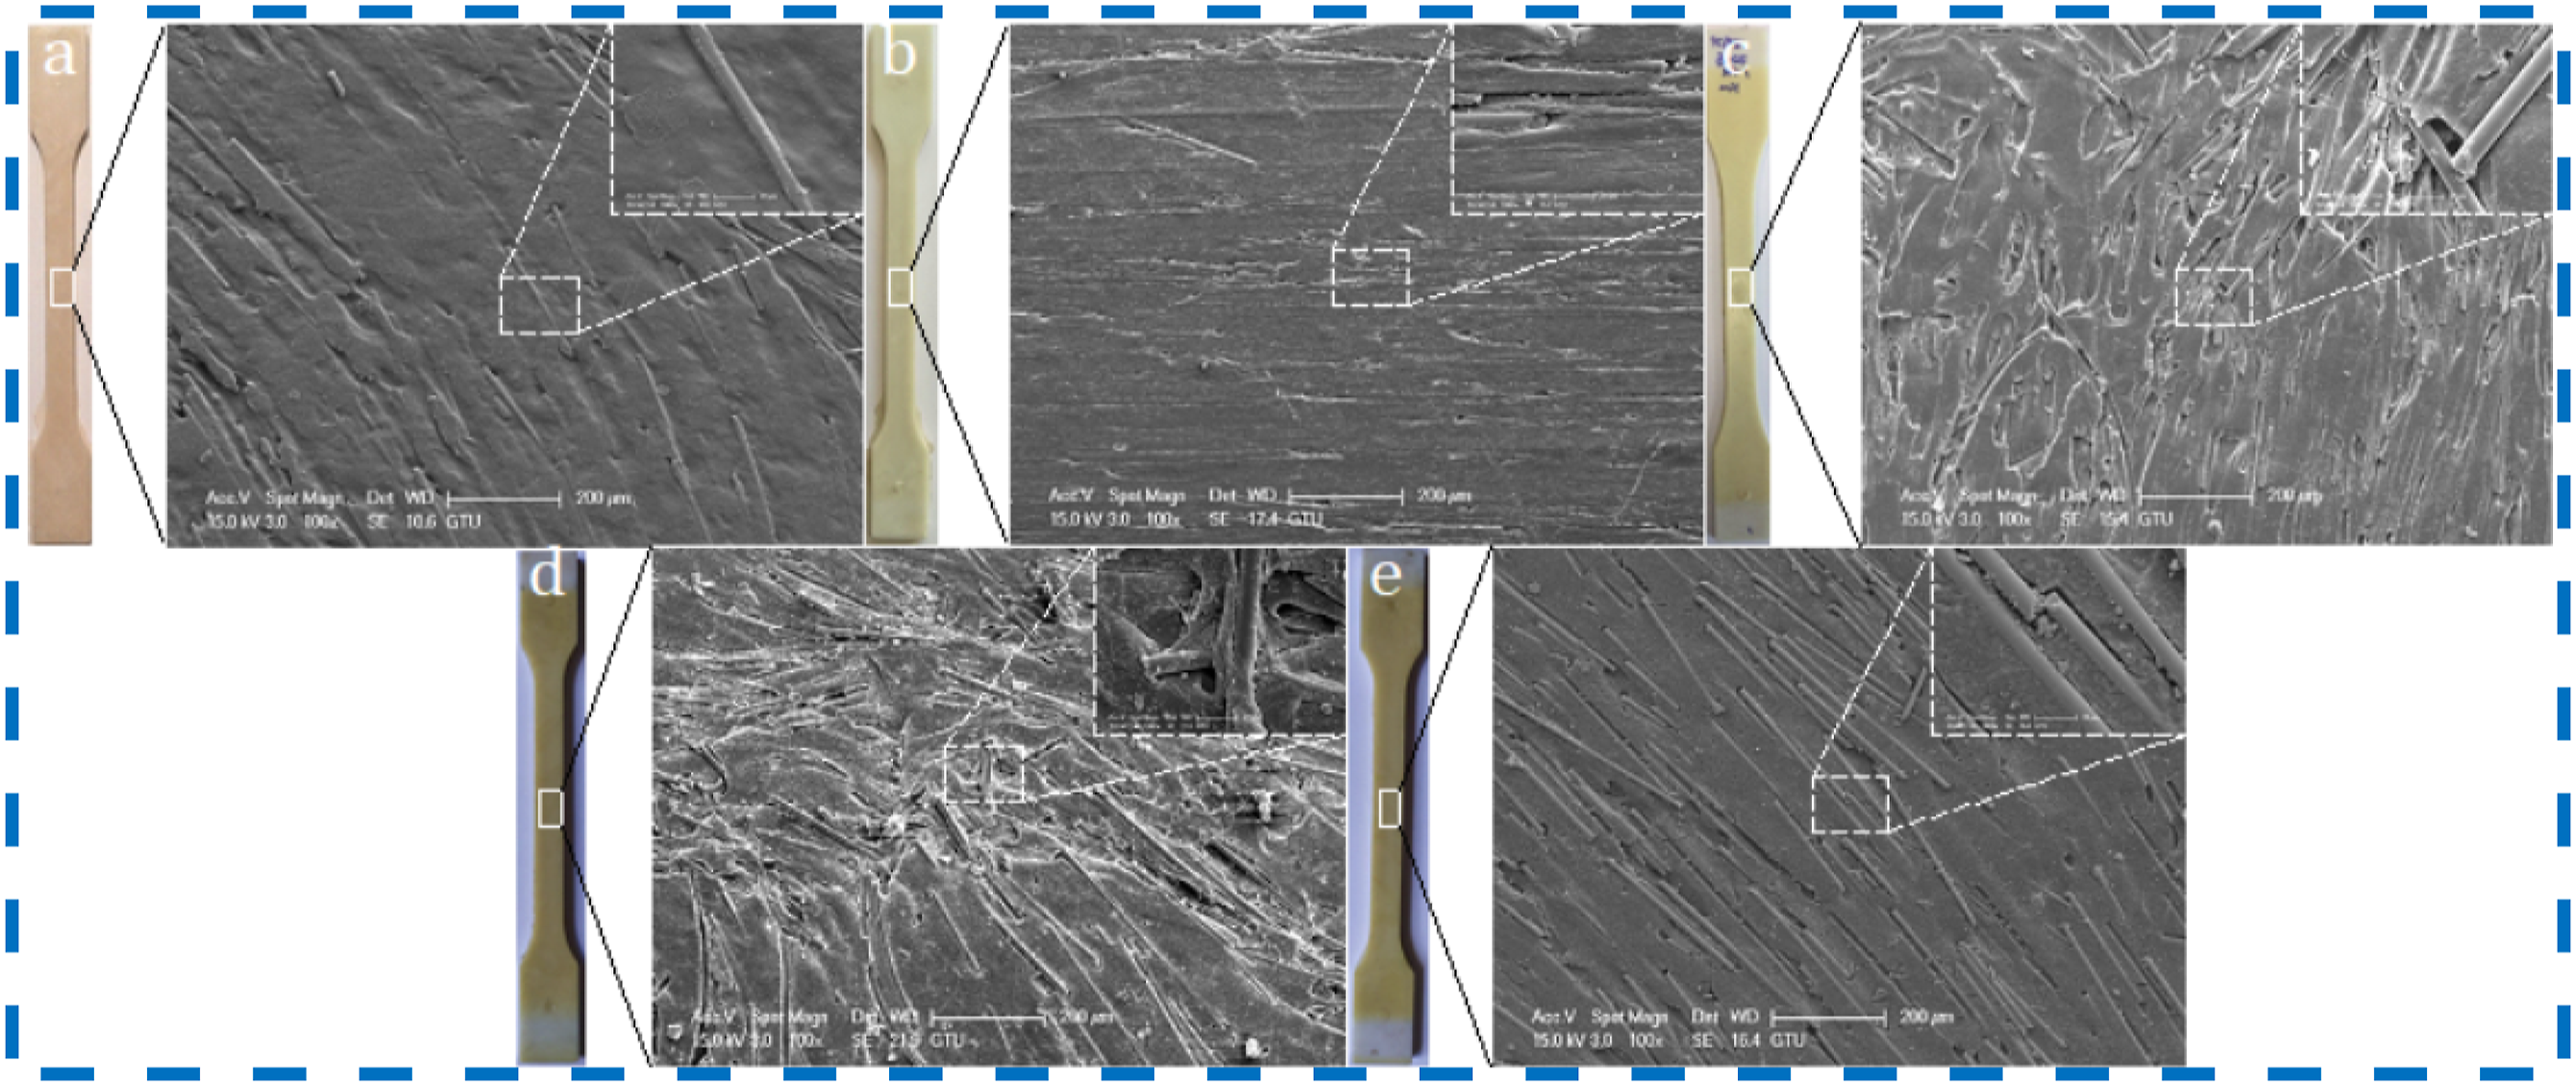
Images for tensile samples produced by reprocessing PC/ABS/30 GF samples after 12 months natural ageing then mixing them with pure PC/ABS/30 GF are given in Figure 12. For the samples reprocessed after natural ageing then mixed with pure PC/ABS/30 GF at different ratios, a color darkening of the samples was observed. As the aged material ratio decreased and the pure material ratio increased (75V + R-N), the colors of the samples became lighter. Visual images for surface of PC/ABS/30 GF composites aged naturally for (a) 0 months (It means unaged PC/ABS/30 GF composite.) and (b) 12 months. Visual images for blends of virgin-naturally aged PC/ABS/30 GF composites. (c) 25V + R-N, (d) 50V + R-N and (e) 75V + R-N.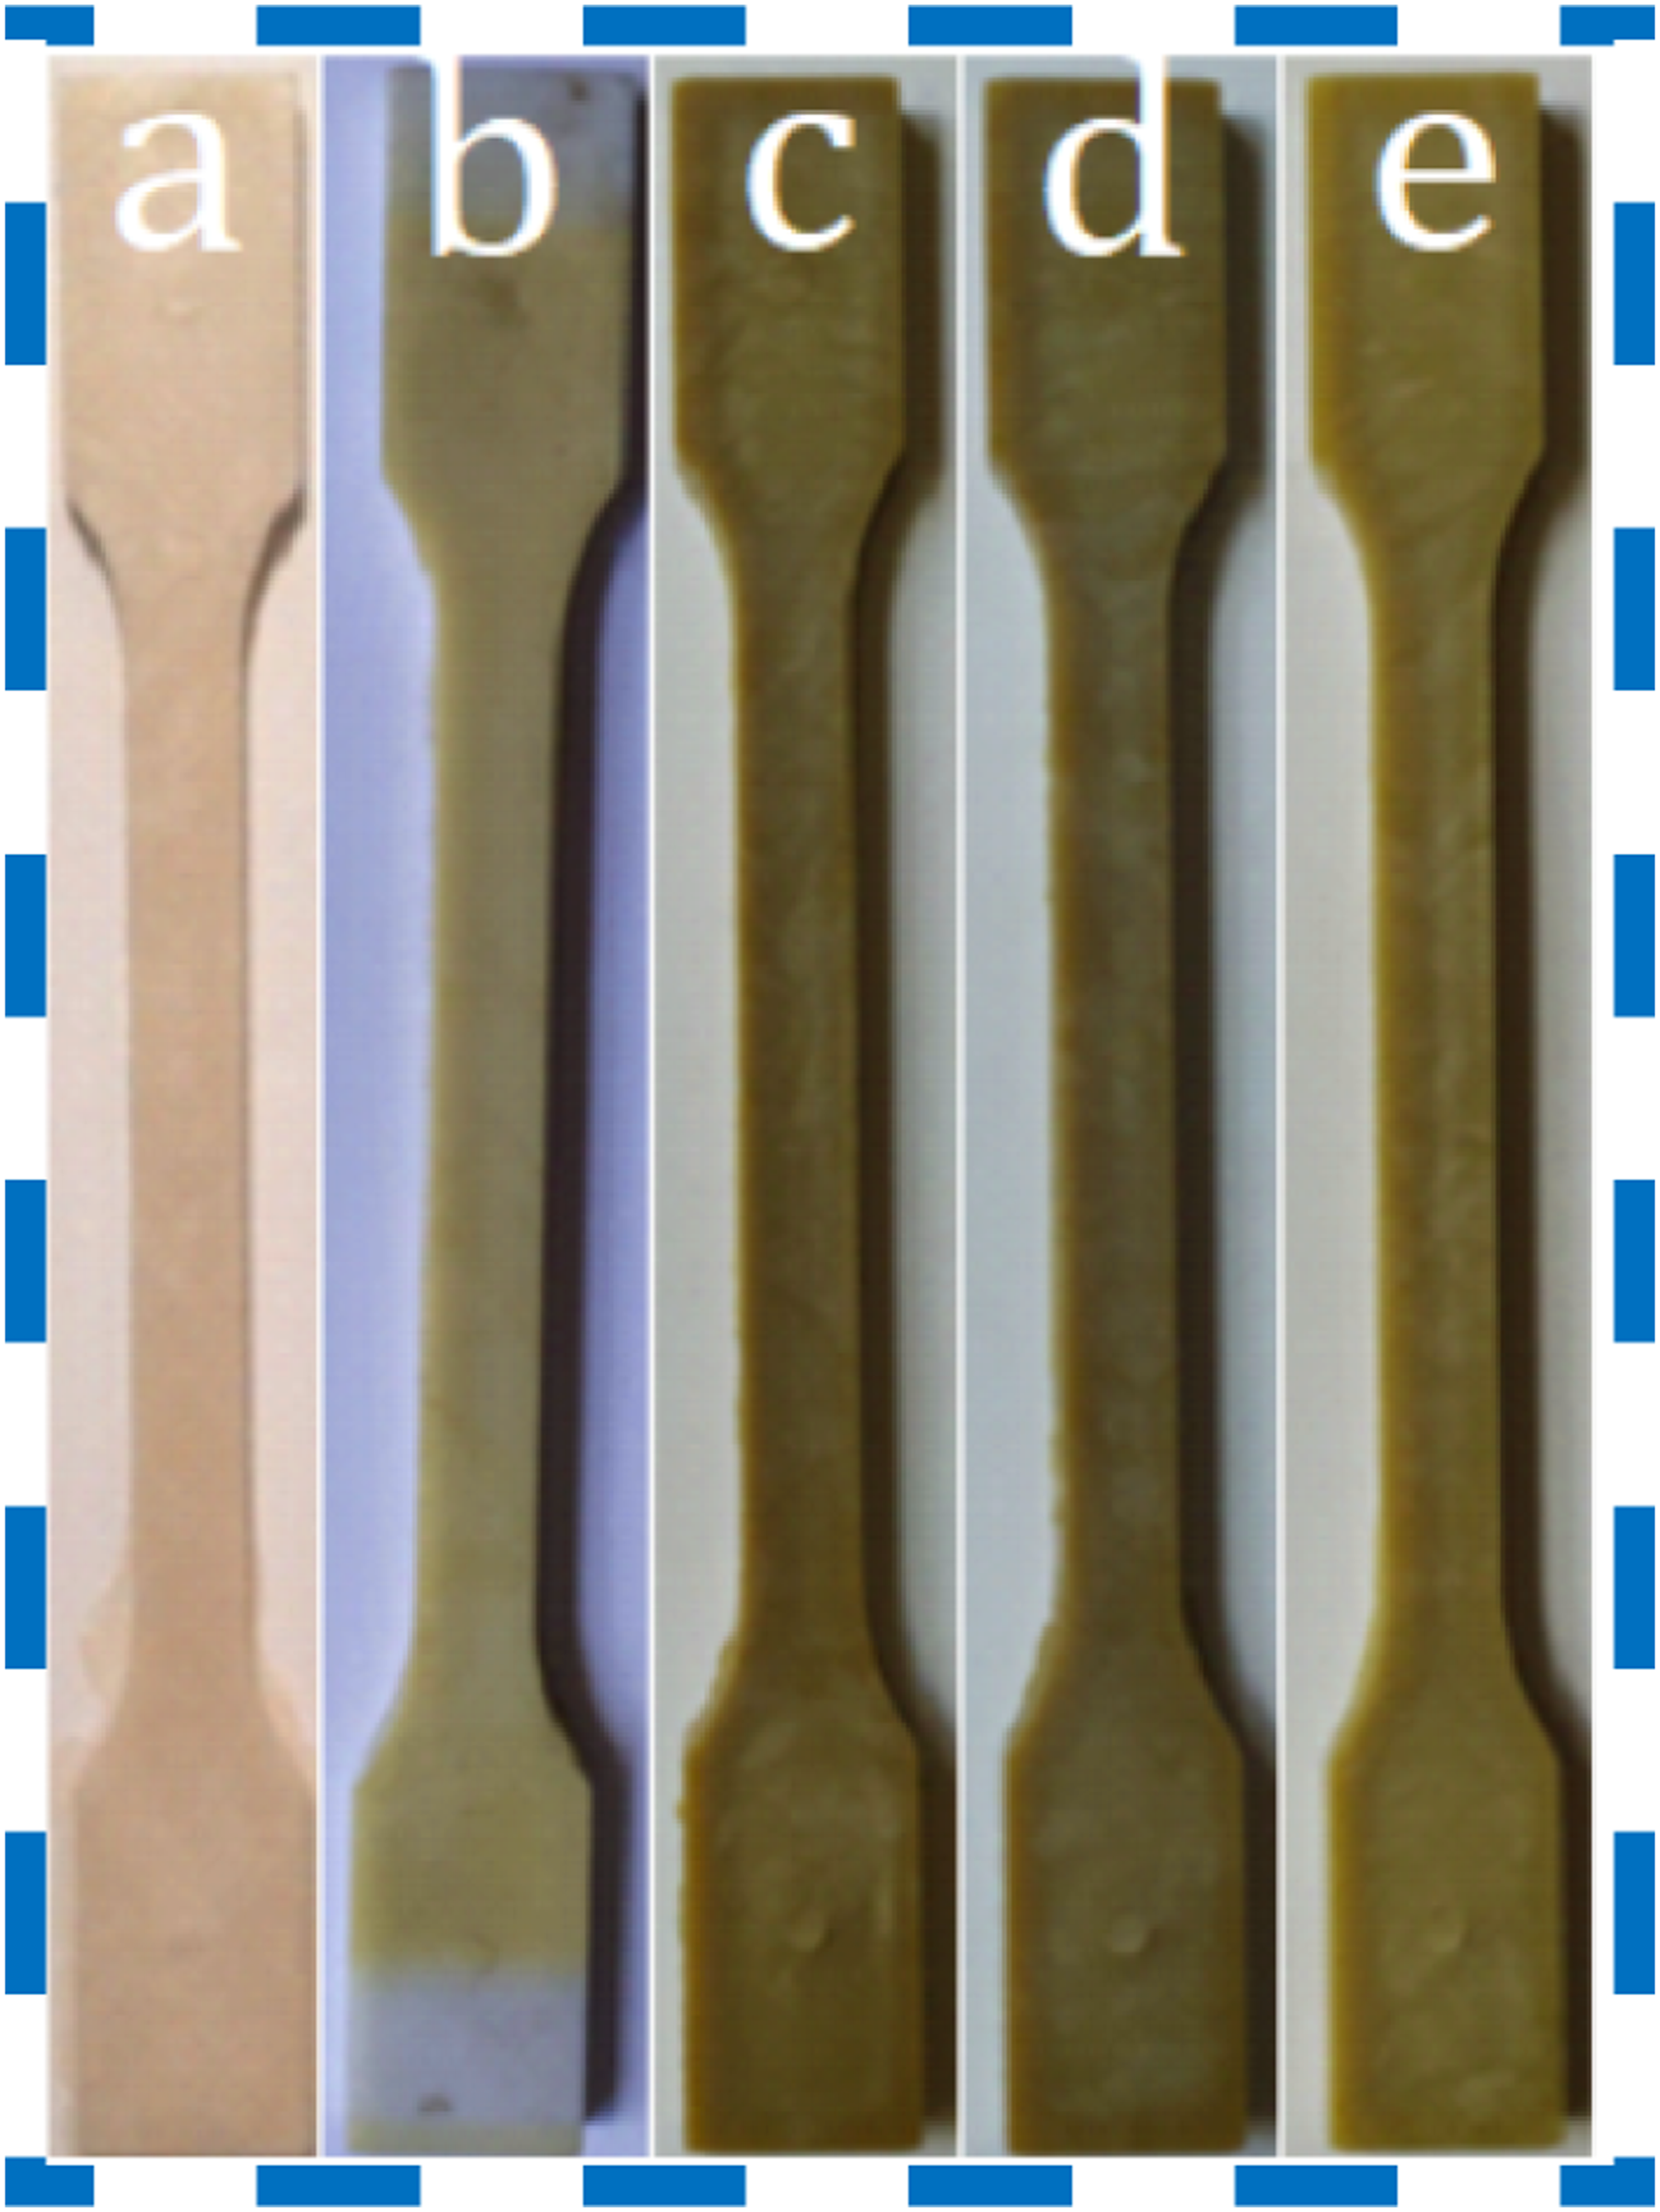
Images for PC/ABS/30 GF tensile test samples taken before and after UV ageing are demonstrated in Figure 13. Color change (yellowing in color) was clearly seen after UV ageing. When the surfaces were examined with SEM, glass fibers became more evident on the polymer surface with UV ageing. Visual and SEM images for surface of PC/ABS/30 GF composites aged artificially for (a) 0 h (It means unaged PC/ABS/30 GF composite.), (b) 48 h, (c) 144 h and (d) 336 h.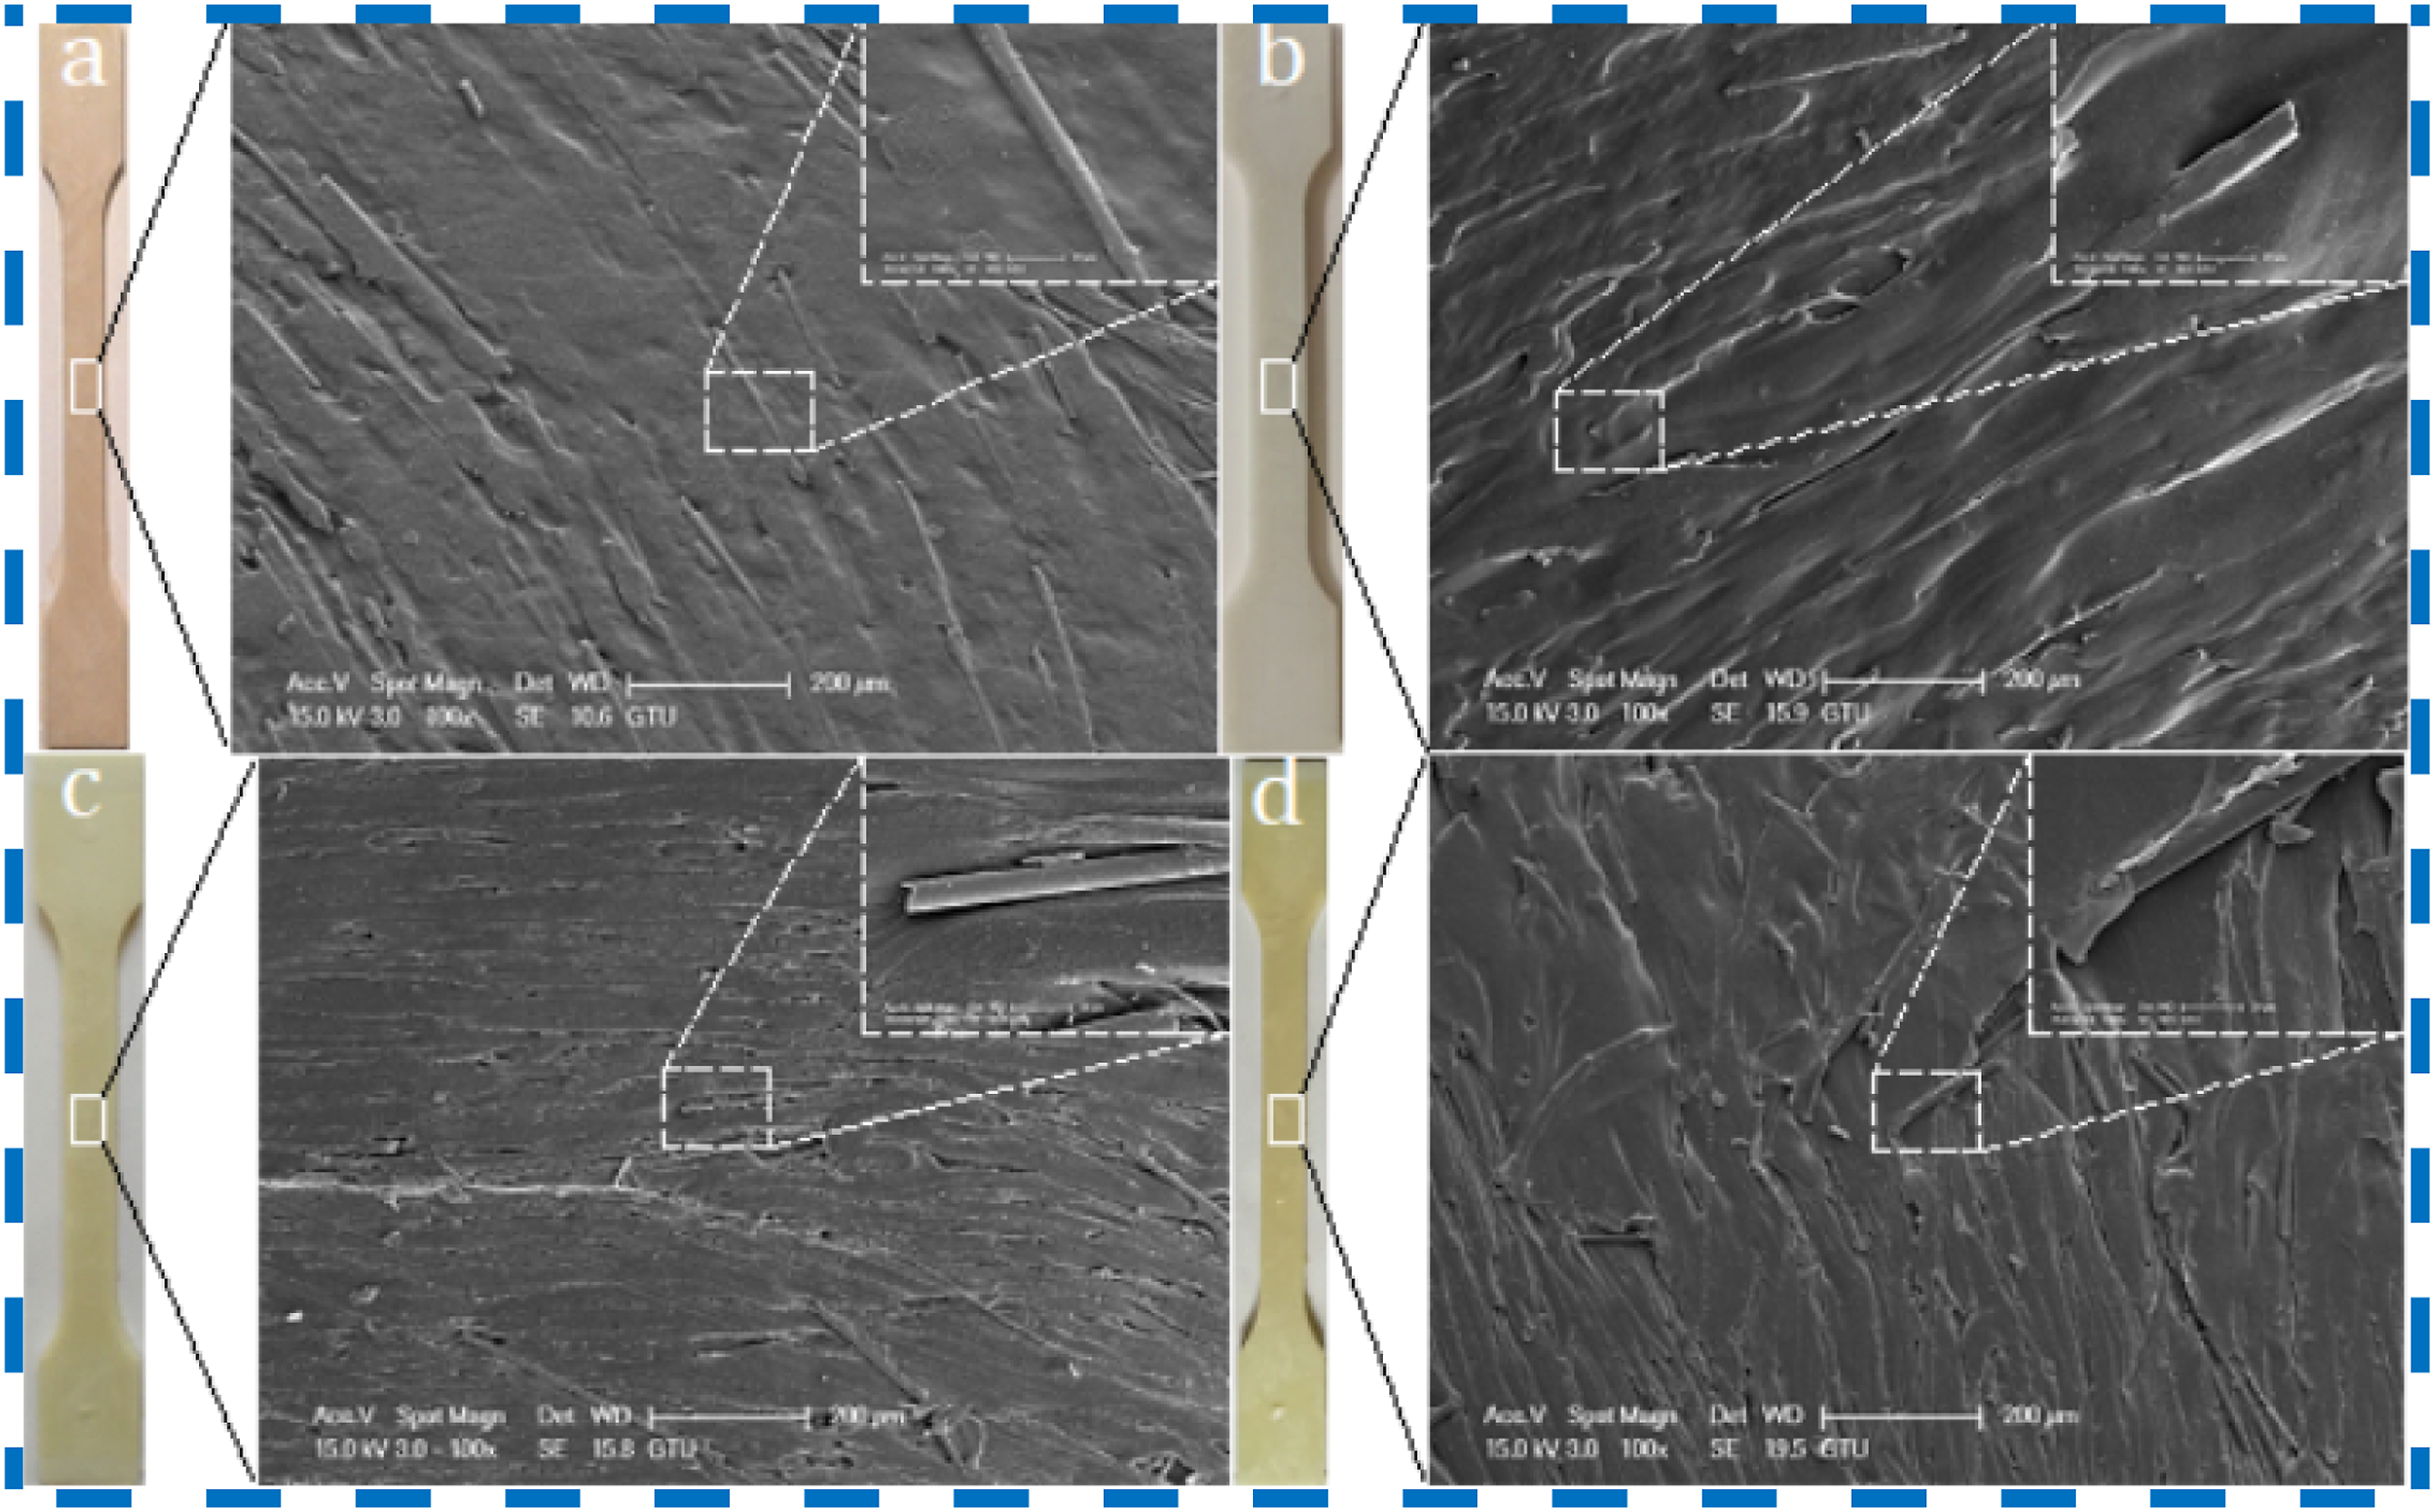
Images for tensile samples produced by reprocessing PC/ABS/30 GF samples after 336 h UV ageing then mixing them with pure PC/ABS/30 GF are presented in Figure 14. For the samples reprocessed after UV ageing then mixed with pure PC/ABS/30 GF at different ratios, a color darkening of the samples was observed. As the aged material ratio decreased and the pure material ratio increased (75V + R-UV), the colors of the samples became lighter. Visual images for surface of PC/ABS/30 GF composites aged artificially for (a) 0 h (It means unaged PC/ABS/30 GF composite.) and (b) 336 h. Visual images for blends of virgin-artificially aged PC/ABS/30 GF composites. (c) 25V + R-UV, (d) 50V + R-UV and (e) 75V + R-UV.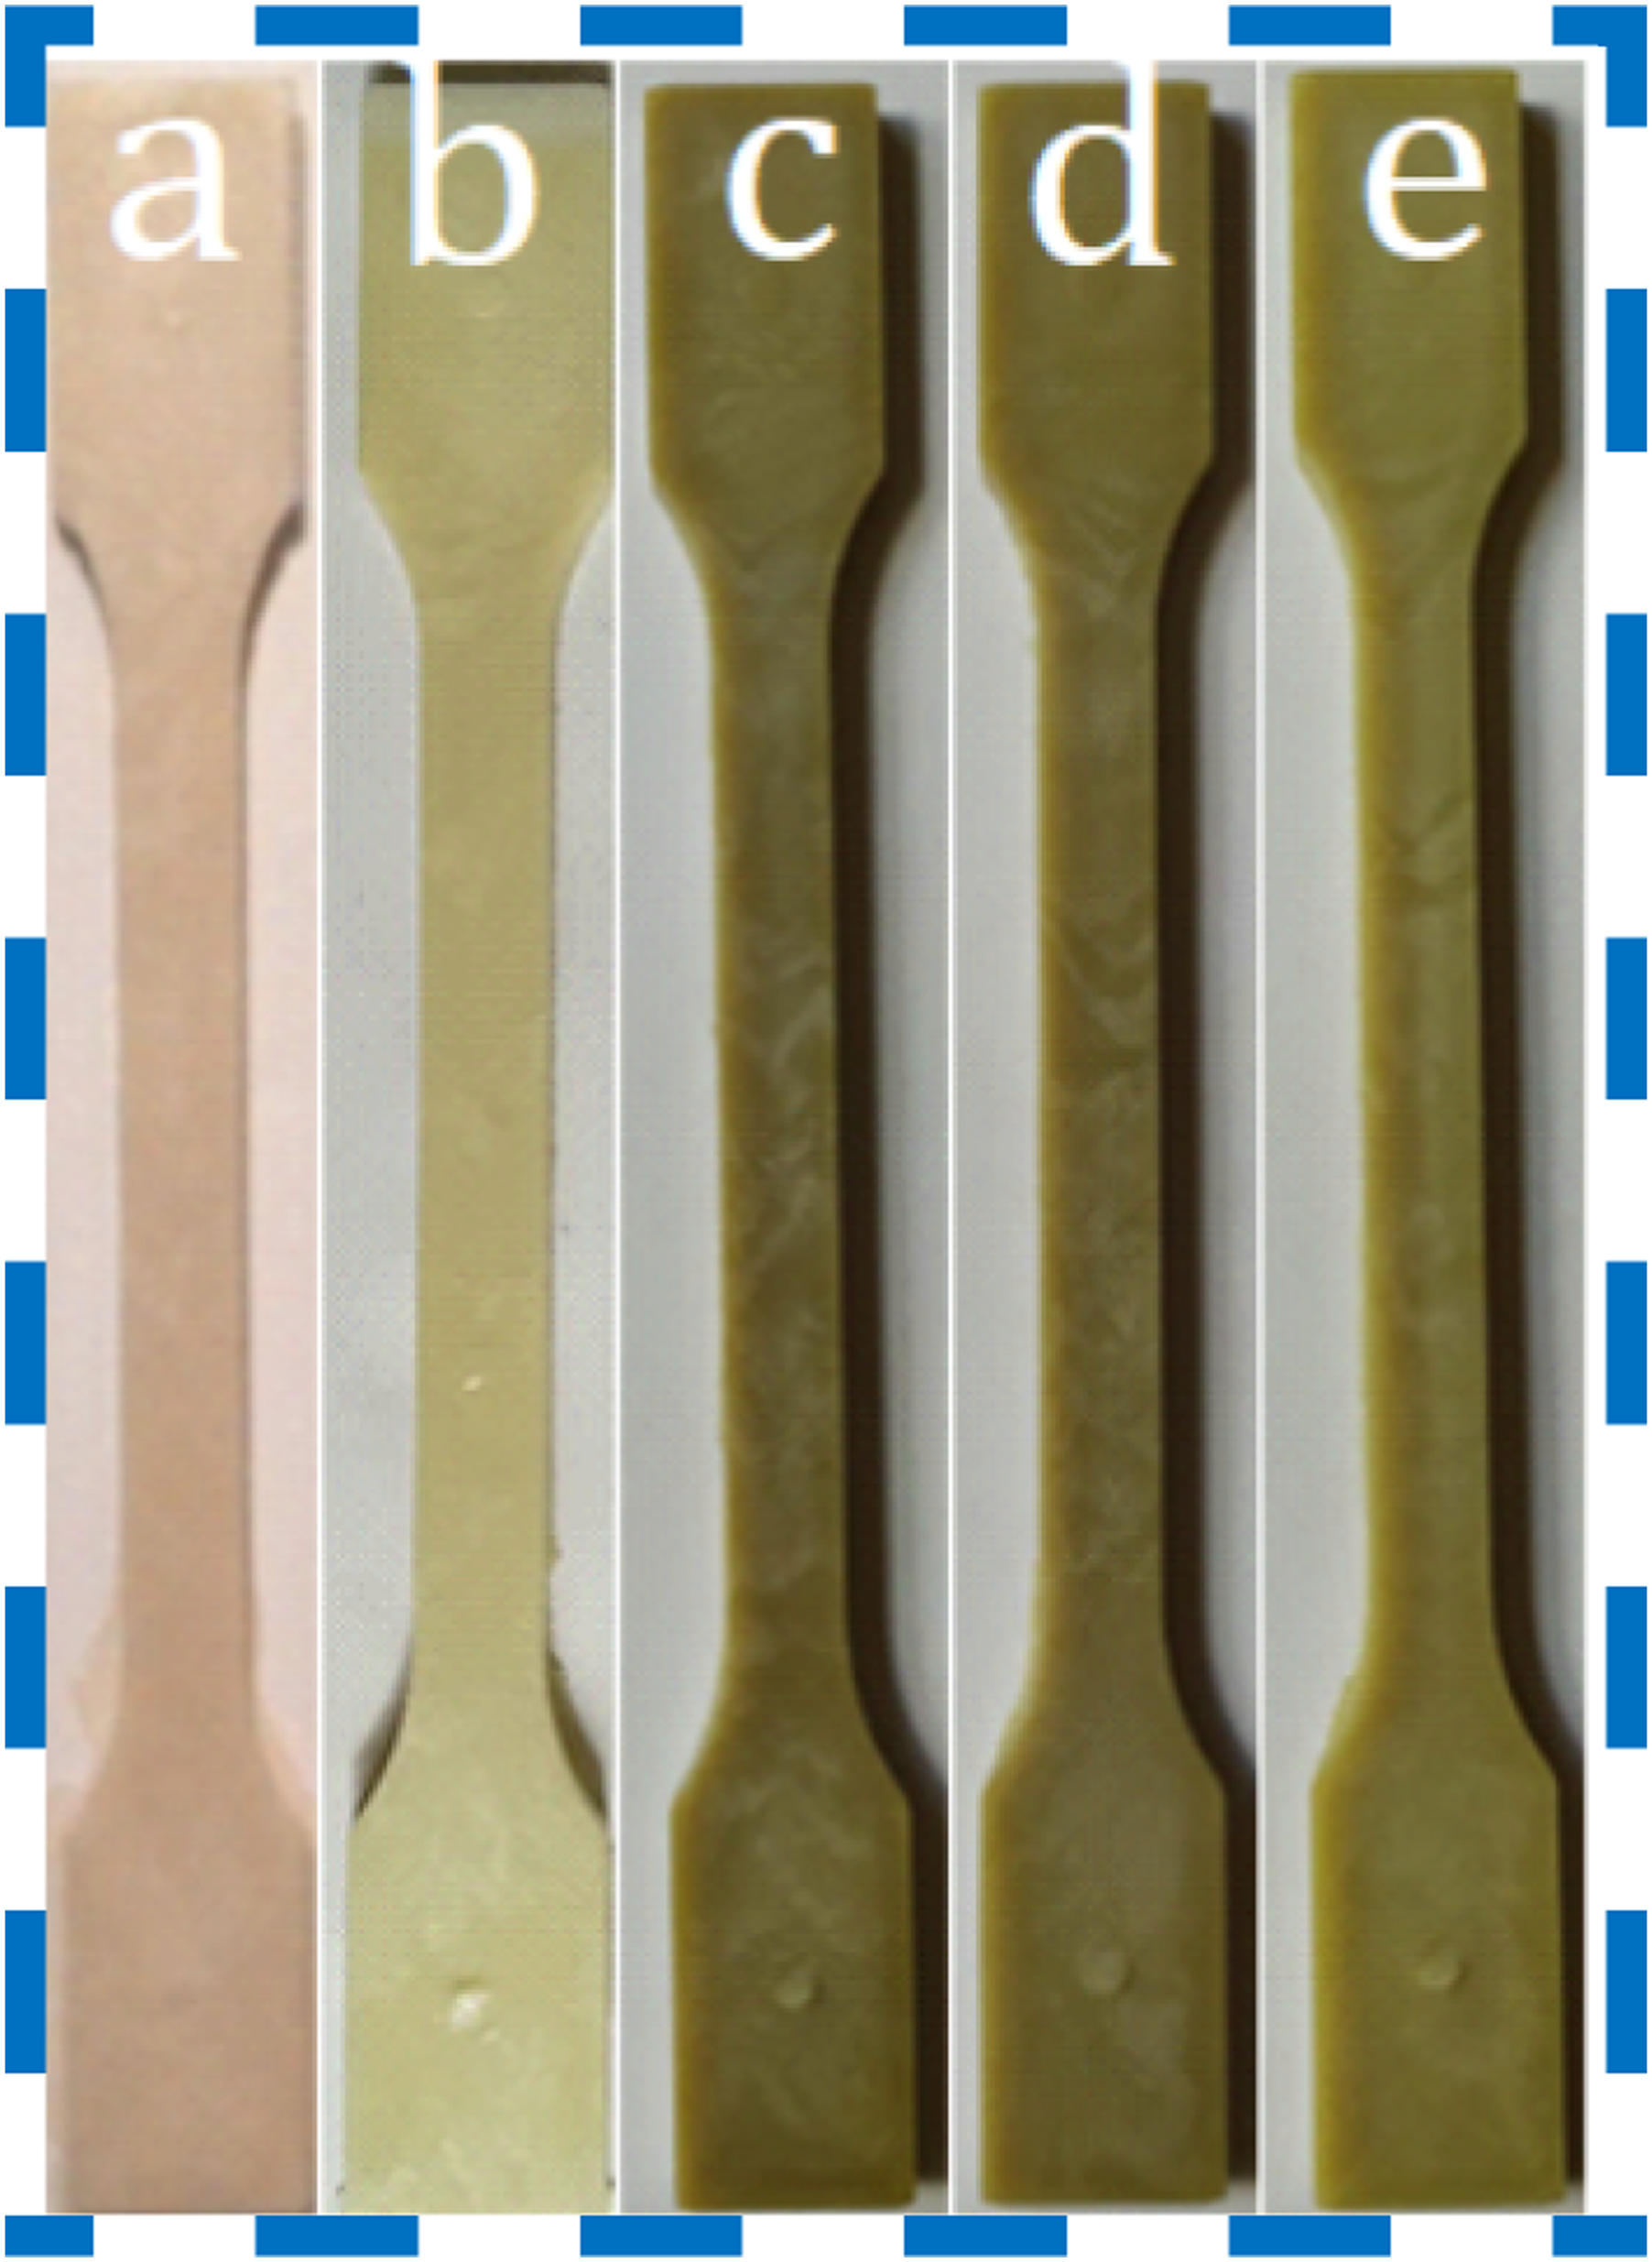
Mechanical properties
Tensile results
Tensile test sample, device and results are given from Figure 15(a)–15(l). Tensile tests were carried out in accordance with ISO 527-1
20
standard (Figure 15(a)) by Instron 5569 universal testing device (Figure 15(b)). Stress-strain curves in Figure 15(c)–(e) demonstrate that weathering had no significant influence on the tensile curves. With the increase in glass fiber addition ratio, tensile strength increased, and strain value decreased. For PC/ABS/30 GF composite, high tensile strength values were obtained before natural and UV ageing. Stress-strain behavior of 10% glass fiber reinforced PC/ABS composites (PC/ABS/10 GF) before and after natural ageing are shown in Figure 15(c). Unaged and aged samples gave similar stress-strain curve behavior. PC/ABS/10 GF composites before and after natural ageing for 3, 6, 9 and 12 months failed with little or no plastic deformation. The samples broke after reaching the maximum stress, giving very little elongation. Average elongation at break and tensile strength after natural ageing for PC/ABS/10 GF composite are presented in Figure 15(i)‒15(k), respectively. It was found that the elongation at break decreased with natural ageing (Figure 15(i)). After 12 months of natural ageing, the elongation at break decreased by 44.43%. In general, it was found that the tensile strength decreased with natural ageing (Figure 15(k)). After 12 months of natural ageing, the tensile strength decreased by 18.25%. Tensile test. (a) Dimensions of tensile test sample (all dimensions are in mm). (b) Universal test machine for test. (c) Tensile stress-strain graphs for PC/ABS/10 GF composite before and after natural ageing. (d) Tensile stress-strain graphs for PC/ABS/20 GF composite before and after natural ageing. (e) Tensile stress-strain graphs for PC/ABS/30 GF composite before and after natural ageing. (f) Tensile stress-strain graphs for PC/ABS/10 GF composite before and after UV ageing. (g) Tensile stress-strain graphs for PC/ABS/20 GF composite before and after UV ageing. (h) Tensile stress-strain graphs for PC/ABS/30 GF composite before and after UV ageing. (i) Elongation at break results for naturally aged samples. (j) Elongation at break results for artificially UV aged samples. (k) Tensile strength results for naturally aged samples. (l) Tensile strength results for artificially UV aged samples.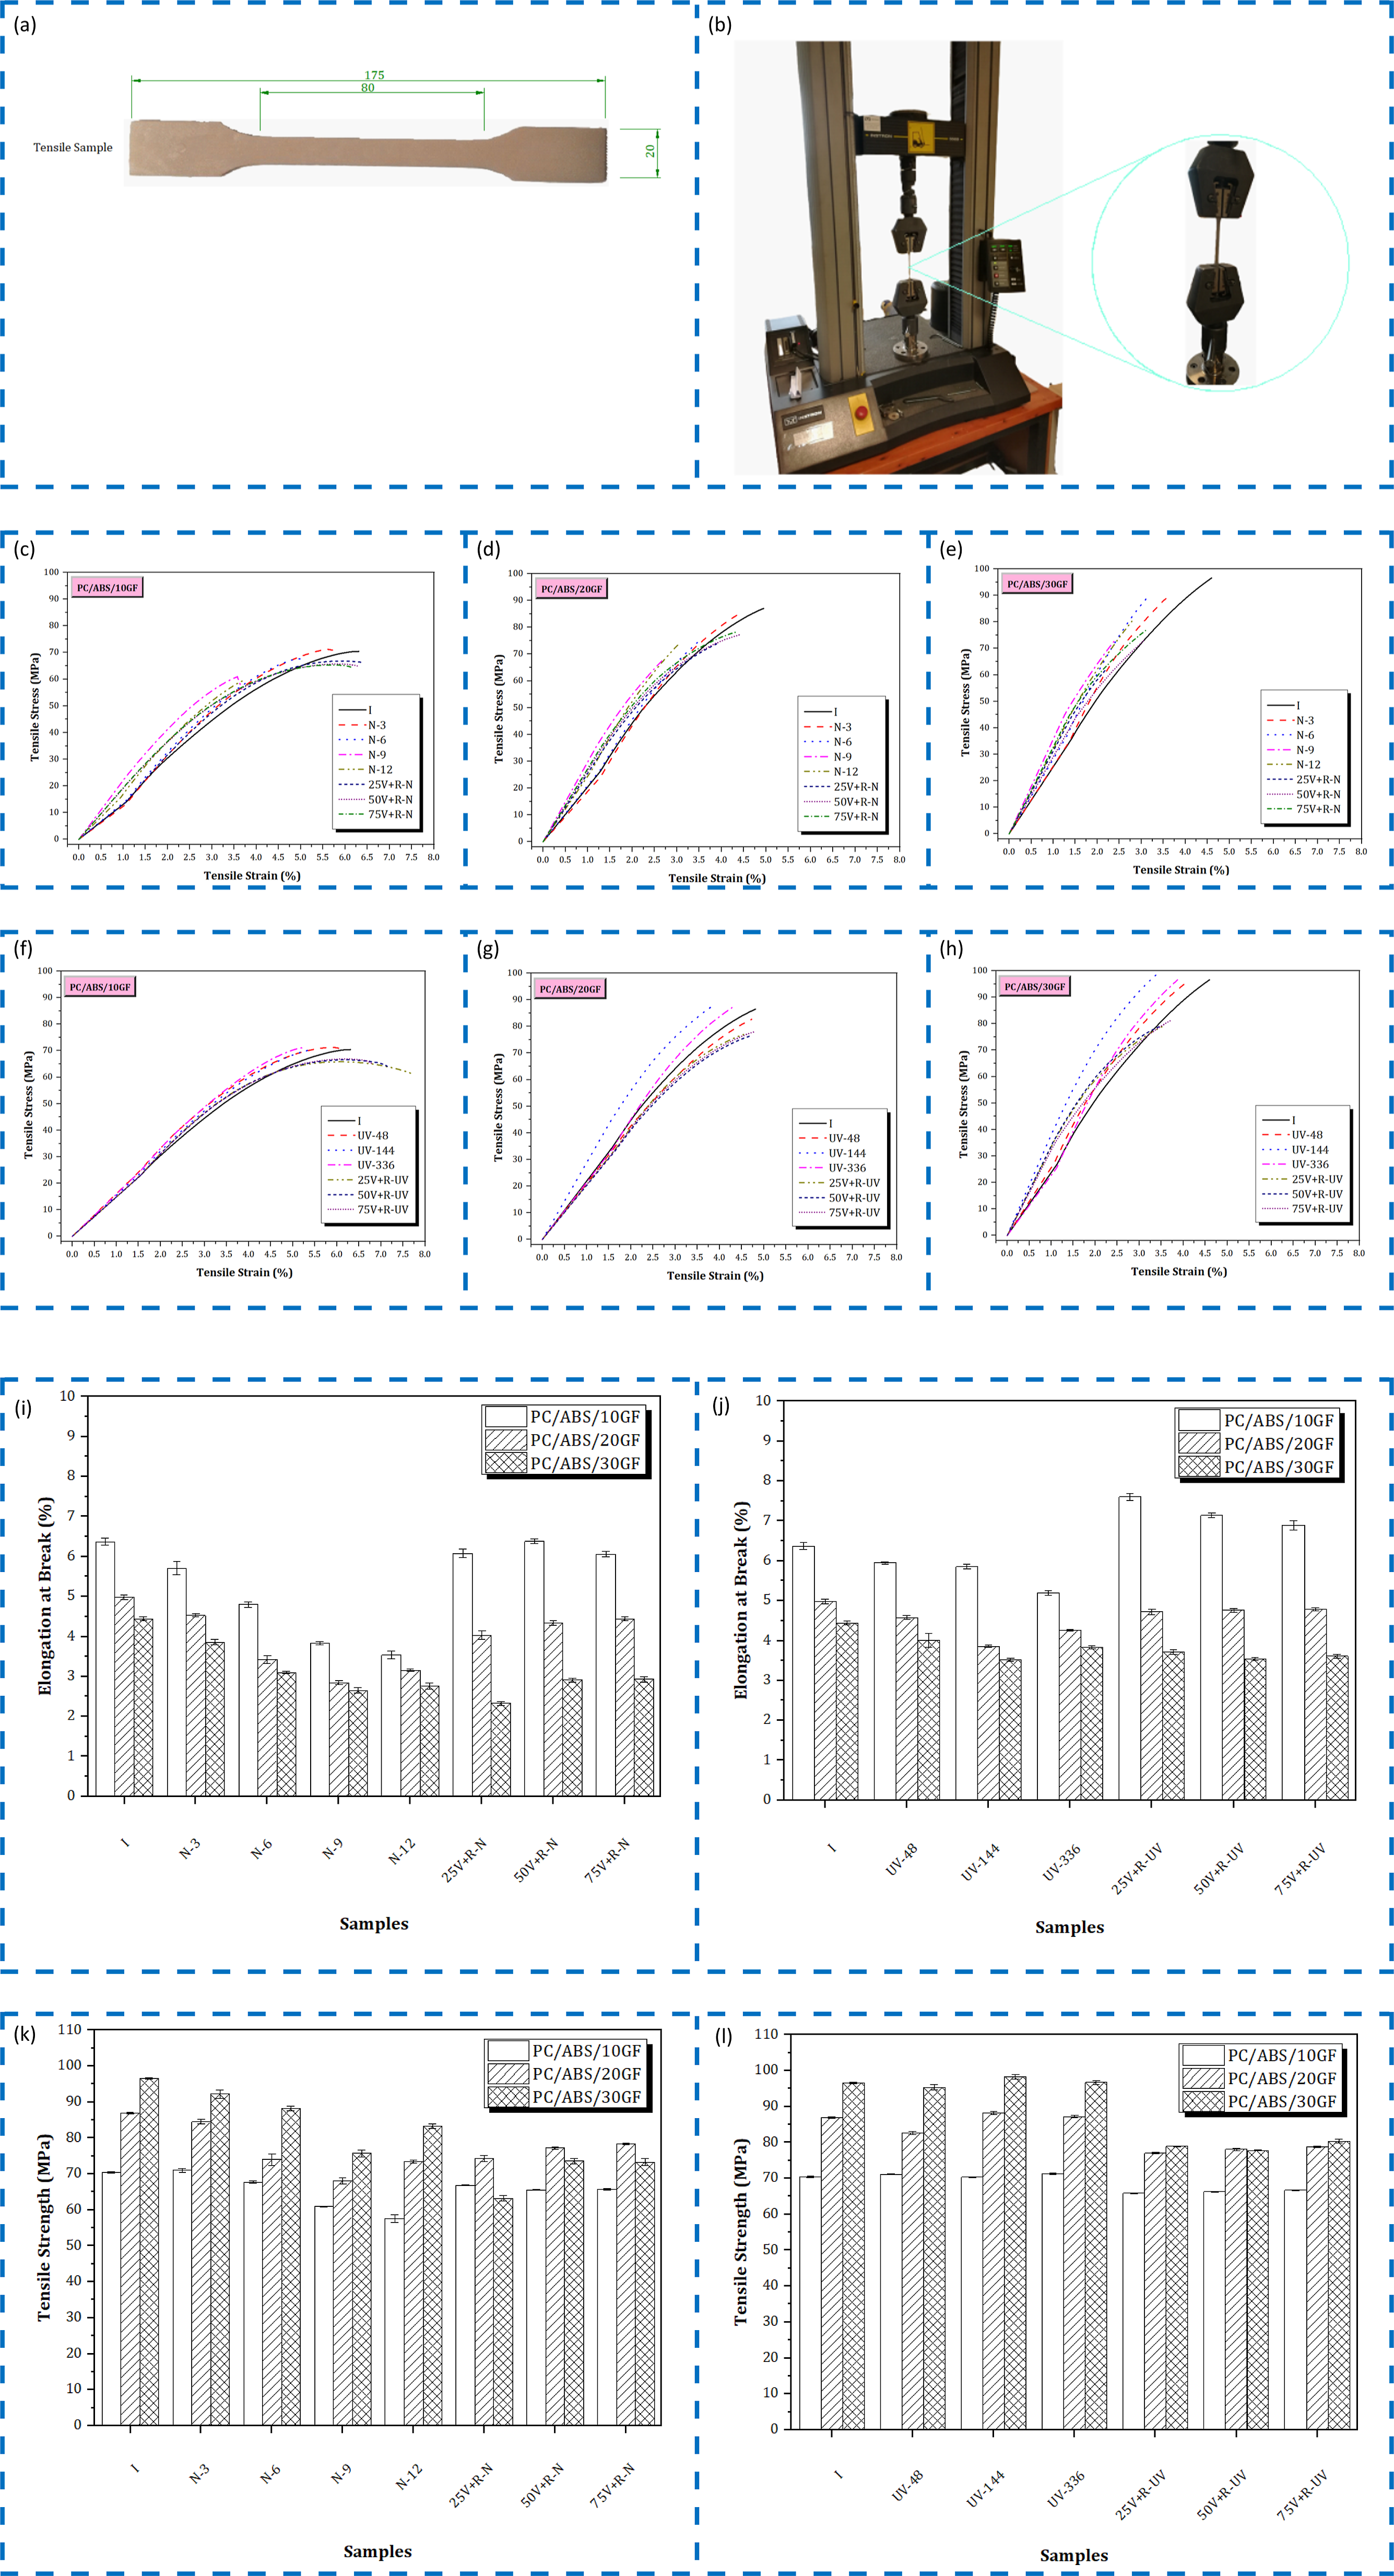
Stress-strain graph of PC/ABS/10 GF samples exposed to reprocessing after natural ageing then mixing with pure PC/ABS/10 GF is demonstrated in Figure 15(c). The samples broke after reaching the maximum stress, demonstrating very little elongation. The relationship between the elongation at break and tensile strength values with respect to the addition ratios are presented in Figure 15(i) and 15(k), respectively. An increase in the elongation at break occurred when pure PC/ABS/10 GF was added to the 12 months naturally aged PC/ABS/10 GF samples (Figure 15(i)). 25%, 50% and 75% pure PC/ABS/10 GF addition increased the elongation at break by 71.75%, 80.23% and 71.19%, respectively, compared to the 12 months naturally aged PC/ABS/10 GF sample. An increase in tensile strength was observed when pure PC/ABS/10 GF was added to the 12 months naturally aged PC/ABS/10 GF samples (Figure 15(k)). The tensile strength of the PC/ABS/10 GF sample aged naturally for 12 months was measured as 57.57 MPa. By adding 25% pure PC/ABS/10 GF to the 12 months naturally aged PC/ABS/10 GF sample, the tensile strength increased to 66.83 MPa. 25%, 50% and 75% pure PC/ABS/10 GF addition increased the tensile strength by 16.09%, 13.86% and 14.14%, respectively, compared to the 12 months naturally aged PC/ABS/10 GF sample (N-12).
Stress-strain behavior of PC/ABS/10 GF before and after UV ageing are demonstrated in Figure 15(f). Unaged and aged samples gave similar stress-strain curve behavior. The samples broke after reaching the maximum stress, showing very little elongation. Average elongation at break and tensile strength after UV ageing for PC/ABS/10 GF composite are given in Figure 15(j) and 15(l), respectively. When the tensile tests of 10% glass fiber reinforced PC/ABS samples were examined after 336 h of accelerated ageing, a decrease of 18.37% was observed in the elongation at break (Figure 15(j)), while almost no change was observed in the tensile strength (Figure 15(l)). It was stated in the literature that there was no change in the tensile strength of glass fiber reinforced polymer material after 3000 h of UV ageing . 27
Stress-strain graph of PC/ABS/10 GF samples exposed to reprocessing after UV ageing then mixing with pure PC/ABS/10 GF is depicted in Figure 15(f). The samples broke after reaching the maximum stress with very little elongation. The relationship between the elongation at break and tensile strength values with respect to the addition ratios are shown in Figure 15(j) and 15(l), respectively. An increase in the elongation at break occurred when pure PC/ABS/10 GF was added to the 336 h accelerated aged PC/ABS/10 GF samples (Figure 15(j)). Addition of 25%, 50% and 75% pure PC/ABS/10 GF increased the elongation at break by 46.15%, 37.31% and 32.50%, respectively, compared to the PC/ABS/10 GF sample aged for 336 h. A decrease in tensile strength was observed when pure PC/ABS/10 GF was added to the 336 h accelerated aged PC/ABS/10 GF samples (Figure 15(l)). 25%, 50% and 75% pure PC/ABS/10 GF addition decreased the tensile strength by 7.55%, 6.93% and 6.36%, respectively, compared to the 336 h aged PC/ABS/10 GF sample (UV-336).
Stress-strain graph for PC/ABS/20 GF samples that were and were not exposed to natural ageing is presented in Figure 15(d). It was found that the typical stress-strain graph of PC/ABS/20 GF material was not affected by the natural ageing process. All samples broke after reaching the maximum stress with very little elongation. Average elongation at break and tensile strength by months are presented in Figures 15(i) and 15(k), respectively. Elongation at break decreased by 9.04% after 3 months of natural ageing, 31.12% after 6 months of natural ageing, 42.97% after 9 months of natural ageing and 36.55% after 12 months of natural ageing. Tensile strength also decreased with increasing natural ageing time, and a 15.52% decrease in tensile strength was found after 12 months of ageing.
Stress-strain graph for PC/ABS/20 GF samples exposed to reprocessing after natural ageing then mixing with pure PC/ABS/20 GF is shown in Figure 15(d). All samples broke after reaching the maximum stress with very little elongation. The relationship between the elongation at break and tensile strength values with respect to the addition ratios are shown in Figures 15(i) and 15(k), respectively. An increase in the elongation at break occurred when pure PC/ABS/20 GF was added to the 12 months naturally aged PC/ABS/20 GF samples (Figure 15(i)). As the pure PC/ABS/20 GF ratio increased, the increase in elongation at break was greater. 25%, 50% and 75% pure PC/ABS/20 GF addition increased the elongation at break by 27.53%, 37.34% and 40.51%, respectively, compared to the 12 months naturally aged PC/ABS/20 GF sample. An increase in tensile strength was observed by adding pure PC/ABS/20 GF to 12 months naturally aged PC/ABS/20 GF samples, and the increase in tensile strength was greater with the increase in the pure PC/ABS/20 GF ratio (Figure 15(k)). The tensile strength of the PC/ABS/20 GF sample aged naturally for 12 months was measured as 73.46 MPa. By adding 75% pure PC/ABS/20 GF to the aged PC/ABS/20 GF sample, the tensile strength increased to 78.36 MPa. 25%, 50% and 75% pure PC/ABS/20 GF addition increased the tensile strength by 1.13%, 5.16% and 6.67%, respectively, compared to the 12 months naturally aged PC/ABS/20 GF sample (N-12).
Stress-strain graph for PC/ABS/20 GF samples that were and were not exposed to UV ageing is demonstrated in Figure 15(g). Accelerated ageing was found to have no obvious effect on the typical stress-strain graph of PC/ABS/20 GF material. All samples broke after reaching the maximum stress, showing very little elongation. Average elongation at break and tensile strength by hours are presented in Figure 15(j) and 15(l), respectively. When the UV ageing results were examined, an 8.03% decrease after 48 h, a 22.49% decrease after 144 h, and a 14.46% decrease after 336 h in elongation at break was observed. This decrement in the elongation at break with ageing was found to be good agreement with literature . 28 When the tensile tests of PC/ABS/20 GF material were examined after accelerated ageing, a 4.88% decrease after 48 h, a 1.47% increase after 144 h, and a 0.32% increase after 336 h in tensile strength was observed. It was stated in the literature that there was no change in the tensile strength of glass fiber reinforced polymer material after 3000 h of UV ageing . 27
Stress-strain graph for PC/ABS/20 GF samples exposed to reprocessing after UV ageing then mixing with pure PC/ABS/20 GF is depicted in Figure 15(g). All samples broke after reaching the maximum stress with very little elongation. The relationship between the elongation at break and tensile strength values with respect to the addition ratios are demonstrated in Figure 15(j) and 15(l), respectively. An increase in the elongation at break occurred when pure PC/ABS/20 GF was added to the 336 h accelerated aged PC/ABS/20 GF samples. As the pure PC/ABS/20 GF ratio increased, the increase in elongation at break was greater (Figure 15(j)). 25%, 50% and 75% pure PC/ABS/20 GF addition increased the elongation at break by 10.80%, 11.74% and 12.44%, respectively, compared to the 336 h accelerated aged PC/ABS/20 GF sample. A decrease in tensile strength was observed with the addition of pure PC/ABS/20 GF to the 336 h accelerated aged PC/ABS/20 GF samples, and the decrease in tensile strength was less with the increase in the pure PC/ABS/20 GF ratio (Figure 15(l)). 25%, 50% and 75% pure PC/ABS/20 GF addition decreased the tensile strength by 11.73%, 10.56% and 9.74%, respectively, compared to the 336 h accelerated aged PC/ABS/20 GF sample (UV-336).
Stress-strain graph for PC/ABS/30 GF samples that were and were not exposed to natural ageing is presented in Figure 15(e). It was found that the typical stress-strain graph of PC/ABS/30 GF material was not affected by the natural ageing process. All samples broke after reaching the maximum stress with very little elongation. Average elongation at break and tensile strength by months are presented in Figure 15(i) and 15(k), respectively. It was found that elongation at break (Figure 15(i)) and tensile strength (Figure 15(k)) decreased with natural ageing. After 12 months of natural ageing, elongation at break decreased by 37.84% and tensile strength decreased by 13.78%.
Stress-strain graph for PC/ABS/30 GF samples exposed to reprocessing after natural ageing then mixing with pure PC/ABS/30 GF is shown in Figure 15(e). All samples broke after reaching the maximum stress with very little elongation. The relationship between the elongation at break and tensile strength values achieved from the typical stress-strain curve and the addition ratios are demonstrated in Figures 15(i) and 15(k), respectively. A decrease in tensile strength was observed when pure PC/ABS/30 GF was added to 12 months naturally aged PC/ABS/30 GF samples (Figure 15(k)). 25%, 50% and 75% pure PC/ABS/30 GF addition reduced the tensile strength by 24.09%, 11.64% and 11.99%, respectively, compared to the 12 months naturally aged PC/ABS/30 GF sample (N-12).
Stress-strain graph for PC/ABS/30 GF samples that were and were not exposed to UV ageing is presented in Figure 15(h). Accelerated ageing was found to have no obvious effect on the typical stress-strain graph of PC/ABS/30 GF material. All samples broke after reaching the maximum stress, showing very little elongation. Average elongation at break and tensile strength by hours are presented in Figure 15(j) and 15(l), respectively. A decrease by 9.68% after 48 h, by 20.72% after 144 h, and by 13.51% after 336 h UV ageing in elongation at break was observed. When the tensile tests of PC/ABS/30 GF material after accelerated ageing were examined, no obvious change was seen in the tensile strength with accelerated ageing (Figure 15(l)). It was stated in the literature that there was no change in the tensile strength of glass fiber reinforced polymer material after 3000 h of UV ageing . 27
Stress-strain graph for PC/ABS/30 GF samples exposed to reprocessing after UV ageing then mixing with pure PC/ABS/30 GF is shown in Figure 15(h). All samples broke after reaching the maximum stress, showing very little elongation. The relationship between the elongation at break and tensile strength values from the typical stress-strain curve and the addition ratios are demonstrated in Figure 15(j) and 15(l), respectively. A decrease in the elongation at break occurred with the addition of pure PC/ABS/30 GF to the accelerated aged PC/ABS/30 GF samples for 336 h (Figure 15(j)). 25%, 50% and 75% pure PC/ABS/30 GF addition reduced the elongation at break by 3.13%, 7.81% and 5.99%, respectively, compared to the 336 h accelerated aged PC/ABS/30 GF sample. A decrease in tensile strength was observed when pure PC/ABS/30 GF was added to the 336 h accelerated aged PC/ABS/30 GF samples (Figure 15(l)). 25%, 50% and 75% pure PC/ABS/30 GF addition decreased the tensile strength by 18.33%, 19.51% and 16.87%, respectively, compared to the 336 h accelerated aged PC/ABS/30 GF sample (UV-336).
After tensile tests, fracture surface of all specimens was examined by a SEM. Figure 16 demonstrates SEM micrographs of PC/ABS/10 GF samples taken before and after natural ageing. When these images were examined, no change in fracture characteristics was observed on the fracture surfaces. SEM micrographs for the samples produced by reprocessing PC/ABS/10 GF samples exposed to natural ageing then mixing them with pure PC/ABS/10 GF are also presented in Figure 16. When the SEM images were examined, no significant change was seen in the breaking surfaces with the addition of pure PC/ABS/10 GF. SEM images of PC/ABS/10 GF composites aged naturally for (a) 0 months (It means unaged PC/ABS/10 GF.), (b) 3 months, (c) 6 months, (d) 9 months and (e) 12 months. SEM images for blends of virgin-naturally aged PC/ABS/10 GF composites. (f) 25V + R-N, (g) 50V + R-N and (h) 75V + R-N. (SEM images were taken at 100x magnification. Images in the magnified frame are 1000x.).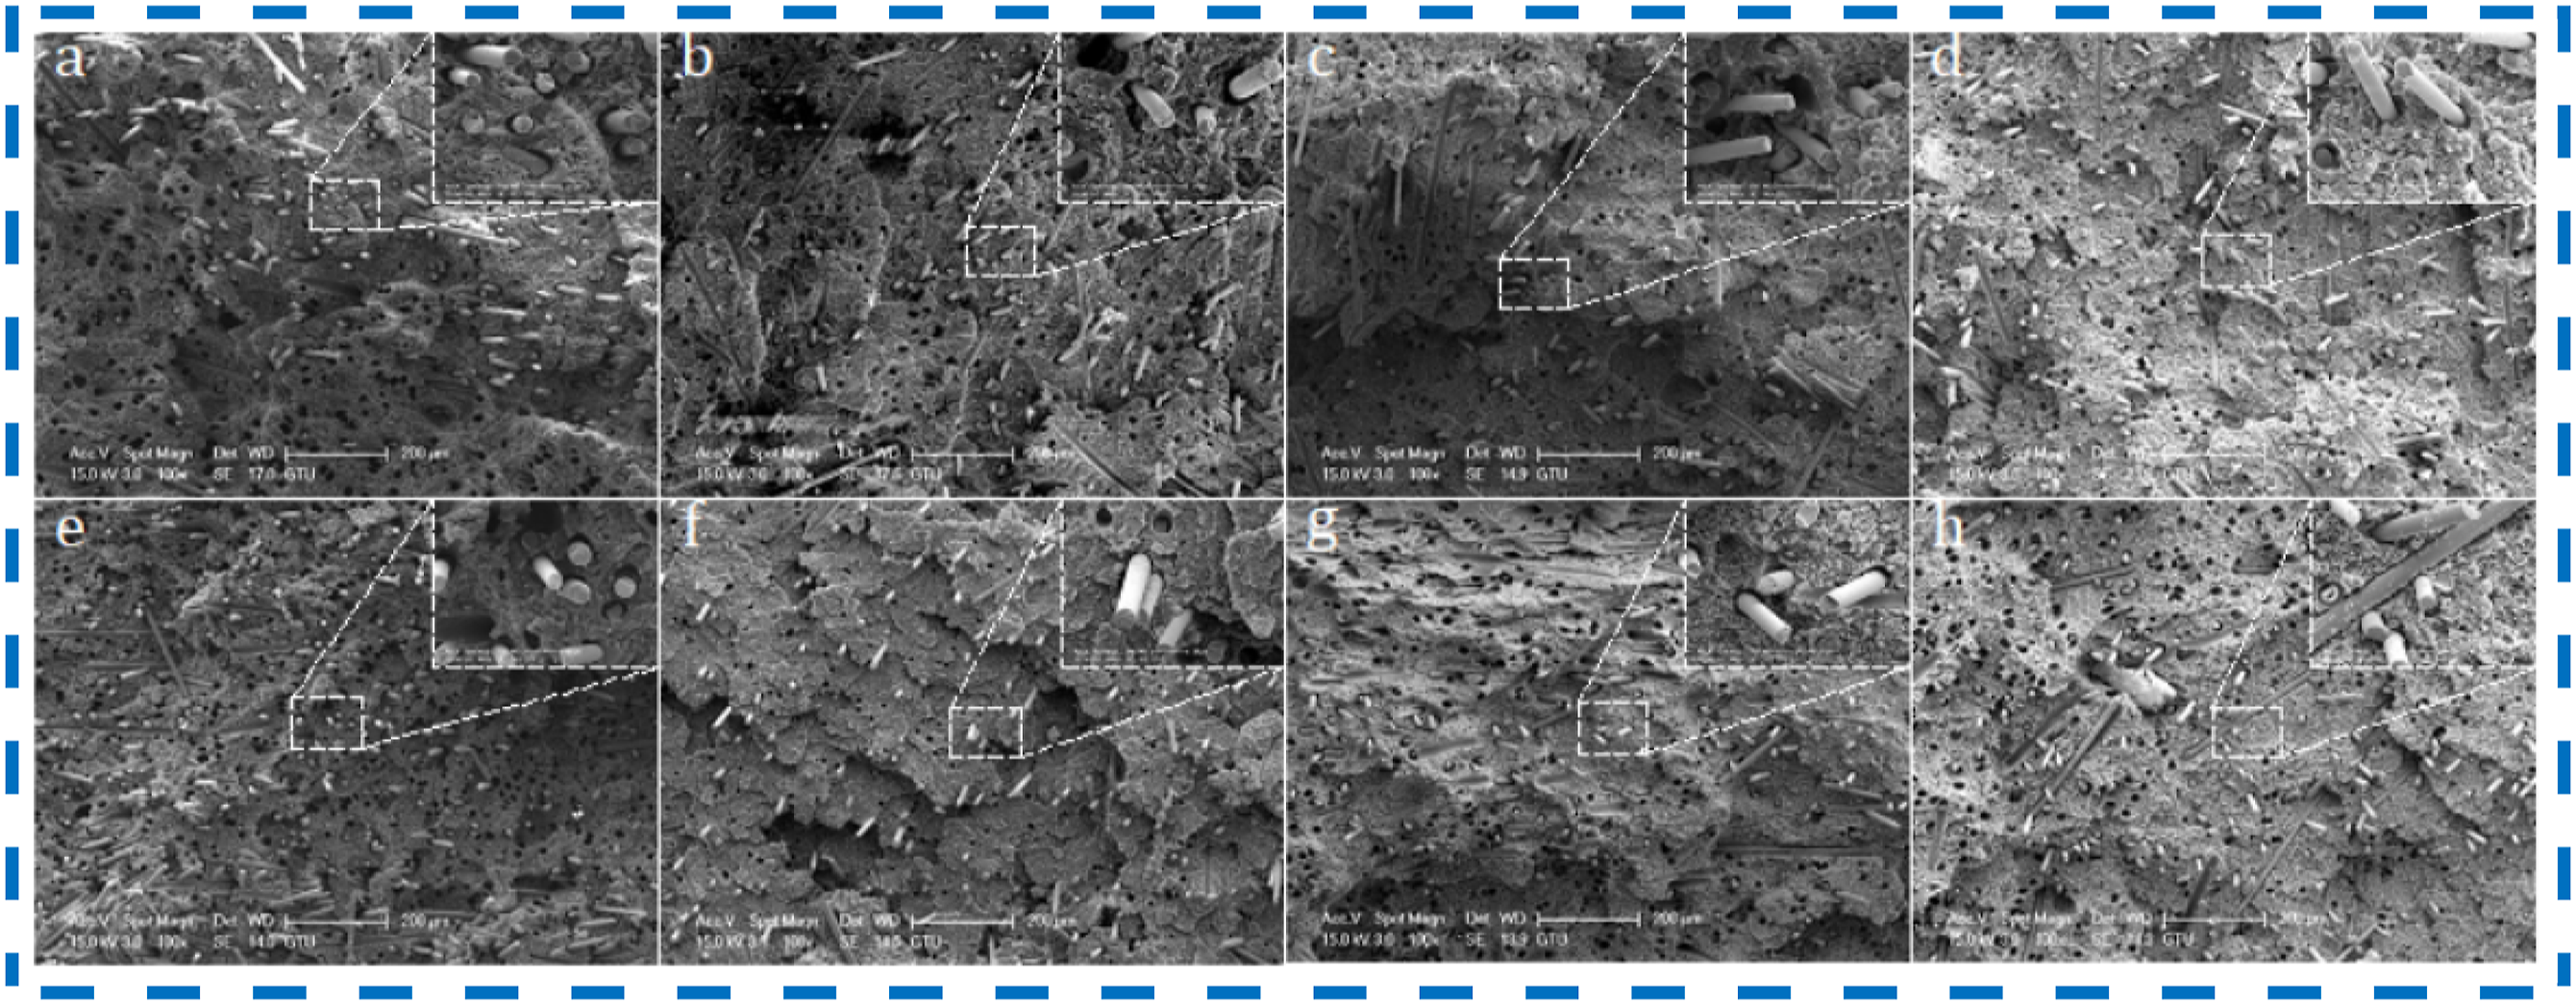
Figure 17 depicts SEM micrographs of unaged and artificially aged PC/ABS/10 GF composites after tensile test. No change was observed on the fracture surfaces of the samples after UV ageing. SEM micrographs for the samples produced by reprocessing PC/ABS/10 GF samples exposed to UV ageing then mixing them with pure PC/ABS/10 GF are also shown in Figure 17. When SEM images were examined, no significant change was seen in the fracture surfaces with the addition of pure PC/ABS/10 GF. SEM images of PC/ABS/10 GF composites aged artificially for (a) 0 h (It means unaged PC/ABS/10 GF.), (b) 48 h, (c) 144 h and (d) 336 h. SEM images for blends of virgin-naturally aged PC/ABS/10 GF composites. (e) 25V + R-UV, (f) 50V + R-UV and (g) 75V + R-UV. (SEM images were taken at 100x magnification. Images in the magnified frame are 1000x.).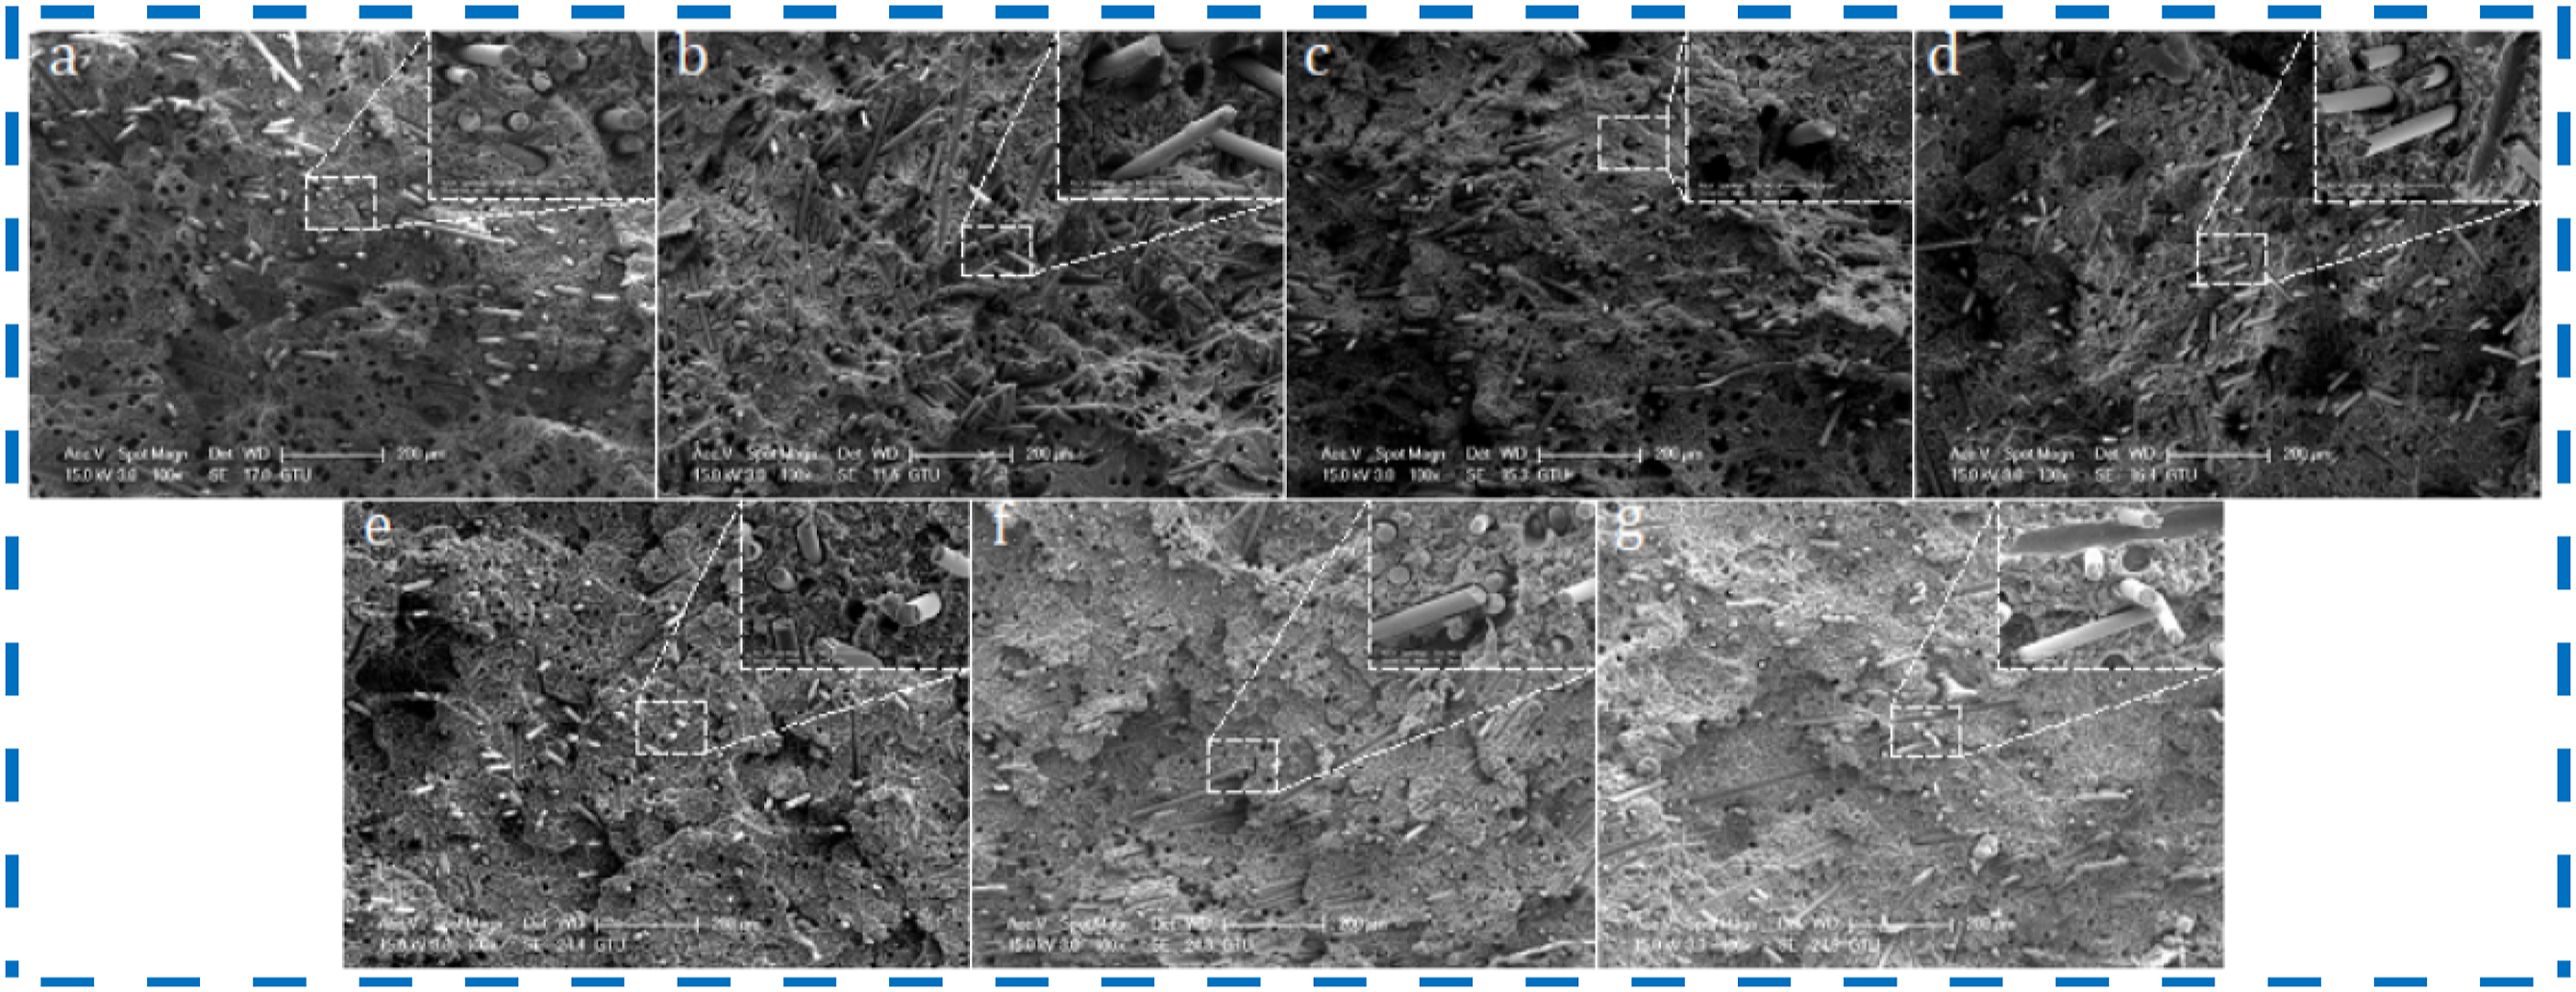
SEM micrographs of PC/ABS/20 GF samples taken before and after natural ageing are demonstrated in Figure 18. In the SEM images taken after 3, 6, 9 and 12 months of natural ageing, it was observed that the matrix material on the fiber surfaces was peeled off and the fibers broke off from the matrix without adhesion. Additionally, it was observed that the gap between the fiber and matrix increased as a result of the ageing process. The reason for the decrease in mechanical properties with ageing is the increase in the gaps between the fiber-matrix and fiber-matrix separation. Worse mechanical properties of aged polypropylene/glass fiber samples compared to unaged one was explained due to poor interface adhesions .
29
Figure 18 also shows SEM micrographs for the samples produced by reprocessing PC/ABS/20 GF samples exposed to natural ageing then mixing them with pure PC/ABS/20 GF. When SEM images were examined, no significant change was seen in the fracture surfaces with the addition of pure PC/ABS/20 GF. SEM images of PC/ABS/20 GF composites aged naturally for (a) 0 months (It means unaged PC/ABS/20 GF.), (b) 3 months, (c) 6 months, (d) 9 months and (e) 12 months. SEM images for blends of virgin-naturally aged PC/ABS/20 GF composites. (f) 25V + R-N, (g) 50V + R-N and (h) 75V + R-N. (SEM images were taken at 100x magnification. Images in the magnified frame are 1000x.).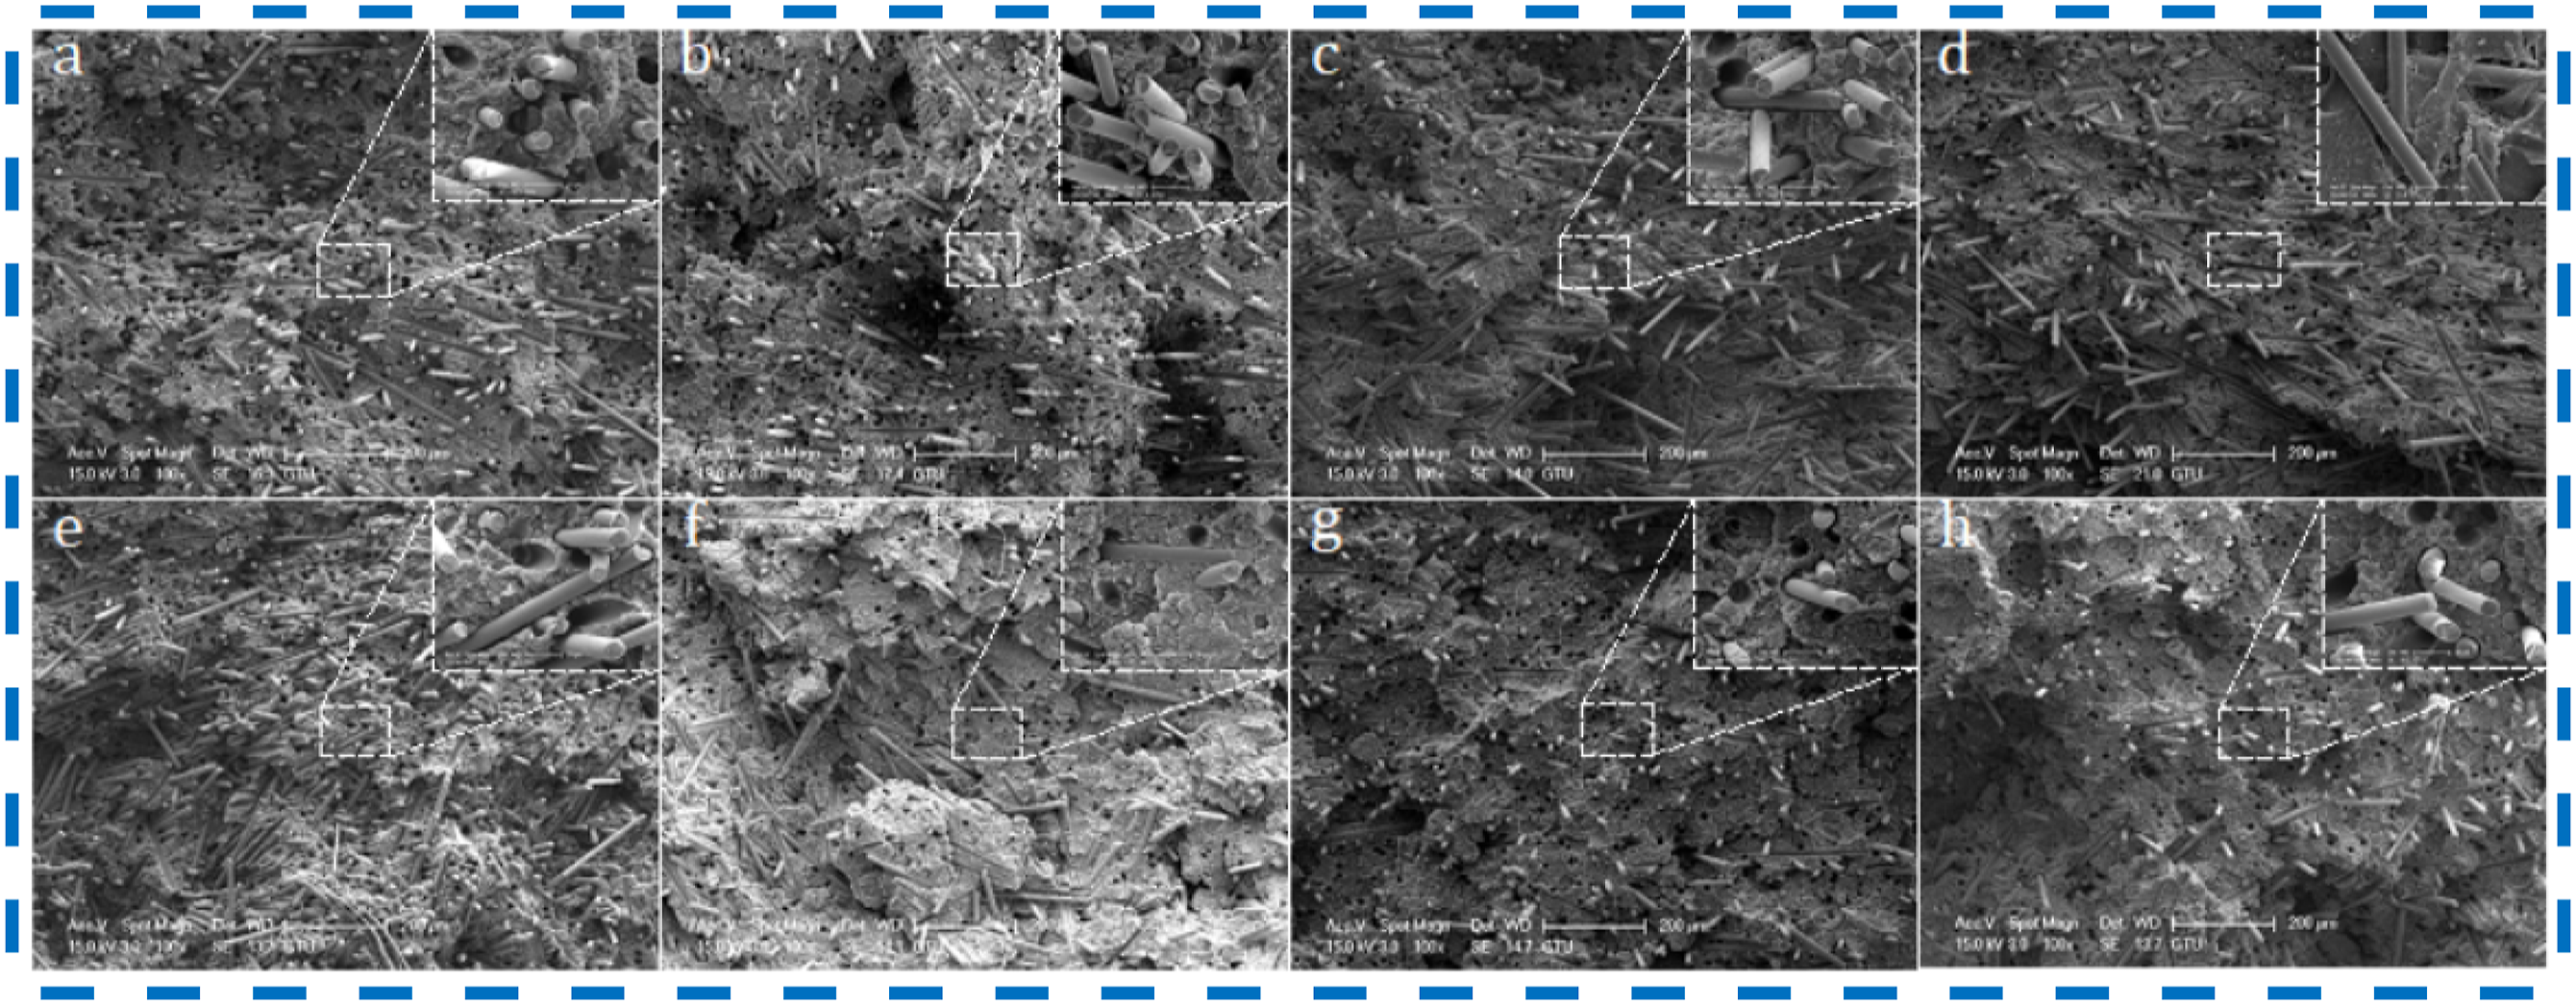
SEM micrographs for PC/ABS/20 GF samples taken before and after UV ageing are shown in Figure 19. No change was observed on the fracture surfaces of the samples after UV ageing. Figure 19 also depicts SEM micrographs of the samples produced by reprocessing PC/ABS/20 GF samples exposed to UV ageing then mixing them with pure PC/ABS/20 GF. When SEM images were examined, no significant change was seen in the fracture surfaces with the addition of pure PC/ABS/20 GF. SEM images of PC/ABS/20 GF composites aged artificially for (a) 0 h (It means unaged PC/ABS/20 GF.), (b) 48 h, (c) 144 h and (d) 336 h. SEM images for blends of virgin-naturally aged PC/ABS/20 GF composites. (e) 25V + R-UV, (f) 50V + R-UV and (g) 75V + R-UV. (SEM images were taken at 100x magnification. Images in the magnified frame are 1000x.).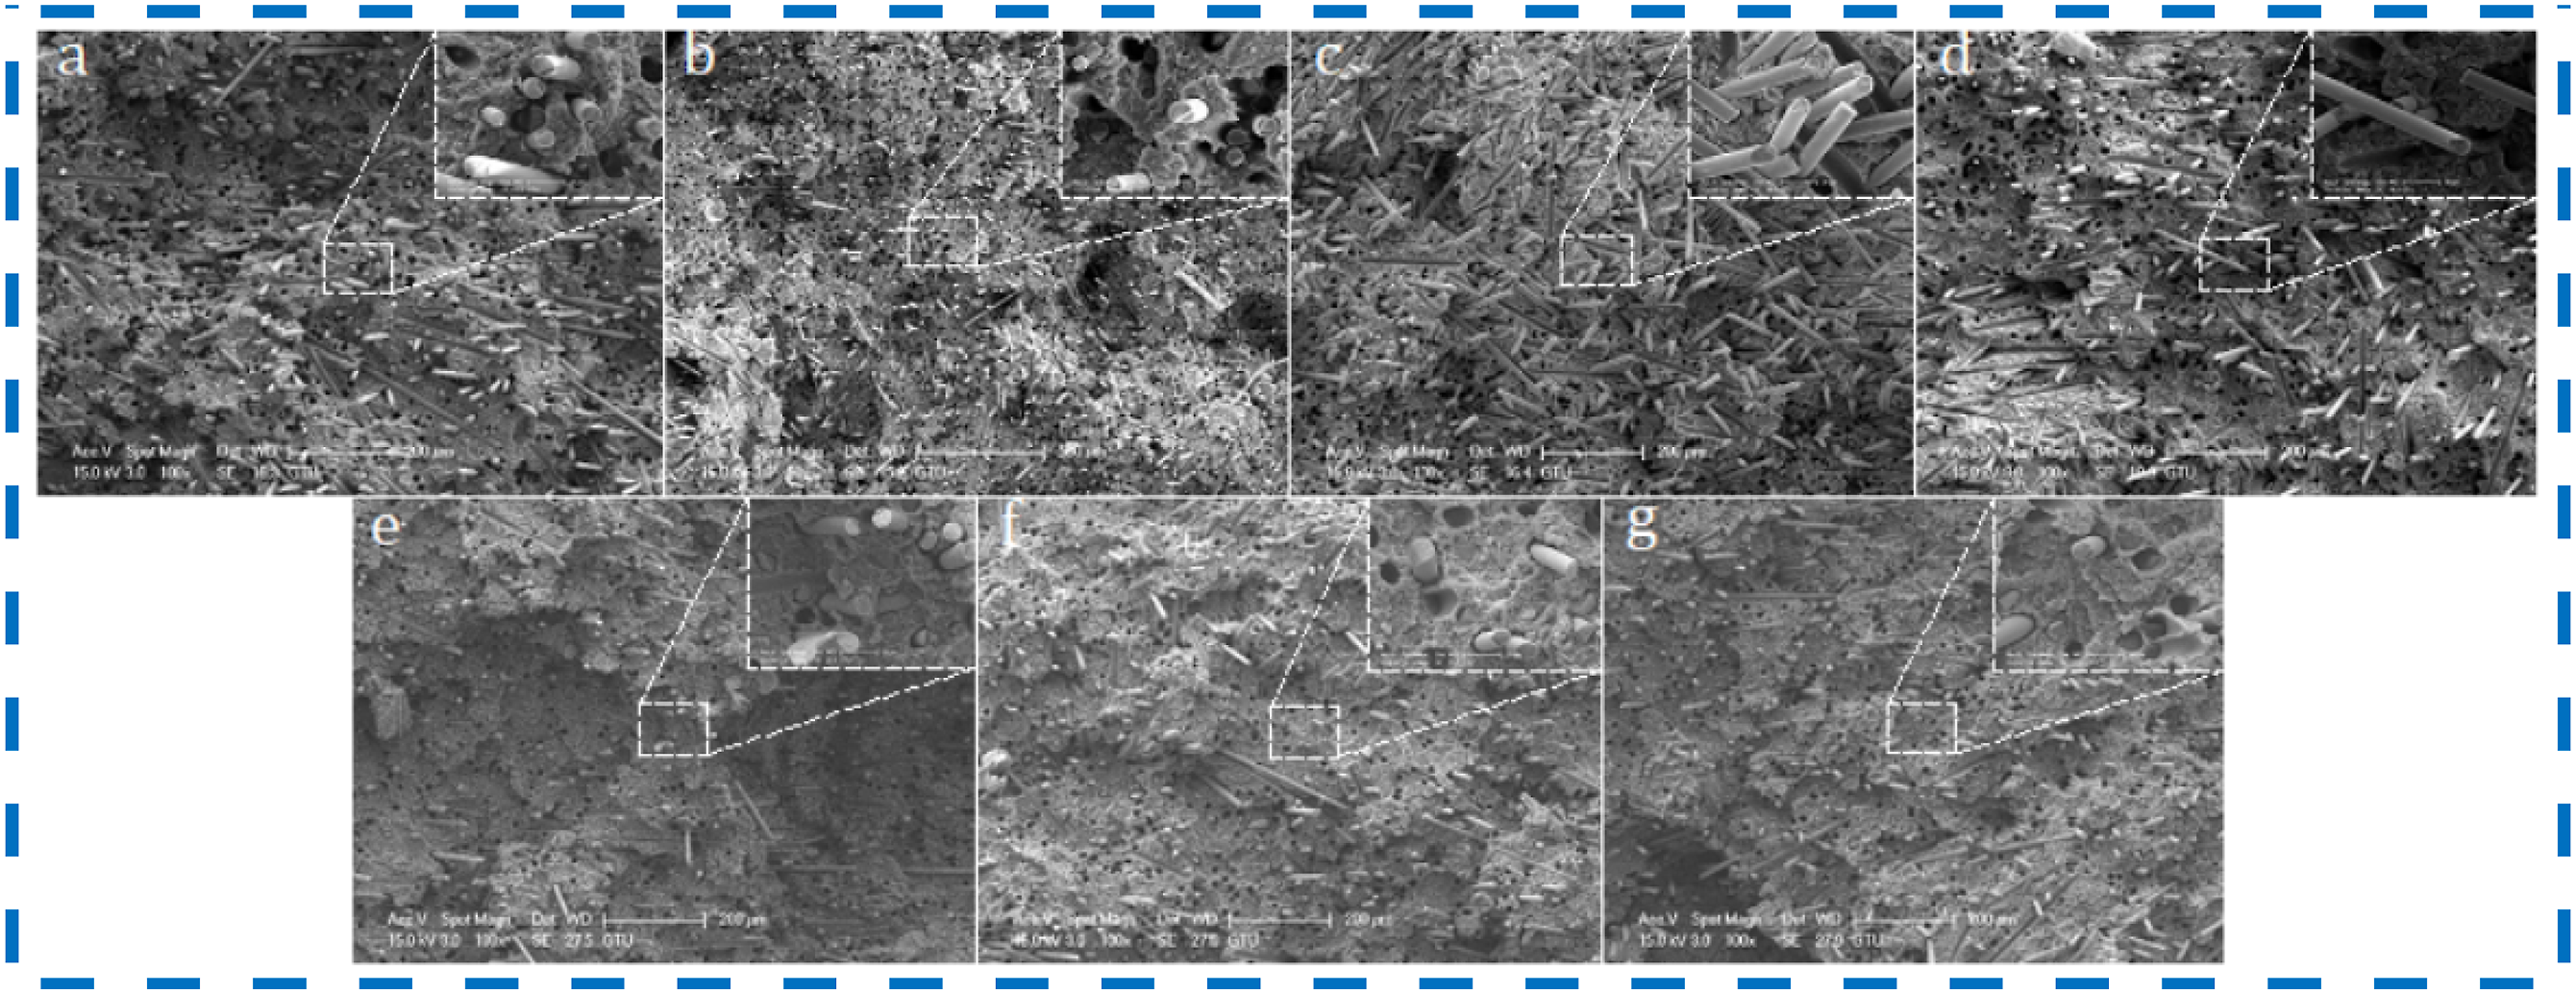
SEM micrographs for PC/ABS/30 GF samples taken before and after natural ageing are demonstrated in Figure 20. When these images were examined, no change in fracture characteristics was observed on the fracture surfaces. SEM micrographs for the samples produced by reprocessing PC/ABS/30 GF samples exposed to natural ageing then mixing them with pure PC/ABS/30 GF are also presented in Figure 20. When SEM images were examined, no significant change was seen in the fracture surfaces with the addition of pure PC/ABS/30 GF. SEM images of PC/ABS/30 GF composites aged naturally for (a) 0 months (It means unaged PC/ABS/30 GF.), (b) 3 months, (c) 6 months, (d) 9 months and (e) 12 months. SEM images for blends of virgin-naturally aged PC/ABS/30 GF composites. (f) 25V + R-N, (g) 50V + R-N and (h) 75V + R-N. (SEM images were taken at 100x magnification. Images in the magnified frame are 1000x.).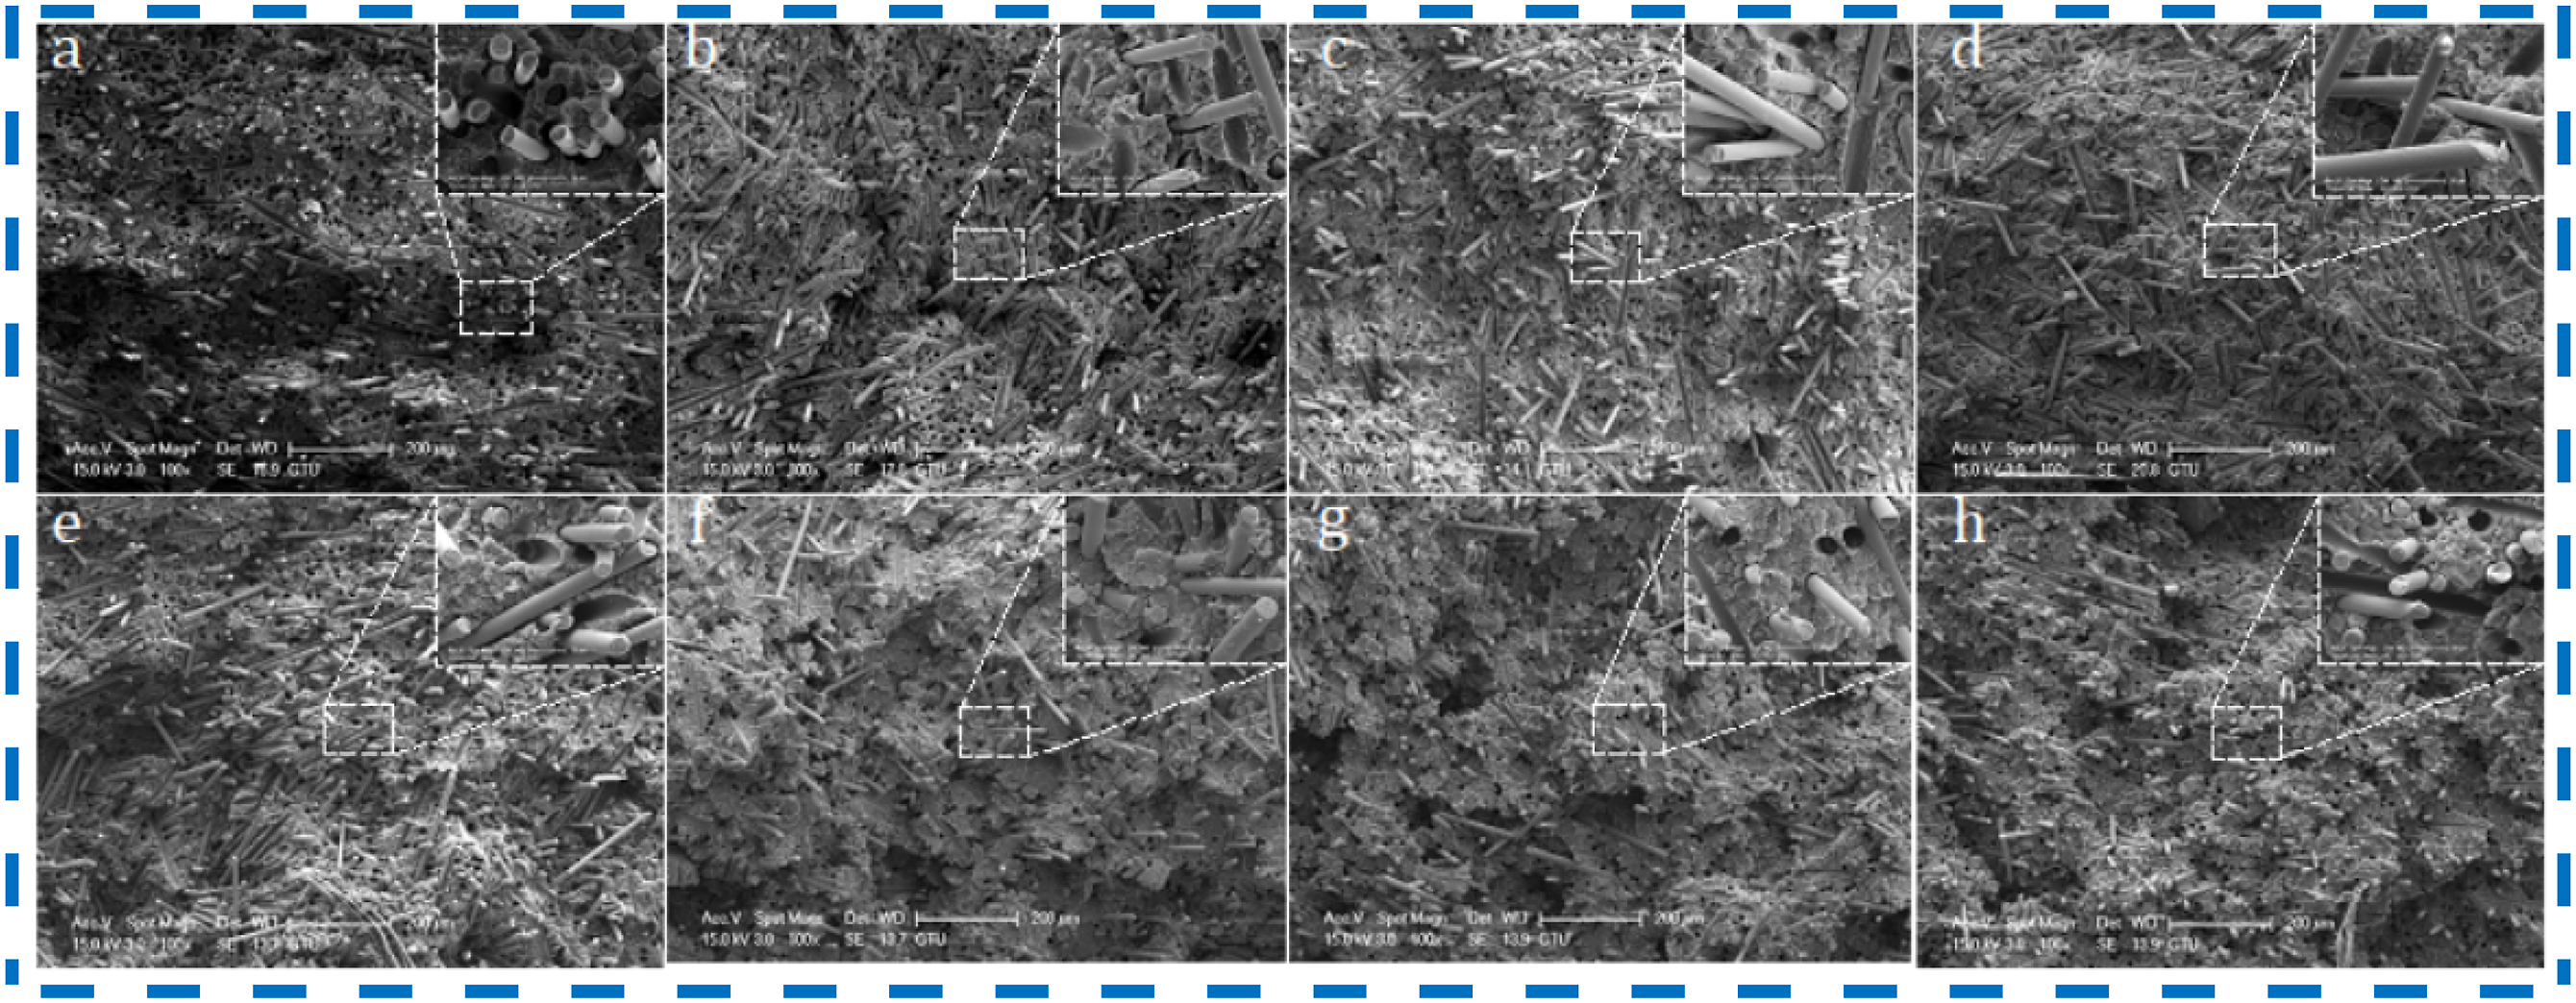
SEM micrographs for PC/ABS/30 GF samples taken before and after UV ageing are shown in Figure 21. In the light of these images, it was seen in SEM images taken as a result of accelerated ageing for 48, 144 and 336 h that the matrix material on the fiber surfaces was peeled off and the fibers broke off from the matrix without adhesion. Additionally, it was observed that the gap between the fiber and matrix increased as a result of the ageing process. SEM micrographs for the samples produced by reprocessing PC/ABS/30 GF samples exposed to UV ageing then mixing them with pure PC/ABS/30 GF are also presented in Figure 21. When SEM images were examined, no significant change was seen in the fracture surfaces with the addition of pure PC/ABS/30 GF. SEM images of PC/ABS/30 GF composites aged artificially for (a) 0 h (It means unaged PC/ABS/30 GF.), (b) 48 h, (c) 144 h and (d) 336 h. SEM images for blends of virgin-naturally aged PC/ABS/30 GF composites. (e) 25V + R-UV, (f) 50V + R-UV and (g) 75V + R-UV. (SEM images were taken at 100x magnification. Images in the magnified frame are 1000x.).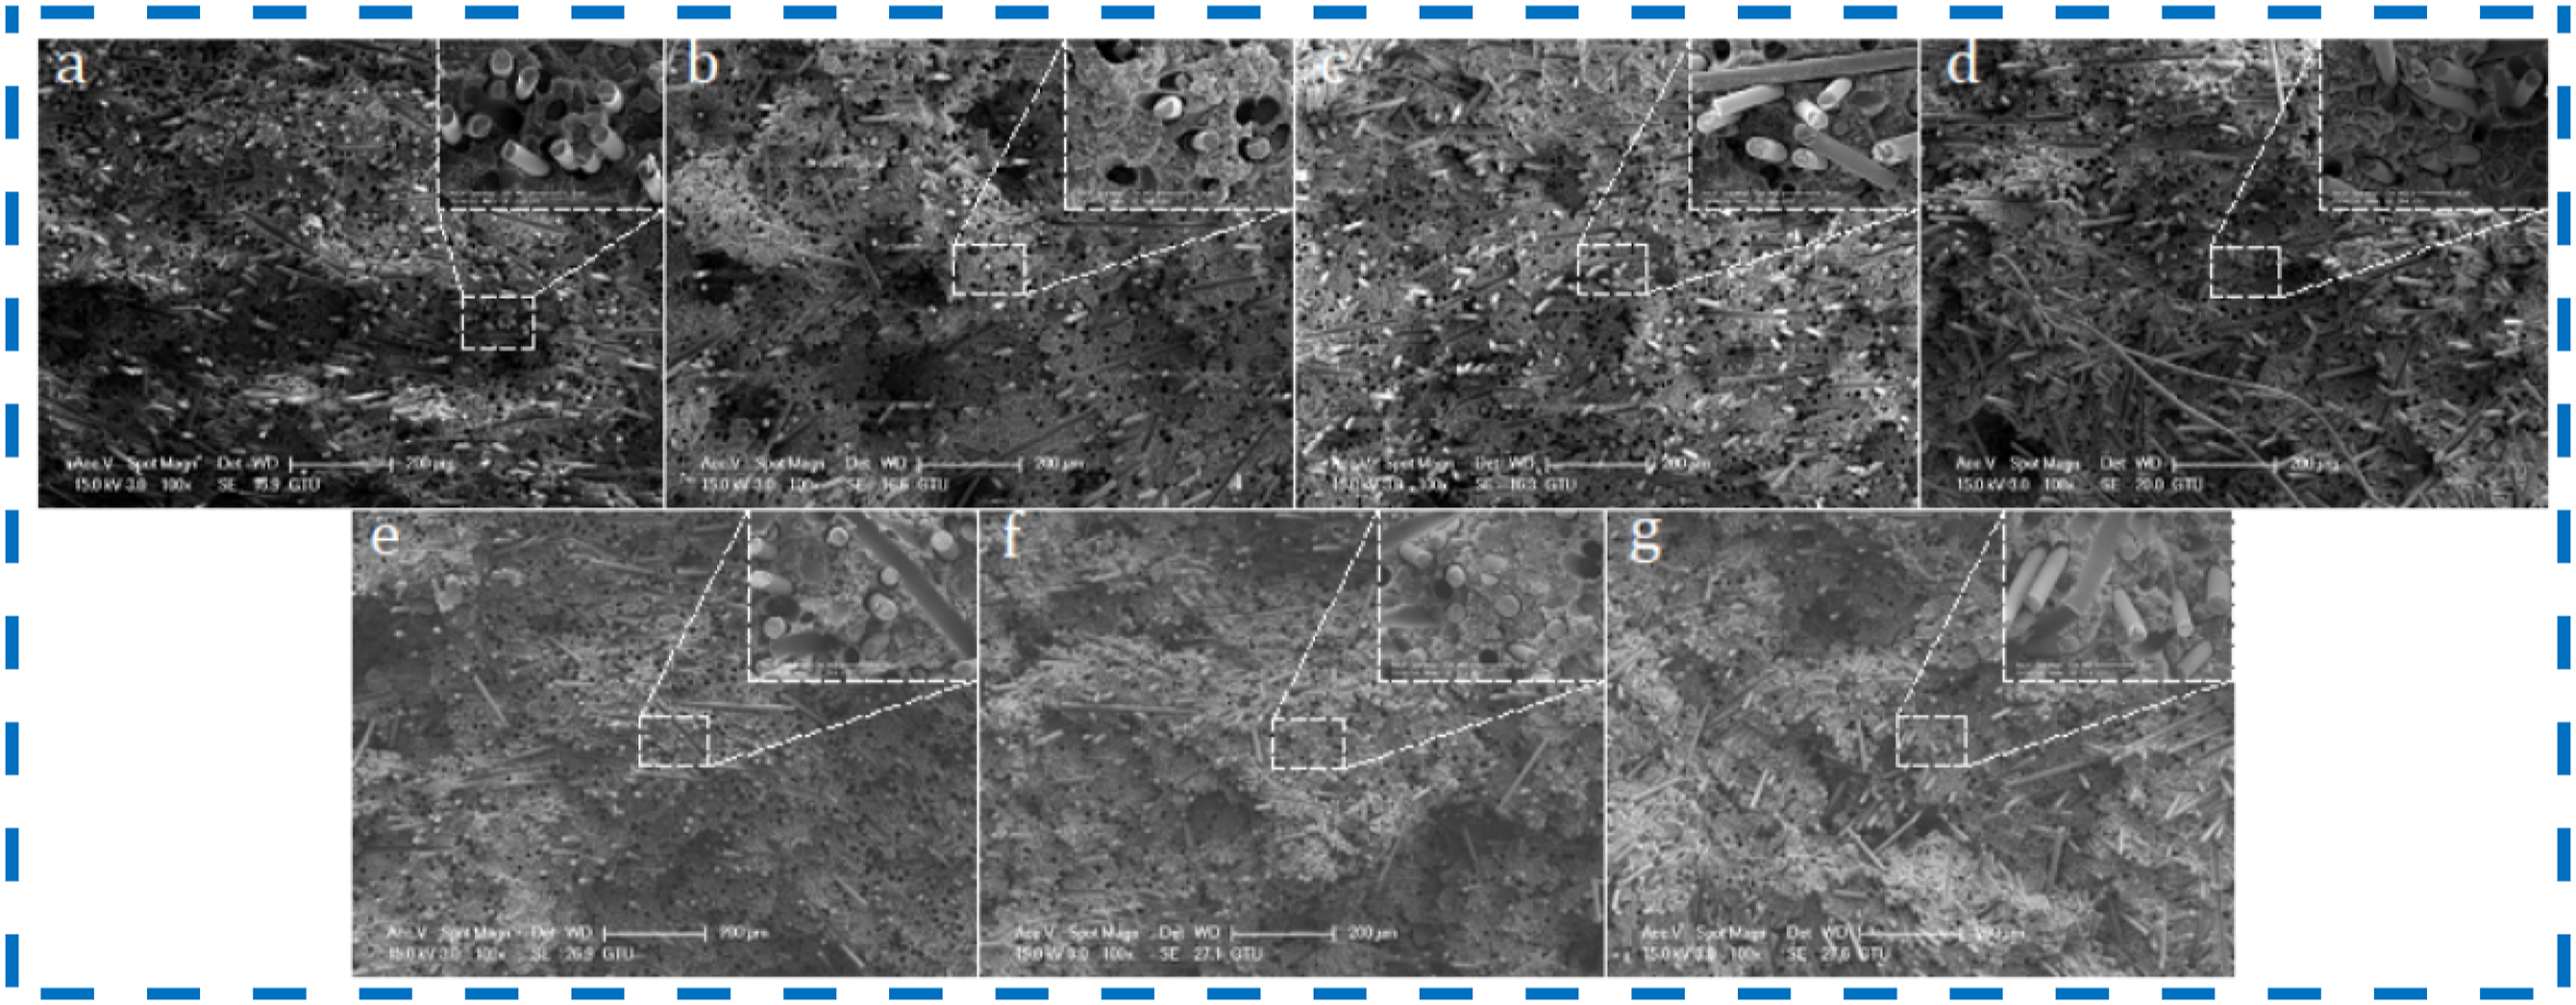
Flexural results
Flexural test sample, device and results are presented from Figure 22(a)‒22(l). Three-point flexural tests were performed according to ISO 178
21
standard (Figure 22(a)) by Instron 5569 device (Figure 22(b)). Flexural stress-strain curves in Figure 22(c)-(h) demonstrate that weathering had no significant influence on the flexural curves. With the increase in glass fiber addition ratio, flexural strength increased, and strain value decreased. Figure 22(i) shows average deflection for naturally aged PC/ABS/10 GF samples by months. The deflection value decreased with increasing natural ageing time. The relationship between the flexural values and the addition ratios is also demonstrated in Figure 22(i). An increase in the deflection values occurred when pure PC/ABS/10 GF was added to the 12 months naturally aged PC/ABS/10 GF samples. Average flexural strength for naturally aged PC/ABS/10 GF samples by months is presented in Figure 22(k). It was found that the flexural strength decreased by 5.42%, 6.20%, 15.27% and 9.27% after 3, 6, 9 and 12 months of natural ageing, respectively. The decrease in flexural strength with natural ageing was also found in the literature for glass fiber reinforced polymer materials, and this result was explained by the degradation mechanism on the surface .
27
An increase in the flexural strength was observed by adding pure PC/ABS/10 GF to the 12 months naturally aged PC/ABS/10 GF samples. The flexural strength of the 12 months naturally aged PC/ABS/10 GF sample was measured as 86.74 MPa. By adding 25% pure PC/ABS/10 GF to the aged PC/ABS/10 GF sample, the flexural strength increased to 98.85 MPa. 25%, 50% and 75% pure PC/ABS/10 GF addition increased the flexural strength by 13.96%, 13.78% and 10.62%, respectively, compared to the 12 months naturally aged PC/ABS/10 GF sample (N-12). In addition, all aged-pure mixtures (25V + R-N, 50V + R-N and 75V + R-N) showed a slight increase in flexural strength compared to pure PC/ABS/10 GF. Flexural test. (a) Dimensions of flexural test sample (all dimensions are in mm). (b) Universal test machine for test. (c) Flexural stress-strain graphs for PC/ABS/10 GF composite before and after natural ageing. (d) Flexural stress-strain graphs for PC/ABS/20 GF composite before and after natural ageing. (e) Flexural stress-strain graphs for PC/ABS/30 GF composite before and after natural ageing. (f) Flexural stress-strain graphs for PC/ABS/10 GF composite before and after UV ageing. (g) Flexural stress-strain graphs for PC/ABS/20 GF composite before and after UV ageing. (h) Flexural stress-strain graphs for PC/ABS/30 GF composite before and after UV ageing. (i) Deflection results for naturally aged samples. (j) Deflection results for artificially UV aged samples. (k) Flexural strength results for naturally aged samples. (l) Flexural strength results for artificially UV aged samples.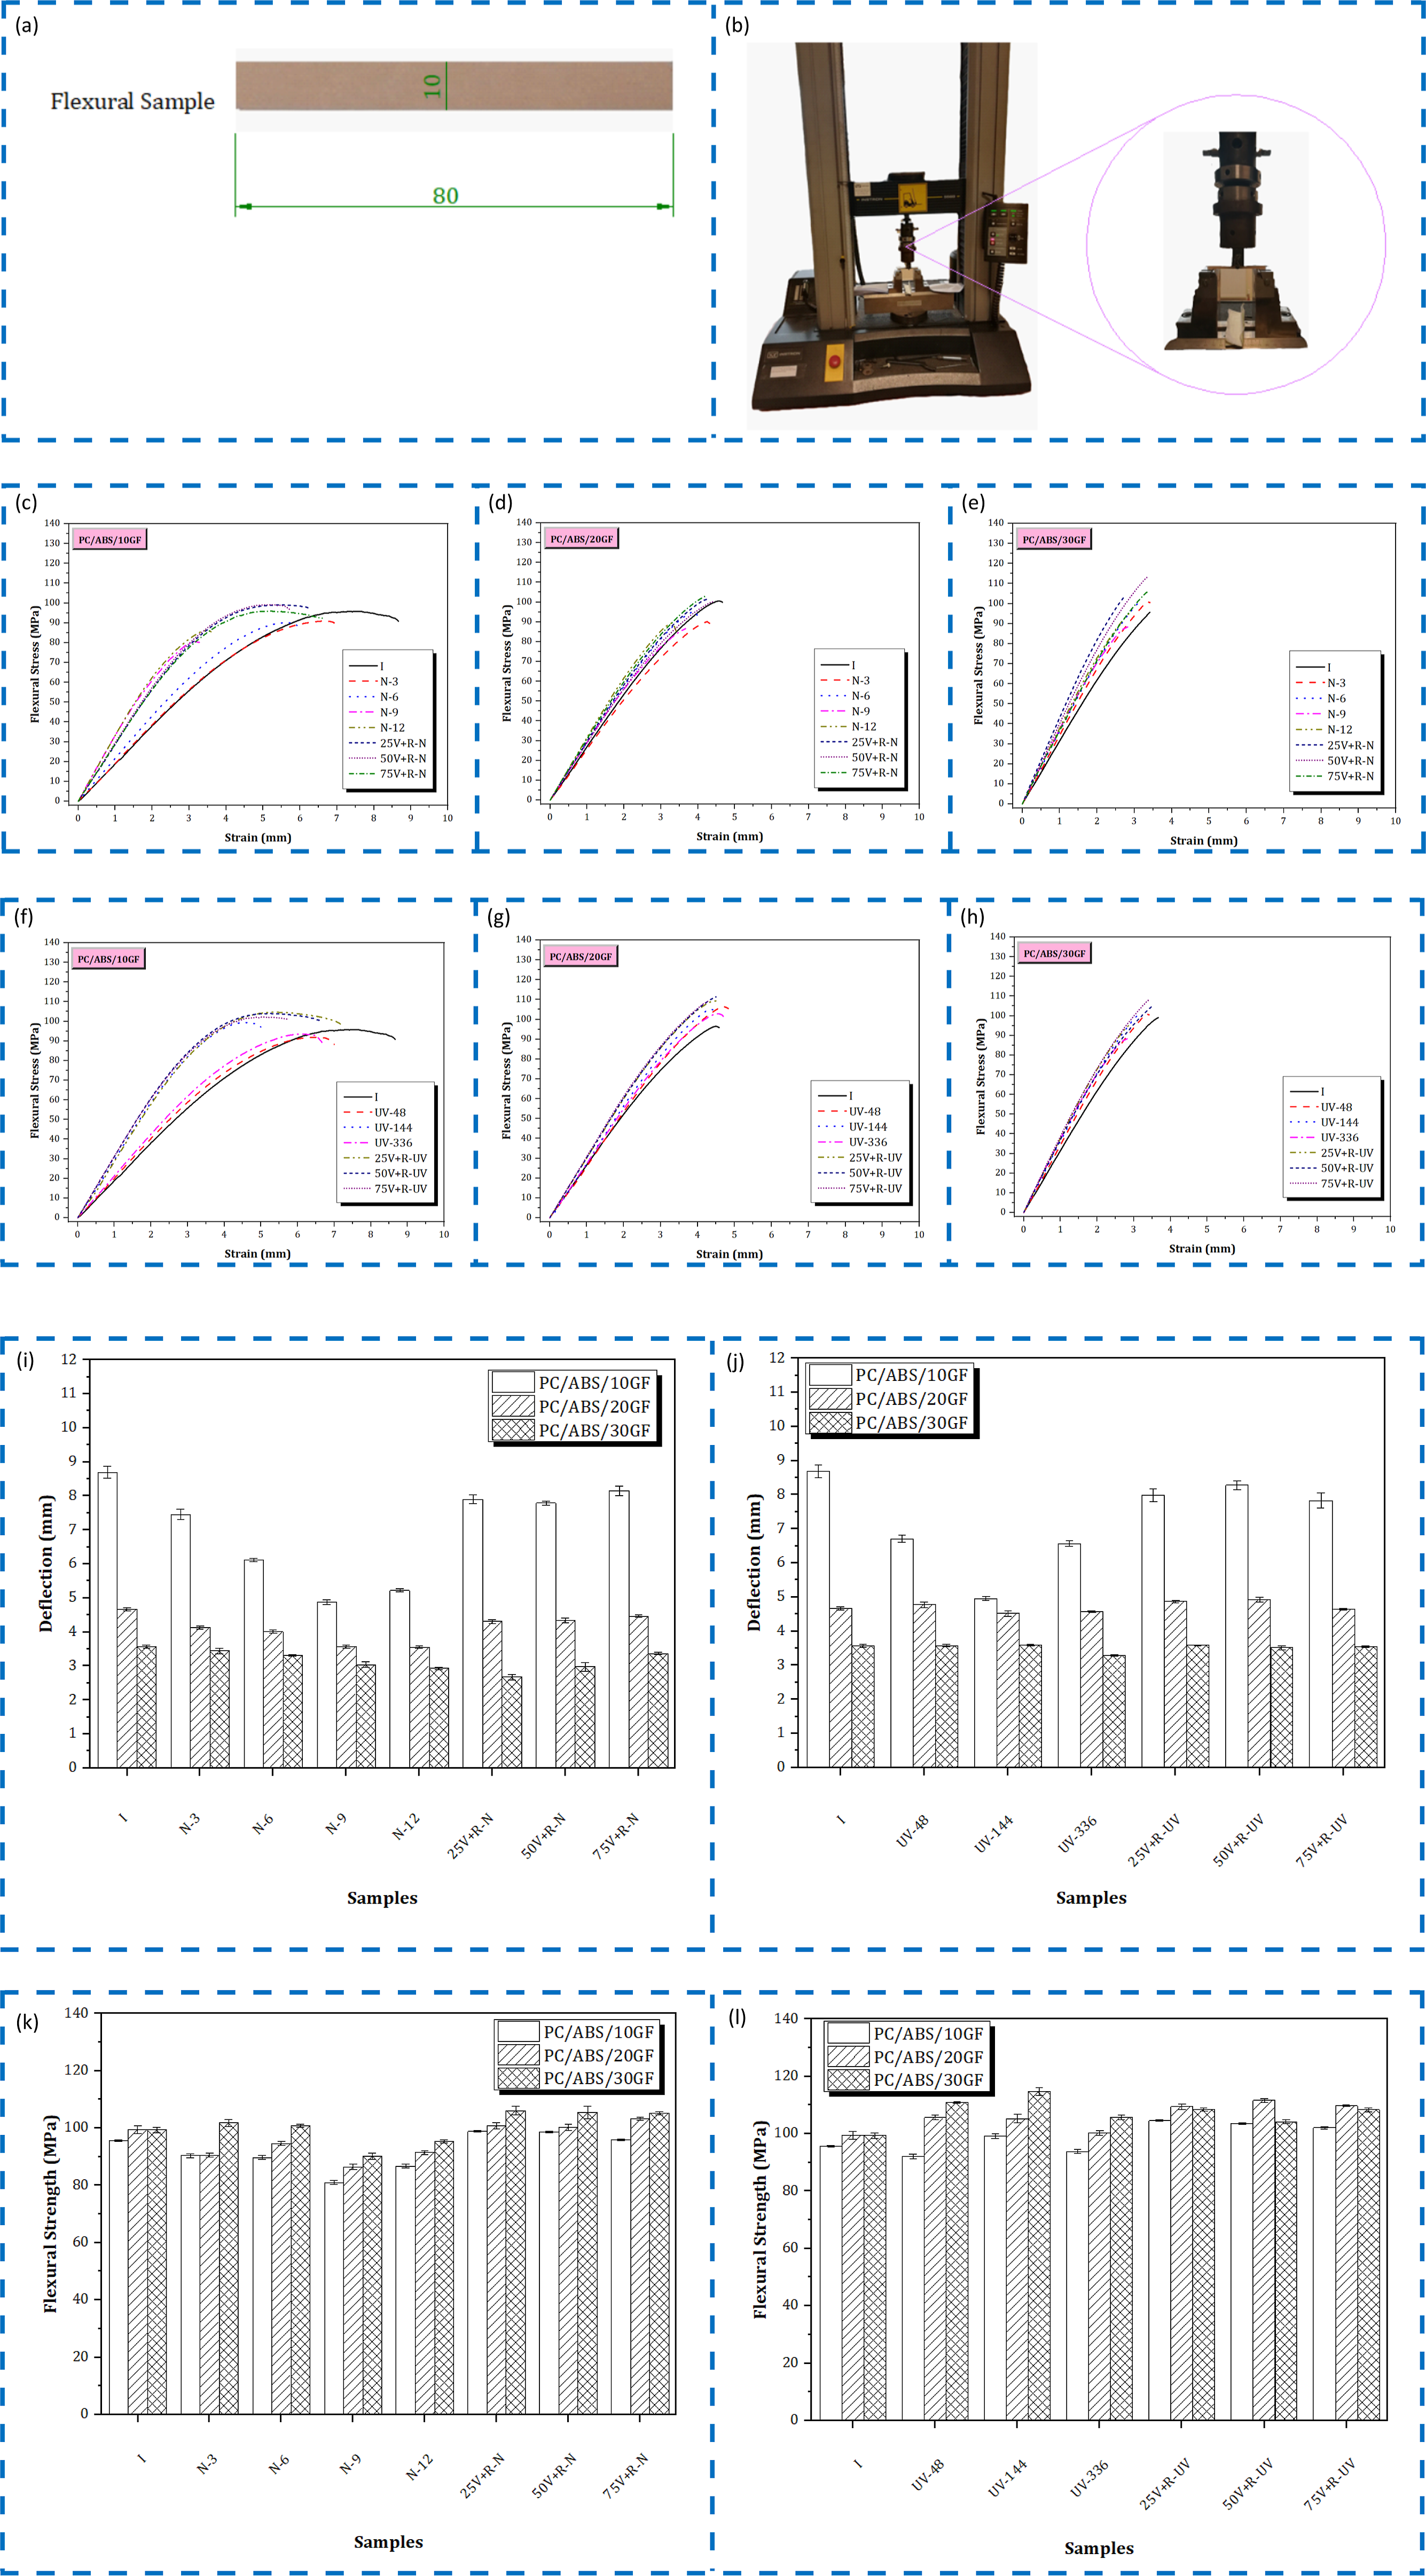
Average deflection for artificially aged PC/ABS/10 GF samples by hours is depicted in Figure 22(j). When the flexural test results of 10% glass fiber reinforced PC/ABS material after accelerated ageing were examined, it was seen that the deflection value decreased by 22% after 48 h, by 42% after 144 h, and by 24% after 336 h. Figure 22(j) also shows the relationship between the flexural values and the addition ratios. An increase in the deflection values occurred when pure PC/ABS/10 GF was added to the 336 h accelerated aged PC/ABS/10 GF samples. Average flexural strength by UV ageing is presented in Figure 22(l). An approximately 3% decrease in flexural strength results was achieved after 48 h of UV ageing, and an approximately 4% increase was achieved after 144 h of UV ageing. After 336 h of UV ageing, a 2% decrease was observed. The relationship between the flexural strength and the addition ratios is also demonstrated in Figure 22(l). An increase in the flexural strength values occurred when pure PC/ABS/10 GF was added to the 336 h accelerated aged PC/ABS/10 GF samples. The flexural strength of the PC/ABS/10 GF sample accelerated aged for 336 h was measured as 93.84 MPa. By adding 25% pure PC/ABS/10 GF to the aged PC/ABS/10 GF sample, the flexural strength increased to 104.63 MPa. 25%, 50% and 75% pure PC/ABS/10 GF addition increased the flexural strength by 11.50%, 10.36% and 8.75%, respectively, compared to the 336 h accelerated aged PC/ABS/10 GF sample (UV-336). In addition, all aged-pure mixtures (25V + R-UV, 50V + R-UV and 75V + R-UV) caused an increase in flexural strength compared to pure PC/ABS/10 GF.
Average deflection for naturally aged PC/ABS/20 GF samples by months is presented in Figure 22(i). The deflection value decreased with increasing natural ageing time. Figure 22(i) also shows the relationship between the flexural values and the addition ratios. An increase in the deflection values occurred when pure PC/ABS/20 GF was added to the 12 months naturally aged PC/ABS/20 GF samples. Average flexural strength for naturally aged PC/ABS/20 GF samples by months is depicted in Figure 22(k). It was found that the flexural strength decreased by 8.90% after 3 months of natural ageing, 4.80% after 6 months of natural ageing, 13.11% after 9 months of natural ageing and 8.01% after 12 months of natural ageing. The decrease in flexural strength with natural ageing was also found in the literature for glass fiber reinforced polymer materials, and this result was explained by the degradation mechanism on the surface . 27 Figure 22(k) also demonstrates the relationship between the flexural strength and the addition ratios. An increase in the flexural strength was observed by adding pure PC/ABS/20 GF to the 12 months naturally aged PC/ABS/20 GF samples. The flexural strength of the 12 months naturally aged PC/ABS/20 GF sample was measured as 91.48 MPa. By adding 75% pure PC/ABS/20 GF to the aged PC/ABS/20 GF sample, the flexural strength increased to 103.16 MPa. 25%, 50% and 75% pure PC/ABS/20 GF addition increased the flexural strength by 10.25%, 9.63% and 12.77%, respectively, compared to the 12 months naturally aged PC/ABS/20 GF sample (N-12). In addition, all aged-pure mixtures (25V + R-N, 50V + R-N and 75V + R-N) showed a slight increase in flexural strength compared to the pure PC/ABS/20 GF.
Average deflection for artificially aged PC/ABS/20 GF samples by hours is presented in Figure 22(j). There was not much change in deflection values with UV ageing. Figure 22(j) also gives the relationship between the flexural values and the addition ratios. When pure PC/ABS/20 GF was added to 336 h accelerated aged PC/ABS/20 GF samples, a slight increase in deflection values occurred. Average flexural strength by UV ageing is shown in Figure 22(l). When the flexural tests of PC/ABS/20 GF material after accelerated ageing were examined, a 6.21% increase after 48 h of UV ageing, a 5.89% increase after 144 h of UV ageing, and a 0.89% increase after 336 h of UV ageing in flexural strength was observed. The relationship between the flexural strength and the addition ratios is also demonstrated in Figure 22(l). An increase in the flexural strength values occurred when pure PC/ABS/20 GF was added to the 336 h accelerated aged PC/ABS/20 GF samples. The flexural strength of the accelerated aged for 336 h PC/ABS/20 GF sample was measured as 100.32 MPa. By adding 50% pure PC/ABS/20 GF to the aged PC/ABS/20 GF sample, the flexural strength increased to 111.64 MPa. 25%, 50% and 75% pure PC/ABS/20 GF addition increased the flexural strength by 9.09%, 11.28% and 9.40%, respectively, compared to the 336 h accelerated aged PC/ABS/20 GF sample (UV-336). In addition, all aged-pure mixtures (25V + R-UV, 50V + R-UV and 75V + R-UV) caused an increase in flexural strength compared to the pure PC/ABS/20 GF.
Average deflection for naturally aged PC/ABS/30 GF samples by months is shown in Figure 22(i). The deflection was found to change very little after natural ageing. Figure 22(i) also presents the relationship between the flexural values and the addition ratios. No significant change in deflection values occurred when pure PC/ABS/30 GF was added to PC/ABS/30 GF samples that were naturally aged for 12 months. Figure 22(k) demonstrates average flexural strength for naturally aged PC/ABS/30 GF samples by months. It was found that the flexural strength changed little after natural ageing. The relationship between the flexural strength and the addition ratios is also shown in Figure 22(k). An increase in flexural strength was observed by adding pure PC/ABS/30 GF to 12 months naturally aged PC/ABS/30 GF samples. The flexural strength of the 12 months naturally aged PC/ABS/30 GF sample was measured as 95.30 MPa. By adding 25% pure PC/ABS/30 GF to the aged PC/ABS/30 GF sample, the flexural strength increased to 106.09 MPa. 25%, 50% and 75% pure PC/ABS/30 GF addition increased the flexural strength by 11.32%, 10.65% and 10.49%, respectively, compared to the 12 months naturally aged PC/ABS/30 GF sample (N-12). Additionally, all aged-pure blends (25V + R-N, 50V + R-N and 75V + R-N) caused an increase in flexural strength relative to the pure PC/ABS/30 GF polymer.
Figure 22(j) presents average deflection for artificially aged PC/ABS/30 GF samples by hours. After 336 h of UV ageing, there was a 7.84% decrease in deflection value. The relationship between the flexural values and the addition ratios is also given in Figure 22(j). When pure PC/ABS/30 GF was added to the 336 h accelerated aged PC/ABS/30 GF samples, there was not much change in the deflection values. Average flexural strength by UV ageing is shown in Figure 22(l). When flexural tests of PC/ABS/30 GF material after accelerated ageing were examined, an increase of 11.62% after 48 h of UV ageing, a 15.50% increase after 144 h of UV ageing, and a 6.49% increase after 336 h of UV ageing in flexural strength was observed. The relationship between the flexural strength and the addition ratios is also depicted in Figure 22(l). 25V + R-UV and 75V + R-UV aged-pure mixtures caused an increase in flexural strength compared to pure PC/ABS/30 GF and 336 h accelerated aged PC/ABS/30 GF samples.
It was also concluded that increasing glass fiber content enhanced flexural strength for aged and unaged composites. This enhancement in the flexural strength was found to be in good agreement with literature and could be explained with the glass fiber contribution as a brittle and tough material.30,31
Impact results
Impact test sample, device and results are given from Figure 23(a)‒23(d). Impact tests were conducted with respect to ISO 180
22
standard (Figure 23(a)) by Instron CEAST 9050 device (Figure 23(b)). The impact strength result of PC/ABS/10 GF samples that were and were not exposed to natural ageing is presented in Figure 23(c). Impact strength decreased with natural ageing. It was found that the impact strength decreased by 3.79% after 3 months of natural ageing and by 6.21% after 6 months of natural ageing. Impact strength decreased by 5.52% after 9 months of ageing and by 12.87% after 12 months of ageing. The impact strength result of PC/ABS/10 GF samples exposed to natural ageing then mixing with pure PC/ABS/10 GF is also given in Figure 23(c). A decrease in impact strength was observed when pure PC/ABS/10 GF was added to 12 months naturally aged PC/ABS/10 GF samples, and the decrease in impact strength was less with the increase in the pure PC/ABS/10 GF ratio. 25%, 50% and 75% pure PC/ABS/10 GF addition decreased the impact strength by 34.83%, 22.56% and 5.41%, respectively, compared to the 12 months naturally aged PC/ABS/10 GF sample (N-12). The reason for the decrement in impact strength with the addition of pure polymer may be inhomogeneity during blending or differences in melt flow characteristics.
32
Impact test. (a) Dimensions of impact test sample (all dimensions are in mm). (b) Test machine for test. (c) Impact strength results for naturally aged samples. (d) Impact strength results for artificially UV aged samples.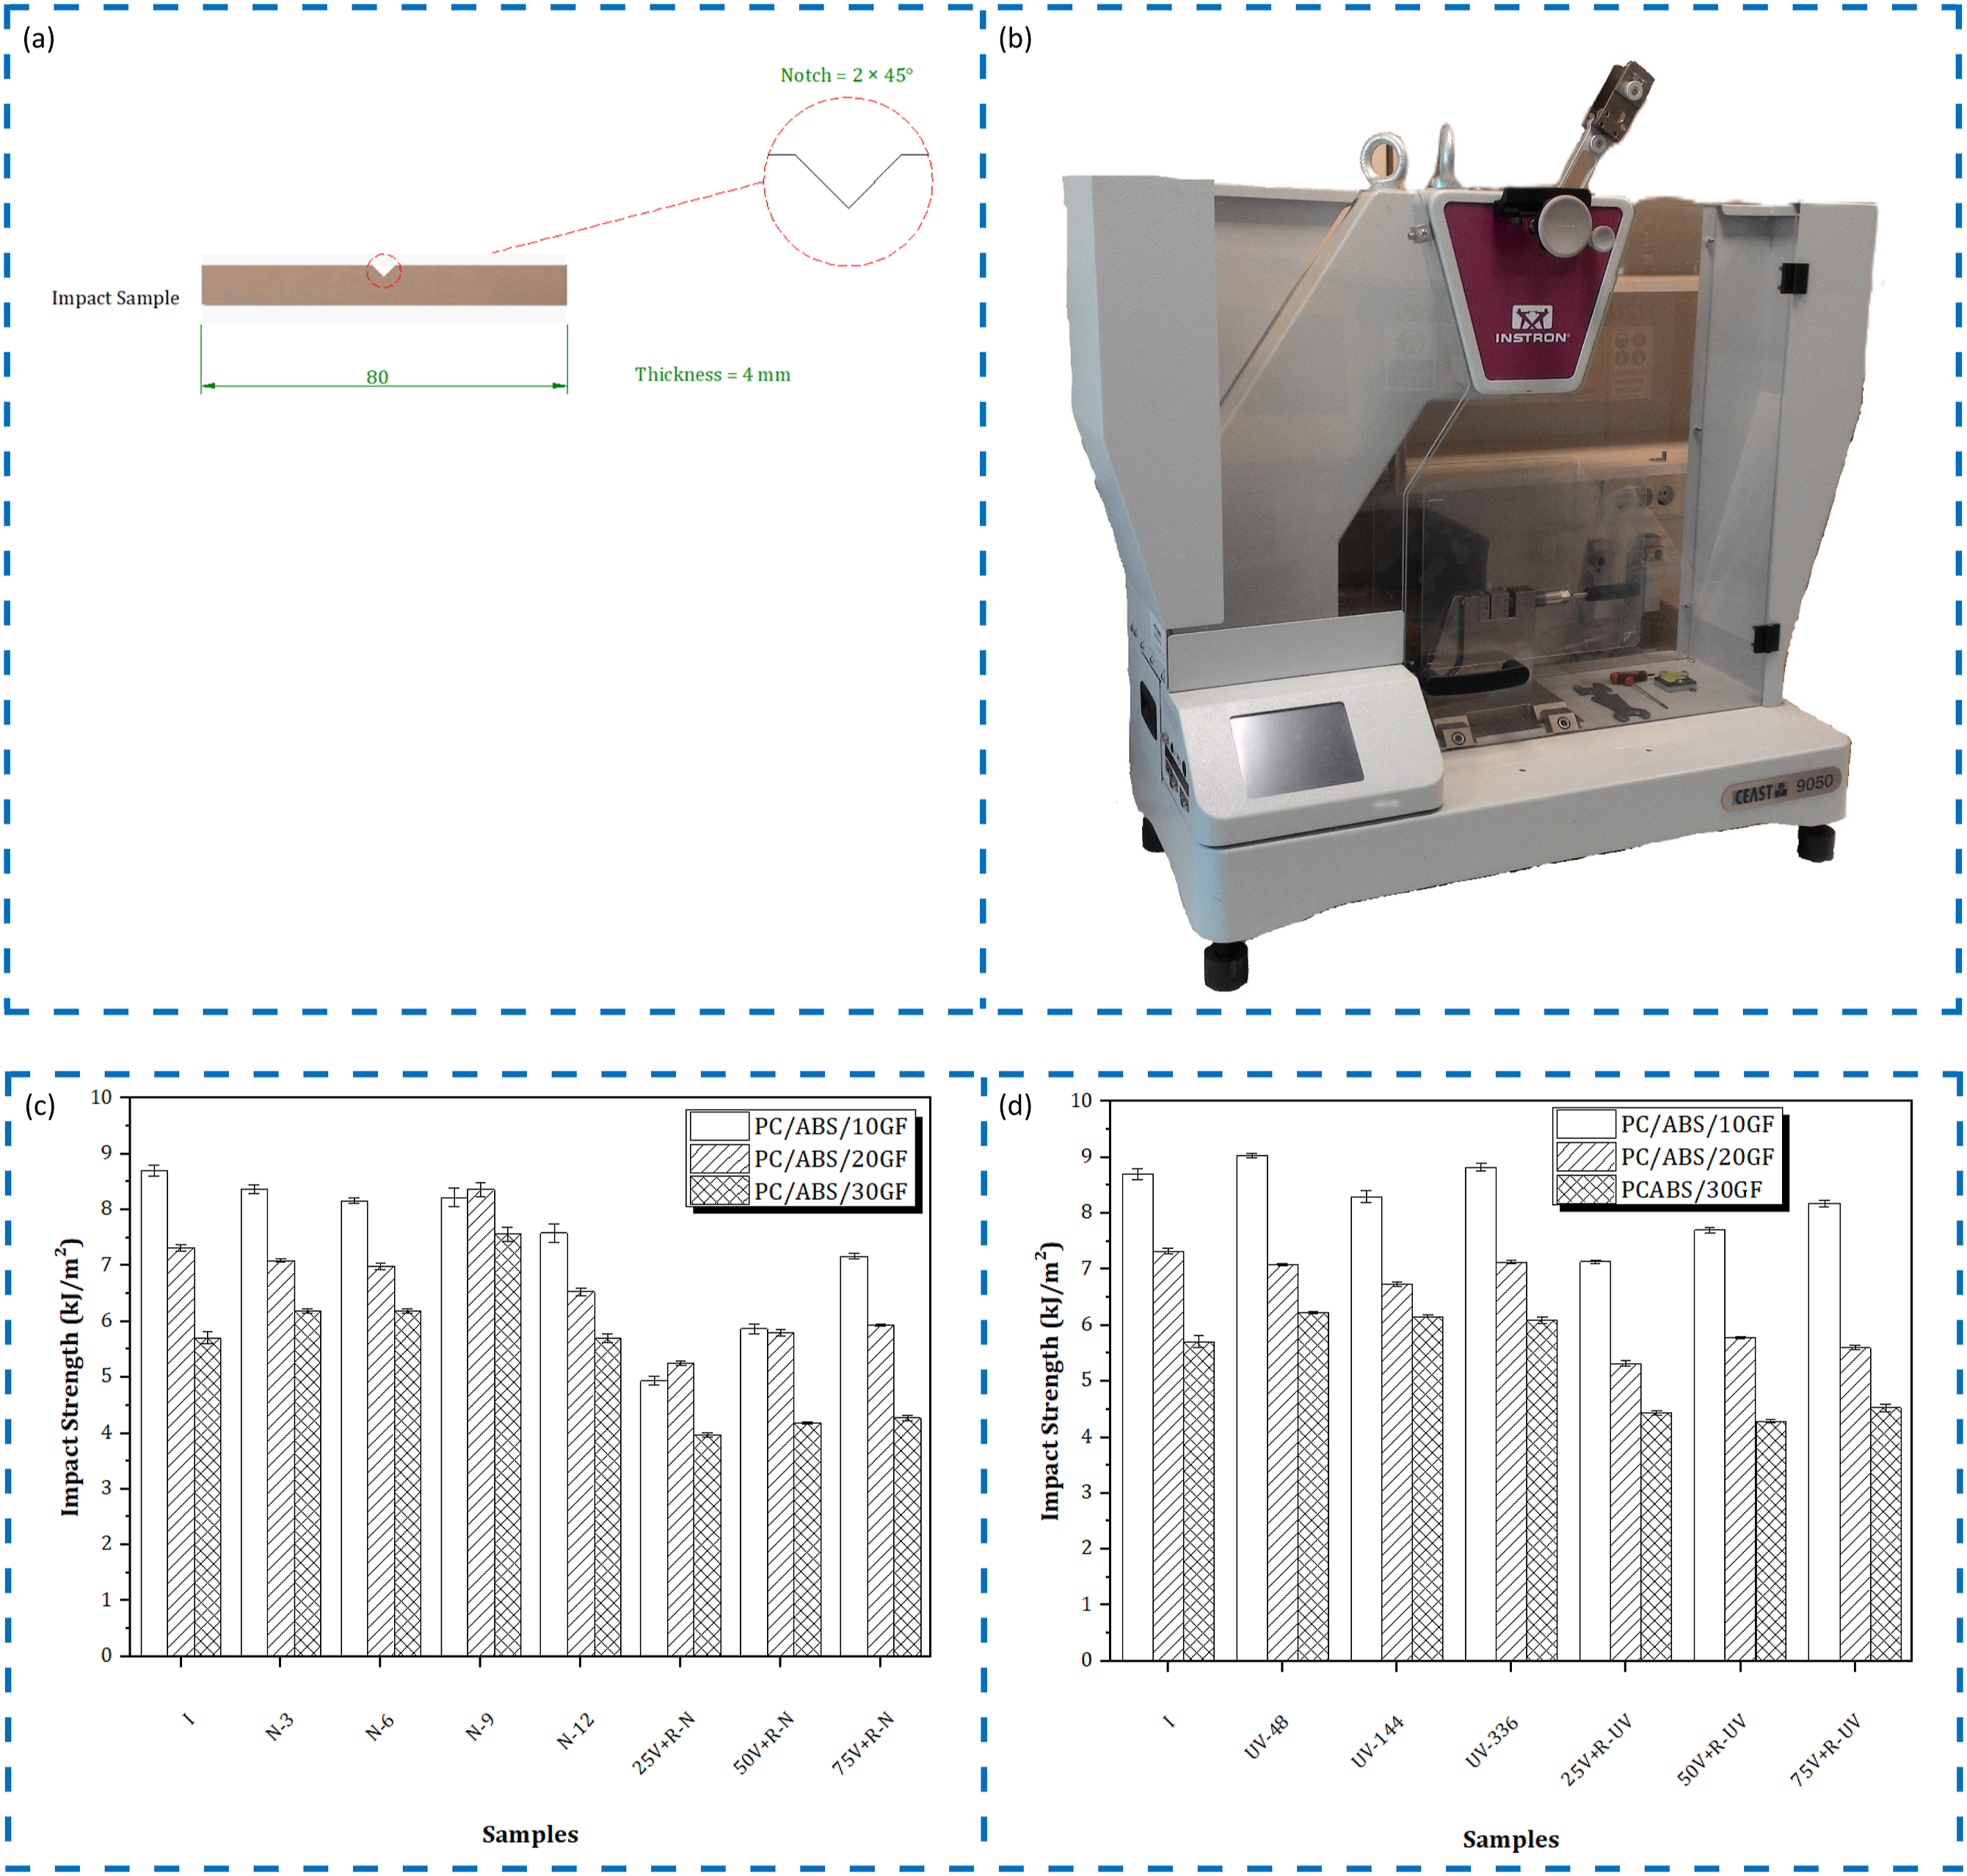
Figure 23(d) shows the impact strength result of PC/ABS/10 GF samples that were and were not exposed to UV ageing. When the impact tests of 10% glass fiber reinforced PC/ABS material were examined after accelerated ageing, an increase of 3.79% in strength was observed after 48 h, a decrease of approximately 5% after 144 h, and an increase of 1.38% after 336 h. Considering the change amounts, it was concluded that the impact strength of the PC/ABS/10 GF material did not change as a result of 336 h of accelerated ageing. The impact strength result of PC/ABS/10 GF samples exposed to UV ageing then mixing with pure PC/ABS/10 GF is also given in Figure 23(d). A decrease in impact strength was observed when pure PC/ABS/10 GF was added to PC/ABS/10 GF samples aged for 336 h, and the decrease in impact strength was less with the increase in the pure PC/ABS/10 GF ratio. 25%, 50% and 75% pure PC/ABS/10 GF addition decreased the impact strength by 19.05%, 12.70% and 7.26%, respectively, compared to the 336 h accelerated aged PC/ABS/10 GF sample (UV-336).
Impact strength result of PC/ABS/20 GF samples that were and were not exposed to natural ageing is presented in Figure 23(c). It was found that the impact strength decreased by 3.14% after 3 months of natural ageing, by 4.51% after 6 months of natural ageing and by 10.79% after 12 months of natural ageing. After 9 months of natural ageing, there was a 14.21% increase in impact strength. Figure 23(c) also presents the impact strength result of PC/ABS/20 GF samples exposed to natural ageing then mixing with pure PC/ABS/20 GF. A decrease in impact strength was observed when pure PC/ABS/20 GF was added to 12 months naturally aged PC/ABS/20 GF samples but the deterioration in impact strength was less with the increase in the pure PC/ABS/20 GF ratio. 25%, 50% and 75% pure PC/ABS/20 GF addition decreased the impact strength by 19.45%, 11.18% and 9.04%, respectively, compared to the 12 months naturally aged PC/ABS/20 GF sample (N-12).
Impact strength result for PC/ABS/20 GF samples that were and were not exposed to UV ageing is shown in Figure 23(d). When the impact tests of PC/ABS/20 GF material were examined after accelerated ageing, a 3.28% decrease after 48 h, a 7.92% decrease after 144 h, and a 2.60% decrease after 336 h in impact strength was observed. Figure 23(d) also gives the impact strength result of PC/ABS/20 GF samples exposed to UV ageing then mixing with pure PC/ABS/20 GF. A decrease in impact strength was observed when pure PC/ABS/20 GF was added to the 336 h accelerated aged PC/ABS/20 GF samples. 25%, 50% and 75% pure PC/ABS/20 GF addition decreased the impact strength by 25.39%, 18.93% and 21.46%, respectively, compared to the 336 h accelerated aged PC/ABS/20 GF sample (UV-336).
Impact strength result of PC/ABS/30 GF samples that were and were not exposed to natural ageing is presented in Figure 23(c). When the impact tests of PC/ABS/30 GF material were examined after natural ageing, an increase of 8.41% in impact strength was observed after 3 months. In the tests after 6 months, no change was seen compared to the 3 months results. After 9 months, the impact strength increased by 32.57%, and in the tests after 12 months, the impact strength was close to the unaged PC/ABS/30 GF value. Figure 23(c) also demonstrates the impact strength result of PCABS/30 GF samples exposed to natural ageing then mixing with pure PC/ABS/30 GF. A decrease in impact strength was observed when pure PC/ABS/30 GF was added to 12 months naturally aged PC/ABS/30 GF but the decrease in impact strength was less with the increase in the pure PC/ABS/30 GF ratio. 25%, 50% and 75% pure PC/ABS/30 GF addition reduced the impact strength by 30.35% and 26.67% and 25.09%, respectively, compared to the 12 months naturally aged PC/ABS/30 GF sample (N-12).
Impact strength result of PC/ABS/30 GF samples that were and were not exposed to UV ageing at the end of the ageing periods is presented in Figure 23(d). When the impact tests of PC/ABS/30 GF material after accelerated ageing were examined, an increase of 8.93% after 48 h, a 7.88% increase after 144 h, and a 6.65% increase after 336 h in impact strength was observed. The impact strength result of PC/ABS/30 GF samples exposed to UV ageing then mixing with pure PC/ABS/30 GF is also presented in Figure 23(d). A decrease in impact strength was observed when pure PC/ABS/30 GF was added to the 336 h accelerated aged PC/ABS/30 GF samples. 25%, 50% and 75% pure PC/ABS/30 GF addition decreased the impact strength by 27.26%, 29.56% and 25.62%, respectively, compared to the 336 h accelerated aged PC/ABS/30 GF sample (UV-336).
Rheological results
MFI result for PC/ABS/10 GF samples that were and were not exposed to natural ageing is demonstrated in Figure 24(a). After 9 months of natural ageing, there was an 82.71% increase in MFI value. After 12 months of natural ageing, there was a 15.35% increase in MFI value. Figure 24(a) also shows MFI result for PC/ABS/10 GF samples exposed to natural ageing then mixing with pure PC/ABS/10 GF. An increase in MFI value was observed when pure PC/ABS/10 GF was added to 12 months naturally aged PC/ABS/10 GF samples. MFI value of the PC/ABS/10 GF sample naturally aged for 12 months was calculated as 17.88 g/10 min. The addition of 25% pure PC/ABS/10 GF increased the MFI value to 30.24 g/10 min. In addition, all aged-pure mixtures (25V + R-N, 50V + R-N and 75V + R-N) caused an increase in the MFI value compared to the pure PC/ABS/10 GF. It was stated in the literature that MFI value of naturally and UV aged PC/PBT polymer increased after recycling compared to its aged state.
33
MFI test results. (a) MFI results for naturally aged samples. (b) MFI results for artificially UV aged samples.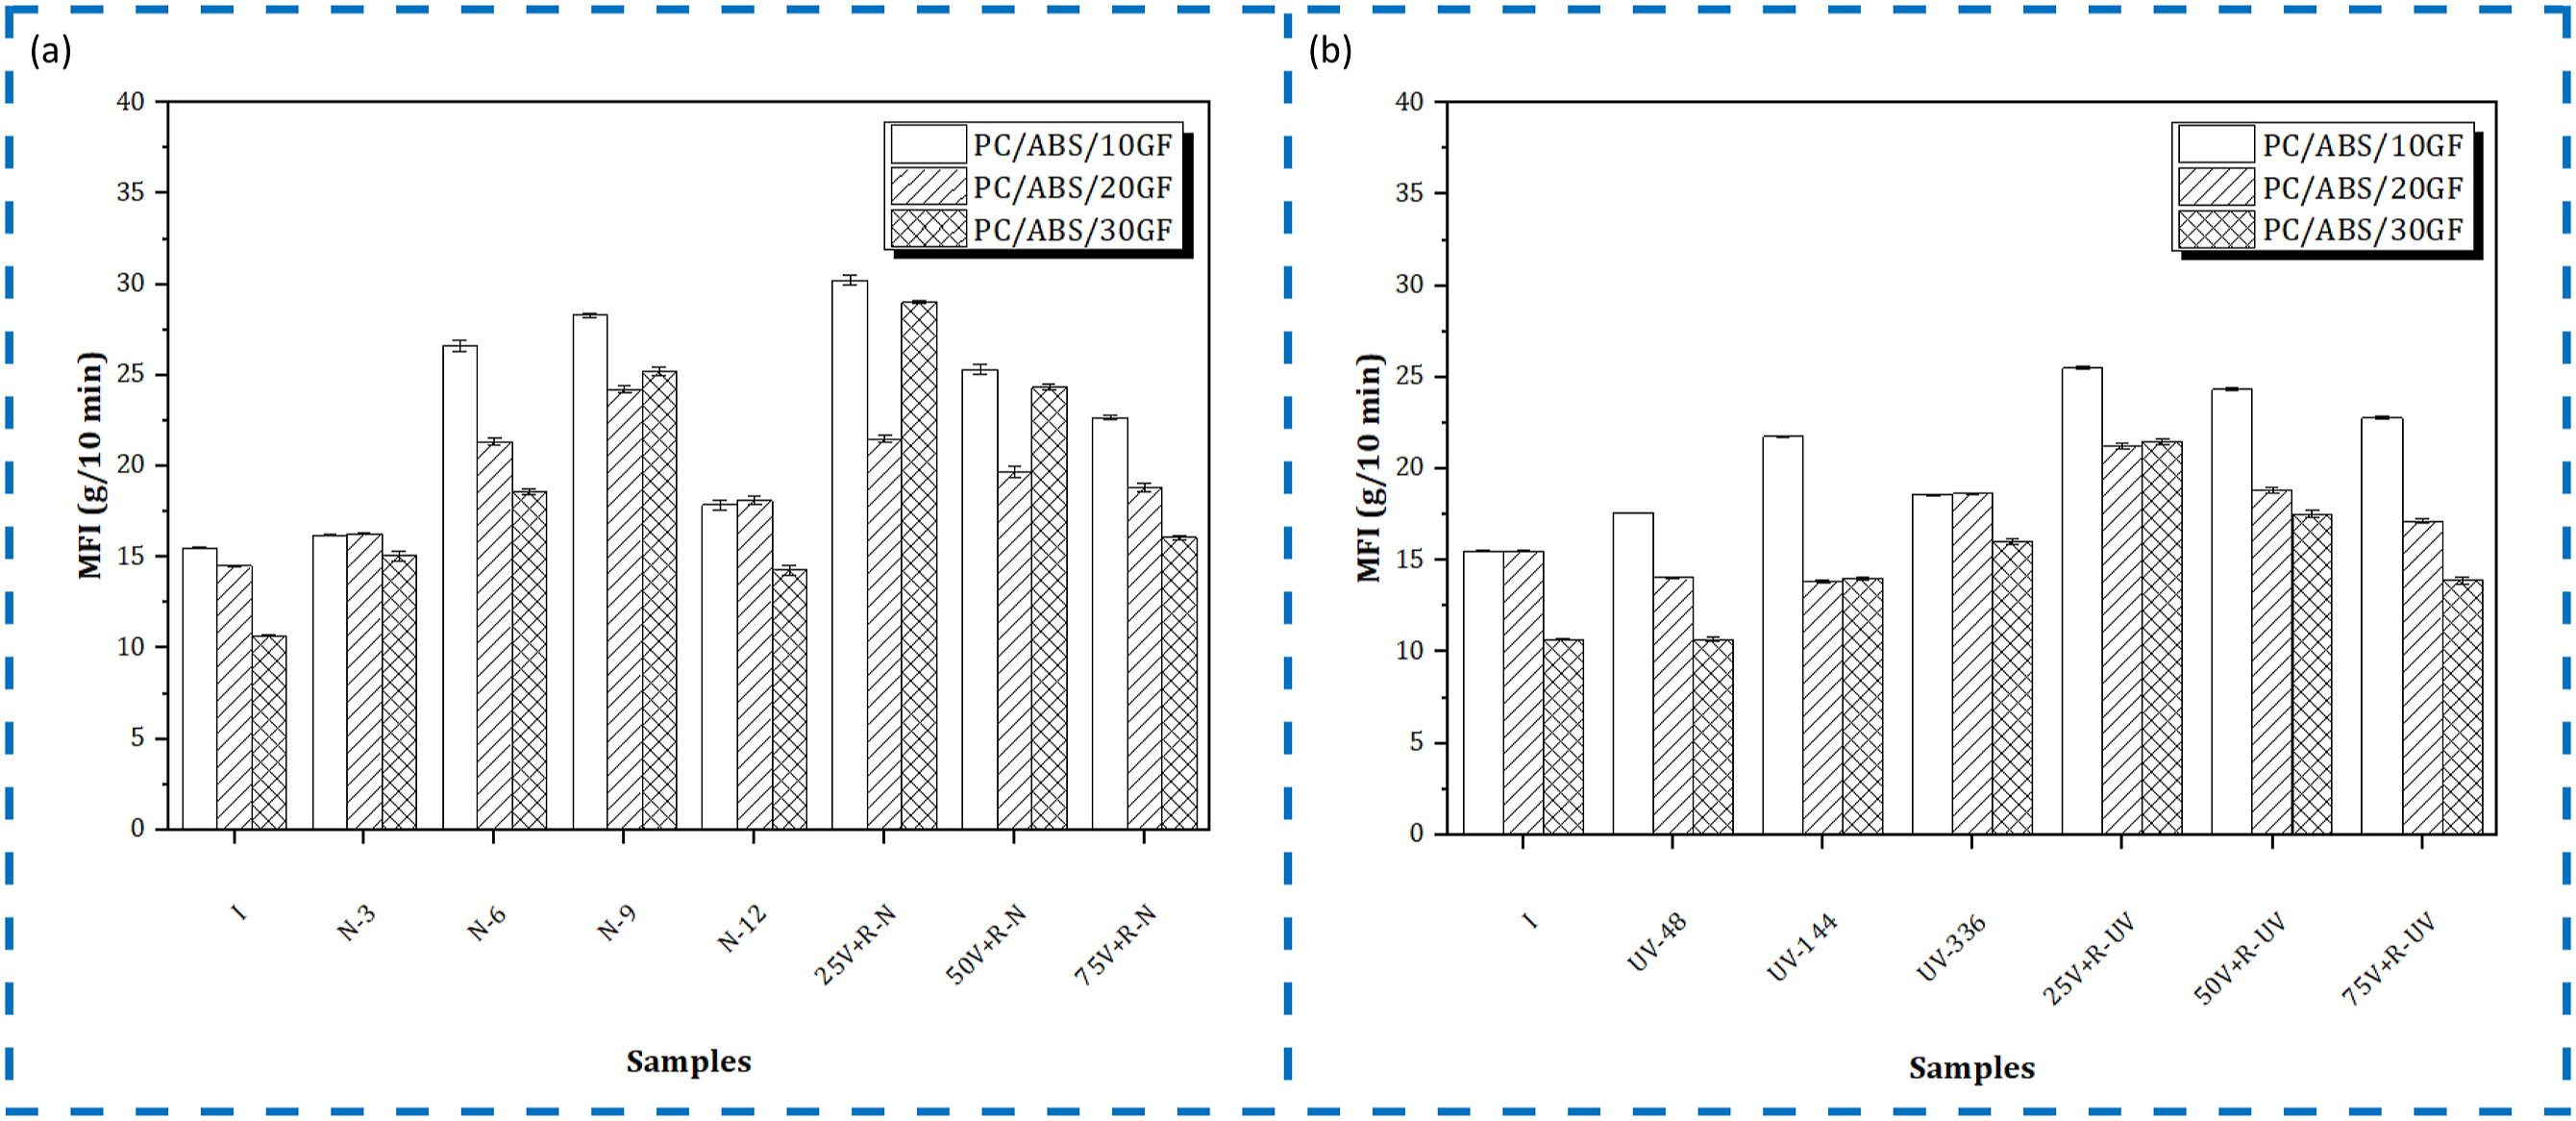
MFI result for PC/ABS/10 GF samples that were and were not exposed to UV ageing is demonstrated in Figure 24(b). When the melt flow properties of 10% glass fiber reinforced PC/ABS samples were examined after accelerated ageing, it was concluded that MFI value increased by 13.48% after 48 h, by 40.39% after 144 h and by 19.87% after 336 h. MFI result for PC/ABS/10 GF samples exposed to UV ageing then mixing with pure PC/ABS/10 GF is presented in Figure 24(b). An increase in MFI value was observed when pure PC/ABS/10 GF was added to the 336 h accelerated aged PC/ABS/10 GF samples. MFI value of the PC/ABS/10 GF sample accelerated aged for 336 h was calculated as 18.58 g/10 min. The addition of 25% pure PC/ABS/10 GF increased MFI value to 25.50 g/10 min. In addition, all aged-pure mixtures (25V + R-UV, 50V + R-UV and 75V + R-UV) caused an increase in MFI value compared to the pure PC/ABS/10 GF polymer. It was stated in the literature that MFI value of naturally and UV aged PC/PBT polymer increased after recycling compared to its aged state. 33
MFI result for PC/ABS/20 GF samples that were and were not exposed to natural ageing is presented in Figure 24(a). After 12 months of natural ageing, there was a 24.71% increase in MFI value. Figure 24(a) also shows MFI result for PC/ABS/20 GF samples exposed to natural ageing then mixing with pure PC/ABS/20 GF. An increase in MFI value was observed when pure PC/ABS/20 GF was added to the 12 months naturally aged PC/ABS/20 GF samples. MFI value of the PC/ABS/20 GF sample aged naturally for 12 months was calculated as 18.12 g/10 min. The addition of 25% pure PC/ABS/20 GF increased MFI value to 21.48 g/10 min. In addition, all aged-pure mixtures (25V + R-N, 50V + R-N and 75V + R-N) caused an increase in MFI value compared to the pure PC/ABS/20 GF. It was stated in the literature that MFI value of naturally and UV aged PC/PBT polymer increased after recycling compared to its aged state. 33
MFI result for PC/ABS/20 GF samples that were and were not exposed to UV ageing is depicted in Figure 24(b). When MFI tests of PC/ABS/20 GF material were examined after accelerated ageing, a 9.35% decrease after 48 h, a 10.52% decrease after 144 h, and a 20.26% increase after 336 h in MFI values was observed. Figure 24(b) also presents MFI result for PC/ABS/20 GF samples exposed to UV ageing then mixing with pure PC/ABS/20 GF. An increase in MFI value was generally observed with the addition of pure PC/ABS/20 GF to the 336 h accelerated aged PC/ABS/20 GF samples. MFI value of the PC/ABS/20 GF sample accelerated aged for 336 h was calculated as 18.64 g/10 min. The addition of 25% pure PC/ABS/20 GF increased MFI value to 21.24 g/10 min. In addition, all aged-pure mixtures (25V + R-UV, 50V + R-UV and 75V + R-UV) caused an increase in MFI value compared to the pure PC/ABS/20 GF. It was declared in the literature that MFI value of naturally and UV aged PC/PBT polymer increased after recycling compared to its aged state . 33
MFI result for PC/ABS/30 GF samples that were and were not exposed to natural ageing is shown in Figure 24(a). When the MFI tests of PC/ABS/30 GF material after natural ageing were examined, an increase in MFI values by 41.16% after 3 months, 73.99% after 6 months, 135.73% after 9 months and 33.58% after 12 months was observed. Figure 24(a) also presents MFI result for PC/ABS/30 GF samples exposed to natural ageing then mixing with pure PC/ABS/30 GF. An increase in MFI value was observed when pure PC/ABS/30 GF was added to the 12 months naturally aged PC/ABS/30 GF samples. MFI value of the PC/ABS/30 GF sample aged naturally for 12 months was calculated as 14.28 g/10 min. The addition of 25% pure PC/ABS/30 GF increased MFI value to 29.04 g/10 min. In addition, all aged-pure mixtures (25V + R-N, 50V + R-N and 75V + R-N) had higher MFI than pure PC/ABS/30 GF. It was stated in the literature that MFI value of naturally and UV aged PC/PBT polymer increased after recycling compared to its aged state . 33
MFI result for PC/ABS/30 GF samples that were and were not exposed to UV ageing is demonstrated in Figure 24(b). It was found that there was no change in MFI values after 48 h, a 30.96% increase after 144 h, and a 49.86% increase after 336 h. MFI result for PC/ABS/30 GF samples exposed to UV ageing then mixing with pure PC/ABS/30 GF is also given in Figure 24(b). An increase in MFI value was generally observed with the addition of pure PC/ABS/30 GF to PC/ABS/30 GF samples that were accelerated aged for 336 h. In addition, all aged-pure mixtures (25V + R-UV, 50V + R-UV and 75V + R-UV) had higher MFI than pure PC/ABS/30 GF. It was declared in the literature that MFI value of naturally and UV aged PC/PBT polymer increased after recycling compared to its aged state . 33
Conclusions
The influences of natural ageing (weathering) and artificial UV ageing on the mechanical, rheological and morphological properties of different amount of glass fiber reinforced PC/ABS were studied in current research. Virgin composite granules were injection molded into the shapes of the tensile, flexural and impact test specimens. Then, specimens were exposed to natural ageing in Gebze (Turkey) for 12 months and exposed to UV ageing for 336 h. After these weathering stages, 12 months naturally and 336 h UV aged specimens were ground and the ground specimens were mixed with virgin glass fiber reinforced PC/ABS at the ratios of 25, 50 and 75% by weight. The mixed materials were re-molded to produce test specimens and then characterized. Following conclusions were derived from experiments: • Color change (yellowing in color) was observed in the PC/ABS/10 GF, PC/ABS/20 GF and PC/ABS/30 GF samples after natural and UV ageing. • In general, samples reprocessed after natural, or UV ageing then mixed with pure composites at different ratios, a color darkening of the samples was observed. As the aged material ratio decreased and the pure material ratio increased, the colors of the samples became lighter. • In general, with natural and UV ageing, more cracks and separated fibers appeared on the side surface of PC/ABS/10 GF, PC/ABS/20 GF and PC/ABS/30 GF. Glass fibers became more evident on the polymer surface with ageing. • Stress-strain curves demonstrated that weathering and recycling had no significant influence on the tensile curves. All composites failed with little or no plastic deformation before and after ageing. The samples broke after reaching the maximum stress, giving very little elongation. • With the increase in glass fiber addition ratio, tensile strength increased, and strain value decreased. For PC/ABS/30 GF composite, high tensile strength values were obtained before natural and UV ageing. • Elongation at break decreased with natural and UV ageing for PC/ABS/10 GF, PC/ABS/20 GF and PC/ABS/30 GF. An increase in the elongation at break occurred when pure PC/ABS/10 GF, PC/ABS/20 GF was added to the 12 months naturally aged PC/ABS/10 GF, PC/ABS/20 GF samples or the 336 h accelerated aged PC/ABS/10 GF, PC/ABS/20 GF samples. A decrease in the elongation at break occurred with the addition of pure PC/ABS/30 GF to the accelerated aged PC/ABS/30 GF samples for 336 h. • In general, tensile strength decreased with natural ageing for PC/ABS/10 GF, PC/ABS/20 GF and PC/ABS/30 GF. An increase in tensile strength was observed when pure PC/ABS/10 GF, PC/ABS/20 GF was added to the 12 months naturally aged PC/ABS/10 GF, PC/ABS/20 GF samples. A decrease in tensile strength was observed when pure PC/ABS/30 GF was added to 12 months naturally aged PC/ABS/30 GF samples. A decrease in tensile strength was observed when pure PC/ABS/10 GF, PC/ABS/20 GF, PC/ABS/30 GF was added to the 336 h accelerated aged PC/ABS/10 GF, PC/ABS/20 GF, PC/ABS/30 GF samples. • Deflection value decreased with natural and UV ageing for PC/ABS/10 GF, PC/ABS/20 GF. An increase in the deflection values occurred when pure PC/ABS/10 GF, PC/ABS/20 GF was added to the 12 months naturally aged PC/ABS/10 GF, PC/ABS/20 GF samples or the 336 h accelerated aged PC/ABS/10 GF, PC/ABS/20 GF samples. • Flexural strength decreased with natural ageing for PC/ABS/10 GF, PC/ABS/20 GF. An increase in the flexural strength was observed by adding pure PC/ABS/10 GF, PC/ABS/20 GF, PC/ABS/30 GF to the 12 months naturally aged PC/ABS/10 GF, PC/ABS/20 GF, PC/ABS/30 GF samples or the 336 h accelerated aged PC/ABS/10 GF, PC/ABS/20 GF, PC/ABS/30 GF samples. • Impact strength decreased with natural ageing for PC/ABS/10 GF and UV ageing for PC/ABS/20 GF. A decrease in impact strength was observed when pure PC/ABS/10 GF, PC/ABS/20 GF, PC/ABS/30 GF was added to 12 months naturally aged PC/ABS/10 GF, PC/ABS/20 GF, PC/ABS/30 GF samples or PC/ABS/10 GF, PC/ABS/20 GF, PC/ABS/30 GF samples aged for 336 h. PC/ABS/30 GF composites retained impact strength after natural ageing. • MFI increased with natural and UV ageing for PC/ABS/10 GF, PC/ABS/20 GF, PC/ABS/30 GF. An increase in MFI value was observed when pure PC/ABS/10 GF, PC/ABS/20 GF, PC/ABS/30 GF was added to 12 months naturally aged PC/ABS/10 GF, PC/ABS/20 GF, PC/ABS/30 GF samples or the 336 h accelerated aged PC/ABS/10 GF, PC/ABS/30 GF samples. • Generally, mechanical properties diminished with natural and UV ageing. But some retention in properties could be achieved with the incorporation of pure polymer.
Footnotes
Acknowledgments
One of the authors (E.K.) would like to thank her doctor, interventional neurologist Prof. Hasan Hüseyin Karadeli, who saved her life and added a miracle to her life with the operation and treatment he performed after cerebrovascular disease in August 2019. The authors thank to TUBITAK for support. The authors also thank Onder Gedik for helping with injection molding and extruder processes, Adem Şen for helping with the tensile and flexural tests and Ahmet Nazim for helping with the SEM observations.
Declaration of conflicting interests
The author(s) declared no potential conflicts of interest with respect to the research, authorship, and/or publication of this article.
Funding
The author(s) disclosed receipt of the following financial support for the research, authorship and/or publication of this article: This study was supported by The Scientific and Technological Research Council of Turkey (TUBITAK), Project Number: 116M257.