
Abstract
The main purpose of this study was to use “green materials” approach by investigating effects of only 1 wt% Cellulose Nanofibrils (CNF) on the strengthening and toughening of neat and blended polylactide (PLA) biopolymer matrix. For this purpose, first of all effects of CNF were investigated in PLA/CNF biocomposite specimens. After blending of PLA with 10 phr bio-based thermoplastic polyester (b-TPE) elastomer, effects of CNF were investigated also for this PLA/b-TPE/CNF ternary biocomposite specimens. Mechanical tests revealed that due to the efficient strengthening and toughening mechanisms, CNF increased flexural strength of PLA by 33%, while b-TPE increased fracture toughness of PLA by 104%. When CNF and b-TPE were incorporated together, synergism in the strength and toughness values were occurred. All bioblend and biocomposite specimens were produced by using the same “melt mixing” technique in a laboratory size twin-screw extruder, and their test specimens were shaped by conventional “compression molding”. Since shaping by “3D-printing” is frequently used in the biomedical sectors, another distinctive aim of this study was to reveal whether there were any differences in the strength and toughness values of specimens after their 3D-printing. It was observed that due to the “textured” structure of 3D-printed specimens, their flexural strength values were approximately 20% lower, while fracture toughness values were approximately 20% higher.
Keywords
Introduction
Although use of petroleum-based traditional polymers is still dominating in various sectors of industry, consideration of bio-based polymers from the point of “green materials” approach is becoming an important necessity. Among other alternative biopolymer macromolecules, poly(lactic acid) simply named as polylactide (PLA) is becoming one of the best candidate due to its available mass production method from corn-starch and its thermoplastic character leading to efficiency in many industrial processing techniques such as melt mixing and conventional molding for shaping.
Performance of neat PLA in terms of mechanical and thermal properties could be sufficient for many ordinary components used at around room temperature. On the other hand, for the applications requiring higher degree of strength and toughness; reinforcing and blending will be required.
In order to improve strength of PLA, composite making with conventional fibers, macro and/or micro-fillers could be used. In the academia, researchers especially used nano-size reinforcing agents such as nanoclays, carbon nanotubes, graphene and various inorganic fillers1–3 due to their efficiency in the main polymer strengthening mechanisms of “load transfer from the matrix” and “decreased mobility of matrix macromolecules” by their very high surface area to volume ratios.
For the “fully green composites” approach, it is important that not only bio-based polymer matrix, but nano-sized reinforcing agents should be also bio-based; such as Cellulose Nanofibrils (CNF). There are certain number of studies4–15 conducted to observe influences of CNF on the certain mechanical properties of PLA matrix biocomposites. These studies generally indicated that use of around 1 wt% CNF could result in improvement in strength values; while certain melt mixing problems would occur when higher amounts of CNF were incorporated. Thus, one of the purposes of this study was to contribute these studies by investigating effects of using only 1 wt% CNF on the strengthening mechanism of PLA matrix.
In order to improve toughness of PLA, the general approach is using “rubber toughening” method which is very efficient for the main toughening mechanism of “shear yielding”. For this purpose, blending of PLA with various traditional elastomers including natural rubber, isoprene rubber, butadiene-based rubbers and many ethylene-copolymers were used.16–19 For the “green blends” approach, PLA was blended with bio-based elastomers, such as bio-based thermoplastic vulcanizates,20–27 poly(butylene adipate-co-terephthalate),28,29 starch,30–32 poly-(3-hydroxybutyrate-co-3-hydroxyvalerate), 33 lignin,34,35 poly(butylene succinate), 36 bio-based poly(ethylene terephthalate) 37 and polycaprolactone. 38
It is known that block-copolymer elastomer structures having thermoplastic character due to their hard and soft segments could be also efficient to balance strength and toughness values in the PLA blends. In the literature, blending of PLA with bio-based thermoplastic polyurethane elastomer was reported by only three studies39–41; while blending with bio-based thermoplastic polyester (b-TPE) elastomers by only two studies.42,43 These studies generally indicated that blending of PLA with around 10 phr thermoplastic elastomers would result in improvement in toughness values without too much decrease in strength values. Thus, another purpose of this study was to contribute these very limited number of studies by investigating effects of blending PLA with only 10 phr b-TPE on the toughening mechanisms.
In order to get optimum degree of strength and toughness, “ternary systems” could be also produced; that is PLA matrix could be blended with a bio-based elastomer together with reinforcing with a cellulose nano-filler, simultaneously. From this point of view, a few studies were reported for the ternary systems of PLA/elastomer/CNF.44–46 However, to the best of our knowledge, no studies on the ternary systems of PLA/b-TPE/CNF were cited in the literature. Thus, the most distinctive aim of this study was to investigate the degree of strengthening and toughening of PLA biopolymer when reinforced with only 1 wt% CNF and blended with only 10 phr b-TPE, simultaneously.
Although shaping of the components made from bio-blends and biocomposites could be achieved by traditional injection or compression molding techniques, use of additive manufacturing techniques such as 3D-printing in the biomedical sectors is on the rise due to various advantages. Significant number of 3D-printer studies47–59 on the PLA/Cellulose biocomposites were already cited in the literature. However, only two of them48,51 compared changes in the mechanical properties of specimens. Thus, another distinctive aim of this study was to reveal whether there were any differences in the strength and toughness values of all groups of PLA, b-TPE, CNF specimens after their 3D-printing, compared to their compression molded counterparts.
Experimental work
Ingredients of the bioblends and biocomposites
The main biopolymer matrix used was PLA with L-type lactic acid macromolecules. According to the supplier (NaturePlast PLE 001, France), its density was 1.25 g/cm3, melting temperature range was 145°C–155°C, melt flow index range at 190°C under 2.16 kg was 2–8 g/10 min, while the weight average molecular weight was 101 × 103 g/mol.
For toughening purposes, inherently brittle PLA matrix was blended with a b-TPE. According to the supplier (Dupont, Hytrel RS 40F3 NC010, USA), soft segments were composed of at least 50% renewably sourced bio-ingredients by weight. Its block copolymer structure was consisted of poly(tetramethylene ether) glycol terephthalate soft segments and poly(butylene terephthalate) hard segments. Its density, Shore-D hardness, stress and strain at break values were 1.11 g/cm3, 37, 26 MPa and 650%, respectively.
For reinforcing purposes of neat PLA and PLA/b-TPE blends, CNF were used. According to the supplier (Guilin Qihong Technology, China) diameter range of these CNF particles was 20-100 nm. Molecular structures of these three ingredient materials are given in Figure 1. Molecular structure of the ingredients (PLA, b-TPE, CNF) used in the bioblends and biocomposites. PLA: polylactide; b-TPE: bio-based thermoplastic polyester elastomer; CNF: Cellulose Nanofibrils.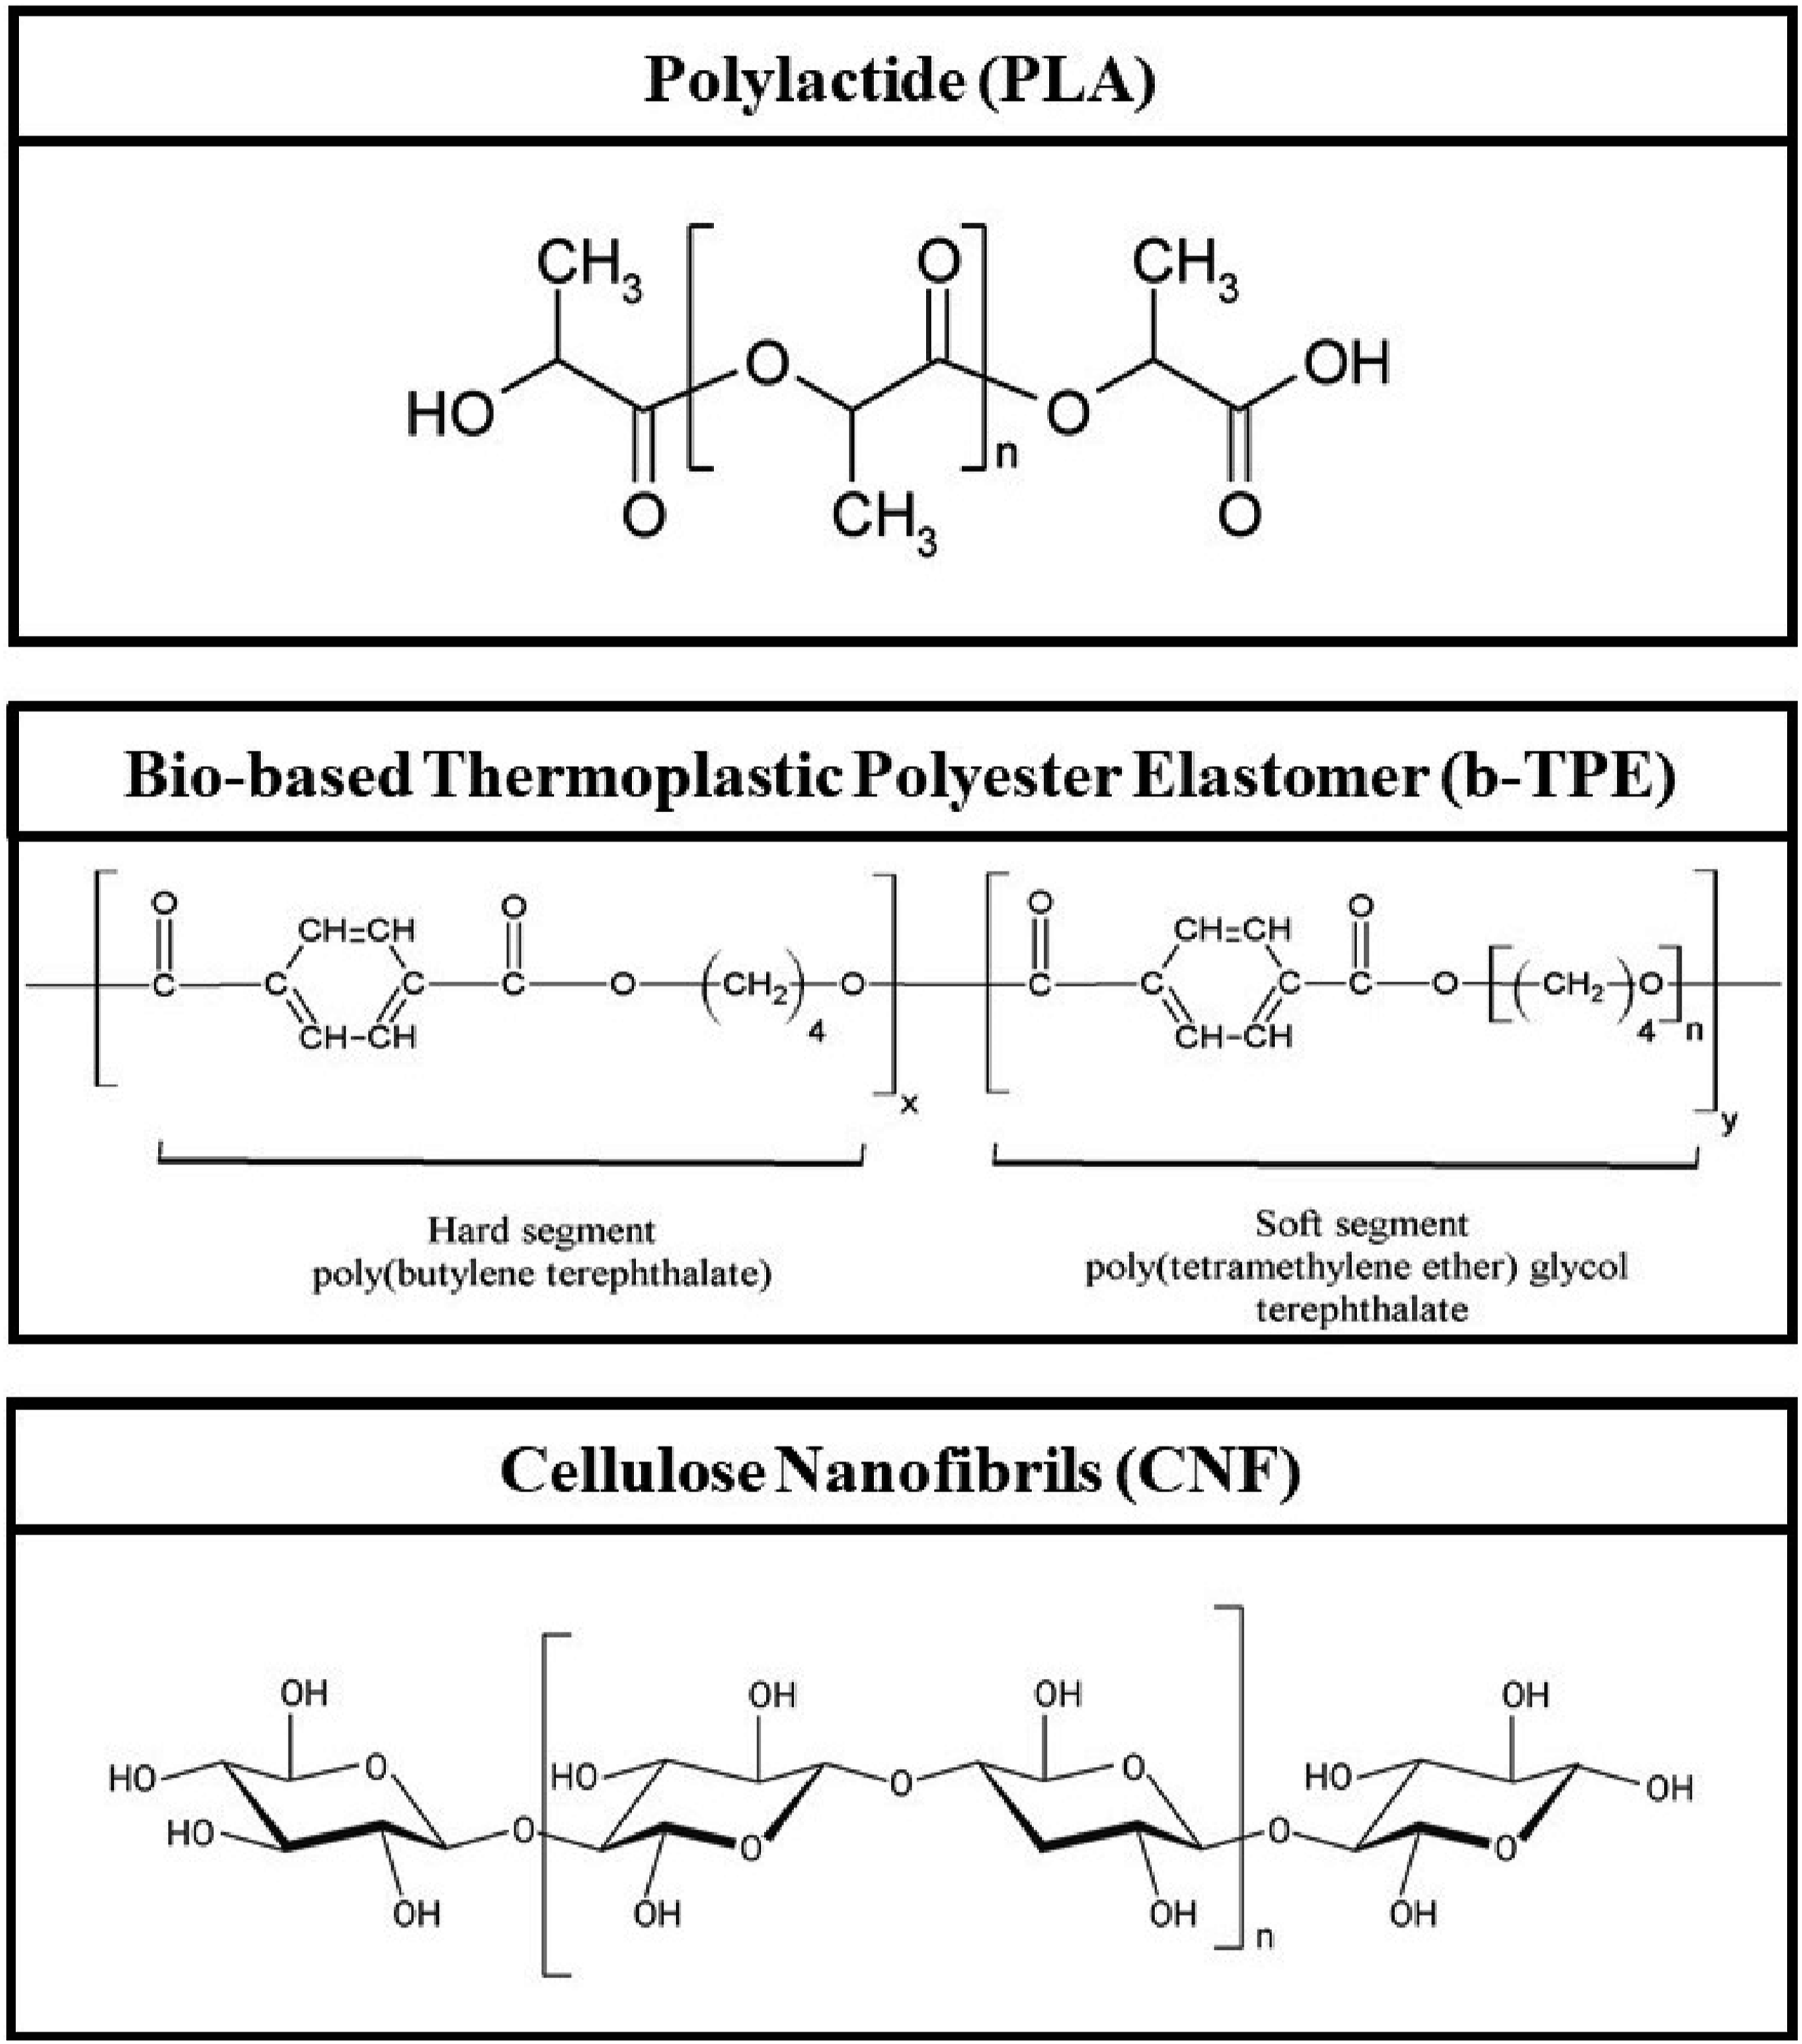
Production of bioblends and biocomposites
Both bioblends (PLA/b-TPE) and biocomposites (PLA/CNF and PLA/b-TPE/CNF) were produced by using the same “melt mixing” technique in a laboratory size twin-screw extruder (Rondol Microlab 300, UK) (Figure 2). For all compositions, typical temperature profile and screw speed used were 115°-170°-180°-175°-150°C and 70 r/min, respectively. Before melt-mixing, all ingredients (PLA, b-TPE, CNF) were pre-dried in a vacuum oven at certain temperatures for certain periods. General views of the equipment used during production of bioblends and biocomposites by melt mixing; and their specimen shaping by conventional molding and additive manufacturing technique.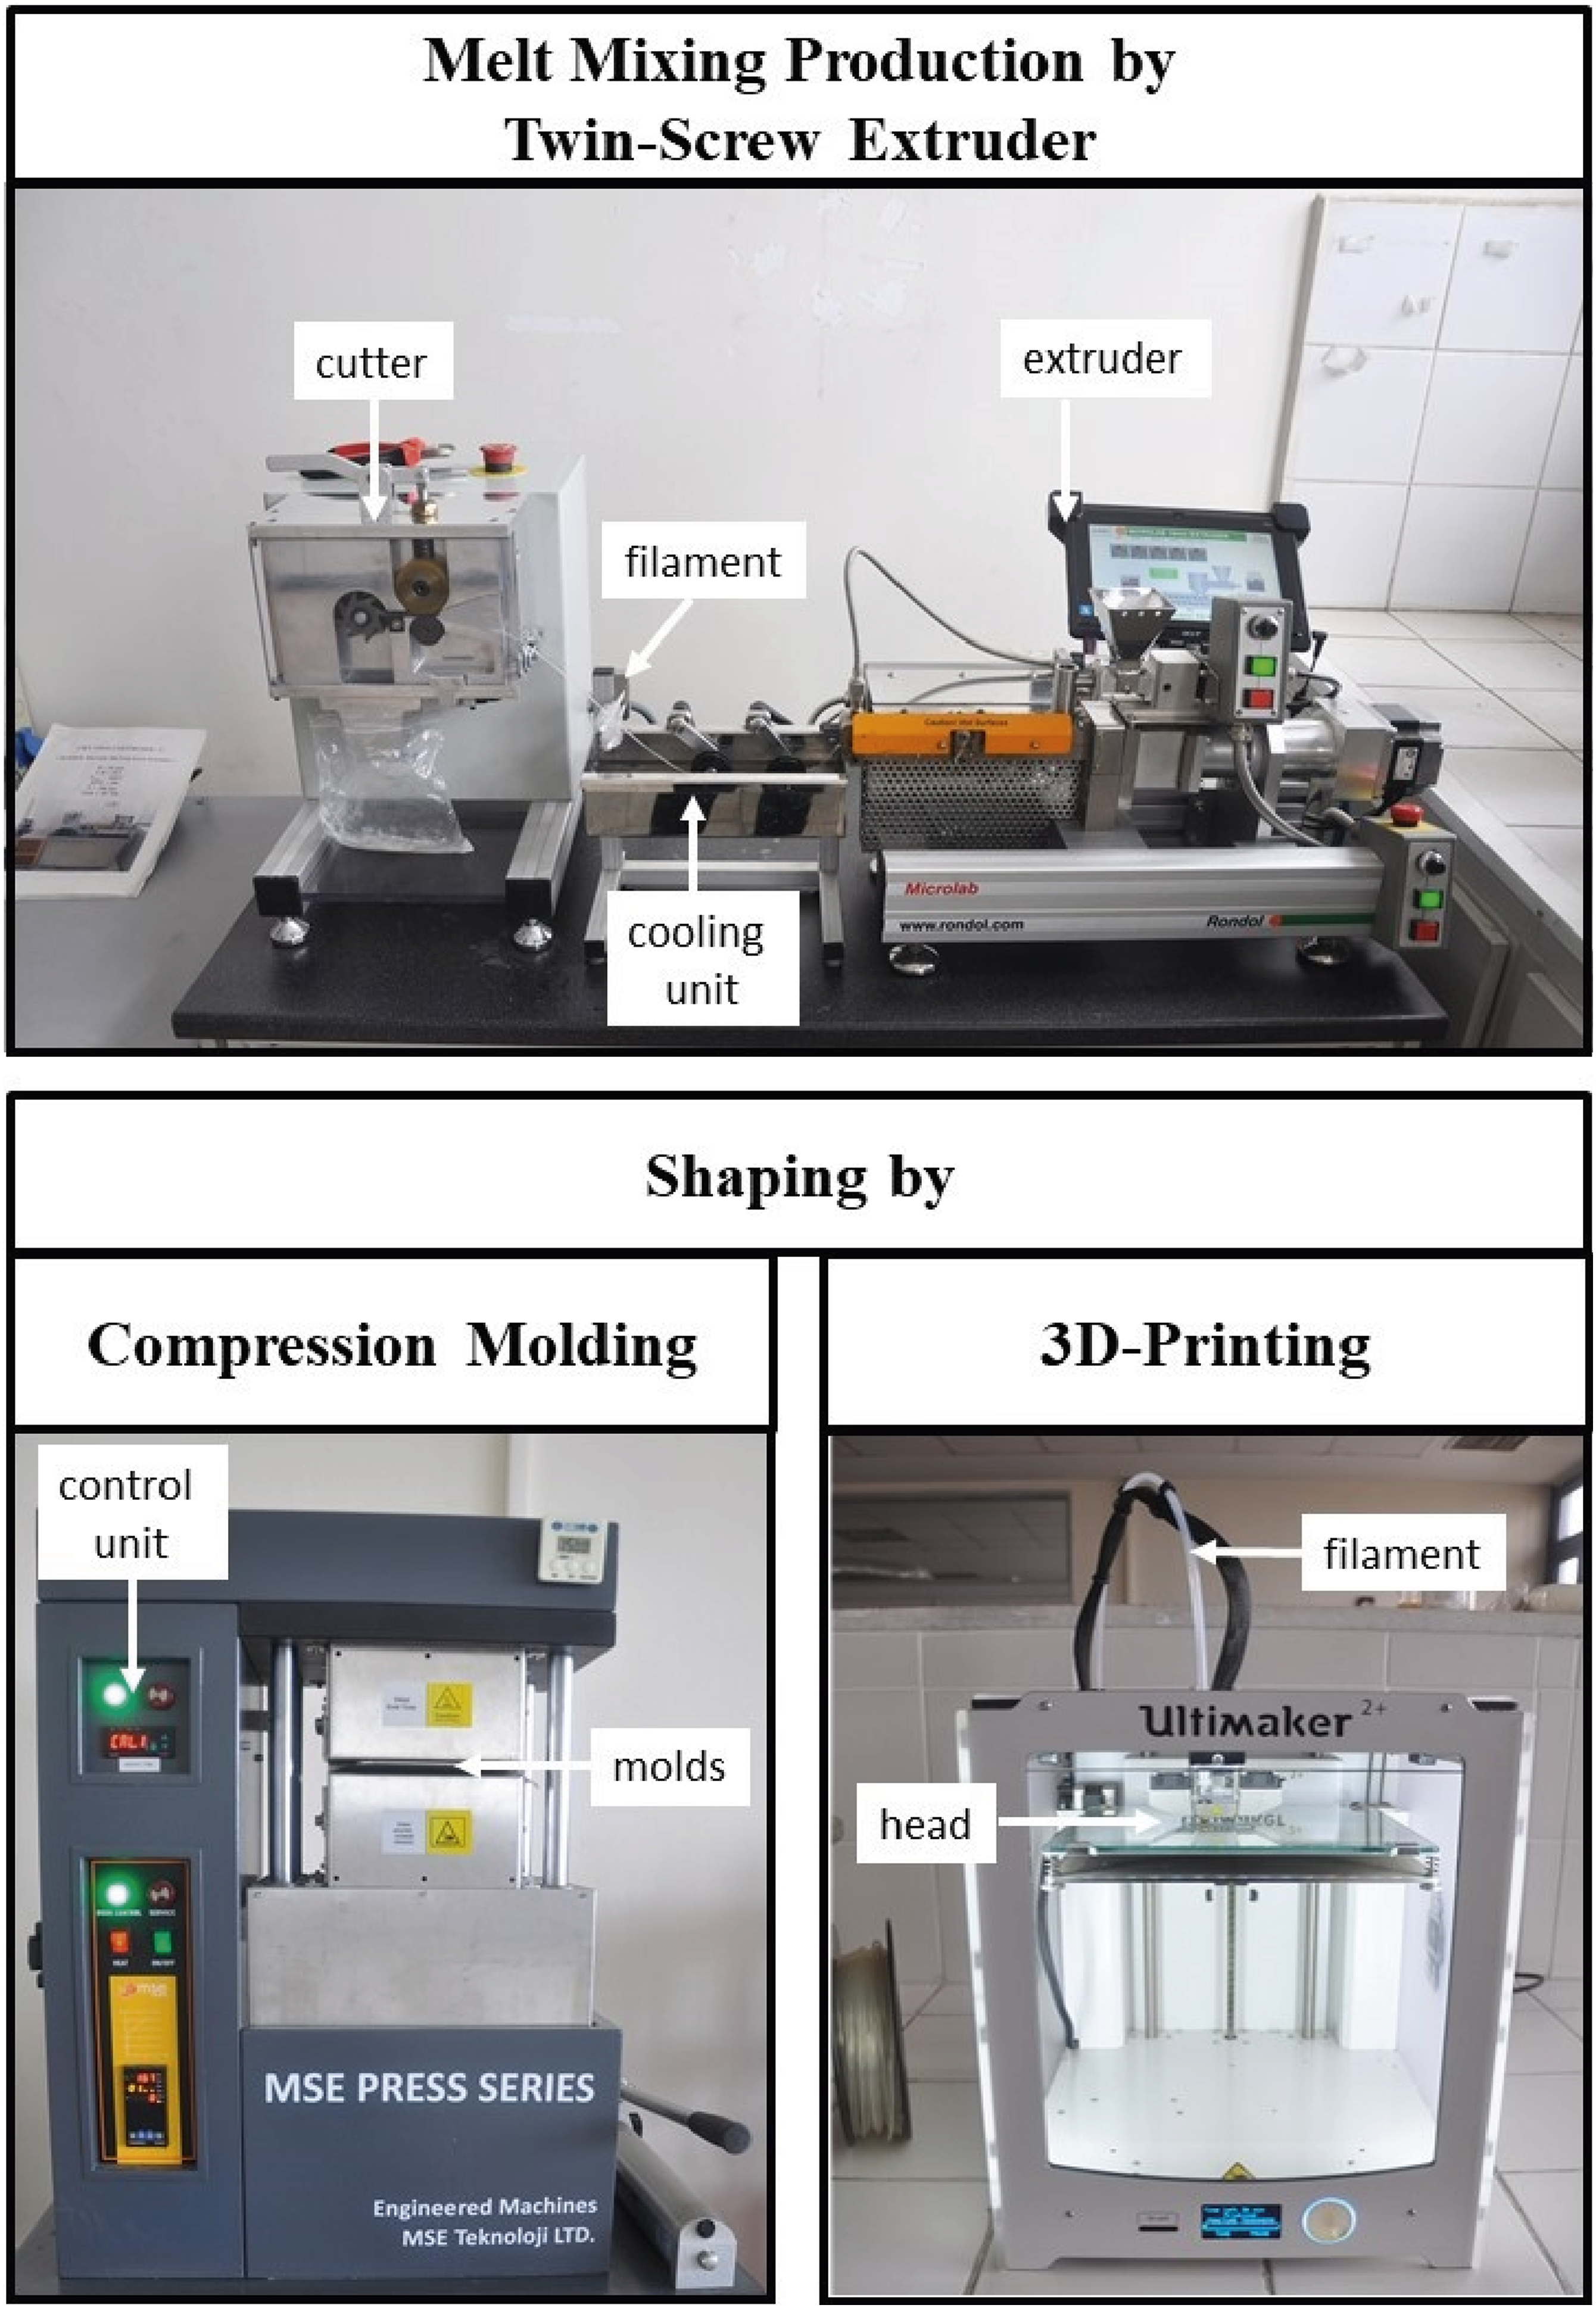
Literature survey indicated that typical elastomer amount used for toughening of PLA with little decrease in strength was around 10 phr; while typical amount of nano-reinforcements used in nanocomposite studies was around 1 wt%. Thus, in this study, PLA/b-TPE bioblends were produced by using 10 phr b-TPE; while PLA/CNF and PLA/b-TPE/CNF biocomposites were produced by incorporating 1 wt% CNF particles.
Shaping of test specimens by compression molding
The first technique used to shape test specimens of all bioblends and biocomposites was the conventional “compression molding”. Before filling the molds prepared according to related ISO standards with 2–3 mm pellets obtained from the cutter of the twin-screw extruder; these pellets were first dried in an oven at 60°C for 12 h. Then, specimens were shaped by using a laboratory-scale hot press (MSE LP_M2SH05, Turkey) (Figure 2) at 160°C, under 25 kN for 5–6 min.
Shaping of test specimens by 3D-printing
In order to observe whether there would be any differences in the mechanical properties of bioblends and biocomposites when their test specimens were shaped by an additive manufacturing technique compared to conventional molding technique; a Fused Deposition Modeling (FDM) type table-top 3D-printer (Ultimaker 2+, Netherlands) (Figure 2) was used. For this purpose, 2 mm diameter continuous filaments obtained from the twin-screw extruder were fed into the 3D-printer head at 190°C having 0.4 mm nozzle.
Specimen geometries in accordance with related ISO standards were obtained by using a drawing software (SolidWorks) and then G-code slicing software (Cura 2.3.1). After determining all the required hardware parameters and software parameters by conducting various trials, test specimens were printed with lay-down position and ±45° raster orientation.
Testing and analyses of the specimens
Electronmicroscopy analyses
Morphology and distribution of b-TPE domains and CNF particles in PLA matrix were observed by using a field emission scanning electron microscope (SEM) (FEI Nova Nano 430, Japan) under an accelerating voltage of 15 kV with a working distance of 5 mm. Fracture surfaces of the specimens to be examined were first gold sputtered.
Thermal analyses
Thermal behaviors of the bioblend and biocomposite specimens were analyzed by both Differential Scanning Calorimetry (SII X-DSC 700 Exstar, Japan) and Thermogravimetric Analyses (SII TG/DTA 7300 Exstar, Japan) under a heating rate of 10°C/min. Heating profile used during DSC analyses was from −80° to 220°C, while during TGA analyses it was from 30° to 550°C.
Mechanical tests
Strength and stiffness of the bioblend and biocomposite specimens were determined by conducting “Three-Point Bending” tests in accordance with ISO 178 standard, while toughness values of the specimens were determined by conducting “K IC and G IC Fracture Toughness” tests in accordance with ISO 13586 standard. Tests were performed by using a 5 kN Universal Testing System (Instron 5565A, USA) for at least five specimens in each group.
Results and discussion
In this section, after fracture surface morphology observations in the compression molded bioblend and biocomposite specimens, effects of CNF reinforcements on the thermal and mechanical properties were discussed. Moreover, differences observed when the specimens were shaped by 3D-printing were also reported.
Fracture surface morphology of bioblends and biocomposites
As shown in Figure 3, SEM analyses on the fracture surface of the specimens were conducted under two different magnifications; i.e., “general view” with 1000X magnification and “closer view” with 5000X magnification. General and closer view scanning electron microscope images showing fracture surface morphology of bioblend and biocomposite specimens.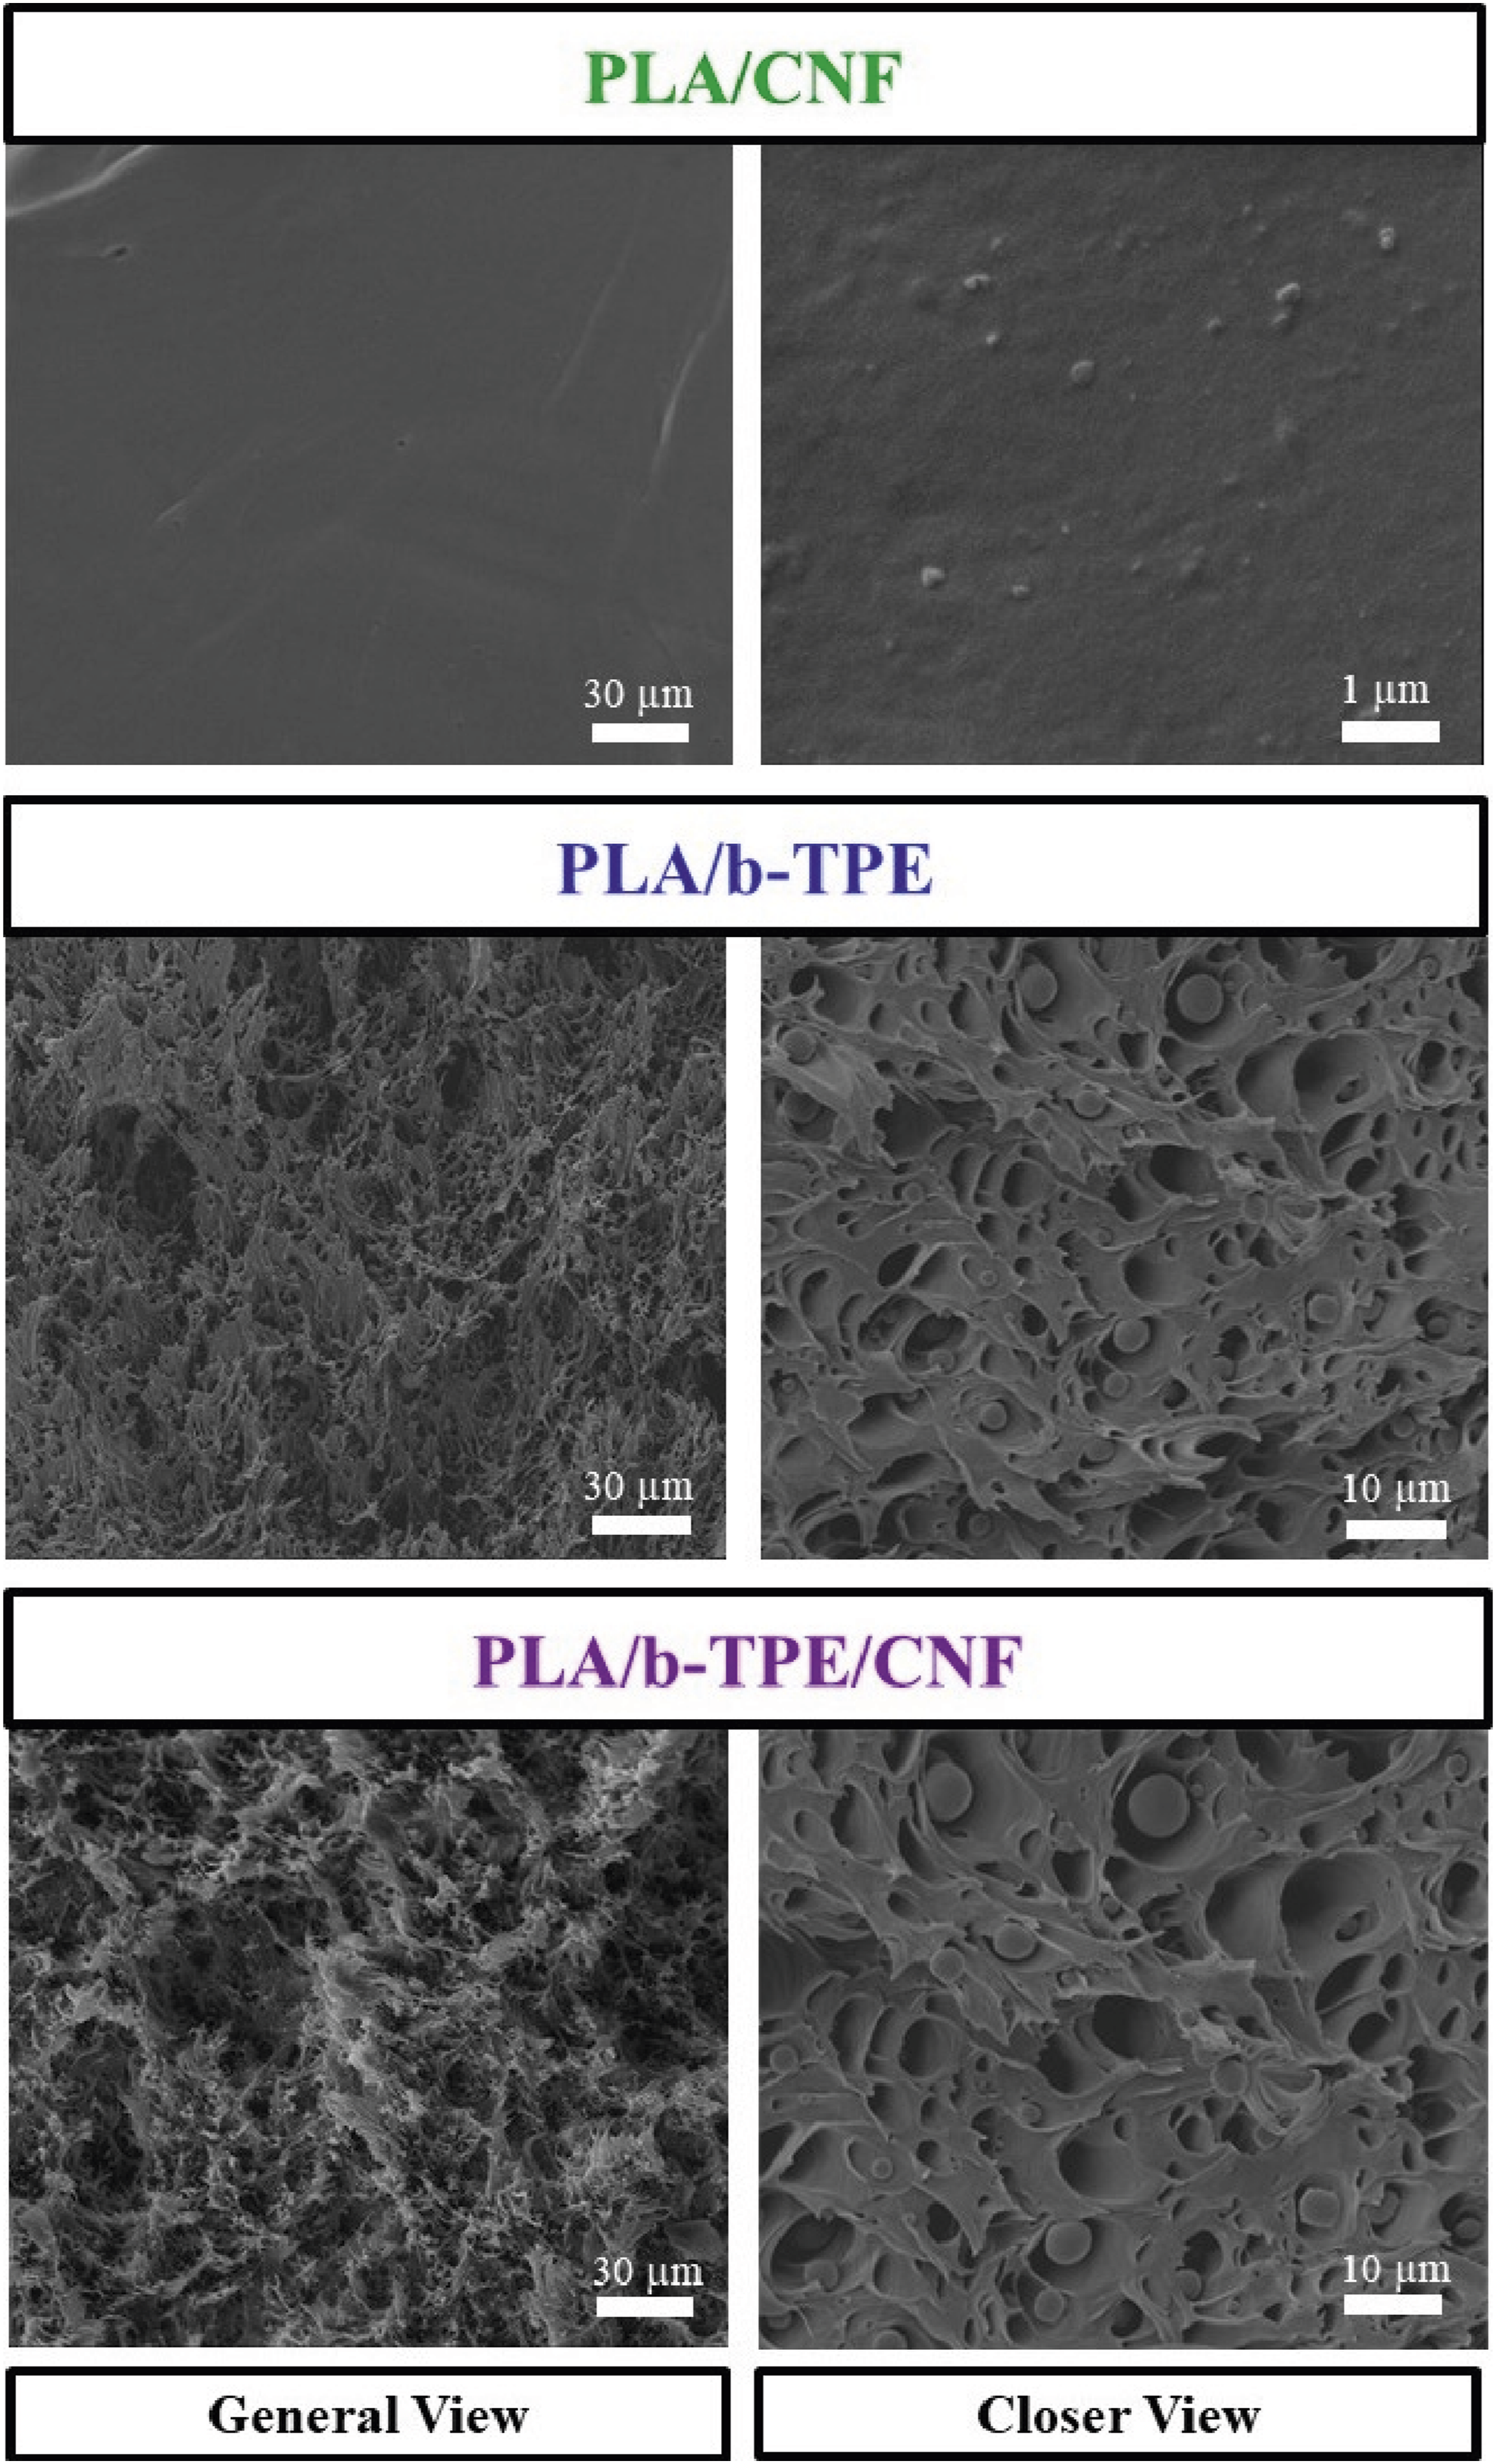
General view image of PLA/CNF biocomposite specimen revealed very smooth fracture surface with certain degree of craze bands, which was due to the inherently brittle behavior of PLA matrix. Closer view image of this biocomposite specimen indicated that use of 1 wt% CNF particles were rather randomly and uniformly distributed in PLA matrix. As would be discussed later, even distribution of CNF reinforcements played a critical role in the improvement of mechanical properties.
On the other hand, general view image of PLA/b-TPE bioblend specimen revealed excessively rough fracture surface which was due to the shear yielding occurred with very high degree of plastic deformation. Due to the immiscibility of PLA with b-TPE, closer view image of this bioblend specimen indicated that use of 10 phr b-TPE resulted in homogeneously distributed round “domains” with diameters less than 10 microns. As would be discussed later, these elastomer domains played a critical role in the rubber toughening mechanism of specimens.
For the specimen of PLA/b-TPE/CNF, general view image in Figure 3 again revealed excessively rough fracture surface due to the shear yielding occurred. However, in the closer view image, it was not possible to recognize CNF particles which were obscured by the large amount of b-TPE domains formed.
Thermal behavior of bioblends and biocomposites
In order to observe thermal behavior of all specimens produced by melt-mixing and then shaped by compression molding, both DSC and TGA analyses were conducted.
DSC
First heating DSC thermograms were illustrated in Figure 4. Then, values of glass transition temperature (T
g
), cold crystallization temperature (T
cc
), melting temperature (T
m
), enthalpies during melting (∆H
m
) and cold crystallization (∆H
cc
) determined from thermograms were tabulated in Table 1. In this table, percent crystallinity (X
c
) of all specimens were also given, which were determined by using the values of ∆H
m
, ∆H
cc
and the weight fraction of PLA (w
PLA
) together with melting enthalpy of 100% crystalline PLA (∆H
m
º) cited as 93.7 J/g in the literature.
60
First heating DSC thermograms of bioblend and biocomposite specimens. Values of the transition temperatures, enthalpies and crystallinity amounts of bioblend and biocomposite specimens determined from first heating DSC thermograms. PLA: polylactide; b-TPE: bio-based thermoplastic polyester elastomer; CNF: Cellulose Nanofibrils.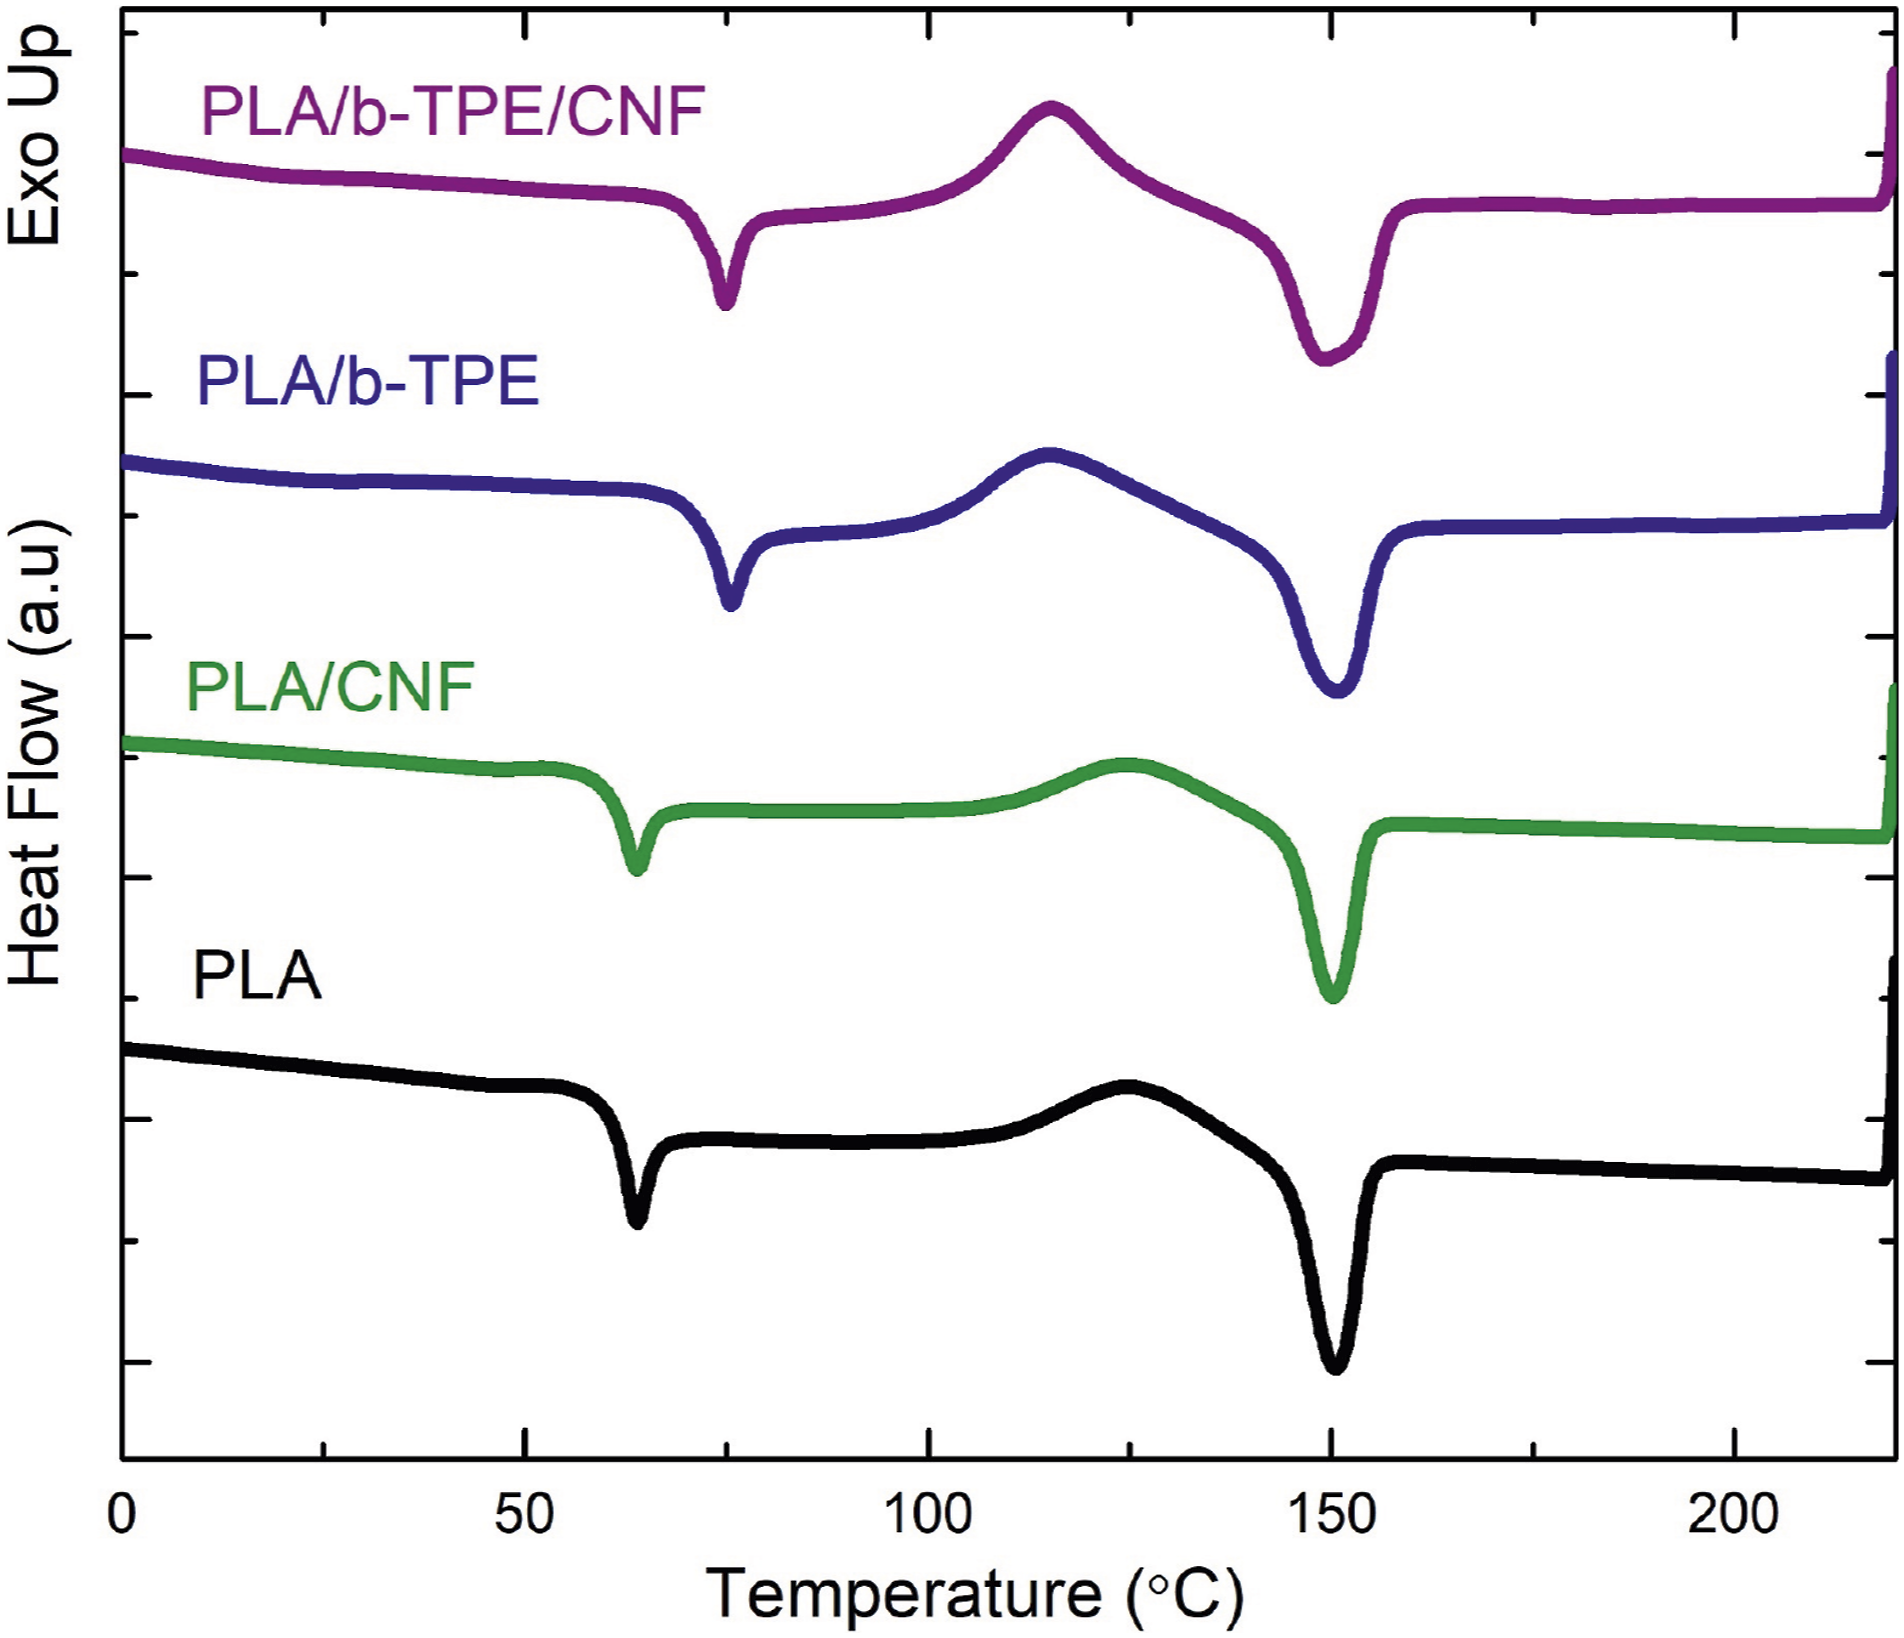
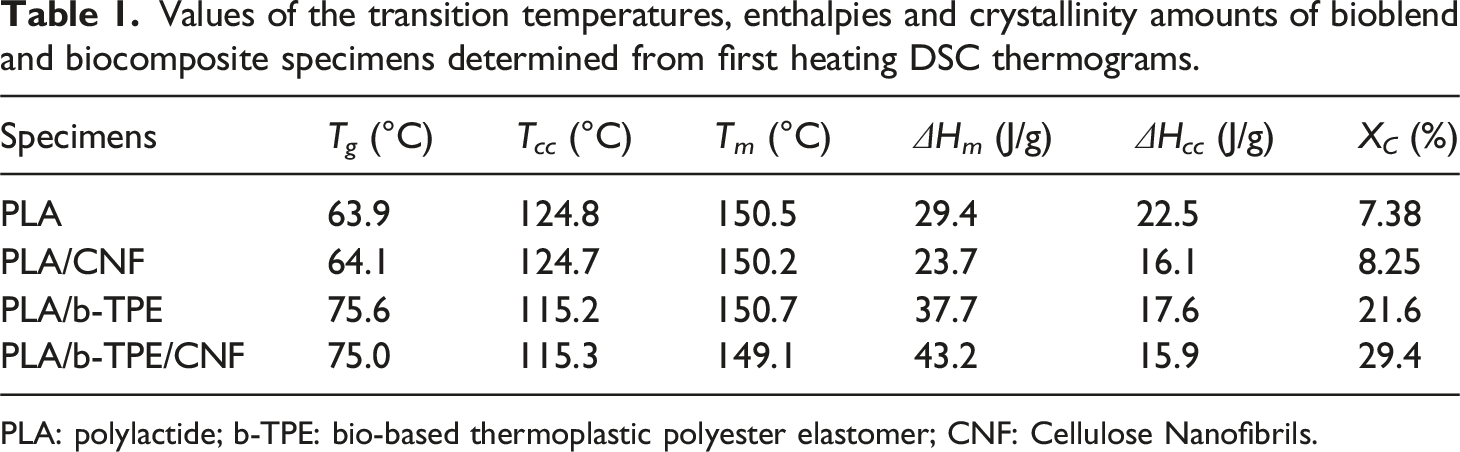
It was observed that use of 1 wt% CNF reinforcement in neat PLA matrix played no significant role in the transition temperatures T g , T cc , T m and the degree of crystallinity (X c ).
Contrarily, blending of PLA with 10 phr b-TPE resulted in an increase of glass transition temperature by 10°C. This improvement in T g value of PLA could be related to especially hard segments of the block copolymer structure of b-TPE. Moreover, Table 1 also indicated that cold crystallization temperature of PLA decreased by around 10°C. Consequently, this decrease in T cc was an indication of earlier start of heterogeneous nucleation of crystallites at the interfacial boundaries of homogenously distributed micron sized b-TPE domains in the PLA matrix. Thus, blending of PLA with b-TPE resulted in almost four times increase in X c crystallinity amount. Similar observations were cited in the literature.41–43
When 1 wt% CNF particles were incorporated together with 10 phr b-TPE, apart from higher degree of PLA crystallinity (X c ), no significant differences were observed.
TGA
Results of TGA as the second thermal analysis conducted for all specimens were illustrated in Figure 5 in the form of mass loss versus temperature curves. Then, thermal degradation temperatures (T
5%
, T
10%,
T
25%,
T
max
) determined for the 5 wt%, 10 wt%, 25 wt%, and maximum wt% losses were tabulated in Table 2. Thermogravimetric curves of bioblend and biocomposite specimens. Values of the thermal degradation temperatures and %residue of the bioblend and biocomposite specimens determined from thermogravimetric curves. PLA: polylactide; b-TPE: bio-based thermoplastic polyester elastomer; CNF: Cellulose Nanofibrils.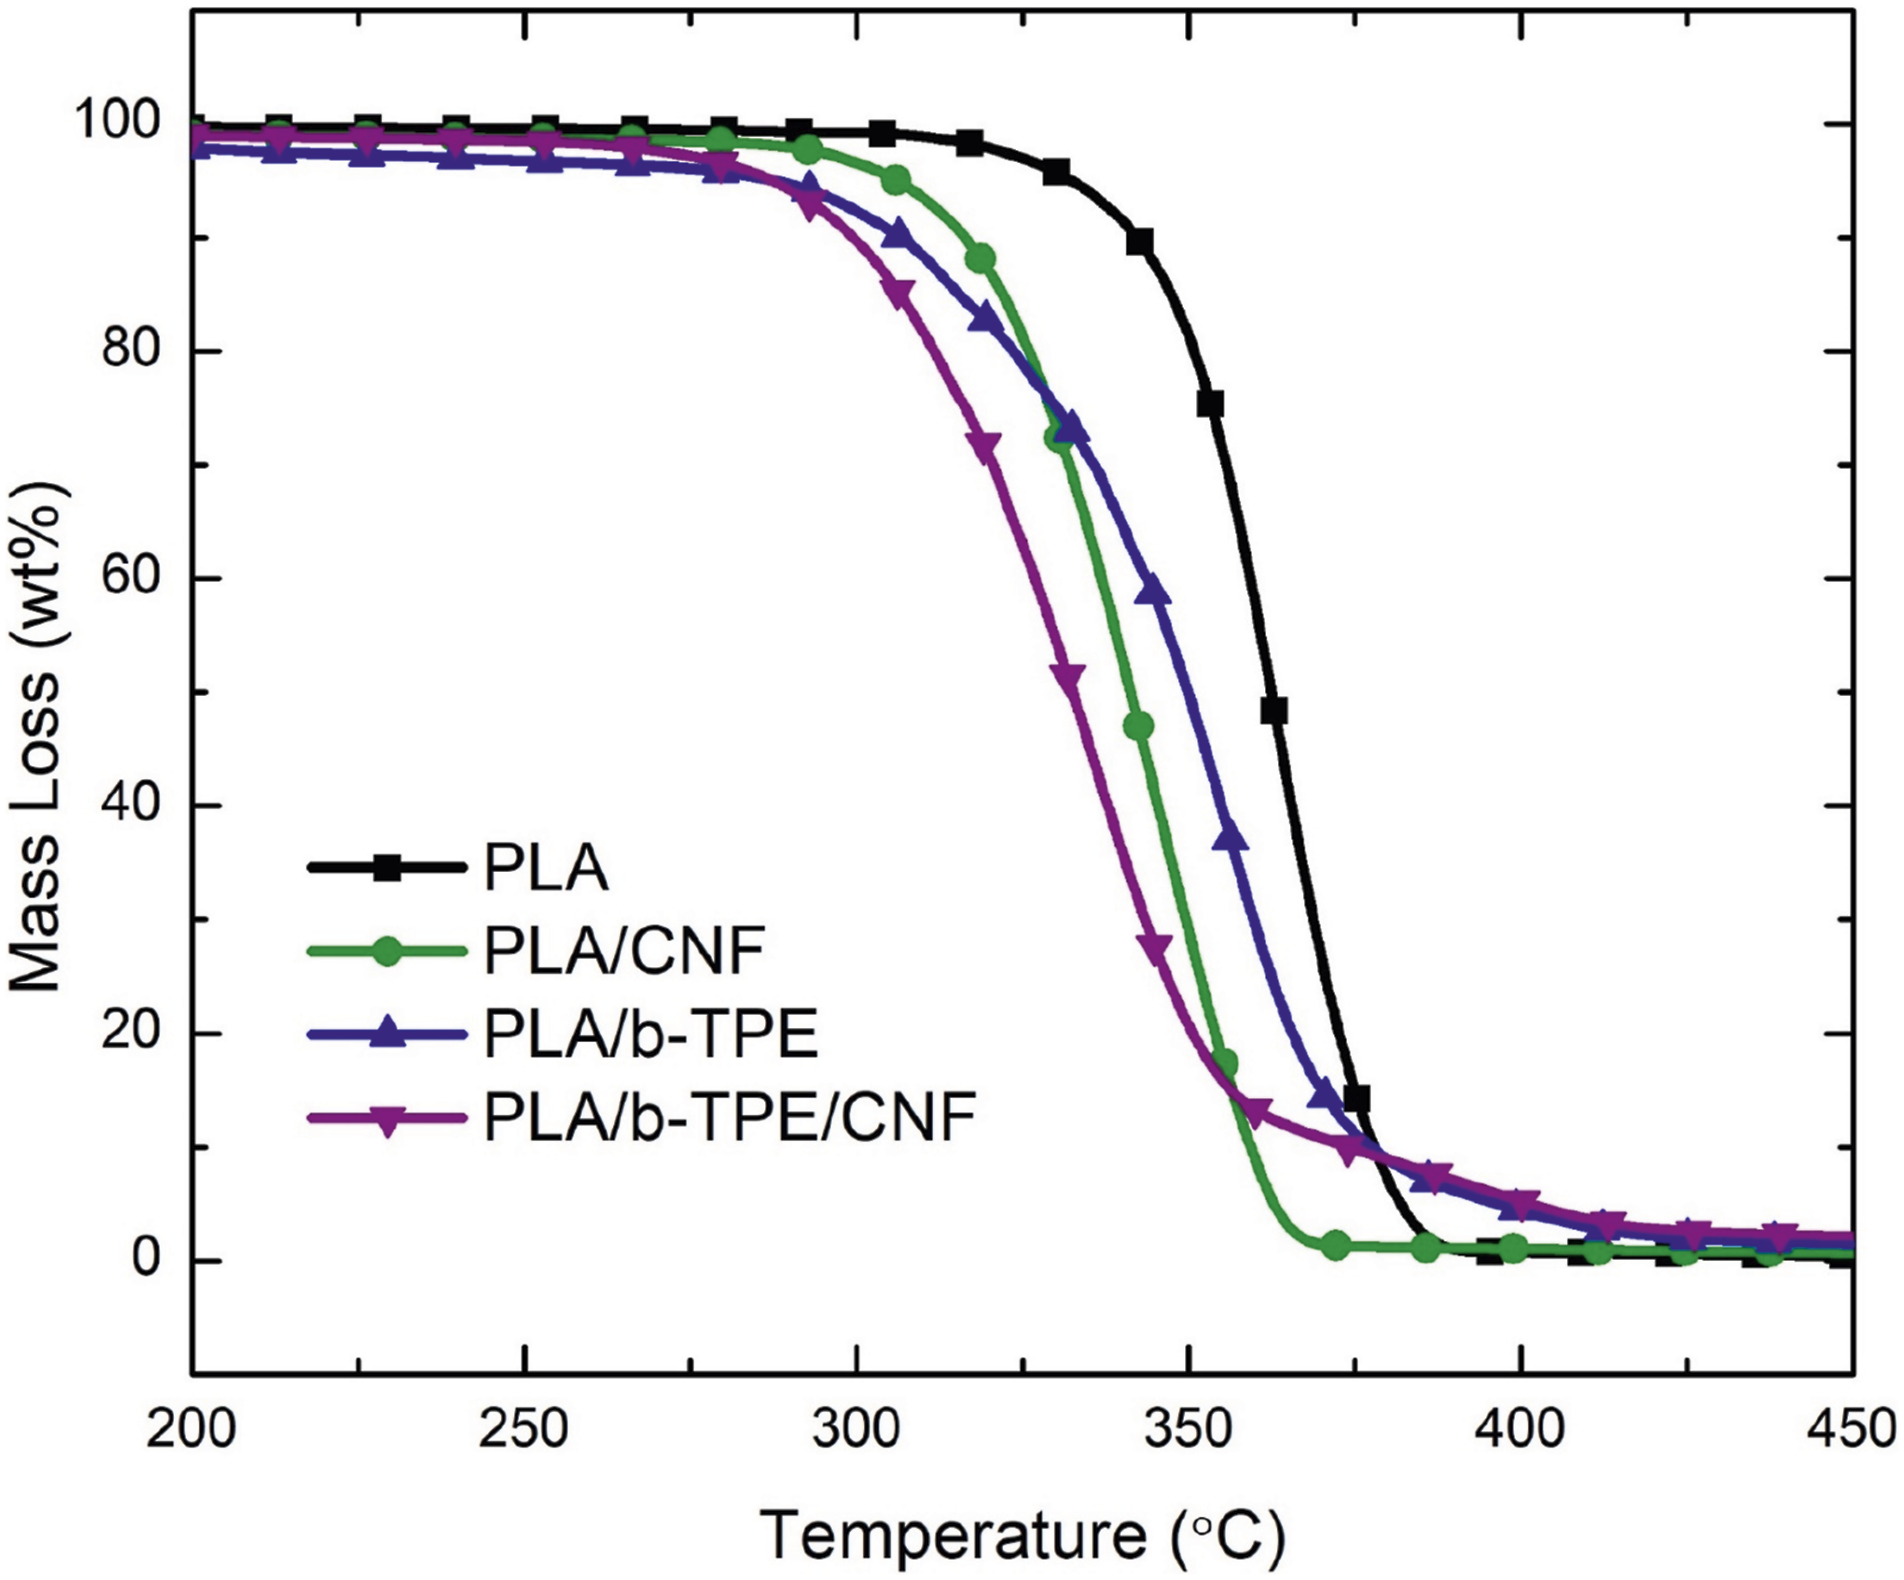
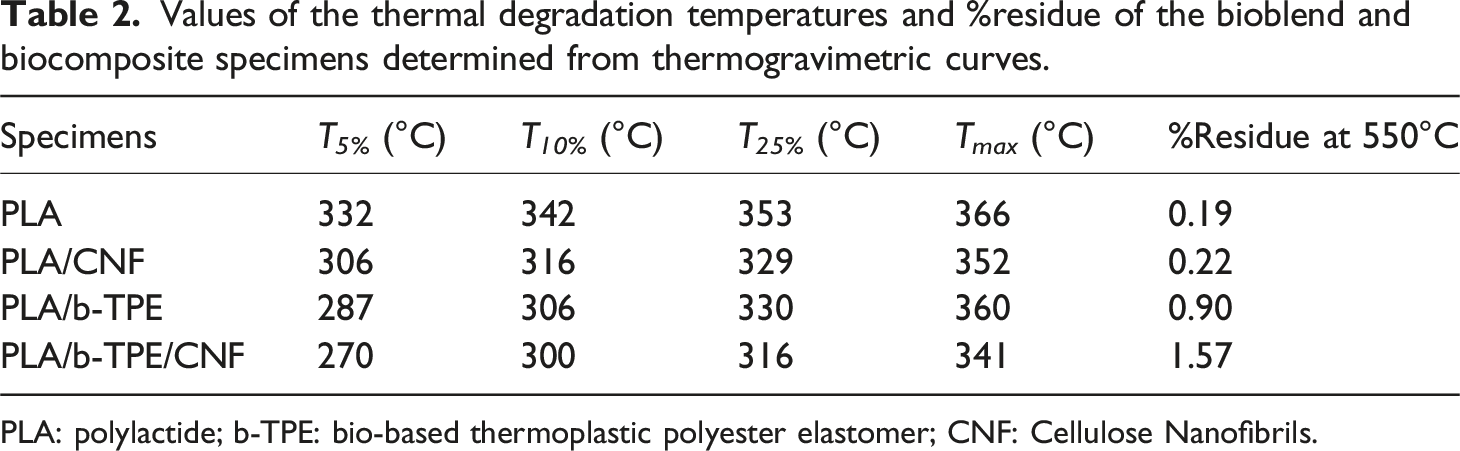
It is known that 45 since thermal degradation temperature levels of cellulose macromolecular structure of CNF reinforcements, and soft segment blocks of b-TPE elastomer structure are not higher than the PLA matrix structure; no improvements were observed in the T 5% , T 10%, T 25%, T max values of bioblend and biocomposite specimens.
Since all the ingredient materials used were bio-based macromolecules; another data i.e., %Residue at 550°C determined in the thermogravimetric analyses revealed that residue amounts were negligible. Thus, contrary to the use of inorganic fillers in the PLA matrix, it could be stated that use of CNF and b-TPE would result in production of “fully green” bioblends and biocomposites.
Contribution of CNF on the strengthening of neat and blended PLA
It is known that strengthening and stiffening of polymer materials could be evidenced by the increase in the values of Strength and Elastic Modulus. Thus, in order to reveal contribution of CNF on the strengthening and stiffening of neat and blended PLA, three-point bending tests were performed for all specimens. Flexural stress-strain curves obtained from these tests were illustrated in Figure 6. Then, values of “Flexural Strength (σ
Flex
)” and “Flexural Modulus (E
Flex
)” determined from these curves were compared in Figure 7. Flexural stress-strain curves of bioblend and biocomposite specimens. Contribution of CNF on the strengthening and stiffening of neat and blended PLA. PLA: polylactide; CNF: Cellulose Nanofibrils.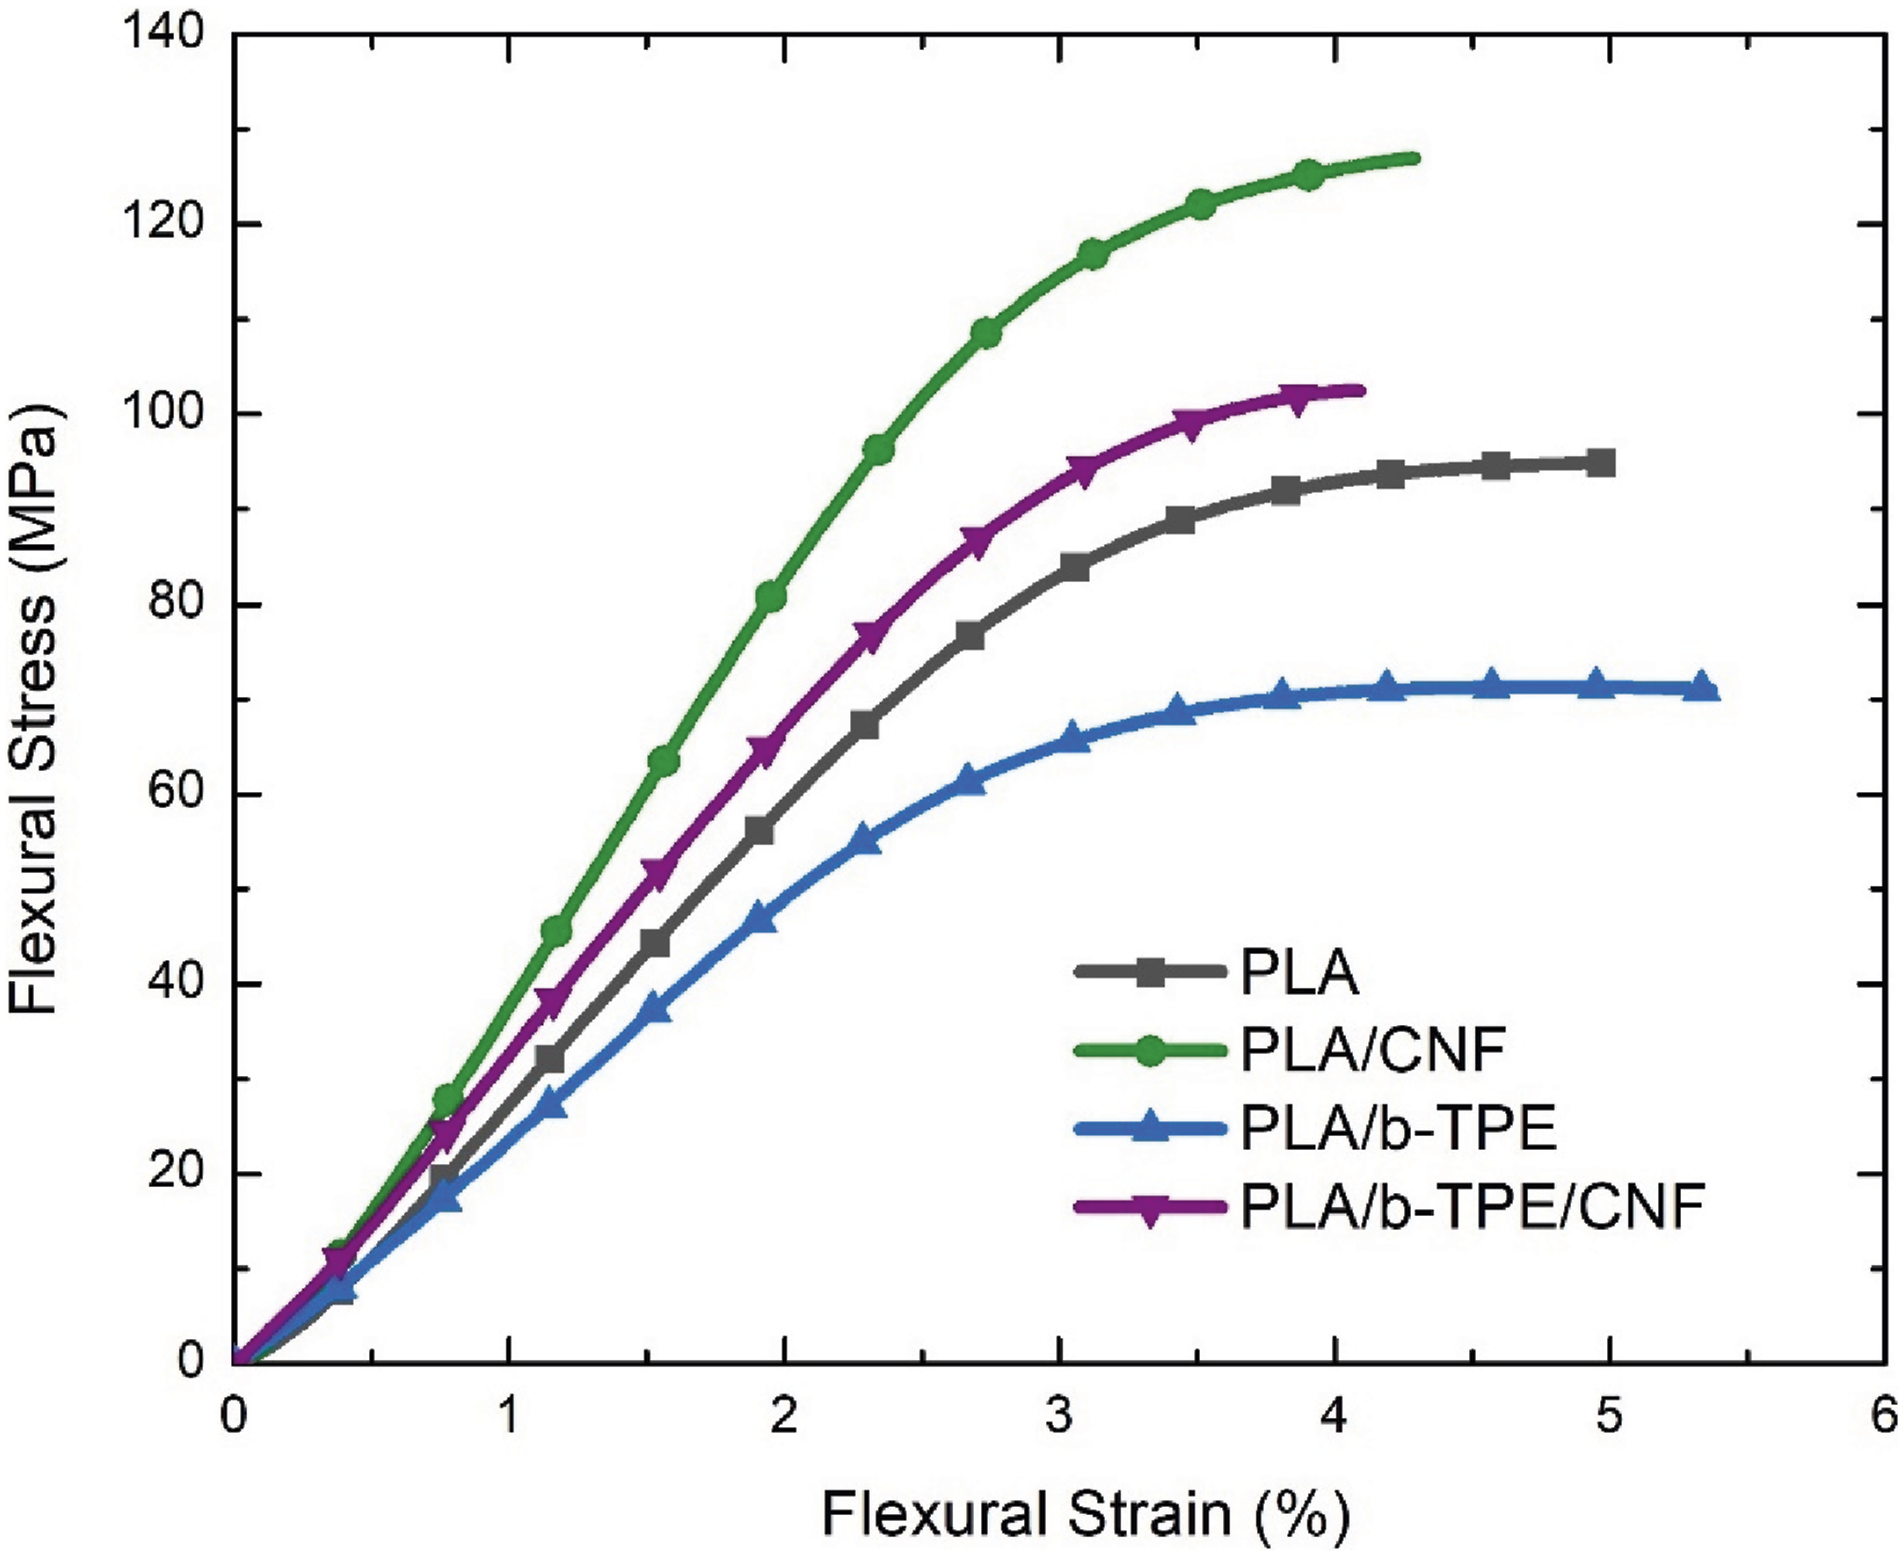
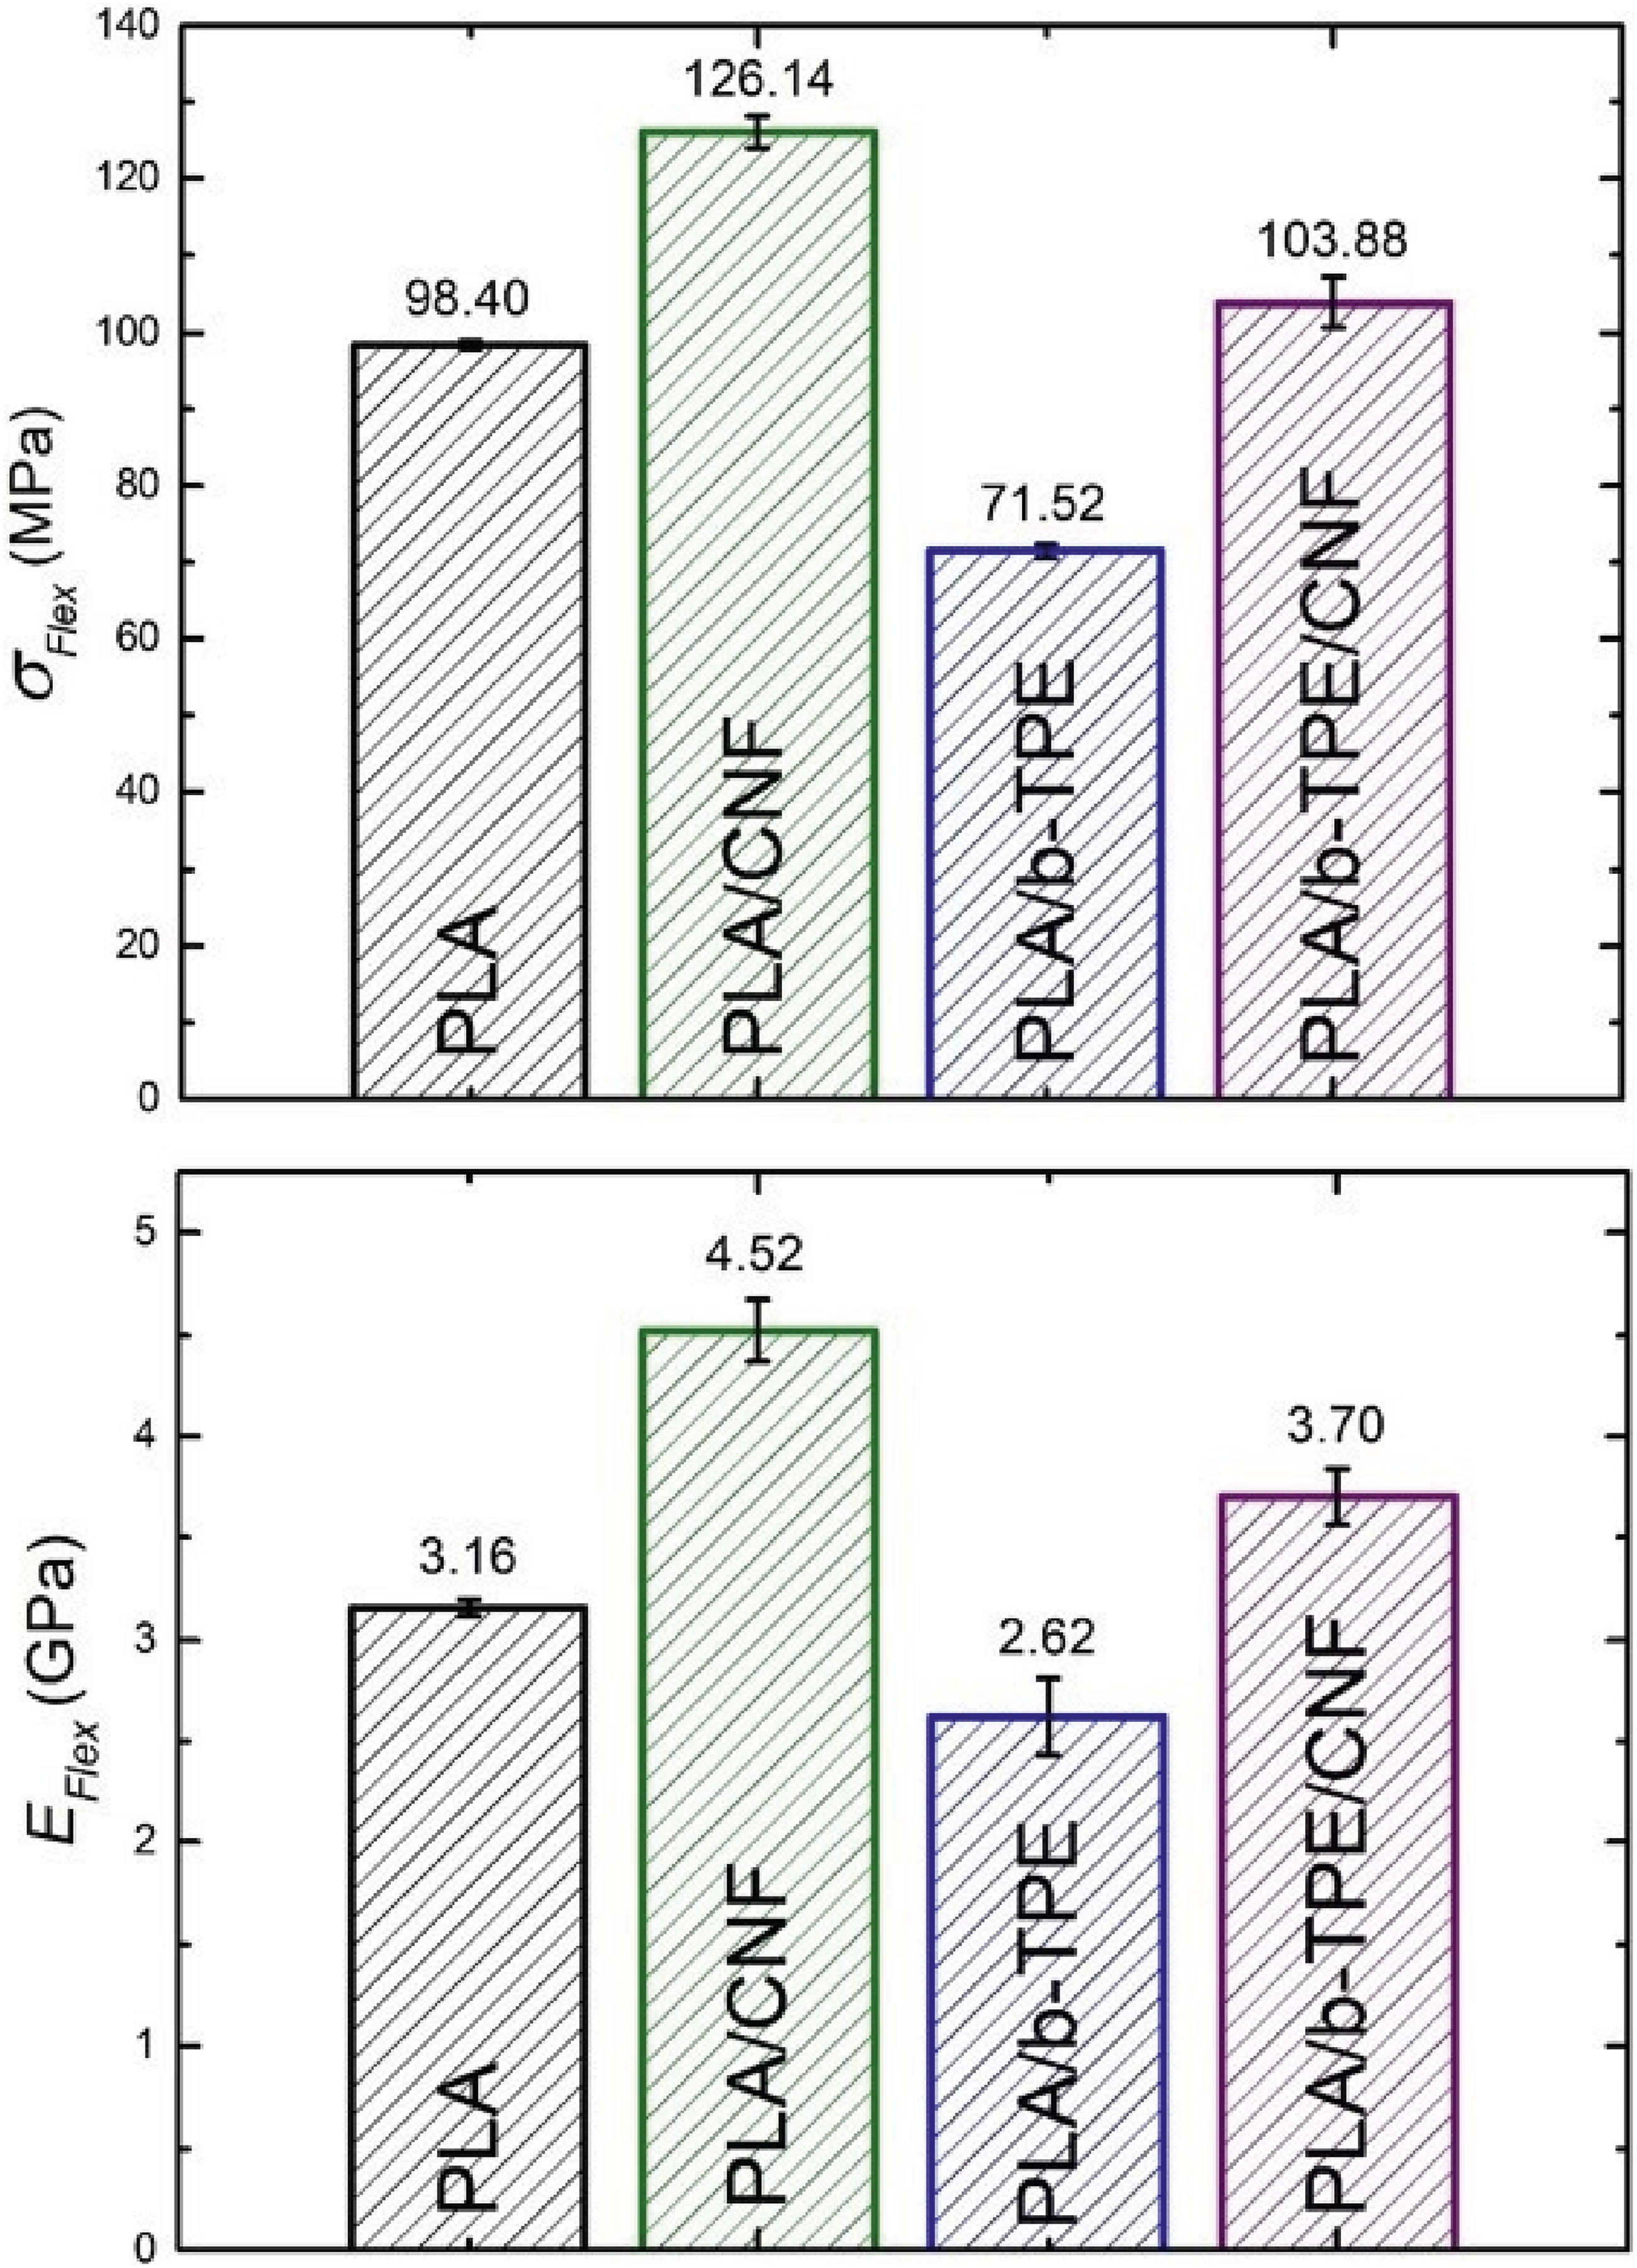
It was apparent that when neat PLA was reinforced with only 1 wt% CNF, significant degree of strengthening and stiffening took place; being 33% increase in σ Flex and 43% increase in E Flex values. Because, due to the stronger cellulose structure and extremely high surface area/volume ratio of their nano-size, use of CNF was very efficient in the well-known strengthening mechanisms of “decreased molecular mobility” of polymer matrix and “load transfer” mechanism from the matrix to the reinforcement.
Of course, for the efficient strengthening mechanisms of “decreased matrix mobility” and “load transfer from the matrix”; a certain degree of interfacial bond between the matrix and the reinforcement would be necessary. In this system, interfacial attraction between CNF and PLA could be attributed to polar interactions that might form between the extensive number of hydroxyl groups in the cellulose structure and the carboxyl, hydroxyl end groups, and ester carbonyl groups of PLA macromolecules.
On the other hand, Figure 7 indicated that when PLA was blended with 10 phr b-TPE, reduction in the strength and stiffness occurred, being 25% decrease in σ Flex and 17% decrease in E Flex values, which was expected. Because, as would be discussed in the next section, the main purpose of blending inherently brittle polymers with elastomers is to improve “toughness”, not strength and stiffness. It is known that41,42 especially due to the very low T g soft segments present in the block copolymer structure of thermoplastic elastomers, they act as plasticizers when blended with PLA. Consequently, they reduce strength and stiffness of the blends.
However, Figure 7 also revealed that, when 1 wt% CNF was incorporated into the PLA/b-TPE bioblend, reductions in the strength and stiffness values were recovered significantly. It was observed that σ Flex and E Flex values of the PLA/b-TPE/CNF specimen approached to the values of PLA/CNF; and both values were higher than the values of neat PLA. Thus, it could be stated that, addition of only 1 wt% CNF also contributed to recover strength and stiffness losses in the PLA/b-TPE bioblend specimen.
Contribution of CNF on the toughening of neat and blended PLA
One of the best methods to investigate toughening of brittle polymer materials is to perform Fracture Toughness tests for the determination of “Critical Stress Intensity Factor (K
IC
)” and “Critical Strain Energy Release Rate (G
IC
)” values. Thus, K
IC
and G
IC
fracture toughness values determined for all specimens were compared in Figure 8. Contribution of CNF on the toughening of neat and blended PLA. PLA: polylactide; CNF: Cellulose Nanofibrils.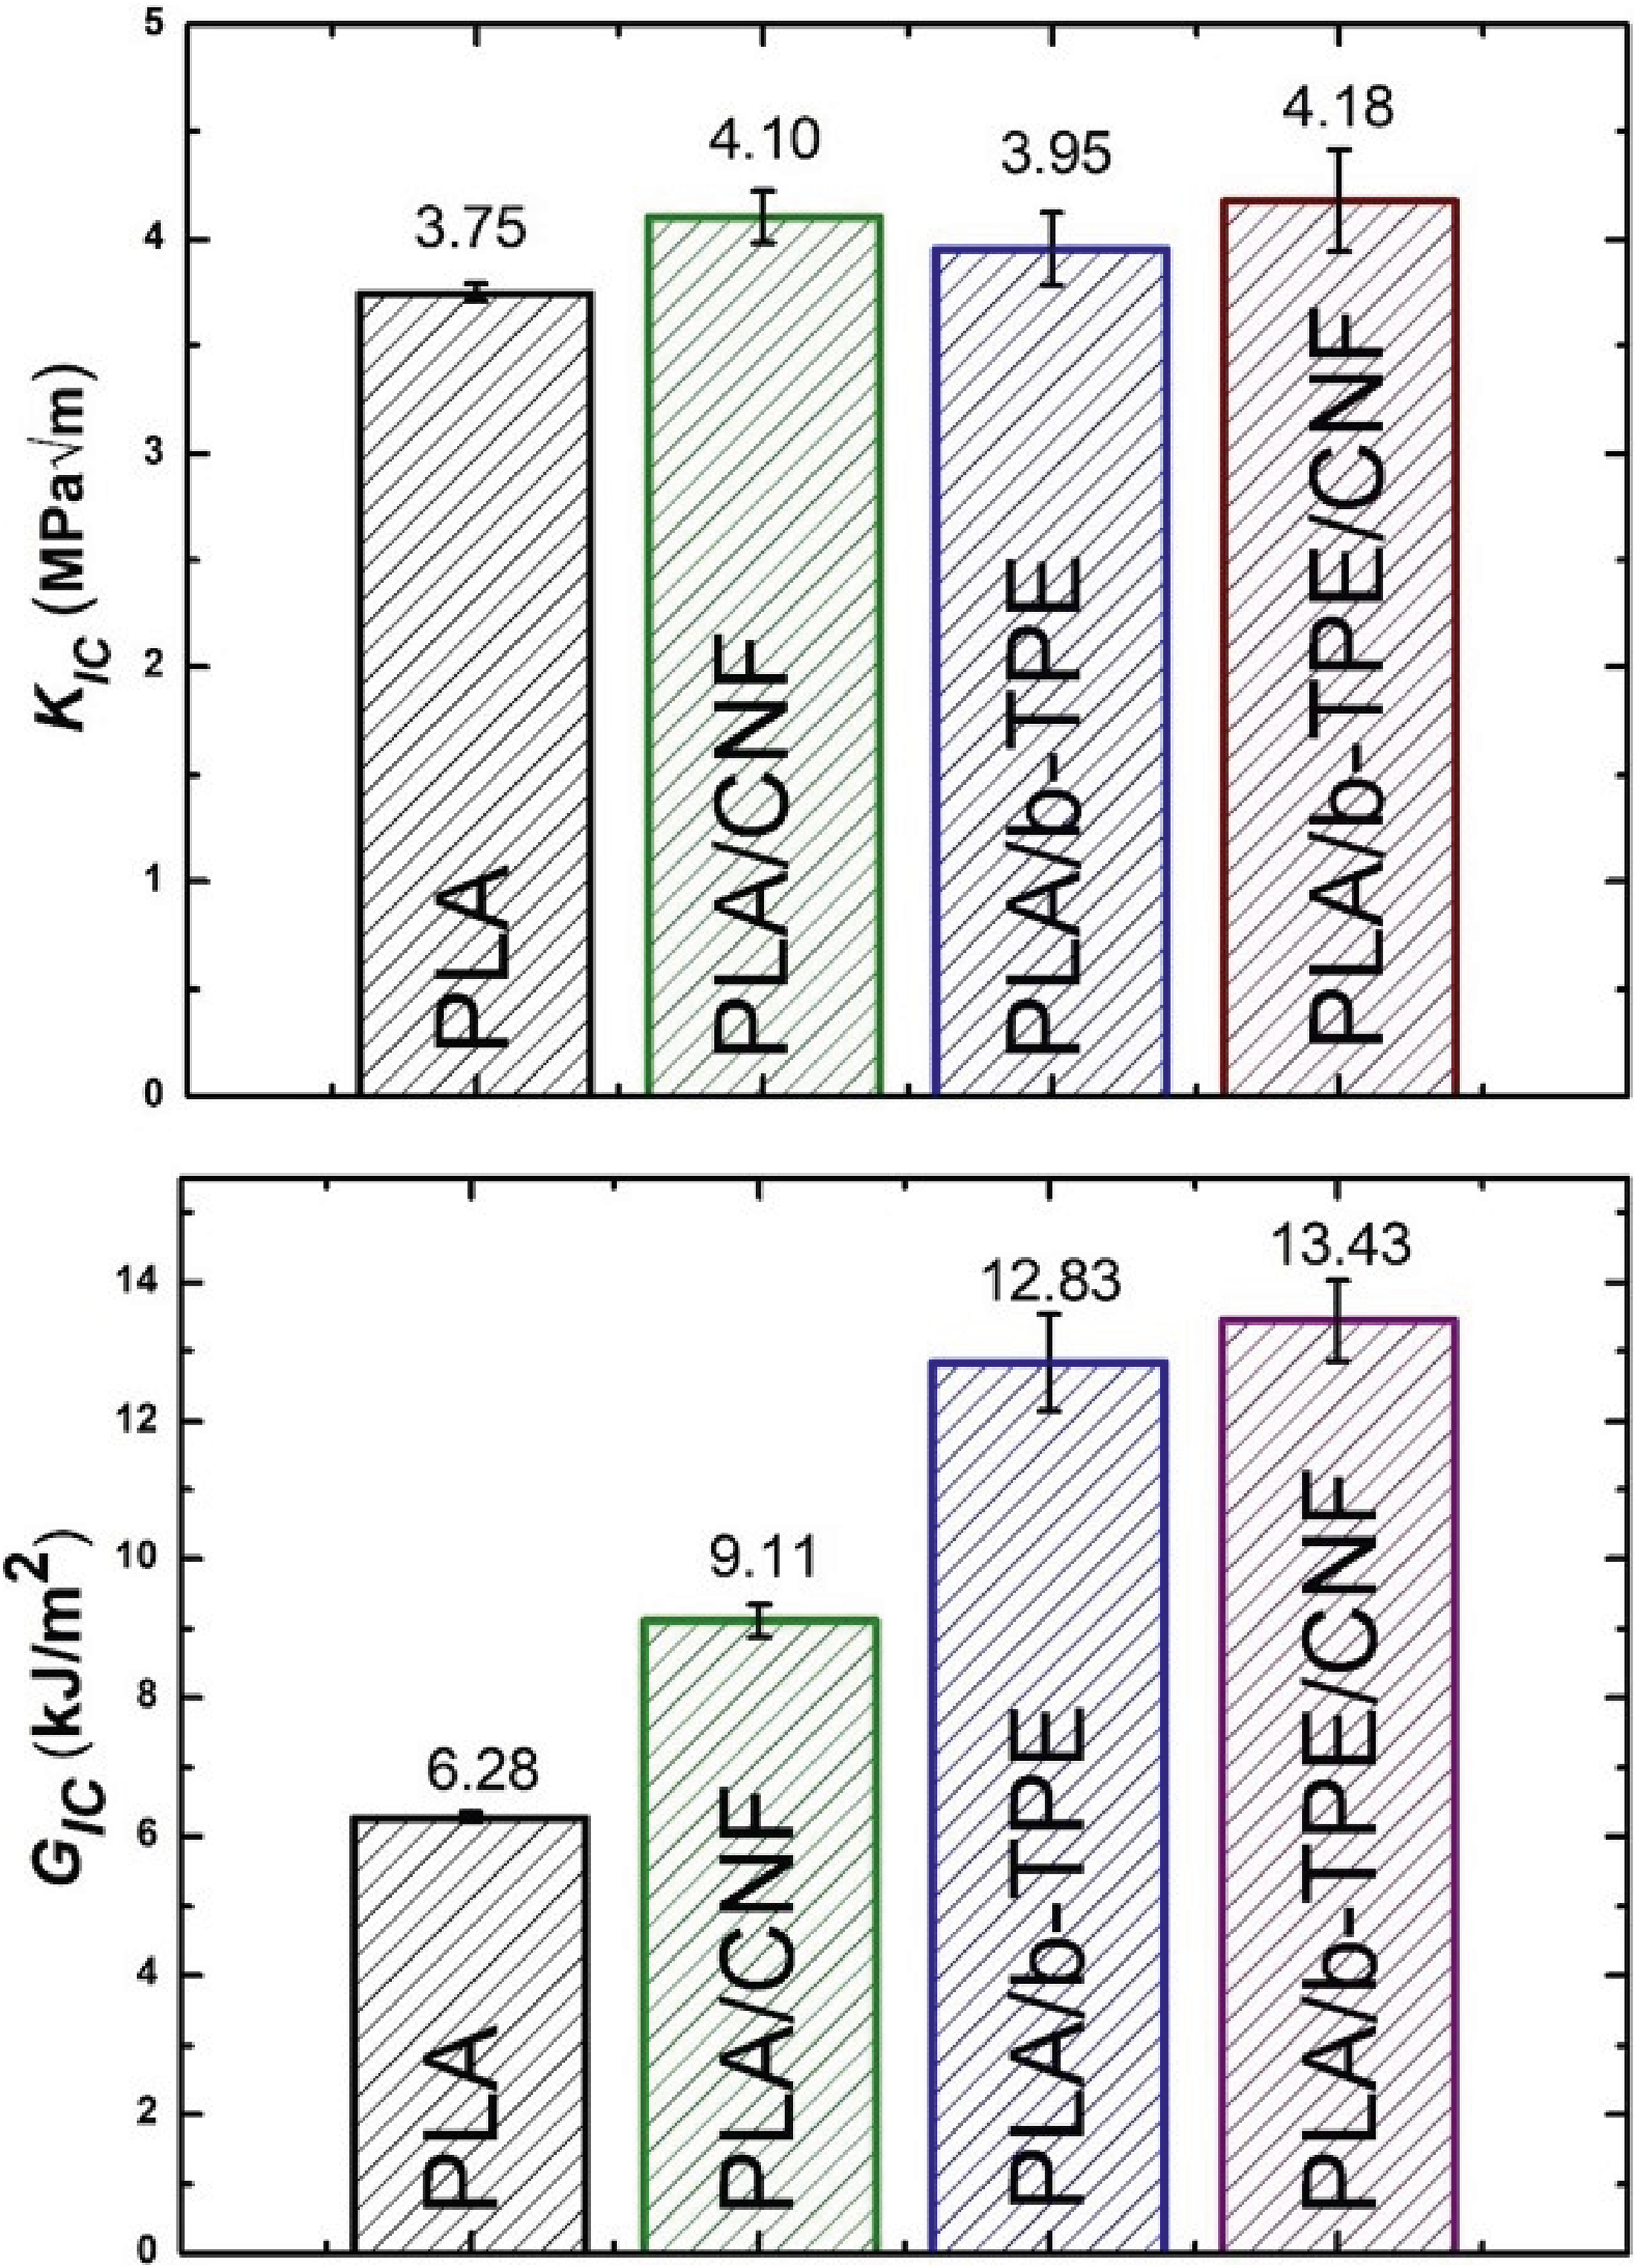
When only 1 wt% CNF was incorporated, Figure 8 revealed that toughening of brittle PLA matrix occurred, being 9% increase in K IC and 45% increase in G IC fracture toughness values. Because, one of the well-known toughening mechanisms named as “crack pinning” or “crack deflection” would take place at the interface of PLA matrix and CNF reinforcements leading to significant decreases in the propagation rate of cracks.
Figure 8 also revealed that when 10 phr b-TPE was blended with PLA, “rubber toughening” phenomenon occurred increasing the values of K IC and G IC as 5% and 104%, respectively. The main mechanism in rubber toughening was the excessive amount of “shear yielding”, i.e., plastic deformation due to the presence of b-TPE round elastomeric domains homogenously distributed in the PLA matrix. Thus, high degree of shearing resulted in very rough fracture surface as evidenced in the SEM images of Figure 1. Apart from excessive shear yielding mechanism which retarded crack propagation rate by absorbing the energy required for crack growth, it could be pointed out that another rubber toughening mechanism occurring was the “cavity formation” around rubber domains, as seen in Figure 1. This mechanism also named as “debonding” is the separation at the interface between the immiscible rubber domains of b-TPE and PLA matrix, which absorb the energy of propagating cracks, and then decrease their growth rate, consequently results in higher fracture toughness values.
It was observed in Figure 8 that, the highest degree of toughening was obtained when PLA matrix was reinforced with 1 wt% CNF together with blending by 10 phr b-TPE. Due to a kind of toughening synergism, K IC and G IC fracture toughness values of the PLA/b-TPE/CNF specimen increased as much as 12% and 114% in K IC and G IC fracture toughness values, respectively.
Differences in strengthening and toughening of specimens after 3D-printing
Due to various advantages of additive manufacturing techniques compared to conventional molding techniques, FDM-type 3D-printers were frequently used during shaping of many biomedical components made from bioblends and biocomposites. Therefore, in order to reveal whether there would be any difference in the degree of strengthening and toughening of 3D-printed specimens compared to compression molded ones discussed above, three-point bending and fracture toughness tests were once more performed this time when the specimens were shaped by 3D-printing.
Then, Strength and Stiffness (σ
Flex
and E
Flex
) values of 3D-printed and compression molded specimens were compared in Figure 9; while Fracture Toughness (K
IC
and G
IC
) values were compared in Figure 10. All mechanical properties were also compared in Table 3 with ± standard deviations. Differences in the flexural strength and modulus values of 3D-printed and compression molded specimens. Differences in the fracture toughness values of 3D-printed and compression molded specimens. Differences in the values of all mechanical properties of 3D-printed and compression molded specimens. PLA: polylactide; b-TPE: bio-based thermoplastic polyester elastomer; CNF: Cellulose Nanofibrils.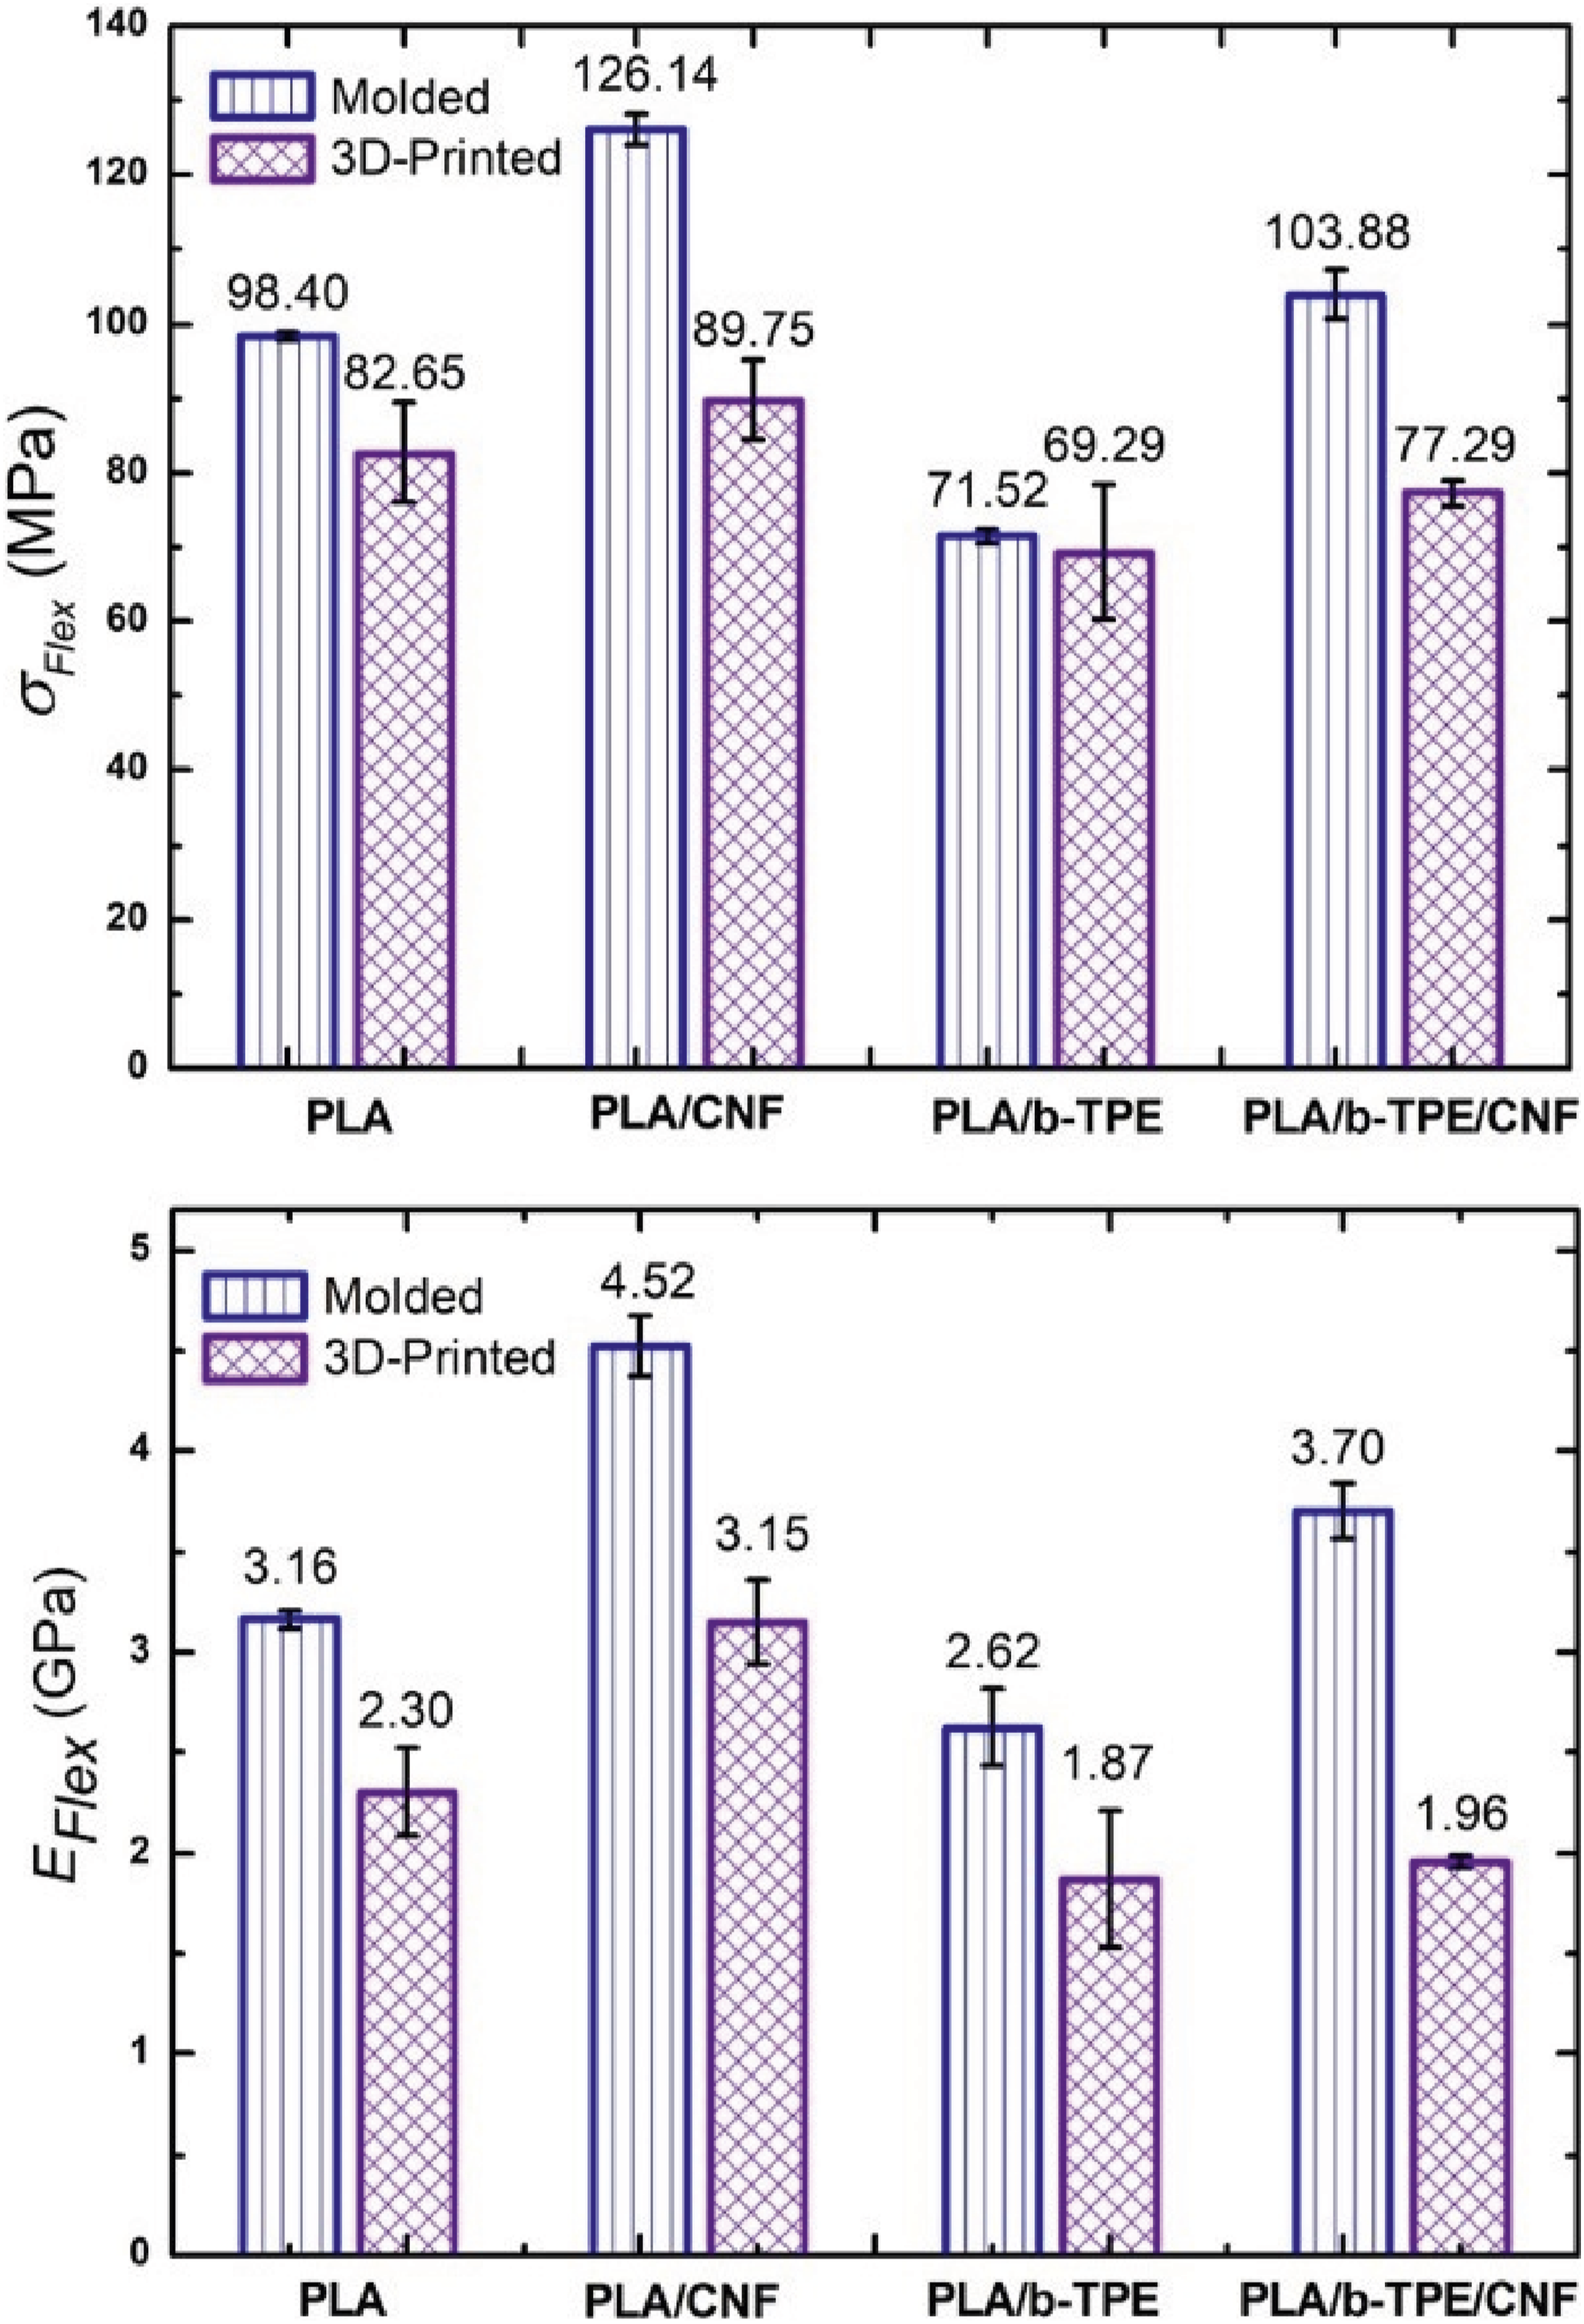
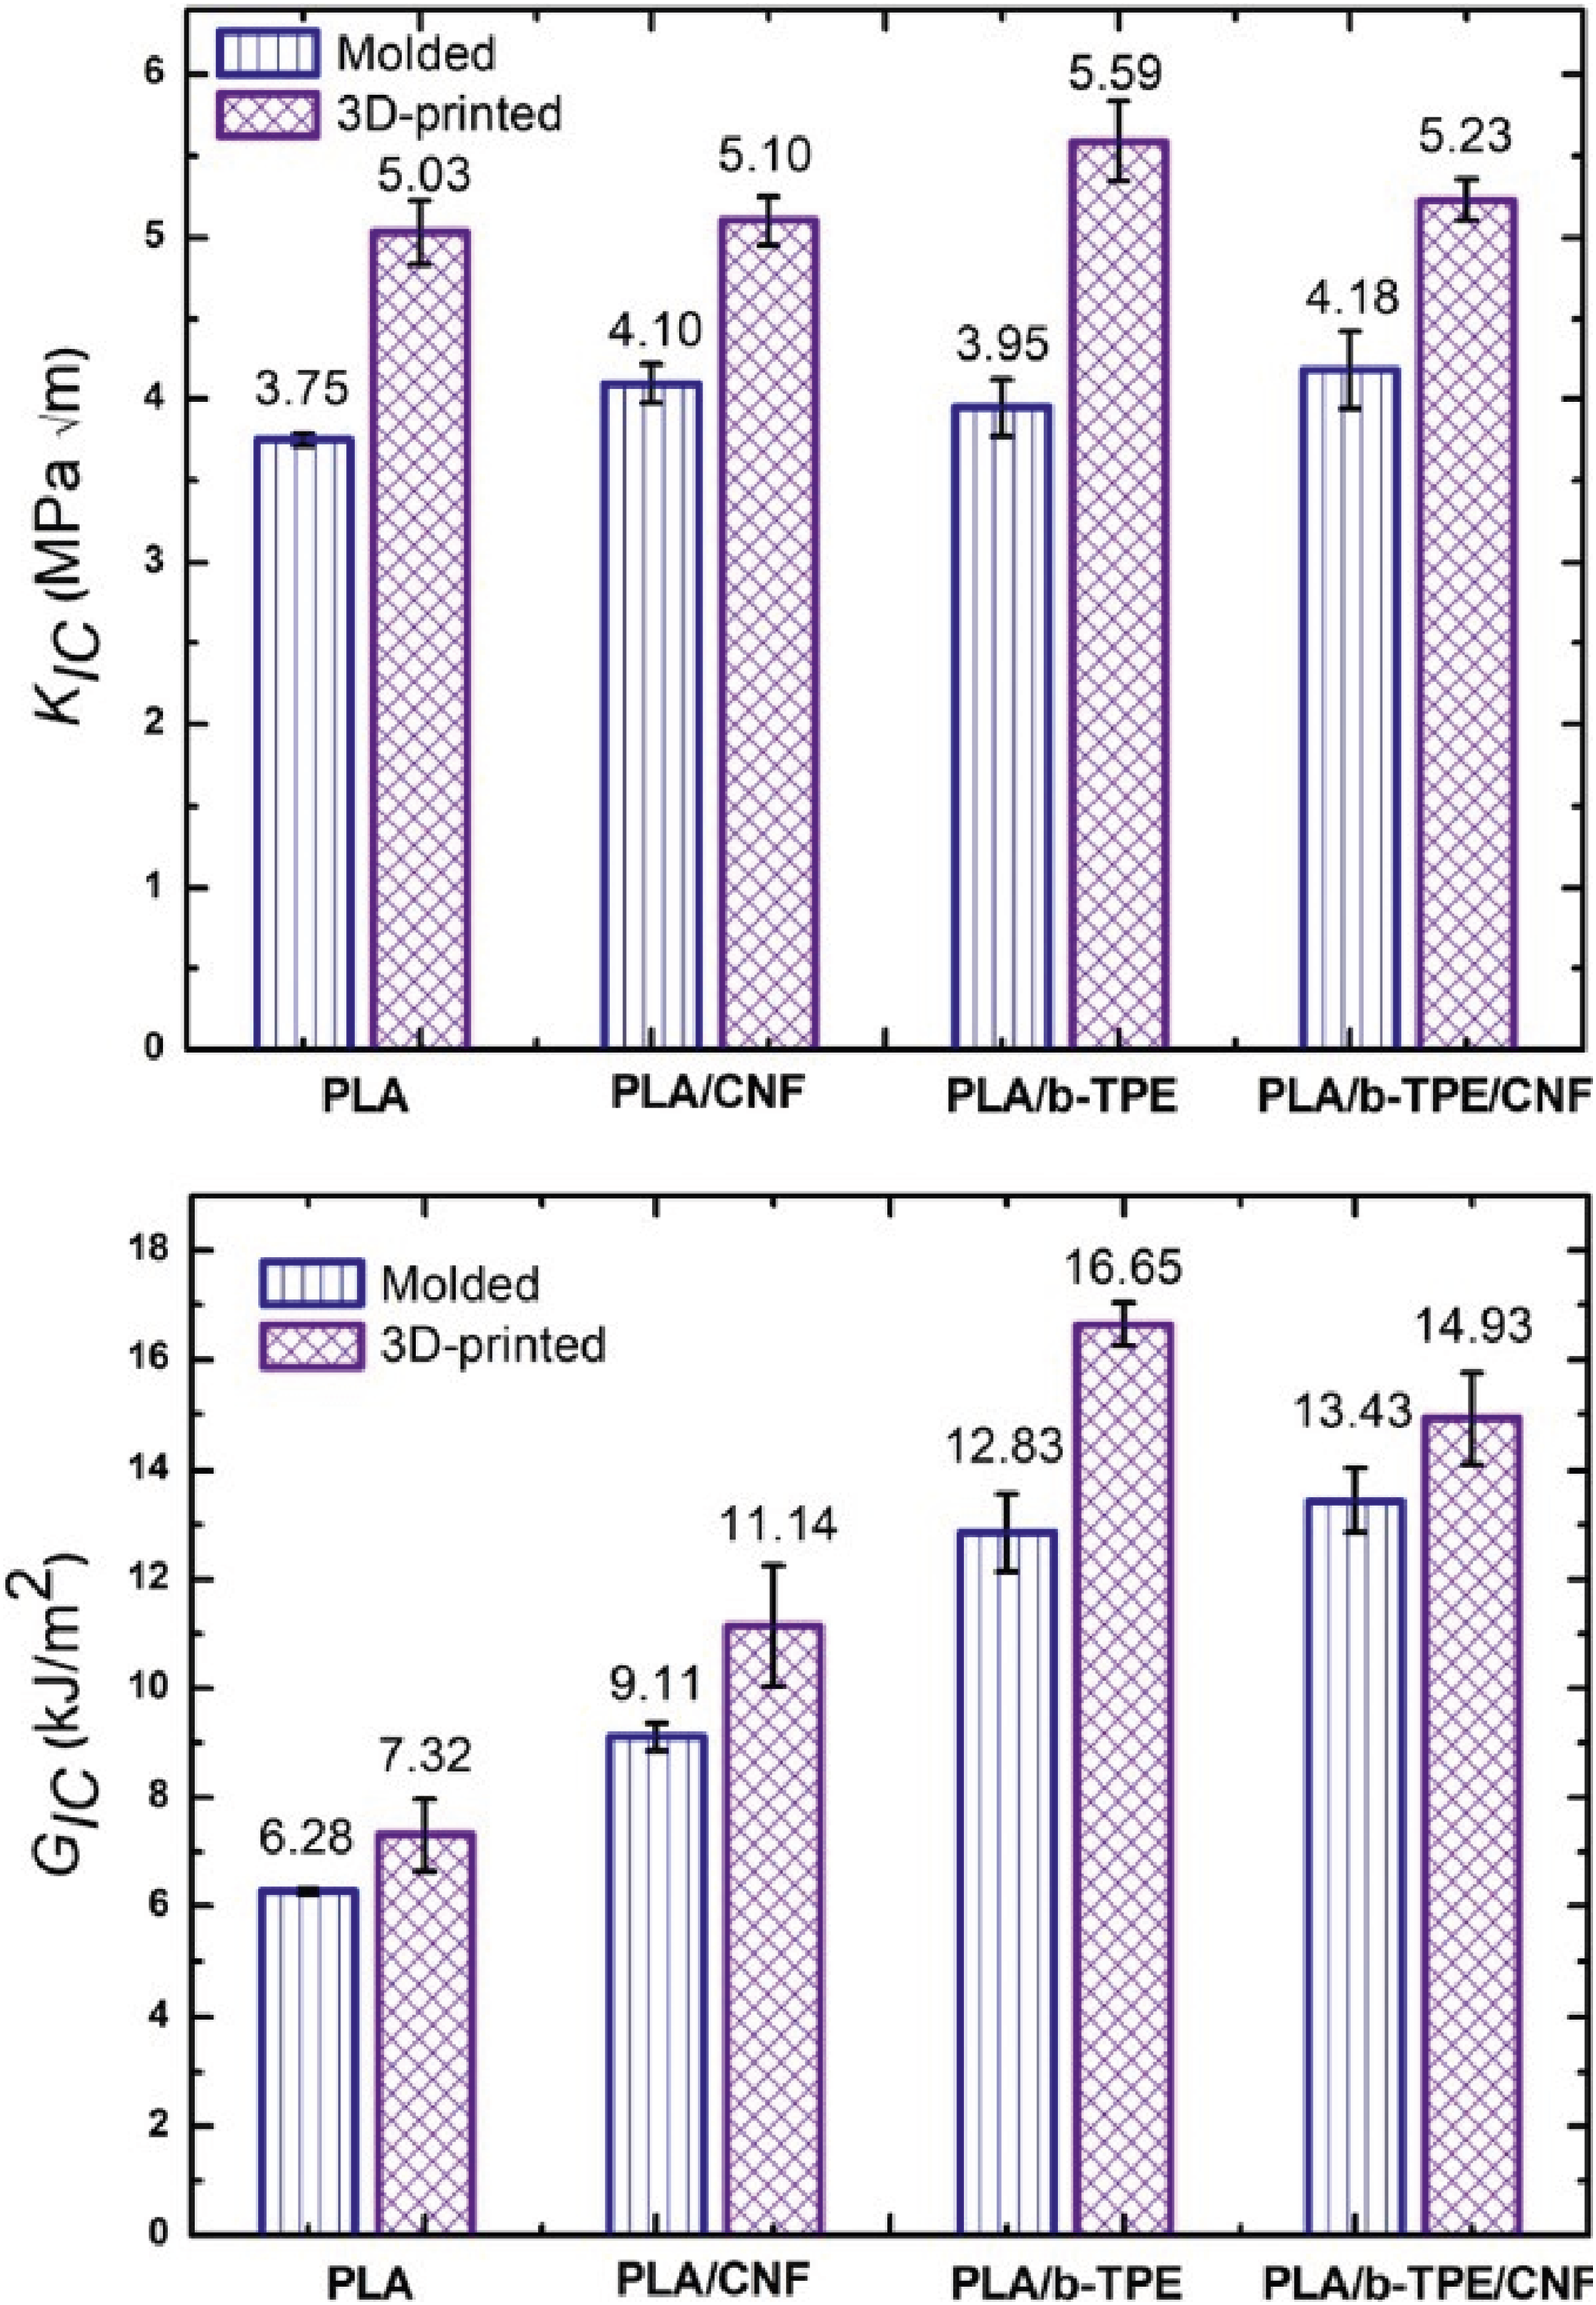
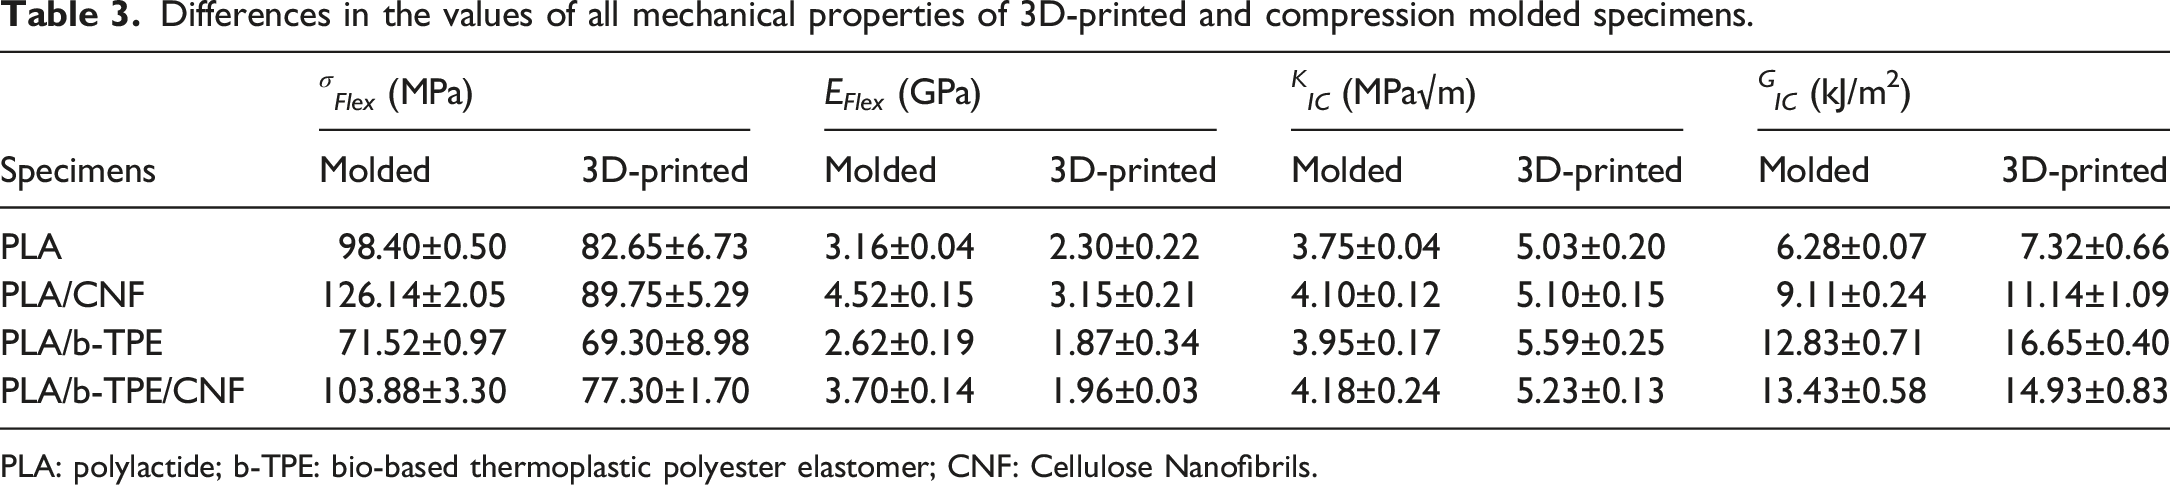
Figures 9 and 10, and Table 3 revealed that for the 3D-printed specimens; those increasing and decreasing trends due to use of CNF and b-TPE on the mechanical properties of PLA were all the same compared to the compression molded specimens discussed in the previous sections. This could be interpreted that there would be no change in the contribution trend of CNF to all mechanical properties of neat and blended PLA when components were shaped by 3D-printing.
On the other hand, Figure 9 indicated that flexural strength and modulus values of 3D-printed specimens were approximately 20% and 34% lower compared to compression molded specimens. Oppositely, Figure 10 indicated that K IC and G IC fracture toughness values of 3D-printed specimens were approximately 31% and 20% higher compared to compression molded specimens.
In order to reveal reasons of lower performance in the strengthening degree and higher performance in the toughening degree of 3D-printed specimens, visual inspection was conducted for the structural appearance of three-point bending and fracture toughness test specimens. In Figure 11, images of only neat PLA specimens were given. Because, compared to others neat PLA specimens were rather semi-transparent so that it was possible to make visual inspection. Images of the semi-transparent neat polylactide mechanical test specimens showing rather textured structure of 3D-printed ones compared to compression molded ones.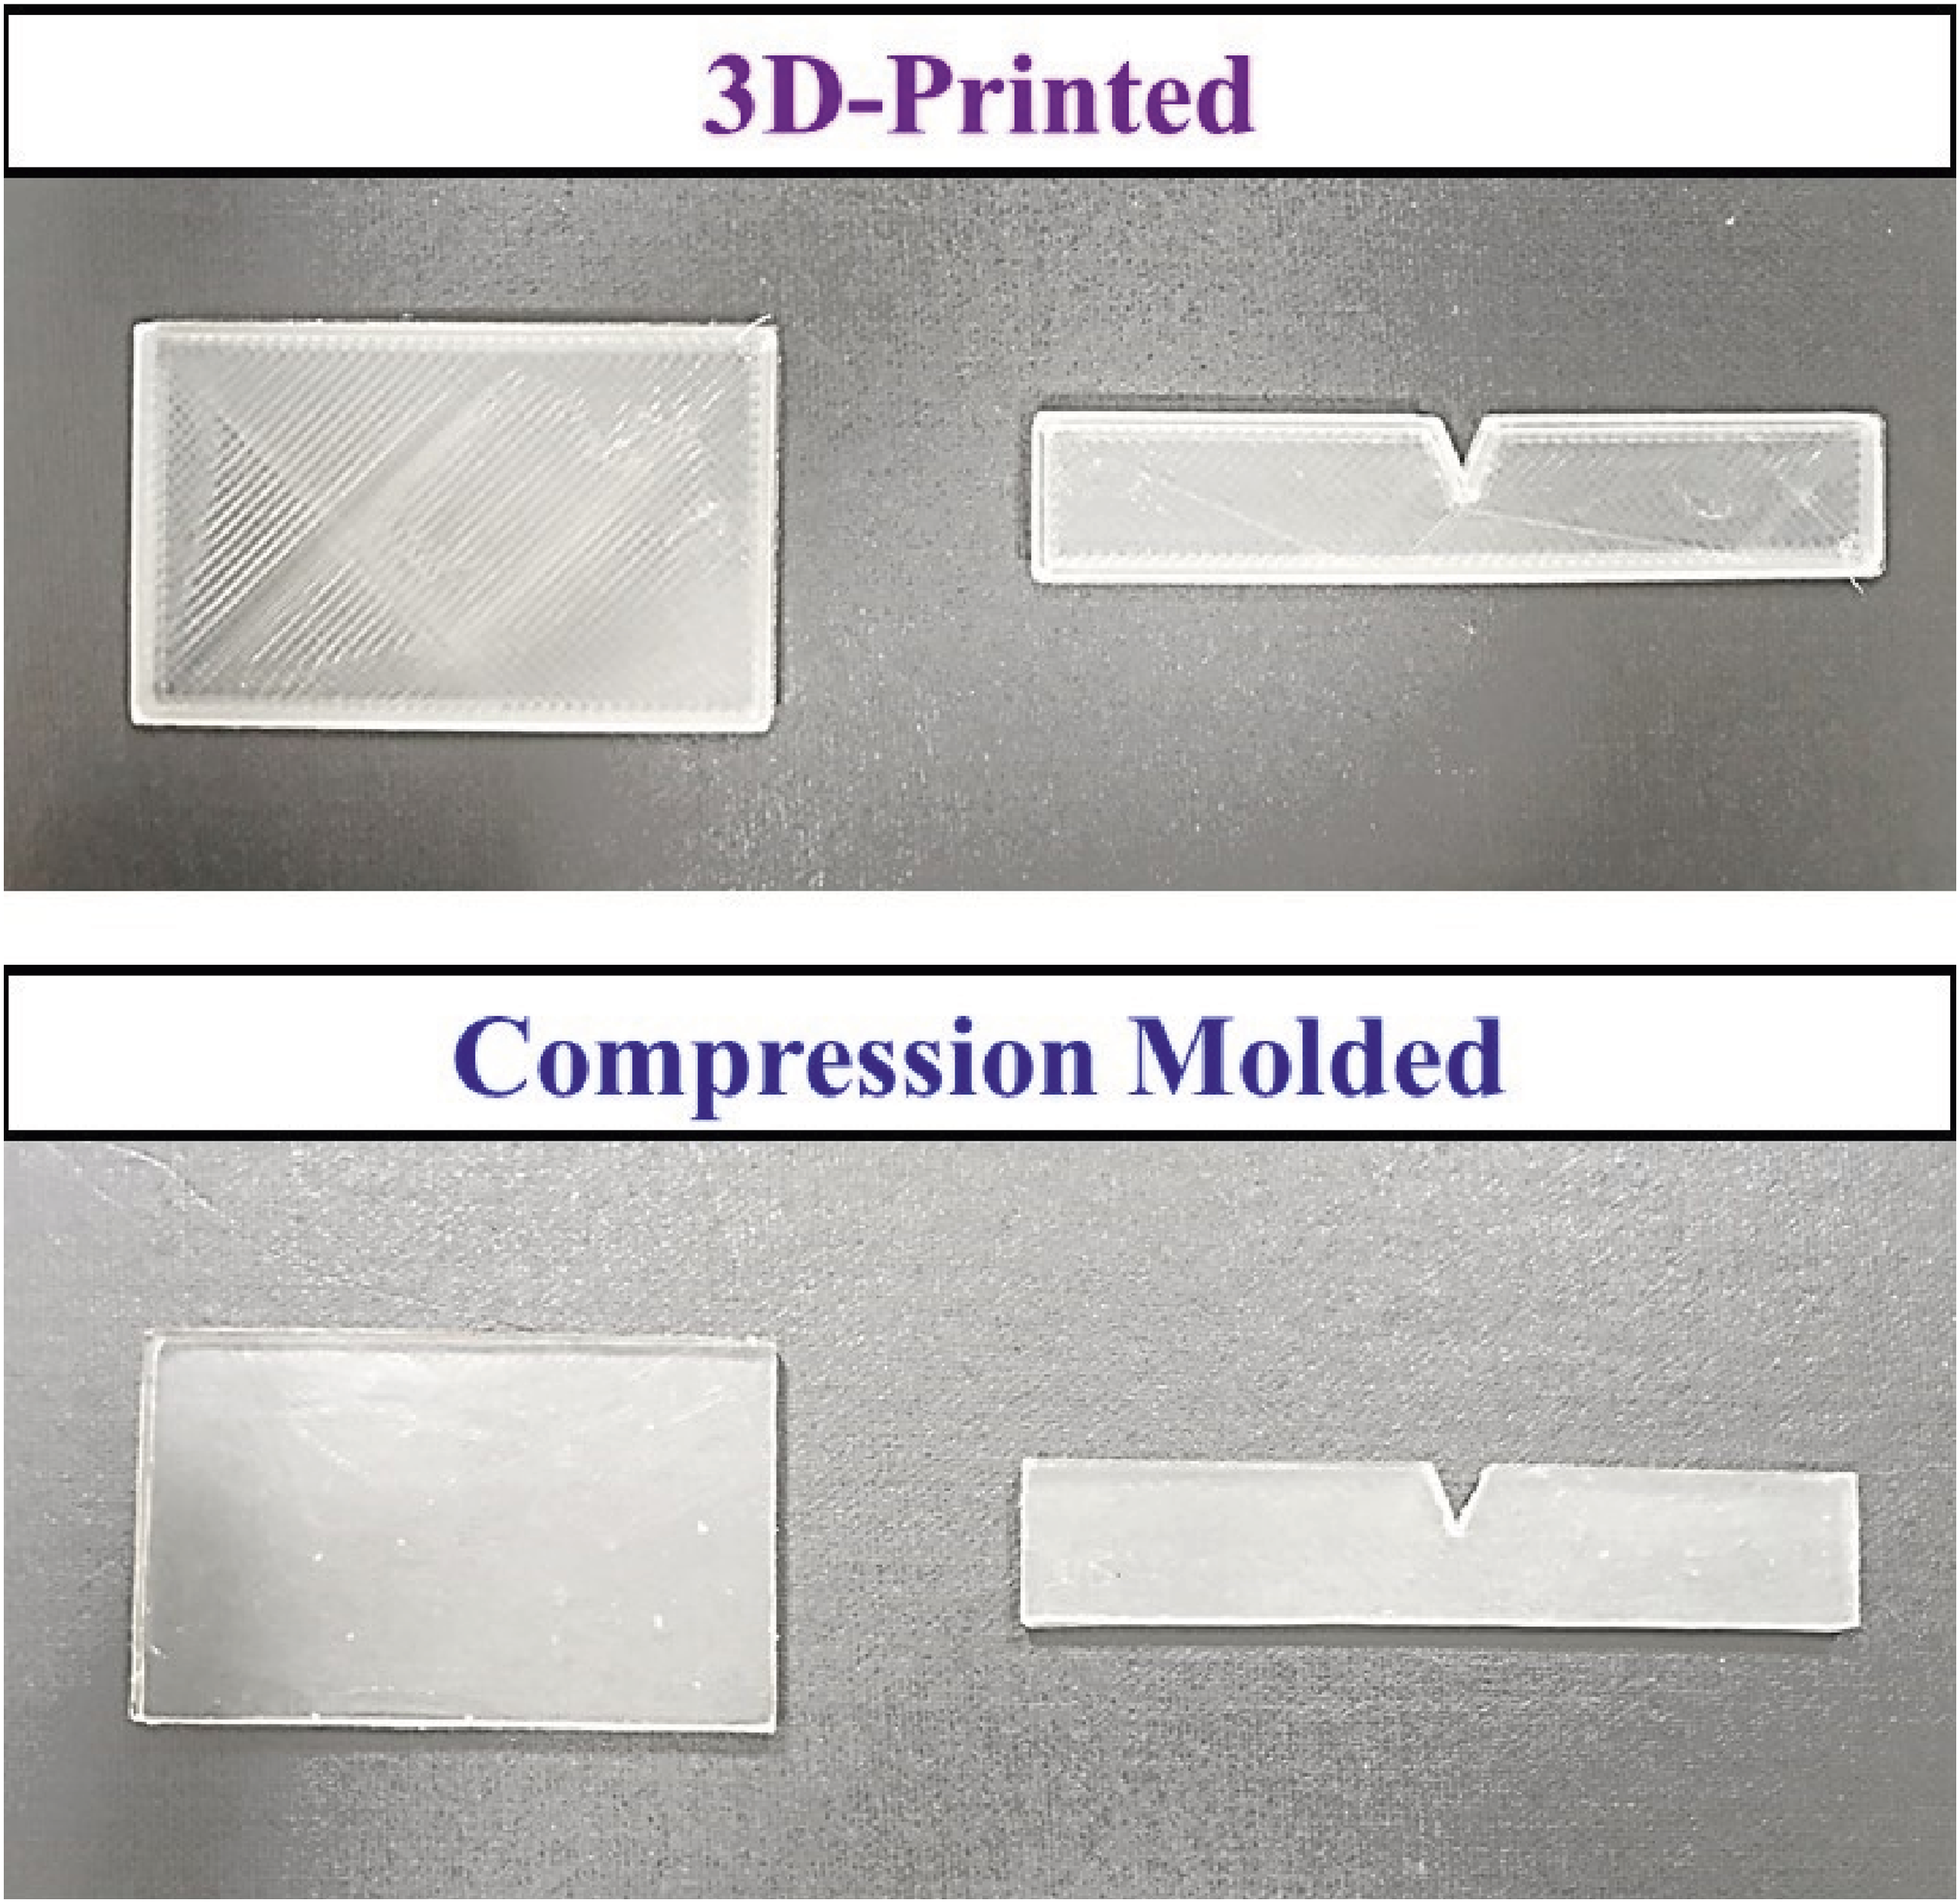
Figure 11 revealed that there were certain differences in the appearances of 3D-printed and compression molded specimen. Compared to the rather smooth and uniform structure of compression molded specimens, a kind of “textured” structure appeared in the 3D-printed ones. The main reason for the formation of textured structure was use of ±45° raster angle orientation during layer-by-layer production of 3D-printing.
Therefore, it could be stated that lower strength and stiffness (σ Flex and E Flex ) values of 3D-printed specimens could be due to the detrimental effect of textured structure on the strengthening and stiffening mechanisms; via certain differences in the degree of orientation and distribution of CNF reinforcements and b-TPE domains in the PLA matrix.
On the other hand, it was apparent that textured structure resulted in higher fracture toughness (K IC and G IC ) values of 3D-printed specimens, which could be due to additional crack deflection action of ±45° textures in terms of the decreased crack propagation rate toughening mechanism discussed before.
Conclusions
Conclusions drawn on the influences of CNF reinforcement in neat and blended PLA based biomaterials could be summarized as follows. • Fracture surface morphology analyses revealed that use of 1 wt% CNF and 10 phr b-TPE, separately or together, resulted in rather uniformly distributed reinforcements and round elastomer domains in PLA matrix. • Thermal analyses indicated that use of 1 wt% CNF played no significant role in the thermal behaviors; while 10 phr b-TPE resulted in four times increase in crystallinity amount of PLA matrix by acting as heterogeneous nucleation of crystallites. • Three-point bending tests revealed that due to the stronger cellulose structure and extremely high surface area/volume ratio of their nano-size, use of only 1 wt% CNF was very efficient in strengthening mechanisms of “decreased molecular mobility” of polymer matrix and “load transfer” mechanism from the matrix to the reinforcement; leading to 33% increase in flexural strength. • On the other hand, due to the soft segments present in the block copolymer structure of thermoplastic elastomers, acting as plasticizers, blending with 10 phr b-TPE resulted in 25% decrease in flexural strength. However, when 1 wt% CNF was incorporated into the PLA/b-TPE bioblend, reduction in flexural strength was recovered significantly, being higher than the value of neat PLA. • Fracture toughness tests indicated that due to the certain efficiency of 1 wt% CNF on the “crack pinning” or “crack deflection” toughening mechanisms, the increase in G
IC
fracture toughness was 45%. • When PLA was blended with 10 phr b-TPE, “rubber toughening” phenomenon leading to very efficient toughening mechanisms of “shear yielding” and “cavity formation” around rubber domains; G
IC
fracture toughness value was increased as much as 104%. Moreover, when CNF and b-TPE were incorporated together, due to a kind of toughening synergism, G
IC
fracture toughness increased 114%. • Mechanical tests of all specimens shaped by 3D-printing revealed that, compared to the values obtained from compression molded specimens; flexural strength values were approximately 20% lower, while G
IC
fracture toughness values were approximately 20% higher. Differences in the values were due to the “textured” structure of 3D-printed specimens formed by the ±45° raster angle orientation used during layer-by-layer production. • It could be stated that lower strength values of 3D-printed specimens could be due to the detrimental effect of textured structure leading to certain differences in the degree of orientation and distribution of CNF reinforcements and b-TPE domains in the PLA matrix. On the other hand, higher fracture toughness values could be due to additional crack deflection action of ±45° textures in terms of decreased crack propagation rate.
Footnotes
Declaration of conflicting interests
The author(s) declared no potential conflicts of interest with respect to the research, authorship, and/or publication of this article.
Funding
The author(s) received no financial support for the research, authorship, and/or publication of this article.