
Abstract
Thermal degradation behaviors of one composite constituted by poly(lactic acid) (PLA), cellulose nanofibrils (CNF), and lignin–cellulose nanofibrils (LCNF) in a nitrogen atmosphere were studied using thermogravimetric analysis (TGA). It was found that the thermal degradation stability of the PLA/LCNF composite was improved when compared to PLA and PLA/CNF. The Flynn–Wall–Ozawa method was used to determine the apparent activation energy of the composite samples which was based on a set of TGA data obtained at different heating rates. It was shown that the conversion functions calculated by means of the Coats–Redfern method depend on a set of kinetic models, which could be concluded that using the model-fitting methods couldn’t reveal the complexity of the thermal degradation process and the isokinetic relationship method was used to estimate a model-independent pre-exponential factor (ln A) corresponding to a given degree of conversion.
Keywords
Introduction
In recent years, cellulose nanofibrils (CNF) have been widely used as reinforcing fillers in polymer matrix materials. 1 –5 Cellulose/poly(lactic acid) (PLA) composites have been studied in various forms due to the good biodegradability of PLA and CNF. For an ordinary CNF/PLA composite system, the interaction between the CNF filler and the PLA matrix is a critical factor in determining the mechanical properties and extending the application of the composite. A simple physical adsorption between the two phases might result in an early failure at the interface and thus deteriorate the mechanical properties. Various substances, including different coupling agents 6,7 and organic isocyanates, 8 have been investigated to increase the interfacial strength between the inorganic particle and the polymeric matrix. This often induces some foreign substances into the materials which might not be entirely desirable for the applications.
In our work, we reported a method to make the CNF disperse homogeneously inorganic solvent for composite formation. In addition, a casting–evaporation process, which can avoid degradation, was used to produce the composite. The lignin was selected as a coupling agent to improve the interaction between PLA and CNF, which showed good properties than that of neat PLA. In view of the production and application of these materials, further studies should be developed to determine the thermal stability as well as to allow a better understanding of the mechanism and kinetics involved in the thermal degradation of the composite. However, there is no information in the open literature about the thermal degradation mechanism of the lignin–cellulose nanofibrils (LCNF)/PLA composite. The aim of the present work is to study the thermal degradation of the LCNF/PLA composite and to evaluate its kinetic parameters of thermal degradation during heating in an inert atmosphere.
Thermogravimetric analysis (TGA) is often used to determine decomposition reactions and evaluate the thermal stability. The mass loss is controlled by the time in isothermal conditions or by the temperature during the heating rate. Changes in mass can be associated with solvent or water desorption/absorption, oxidation or reduction and decomposition. The inconvenience of isothermal condition is the time of tests which is excessively long, particularly at low isothermal temperature. Dynamic thermogravimetric (TG) tests tend to be shorter and the mechanism of degradation may be studied over a large temperature range with typical heating rate. 9
Several techniques are commonly used in the study of pyrolysis kinetics based on TGA. Isoconversional methods are reliable techniques which determine the activation energy at fixed conversions. 10 –13 Some different kinetics models have been used to estimate the kinetics parameters of different polymers and copolymers. 14 –17 In this article, the thermal degradation of the LCNF/PLA composite was studied under nitrogen at different heating rates. In the following, the activation energies of different copolymers have been calculated using the Flynn–Wall–Ozawa (FWO) 18 method. Furthermore, the isokinetic relationship (IKR), 19 was used to estimate a model-independent pre-exponential factor for each degree of conversion.
Theory background
TG method has been widely used in thermal degradation studies. Experiments are usually performed under non-isothermal conditions. Reaction mechanism fitting method that can provide some information on the reaction mechanism of pyrolysis is used for the determination of the apparent active energy. In this study, the activation energies of PLA, PLA/CNF, and PLA/LCNF have been calculated using the FWO method. Furthermore, the IKR method was used to estimate the pre-exponential factor and model the thermal degradation of the materials.
A typical model for a kinetic process of an isothermal degradation can be expressed as

where α is the conversion degree (α = (W0 − Wt)/(W0 − Wf), Wt, W0, and Wf are time t, initial and final weights of the sample, respectively), dα/dt is the conversion rate, k is the degradation rate, constant and f(α) is the differential expression of a kinetic model function, which depends on the particular degradation mechanism.
According to Arrhenius equation

where A is the pre-exponential factor (s−1), assumed to be independent of temperature, E is the activation energy (kJ mol−1), T is the absolute temperature (K), and R is the gas constant (8.314 J mol−1K−1). The kinetic analysis of non-isothermal data is generally performed by the following equation

where β is the constant heating rate. The kinetics analysis of non-isothermal data is generally performed using the following methods.
FWO method
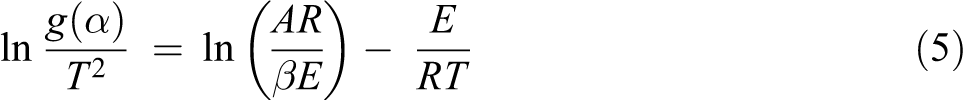
The FWO method 18 is an integral method that can determine the active energy without any knowledge of the reaction mechanism. It used the following approximate equation at a constant weight loss in a thermal degradation process

where g(α) is the integral mechanism function,
The value of E can be computed by the FWO method for any particular degree of conversion. Therefore, according to equation (4), plotting log (β) against 1/T should give straight lines, the slope of which is directly proportional to the activation energy.
To study the degradation mechanisms of the composite materials. The Coats–Redfern method is mostly used to estimate the Arrhenius parameters. The Coats–Redfern method 20 is also an integral method and involves the thermal degradation mechanism. Using an asymptotic approximation (2RT/E << 1), the Coats–Redfern technique uses the following equation for studying the thermal degradation kinetics
E and A can be determined from the slope and the intercept of the straight line
IKR method
The pre-exponential factor can be determined by assuming different reaction models which are shown in Table 1. In isoconversional method, knowing of pre-exponential factor and reaction model is not required to identify the kinetic scheme of the process. A model-independent estimate of the pre-exponential factor can be obtained through the use of an artificial IKR, in which a common intersection point of Arrhenius lines is defined as Tiso and kiso. In a general case, the actual value of ln Aα can be determined by the following method

Thermal degradation data of PLA, PLA/CNF, and PLA/LCNF samples.
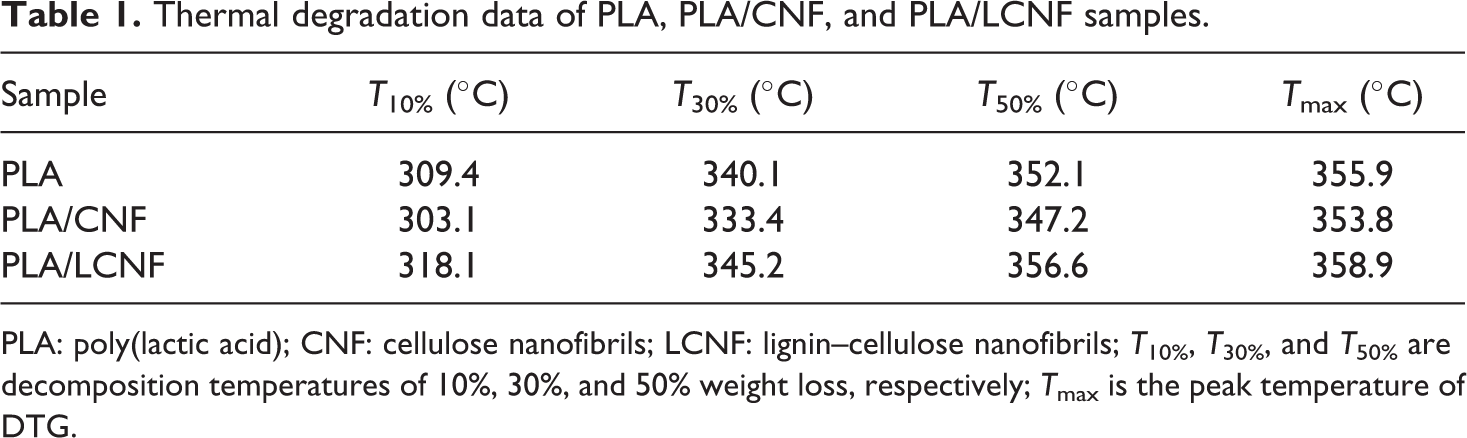
PLA: poly(lactic acid); CNF: cellulose nanofibrils; LCNF: lignin–cellulose nanofibrils; T10%, T30%, and T50% are decomposition temperatures of 10%, 30%, and 50% weight loss, respectively; Tmax is the peak temperature of DTG.
where a = ln (kiso) and b = (RTiso)−1 are coordinates of the intersection point of Arrhenius lines. It is important that this approach is based on a completely artificial IKR derived from the results of the model-fitting method. 10
Another way to calculate the pre-exponential factor, with this method, is by the use of different reaction models, in which the values of activation energy and pre-exponential factor are determined for each model. Intersection of the Arrhenius lines at nearly one point means that Arrhenius parameters will show a linear correlation

where n refers to a particular reaction model. When parameters c and d are determined, the Eα values are substituted to En in equation (7) to estimate the corresponding ln Aα values. 10,20
Experiment
PLA (Mw = 100,000, purchased from Shanghai Yisheng industry Ltd, Shanghai, China) was used as the matrix. Bleached wood pulp board (sulfate cooking) was obtained from a pulp and paper mill in Shandong province, China and used as one kind of additive. Hydrolysis and high-pressure homogeneous process was described in our previous work. 21 The solvent casting and evaporation method was used to prepare the PLA/LCNF composite, PLA was first dissolved in Dimethylacetamide (DMAc), CNF suspended in DMAc and polyethylene glycol (PEG) diluted in DMAc was then well mixed with a 16% PLA/DMAc solution by constantly stirring. The PLA/LCNF composite was obtained by a fast evaporation of DMAc when heating to 80°C. The possible membrane formation mechanism affected by the LCNF are shown in Figure 1 and the absorption promoter mechanism of lignin on cellulose adhesion to the membrane matrix are shown in Figure 2.
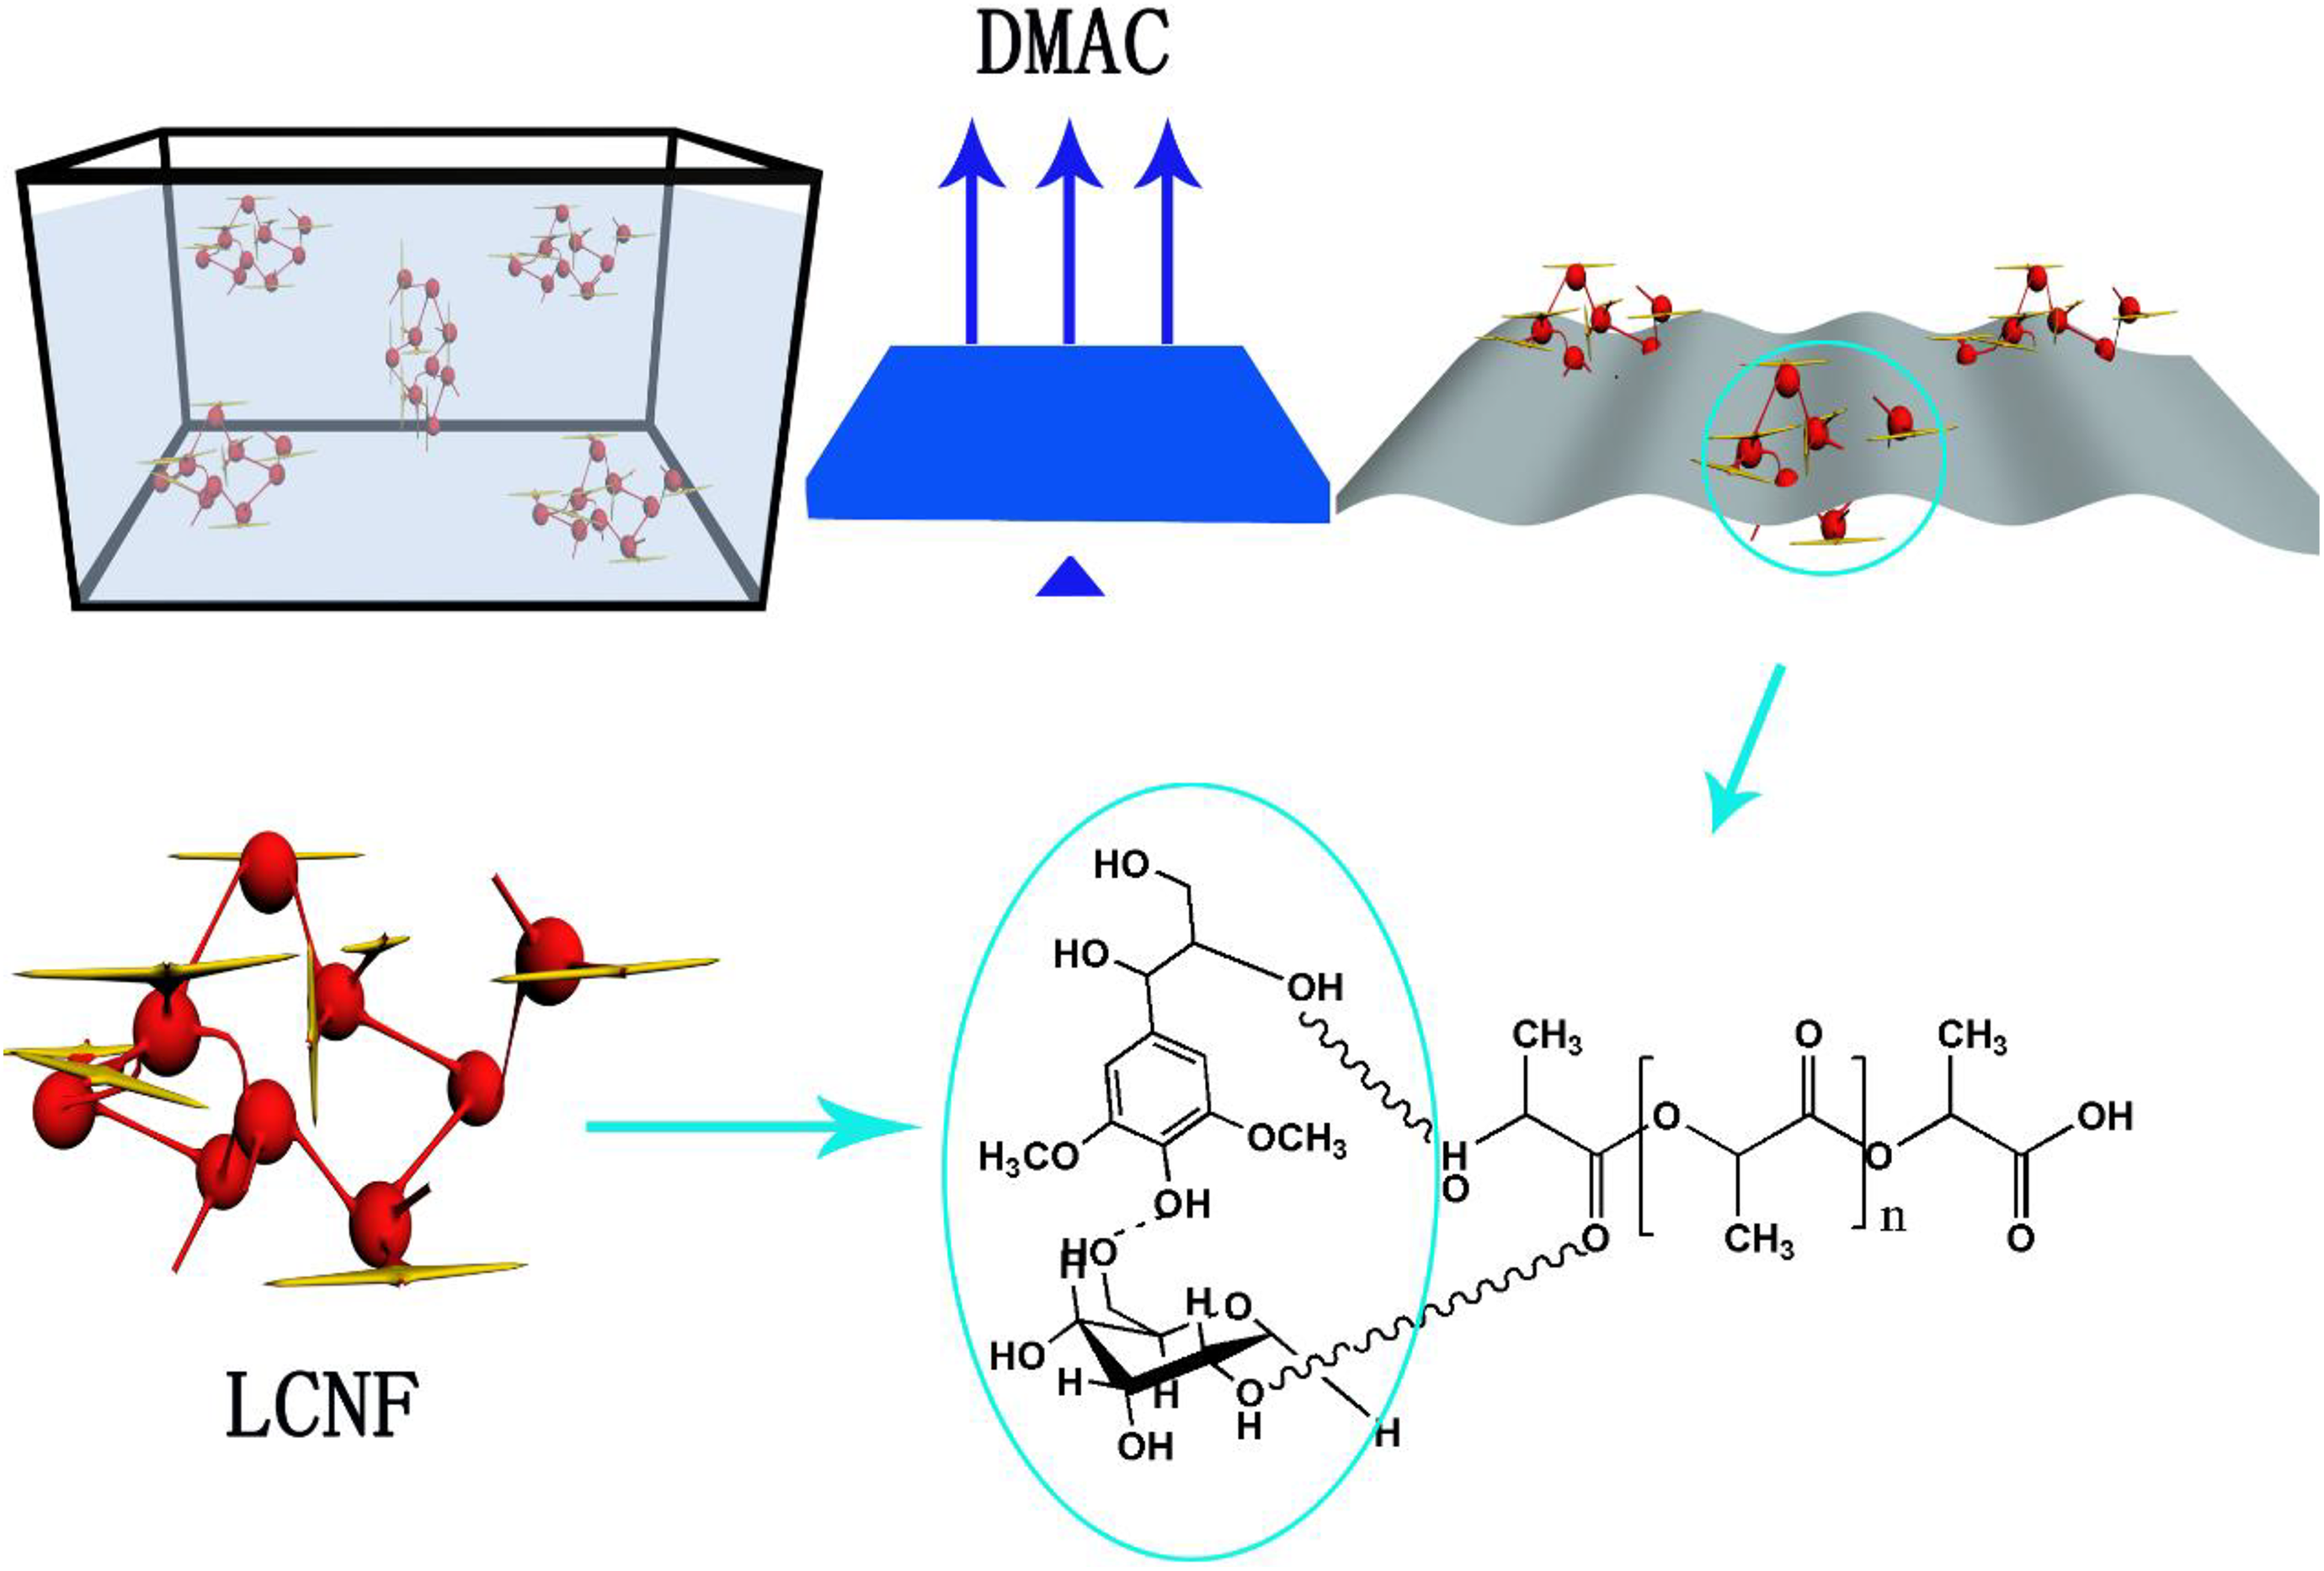
The possible membrane formation mechanism affected by the LCNF. LCNF: lignin–cellulose nanofibrils.
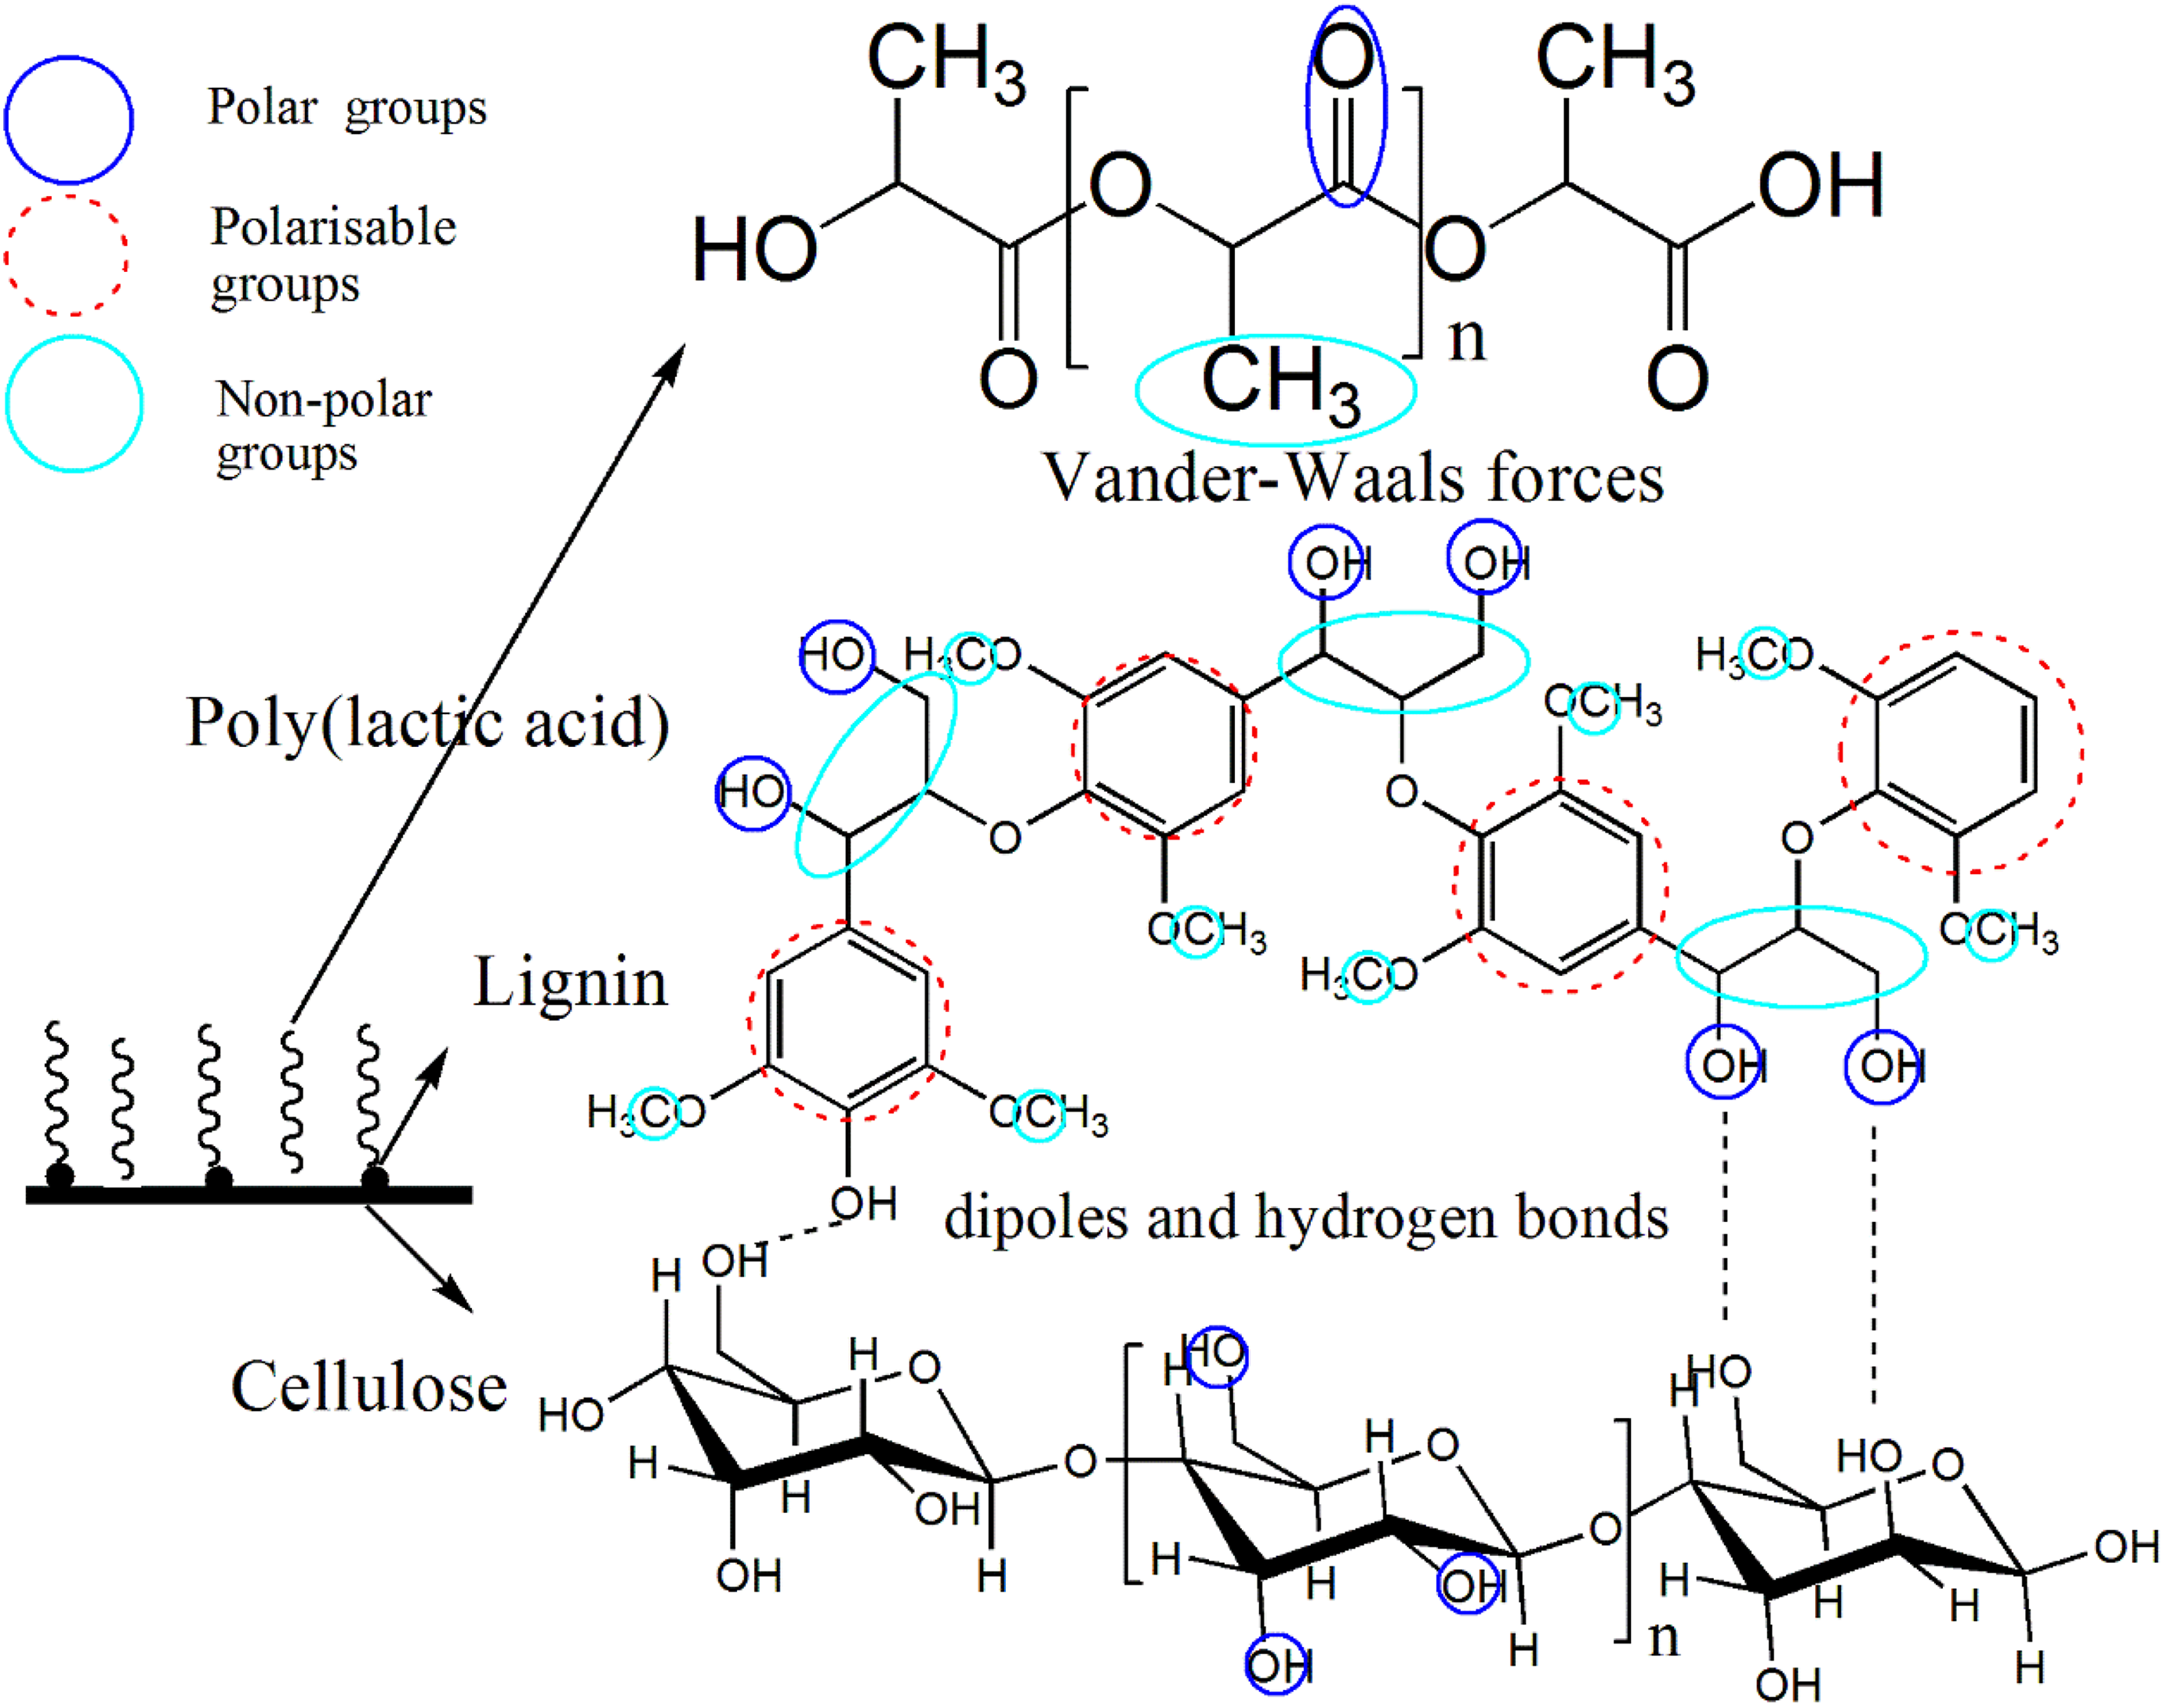
The absorption promoter mechanism of lignin on cellulose adhesion to the membrane matrix.
TGAs of all materials were carried out using an EXSTA TG/DTA6300 (Shandong, China). Samples (5–10 mg) were heated from ambient temperature to 500°C. The experiments were carried out at atmospheric pressure, under nitrogen atmosphere, with a flow rate of 60 ml min−1, at various linear heating rates of 10, 15, 20, and 25°C min−1. Experimental integral curves were differentiated by means of the Origin software (OriginLab) to obtain the differential curves required for the kinetic analysis. Activation energy values were calculated with a specially designed program in MS Excel 2007.
Result and discussion
TGA
The dynamic TG curves and corresponding derivative thermogravimetric (DTG) curves for PLA, PLA/CNF, and PLA/LCNF composites obtained at 10°C min−1 are shown in Figure 3. The weight loss temperatures at 10%, 30%, and 50% of TGA and peak temperature of DTG are listed in Table 1. All the samples displayed a single-step degradation process, it also showed that after 400°C there is no residue in all of the samples and the conversion values practically reach 1. For comparison the thermal degradation behavior of samples, as is clear, with the addition of CNF alone, the PLA had shown more resistant at thermal degradation than PLA/CNF, which could be attributed to the poor interfacial bonding between the CNF and PLA, and the CNF, even as an obstacle, separated the molecular chains of PLA, which made the distance among the molecules larger and the force among the molecular chains of PLA weaker. However, the PLA/LCNF could have an enhancement in the stability compared to the neat PLA, it is clear that the addition of PEG had a positive effect on the composite thermal degradation property. The reason could be explained that PEG covers the surface of the CNF. Lignin, acting as a kind of compatibilizer, successfully improved the interactions between hydrophilic CNF and hydrophobic PLA which was studied in our previous work. 21
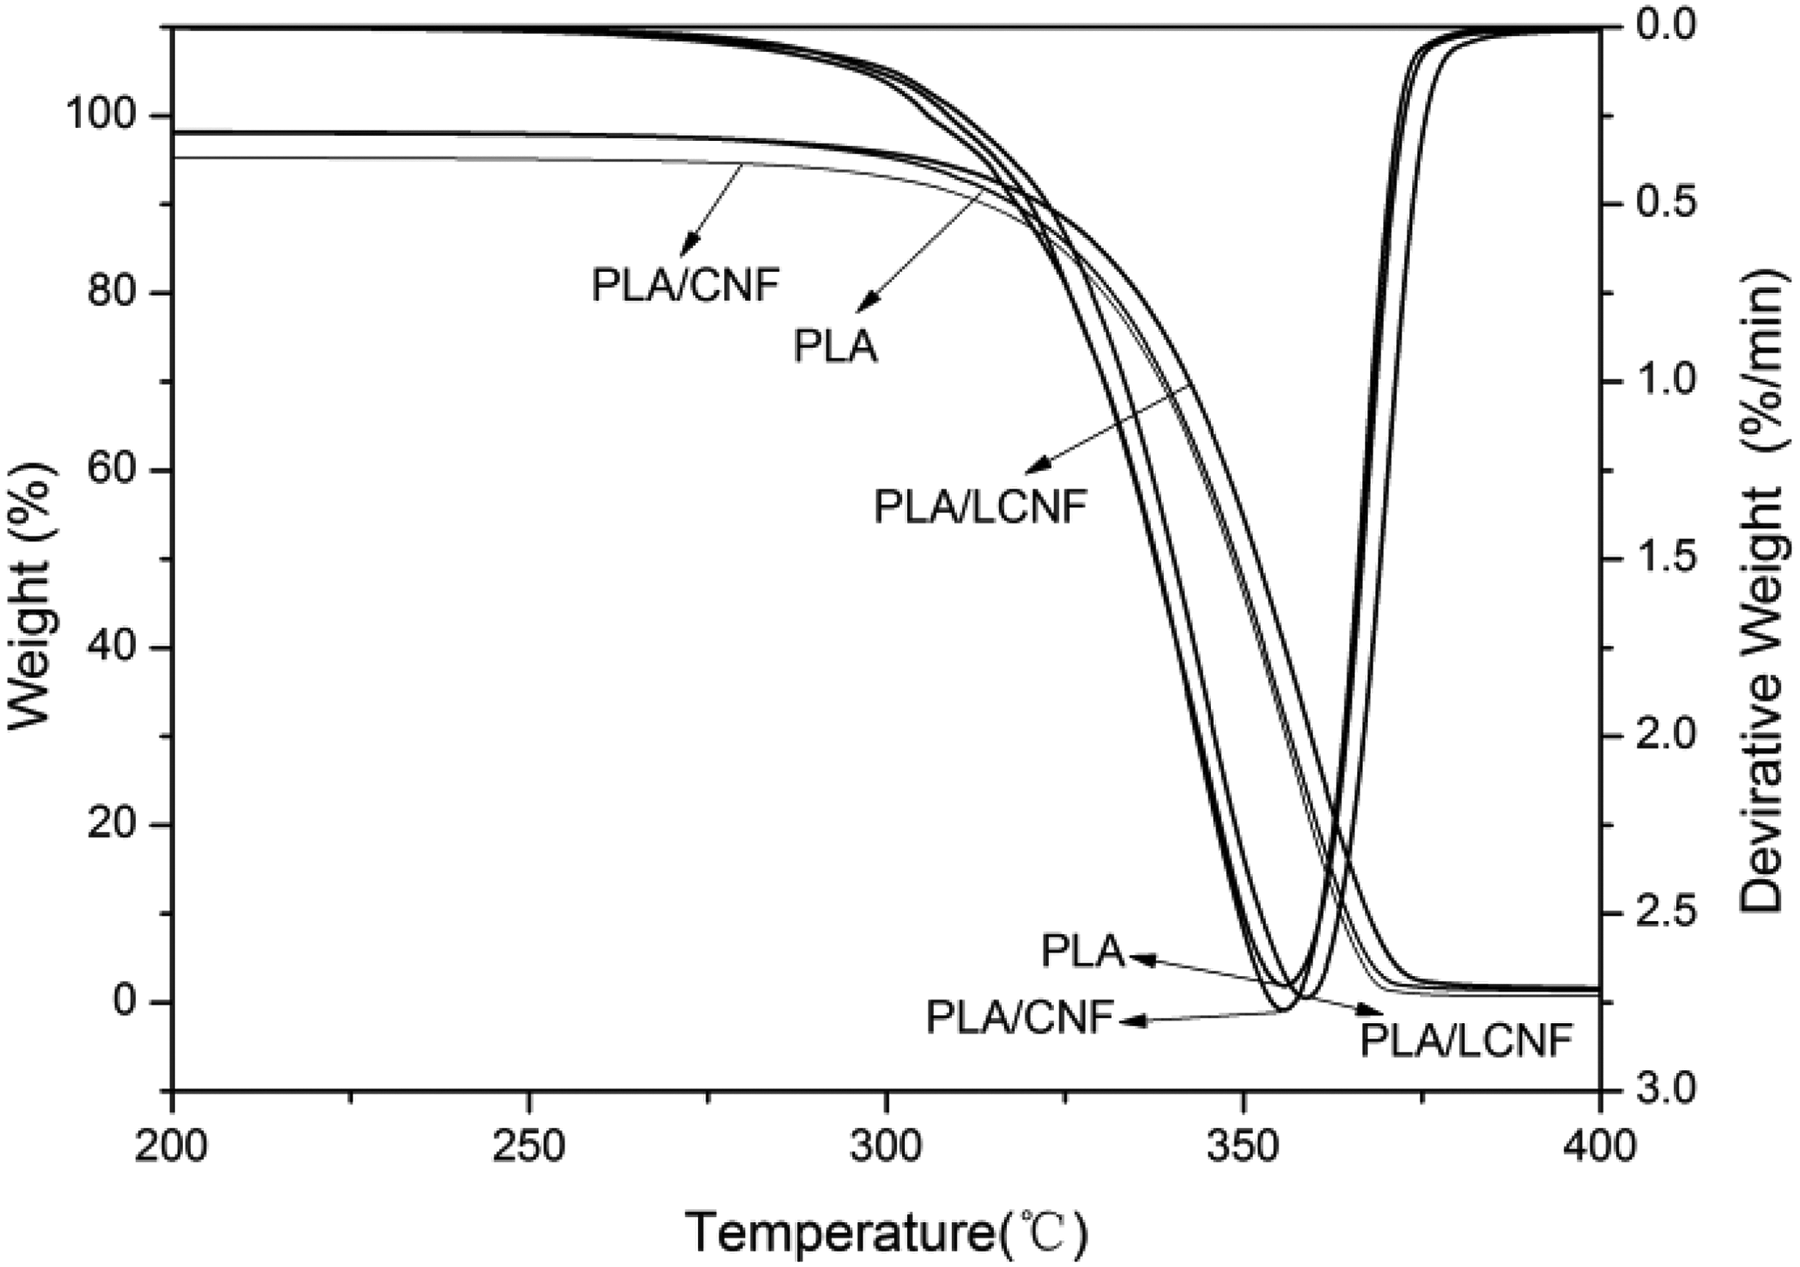
TG curves of PLA, PLA/CNF, and PLA/LCNF composite (heating rate: 10°C min−1). TG: thermogravimetric; PLA: poly(lactic acid); CNF: cellulose nanofibrils; LCNF: lignin–cellulose nanofibrils.
Figure 4 shows that the heating rate influenced the temperature ranges of the pyrolysis process. In these figures, delay in degradation and shifting of the curves to higher temperatures with increasing heating rate is observed, most probably due to increased thermal lag, as at a given temperature a higher heating rate implies that the material reaches that temperature in a short time. 22 The peak temperatures of all PLA composites were shifted to high temperature and also the thermal degradation rates increased with the heating rate. At higher heating rates, composite decomposition processes are more vigorous and consequently result in higher maximum rates of degradation which are listed in Table 2. A comparison between slow and fast heating rate data about the maximum decomposition temperature in Table 2 indicates that the PLA/LCNF composite has a better principle improvement with increasing heating rate than PLA/CNF and neat PLA.
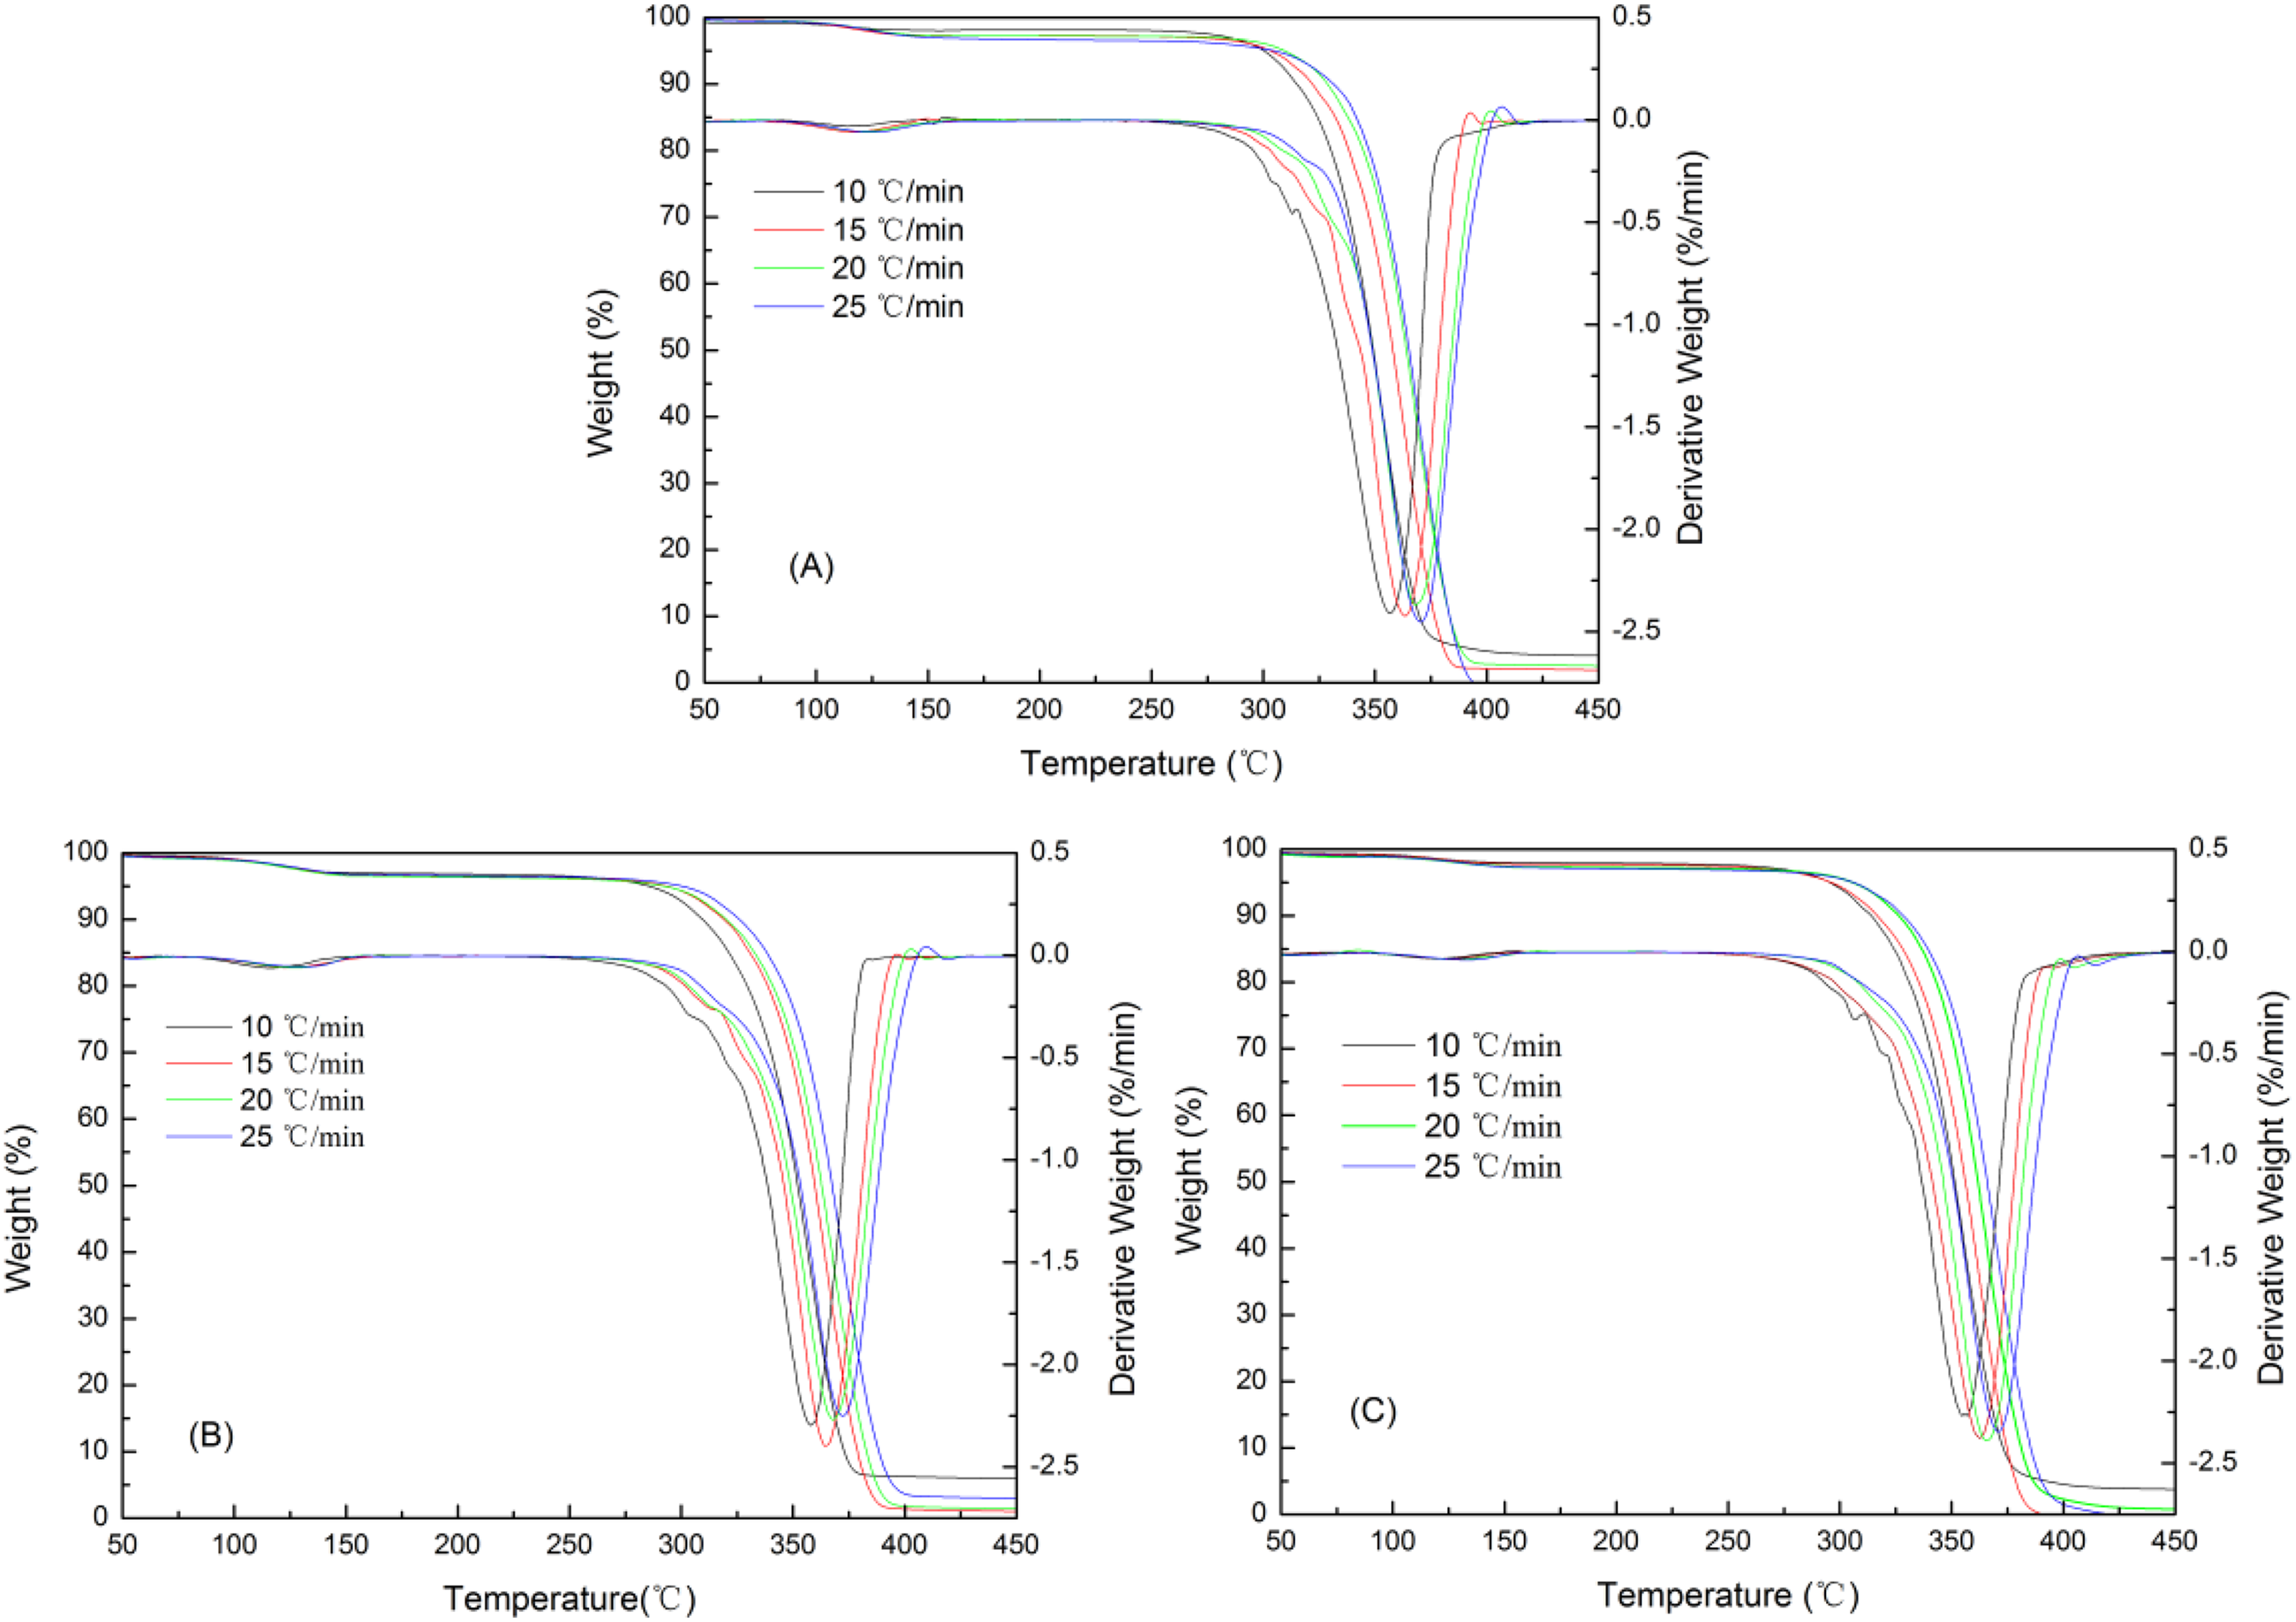
Effect of heating rate on composite TG and DTG pyrolysis profiles: (a) PLA/LCNF, (b) PLA/CNF, and (c) PLA. TG: thermogravimetric; DTG: derivative thermogravimetric; PLA: poly(lactic acid); CNF: cellulose nanofibrils; LCNF: lignin–cellulose nanofibrils.
Tp of PLA, PLA/CNF, and PLA/LCNF composite at different heating rates.
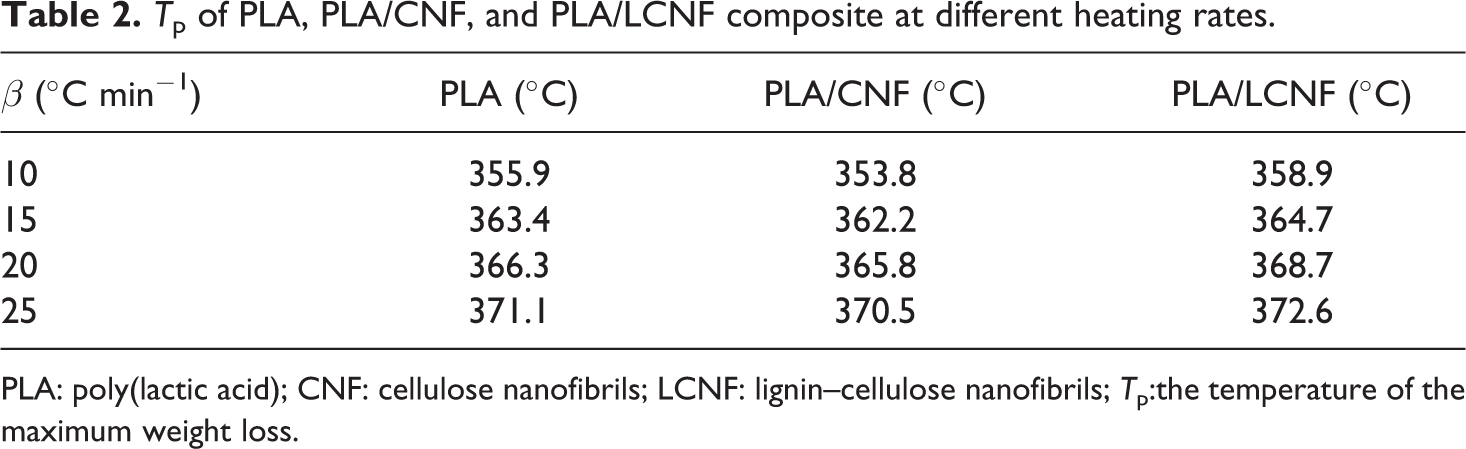
PLA: poly(lactic acid); CNF: cellulose nanofibrils; LCNF: lignin–cellulose nanofibrils; Tp:the temperature of the maximum weight loss.
Non-isothermal degradation kinetics analysis
In a further investigation of the effect of CNF and PEG on the thermal degradation of PLA composites, the apparent activation energies (Ea) of the thermal degradation of these three different kinds of composites are calculated from the weight loss data according to the FWO model, which yields a quantitative parameter that can be used to estimate the thermal stability of these composites. The results of the FWO analysis (log β vs. 1/T) for the conversion values in the range of 0.1–0.9 were determined for PLA, PLA/CNF, and PLA/LCNF composites and are shown in Figure 5. Activation energy can be calculated from the slope of the appropriate linear plot. The activation energies versus conversion values of different PLA composites calculated by the FWO method were also depicted in Figure 6 for all samples.
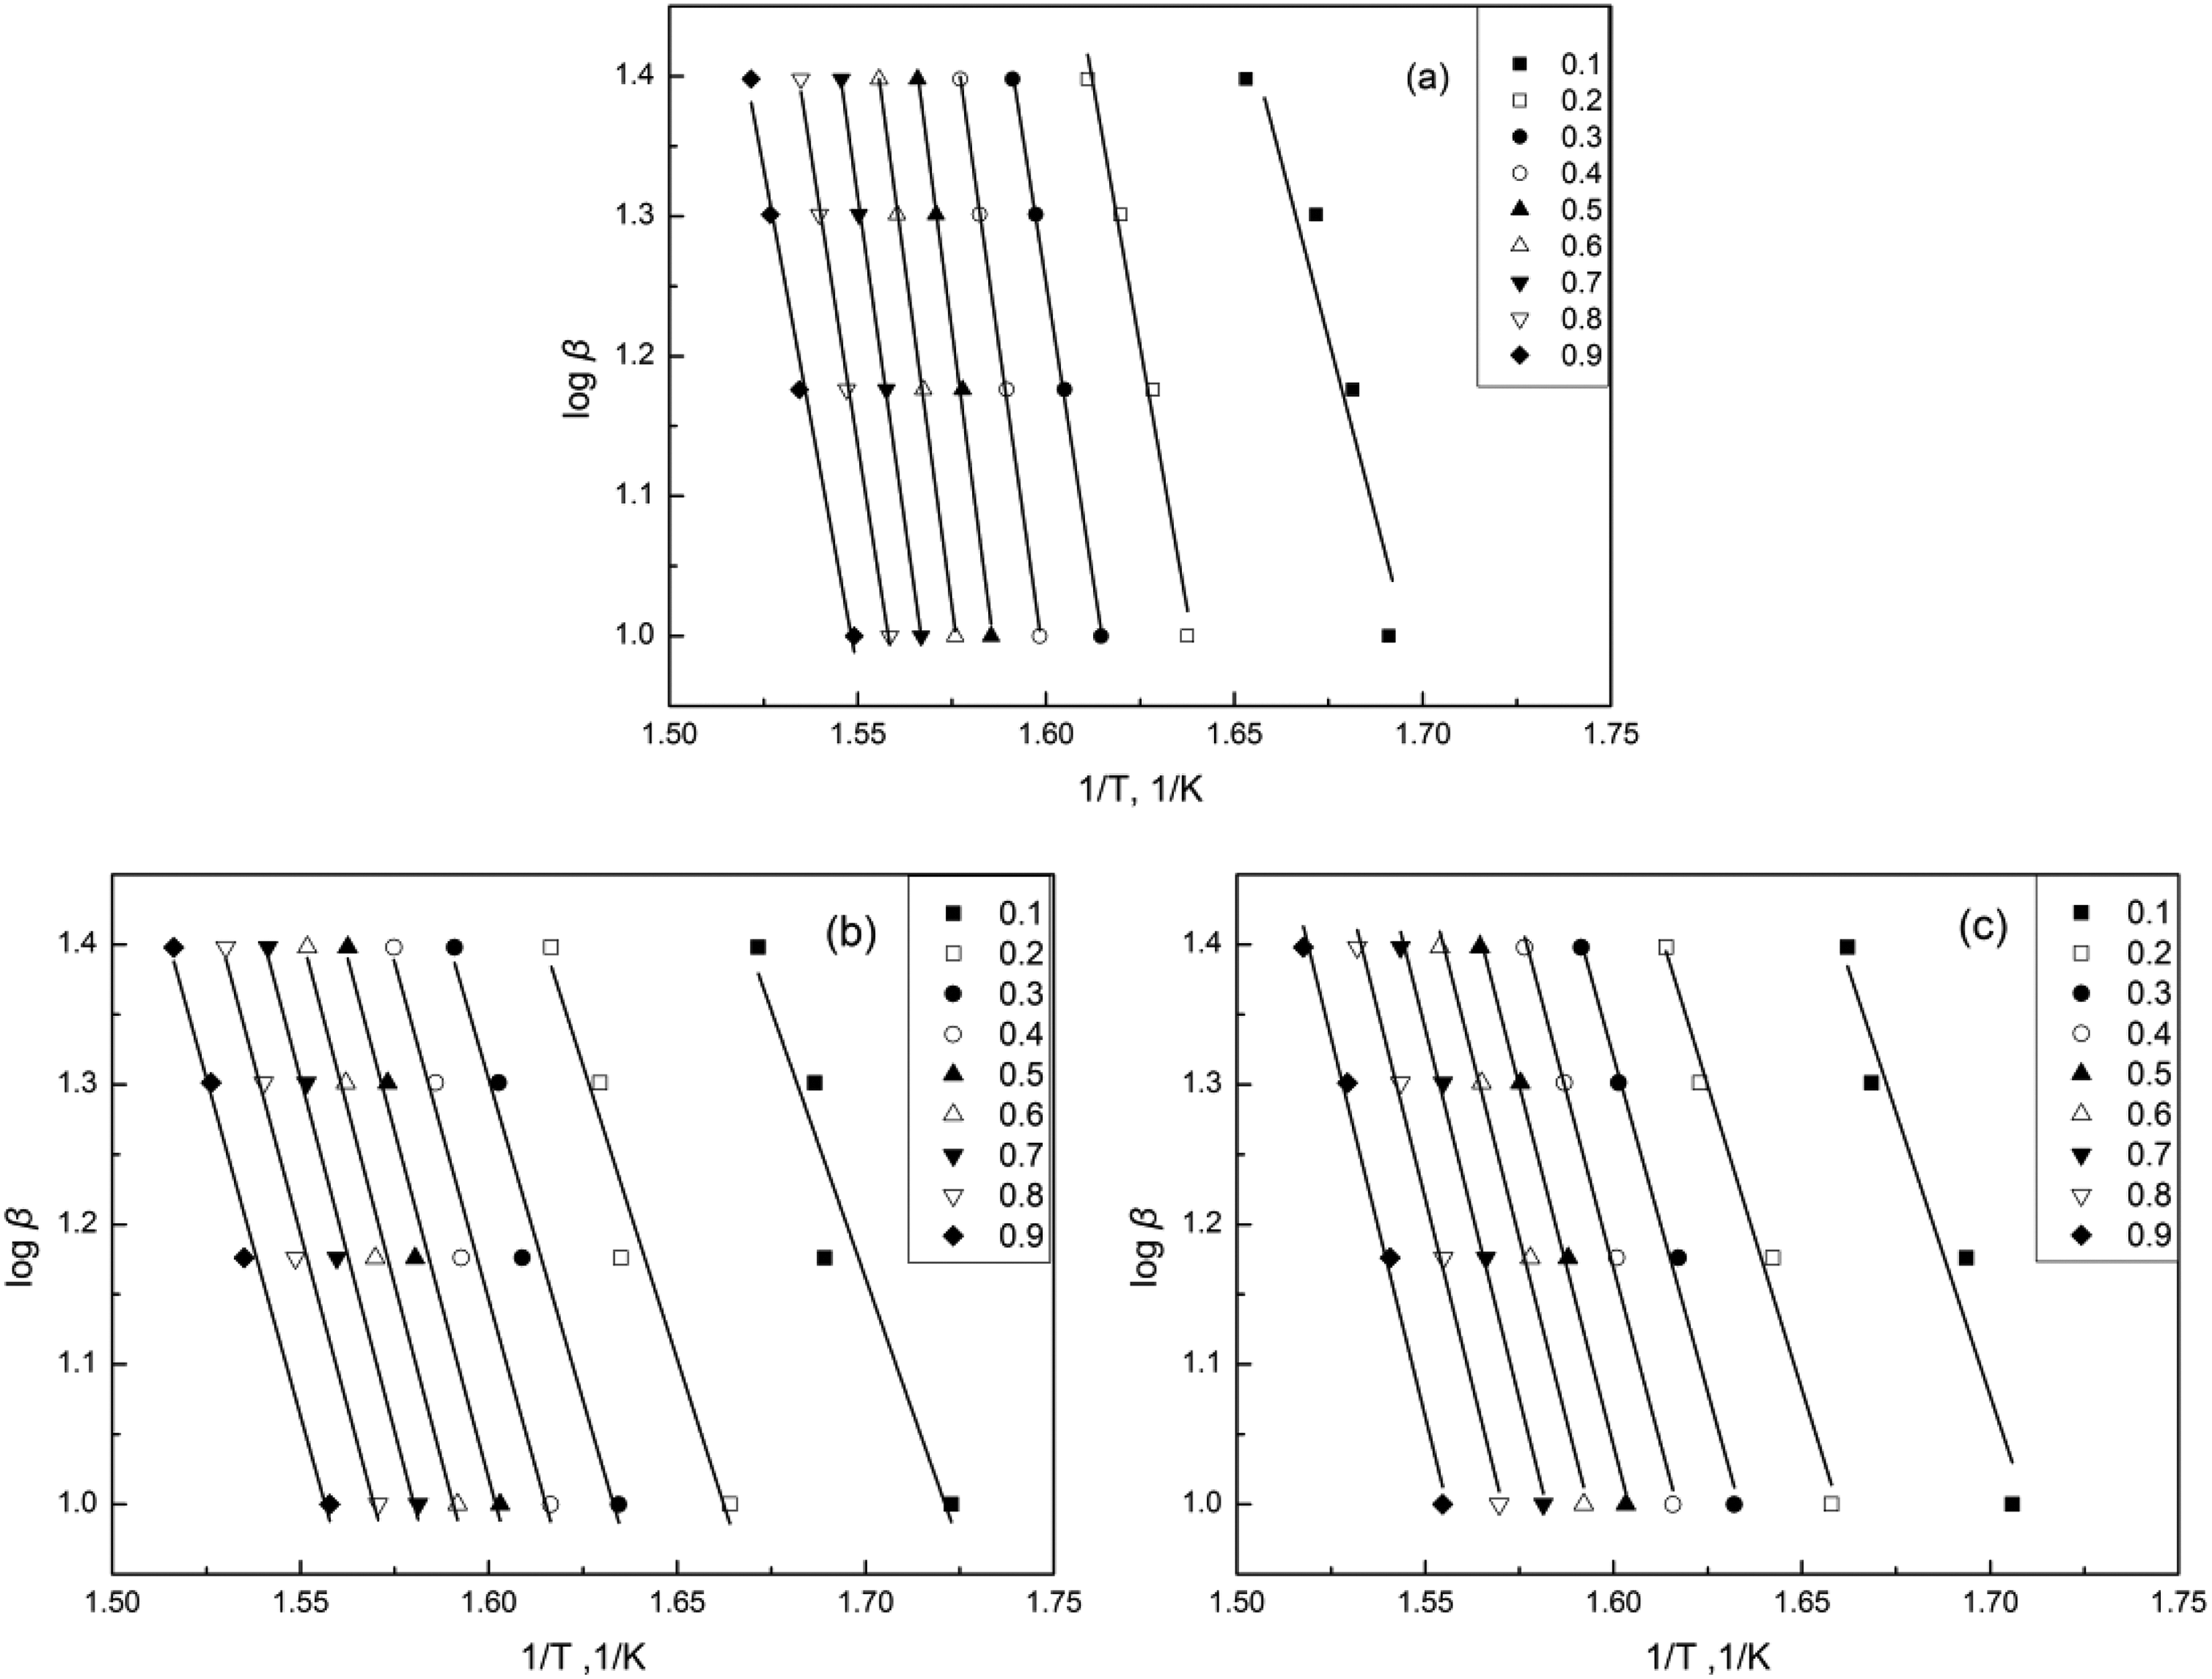
FWO plots for (a) PLA/LCNF, (b) PLA/CNF, and (c) PLA samples at various conversions. FWO: Flynn–Wall–Ozawa; PLA: poly(lactic acid); CNF: cellulose nanofibrils; LCNF: lignin–cellulose nanofibrils.
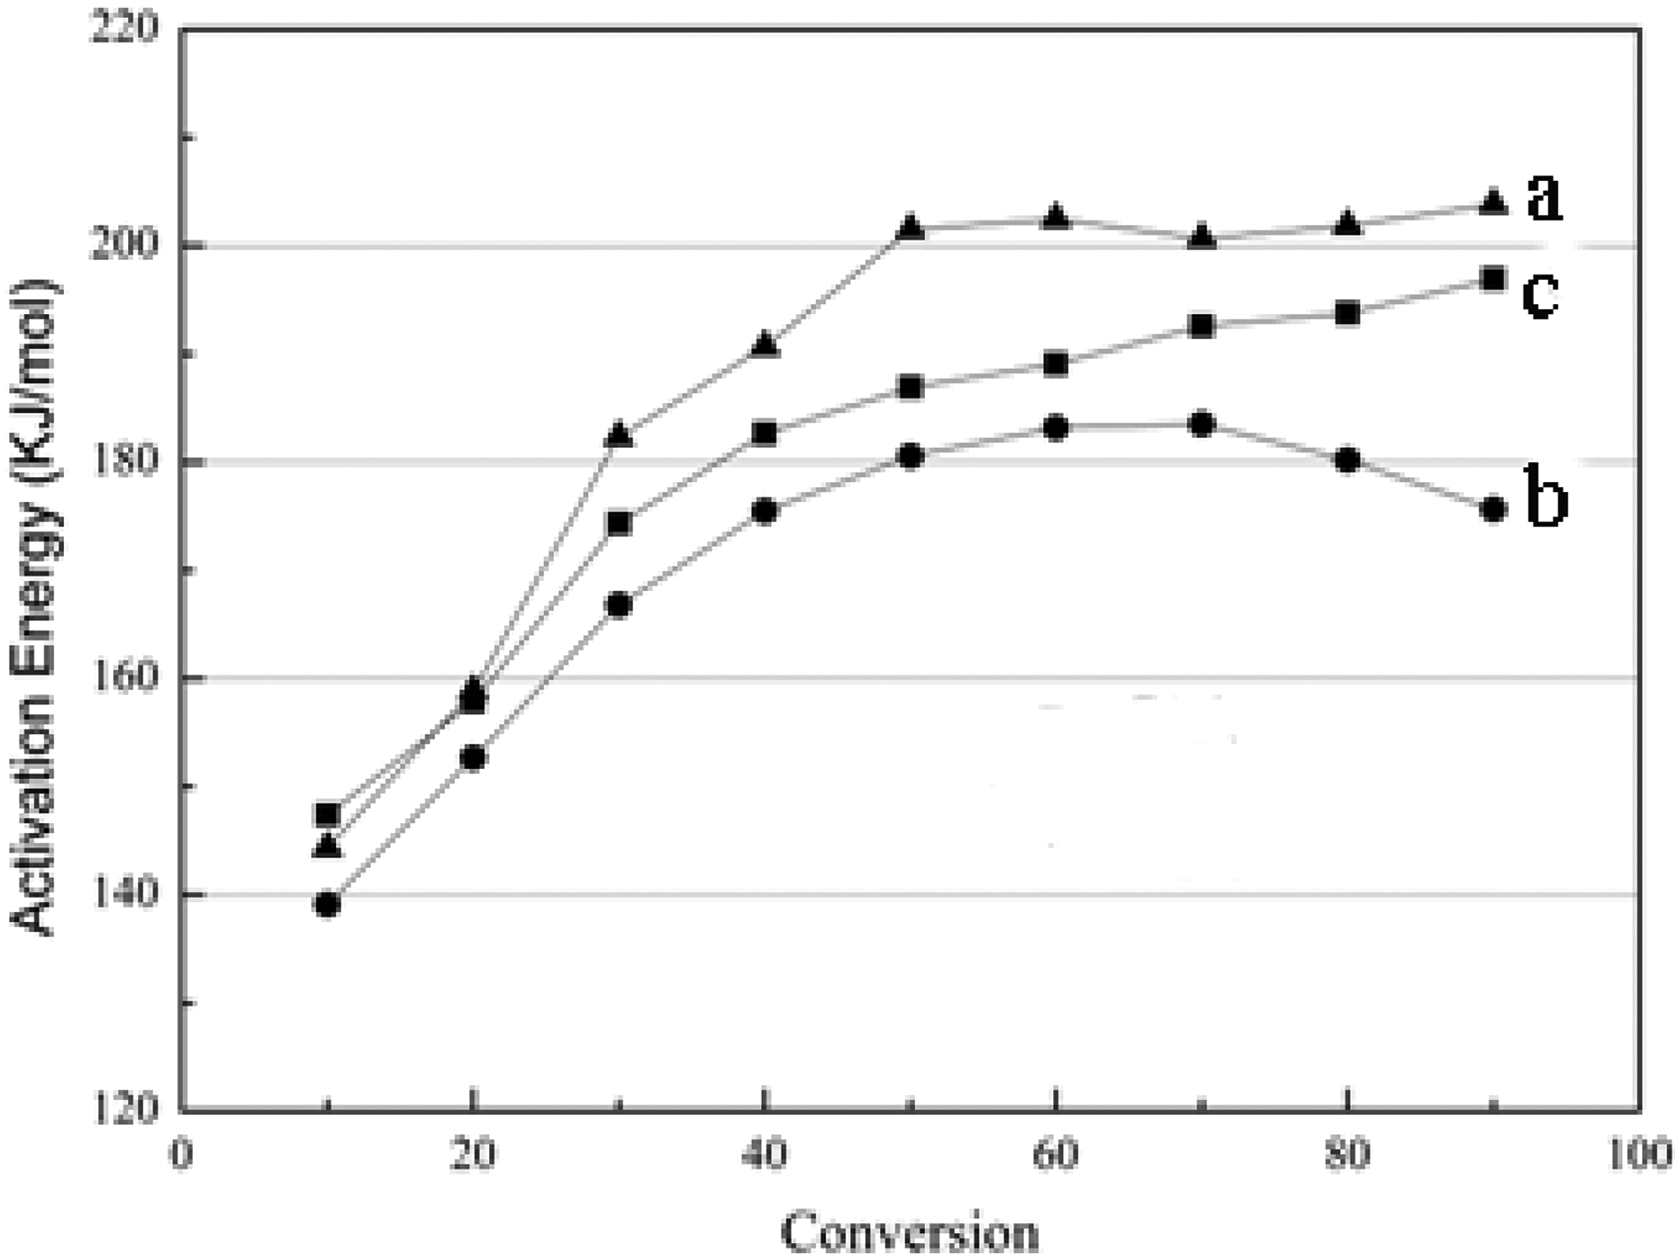
Variation of activation energy (E) versus conversion (α) for (a) PLA/LCNF, (b) PLA/CNF, and (c) PLA composite samples. PLA: poly(lactic acid); CNF: cellulose nanofibrils; LCNF: lignin–cellulose nanofibrils.
The activation energy of the PLA is greater than that of the PLA/CNF composite in the 0.1–0.9 weight loss region. The calculated E values from the FWO method were 185.7 and 170.8 kJ mol−1 for pure PLA and the PLA/CNF composite, respectively. It can be seen that the E value of PLA increased from 150 to 190 kJ mol−1 at the first stage with an increase in α from 0.1 to 0.5, and then kept constant at about 195 kJ mol−1 until almost complete decomposition had occurred. Similar observation for PLA has also been reported indicating that the degradation by both cis-elimination and ester interchange shifted toward cis-elimination with an increase in temperature. 23,24 The ester interchange has a lower energy of activation than the cis-elimination. Therefore, the values of E increased with α. When CNF is present, the activation energy of the PLA/CNF composite decreased dramatically compared with pure PLA. Considering the CNF in these composites, their thermal degradation behaviors are comparable with PLA degradation as it is shown in Figure 3. For PLA and PLA/CNF, the level of PLA/CNF activation energy in the whole range is lower than PLA, the activation energy of the composite is smaller than that of the polymer matrix, 25 which corresponds to our study. It can be attributed to the incorporation of CNF into PLA which caused an increase in the degradation rate and a decrease in the residual weight for the composite. This is most likely due to the existence of CNF which is degradation in the range of temperatures investigated and the bad miscible property between PLA and CNF in the composite molding processing, which could result in the thermal degradation of PLA and CNF separately, For a molar example, the content of PLA, which consumed energy to be degraded during the thermal degradation, the CNF consumed lower energy compared with pure PLA, so the activation energy of the PLA/CNF composite was lower than PLA. When adding the PEG, the activation energy of PLA/LCNF was increased which was due to the formed PLA/LCNF composite having some inner interactions such as hydrogen bonding and absorption force, these interactions could improve the miscible property between PLA and CNF, which should consume greater energy to break the interactions when the thermal degradation process occurred.
The solid state reactions are sensitive to many factors that are likely to change during the process. Model-fitting methods (like the Coats–Redfern method) are designed to extract a single set of Arrhenius parameters for the whole conversion ranges. The results of Table 3 obviously indicate the strong dependence of kinetic parameters on the selected reaction mechanism. Studies had observed that the linear relationship of activation energy with the conversion indicates the possibility of single reaction mechanism or the unification of multiple-reaction mechanism. 26 Inserting different forms of these mechanisms in equation 7 results in a set of Arrhenius parameters in which the linear plot of ln [g(α)/T 2 ] versus 1/T makes it possible to determine E and ln (A) from the slope and intercept of the graphs, respectively. The correlation factors of different mechanism are listed in Table 4.
Arrhenius parameters for non-isothermal degradation of samples at a heating rate of 10 K min−1.
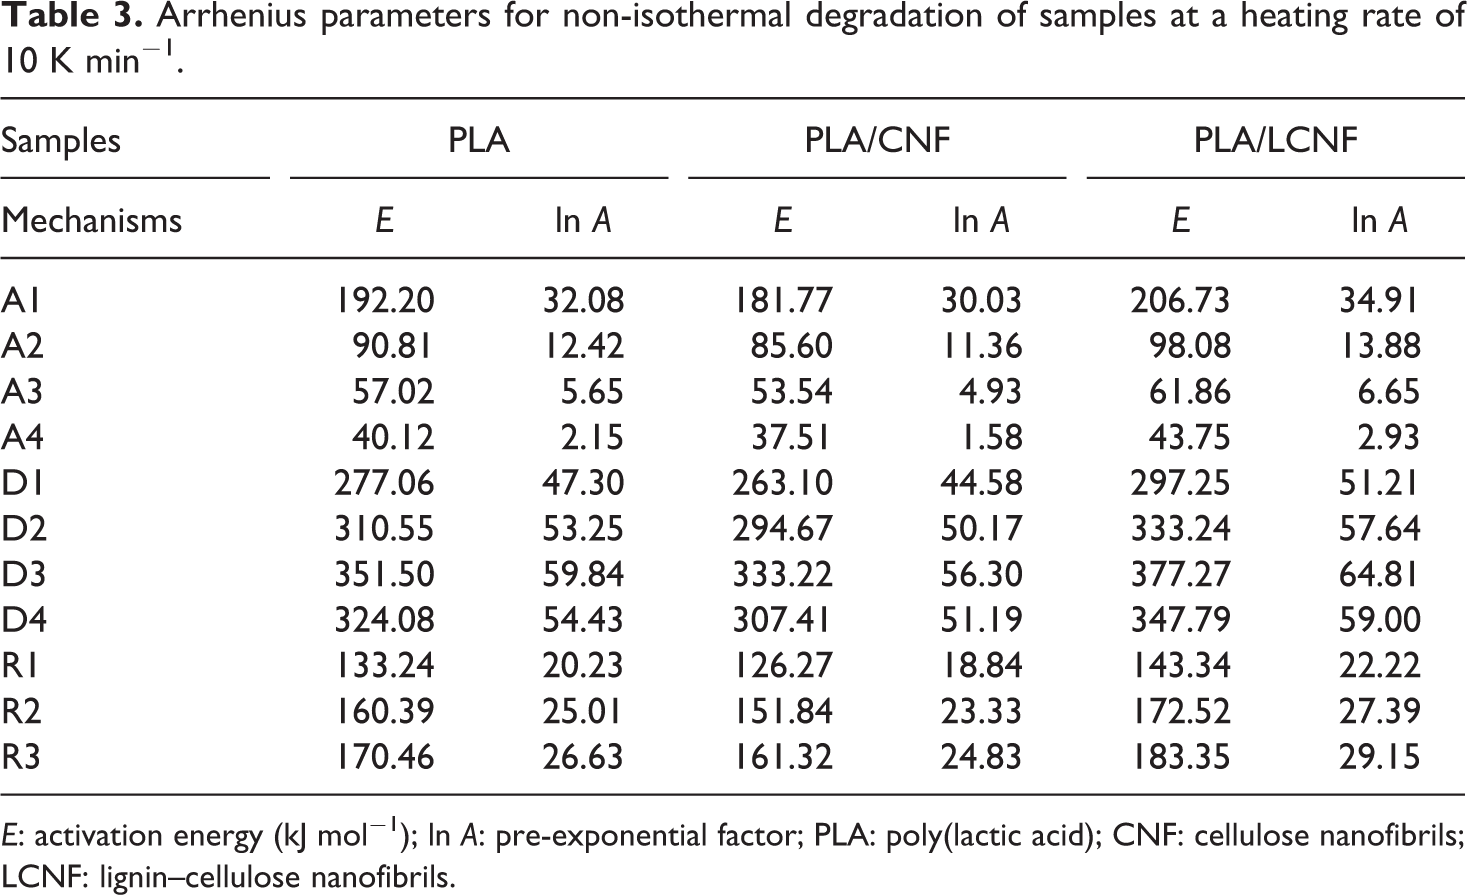
E: activation energy (kJ mol−1); ln A: pre-exponential factor; PLA: poly(lactic acid); CNF: cellulose nanofibrils; LCNF: lignin–cellulose nanofibrils.
The correlation factors corresponding to different mechanisms.
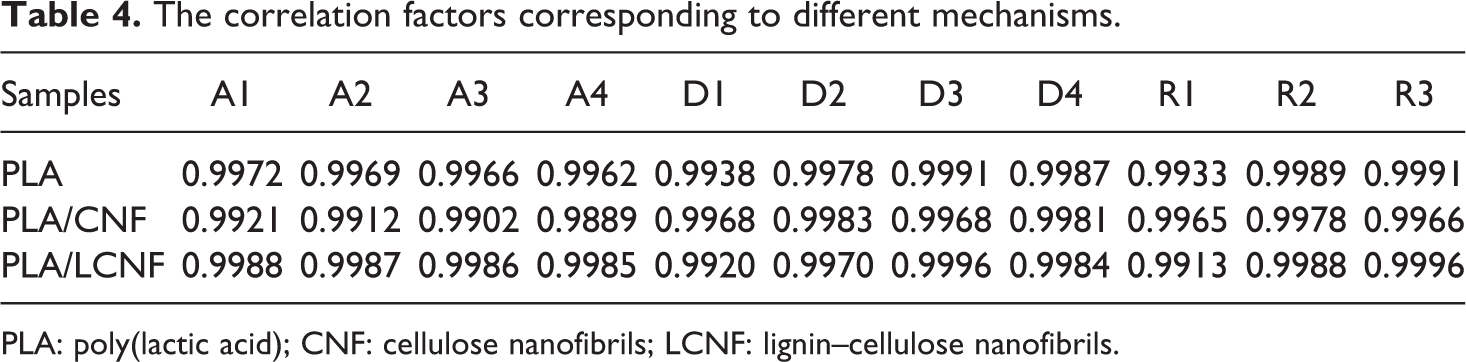
PLA: poly(lactic acid); CNF: cellulose nanofibrils; LCNF: lignin–cellulose nanofibrils.
It is evident from Table 4 that the correlation factors are the standard measures and therefore, it is difficult to make a decision about the exact thermal degradation mechanism. It is clear from Table 3 that the values of Arrhenius parameters corresponding to those models that have high correlation factors vary significantly. Such an uncertainty in the kinetic parameters couldn’t lead to suitable kinetic predictions and reasonable mechanism.
According to the results of Tables 3 and 4, every kinetic model determines only one single pair of Arrhenius parameters (E and ln A) for the whole of conversion range and in this case, the variations of E with α aren’t considered. Therefore, the model-free methods (FWO analysis) could be used for determining the dependency of activation energy on conversion. Also, the most solid state reactions are not simple one-step processes but consist of multiple steps during the degradation process. 27
The Arrhenius lines using the IKR method were plotted using the parameters of Table 3, for all of the samples. Therefore, the intersection point corresponds to the isokinetic parameters (a and b) used, in which nearly all the plotted lines converged. Based on equation (7), the calculated pre-exponential factors ln Aα, corresponding to Eα for each degree of conversion for PLA, PLA/CNF, and PLA/LCNF composites, are shown in Figure 7.
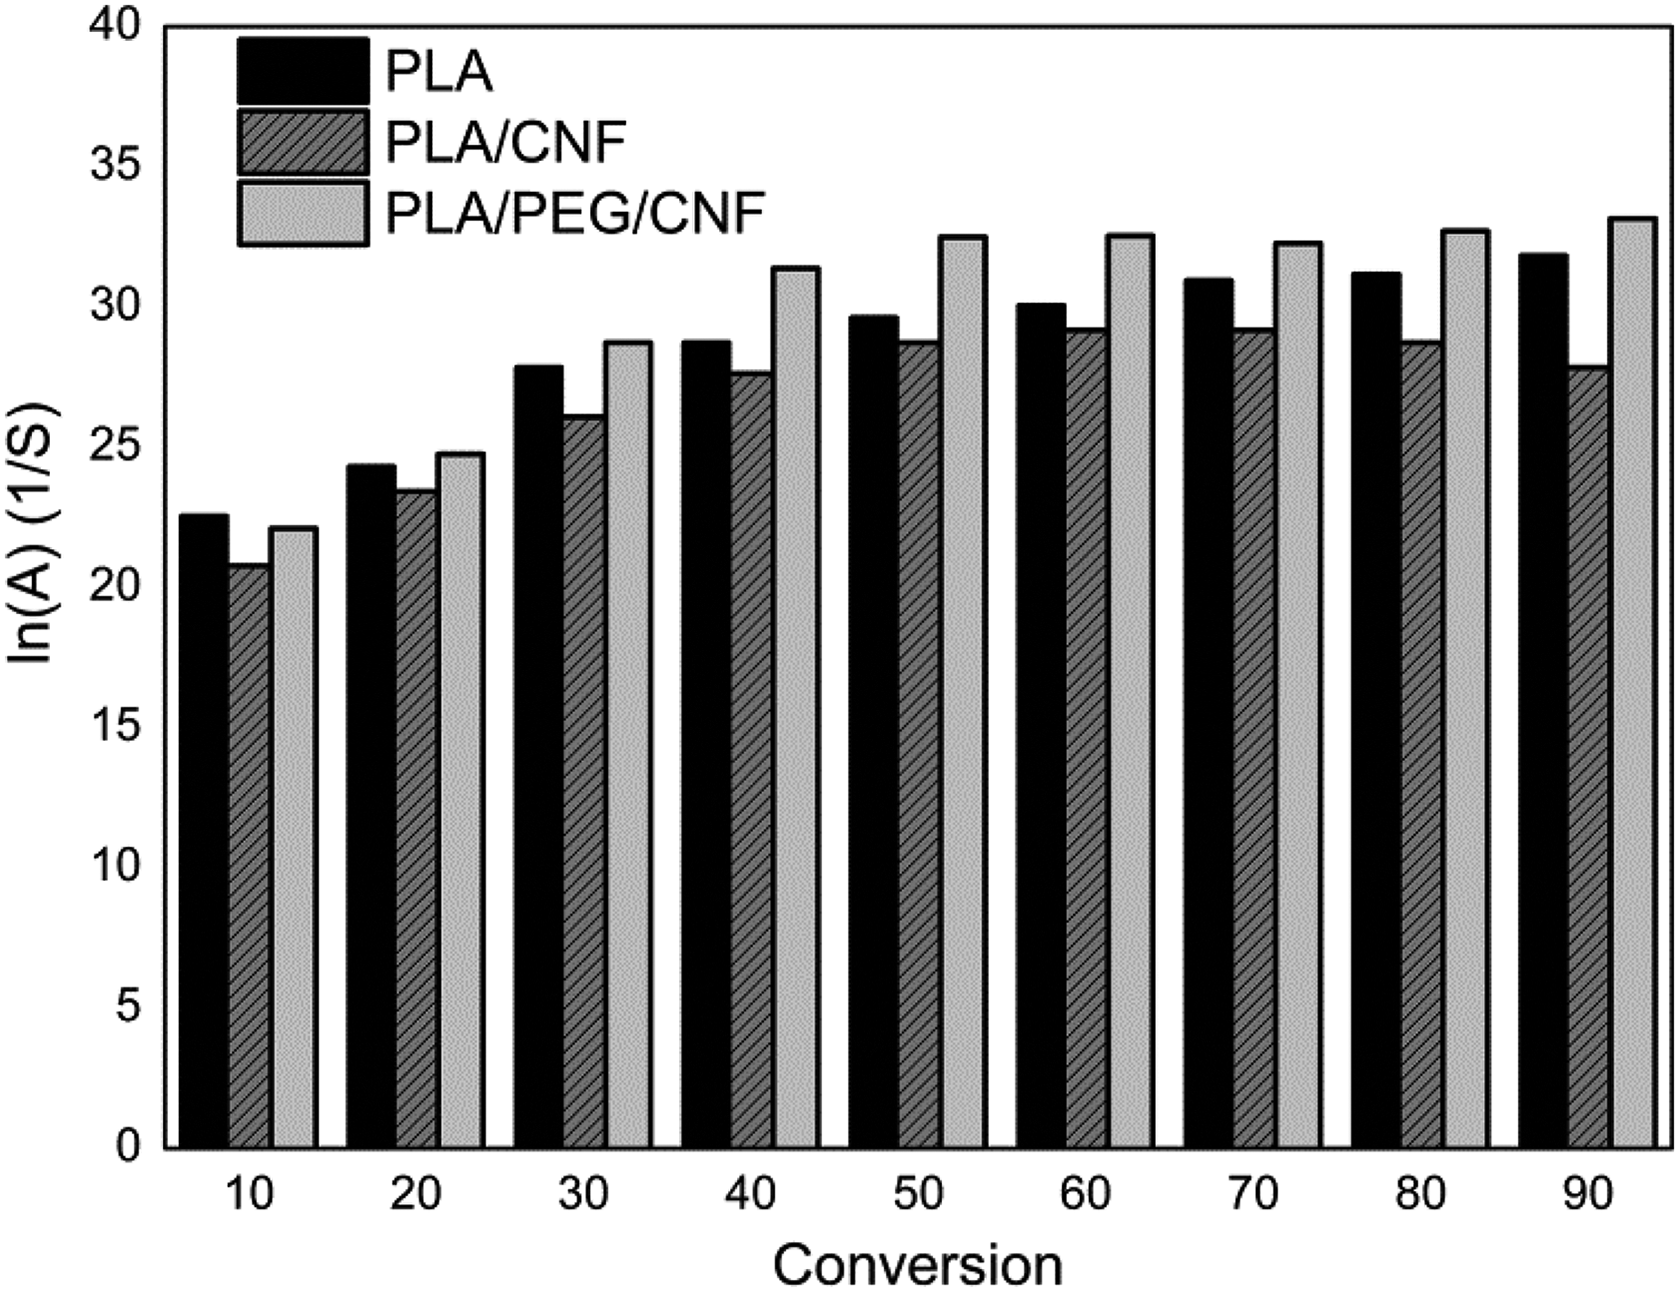
Variation of pre-exponential factor (ln A) versus conversion (α) for PLA, PLA/CNF, and PLA/LCNF composite samples. PLA: poly(lactic acid); CNF: cellulose nanofibrils; LCNF: lignin–cellulose nanofibrils.
Meanwhile, the c and d constants of equation (8) could also be determined by the parameters of Table 3 and the calculated values of ln A by means of equation (8). The same values for ln A results were showed compared to the isokinetic method. As it is observed in Figure 7, the ln Aα values changed with conversion in different samples and this trend is comparable with the variation of activation energy versus conversion which was attributed to the linear correlation between E and ln Aα. Substituting the values of ln Aα and Eα kinetic parameters into Coats–Redfern equation, the form of reaction model (g(α)), could be reconstructed.
Conclusion
In this article, the thermal degradations of PLA, the PLA/CNF, and PLA/LCNF composite were studied in a nitrogen atmosphere. The results indicated that the PEG could increase the thermal stability of PLA by improving the compatibility of PLA and CNF.
Kinetic study using the FWO method revealed a lower activation energy of PLA/CNF and PLA/LCNF composites than that of PLA, while the PLA/LCNF represented a high E than PLA/CNF, which was consistent with the thermal degradation study. The thermal degradations of PLA and the composite could be represented by some functions using the IKR method. However, establishing a certain reaction model is impossible based on the results obtained in this study. Furthermore, the values of ln Aα were determined using IKRs and it was mentioned that ln Aα and E have the same behavior with conversion changes. Complementary proof from other experiments is needed for a comprehensive understanding of the thermal degradation process of the composite materials.
Footnotes
Declaration of Conflicting Interests
The author(s) declared no potential conflicts of interest with respect to the research, authorship, and/or publication of this article.
Funding
The author(s) disclosed receipt of the following financial support for the research, authorship, and/or publication of this article: This work was financially supported by the Key Manufacture Technique of Functional Absorption Ligno-materials and Application Demonstration (2015BAD14B06).