
Abstract
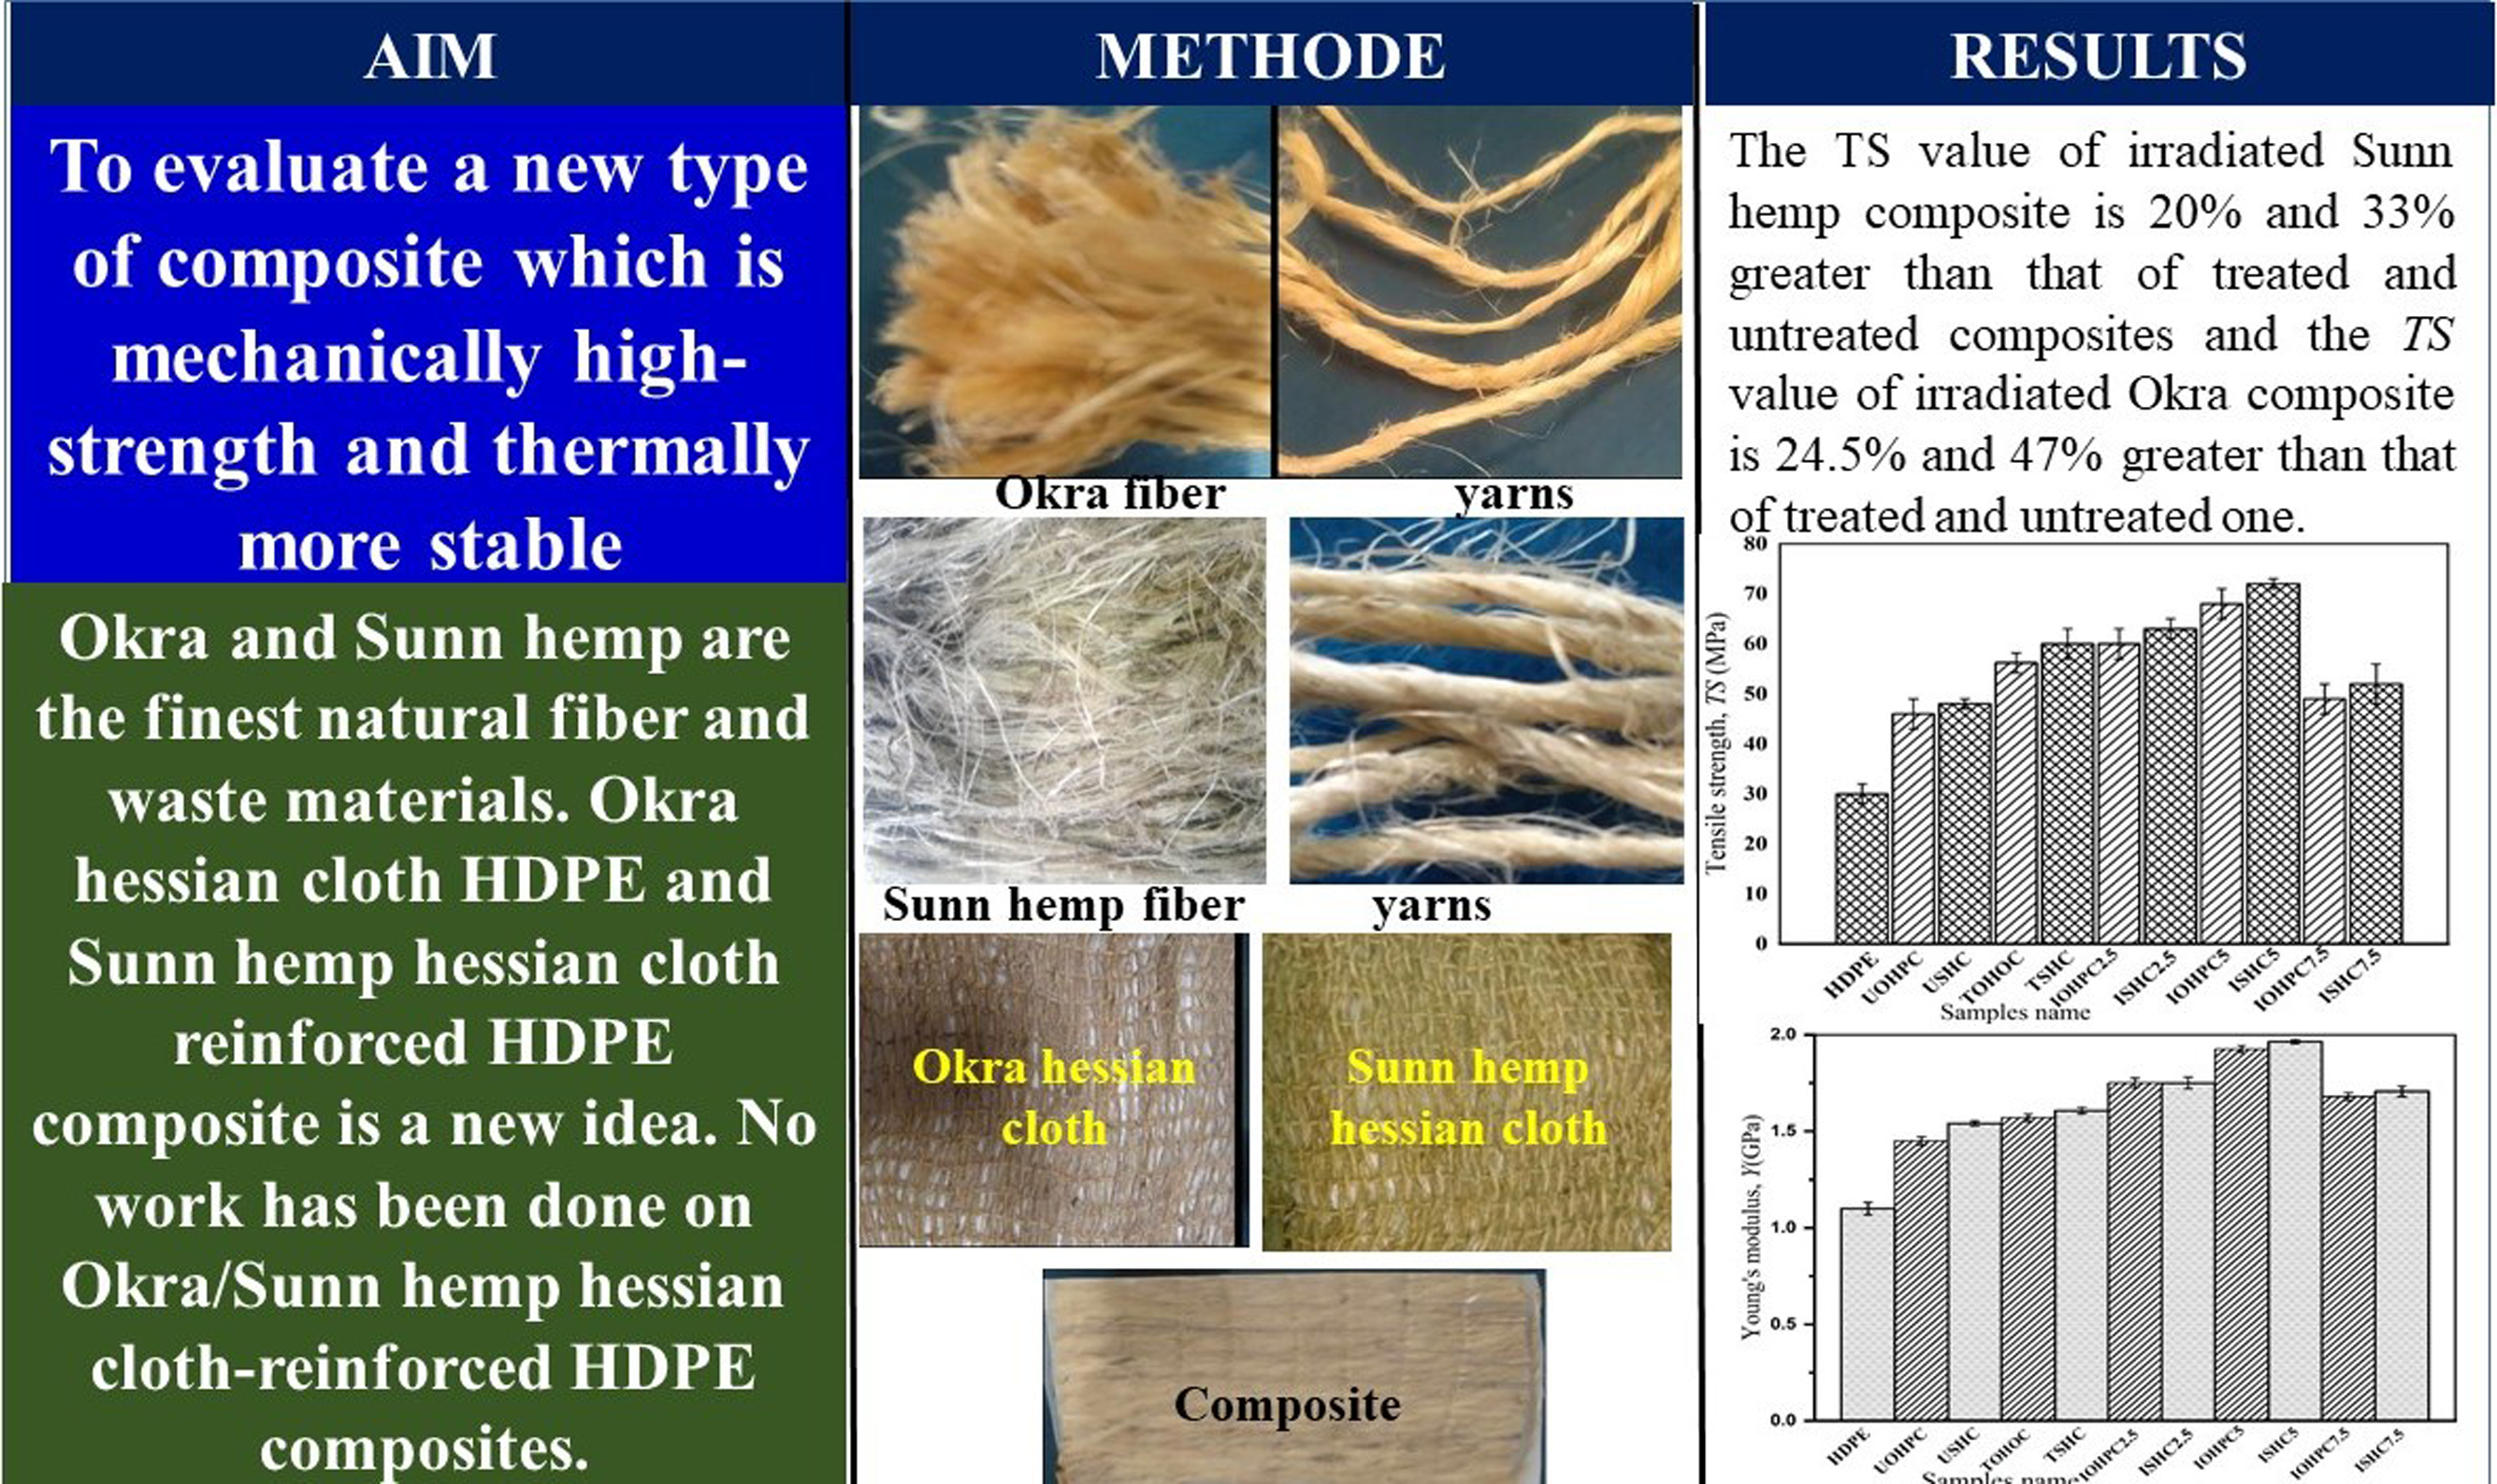
Okra hessian cloth and Sunn hemp hessian cloth were prepared and treated with 5, 10, and 15 wt% alkali solutions for 1 h. The optimized concentration of alkali is 10 wt%. The untreated and treated hessian cloths reinforced high-density polyethylene (HDPE) composites were then prepared using the compression molding method. Alkali-treated, and 55 wt% fiber contents reinforced composites showed improved mechanical properties among 40, 45, 50, 55, 60, and 65 wt% fiber contents composites. 55 wt% fiber contents reinforced composites were then irradiated under gamma-ray at doses 2.5–7.5 kGy at the rate of 6 kGy/h. According to the X-ray diffraction analysis results, only alkali-treated Okra reinforced, and Sunn hemp-reinforced HDPE composites had higher crystallinity values than untreated and irradiated composites. Surface micrographs showed that the Okra-HDPE and Sunn hemp-HDPE had better matrix and fiber attachment. Cross-linking between the two varieties of fibers and matrix was seen using Fourier-transform infrared (FTIR) spectroscopy. Both irradiated composites exhibited greater hydrophobicity in their water intake characteristics compared to untreated and alkali-treated composites. The tensile strength (TS) value of Sunn hemp composite for 5 kGy gamma-ray irradiation dose is 68 MPa, which is 14% and 42% higher than that of treated and untreated composites, respectively. For comparison, the TS value for 5 kGy dose irradiated Okra composite is 66 MPa, which is 17% and 44% higher than that of treated and untreated composites, respectively. Young’s modulus (Y) values of irradiated Okra composite and irradiated Sunn hemp composite showed higher values than that of other composites. Both irradiated composites have better thermal and structural characteristics than untreated and alkali-treated composites.
Introduction
Polymer is an essential material in today’s world. Scientists in different countries have done and are still doing a lot of research on its various properties. 1 There are many thermoplastic polymers, such as polyethylene, polystyrene, polypropylene, and polyvinyl chloride. High-density polyethylene (HDPE) is a kind of thermoplastic polymer that arises from petroleum. Among all types of thermoplastic polymers, HDPE is one of the most widely used thermoplastic materials. HDPE’s crystalline density, chemical resistance, and stiffness are higher than other thermoplastic materials, but their permeability is low. 2 It can be recycled and remolded when heated up. Moreover, it is available in the local market. With the reinforcement of fibers with HDPE, the strength of composites increases, showing better performance. Glass fiber is widely used as a reinforcing material with HDPE. Glass fiber-reinforced HDPE composites have high mechanical strength and high-temperature resistance. 3 But, the glass fiber-reinforced HDPE composites seriously threaten the environment. So, researchers have to look for alternative fiber to reduce the use of glass fiber. Therefore, scientists have taken new steps to use other fibers, which will be alternatives to glass fiber and will not harm the environment. 4 One such fiber is natural fiber. This natural fiber does not cause any detriment to the environment; it gets destroyed after a certain period. Natural fiber-reinforced HDPE composites are some of the most advanced materials fabricated today. These materials have a significant role in the manufacturing of high-performance parts in various industries, including aerospace, automotive, and marine industries. Natural fiber-reinforced HDPE composites are stronger, lighter, and have excellent mechanical, thermal, and chemical properties. The use of these composites can reduce the cost of manufacturing due to their versatility. These composites have also gained popularity due to their excellent durability, high stiffness, and heat resistance. 5
Bangladesh is an agricultural country. That is why agriculture is the mainstay of this country’s economy. Sunn hemp is an annual shrub cultivated as a multipurpose legume, especially for its fine fiber in many countries. 6 Sunn hemp fibers get ready in 90–100 days and are usually harvested after they flower. After harvesting, the sunn hemp stalks are tied into bundles and underwater in soft running water for 7 days. Sunn hemp fibers are extracted from the sunn hemp plant by hand, and the extracted fibers are further washed with fresh water and allowed to dry on bamboo poles. Then, the threads are ready for composite manufacturing in the present investigation. Sunn hemp fiber contains 70–90% cellulose, 18–22% hemicellulose, 3–5% lignin, and 0.95% pectin. 7
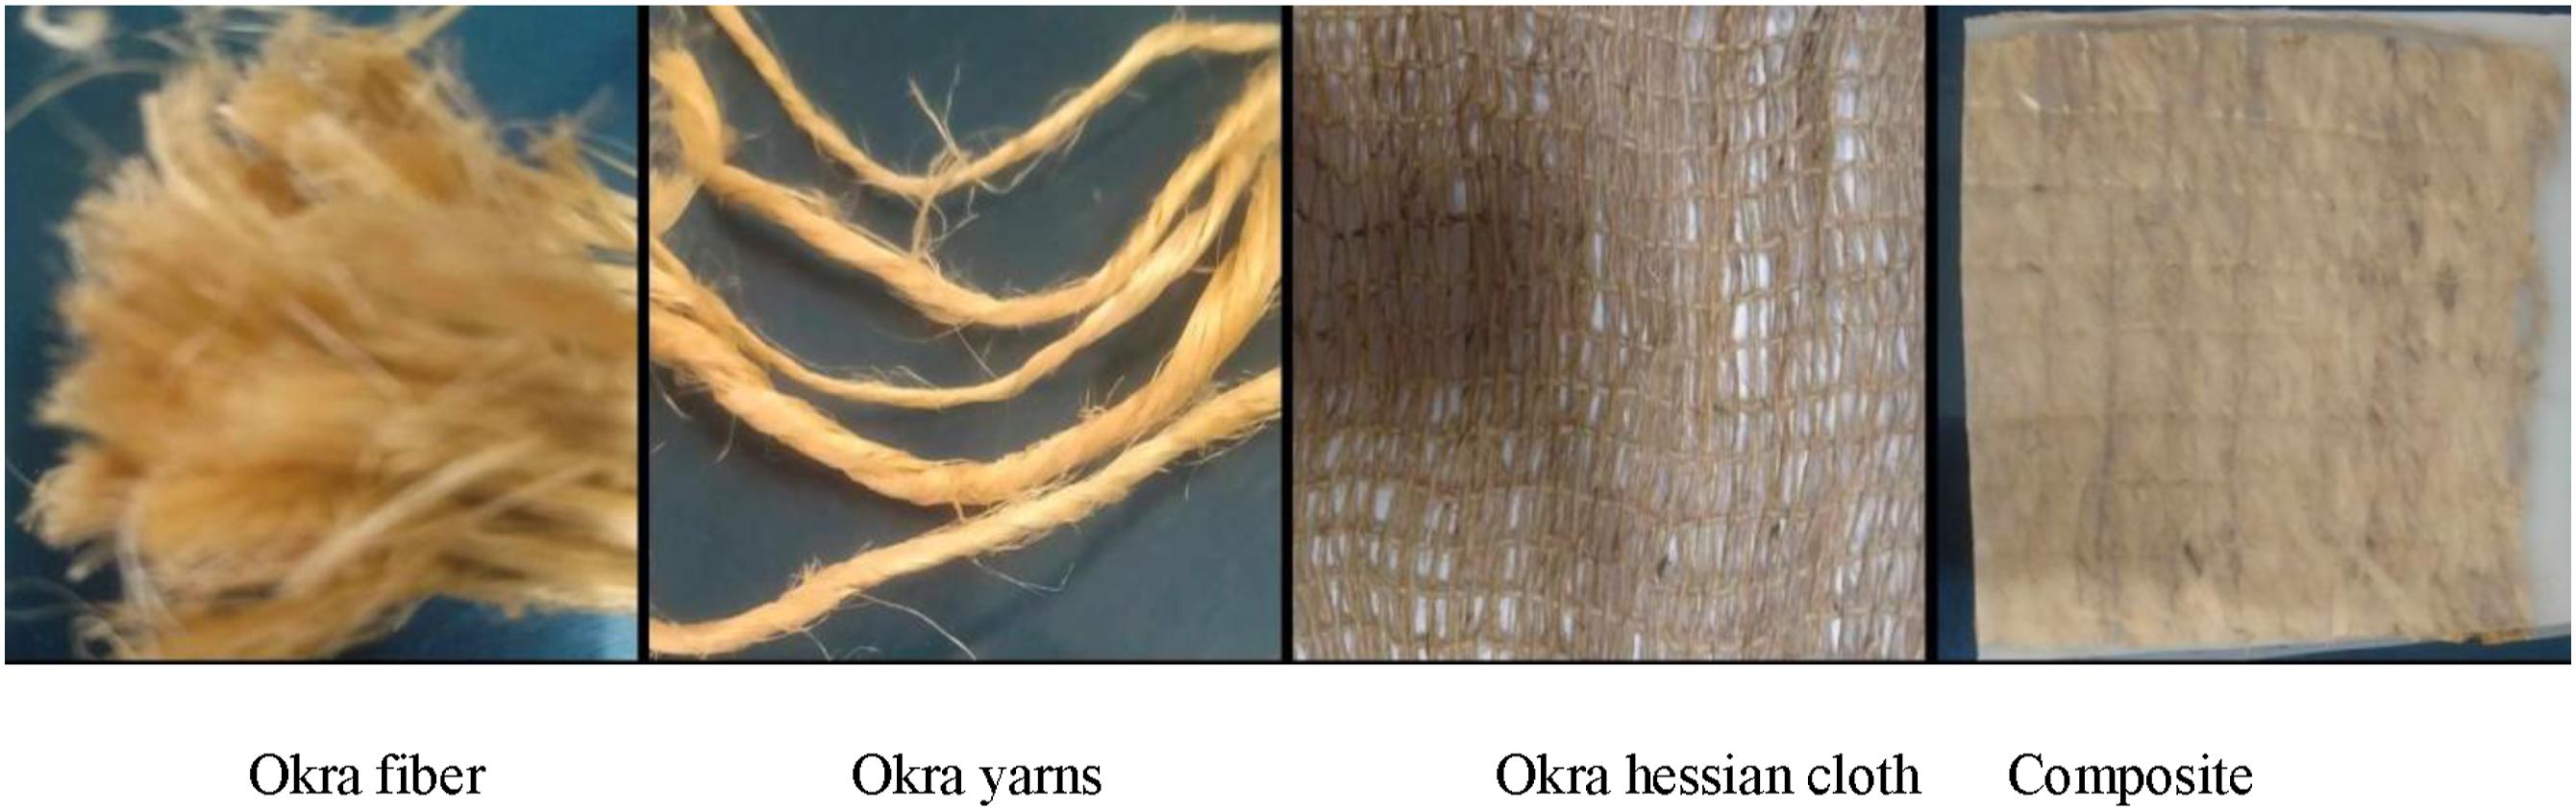
On the other hand, okra fiber is cultivated in Bangladesh, India, Nigeria, Mali, China, Cameron, etc. The color of this fiber is excellent, like jute and mesta fibers. The mechanical strength of Okra fiber is higher than that of jute. 8 The Okra fiber contains 67.5% α-cellulose, 15.4 % hemicellulose, 7.1% lignin, 3.4% pectin matter, 3.9% fatty and waxy matter, and 2.7% aqueous extract. It also contains β-carotene and xanthophyll.9,10
The discrepancy in the mechanical and physical properties of Okra and Sunn hemp natural fibers depends on geographic origin, climate change, and growth conditions. These fibers contain hydroxyl groups in their structure, and poor wettability and low moisture resistance make them tenacious for fiber-matrix adhesion and proper reinforcement.10,11 So, for better fiber-matrix adhesion, we have to improve the surface structure and surface energy of the fibers by physical and chemical treatments, such as alkali treatment, which will improve the fiber-matrix adhesion and enhance the material and mechanical properties of Sunn hemp and Okra -based thermoplastic composites. On the other hand, physical treatments by ionizing radiation such as gamma-ray can introduce better surface cross-linking between natural fiber and matrix by reducing the hydrophilicity of the Sunn hemp and Okra fibers. 12
Researchers have already done extensive research on Sunn hemp, Okra, and other natural fibers-reinforced polymer composites.13,14 Because of different manufacturing techniques and chemical treatments, the fiber-reinforced polymer composites can significantly improve mechanical and some other properties.12–14 A few works have been done on the okra or Sunn hemp fiber-reinforced HDPE composites, but no work has been done on Okra hessian cloth or Sunn hemp hessian cloth-reinforced HDPE composites. The foremost goal of this research work is to observe the structural, mechanical, and thermal properties of Sunn hemp hessian cloth-HDPE thermoplastic composite and Okra hessian cloth-reinforced HDPE composites after chemical treatments of these cloths by sodium hydroxide and physical treatments of composites by gamma-ray irradiation. We expect that the physical characteristics, mechanical strength, and degradation temperatures of Sunn hemp hessian cloth and Okra hessian cloth-reinforced HDPE thermoplastic composite will exhibit enhanced properties. 15
Experimental
Materials
High-density polyethylene
High-density polyethylene (HDPE) granules were purchased from the local market in Bangladesh and are a product of (Guangzhou Zhongshan Trading Co., Ltd) China. These materials were used without any more purification. The density of HDPE can range from 0.93 to 0.97 g/cm3.
Sunn hemp fiber and okra fiber
Sunn hemp and Okra fibers were collected from Gopalpur, Tangail, Bangladesh. The green Sunn hemp and Okra plants were bundled, comprising 15–20 plants. These bundles were then immersed in water for 10 days for 7–12 days. The fibers were then detached carefully from the pulp and washed again and again with water to remove mud and sand. After washing the fiber, it was exposed to sunlight in long bamboo strands for 3 days. After making yarn separately from both fibers, the weaving technique was followed to prepare Sunn hemp and Okra hessian cloth.
Sodium hydroxide
Sodium hydroxide (NaOH) is a product of Merck, Germany, and was purchased from the local market of Bangladesh.
Methods
Sunn hemp hessian cloth and Okra hessian cloth
Figures 1 and 2 show the steps to prepare hessian cloths from Sunn hemp fiber and Okra fiber, respectively. After making the yarn from these fibers, the yarns are strained strongly in a row parallel to each other at equivalent distances on a bamboo frame. Then, different yarns are drawn vertically and closely with the parallel yarns to make hessian cloth. Process for manufacturing USH cloths and their composites with HDPE. Process for manufacturing UOH cloths and their composites with HDPE.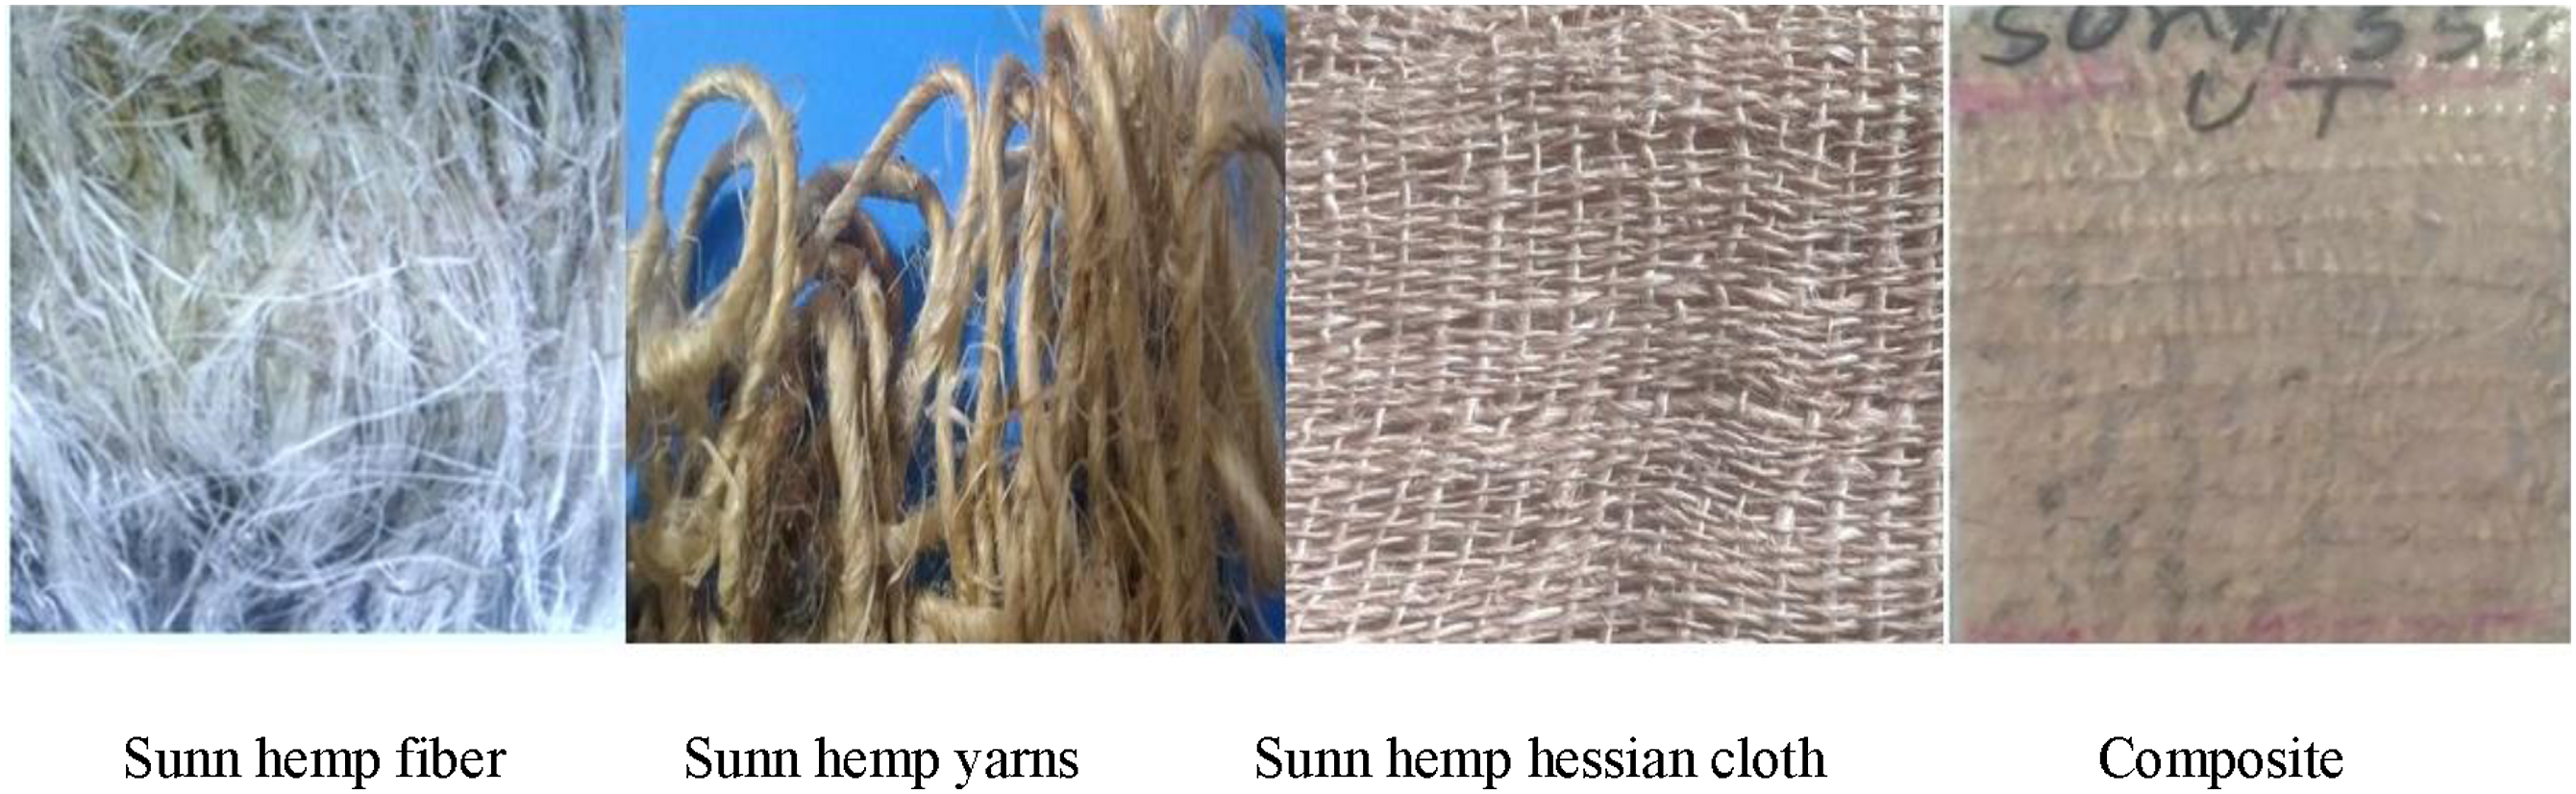
Chemical treatments of sunn hemp and okra hessian cloths
Raw or untreated Sunn hemp hessian cloth and Okra hessian cloth are abbreviated as USH and UOH cloths, respectively. The USHs and UOHs were treated with 5, 10, and 15 wt% sodium hydroxide solution for 1 h and washed with water at 60°C to remove impurities.
16
Due to different concentrations of alkali treatment, the weight loss observed for Sunn hemp and Okra hessian cloths is shown in Figure 3. Comparatively less weight loss of USH than UOH cloths was observed due to alkali treatment, which is due to the greater impurity contents in Okra fiber than Sunn hemp fiber and higher percentages of cellulose in Sunn hemp fiber.
17
Then, they were dried in sunlight to remove moisture for 2 days. After alkali treatment, the treated Sunn hemp hessian cloths and Okra hessian cloths are named as TSH and TOH cloths, respectively. The treated TSH and TOH cloths were then reserved in an evacuated dissector until use. Just before the preparation of the composite, they were also dried in an oven at about 70°C for 1.5 h to remove moisture from the fiber. Analysis of weight loss caused by alkali treatment.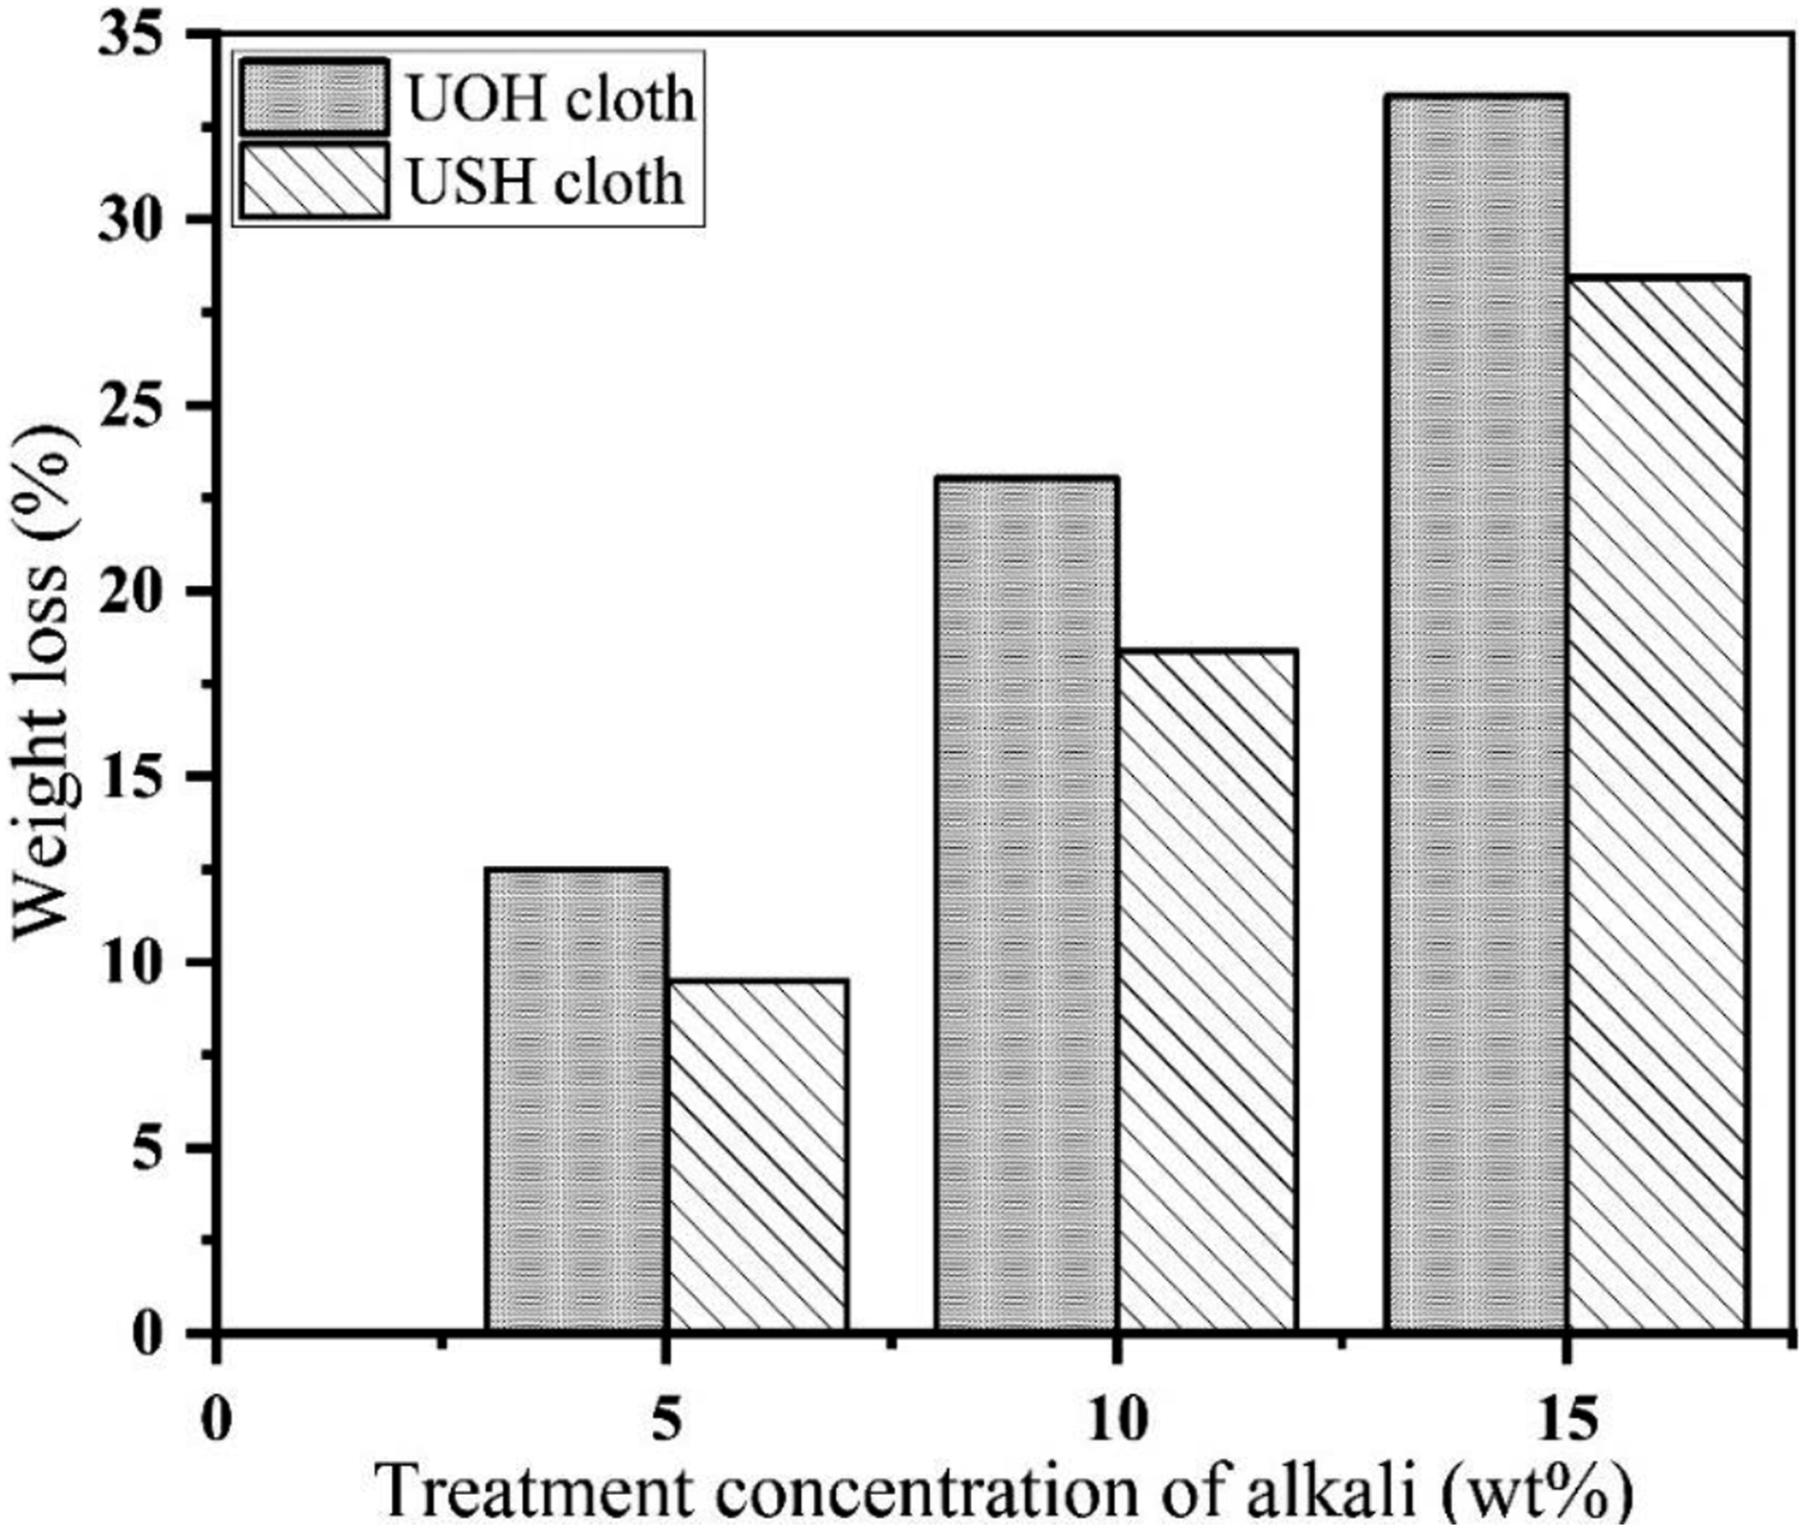
Fabrication of composites and optimization of fibers content
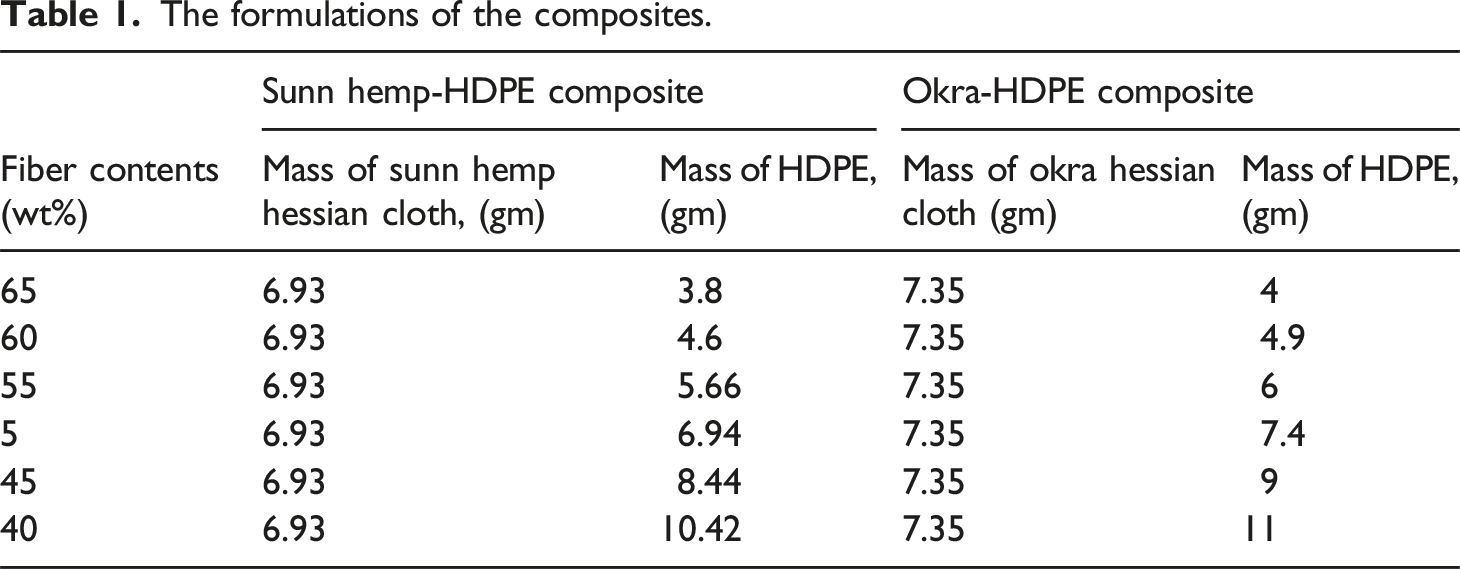
The formulations of the composites.
Characterization
X-ray diffraction
X-ray diffraction (XRD) of the samples was performed by an X-ray diffractometer (Panalytical Corporation, Almelo, Netherlands), which produced monochromatic CuKα radiation with the generator functioning at a current of 40 mA and a voltage of 40 kV. Equation (1) was used to find the percentage of crystallinities of HDPE, UOH cloth, TOH cloth, USH cloth, TSH cloth, UOHPC, USHPC, TOHPC, TSHPC, IOHPC5, and ISHPC5 that were calculated by the following formula.20,21 I
c
= Integrated intensity of crystalline diffraction pattern I
a
= Integrated intensity of crystalline amorphous diffraction pattern

Field emission scanning electron microscopy
A field emission scanning electron microscope (FESEM) at an accelerating voltage of 15 kV (SUPRA 55VP, Carl ZEISS, Oberkochen, Germany) was used to study the interfacial adhesion between the HDPE and fiber in the composites. Before this study, USH cloth, UOH cloth, TSH cloth, TOH cloth, UOHPC, USHPC, TOHPC, TSHPC, IOHPC5, and ISHPC5 samples were pre-coated with a platinum layer (purity, 99.99%) to eliminate electron charging by ion splitting. Samples were taken after measuring tensile strength.
Fourier-transformation infrared (FT-IR) spectroscopy
An FTIR spectrometer (Nicolet 6700 MAGNa-IR, Thermo Scientific, Germany) was used to analyze the functionality of HDPE, USH cloth, UOH cloth, TSH cloth, TOH cloth, UOHPC, USHPC, TOHPC, TSHPC, IOHPC5, and ISHPC5 using the standard ATR in the wave number range of 650 cm−1 to 4000 cm−1.
Water intake
The samples UOHPC, USHPC, TOHPC, TSHPC, IOHPC5, and ISHPC5 were immersed in a bath of 30°C for up to 40 h at 5-h intervals to observe water intake (WI) properties. Before being submerged in water, the samples were dried at 50°C for 24 h; the dried weight was W
i
. After each period, the samples were removed from the water, and their final weight (W
f
) was measured. The values WI of the samples were calculated using the formula below.
23

Mechanical testing of composites
The composites underwent mechanical testing by ASTM 638-08 (Model: AG-1) by a universal tensile testing machine with a load of 5 kN. The cross-head speed was 10 mm/min, and the gauge length was 30 mm. Tensile strength (TS) and Young’s modulus (Y) measurements were performed on three samples from each series.
23
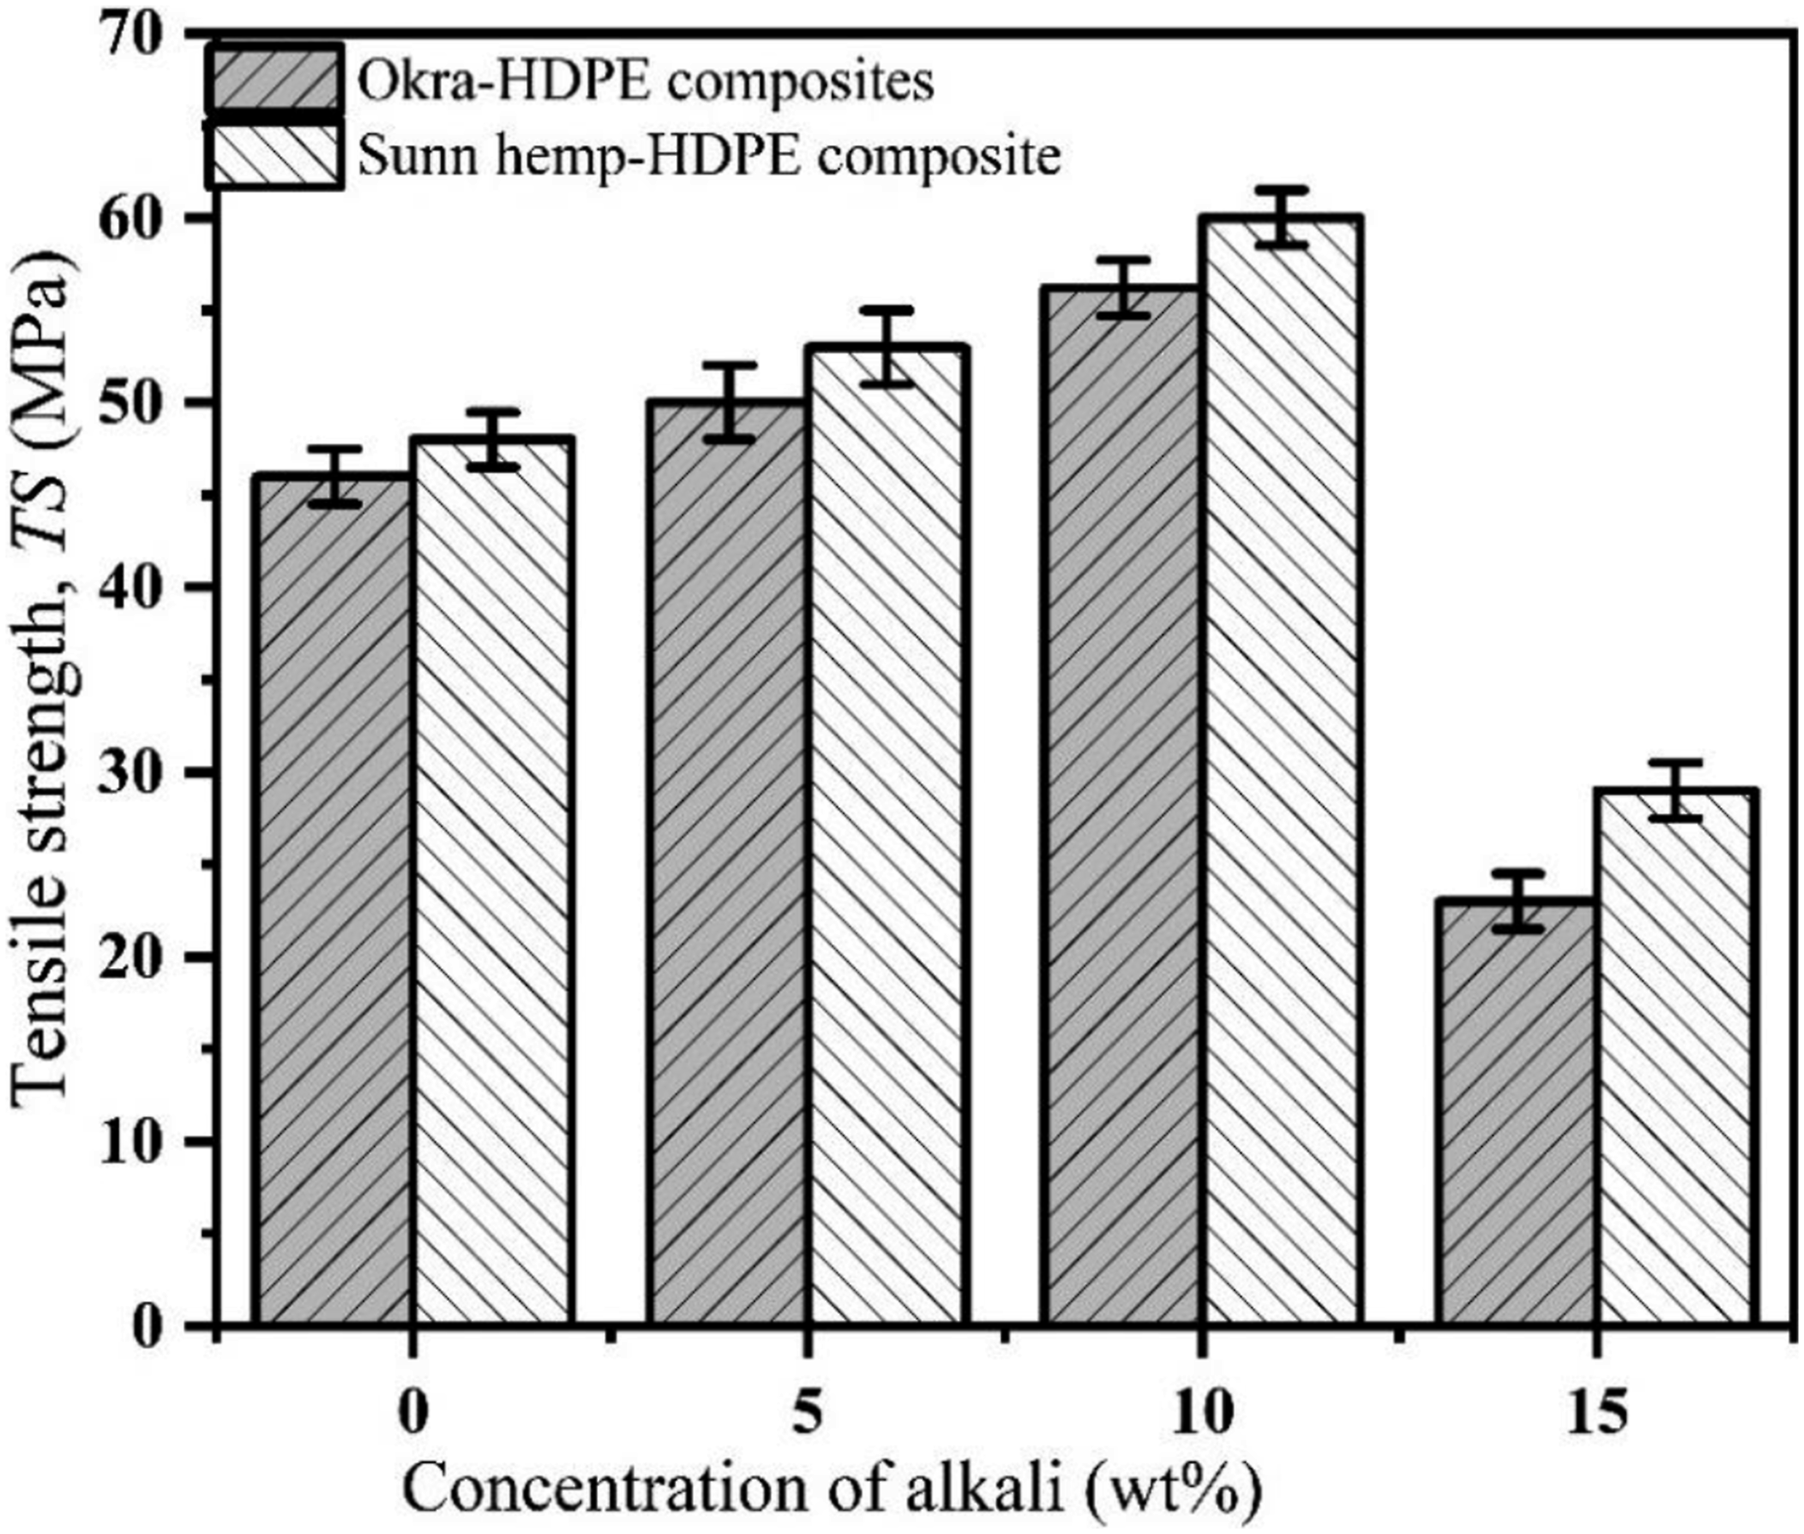
The mechanical strength of untreated composites with 40, 45, 50, 55, 60, and 65 wt% fiber contents were measured and the optimized fiber content was found to be 55 wt% while the TS value was the highest. The mechanical strength of 5, 10, and 15 wt% alkali-treated composites were tested to determine the optimum concentration of alkali. The results are shown in Figure 4. 10 wt% alkali-treated composites demonstrated higher mechanical strength as compared to 5 and 15 wt% alkali-treated composites. So, the optimum concentration is 10 wt%. The optimized fiber content and alkali concentration are obtained from Figures 4 and 5. Optimization of the fiber contents. Optimization of the alkali concentration.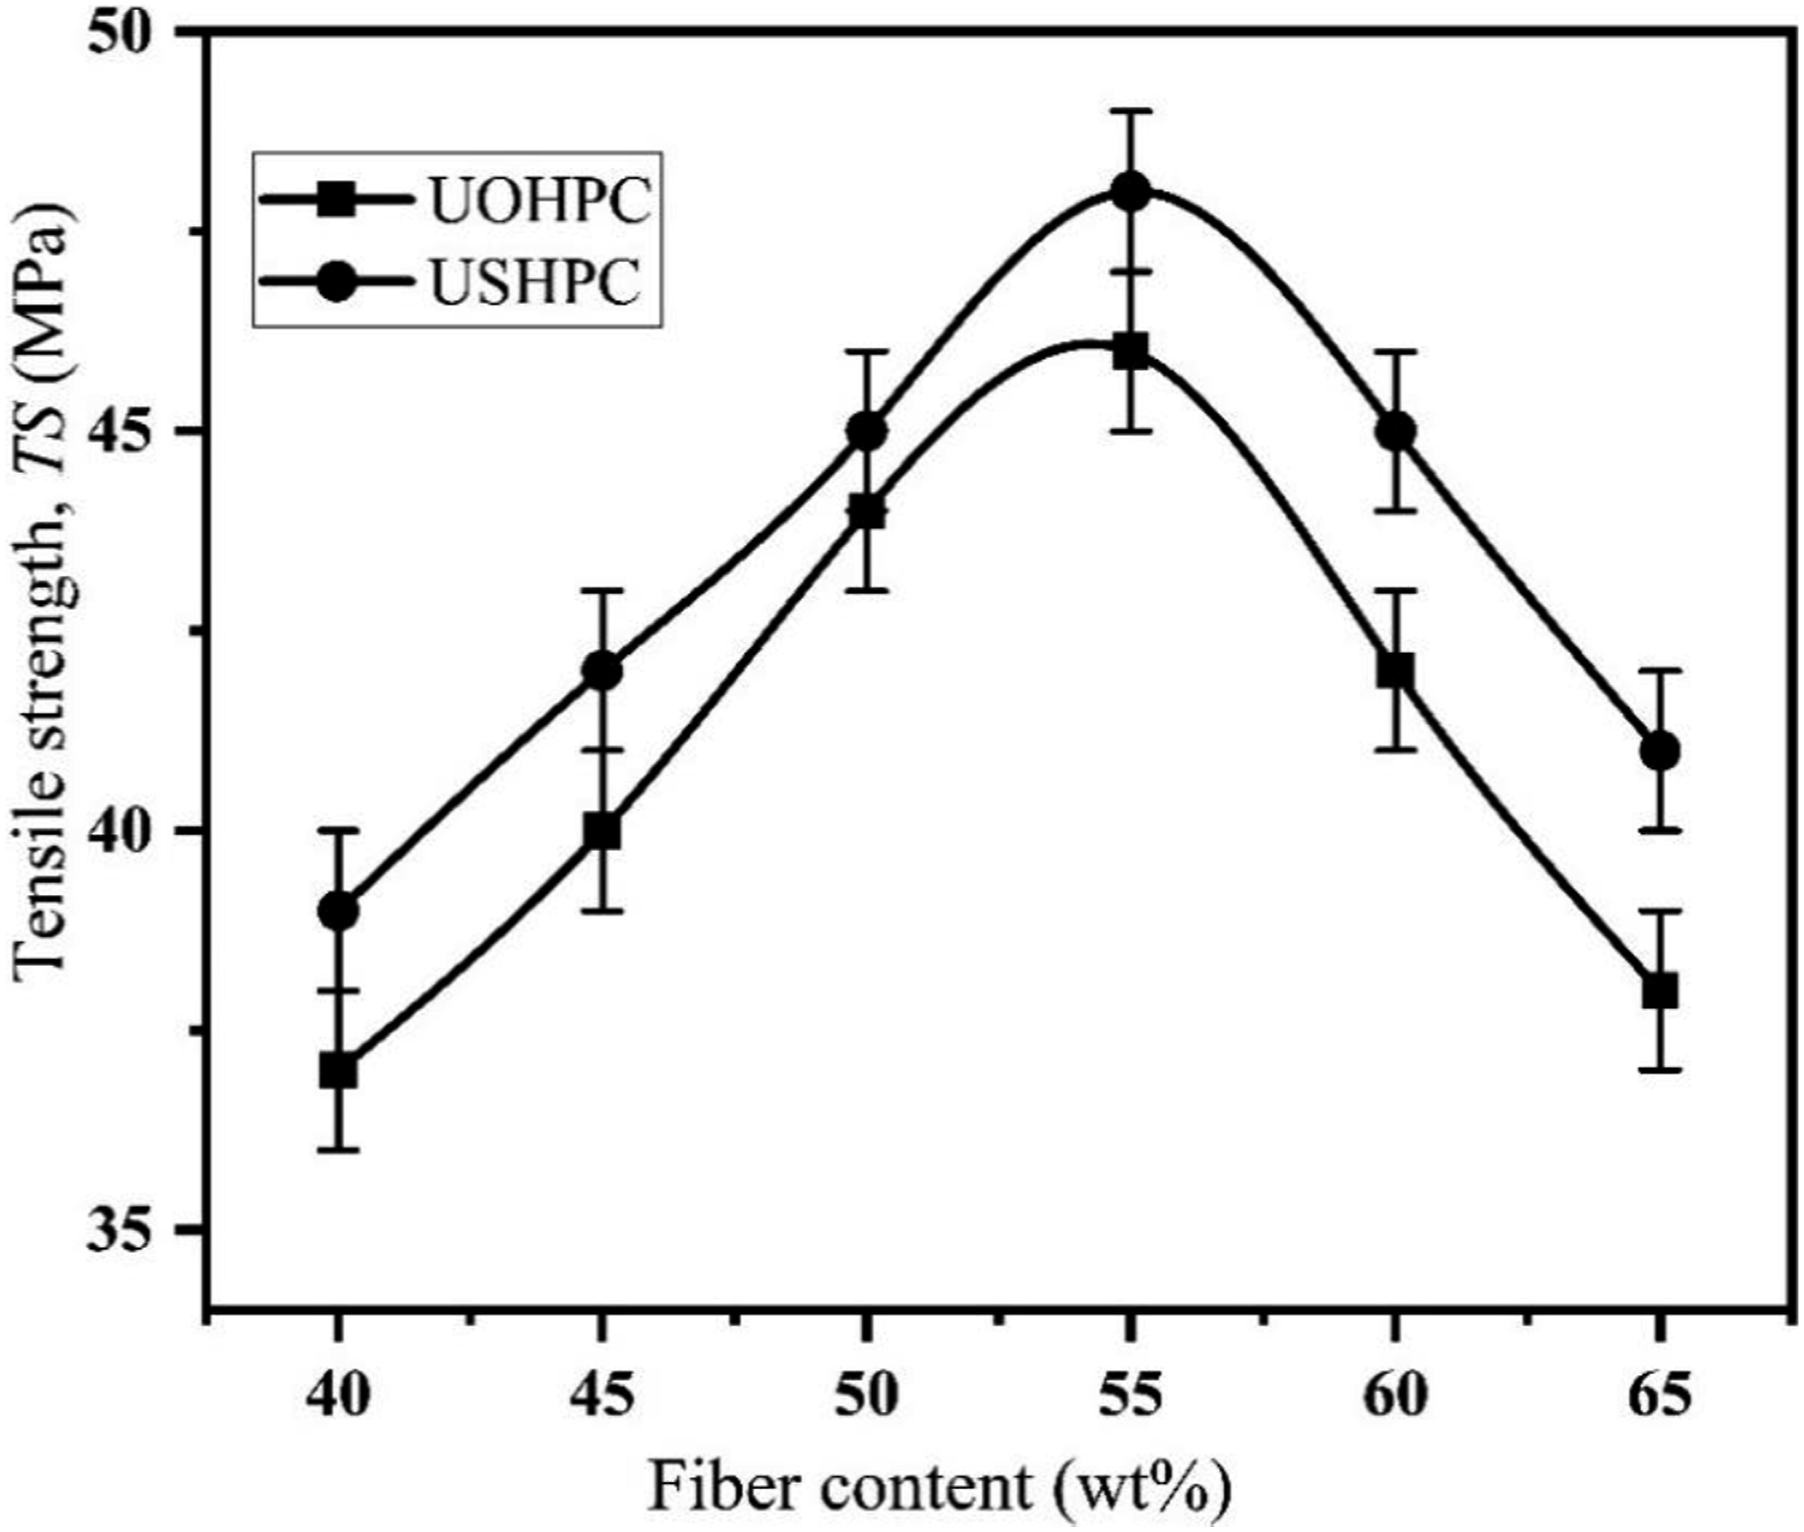
Differential scanning calorimetry
The melting temperature of the samples were identified and evaluated using differential scanning calorimetry (DSC) utilizing a TA/Q1000 system under a nitrogen atmosphere. All test samples were dried at 90°C for 7 h before the measurements. The samples were first heated at 27–600°C with a heating rate of 20°C min−1 to monitor calorimetric characteristics in the nitrogen atmosphere before being used to monitor DSC.
Thermogravimetric analysis
To ascertain the weight loss of the samples at various temperatures, thermogravimetric measurements were done using a TGA Q500 V6.4, Germany, in a nitrogen environment and a platinum crucible (flow rate of 60 mL/min with a heating rate of 20°C/min). The samples were scanned in a temperature range between 25 and 600°C. 24
Results and discussion
XRD analysis of sunn hemp and okra-reinforced HDPE composites
Figure 6 displays the XRD patterns of the USH, TSH, UOH and TOH cloths with two main reflection peaks at (002) and (101), respectively. The XRD patterns of both USH and TSH cloths have two prominent intensity peaks at Bragg’s angles of 23.2° and 16.6°, respectively. These peaks are attributed to the presence of pure cellulose embedded with a small amount of non-cellulosic amorphous components, such as lignin, hemicellulose, pectin, etc.25,26 Alkali treatment is seen to increase the intensity of the (002) and (101) reflection peaks, demonstrating the removal of non-cellulosic amorphous components from the fiber. Equations (1) were used to determine the samples’ crystallinity and Table 2 lists the results. Because of the alkali treatment, it is evident that the crystallinity of TSH cloth increased by 8.34% compared to USH cloth. However, the XRD pattern of UOH cloth shows two strong peaks at 2θ = 23.28 and 16.5° that are associated with the reflection planes (002) and (101), respectively. The position of 2θ for the identical planes occurs at 22.96 and 16.25° as a result of the fiber’s alkali treatment. Table 2 contains the samples’ crystallinity. 20% more crystallinity is observed in TOH cloth compared to UOH cloth. Furthermore, it is seen that alkali treatment enhances the intensity of both the TOH (002) and (101) reflection peaks, demonstrating the removal of non-cellulosic amorphous components from the fiber. The alkali treatment (10 wt%) partially eliminates the amorphous portion of the fiber and causes more cellulose molecules to group together to form higher crystallinities.
27
XRD patterns of UOH, USH, TOH and TSH cloths. Data of XRD at the highest peak.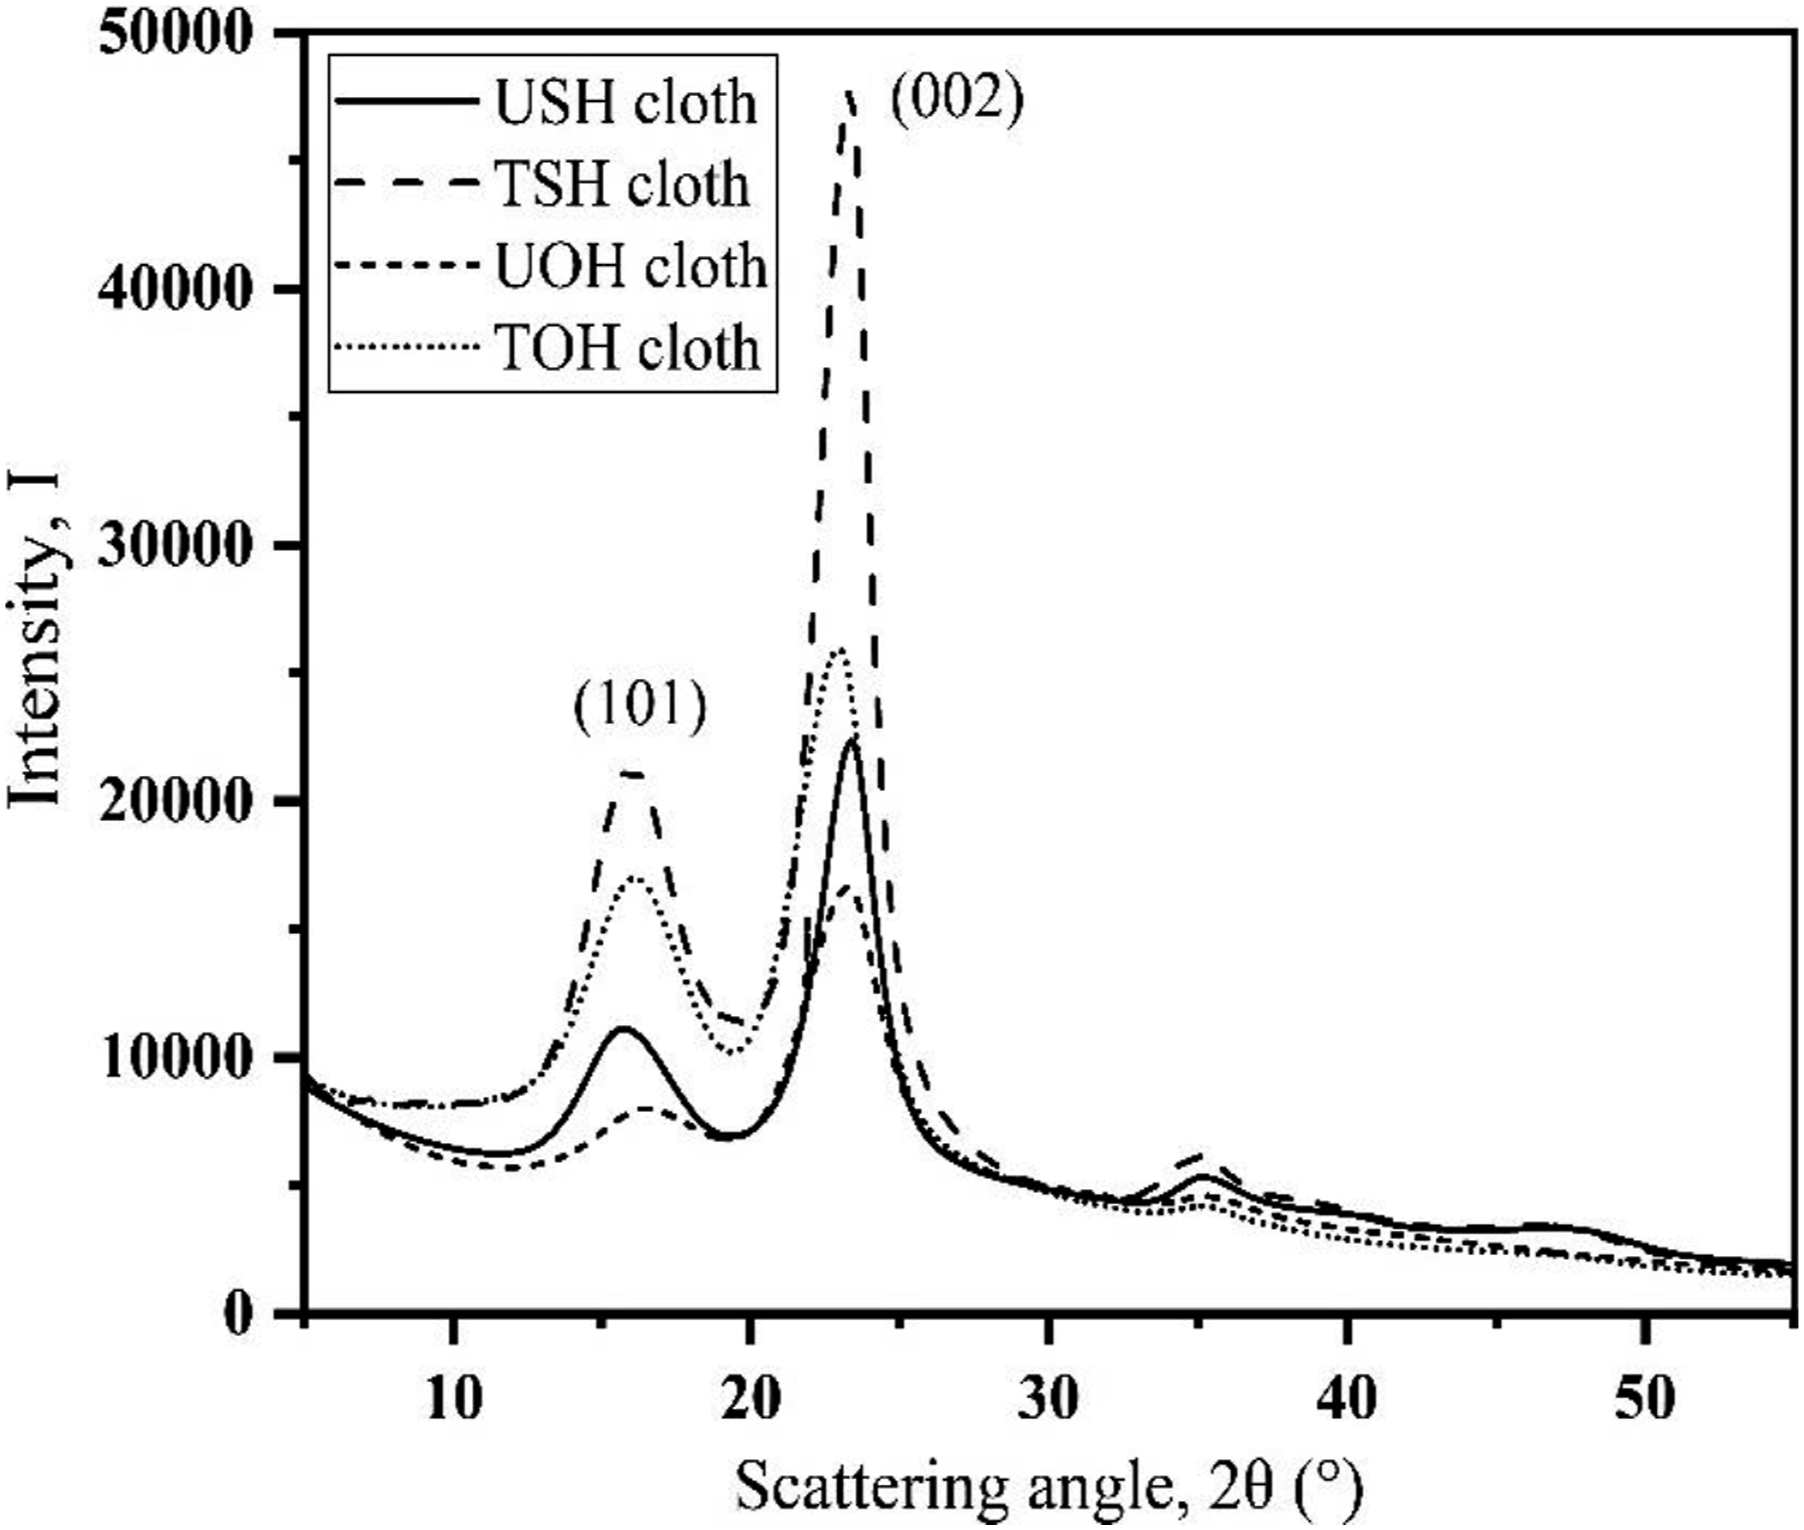
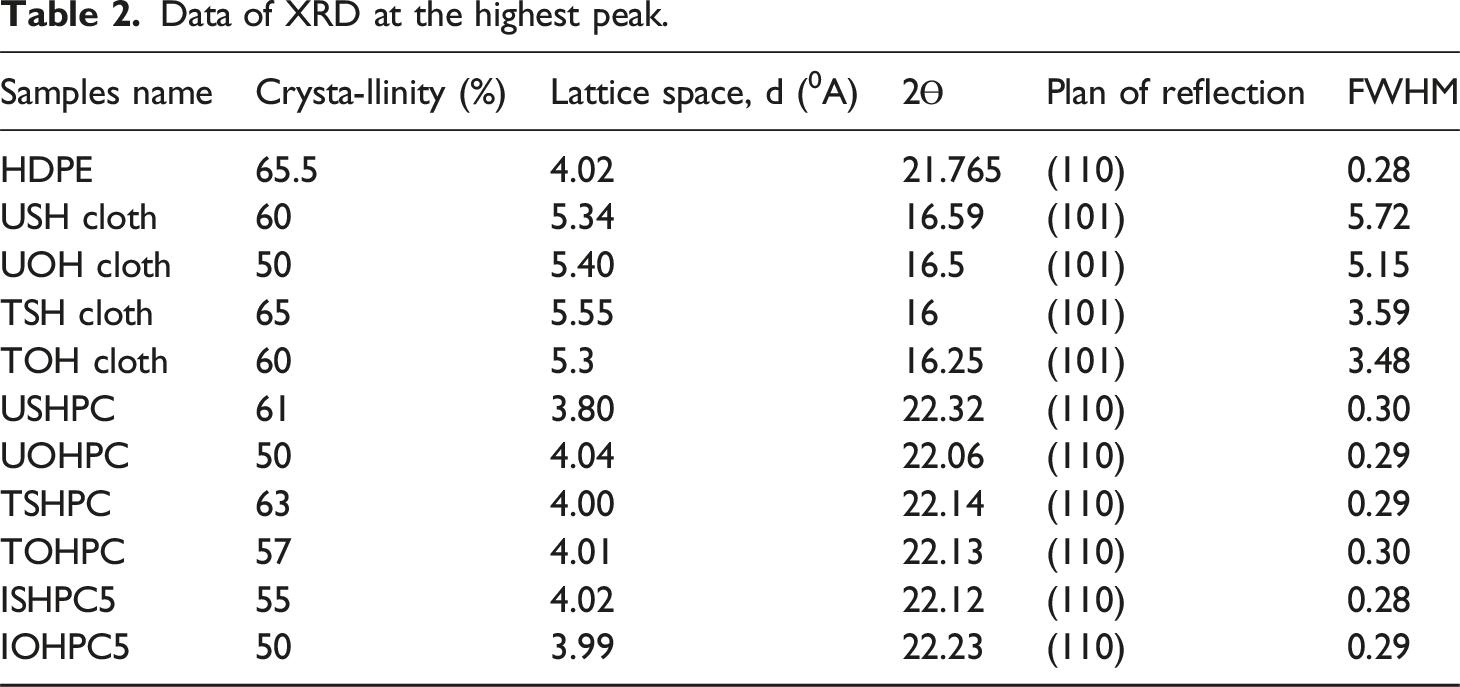
For HDPE, at 21.8° and 24.16°, which correspond to lattice spacing of 4.20 and 3.69, respectively, two distinct (110) and (200) reflection peaks are both very strong. According to the results of the analysis, pristine HDPE has a 65% crystallinity orthorhombic structure. The results are very close to the published ones.
28
Among USHPC, TSHPC, and ISHPC5, the intensity of (110) and (220) reflection peaks is higher for the treated sample. It is shifted to the right side more than HDPE, which indicates that lattice contraction occurs and also indicates higher crystallinity than others (Figure 7). The treated fiber composites (TSHPC) had an increased crystallinity of 3.3% as compared to USHPC, which may suggest higher periodicity and a preferred crystal orientation. However, the data in Table 2 suggest that ISHPC5’s reduced crystallinity, which may be due to gamma-ray irradiation, as gamma-ray can cause to breakdown of bonding and to form a network structure in the irradiated sample.
29
Furthermore, because of the alkali treatment, the crystallinity of TOHPC is 14% greater than that of UOHPC and IOHPC5 for okra hessian cloth-reinforced composites. This may indicate that the treated fiber composites (TOHPC) show more periodicity and favored crystal orientation. XRD patterns of (a) HDPE, (b) UOHPC, (c) USHPC, (d) TOHPC, (e) TSHPC, (f) IOHPC5, and (g) ISHPC5.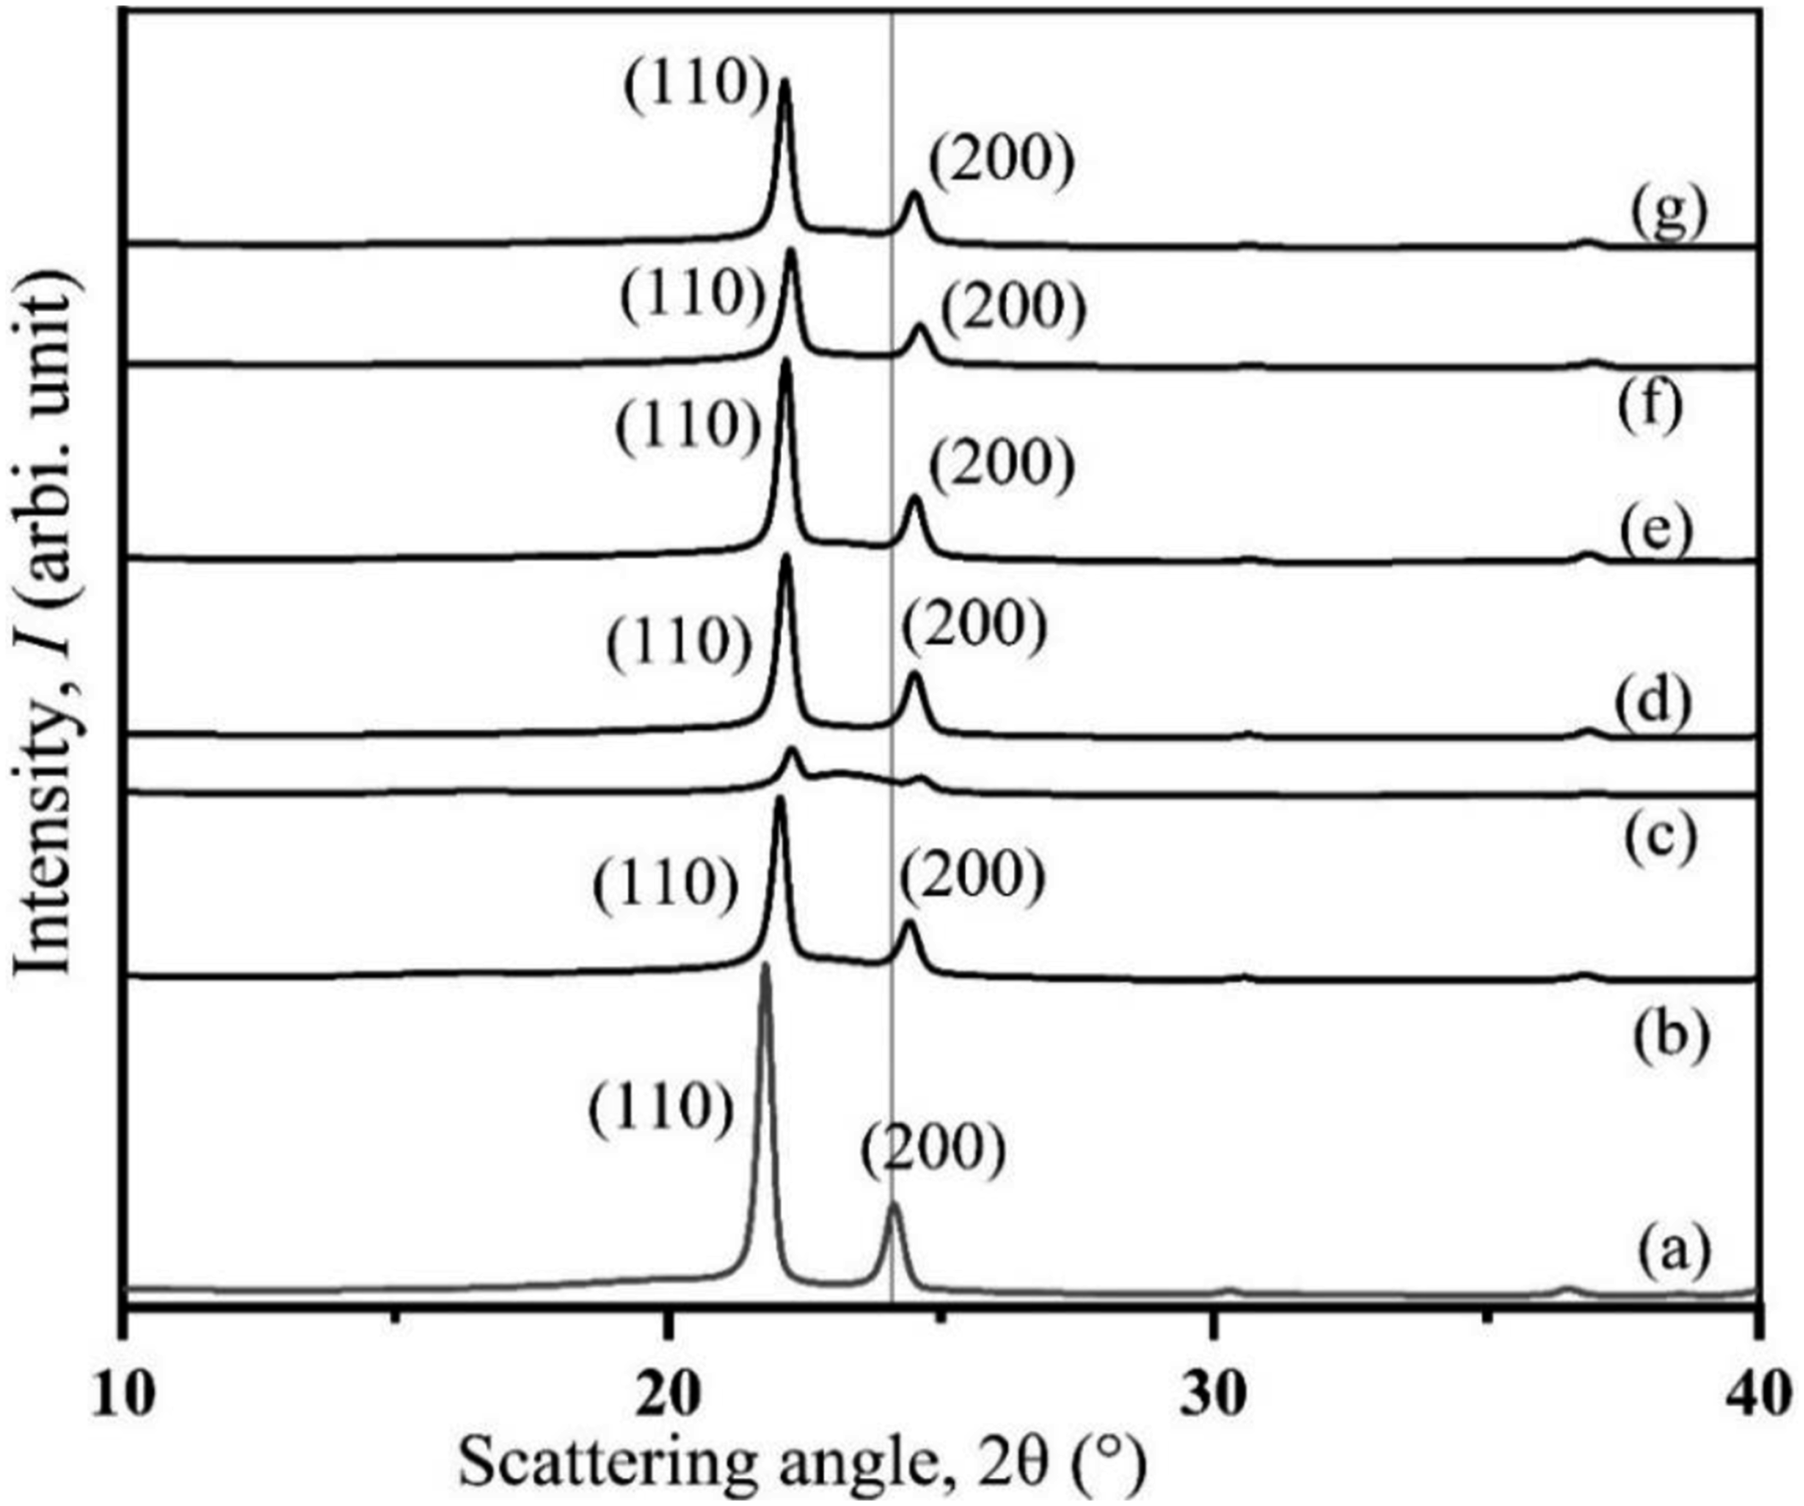
The intensity of the (110) and (200) reflection peaks are also stronger for the TOHPC sample, and the position of 24° in the UOHPC, TOHPC, and IOHPC5 is shifted to the right side compared to HDPE, which suggests that lattice contraction occurs (Figure 7). IOHPC5 and ISHPC5 have lower crystallinities than those of TOHPC and TSHPC samples, respectively. This may be a result of gamma-ray irradiation. 28 Although the crystallinity of the sample decreases by gamma-ray irradiation in one hand, the network (bonding) structure increases due to irradiation on the other. As a result, the mechanical strength increases, even though the modulus decreases due to the decrease of crystallinities. Here, the contribution of more network structure for the increase of modulus prevails over the contribution of crystallinity for the decrease of modulus.
Surface morphology
FESEM was used to examine the surface morphology of the fracture surface after the tensile test. The bundles of UOH, USH, TOH, and TSH cloth fiber are shown in Figure 8. UOH (Figure 8(a)) and USH (Figure 8(b)) cloth fiber had a smooth, compact surface that was covered in a gray coating of visible imperfections.
30
There were many openings visible on the fiber surface of 10 wt% alkali-treated TOH and TSH cloth fiber samples. When the fibers were treated with an alkali, most of the surface impurities containing lignin, hemicellulose, and wax were partially removed from the crystalline part of the cellulose materials. As a result, fibers become rough. Therefore, the wettability of the polymer with fiber increases due to the roughness of the surface. So, after alkali treatment, the mechanical strength of both types of fibers may develop by reinforcing with HDPE in the composites.
31
Figure 9(a)–(f)). shows the FESEM micrographs of UOHPC, USHPC, TOHPC, TSHPC, IOHPC5, and ISHPC5, respectively, which are taken from their fracture surfaces after tensile tests. A lot more fiber breaks are seen in the cases of TOHPC and TSHPC, while UOHPC and USHPC exhibit noticeably fewer fiber breaks, and a lot more fibers are randomly pulled out of the HDPE matrix in the composites. The matrix appears to stick to the fibers in Figure 8(e) and (f) even after they have detached. The gamma-ray irradiated samples IOHPC5 and ISHPC5 have significantly smoother surfaces than the others, and only fiber break is observed according to the micrograph of the sample. FESEM micrographs of the fractured surface of (a) UOH, (b) USH, (c) TOH, and (d) TSH cloths. FESEM micrographs of the fractured surface of (a) UOHPC, (b) USHPC, (c) TOHPC, (d) TSHPC (e) IOHPC5, and (f) ISHPC5.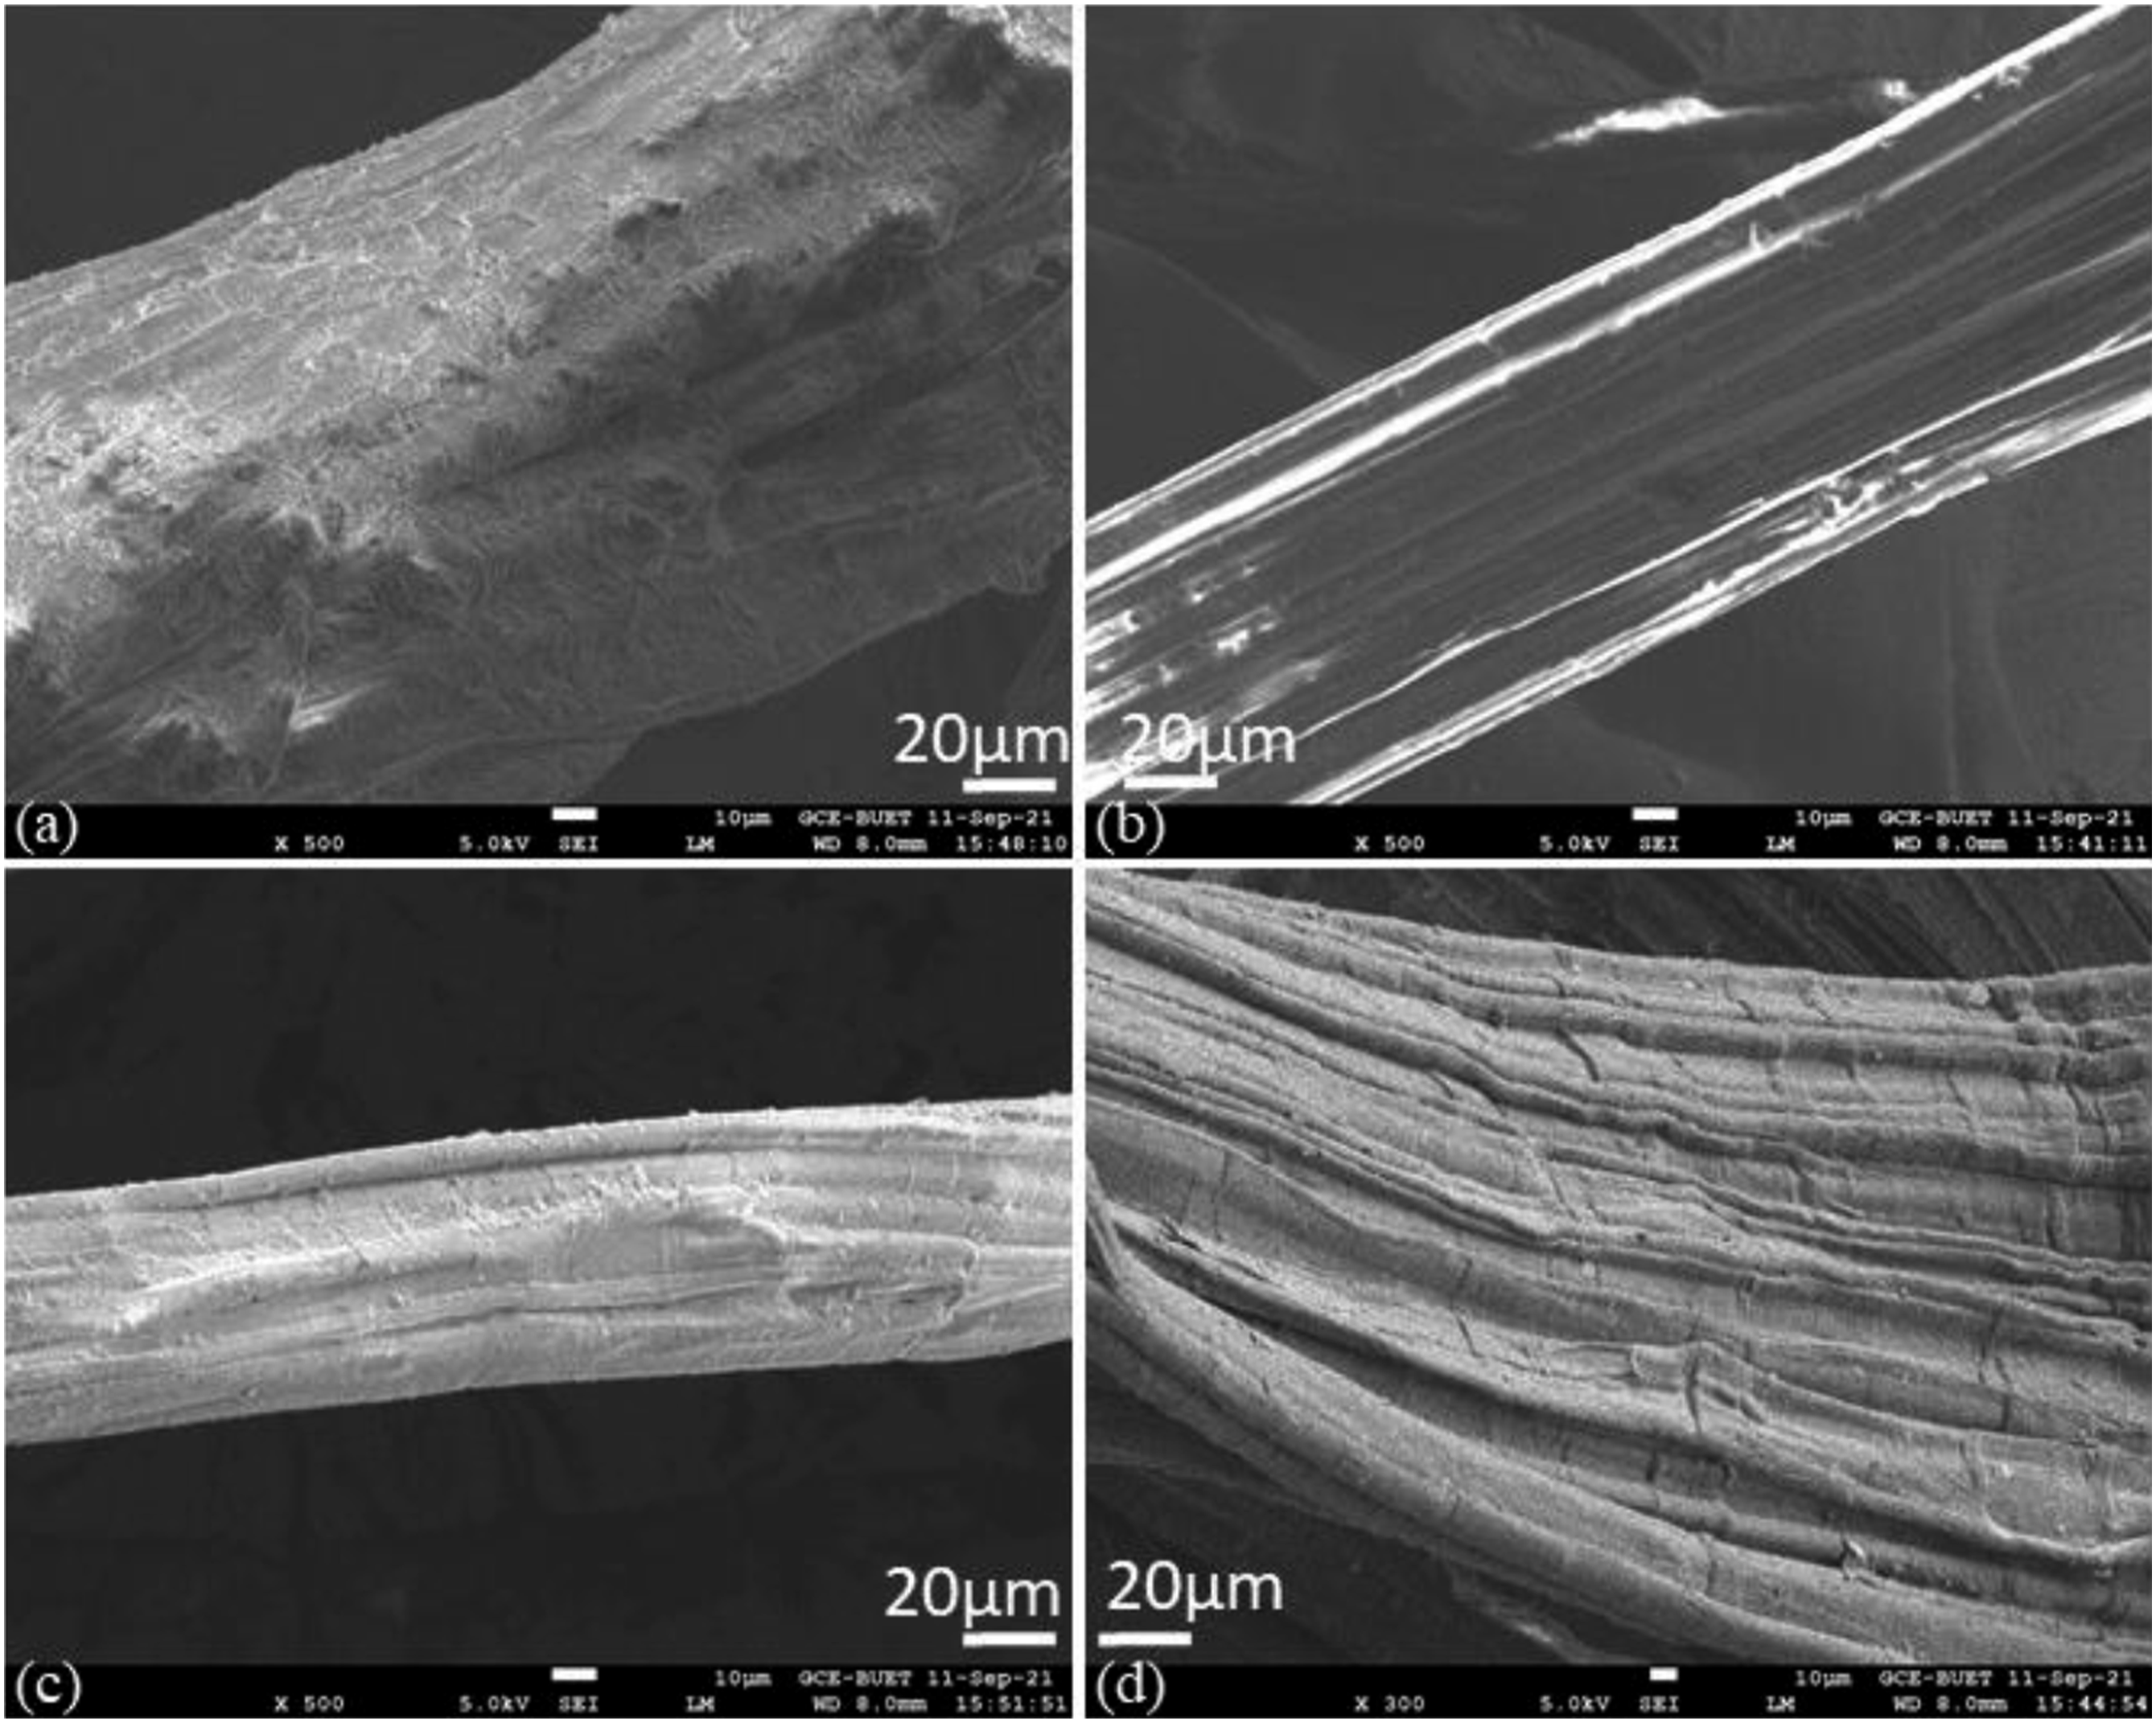
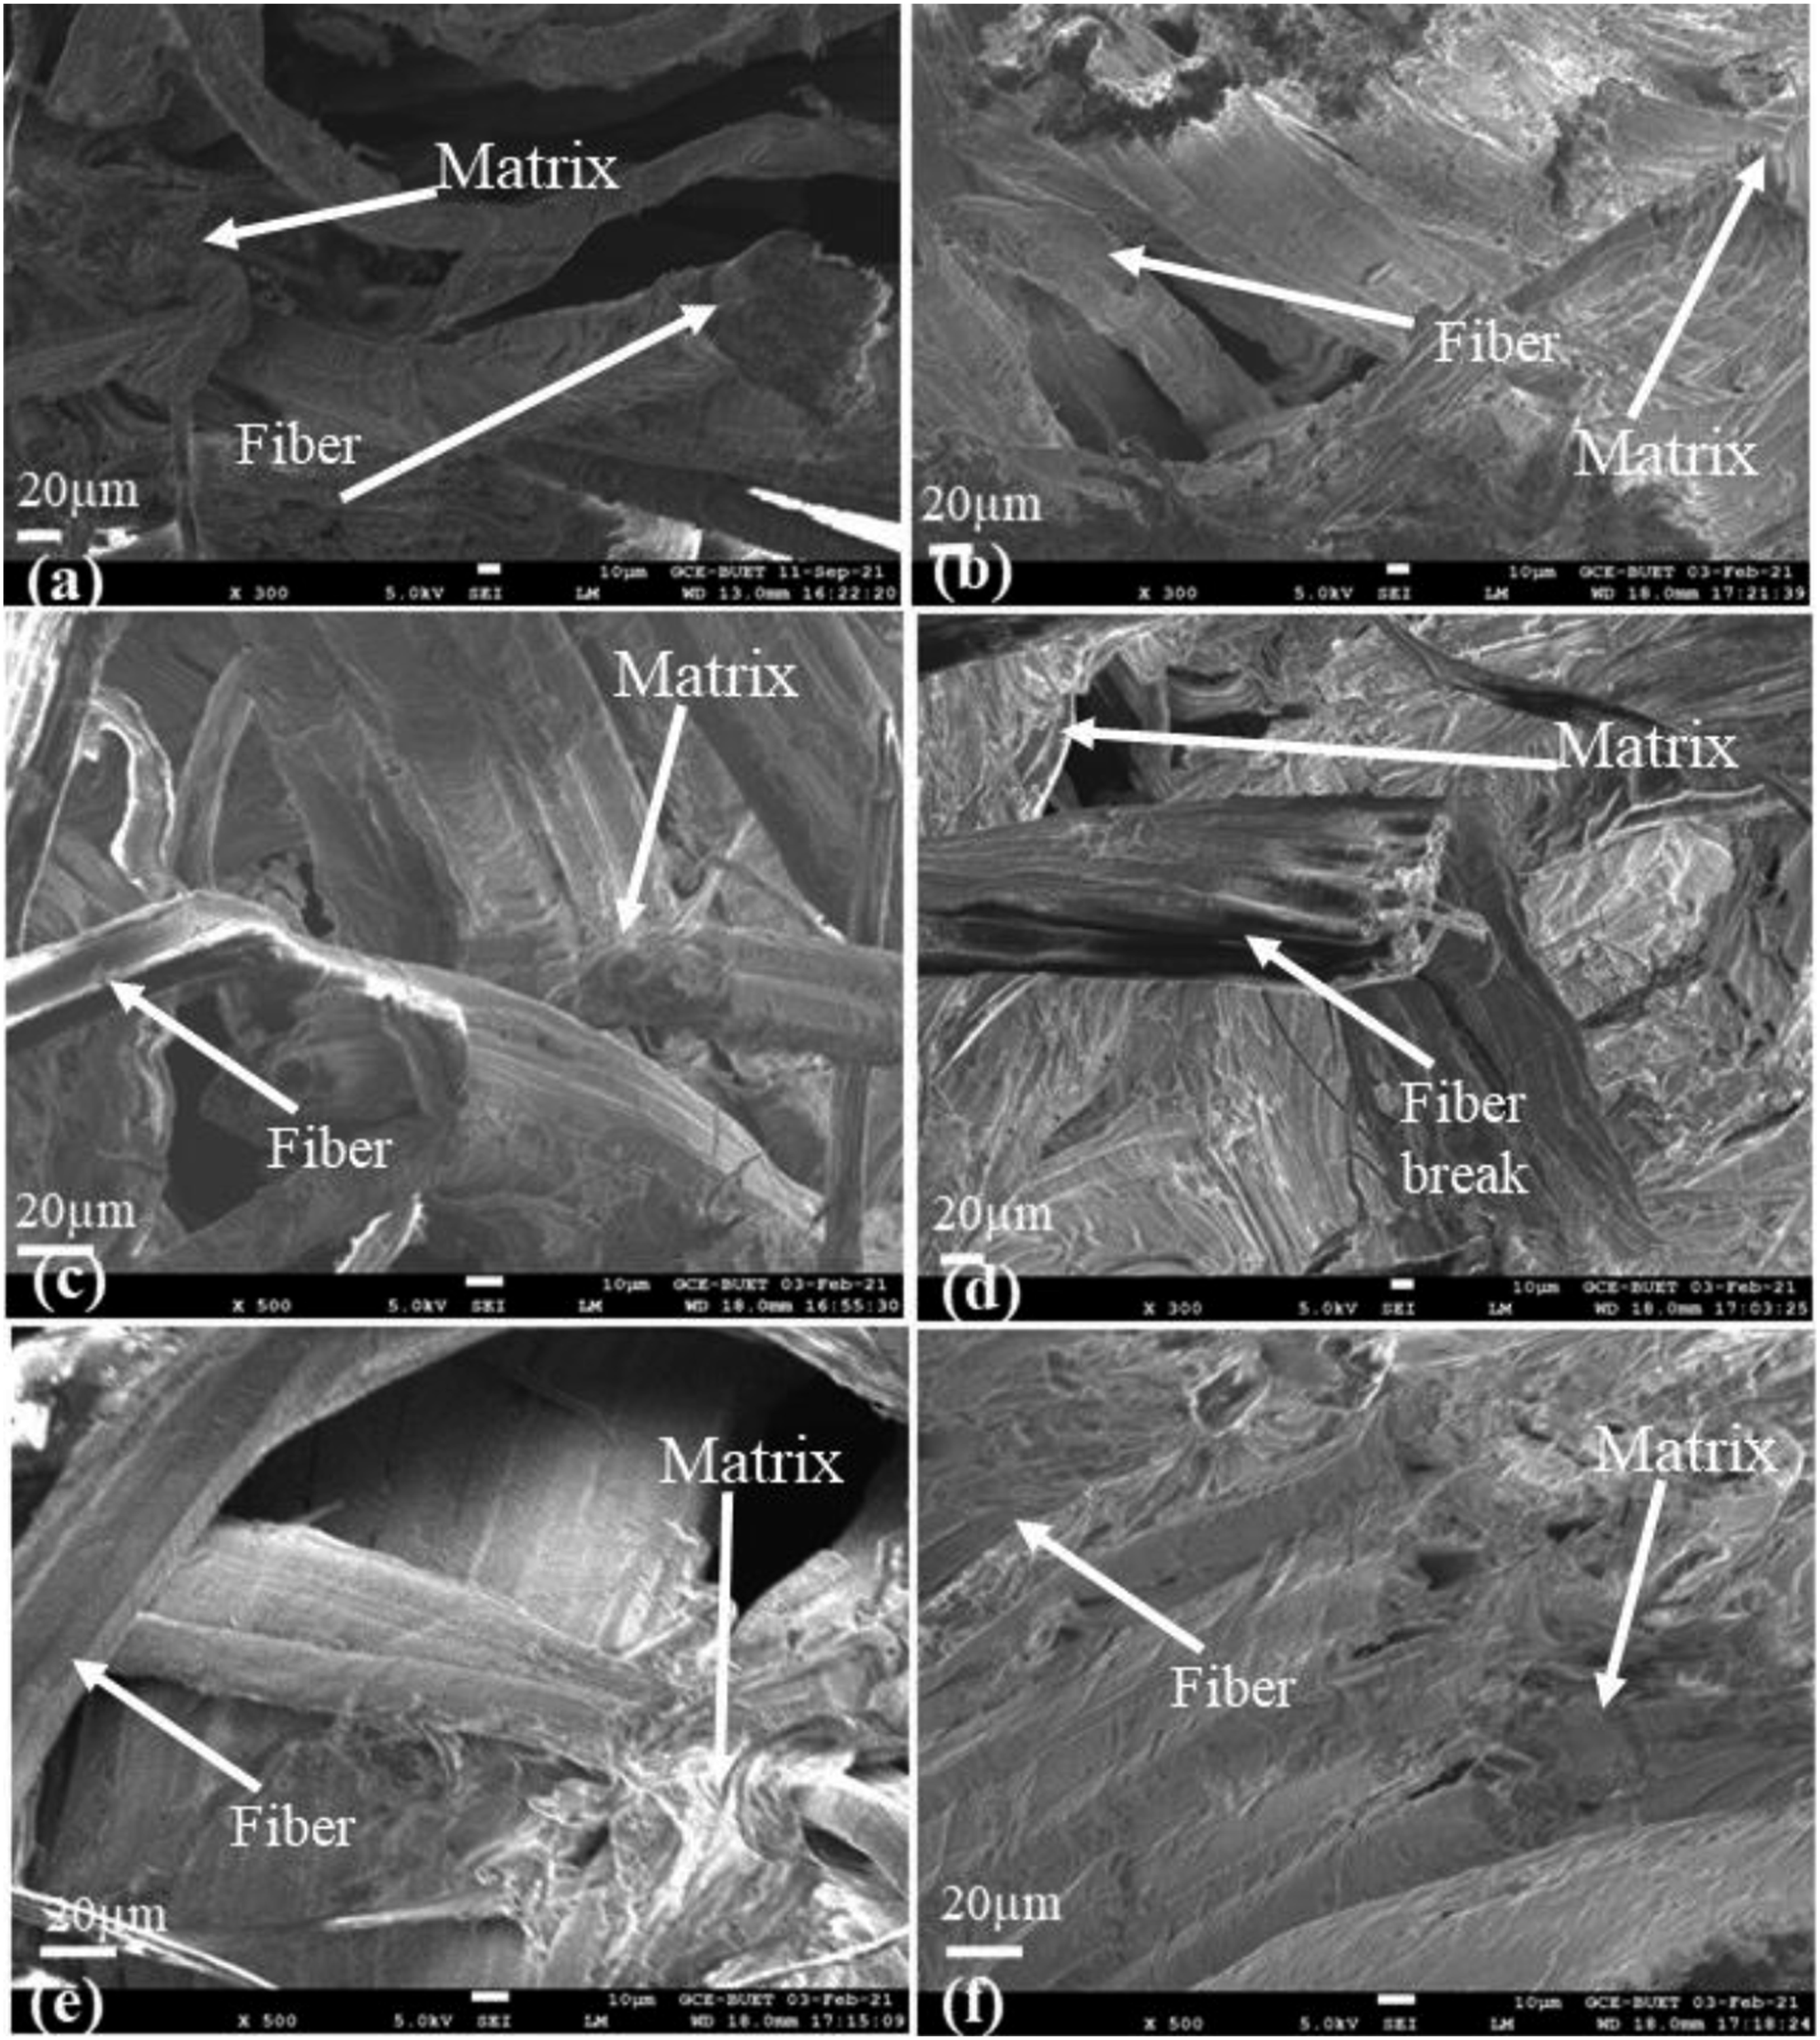
The untreated composites contain lignin, hemicellulose, cellulose, and other impurities. Therefore, fiber pullout is observed from the fracture surface of untreated composites. After alkali treatment, the fiber contains fewer impurities than untreated composites. So, fiber break is observed due to the improved interaction between fiber and matrix by alkali treatment. The composites increased cross-linking between fiber and matrix due to gamma-ray irradiation. 32
FT-IR analysis
Figure 10 shows FT-IR spectra of both UOH and USH cloths having band at 3324 cm−1, indicating -OH stretching for the alkanes group.
31
However, after alkali treatment, for TOH and TSH cloths, this band is reduced and sharp, indicating the removal of hemicellulose due to the decrease of the functional group -OH stretching.
28
A minor peak at 2965 cm−1 for UOH, USH, TOH, and TSH cloths was ascribed to the C-H stretching.33,34 The peak at 1728 cm−1 specifies C=O stretching in acetyl groups of hemicelluloses. There was no peak at 1741 cm−1 for the alkali-treated Okra fiber and a reduced peak for treated Sunn hemp fiber, which indicated the partial removal of hemicelluloses.
35
FTIR of (a) UOH, (b) USH, (c) TOH, and (d) TSH cloths.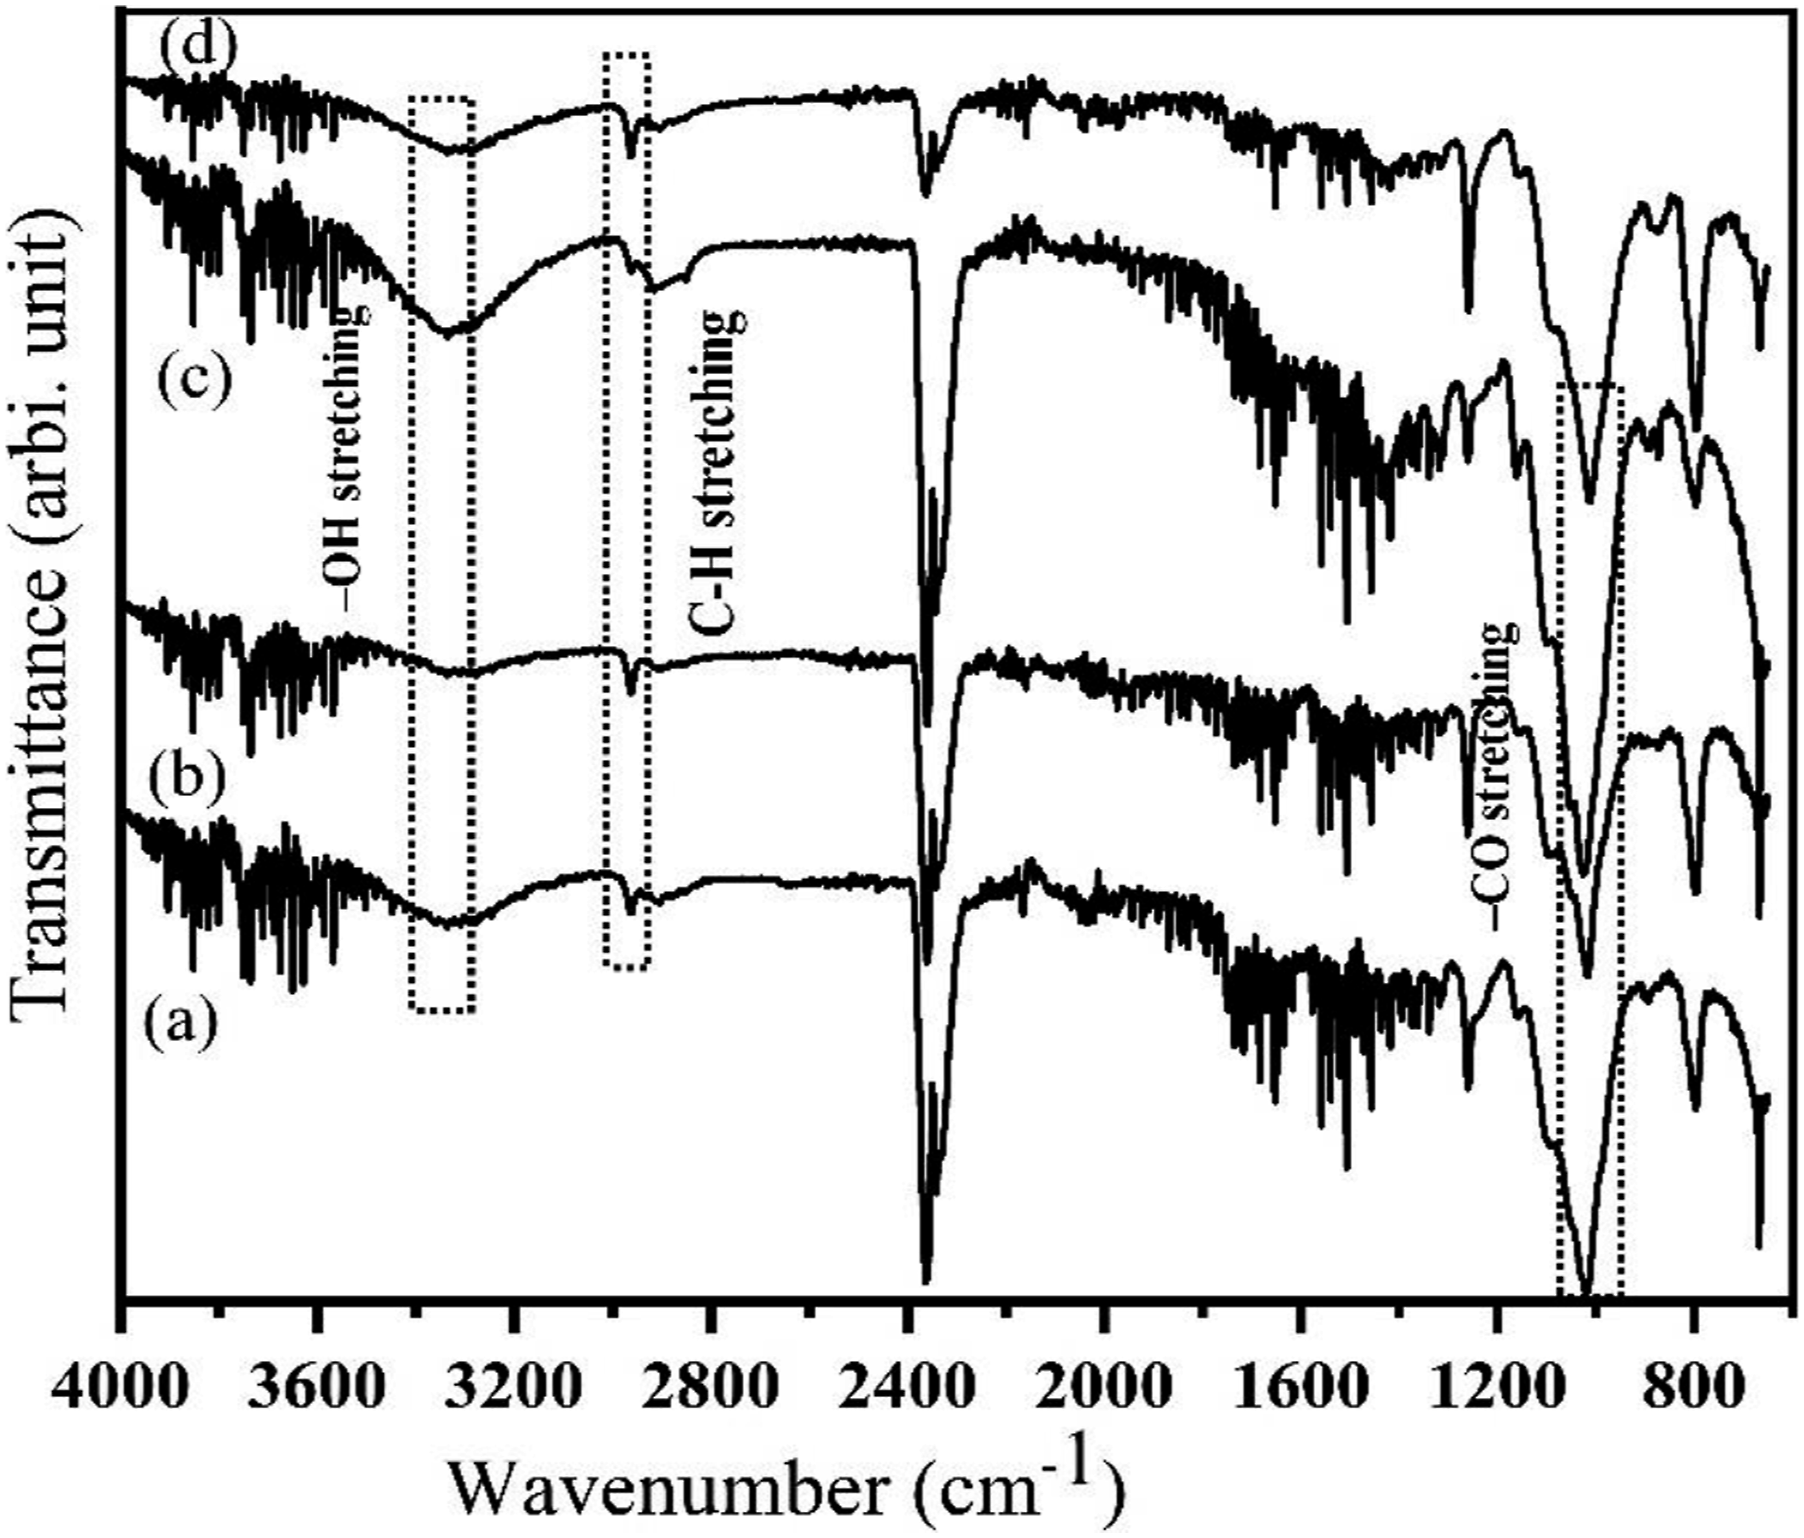
Figure 11 depicts the FTIR spectrum of HDPE; the band at 719–730 cm−1 is due to a rocking deformation of CH2, and the band at 1472 cm−1 is attributed to CH2 as a bending deformation. For HDPE, methyl asymmetric deformation vibration is seen at 1462 cm−1.
27
HDPE exhibits a peak of about 2900 cm−1, which is caused by the -CH2 acting as an asymmetric stretch. Additionally, substantial C=O is stretching at the wavenumber 2342 cm−1. Two thin peaks are present for the presence of the -CH group, asymmetric stretching and symmetric stretching, respectively, in the region of 2855 cm−1 and 2930 cm−1.
36
FTIR of (a) HDPE, (b) UOHPC, (c) USHPC, (d) TOHPC, (e) TSHPC, (f) IOHPC5 and (g) ISHPC5.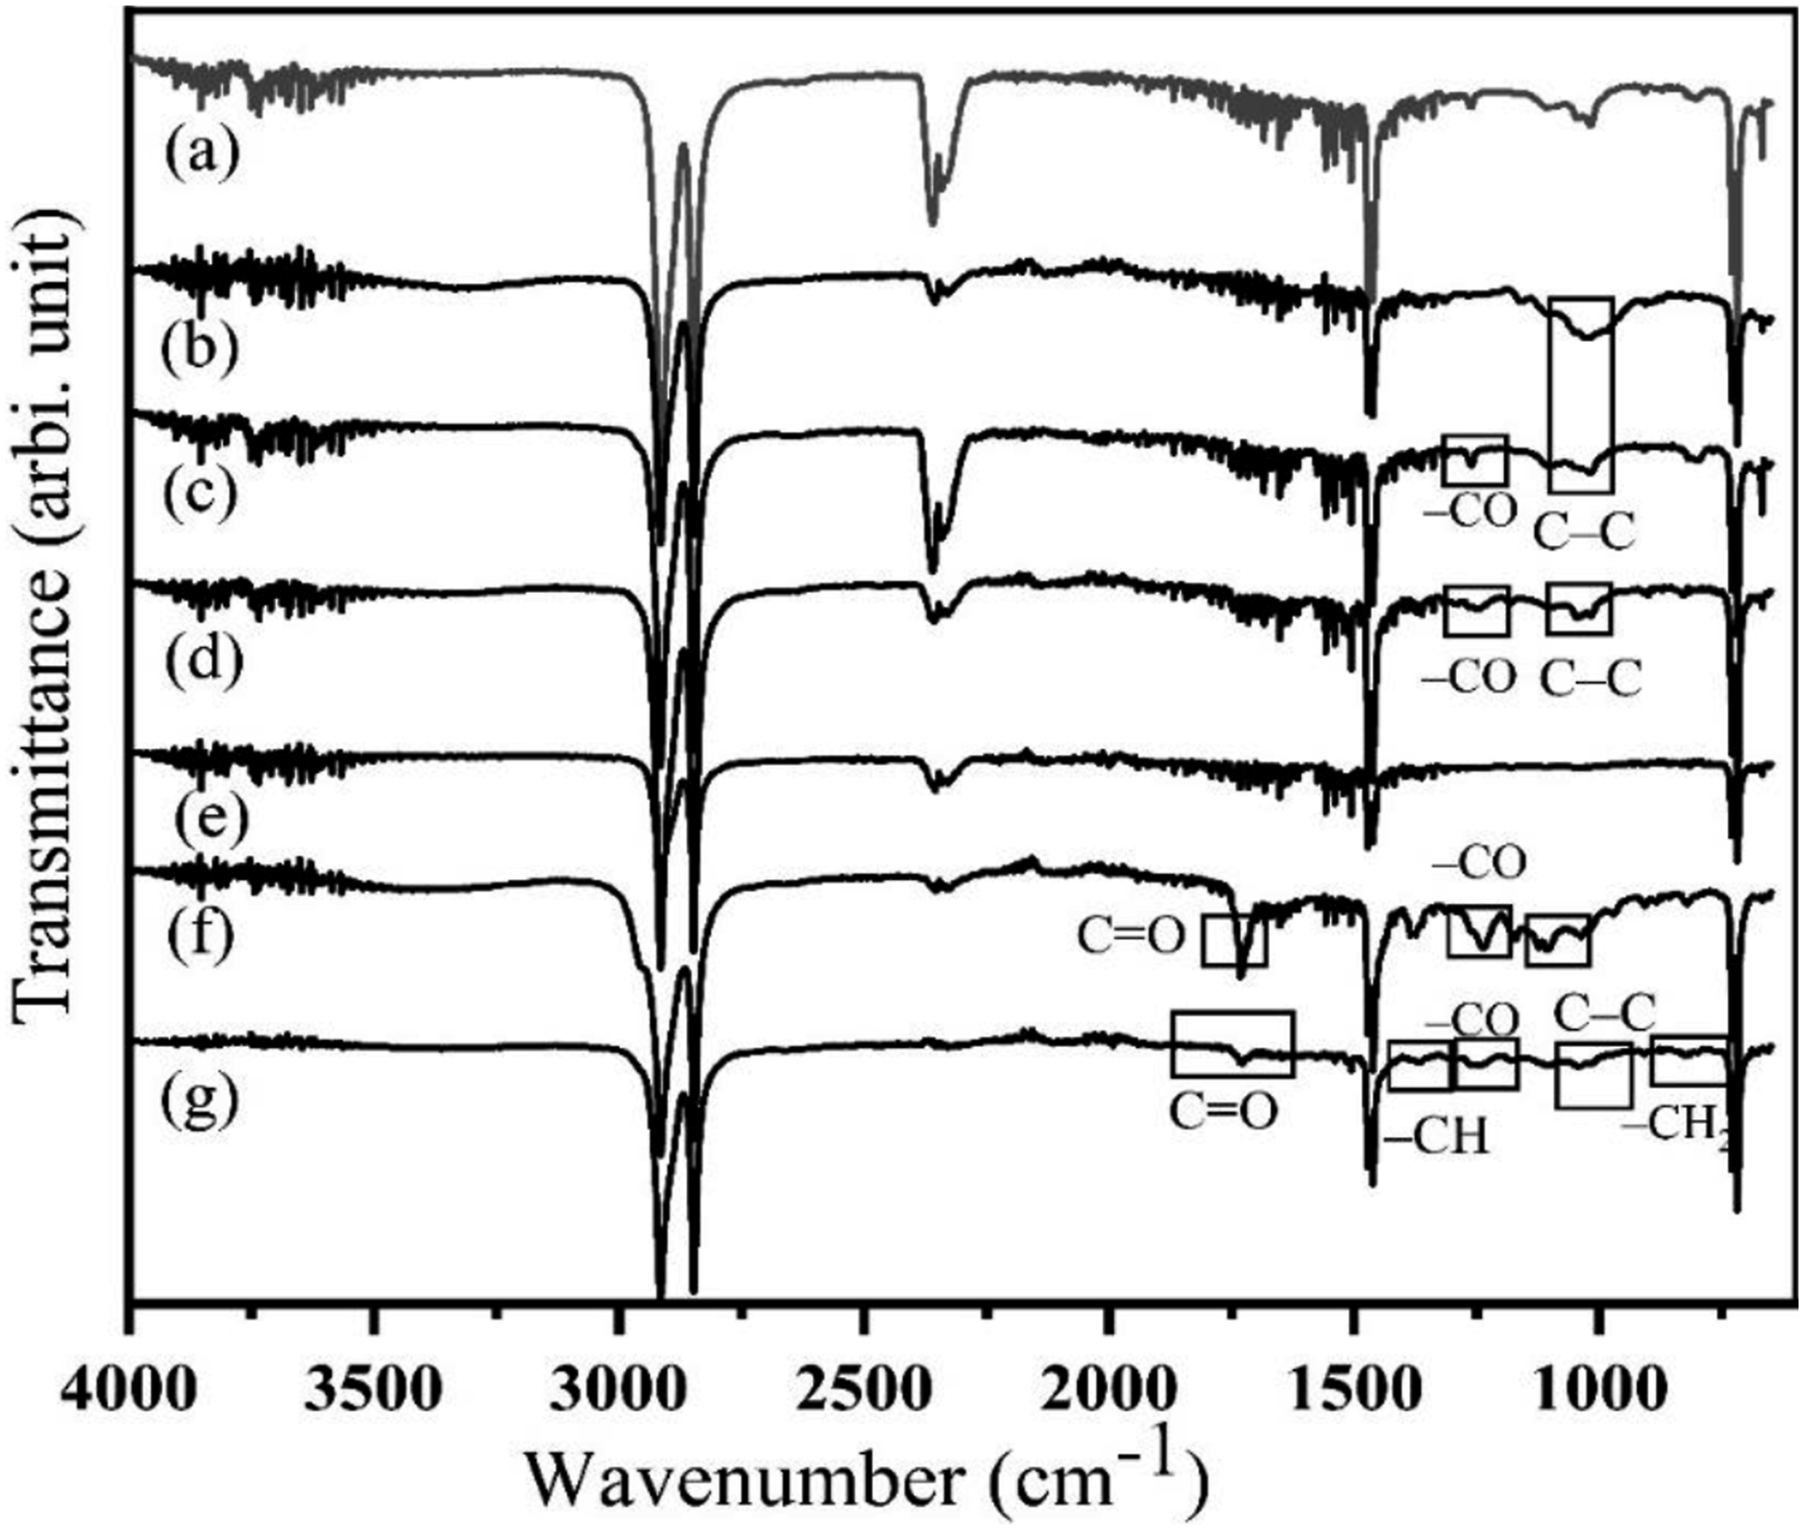
Both UOHPC and USHPC show a small peak at 668 cm−1 due to C-OH as out-of-plane banding in cellulose. This band is also present after alkali treatment that is in TOHPC and TSHPC. The peak for UOHPC and USHPC at 831 cm−1 is attributed to CH2 stretching, the peak for TOHPC and TSHPC at 1253 cm−1 is attributed to C-O bonds, the peak for C-C bonds at 1046 cm−1, and the peak for C-OH bonds at 1011 cm−1. After gamma radiation from both types of treated composites, namely from IOHPC5 and ISHPC5, the peak at 668 cm−1 disappears. Some new peaks are observed between 900 and 1300 cm−1 for both IOHPC5 and ISHPC5. In IOHPC5 and ISHPC5, two new peaks are observed at 1726 cm−1 and at 1369 cm−1, which are assigned to C=O bonds and -CH bonds, respectively. In the fingerprint region of Figure 11, a broad and strong peak was observed in UOHPC, USHPC, TOHPC, and TSHPCs from 3284 to 3500 cm−1, which indicates the O-H stretching vibration modes from alcohols, phenols, and water. 37 After alkaline treatment, the intensity of this band of this region which is assigned to O-H stretching is decreased. The cause of this decreased band is due to a decrease of the functional group of phenolic or aliphatic hydroxyl in the fibers because sodium hydroxide reacts with cellulose promoting the removal of hydroxyl. Irradiation with gamma rays causes the hydroxyl groups to vanish. It favors the formation of crosslinks between fibers and HDPE matrix through C-O and C-C, C-H bonds that appear at 1737 cm−1 and 1650 cm−1, 1025 cm−1, respectively. A new shoulder band is also observed at 2950 cm−1 for the IOHPC5 sample which is assigned to -CH3 asymmetric stretching vibration. 38 For the IOHPC5 and ISHPC5 samples, the peak at 2360 cm−1 is assigned to the C≡N group and the intensity of the peak is mostly reduced due to the gamma-ray irradiation. 39
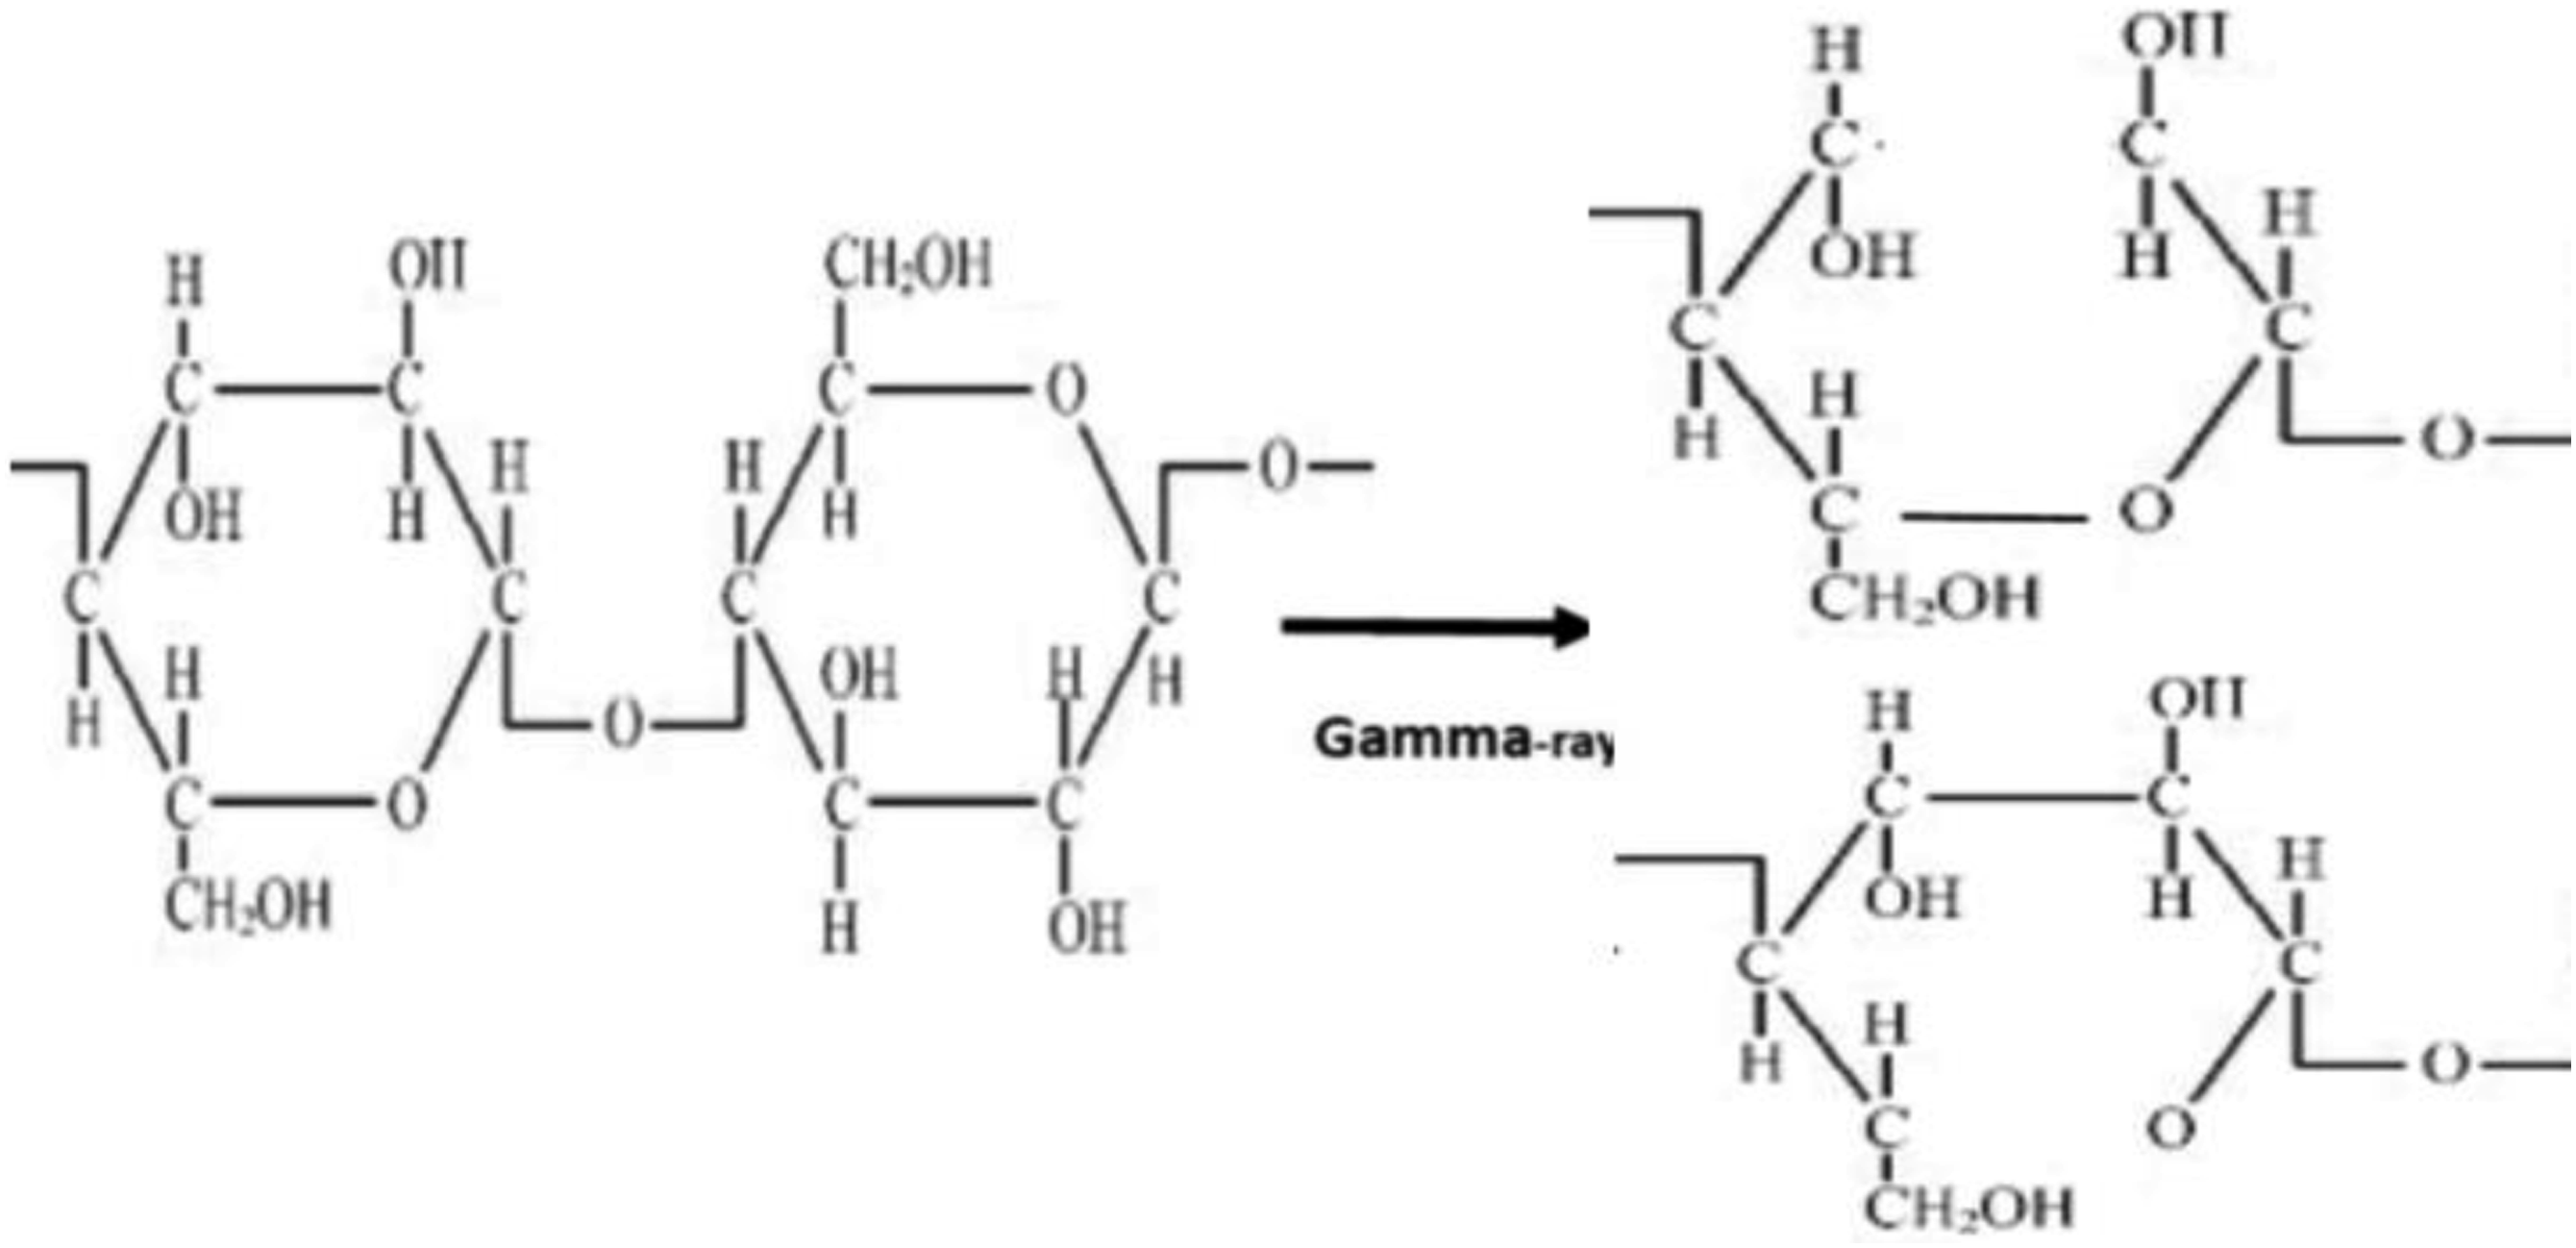
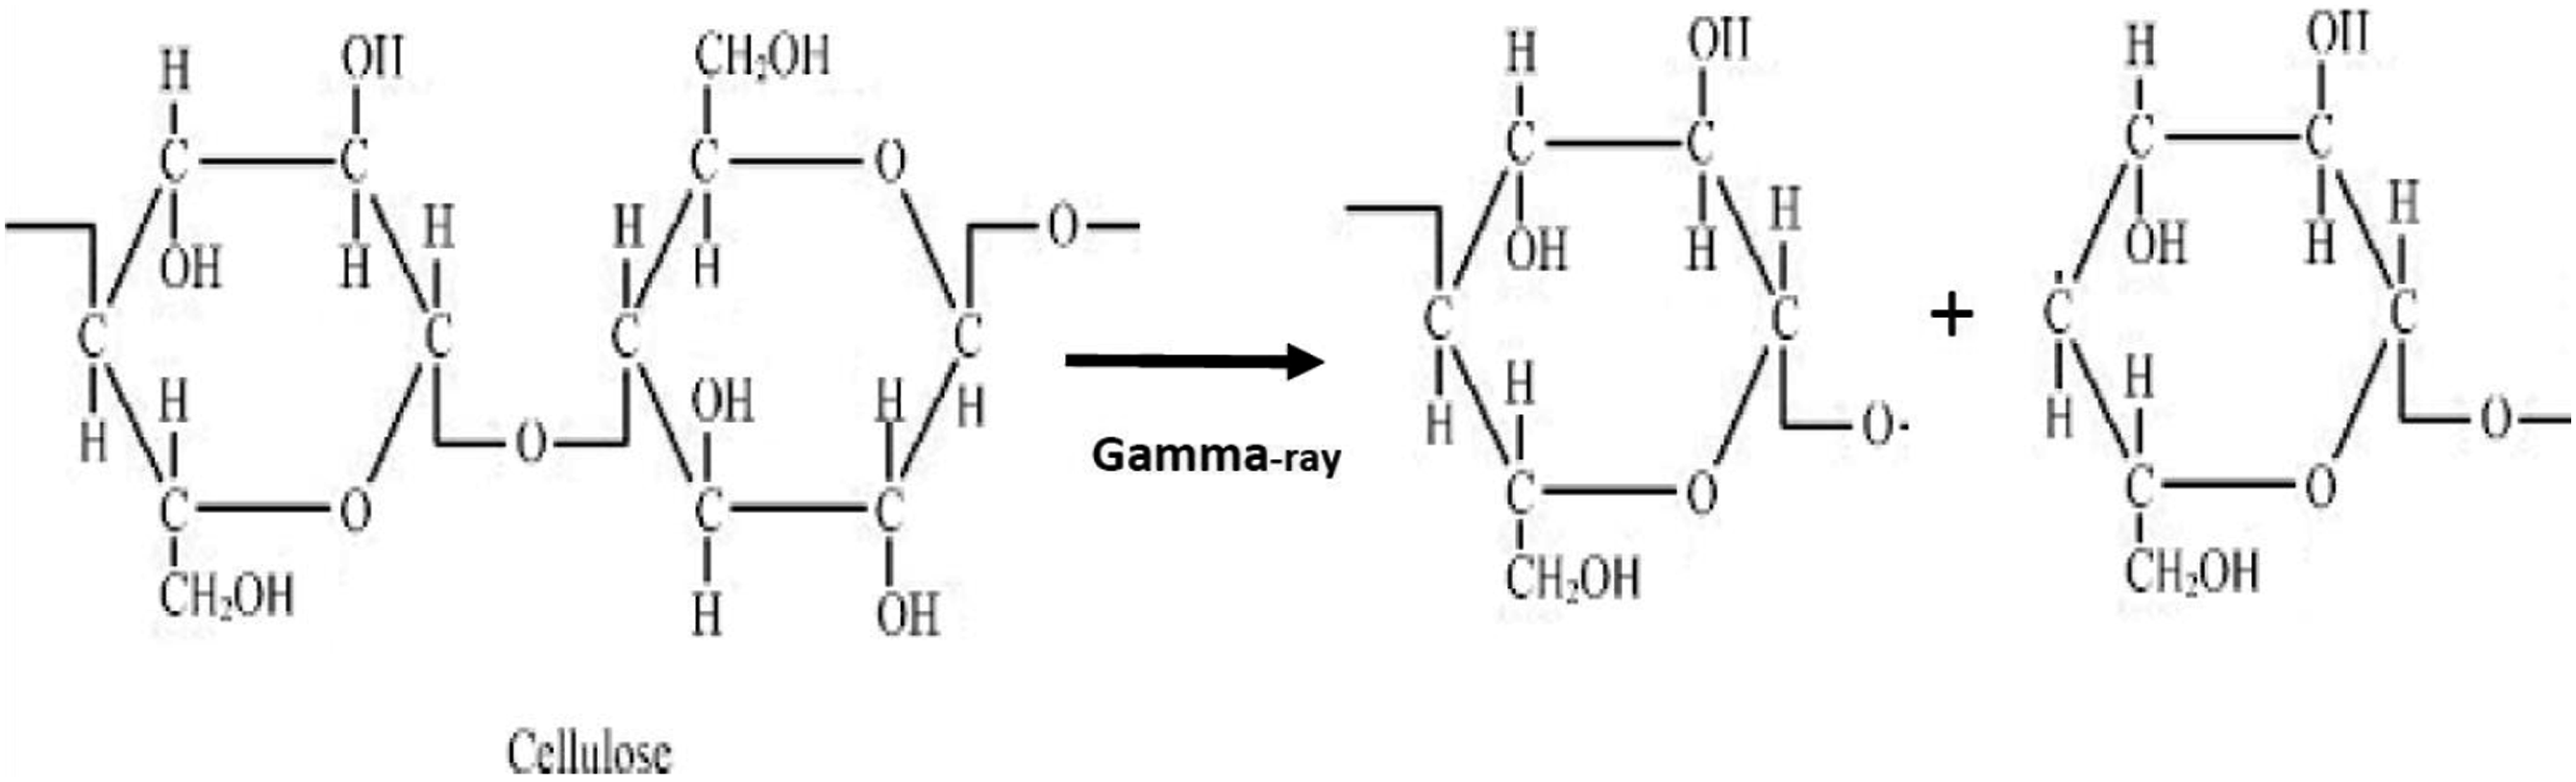
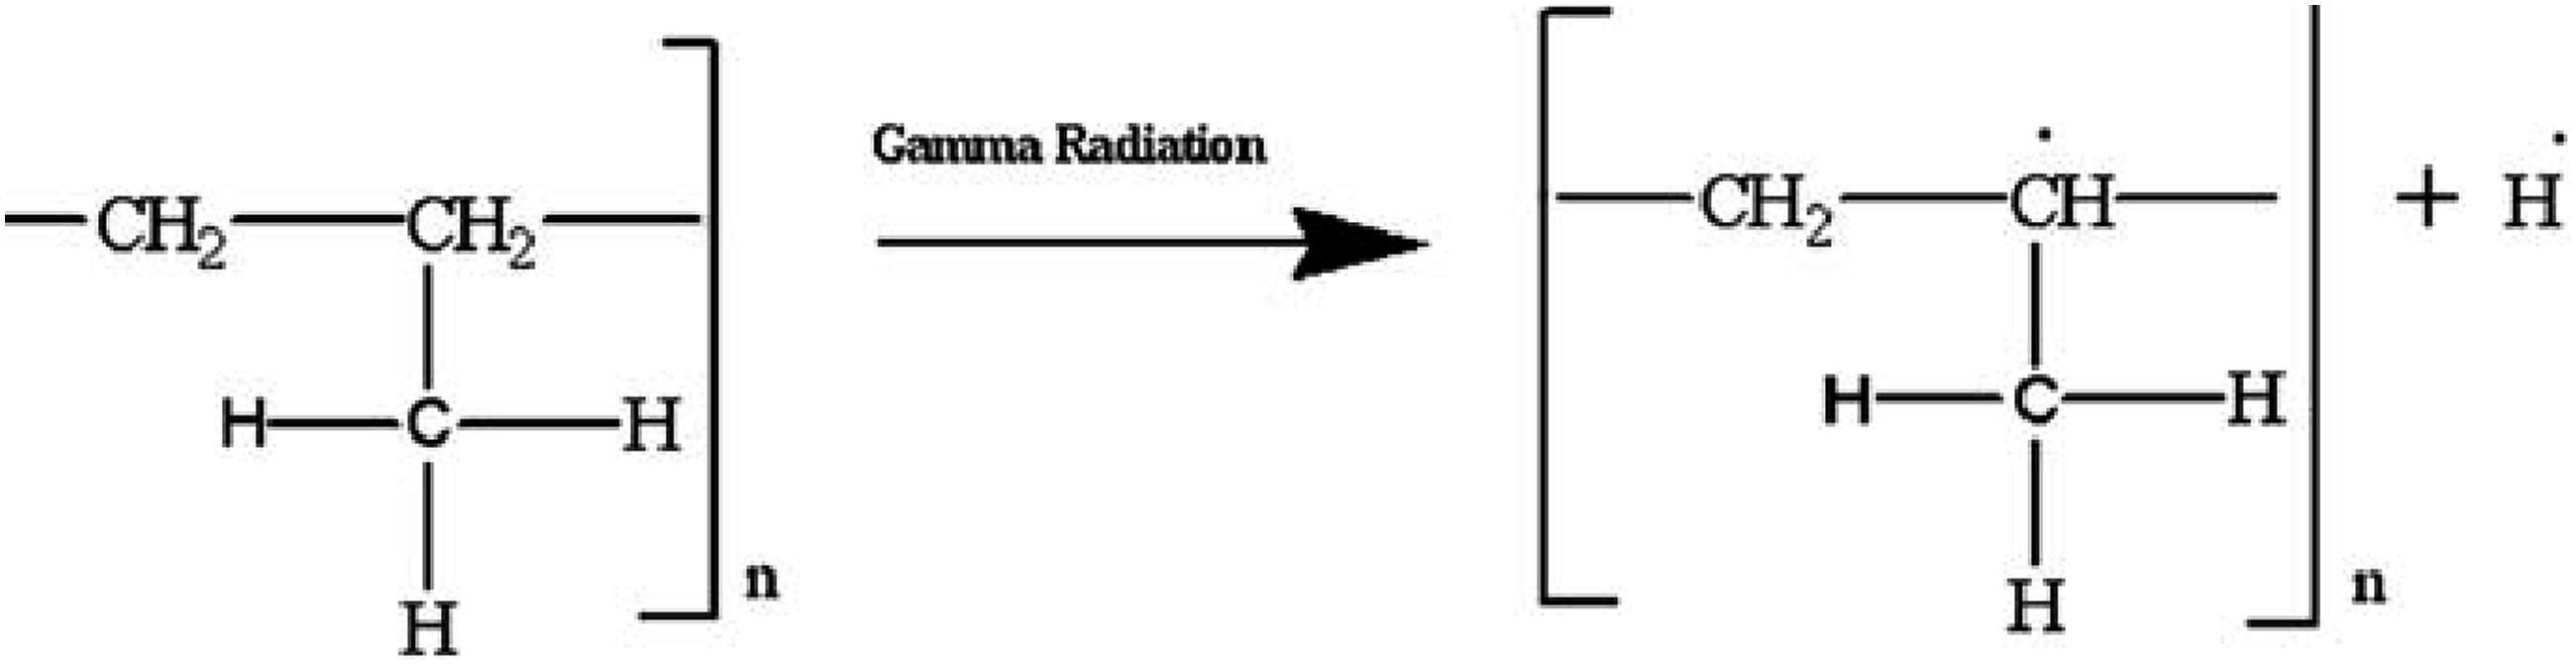
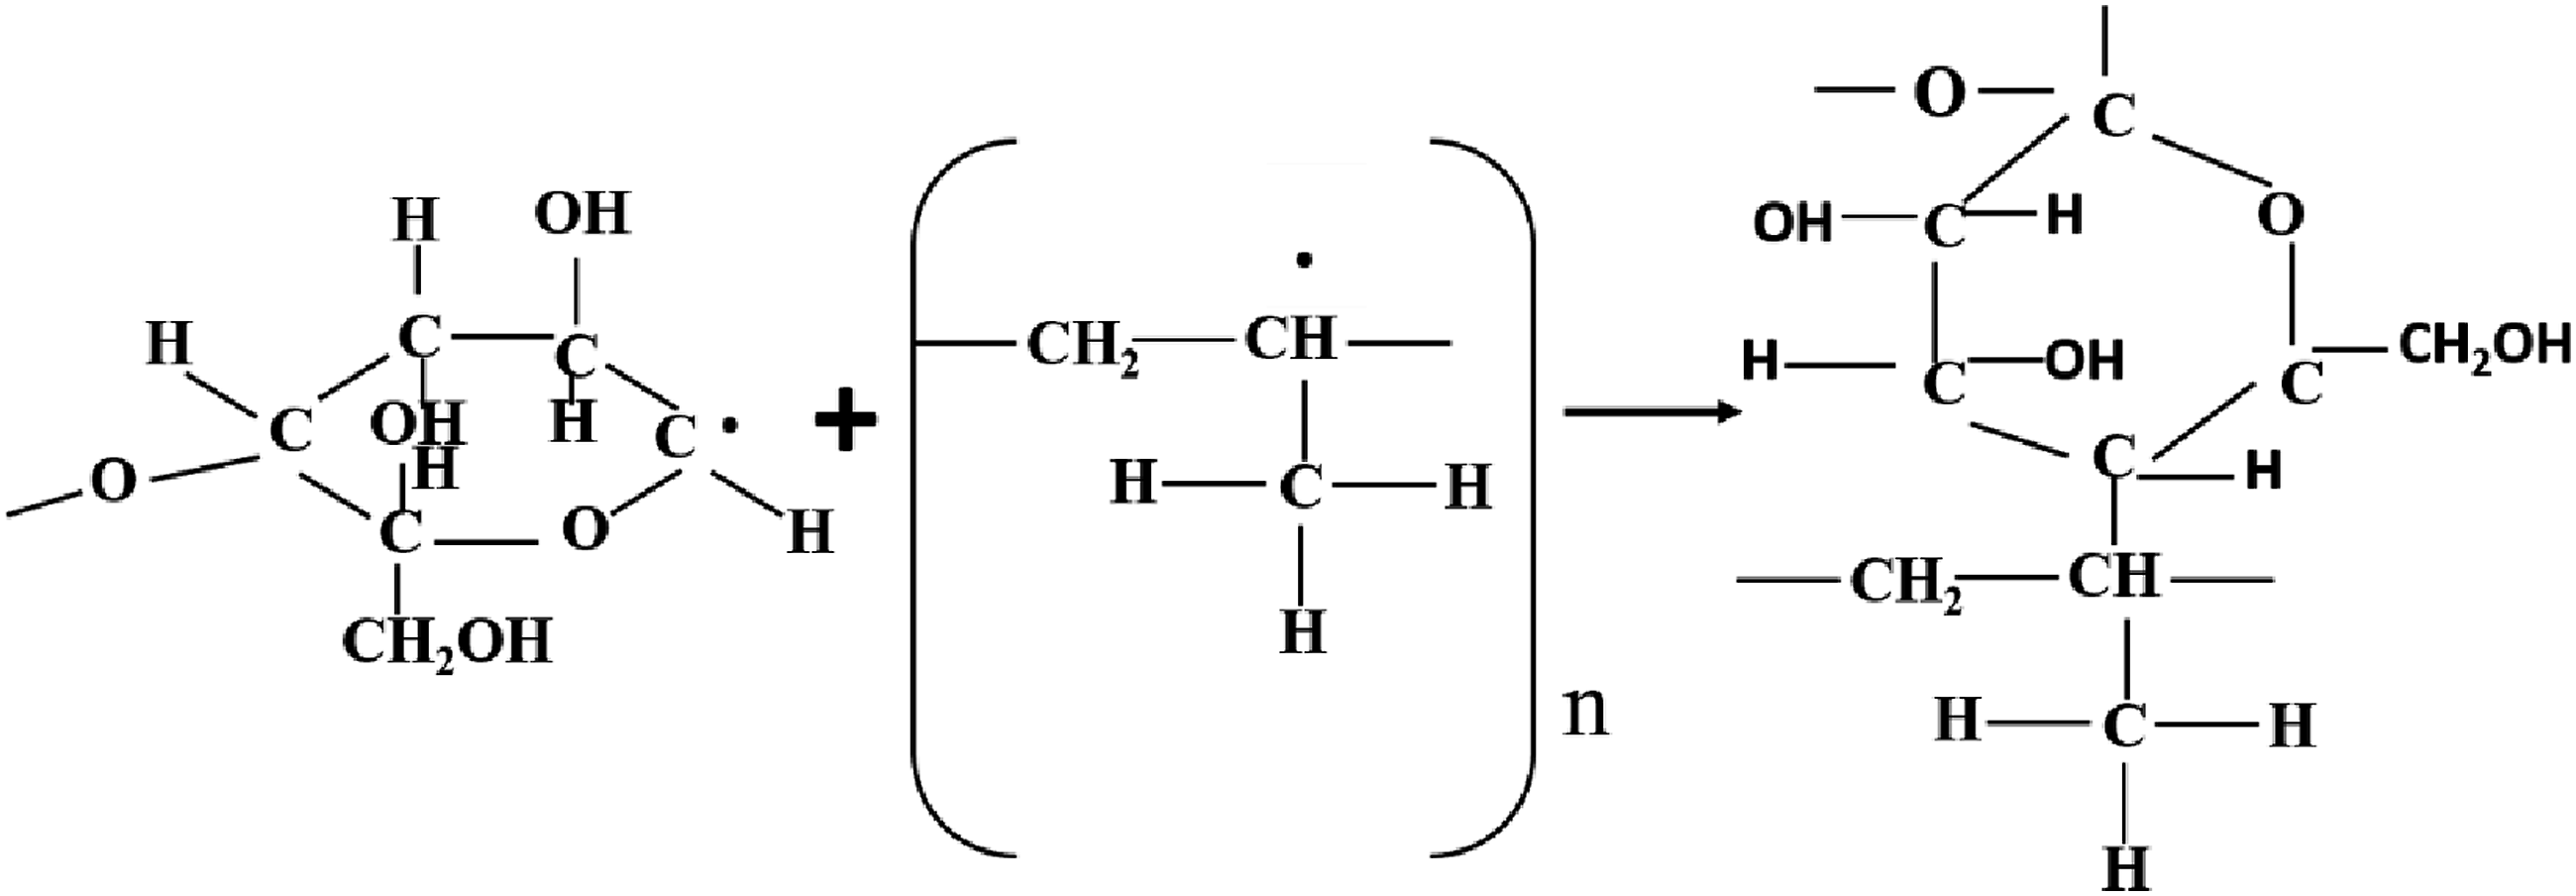
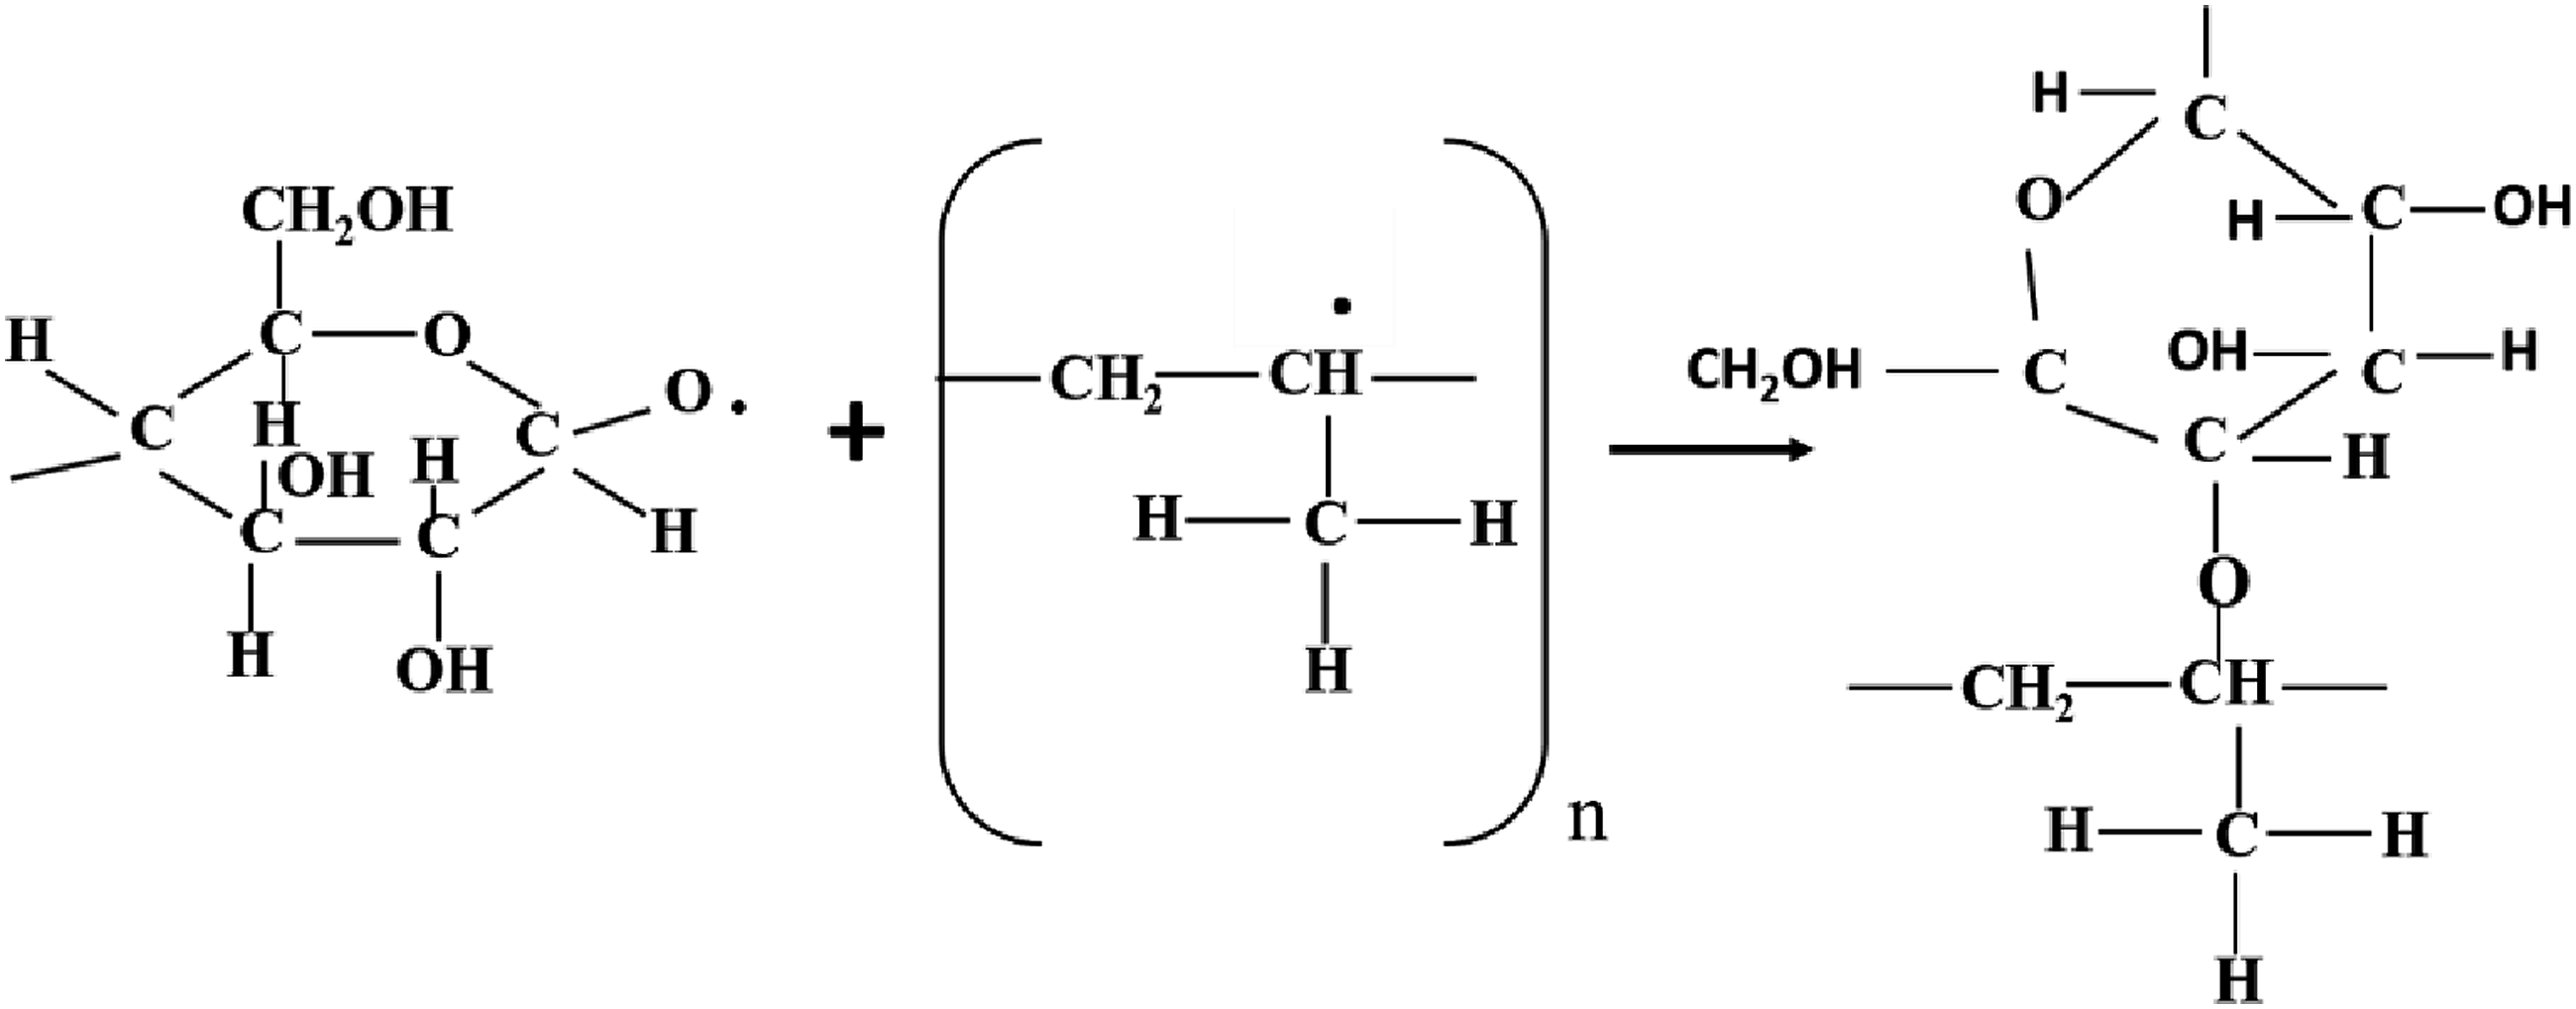
Free radicals are produced as a result of gamma-ray irradiation in the composites by abstraction of hydrogen (H) and hydroxyl (OH) (Figure 12), bond breaking and bond cycle opening (Figure 13), or chain scission in the cleavages of the monomeric units of the treated fibers cellulose (Figure 14). On the other hand, hydrogen abstraction during the cleavage of the HDPE molecule may result in the formation of free radicals as a result of gamma-ray irradiation in the composites (Figure 15). These free radicals are responsible for combining with other cellulose units or with HDPE molecules by C-C and C-O covalent bonds (Figures 16 and 17). Thus, Cross-linking occurs among fiber molecules and HDPE molecules by -CH, -CH2, C-C, and C-O bonds and increases due to gamma-ray irradiation in the composites.
40
Abstraction of hydrogen or hydroxyl from cellulose. Due to gamma radiation exposure, the CC and CO bond on cellulose cycles opens, producing free radicals. Cellulose exposed to gamma radiation produces free radicals through chain scission. Formation of free radicals in HDPE molecules. Gamma-ray radiation causes the formation of C-C bonds. C-O bond formation brought on by gamma radiation.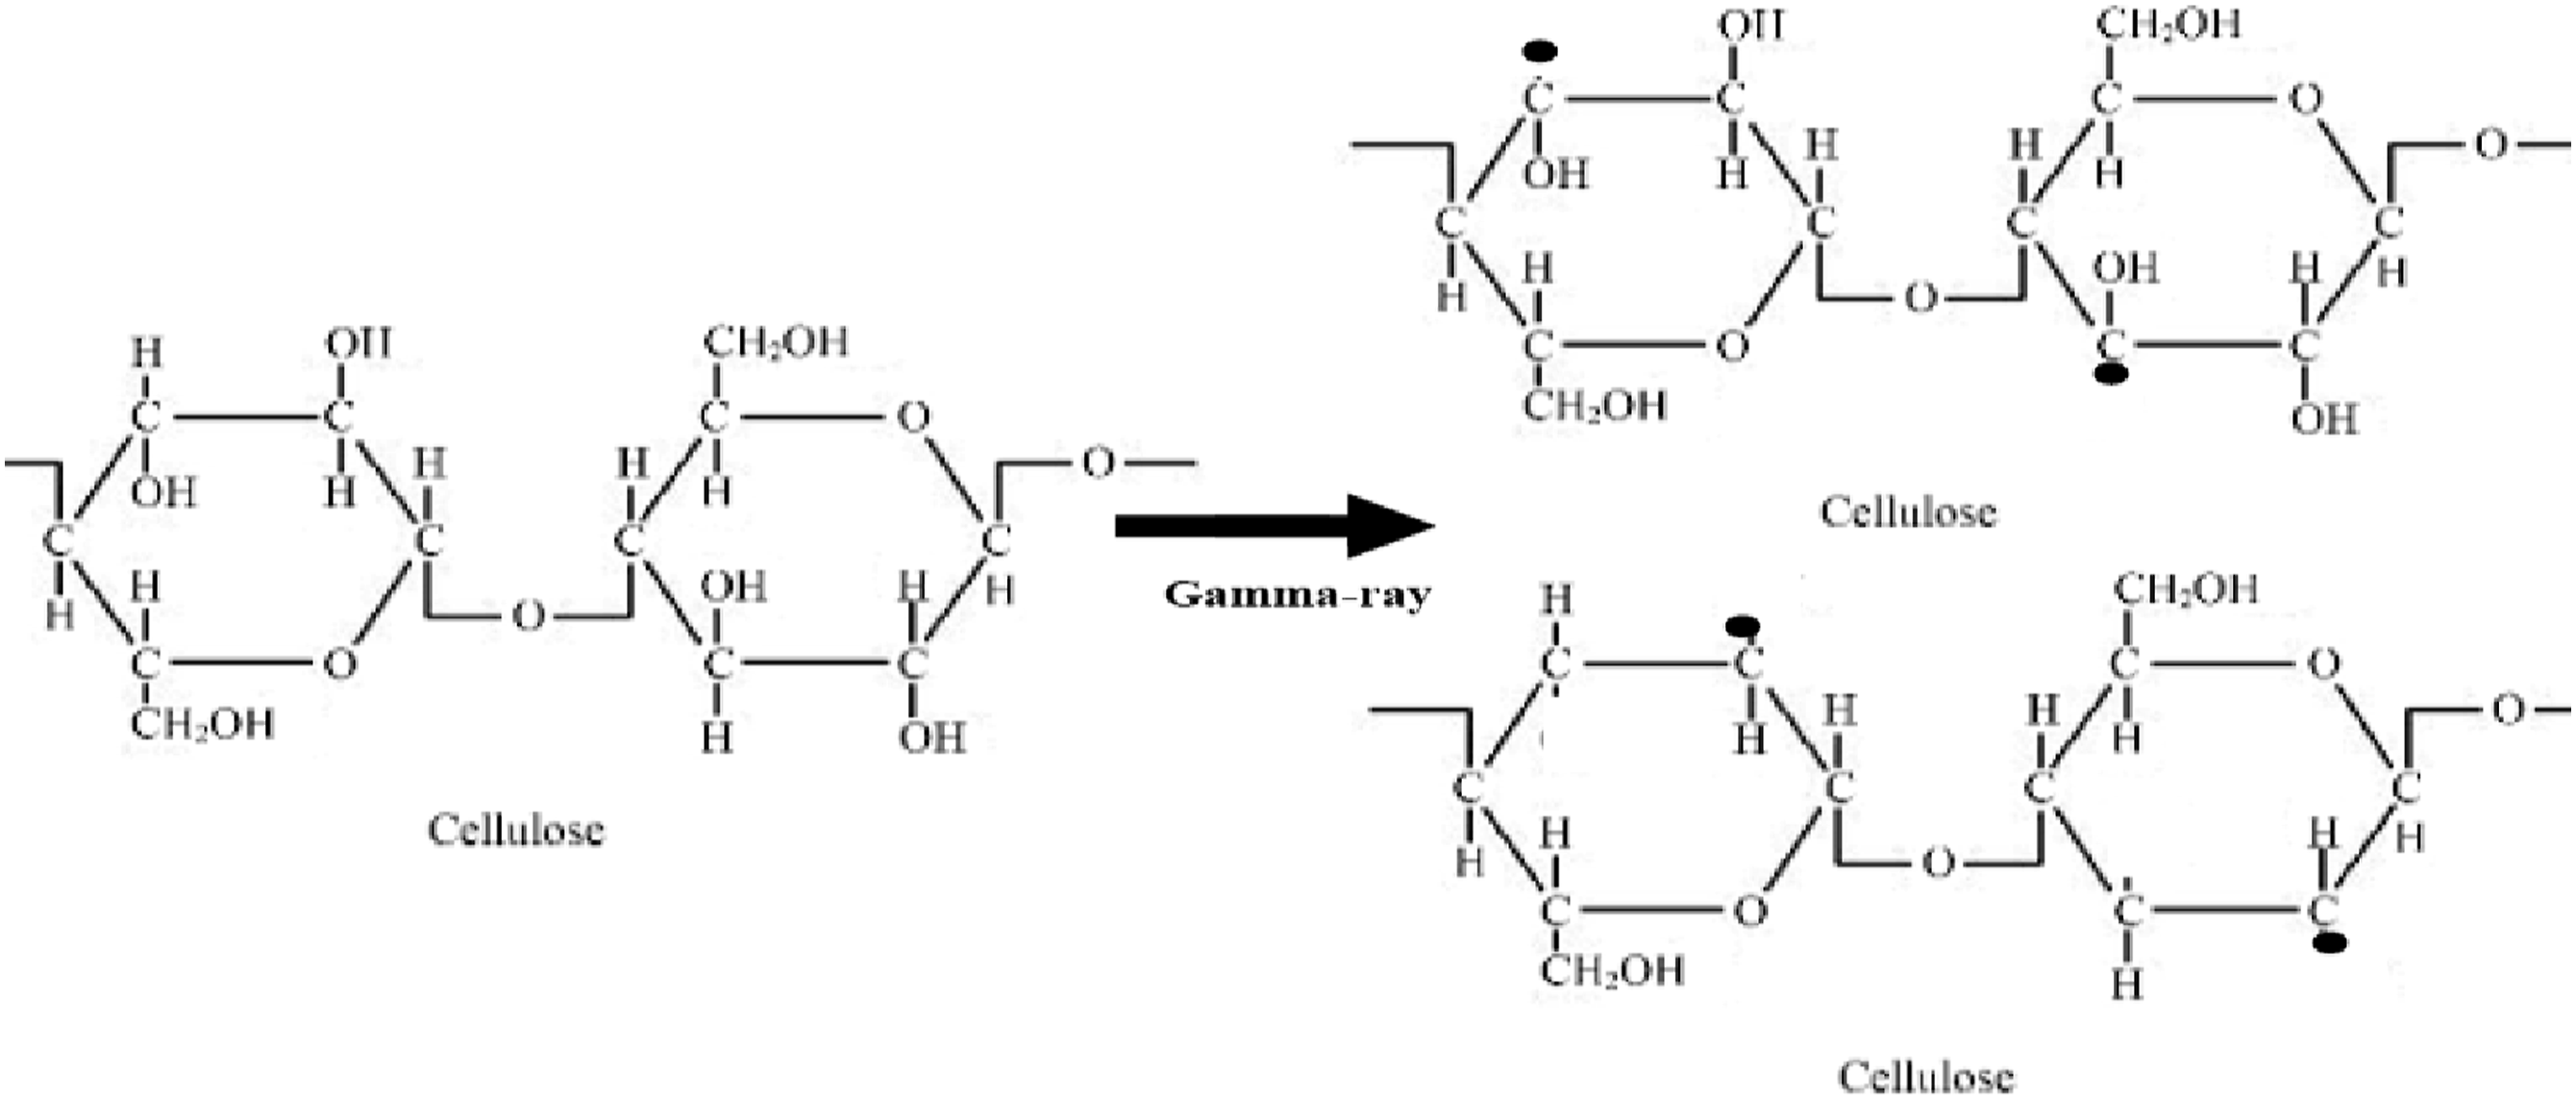
Therefore, the FTIR spectra of both series of treated and gamma-ray irradiated composites demonstrate the adhesion and crosslinking between fiber and HDPE molecules through C-O and C-C, -CH bonds.
Water intake
Figure 18 displays the water intake (WI) characteristics of the UOHPC, USHPC, TOHPC, TSHPC, IOHPC5, and ISHPC5 samples as determined by equation (3). After 40 h, the WI of TSHPC and ISHPC exhibits the maximum and appears to steadily climb. However, for USHPC, the WI properties exhibit increasing tendencies.
41
Additionally, the WI is observed to gradually rise to 40 h before essentially leveling off for TOHPC and IOHPC5. The value of WI of UOHPC at a given time is greater than that of TOHPC and IOHPC5. The WI of UOHPC is 61 and 30% higher than IOHPC5 and TOHPC, respectively. However, after 40 h, the WI of USHPC shows that it is 52.94% higher than ISHPC5 and 16% higher than TSHPC. UOHPC and TOHPC have WI characteristics that are roughly 12% and 15% greater than USHPC and TOHPC, respectively. IOHPC5’s WI is around 5% greater than ISHPC5’s. The increased intermolecular distance between the fiber and matrix caused by the presence of contaminants in the fiber accounts for the higher WI of untreated composites compared to treated composites. Additionally, more micro-voids may be created at the polymer-fiber or fiber-fiber interface, where water can be retained and display higher WI due to the fibers’ enhanced hydrophilicity and decreased incompatibility.19,42 Water intake values of UOHPC, USHPC, TOHPC, TSHPC, IOHPC5 and ISHPC5.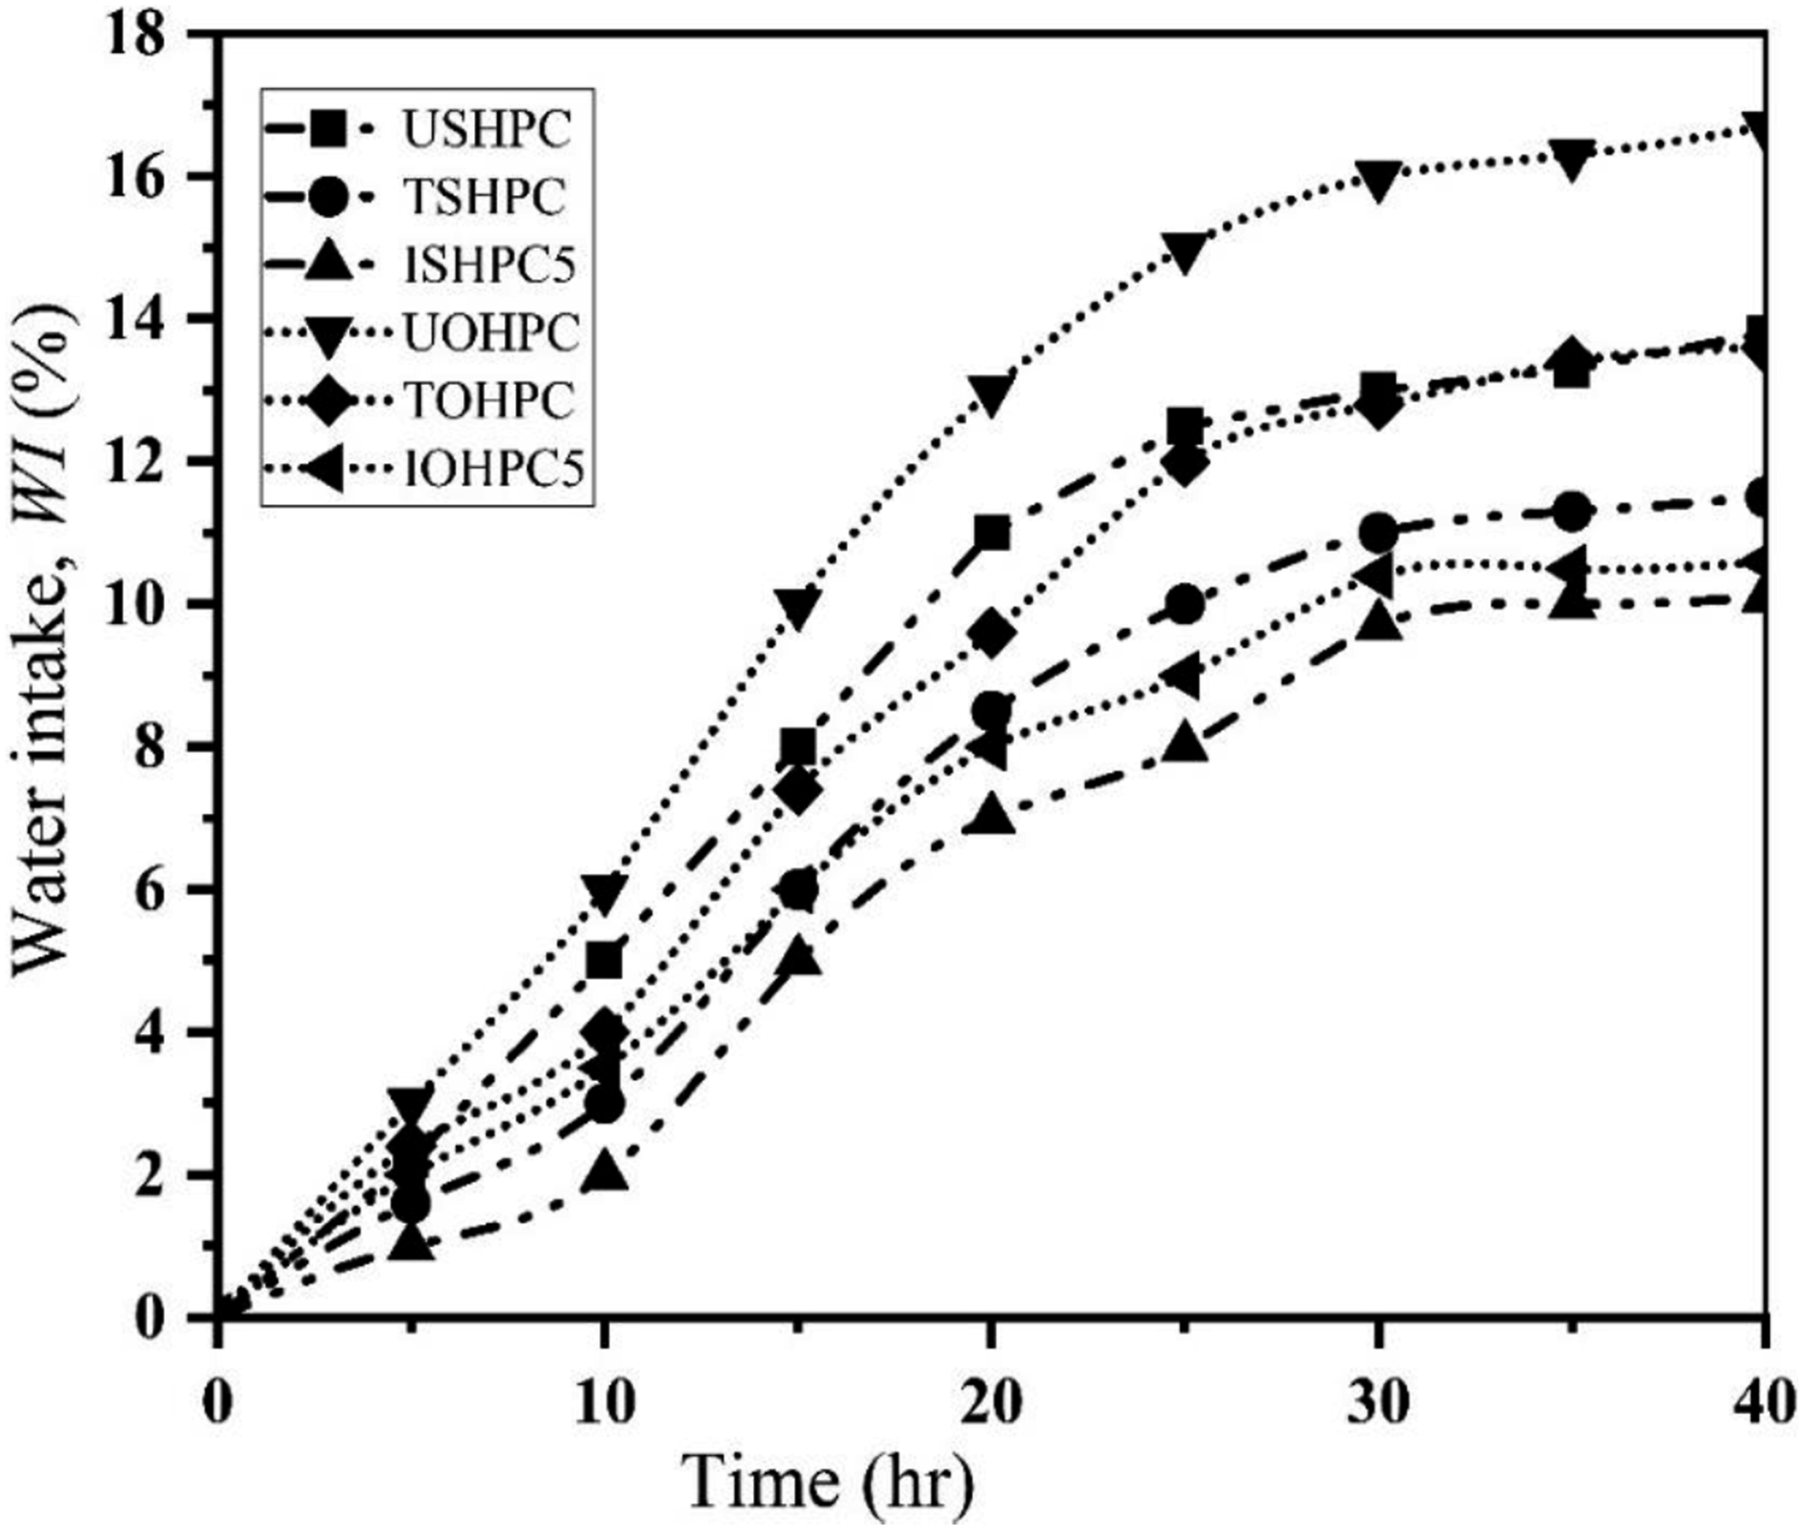
Mechanical properties
Figure 19 demonstrates the variation of TS with fiber contents. The TS values of UOHPC and USHPC are 46 MP and 48 MPa, respectively. After alkali treatment, the TS value of TOHPC is 56.2 MPa, and the TS of TSHPC is 60 MPa. The TS values of UOHPC, USHPC, TOHPC, and TSHPC increase with fiber contents up to 55 wt% and then decrease. The TS value of USHPC is about 5% greater than that of UOHPC, and the TS of TSHPC is about 7% greater than that of TOHPC. After alkali treatments, the fiber becomes rough and produces greater adhesion with the matrix, resulting in higher TS values. Furthermore, the increase of TS is due to the alkali treatment of fiber because waxy and gummy components from both fibers are eliminated after treatment. The fiber loses its weight, and the surface smoothness decreases after alkali treatment (shown in Figure 3). Additionally, Van der Waals’s interaction between the fiber molecules and HDPE molecules increases.
43
Tensile strength of fiber contents for UOHPC, USHPC, TOHPC, and TSHPC.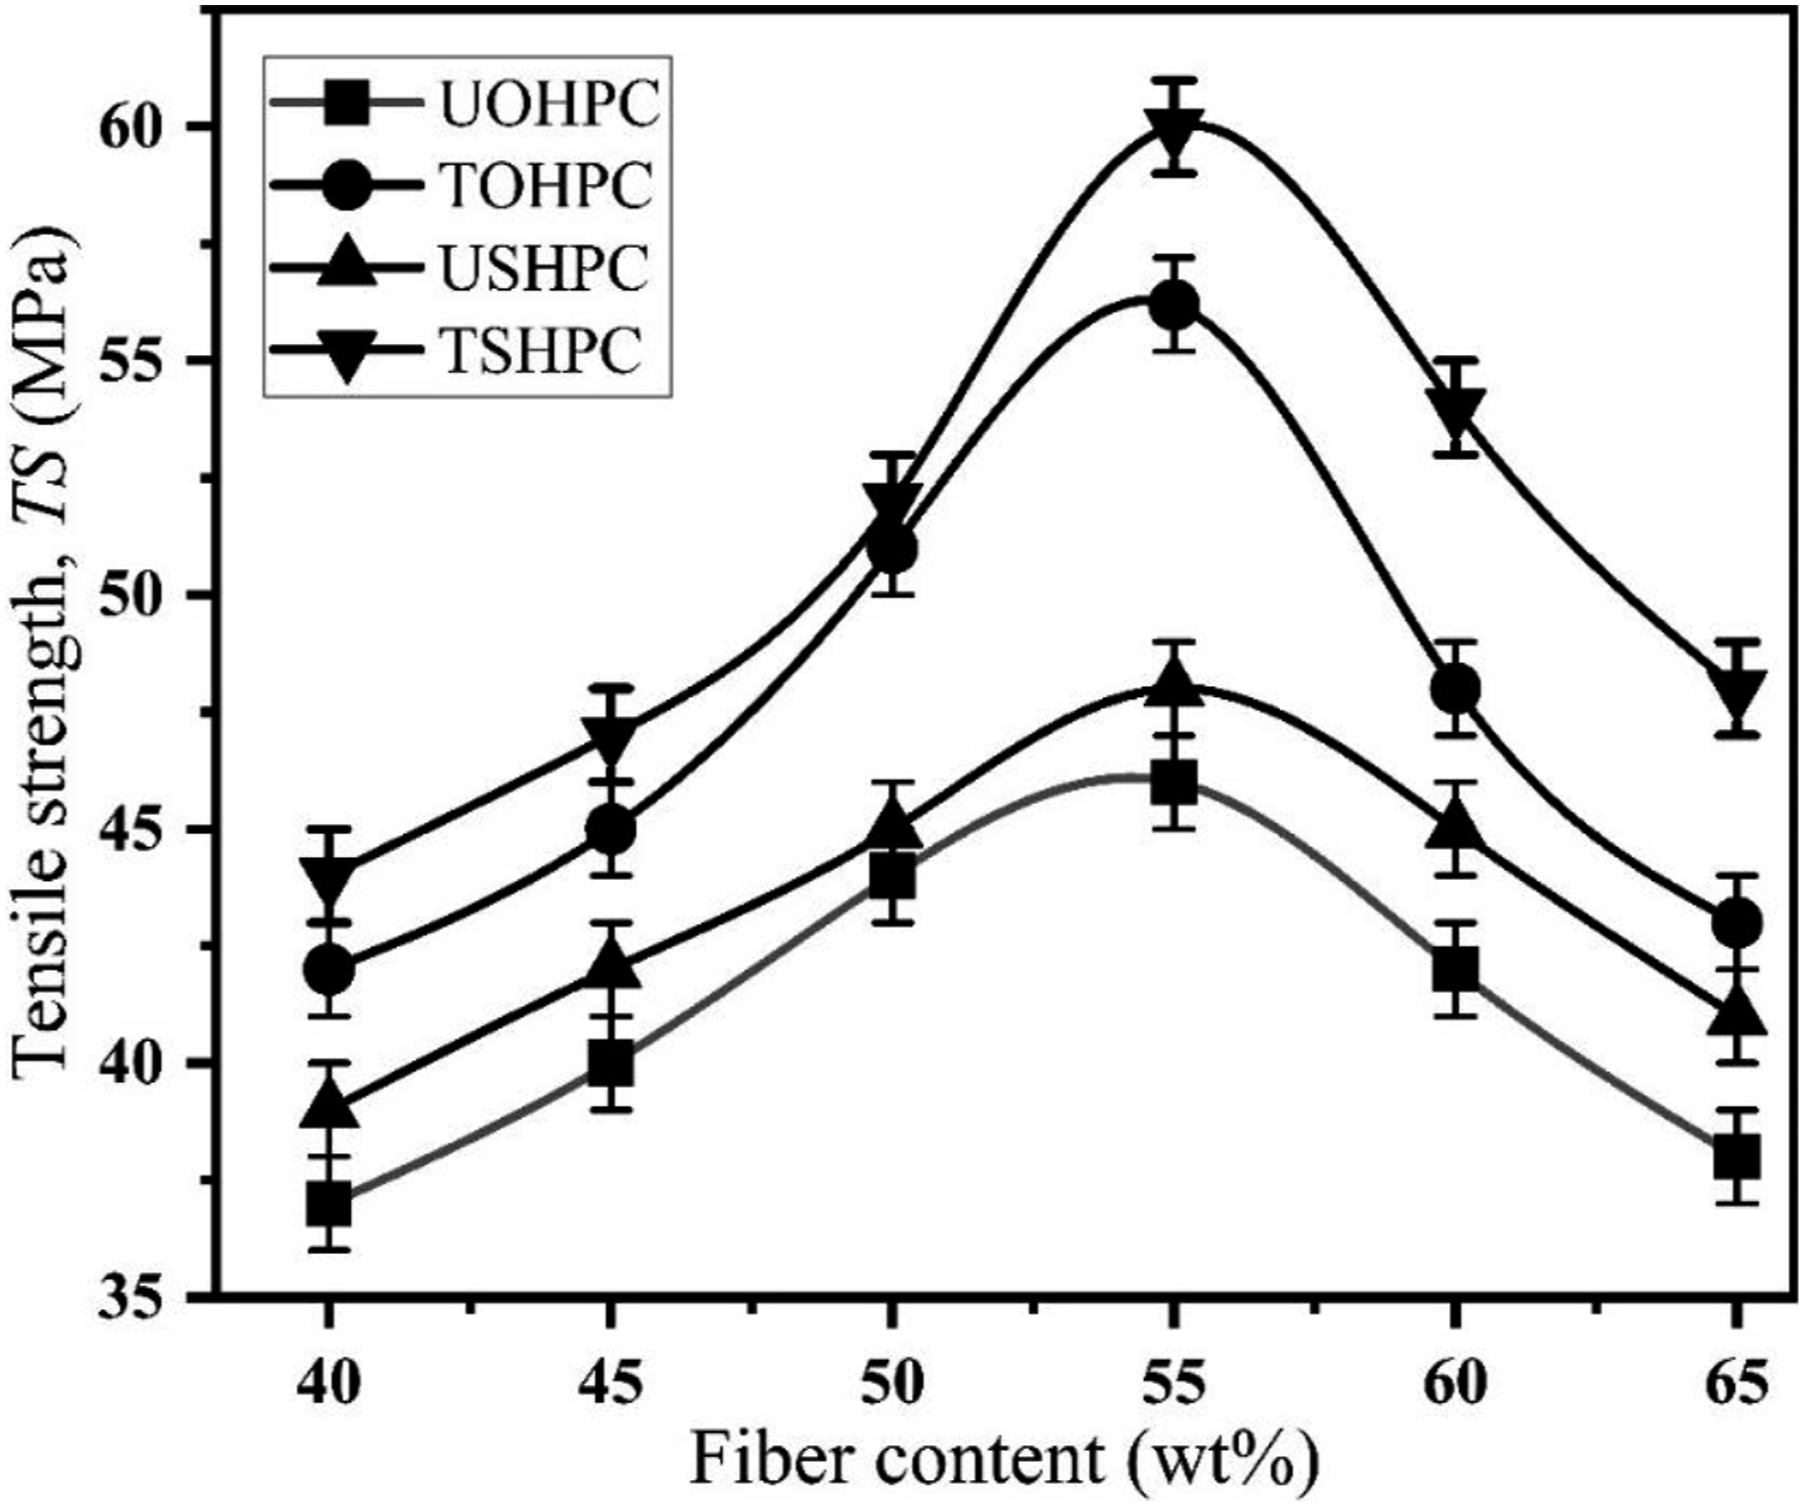
The TS of HDPE, USHPC, TSHPC, ISHPC2.5, IOHPC2.5, ISHPC5, IOHPC5, ISHPC7.5, and IOHPC7.5 are shown in Figure 20. The TS value of untreated composite is greater than that of treated composite. On the other hand, for 5 kGy radiation dose, the maximum TS value of ISHPC5 is 68 MPa, which is 13% and 42% higher than that of TSHPC and USHPC, respectively. TS value of IOHPC5 is 66 MPa at a dose of 5 kGy, which is 18, and 44% greater than that of TOHPC, and UOHPC, respectively. This increase in TS value may be attributed to the improvement of cross-linking between fiber-matrix molecules.
44
As the radiation dose increases, the hydroxyl and hydrogen abstraction takes place from the cellulose unit. Then, new bonds and cross-linking are formed between fiber-fiber and fiber-matrix molecules. The decrease of TS, with increasing radiation dose after 5 kGy, indicates that the bonding chain degrades after high radiation dose. In addition to this, a breakdown of the crosslinking between fiber–matrix molecules occur.
45
Tensile strength maximum of HDPE, UOHPC, USHPC, TOHPC, TSHPC, IOHPC2.5, ISHPC2.5, IOHPC5, ISHPC5, IOHPC7.5, and ISHPC7.5.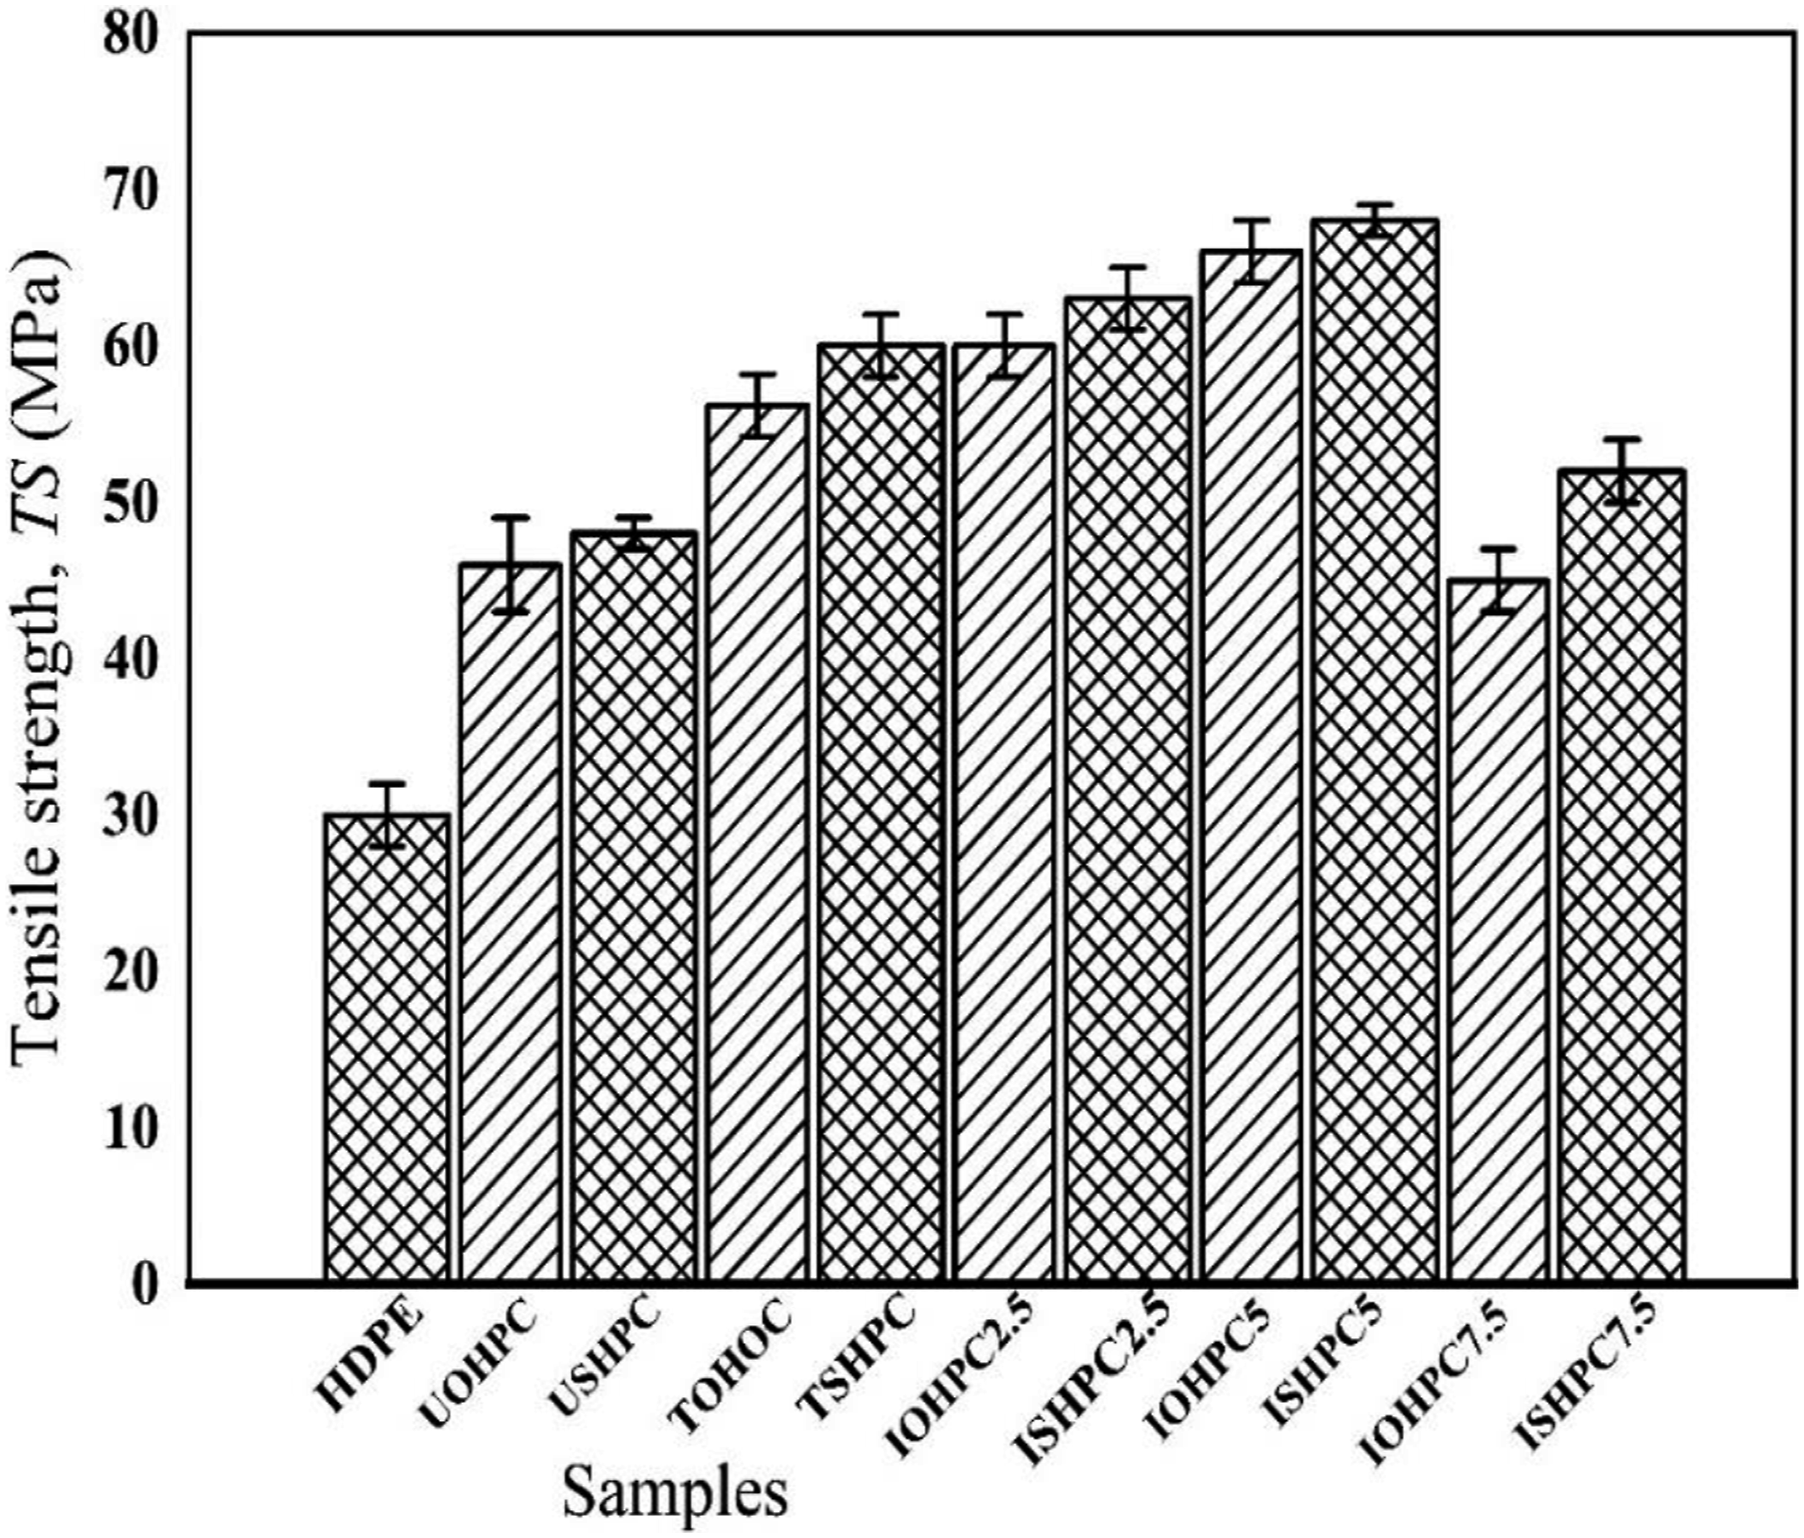
Figure 21 shows the Y value of USHPC, UOHPC, TSHPC, and TOHPC as a function of fiber contents. For both series of composite, the Y value increases up to 55 wt% fiber contents, and after that, it decreases. At the optimum fiber contents, the Y value of USHPC and UOHPC is 1540 and 1450 MPa, respectively. The Y values of TSHPC and TOHPC are enhanced roughly by 4% and 8% from that of untreated composites, respectively.
46
Young’s modulus concerning fiber content for UOHPC, USHPC, TOHPC, and TSHPC.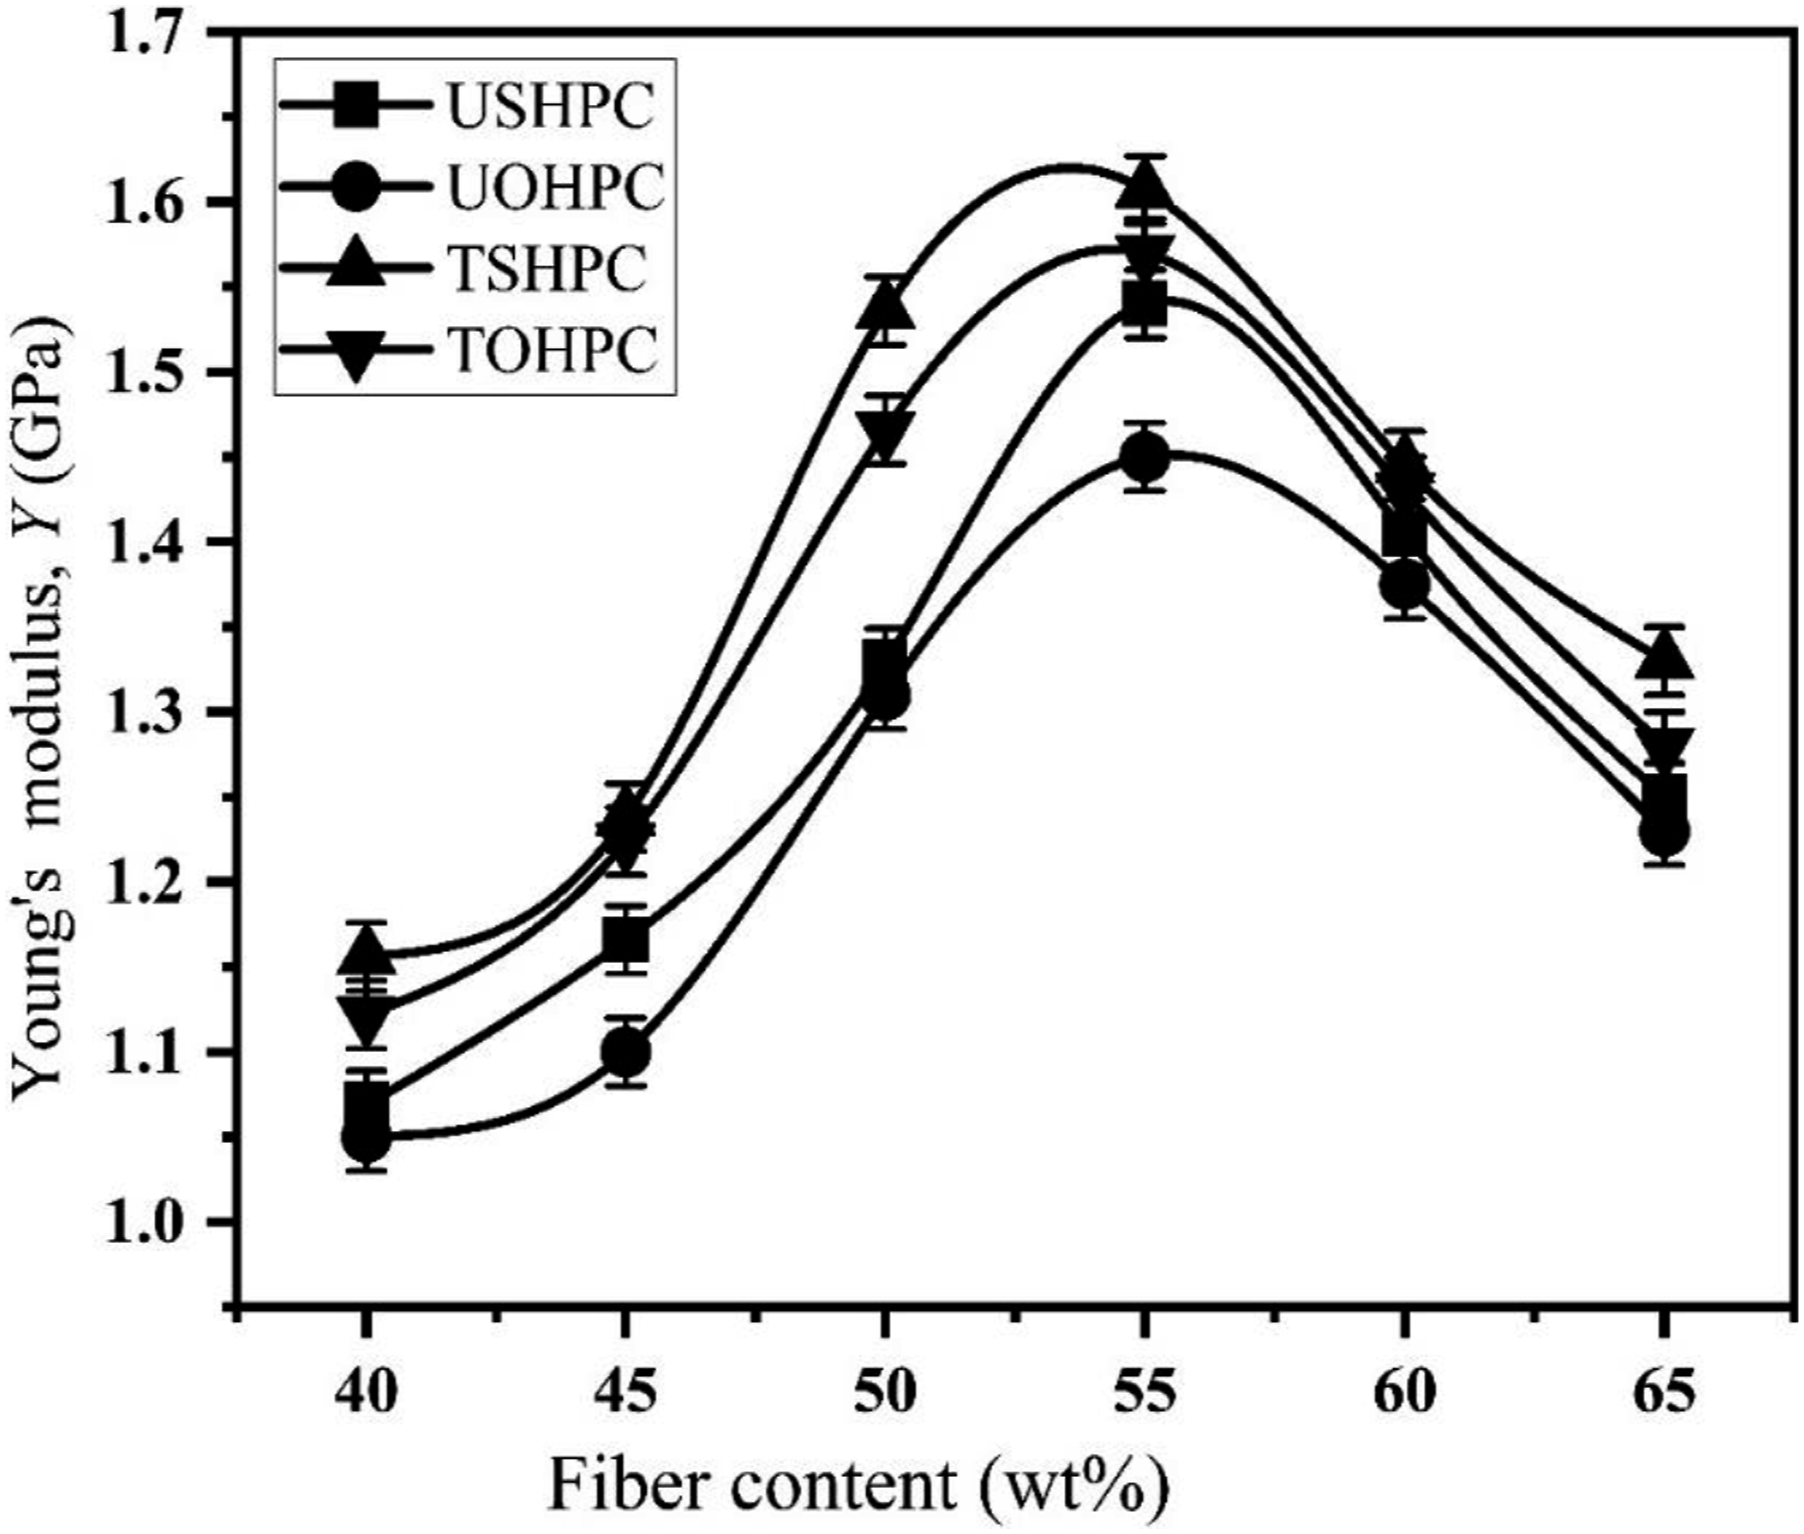
Figure 22 illustrates the change in Y for the following samples: HDPE, USHPC, TSHPC, ISHPC2.5, ISHPC5, ISHPC7.5, UOHPC, TOHPC, IOHPCC2.5, IOHPC5, and IOHPC7.5 at a fiber concentration of 55 wt%. In comparison to HDPE, USHPC, and TSHPC, the maximum Y value is found for ISHPC5 sample, which is 1965 MPa. The Y value of ISHPC5 is 96.5%, 26%, and 22% higher than that of HDPE, USHPC, and TSHPC, respectively. For the IOHPC5 sample, the maximum Y value is 1925 MPa, which is 92.5%, 33%, and 23% higher than that of HDPE, UOHPC, and TOHPC, respectively. The cross-linking between the molecules of the fiber and matrix may be the cause of the increase in Y value with the gamma radiation exposure up to 5 kGy.
47
Young’s modulus of HDPE, UOHPC, USHPC, TOHPC, TSHPC, IOHPC2.5, ISHPC2.5, IOHPC5, ISHPC5, IOHPC7.5, and ISHPC7.5.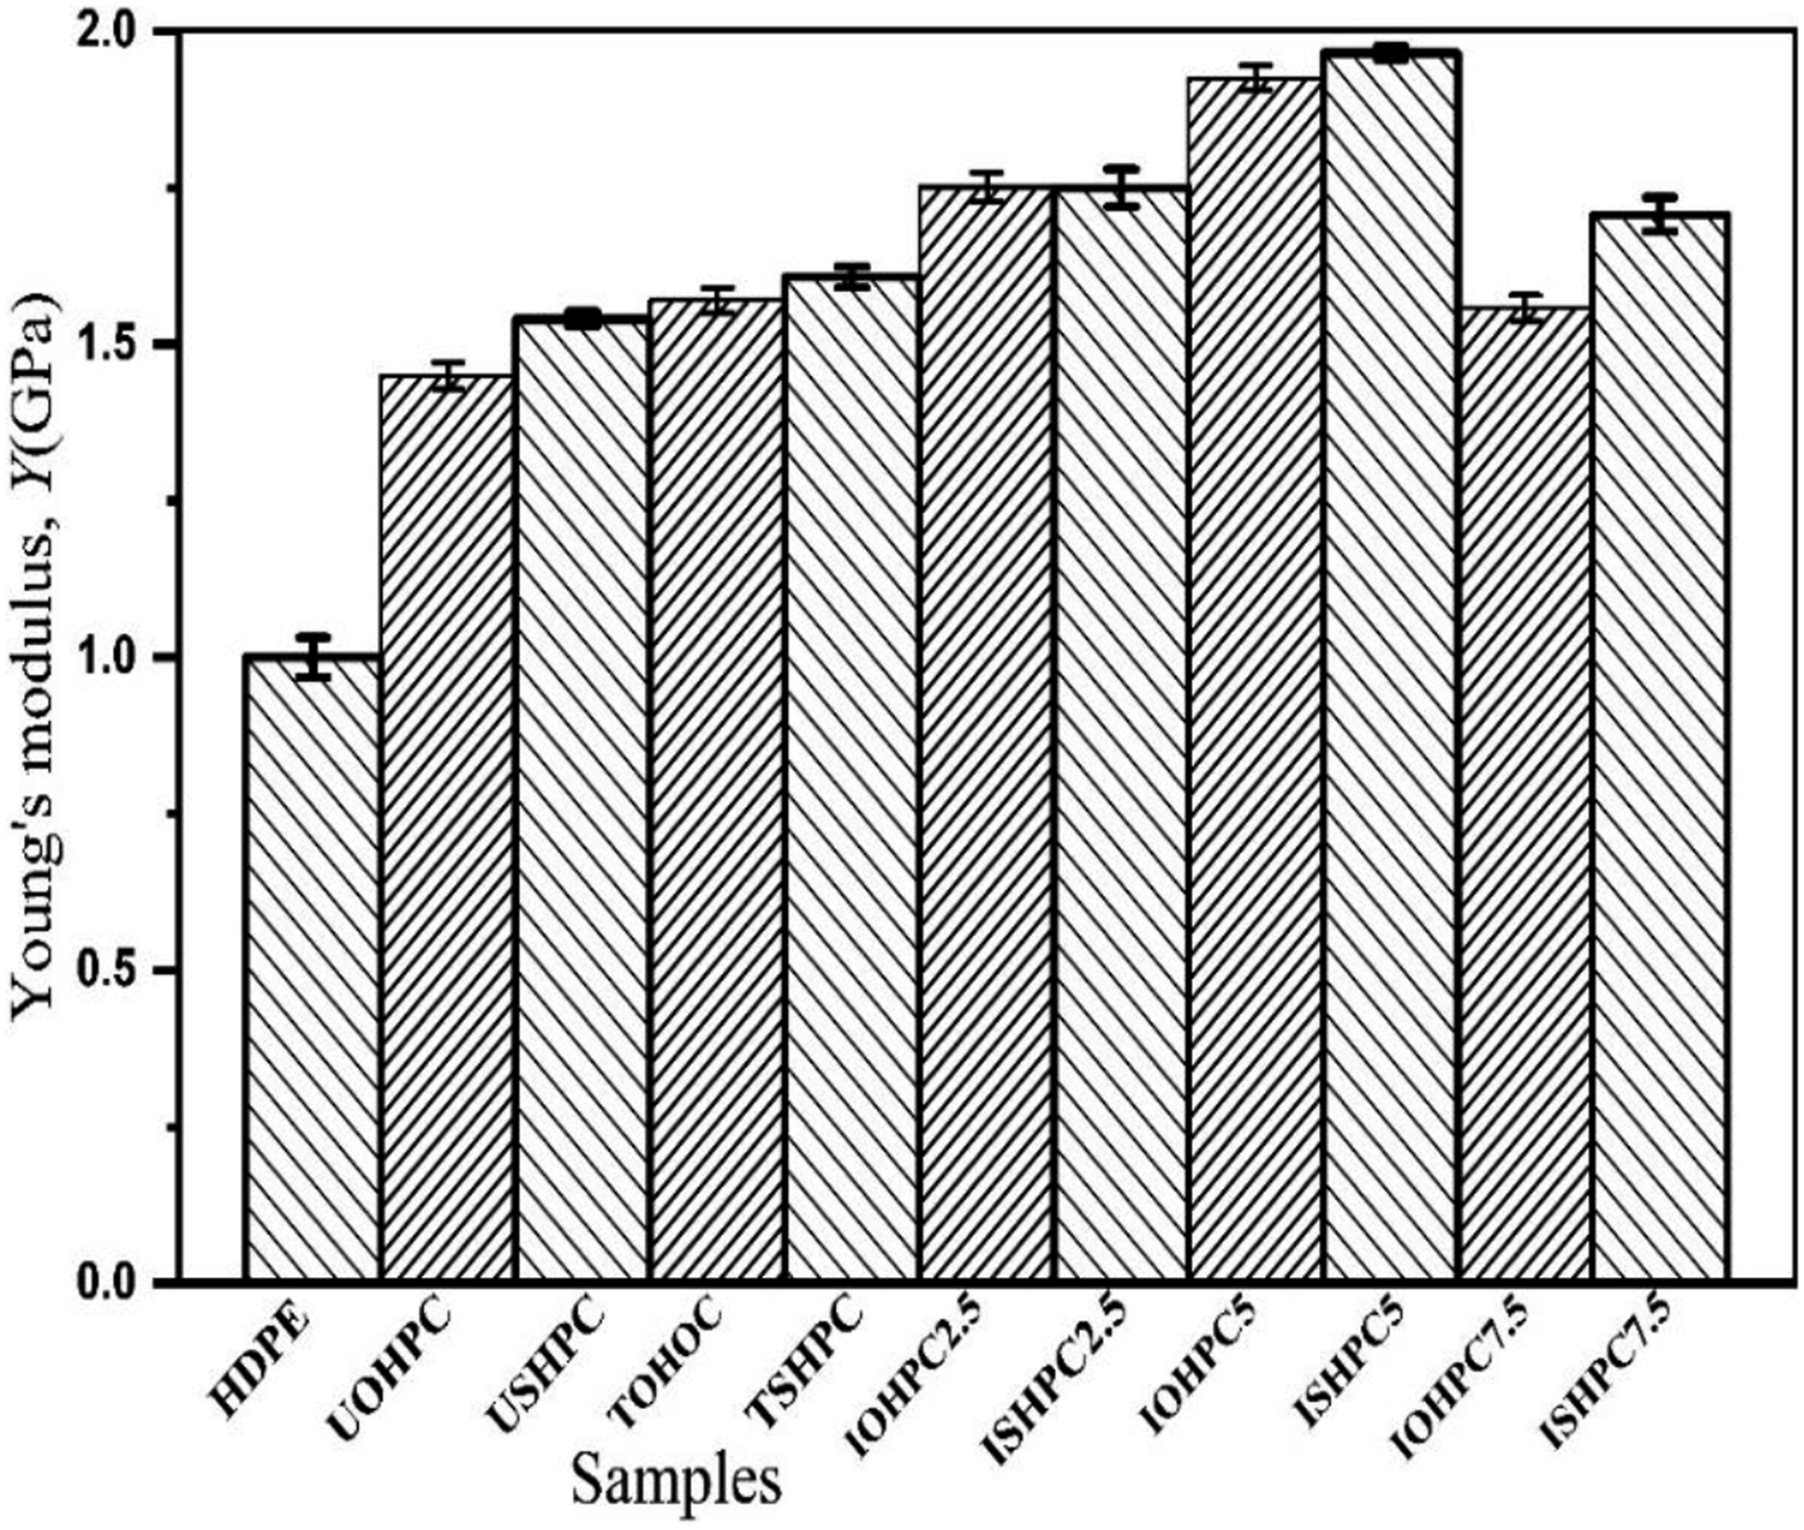
DSC analysis
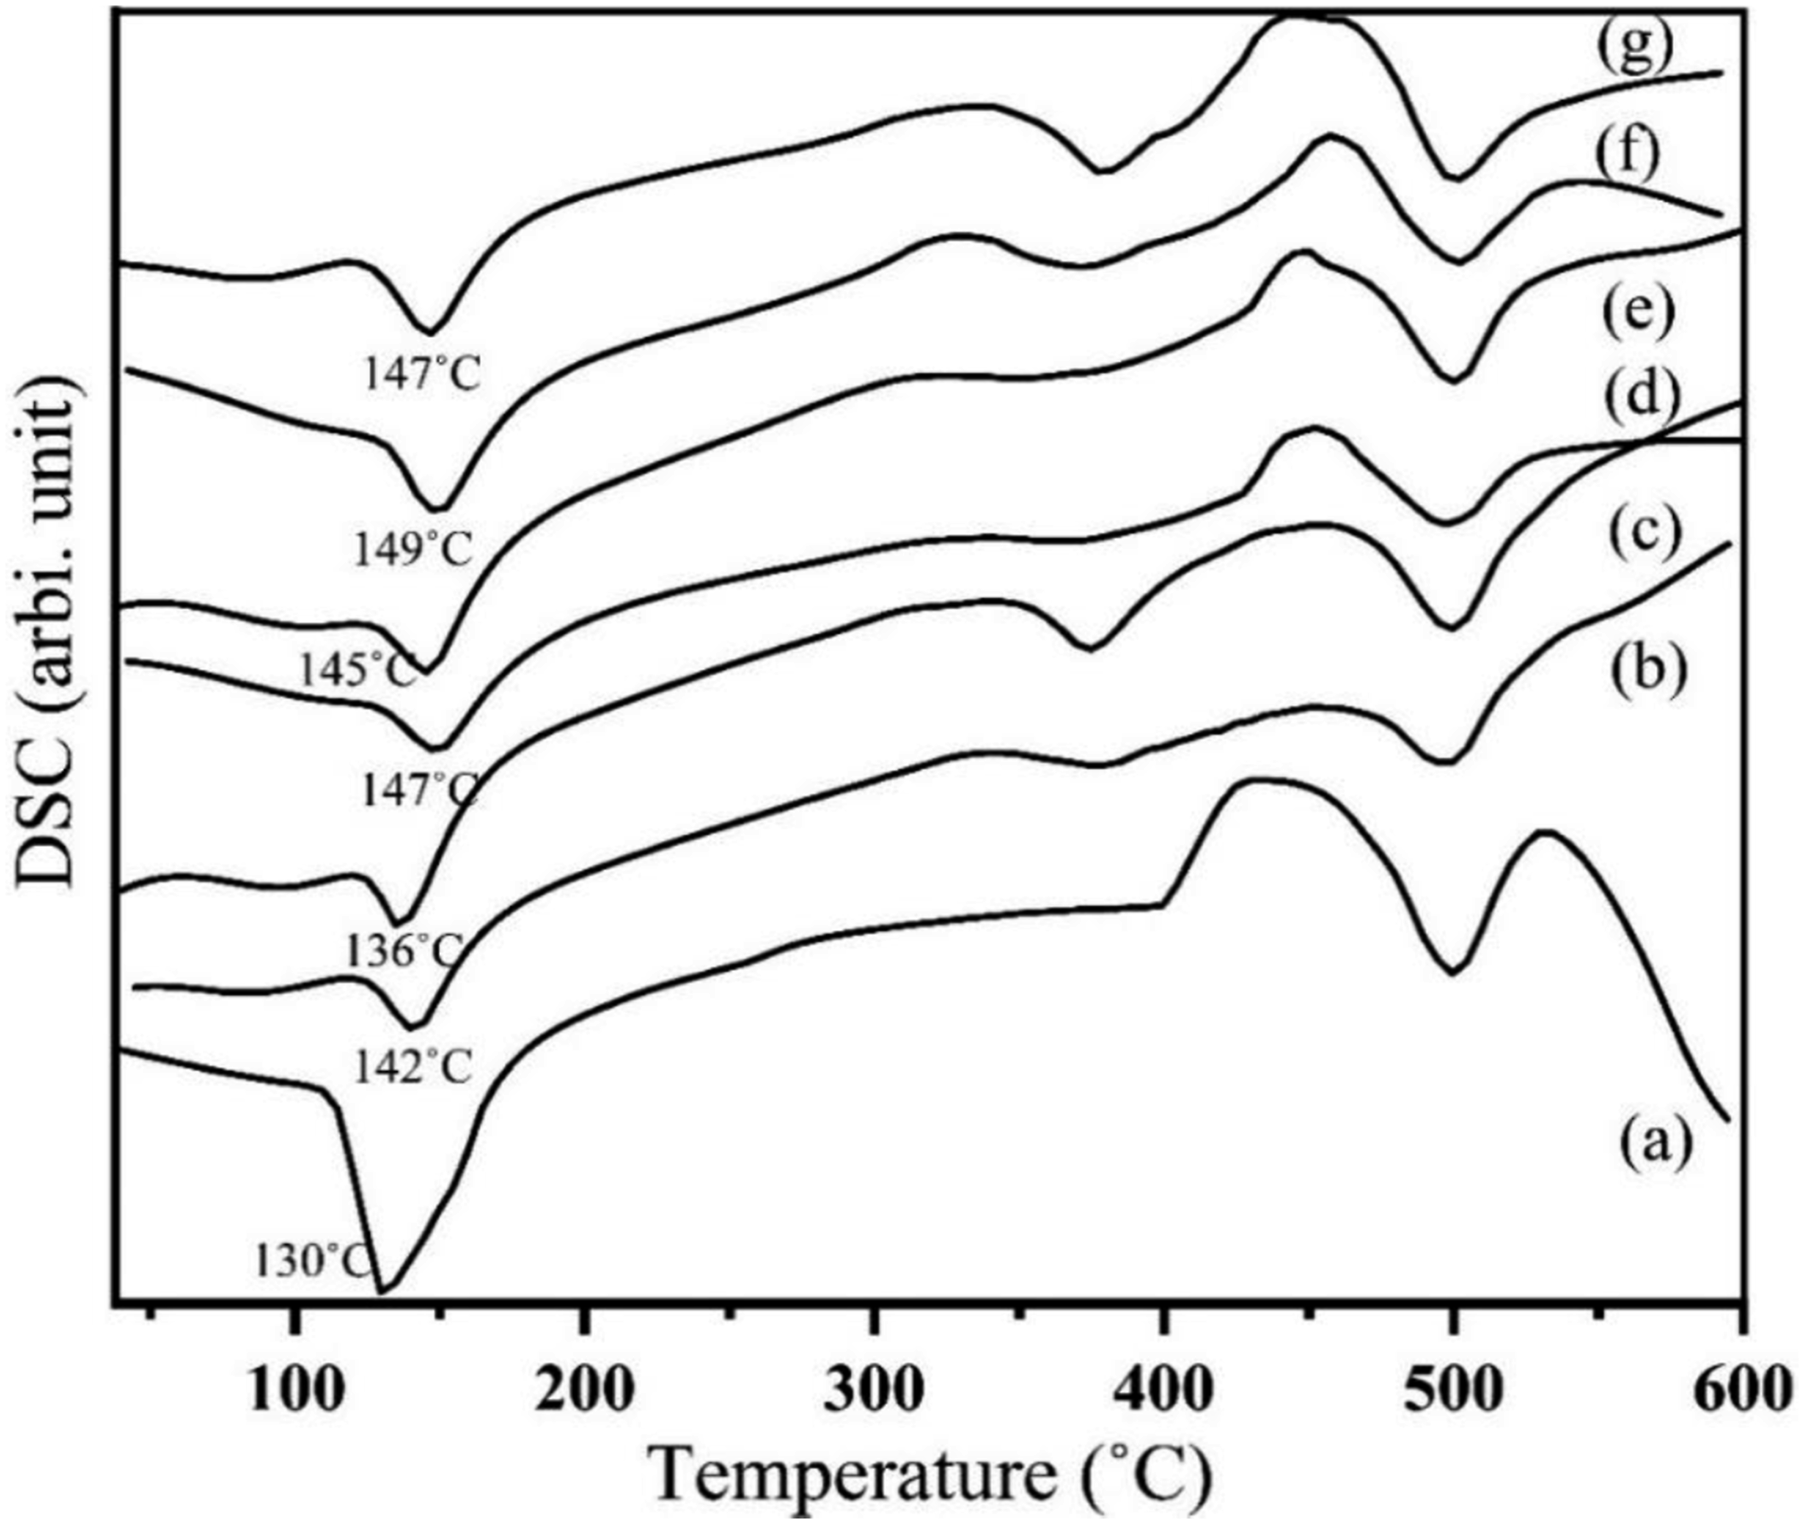
Figure 23 displays the DSC thermograms of USH, UOH, TSH and TOH cloths. According to other researchers’ findings,47,48 the absorbed water begins to emit from the fabric at 88°C and 96°C, which causes the UOH and USH cloths to display a diffuse peak at these temperatures. USH and UOH cloths show the degradation temperatures at 375°C and 378°C, respectively. The diffuse peak of TSH cloth is slightly shifted to the right at 388°C. Figure 24 shows two significant peaks in the DSC of HDPE, of which one shows the melting temperature at 130°C and the other shows the degradation temperature of HDPE, which occurs at 331°C and ends at 497°C. More than two endothermic peaks are seen in both the treated and untreated fiber-reinforced composites (Table 3). The melting temperatures of HDPE, USHPC, UOHPC, TSHPC, TOHPC, ISHPC5, and IOHPC5 are marked in Figure 24. The melting temperature and degradation temperature of UOHPC, TOHPC, and IOHPC5 are shown in Table 3. The shift of melting temperatures of the TSHPC and TOHPC to the right is possibly due to organized crystalline structures and the shift of melting temperature of ISHPC5 and IOHPC5 to the right is due the crosslinking in the samples.
49
DSC of USH, TSGF, UOH and TOH cloths. DSC of (a) HDPE, (b) USHPC, (c) UOHPC, (d) TSHPC, (e) TOHPC, (f) ISHPC5 and (g) IOHPC5. Melting and degradation temperature of HDPE, USHPC, UOHPC, TSHPC, TOHPC, ISHPC5 and IOHPC5.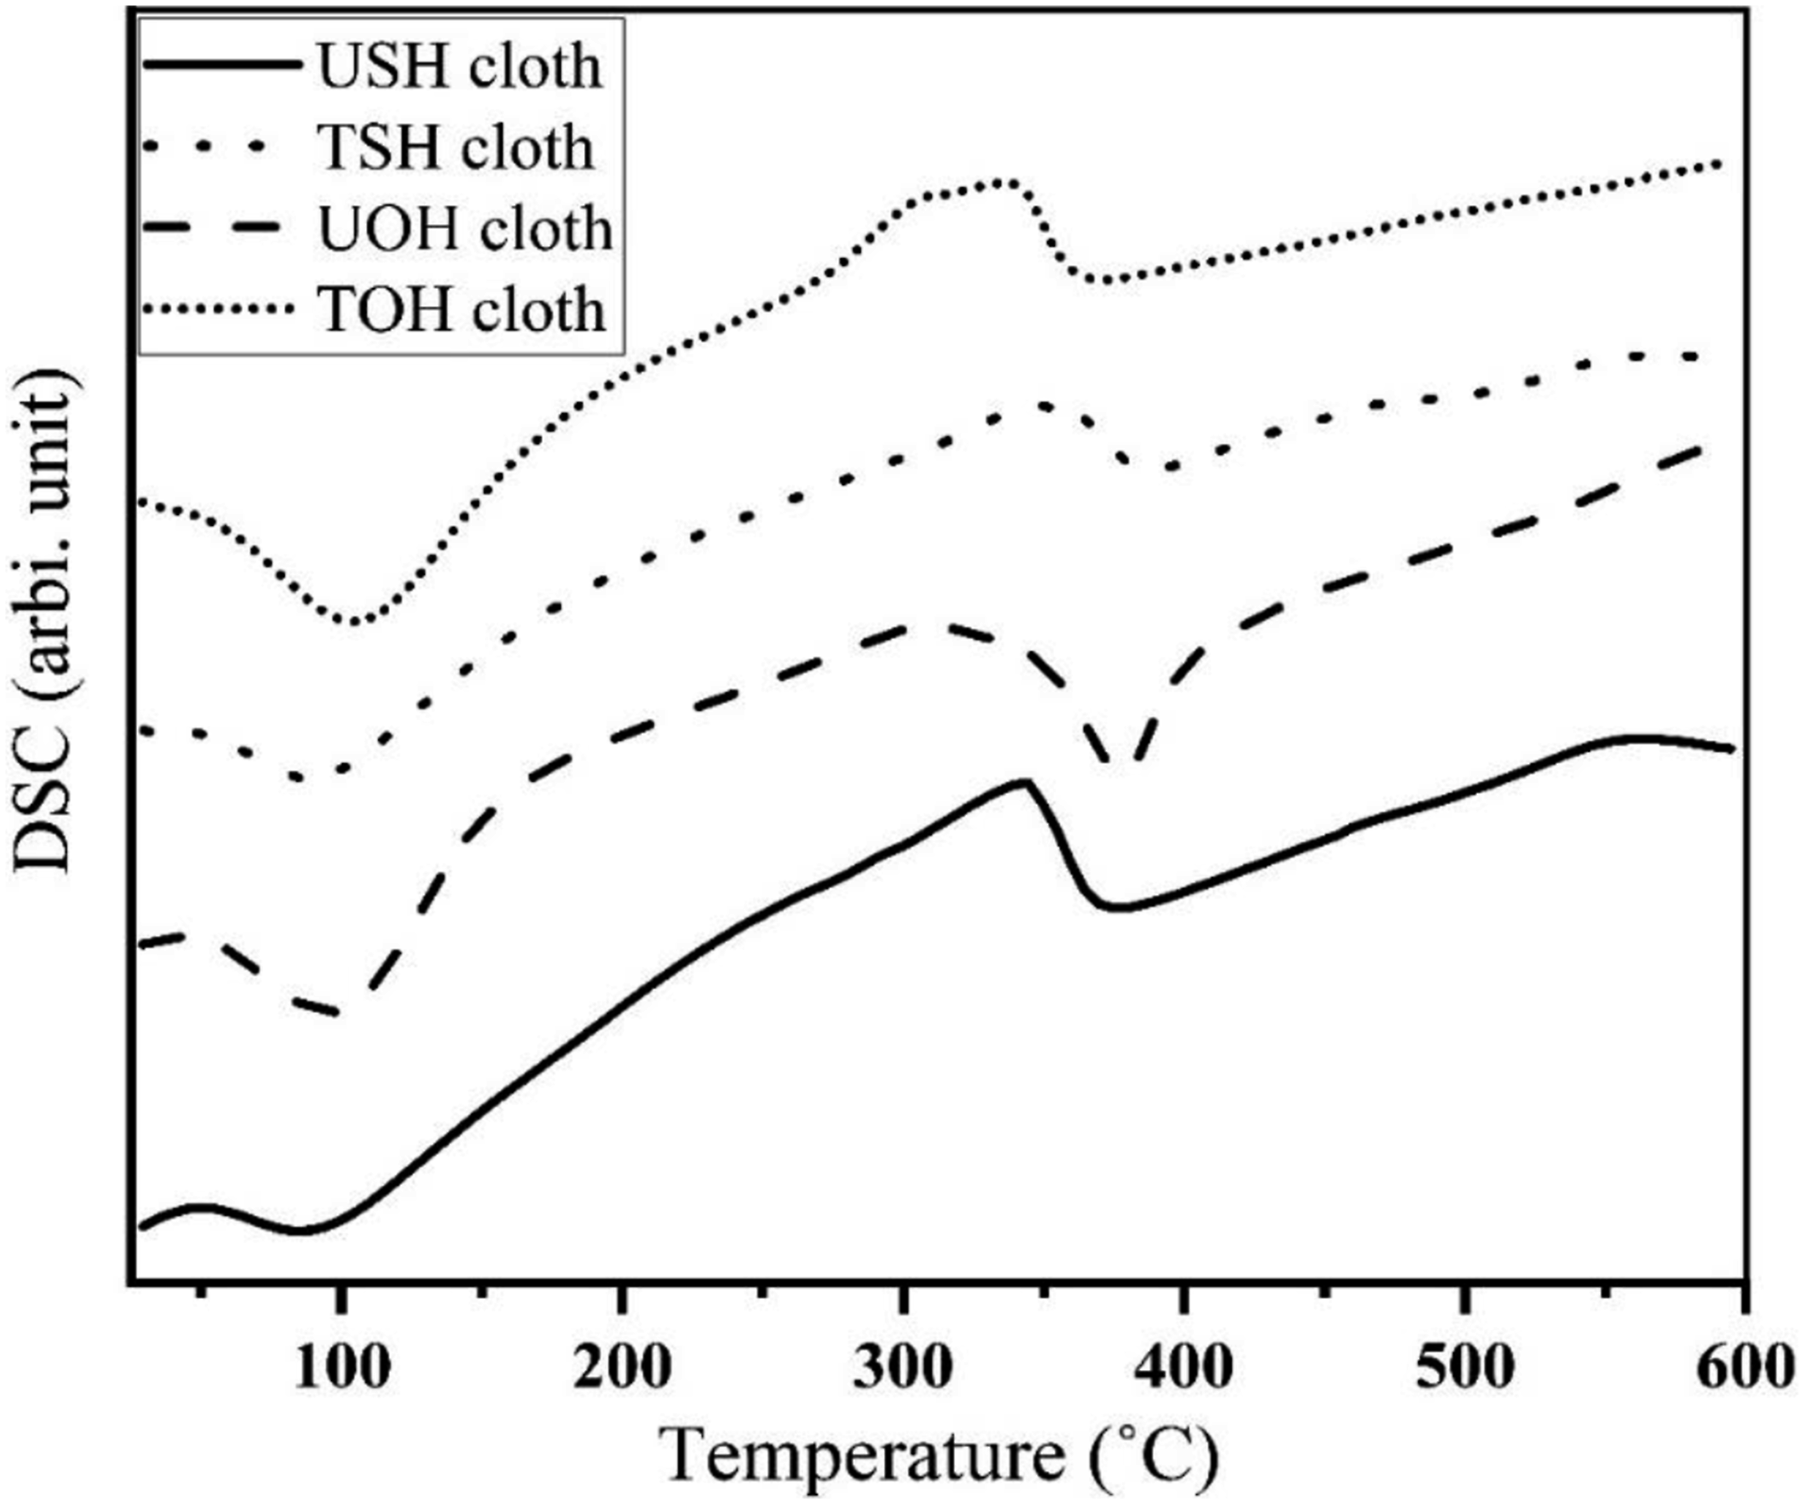

TGA analysis
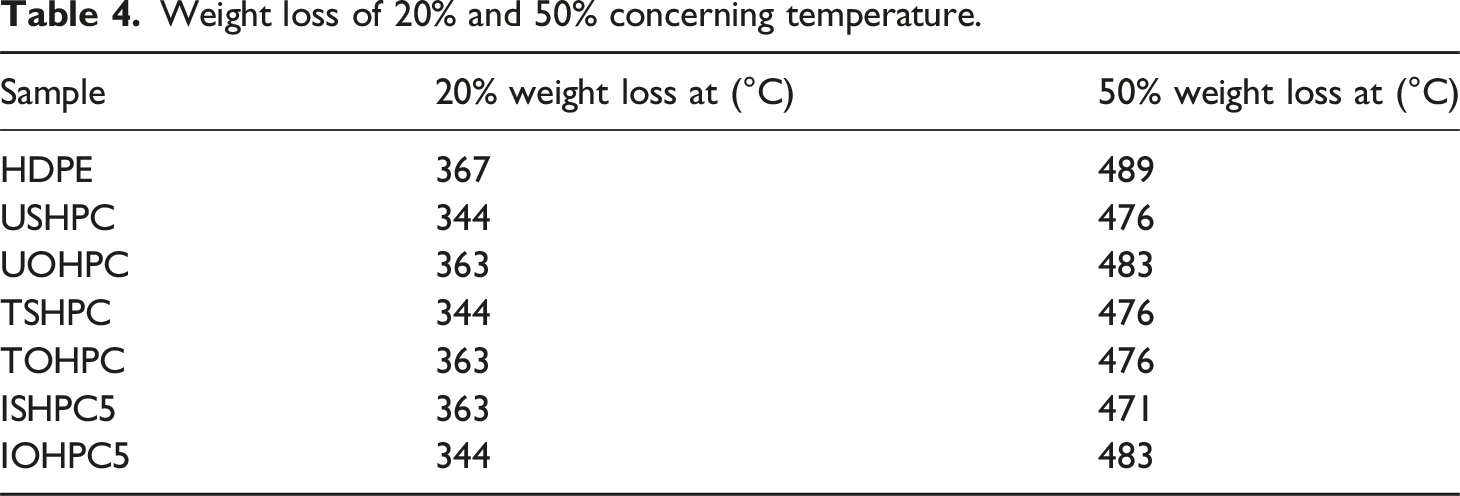
Figure 25 illustrates the TGA of USH, UOH, TSH, and TOH cloths. 50% weight was observed for TOH and UOH cloths at 365°C and 334°C, respectively. In addition, 50% weight loss also observed for USHPC and TSHPC is at 342°C and 355°C respectively. TGA of HDPE, UOHPC, USHPC, TOHPC, TSHPC, IOHPC5, and ISHPC5 are also shown in Figure 26. Weight loss of 50% HDPE, UOHPC, USHPC, TOHPC, TSHPC, IOHPC5, and ISHPC5 samples are introduced in Table 4. On the other hand, the derivatives of TGA for UOH, USH, TOH, and TSH cloths are shown in Figure 27. In the case of untreated cloths, a small peak at around 330°C is found. This is due to the degradation of cellulose and hemicellulose and after that lignin degrades. Besides, sharp peaks are found at different temperatures for different samples. Clearly, from the Figure, untreated cloths degrade at lower temperatures than the treated fibers.46,49 This suggests that treated cloths are thermally more stable than untreated samples. TGA of UOH, USH, TOH, and TSH cloths. TGA of HDPE, UOHPC, USHPC, TOHPC, TSHPC, IOHPC5, and ISHPC5. Weight loss of 20% and 50% concerning temperature. DTG of UOH, USH, TOH, and TSH cloths.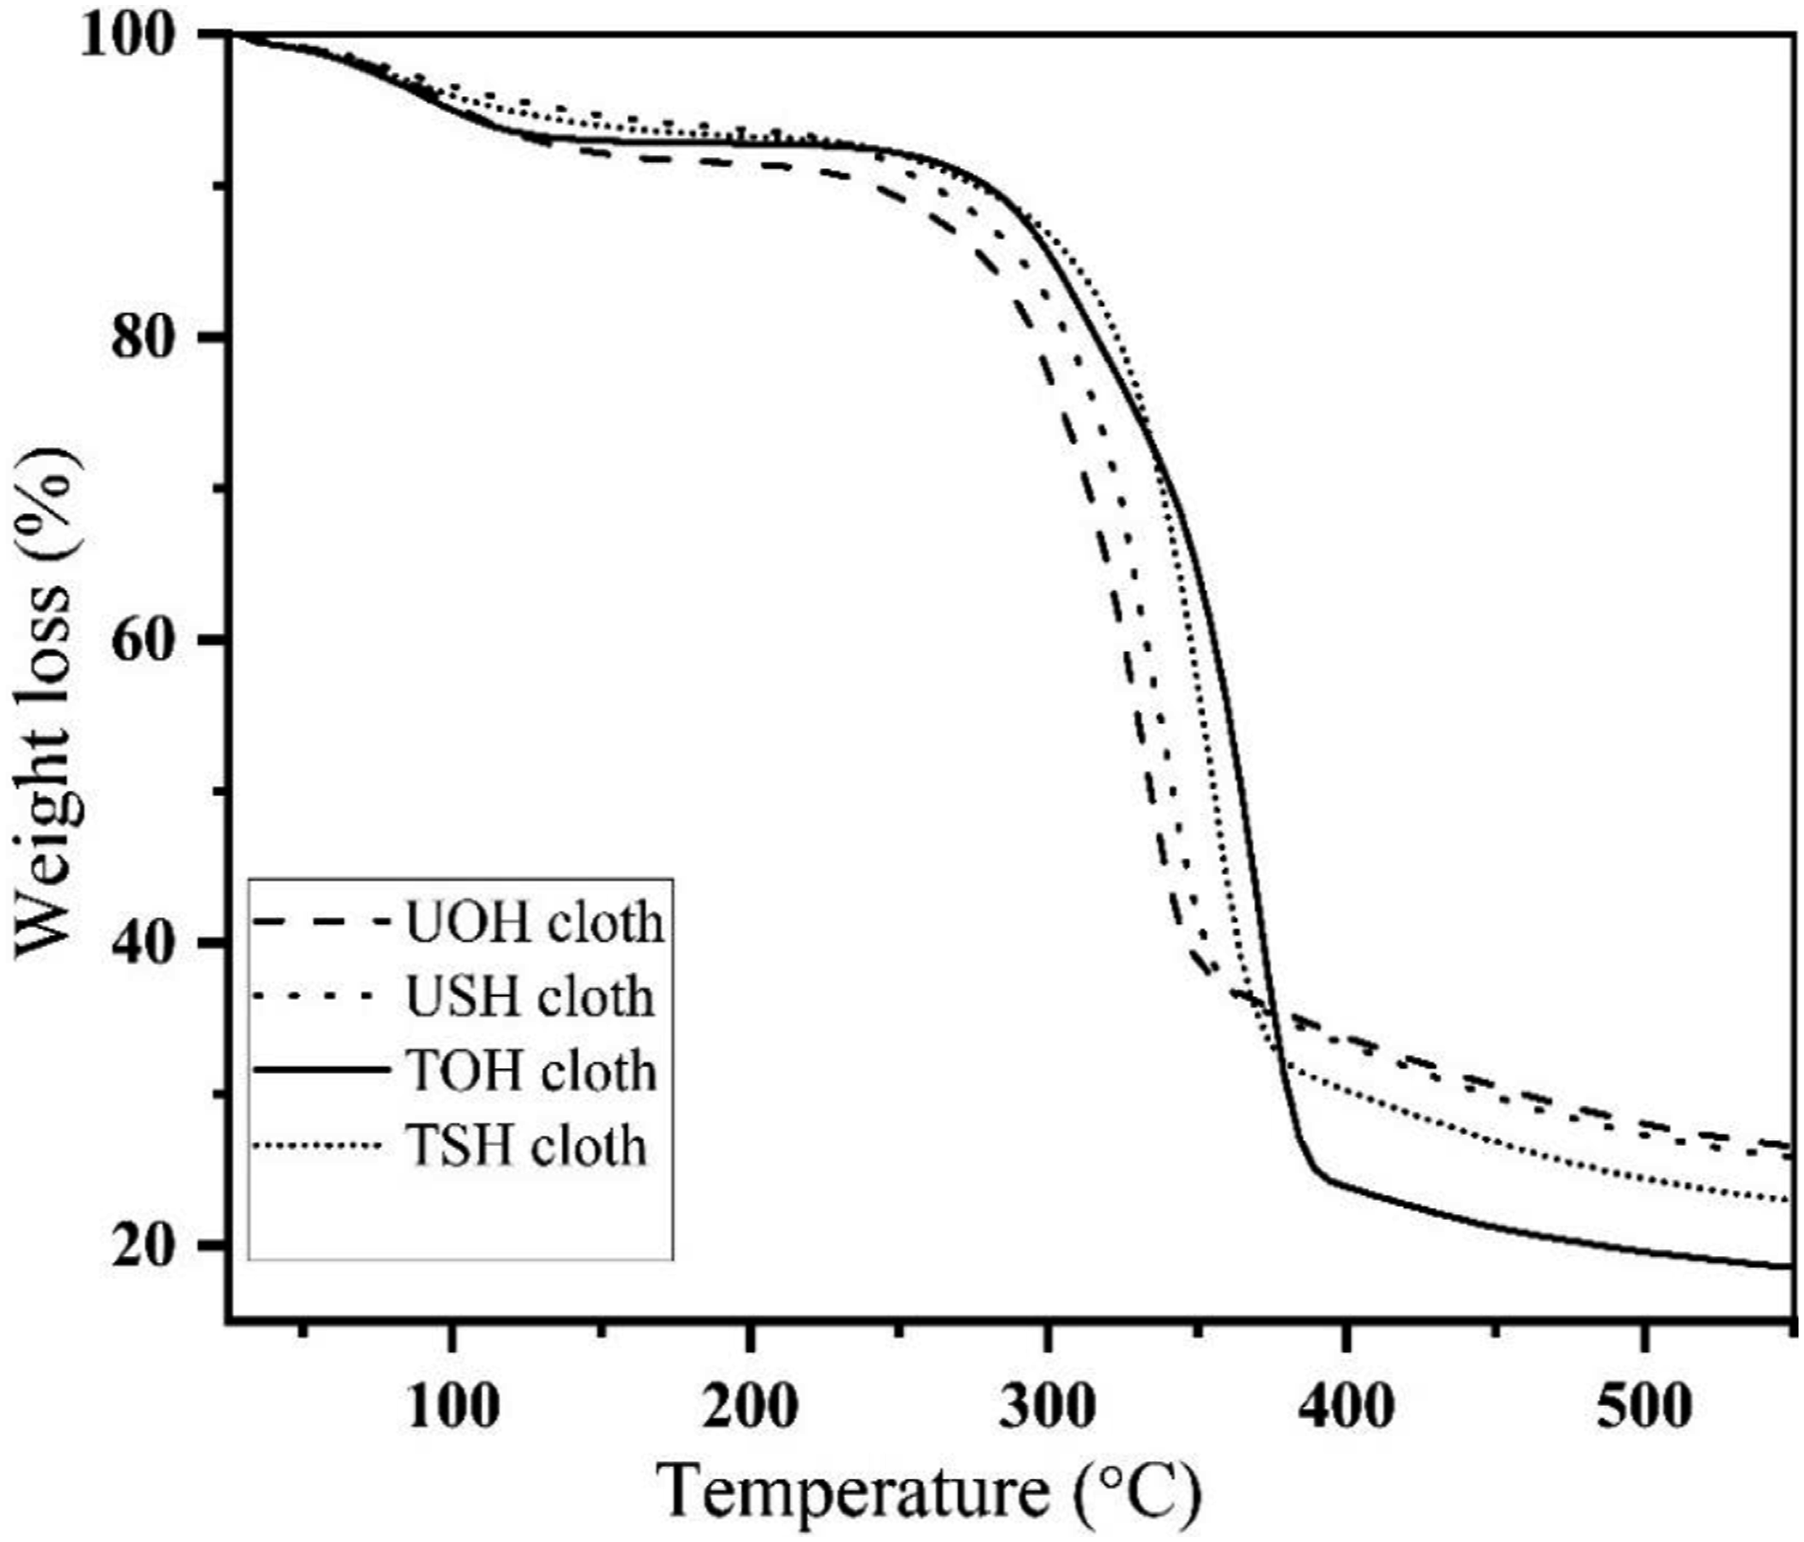
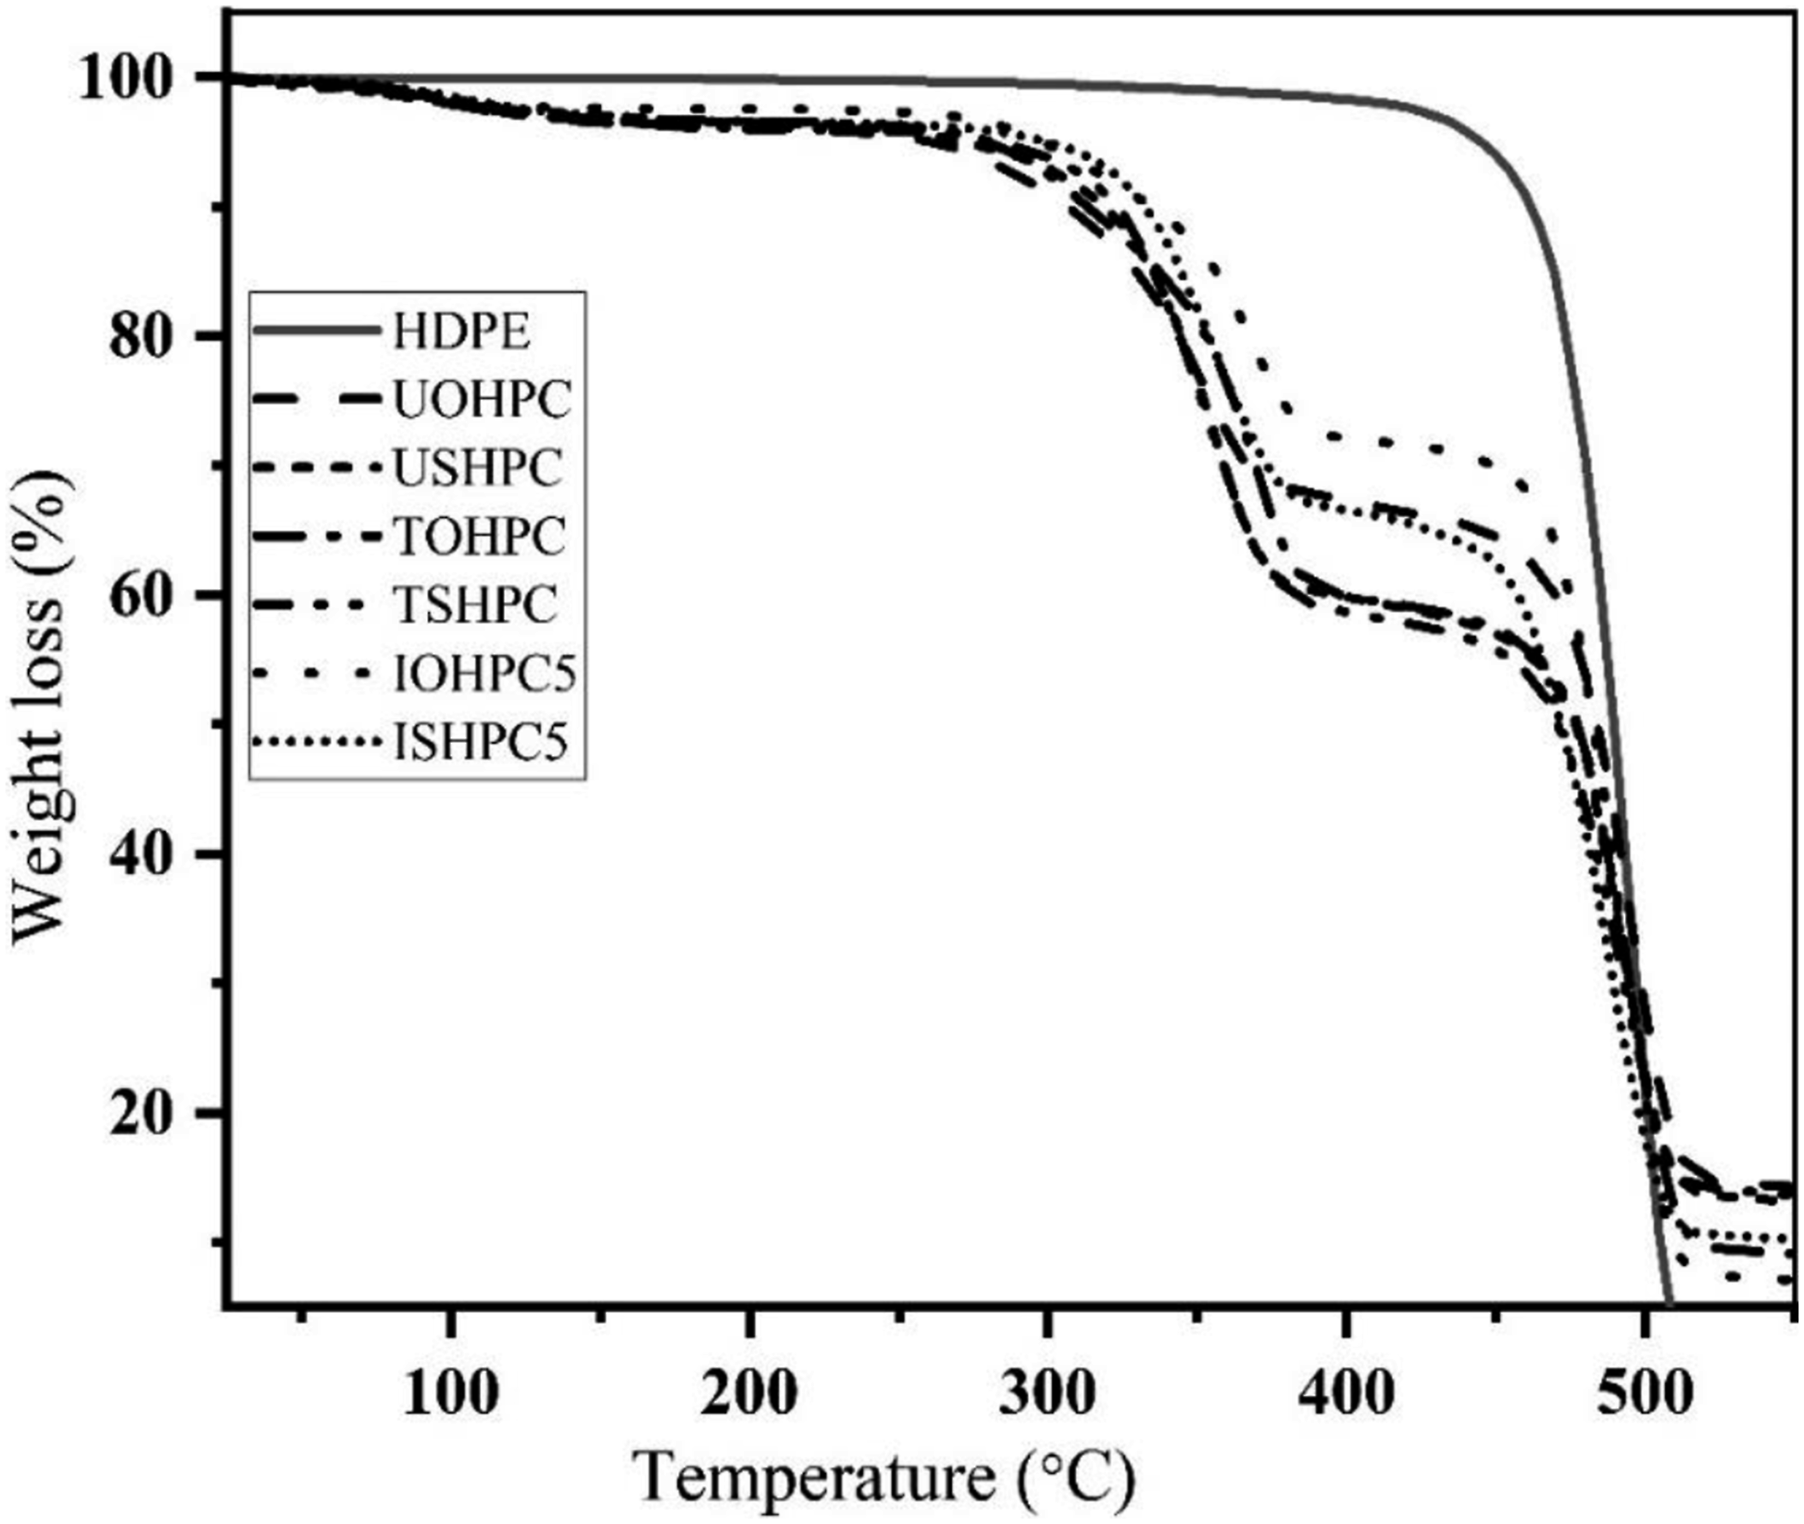
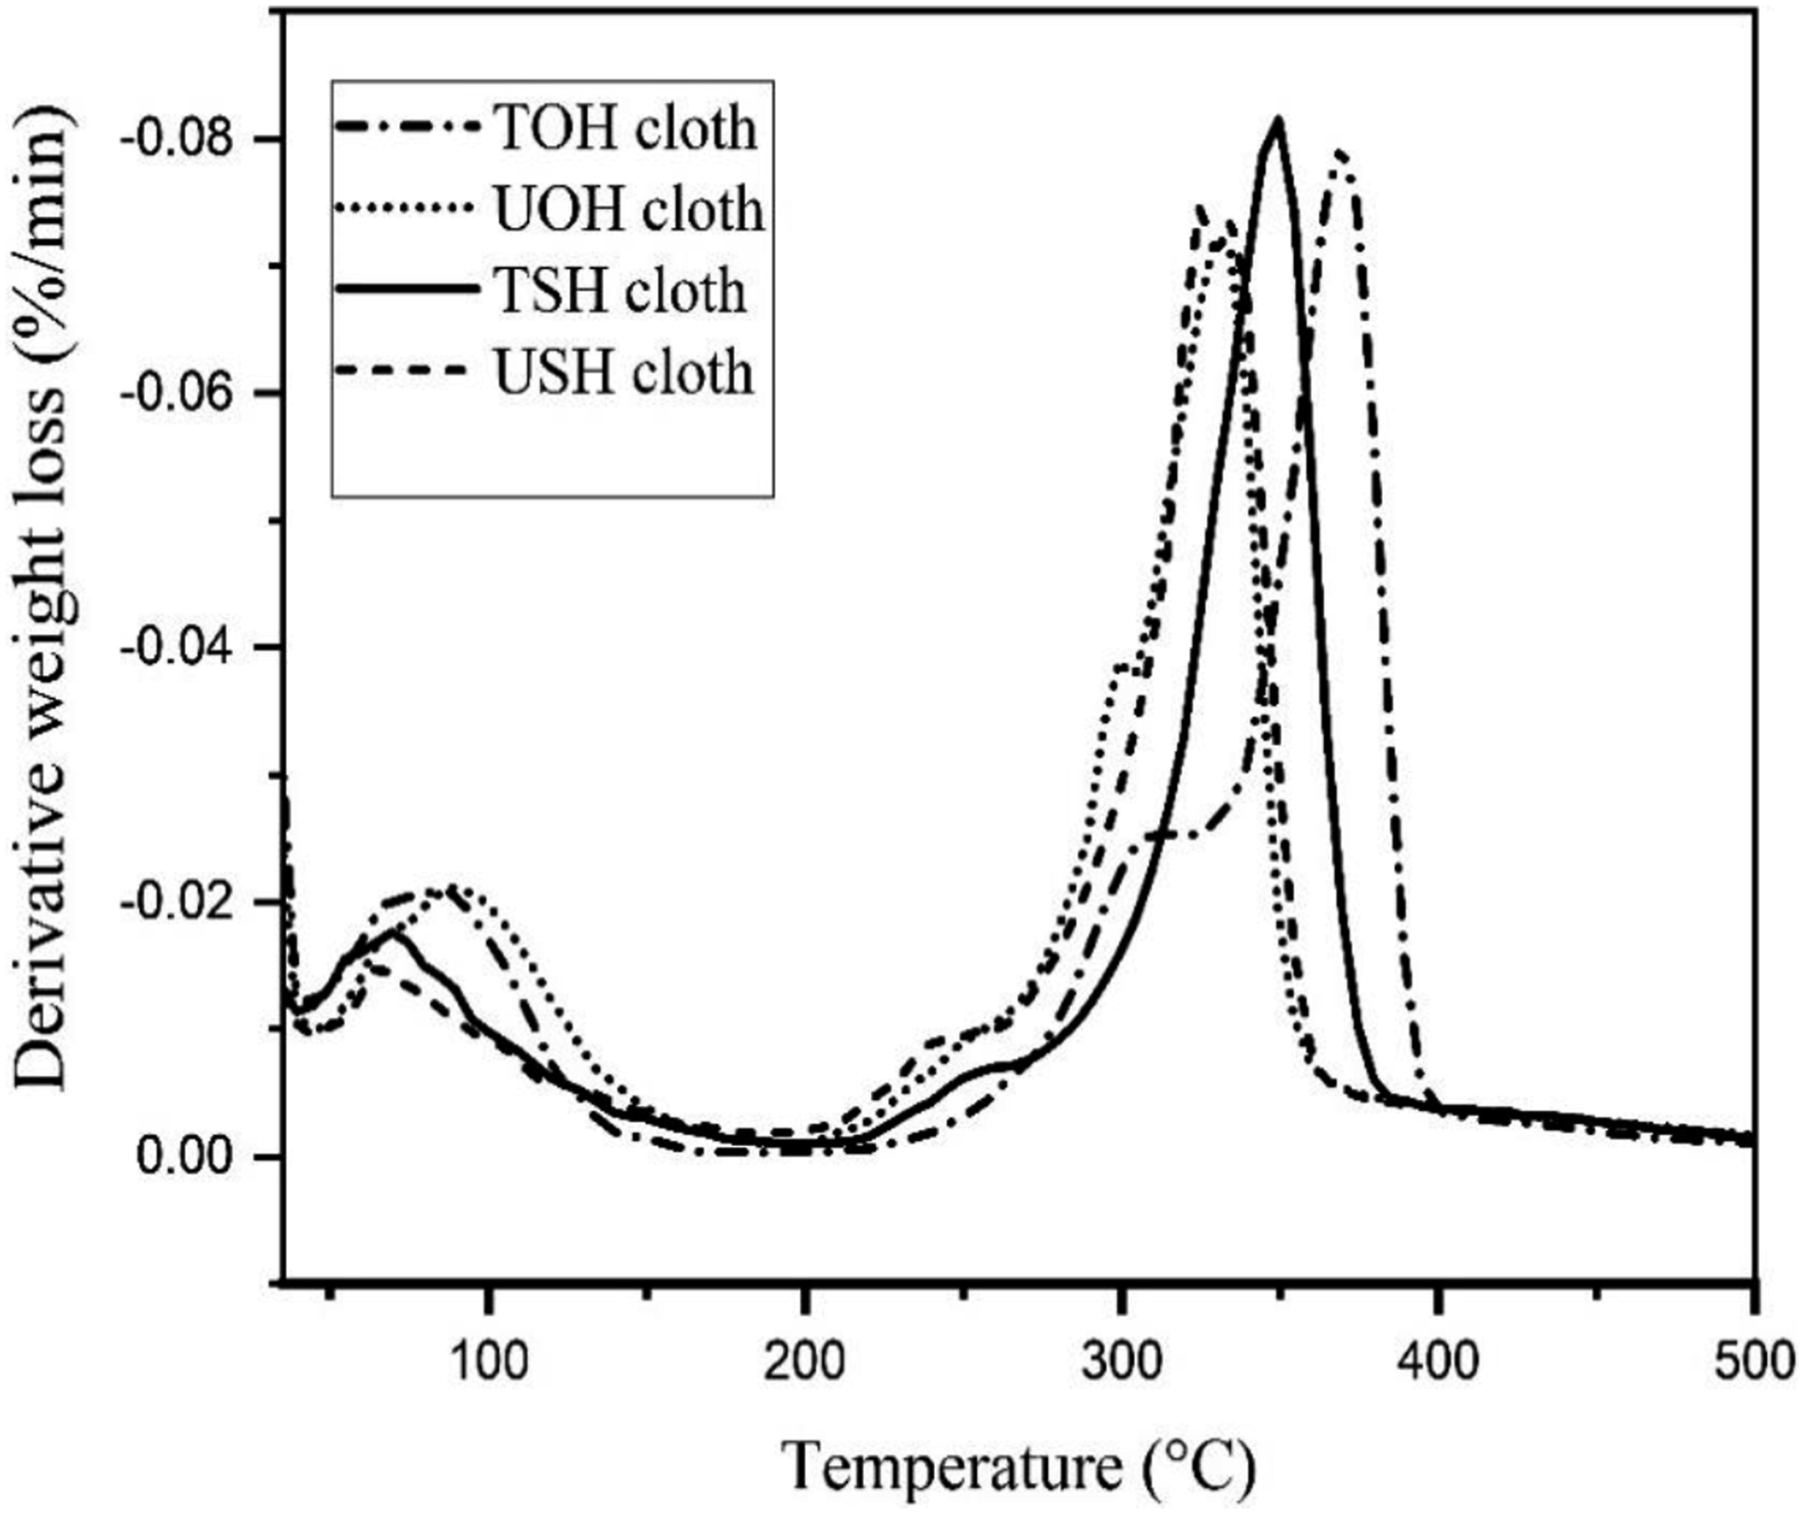
The derivatives of TGA for HDPE, UOHPC, USHPC, TOHPC, TSHPC, IOHPC5, and ISHPC5 are shown in Figure 28. The degradation of HDPE starts at 277°C and finishes at about 400°C, with only a peak in the first-derivative curve with a maximum peak at 488°C. This is due to the separation of C-C chain bonds along with H-abstraction.
50
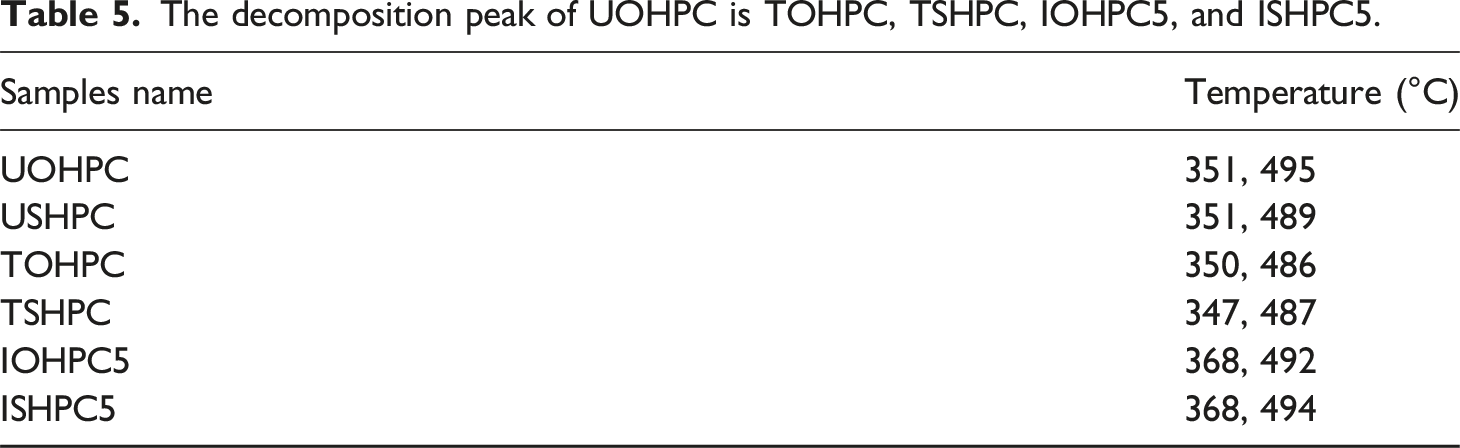
The thermal degradation of UOHPC, USHC, TOHPC, TSHC, IOHPC5, and ISHC5 is followed by the presence of two peaks. Primary weight loss at 350–368°C of the composite samples may have corresponded to the burning of the lignin, hemicellulose, and cellulose. The final weight loss of the composites was observed at the temperature range of 400–520°C by a breakdown of the HDPE.
50
From Figure 28, it is clear that the irradiated composites show higher degradation temperatures than those of untreated and alkali-treated composites. Table 5 displays the degradation temperature of UOHPC, USHPC, TOHPC, TSHPC, IOHPC5, and ISHPC5. DTG of (a) HDPE, (b) UOHPC, (c) USHPC, (d)TOHPC, (e) TSHPC, (f) IOHPC5, and (g) ISHPC5. The decomposition peak of UOHPC is TOHPC, TSHPC, IOHPC5, and ISHPC5.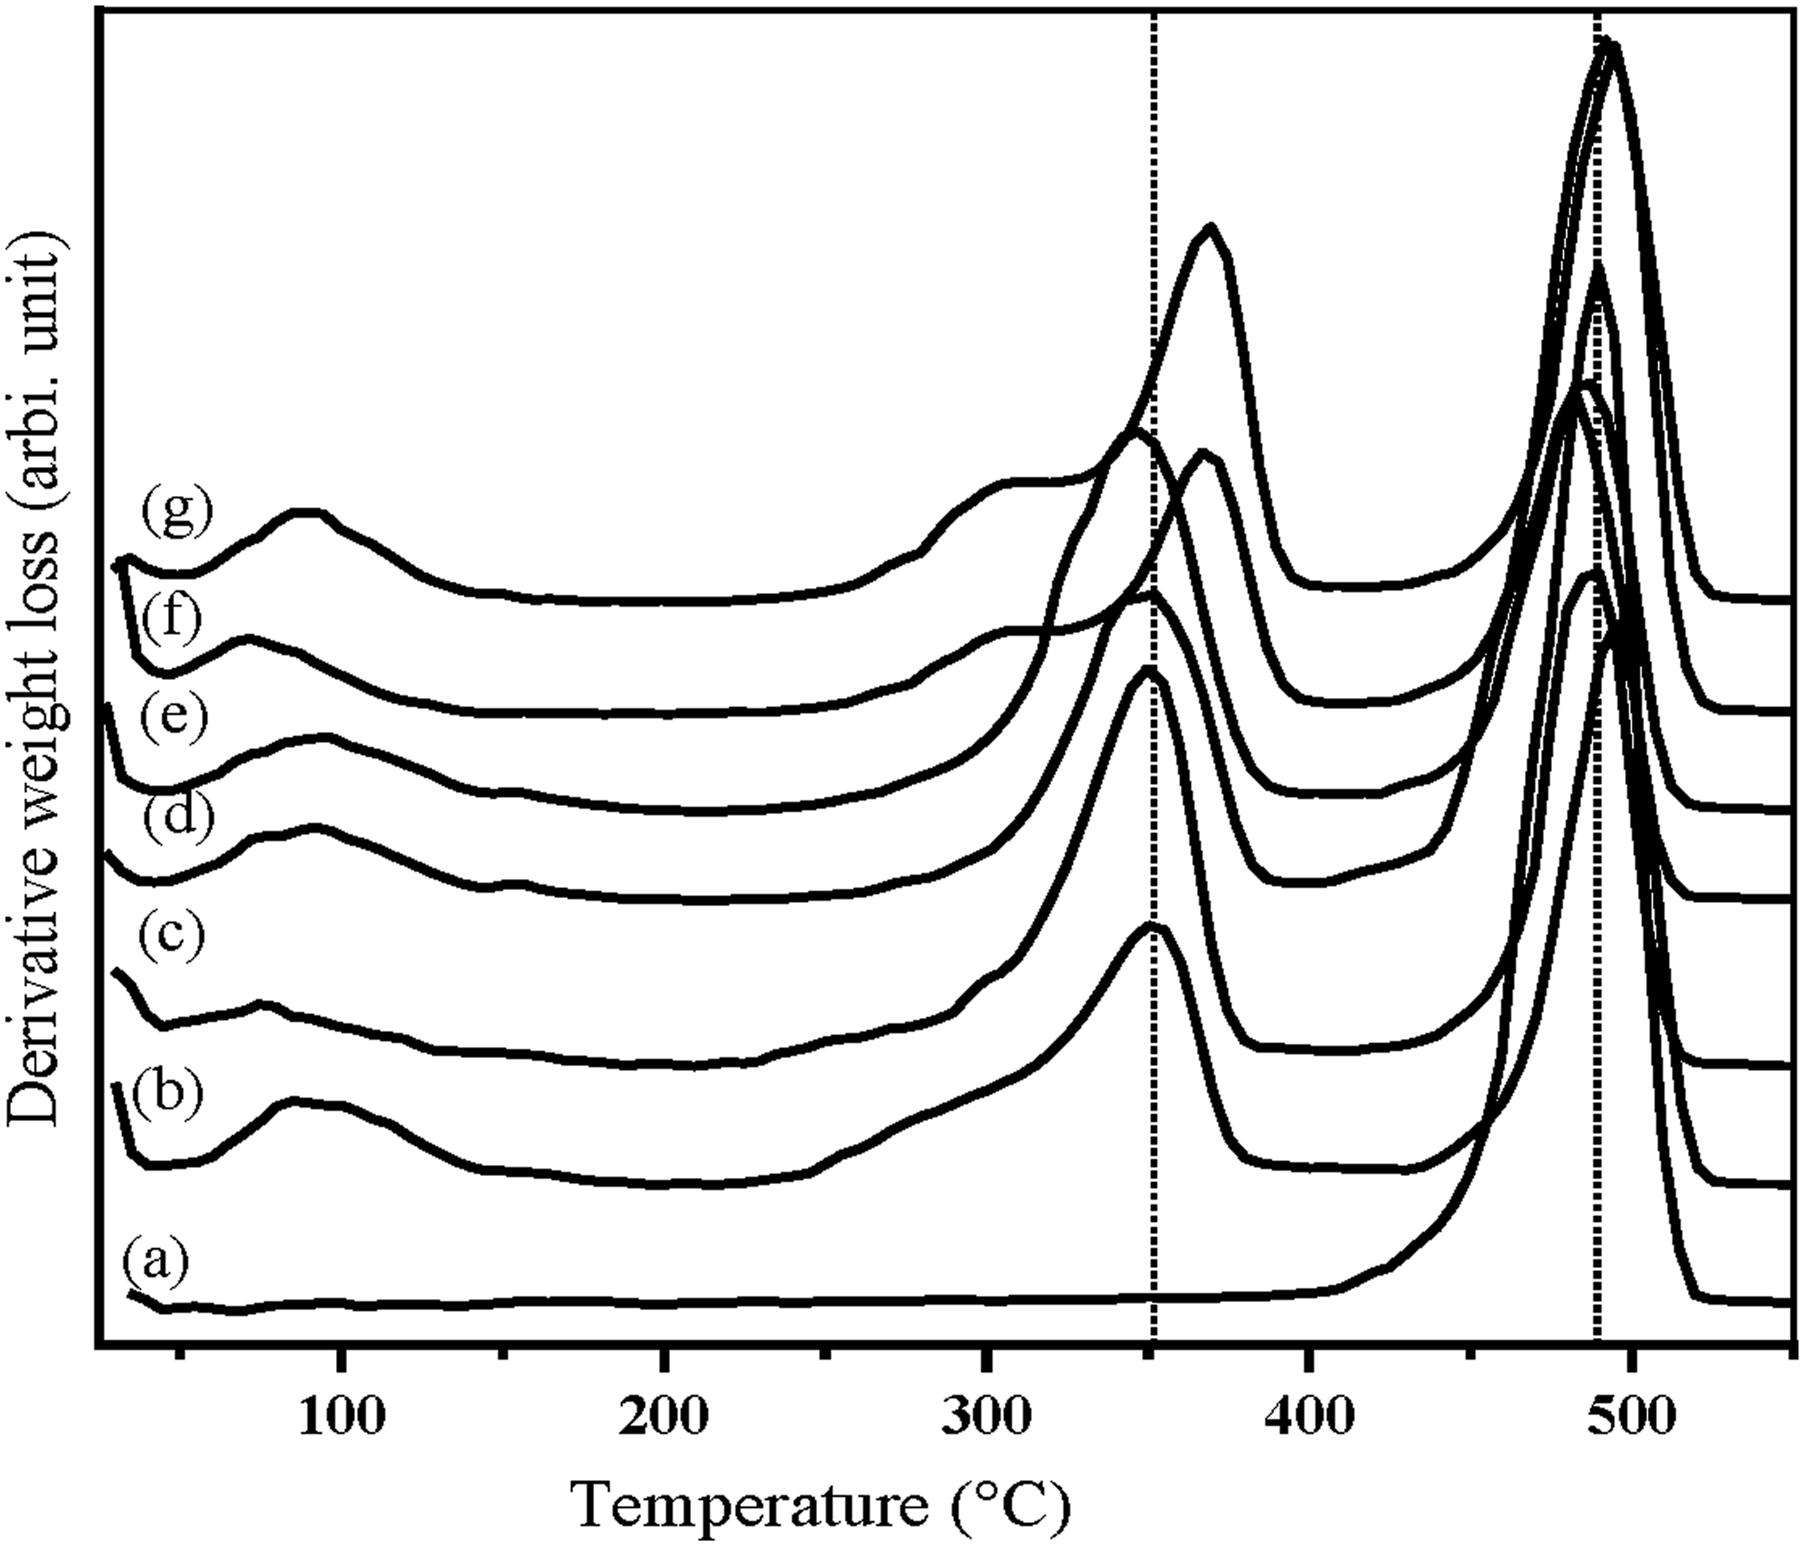
Conclusions
UOHPC and USHPC with 40, 45, 50 55, 60, and 65 wt% cloth contents were fabricated by compression molding method. The optimum fiber content was measured for both UOHPC and USHPC, which is 55 wt%. UOH and USH were treated with 5, 10, and 15 wt% alkali solutions, and it was discovered that 10 wt% alkali solution-treated cloths showed an improved tensile strength for TOHPC and TSHPC. Then, a composite prepared with 55 wt% cloth content treated with 10 wt% alkali solution was taken to be irradiated by various doses of gamma rays. A total of HDPE, USH cloth, TSH cloth, USHPC, UOHPC, TSHPC, TOHPC, IOHPC5, and ISHPC5 samples were prepared and characterized using XRD, FESEM, FTIR spectroscopy, water intake test, mechanical test, and thermal test methods. According to XRD, the crystallinity of TSH cloth is 8.33% higher than that of TOH cloth. The crystallinity of TSHPC and ISHPC5 are 10.52 and 10% greater than that of TOHPC and IOHPC5, respectively. According to FESEM, IOHPC5, and ISHPC5 exhibit improved fiber-to-matrix adhesion than their treated and untreated composites, respectively. The formation of -CH, O=C, and C-C bonds is confirmed by the FTIR in IOHPC5 and ISHPC5. The sample ISHPC5 shows 5 % less water intake properties than that of IOHPC5. This is due to the hydrophobic nature of the treated composites. The TS value of ISHPC5 is 68 MPa and the TS value of IOHPC5 is 66 MPa. These values are greater than those of untreated and alkali-treated composites. The Y value of ISHPC5 is 1.925 GPa and the Y value of IOHPC5 is 1.965 GPa. The melting temperatures of TSHPC and ISHPC5 are 147 and 149°C, respectively, and that of TOHPC and IOHPC5 are 145 and 147°C, respectively. From the results, it can be concluded Sunn hemp hessian cloth-reinforced HDPE composites show better performances than Okra hessian cloth-reinforced HDPE composites.
Future scope
If researchers continue employing various fiber diameters and orientations for their investigation, they can anticipate better and more appropriate results. Instead of thermoplastic, various types of thermoset polymers may also be used to construct the composite. These materials can be used as everyday household items and are lighter than those used by automakers.
Footnotes
Acknowledgements
The Bangladesh University of Engineering and Technology (BUET), which provided financial support for this research project, is gratefully acknowledged by the authors. They appreciate the facilities provided for this research by the Institute of Radiation and Polymer Technology (IRPT), Atomic Energy Research Establishment (AERE) Savar, Dhaka, Bangladesh.
Declaration of conflicting interests
The author(s) declared no potential conflicts of interest with respect to the research, authorship, and/or publication of this article.
Funding
The author(s) disclosed receipt of the following financial support for the research, authorship, and/or publication of this article: Only sample test funding by the Bangladesh University of Engineering and Technology.