
Abstract
Injection molding is one of the preliminary production methods for plastic components. Typically, injection molding Moldflow simulations predicts potential issues like air void, weld-line, warpage etc. This work focuses on weld-line defect, which occurs when two or more flow fronts are meets each other during filling of the cavity. Most of the commercial algorithms are based on isotropic and homogeneous material assumptions however plastic materials are anisotropic and heterogeneous in nature. Therefore, accuracy with isotropic solvers may vary with actual reality. To consider material anisotropy and heterogeneous nature of the material, an integrative simulation is advantageous technology which gives more realistic results. A unique approach of integrative simulations has been used in this work to predict the strength of the weld-line as there is no direct standard procedure or software available to get weld-line strength. Moldflow simulation is performed on specially designed plaque wherein the weld-line is reproduced considering 30% glass-filled polyamide-6 material. The new material model is developed by mapping the structural model of tensile specimens on the Moldflow simulated plaque with integrative mapping approach. The mapped model considers fiber orientation and weld-line characteristics of the material which is then solved in the Abaqus structural solver. Experimental validation is performed by manufacturing of weld-line plaques, specimen preparation, and experimental testing. The results correlation is done for an isotropic and anisotropic material model with experimental results. The correlation study shows, a significant difference in results for isotropic simulation and integrative anisotropic simulations. The failure pattern and load-displacement behavior of integrative simulation is close match with experimental results with minimum 93% accuracy.
Introduction
In the industrial revolution of the twenty-first century, engineering thermoplastics becomes a more popular material owing to its wonderful advantages like chemical resistance, lightweight, excellent mechanical properties, ease of manufacturing, recyclability, etc. Injection molding manufacturing method is one of the suitable methods to process the thermoplastic materials to produce the final parts. Weld-line in injection molded parts is formed, when two melt fronts meet each other. 1 It is one of the common defects which occur in injection molded parts affecting their functionality thus causing dissatisfaction among the customers’. It commonly occurs on circular designs, holes, or an obstruction in the path of the melt flow. From the perspective of the part's strength and surface aesthetics, the weld-lines are undesirable. It usually reduces strength locally and when load transfer takes place through weld-line area, crack initiation occurs followed by failure of the components. 2 In general, mold maker tries to avoid weld-line by selecting proper gate location, using advance sequential valve gate or local heating to improve the overall quality of weld-line area. However complete elimination of weld-line is not possible for complex or circular designs therefore it is required to find effect of weld-line to avoid any potential failure.
Commercial software companies are trying to build algorithms to find out the location and strength of the weld-line. Software like Autodesk Moldflow, and Moldex 3D have included good algorithms to find out the location of the weld-line. However, finding the strength of the weld-line is still under development as strength calculation is part of structural software and it is quite difficult to address it in moldflow software’s as it needs to include complex non-linear finite element code. There are a few simulation experts who tried to integrate both Moldflow and structural solver for customized applications. Also, structural software packages like Abaqus, Ansys, LS dyna, etc. have become compatible to solve integrated files by considering injection molding manufacturing parameters. In general, it is called the integrative simulation method. 3 Nowadays OEMs and material suppliers are working on the development of special-purpose integrative simulation modules considering different parameters like fiber orientations, shrinkage, warpage, temperature, pressure, etc. There are a few mapping tools like Digimat from Hexagon, Helius from Autodesk, Multiscale Designer from Altair, etc. having different interfaces to connect with manufacturing and structural solvers. However, the result accuracy of the integrated simulation method is highly dependent on material characterization and how precisely parameters are mapped or integrated into the solver.
Many researchers have carried out work related to weld-line considering various aspects, parameters, and materials to find out the impact of weld-line with experimental, analytical, and simulation methods. Mosey et al., 1 performed detailed moldflow simulation on automotive parts with 30% glass fiber-filled polyamide 6-6, and process parameters and gate locations are optimized through Taguchi parametric method, and they found that number of weld-lines can be reduced by almost 7.5% through optimization. Onken et al., 2 developed a calculation sub-routine to find out the strength of the weld-line which is based on injection molding simulations. They have developed different models for the healing of the weld-line by considering temperature, pressure, and shear rate and found a good correlation with experimental results for amorphous polystyrene material. Hopmann et al., 3 developed an integrative simulation method based on experimental data and thermo-rheological data from moldflow simulations to find weld-line behavior. The simulation results showed lower values compared with experimental results and hence concluded that calibration needs to be improved based on interdiffusion and modified temperature and pressure factors. Yang et al., 4 proposed a computer determination method to find out weld-line based on filling analysis considering surface model and validated results with Moldflow simulation and visual check on actual parts in production and found the proposed method is correct and can be effective for actual production. Their work also investigated the effect of cavity thickness, injection molding process parameters, and mesh sensitivity on weld-line. Quintana and Frontini, 5 investigated weld-line strength for glass fiber reinforced injection molded part by inspecting morphology and fiber orientation microstructure by simulation and concluded hot weld-line has a detrimental effect on mechanical performance on the part and strength of weld-line area is mainly controlled by fiber orientation concerning the loading direction. Kitayama et al., 6 conducted a study on optimization for reducing weld-line size and cycle time with the help of numerical simulation by a sequential approximate optimization technique. They found that the larger the ratio between weld-line temperature and injection time, the shorter the weld-line size and cycle time, and the same had been confirmed by experimental testing. Liu et al., 7 used the co-injection modeling technique to evaluate the formation and growth of the hot weld line and their results show that the co-injection modeling method provides more comprehensive information on the flow history of the melt-front compared to the conventional injection molding technique. Kovacs and Siklo, 8 performed a simulation of weld-line formation and suggested a method of discretization of the finite elements for good agreement with experimental results. Feng et al., 9 created an orthogonal assay based on with Taguchi method in Autodesk Moldflow software to understand the effect of different processing parameters for weld-line containing microcellular injection modeled solid and foamed Polyether–ether–ketone (PEEK) part. They found strength reduction with weld-line for a foamed sample is 8.1% and for solid samples it is 9.4% compared with respective no weld-line sample. Dairanieh et al., 10 studied the sensitivity of the Moldflow simulation algorithm for the prediction of the weld-line concerning changes in material properties and process parameters and found that algorithm predicting correctly for the effect of viscosity, density, PTV relationship, and injection time on weld-line strength however changes in mold temperature odds with experimental results. Somjate and Pichai, 11 conducted a study by the manufacturing of varying thickness specimens with and without weld-line followed by experimental tests and found that an increase in wall thickness of the specimen is not improving weld-line strength for polypropylene glass-filled material. Adam and Assaker, 12 performed integrated non-linear multiscale material modeling and simulations with the help of Digimat considering local material microstructure from manufacturing simulations to structural modeling and concluded that their tool and methodology gives an improvement in structural results. Camilo, 13 performed integrative simulation based on the healing degree of polymer interdiffusion for unfilled ABS material and glass reinforced (30%) PBT material and found that results of weld-line strength for unfilled material was observed as satisfactory and a large deviation was seen for fiber-reinforced material. Kriwet and Stommel, 14 conducted integrative simulations to predict the effect of fiber orientation from injection molding manufacturing simulations into the structural dynamic finite element analysis for short glass fiber thermoplastic materials and they found that the accuracy of the structural dynamic simulation mainly depends on the material model of stiffness, damping and viscoelasticity. Gao et al, 15 presented a novel method based on the interdiffusion model and healing theory for the prediction of the component strength considering weld-line and found simulation result are closely matching with experimental results.
There are currently few studies with regards to simulation for the prediction of weld-line strength for semicrystalline polyamide-6 glass fiber-filled material on stagnation weld-line. Therefore, further in-depth investigation into this topic is required. The present work focusses on prediction of weld-line strength using integrative simulation method. The simulation methodology developed in this work is unique wherein, a tensile specimen of the structural analysis model is mapped on Moldflow simulation plaque model with weld-line and without weld-line. The validation is conducted by manufacturing of injection molded plaques followed by specimen preparation by machining and experimental testing.
Methodology
The weld-line plaque mold is designed and manufactured based on Moldflow simulation results for different runner and feeding systems which were discussed in our previous work,16–18 where experimental studies were conducted to find out the effect of weld-line considering different weld-line angle, at different packing pressure and different materials. This work is focused on simulation and correlation study with respect to traditional isotropic simulation method, an integrative simulation method and experimental testing to predict weld-line strength.
The three-dimensional CAD model with gate, runner, and mold is prepared in Autodesk Inventor software for injection modeling analysis. Solid modeling is done by performing different features in the tool like extruding, revolving, cut, etc. as per selected plaque dimensions. The coordinate system origin of the CAD model is kept same for all manufacturing and structural simulations. A separate tensile specimen CAD model is prepared as per standard dimensions as that of ISO 527-2 Type 1BA for structural analysis. Figure 1 shows the CAD model of the weld-line plaque and tensile specimen with dimensional detail. (a) Three-dimensional CAD model of weld-line plaque and (b) Tensile test specimen as per ISO 527-2 Type 1BA.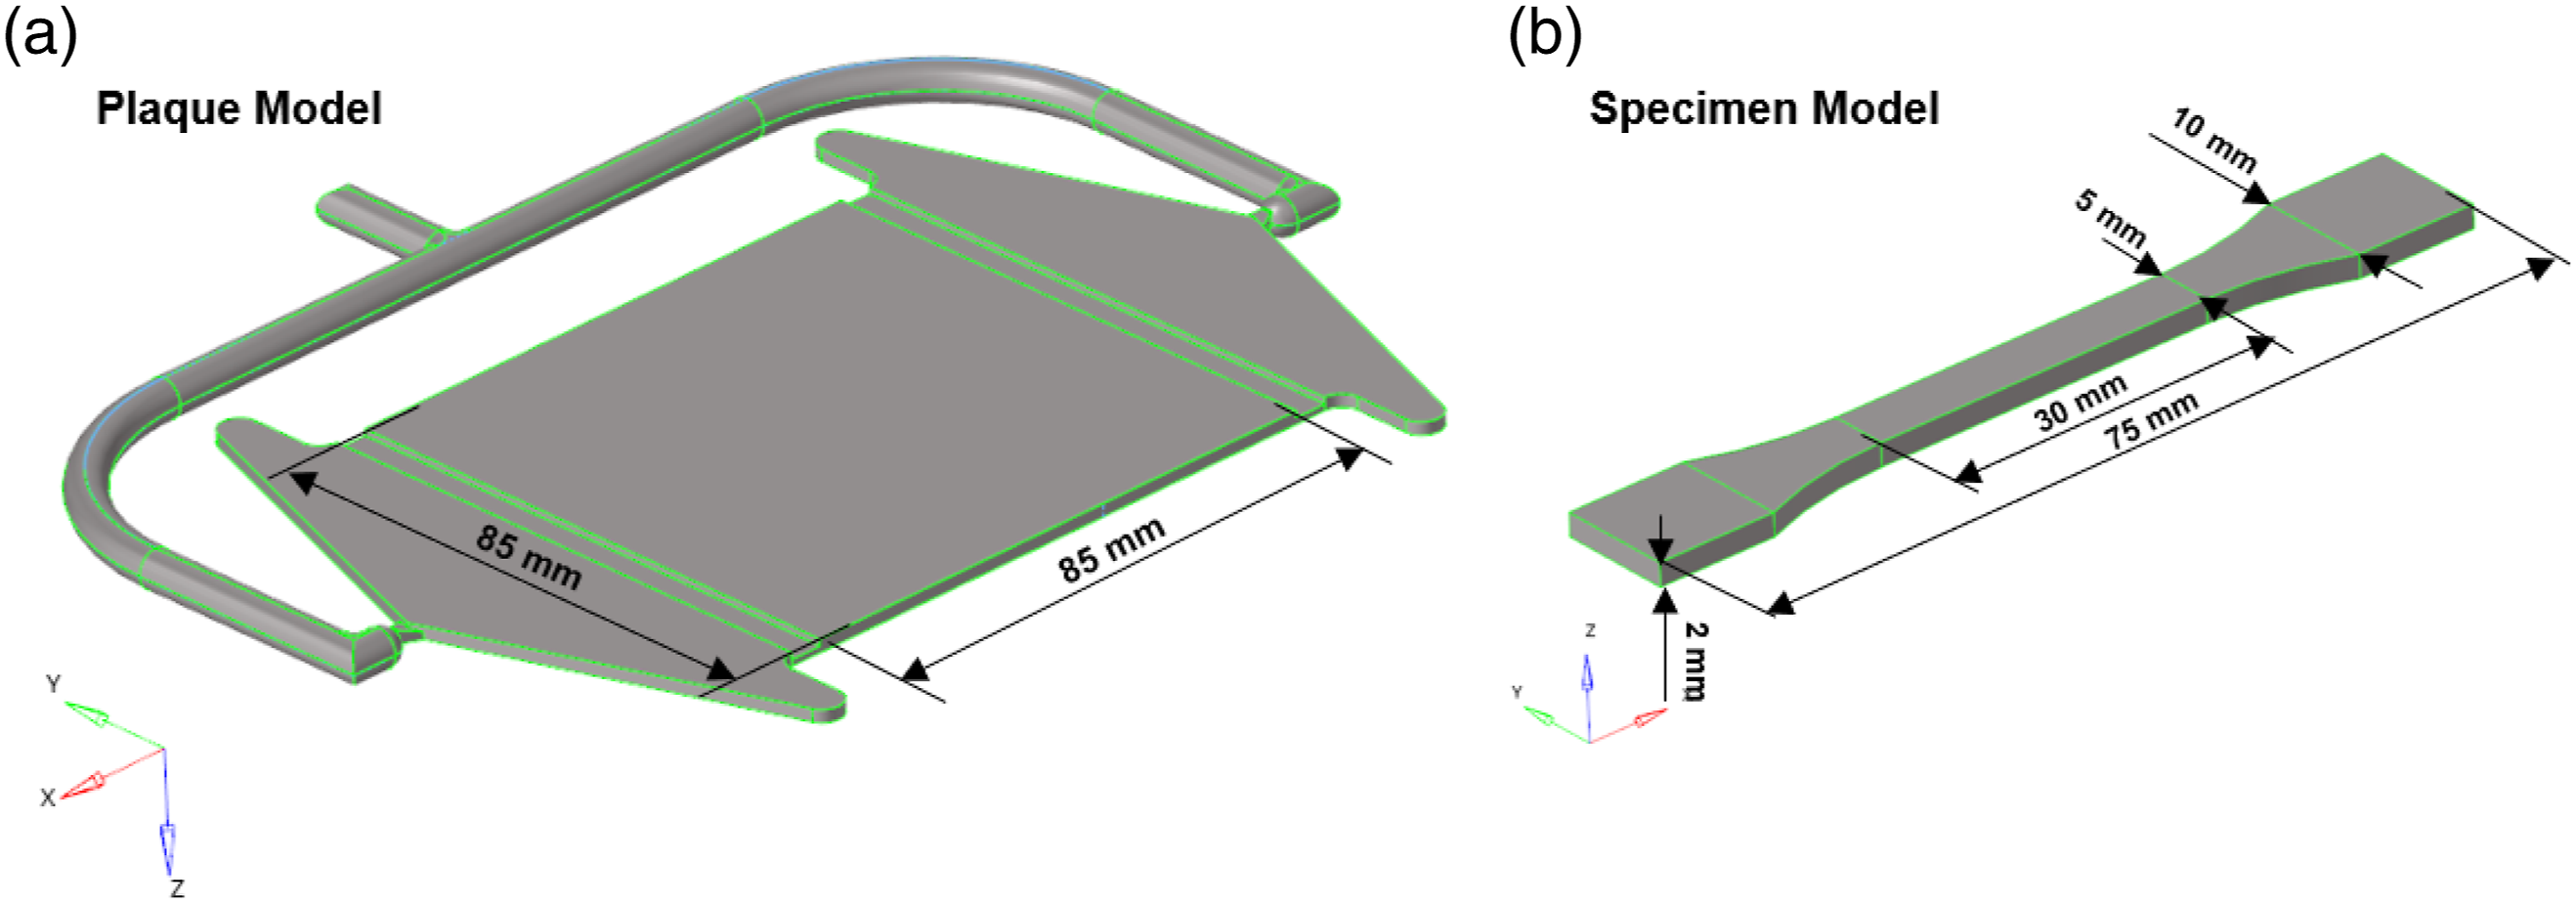
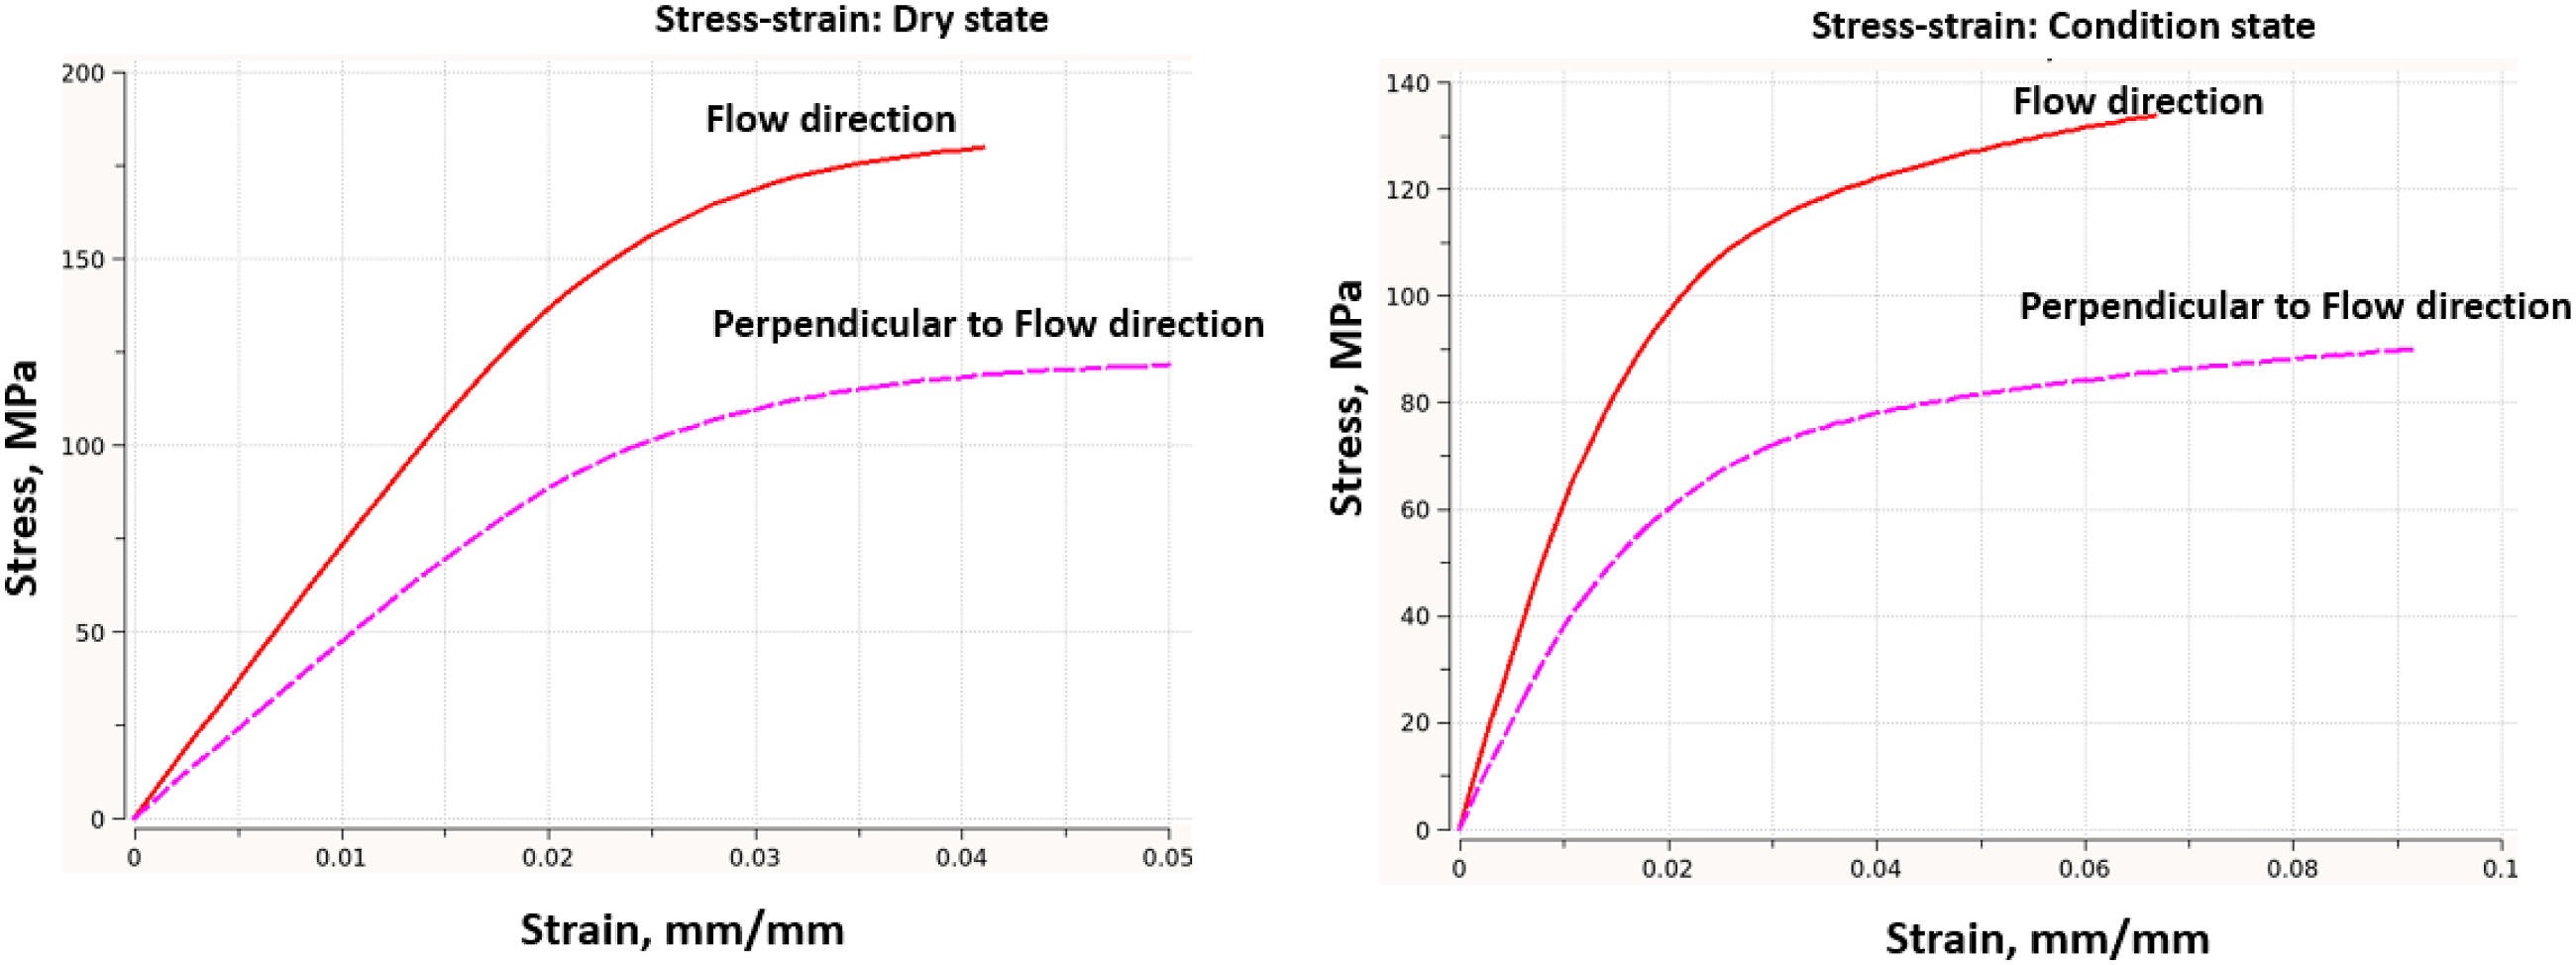
The mold-filling simulation is carried out with the help of Autodesk Moldflow software. The pre-processing (meshing) on the skin of the CAD model is done with the help of Altair HyperMesh. The element type selected for skin meshing is a triangular surface element. The meshed model is then imported into Moldflow software, by selecting the appropriate unit system. The three-dimensional mesh is generated with tetrahedral elements in Moldflow considering ten number of layers across the thickness. The analysis sequence is selected as Fill + Pack + Warp. The material selected for this study is polyamide 6 with 30% glass reinforcements from the BASF’s material portfolio of grade Ultramid® B3WG6. Figure 2 shows Moldflow model and plots of key material properties from an injection molding point of view and Figure 3 shows stress-strain data for PA-6 GF 30% material for flow direction and perpendicular to flow direction for dry and condition state. Moldflow model of weld-line plaque and major material properties plots. Stress-strain curves of PA-6 GF 30% for dry and condition sate for flow direction and perpendicular to flow direction.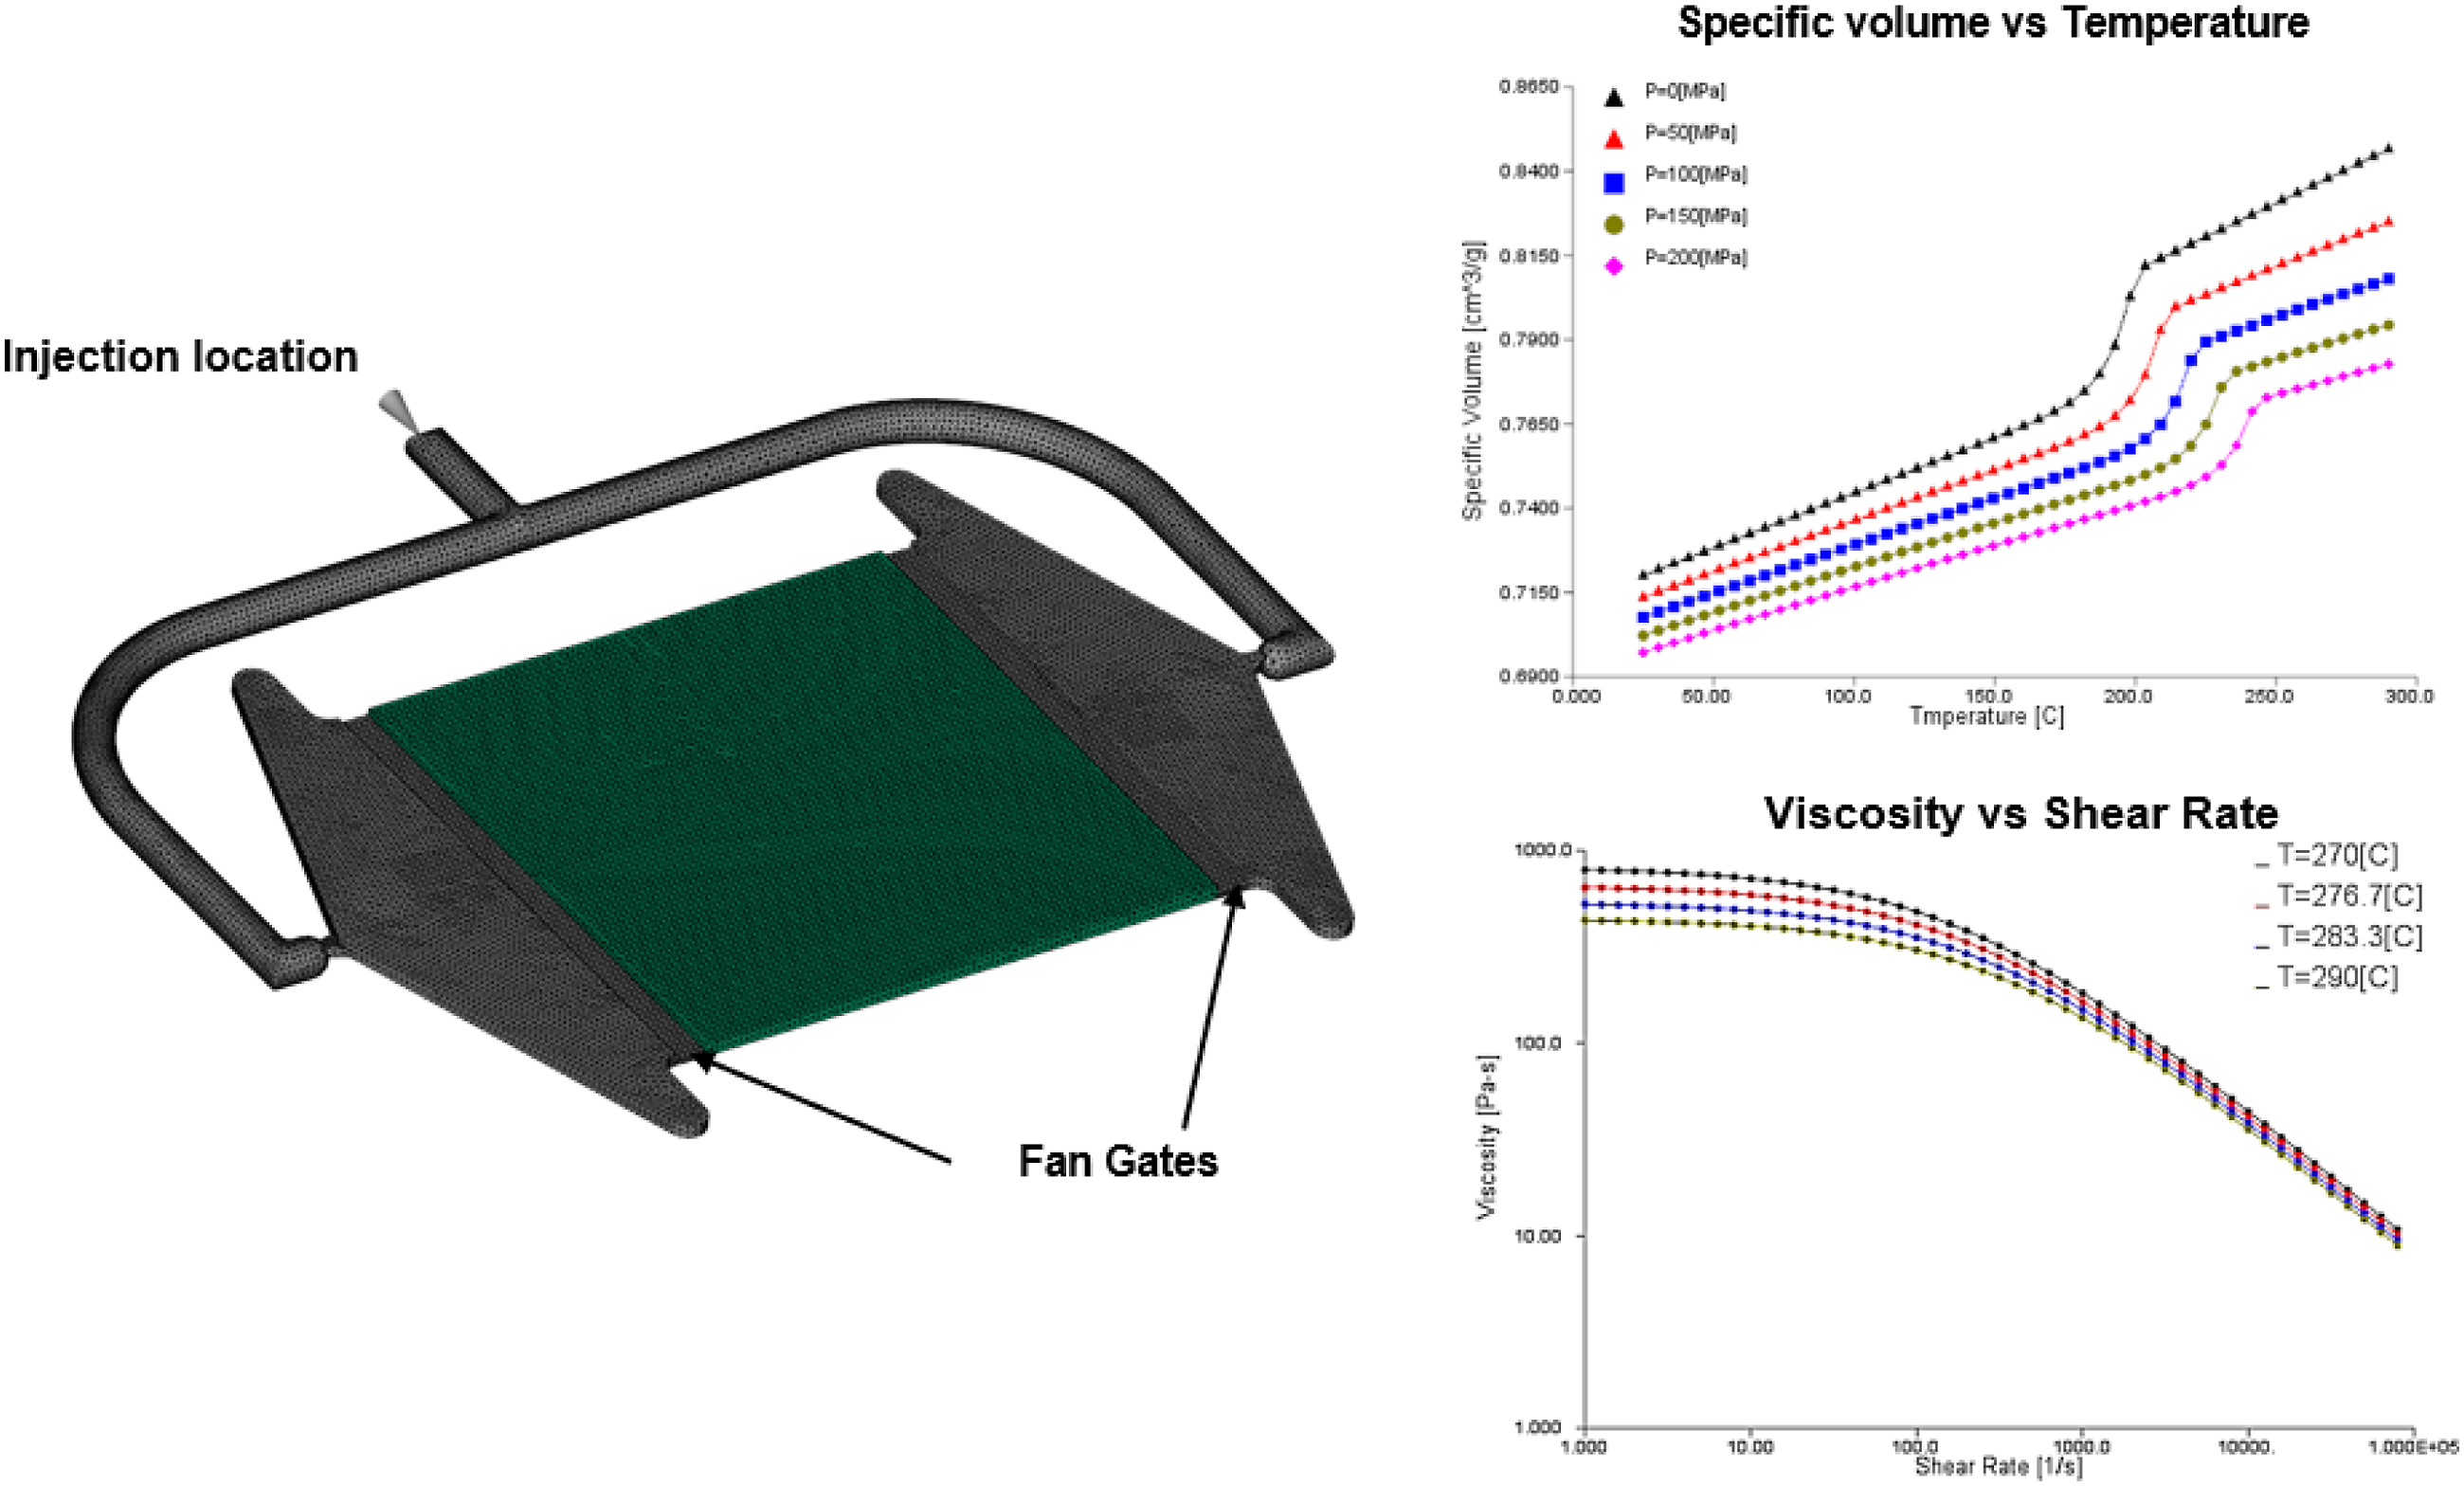
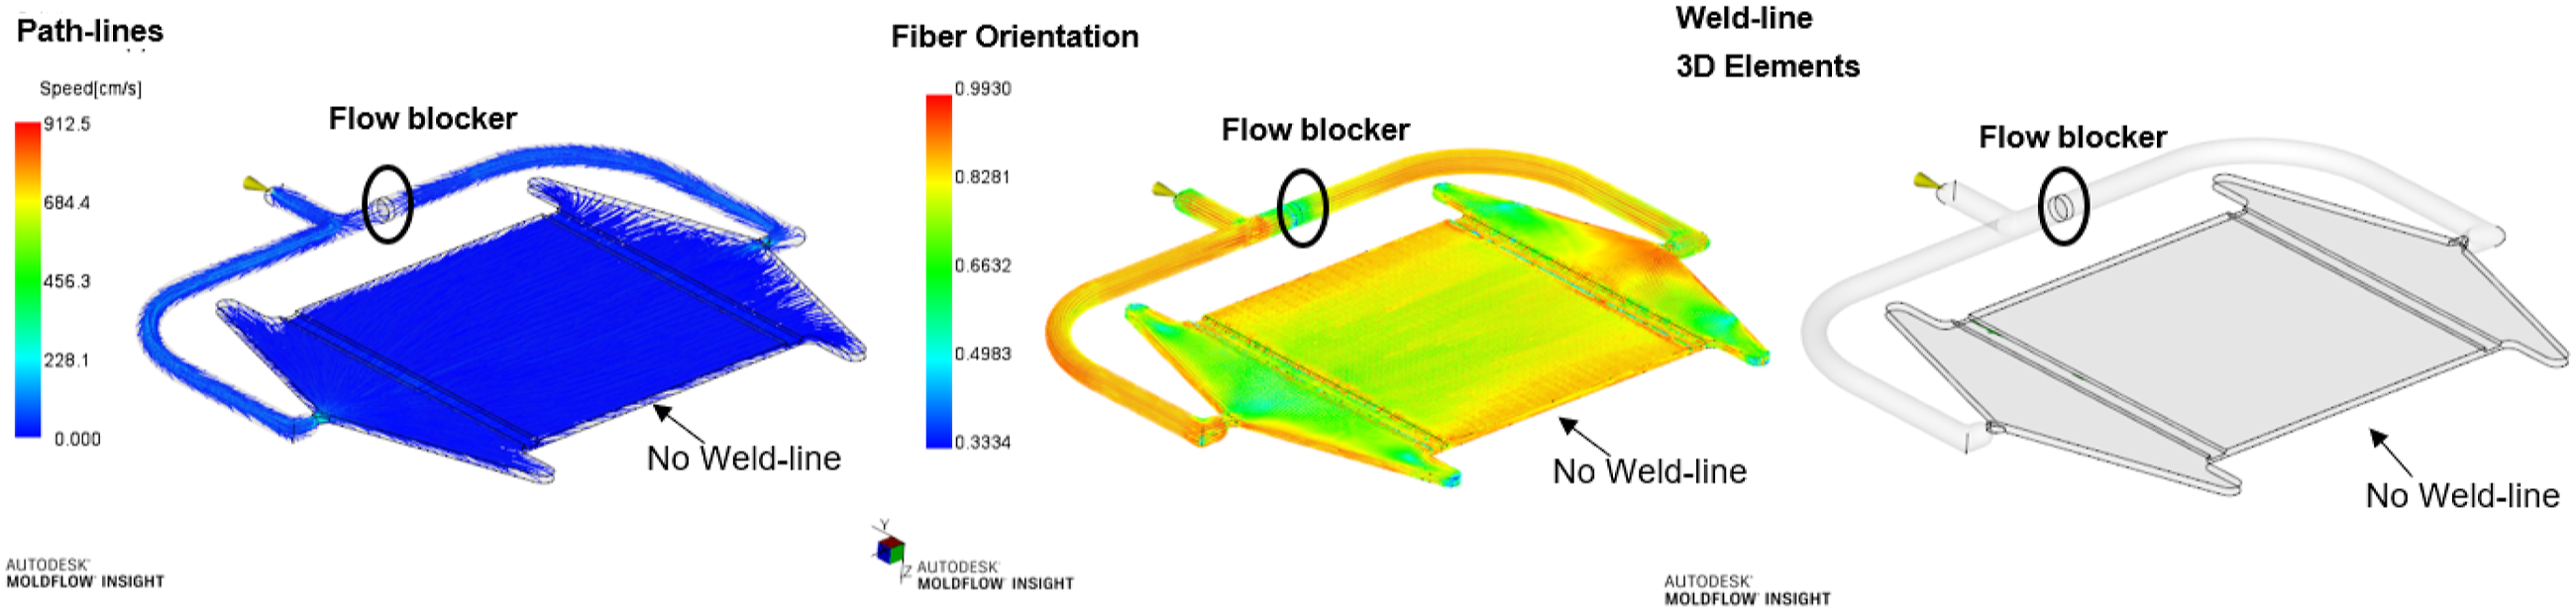
The gate and runner system are built-in three-dimensional CAD model to get a more precise flow behavior of the material in the feeding system. The process parameters are optimized by performing multiple iterations for optimized process parameters like temperature, pressure, injection speed etc. and the final parameters are used for actual manufacturing of the part. For plaques without weld line, one side of the runner system is blocked such that material is passed through one side and there will not be any weld-line occurring at the center. Figure 4 shows the Moldflow results of path line, fiber orientation, and weld-line 3-D elements for weld-line plaque. From the results, it is seen that with this feeding system, straight weld-line perpendicular to flow at the center has been formed. Figure 5 shows the Moldflow analysis results of the no weld-line case by blocking one runner and allowing the material to flow from one direction. In this case, there is no weld-line formed. Moldflow results of path line, fiber orientation, and weld-line 3D elements of weld-line plaque. Moldflow results of path line, fiber orientation and weld-line 3D elements of no weld-line plaque.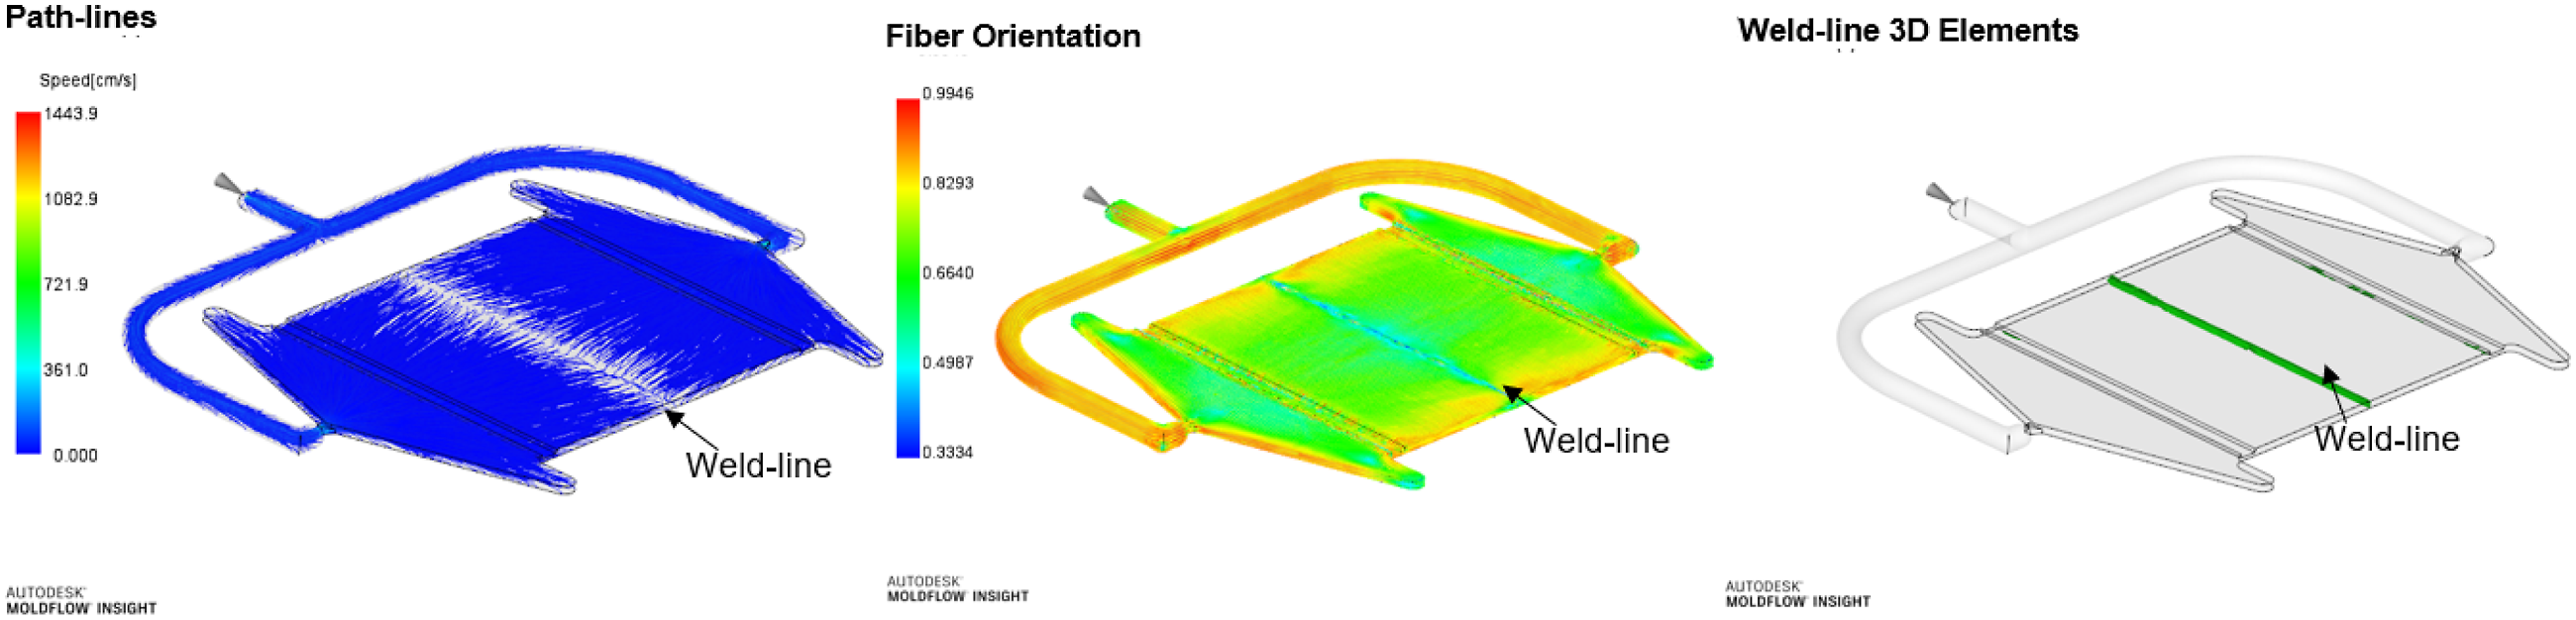
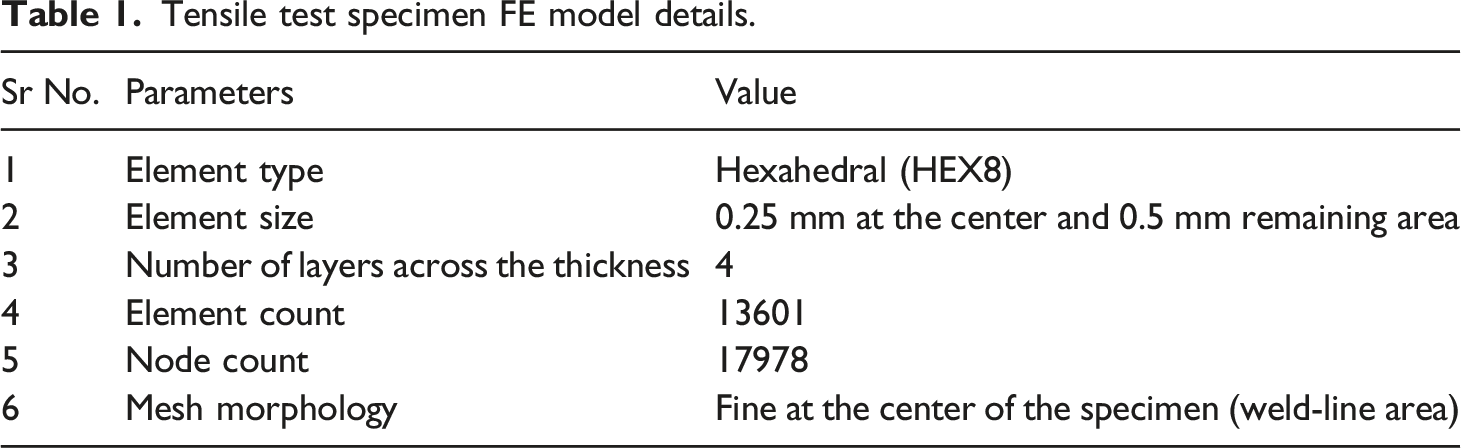
Tensile test specimen FE model details.
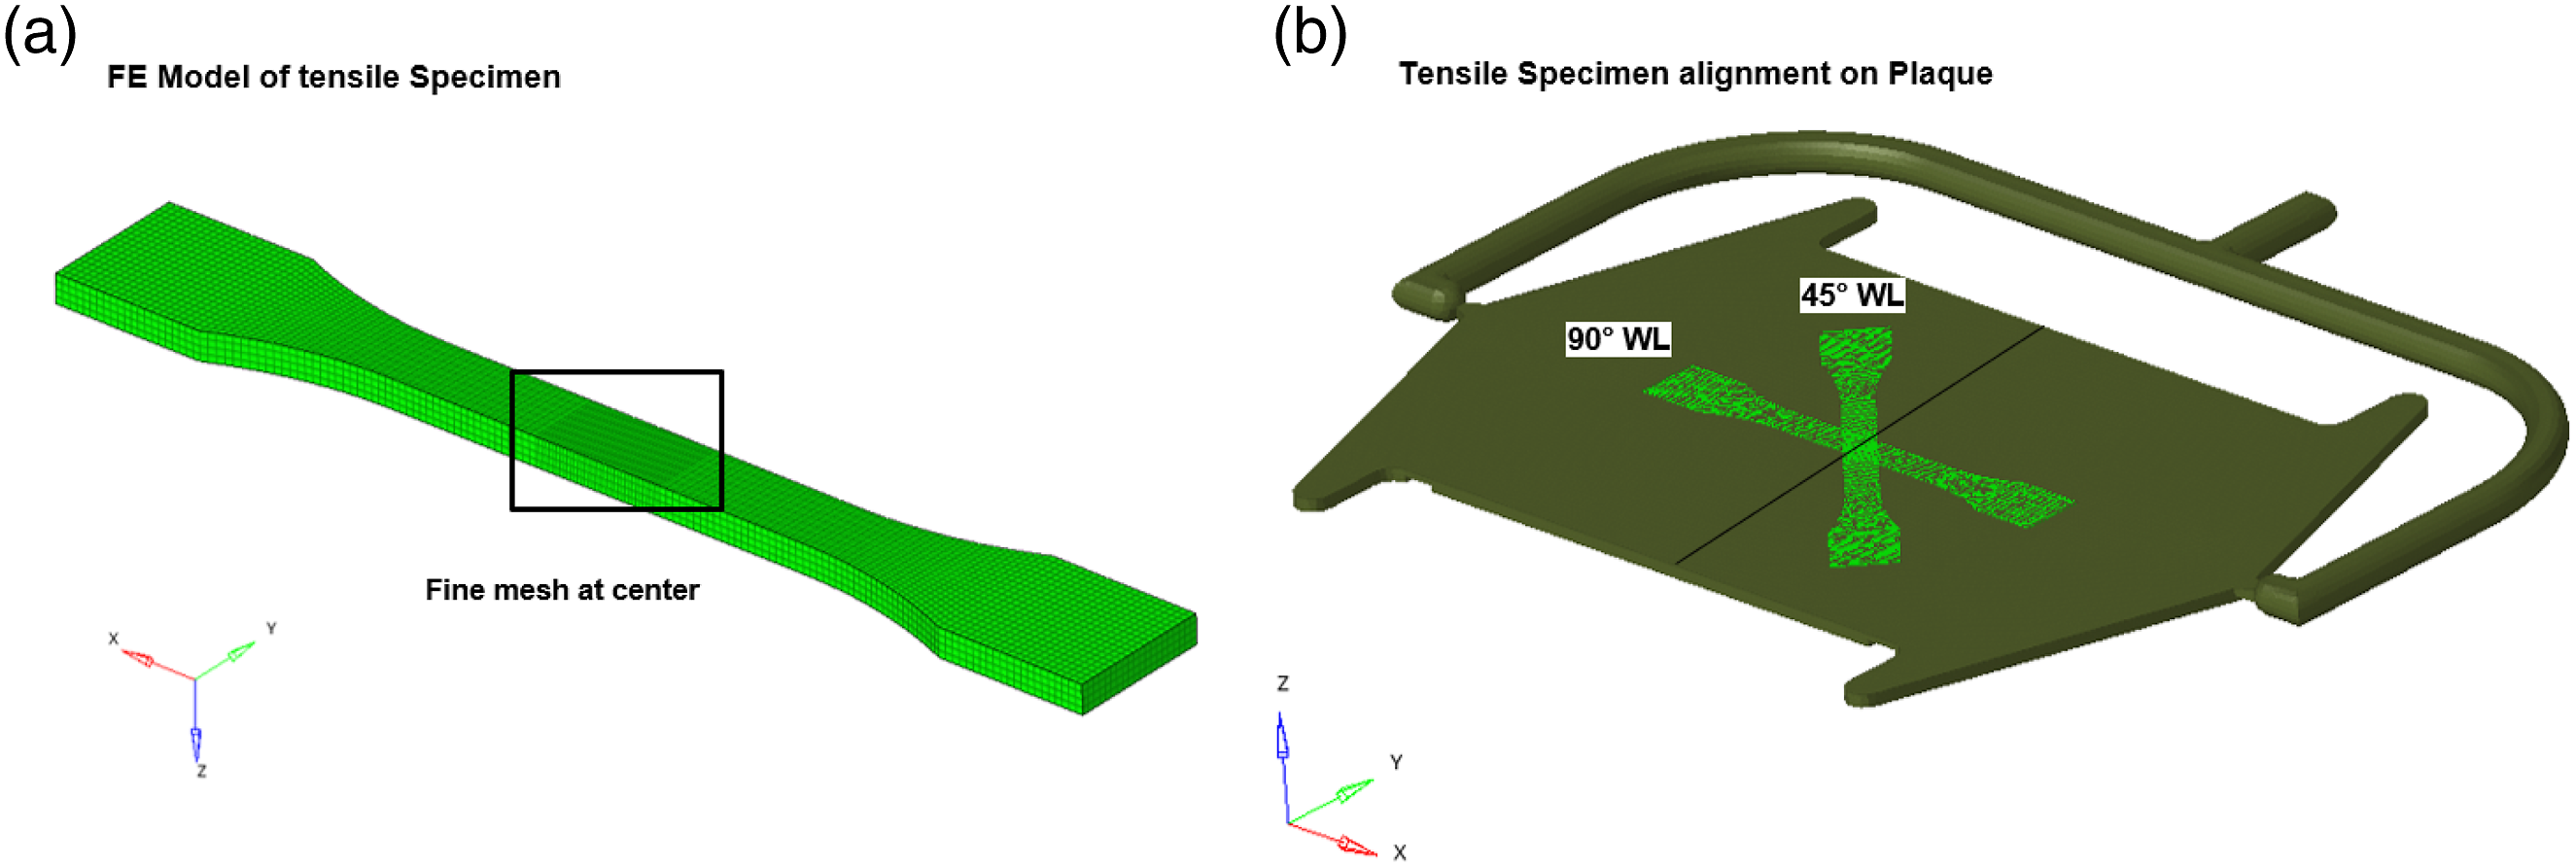
(a) Tensile test specimen FE model, (b) coordinate alignment of the tensile model on plaque model for 90° weld-line and 45° weld-line case.
For tensile specimen’s structural analysis, the loads and boundary conditions are applied in such a way that it resembles actual experimental testing. The nodes of one side grip of the tensile bar are constrained in all DOF and the nodes of the other side grip are pulled with the help of a rigid element. The enforced displacement is applied center of the rigid kinematic coupling element. The simulation is carried out with a very small increment size of 0.001 to capture very precise output result curves. Figure 7 shows experimental setup of test and loads, and boundary conditions used for the structural analysis of tensile specimens. Loads and boundary conditions applied on Tensile test specimen equivalent to experimental setup.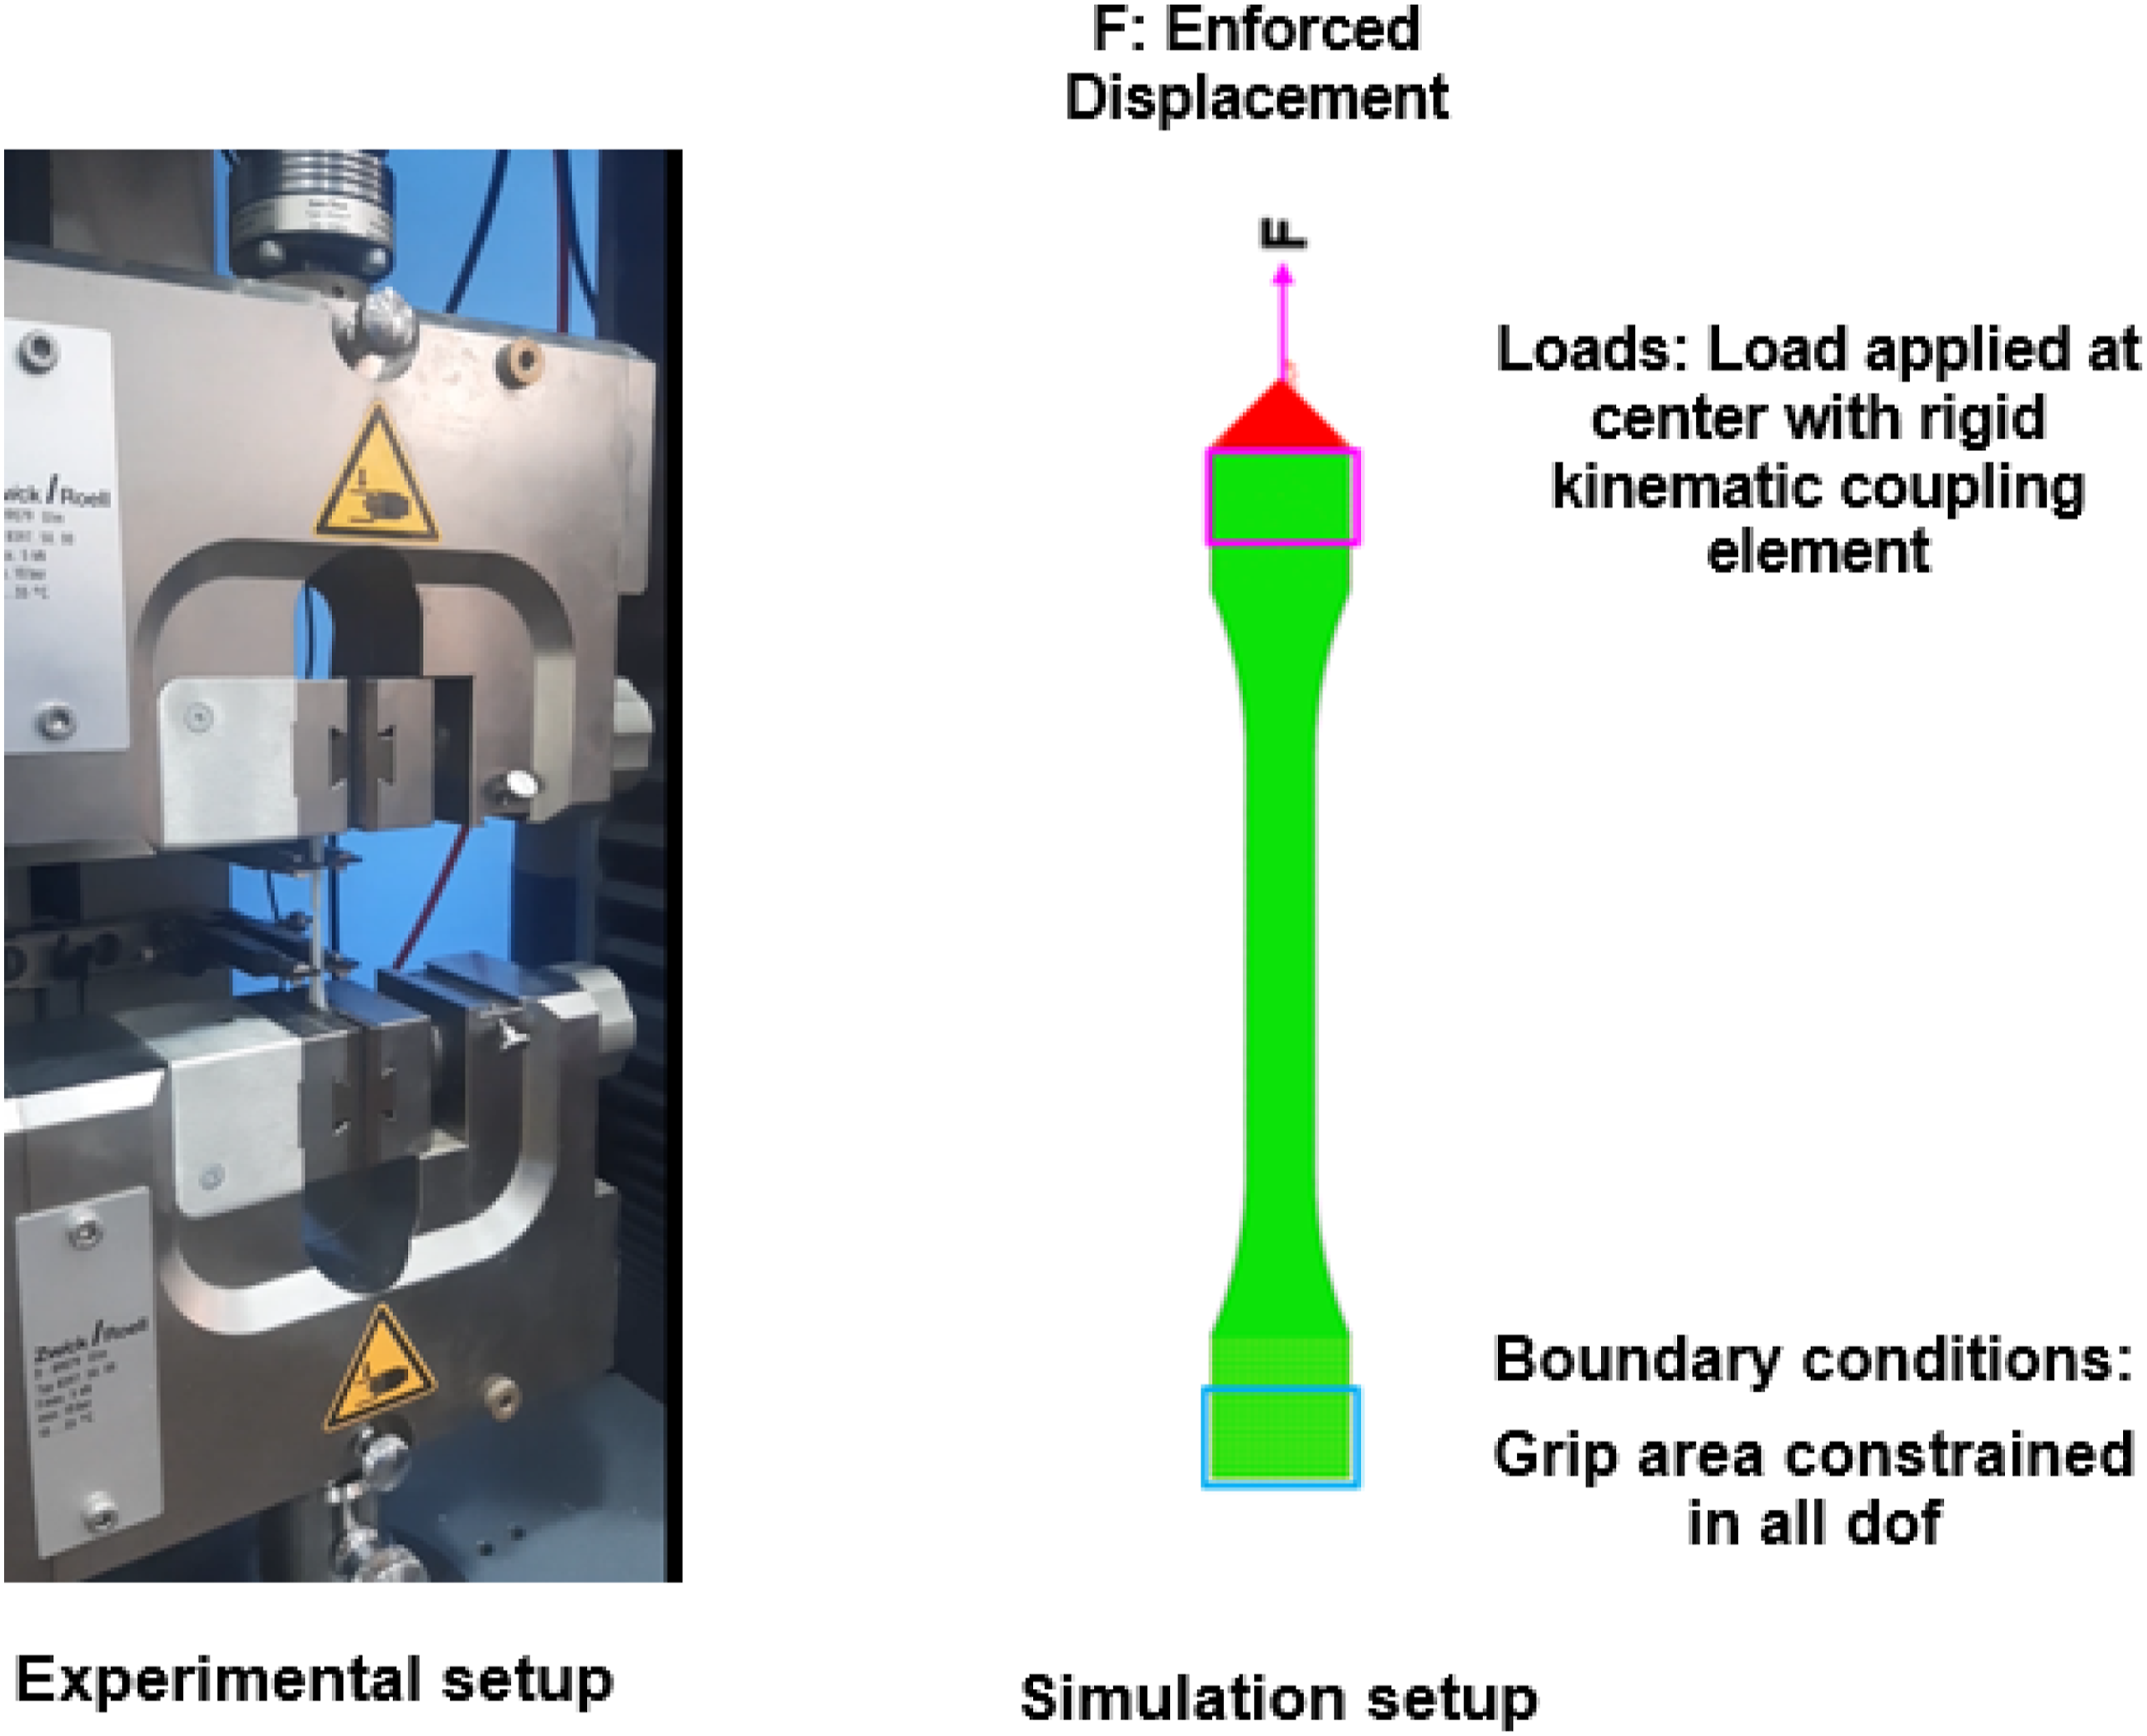
An integrative simulation is an advanced simulation technique where manufacturing results are integrated into structural analysis by modifying material characteristics.19,20 Figure 8 shows the software tool workflow used for integrative simulation. The Autodesk Moldflow is used for injection molding analysis, Altair HyperWorks- HyperMesh is used for creating FE models of tensile specimens, BASF Ultrasim® is used for material mapping and Simulia Abaqus is used as a structural solver. Workflow used for an integrative simulation.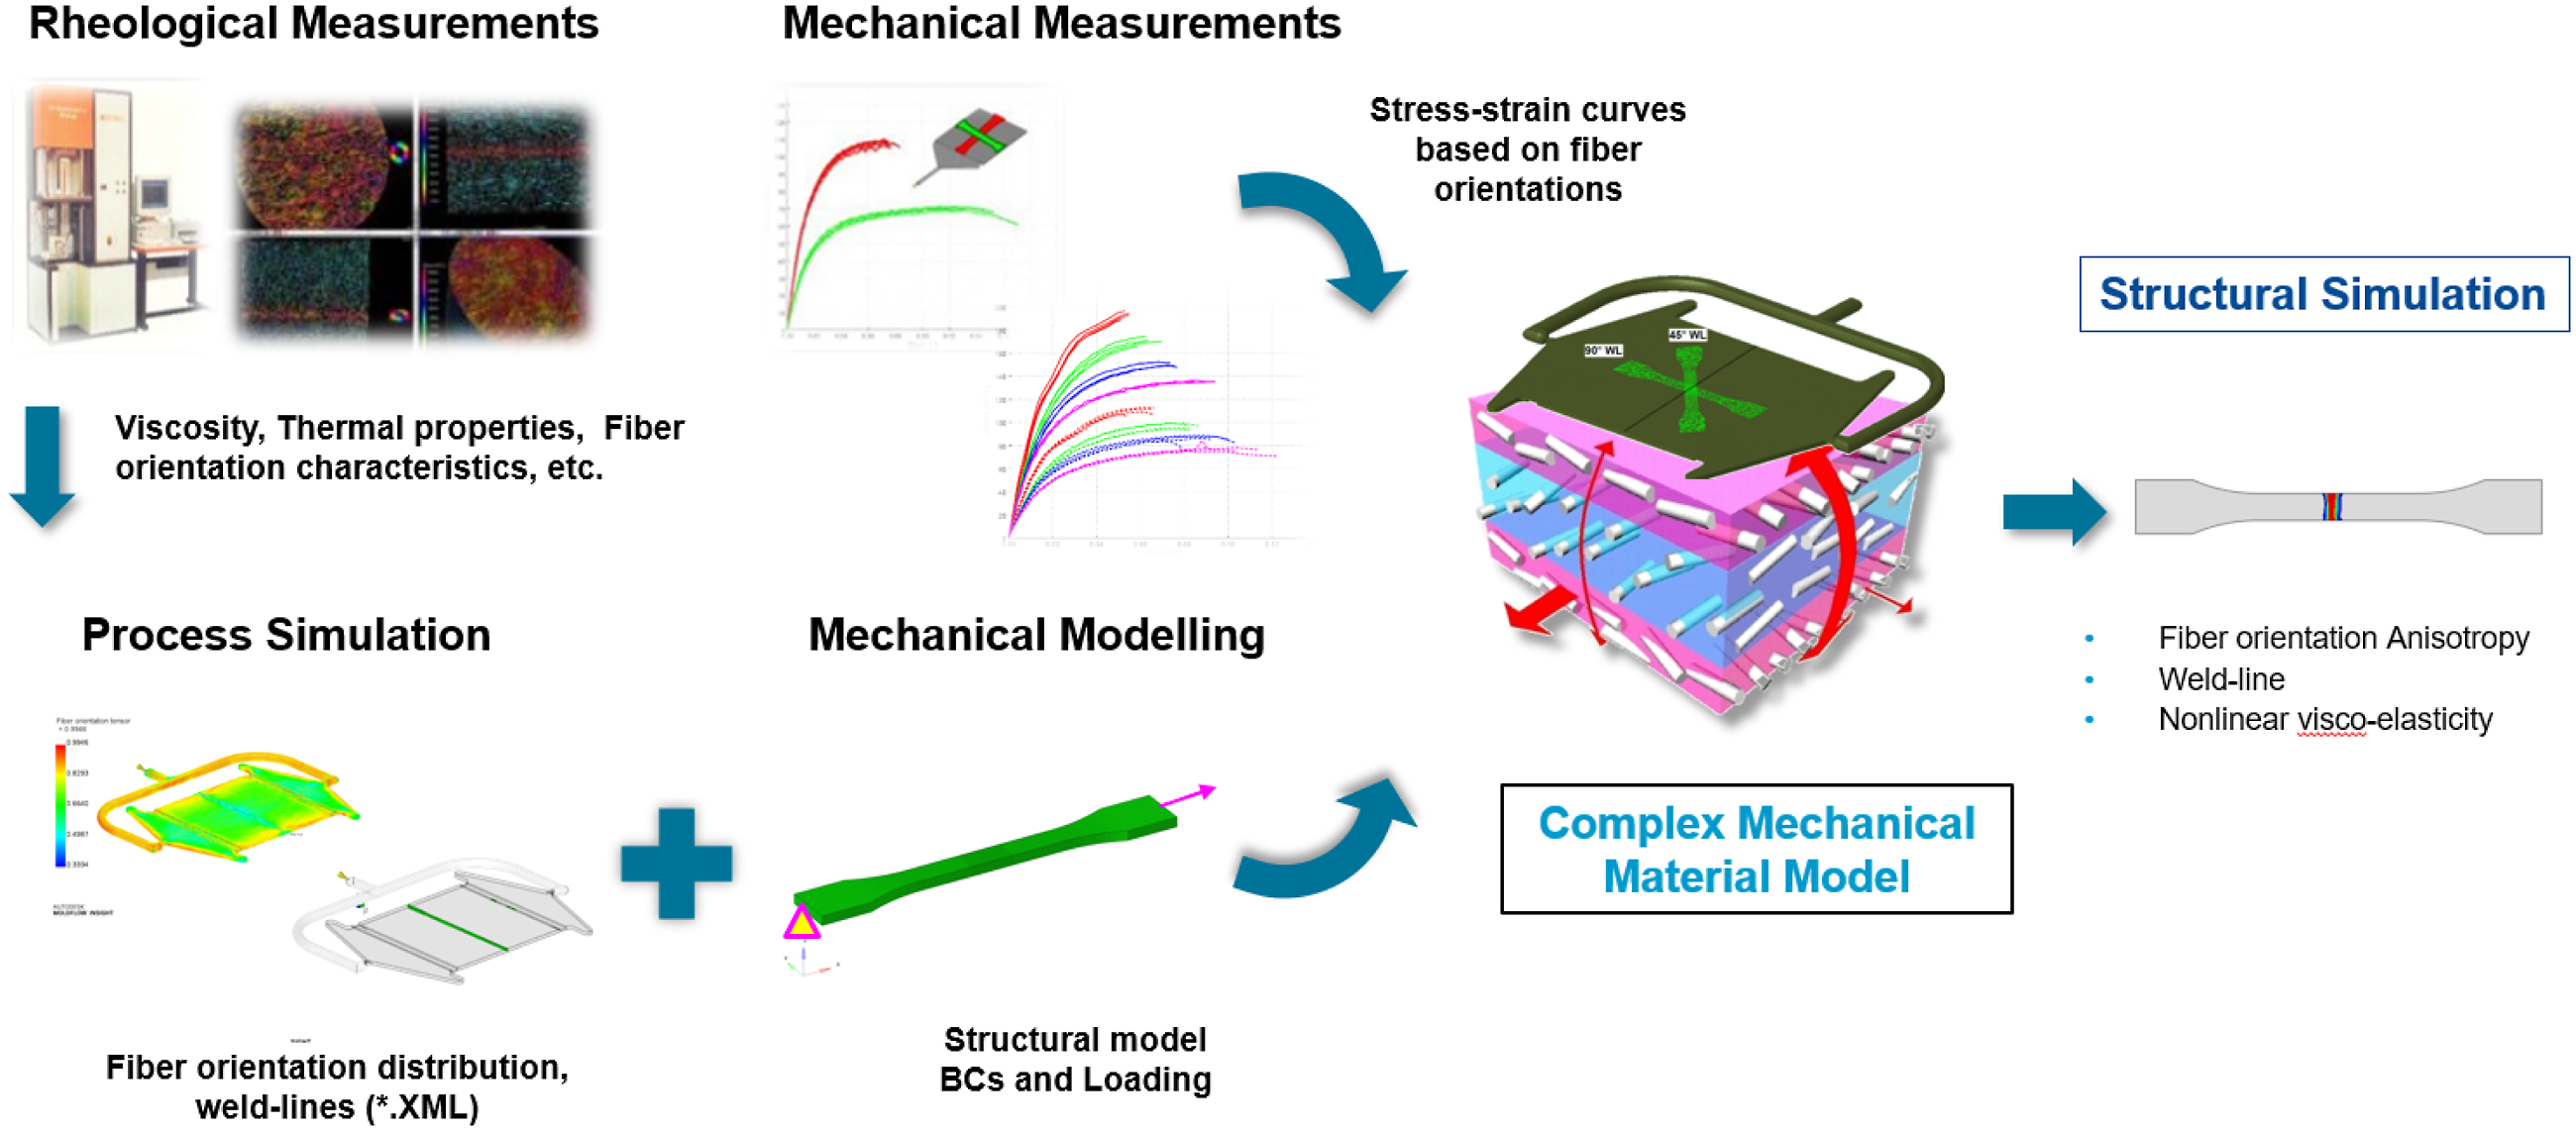
In moldflow-simulation, the fiber orientation is calculated with modified rotational diffusion (MRD) model which is basically based on Folgar–Tucker model. The fiber-orientation tensor and weld-line results are exported from Autodesk Moldflow software with *.vbi script in *.XML files and model data is exported in *.PAT format. This Moldflow output data of the plaque model and finite element file of the tensile specimen are imported into BASF’s Ultrasim® software, where material mapping is performed. In the exported Moldflow file, which has orientation tensor data for each element created during domain discretization for injection molding simulation where ten layers element across the thickness are used. The fiber orientation tensor gives positioning of the fiber within element in directions (X, Y, Z) and planes (XY, XZ, YZ) which will used subsequent mapping procedure. BASF’s Ultrasim® software tool takes mechanical measured stress-strain data calibrated at different fiber orientation. The fiber orientation and weld-line material characteristics from moldflow plaque model are mapped on finite element model of tensile specimen as shown in Figure 9. In the new mapped tensile specimen model, the material definition of each finite element has different material stiffness as per fiber orientation tensor and weld-line area input from moldflow data. At weld-line area, fibers are changing their direction as per fountain flow which is close to perpendicular to initial flow direction. The glass fibers are taking maximum load only in axial direction therefore the stiffness of the material in the flow direction is higher because most of the fibers are parallel to the flow and they are contributing more resistance to the external load compared to base matrix. The stiffness will reduce when fibers are making an angle to the flow direction
21
as resistance to external load gets reduce. Ultrasim® software is preparing a new mapped material card based on contribution of fiber strength, fiber alignment concerning the loading direction, bonding between fiber and base matrix, vicinity of weld-line, fiber alignment at weld-area, and strength of the base matrix. The FE elements at weld-line region of mapped tensile specimen has significantly lower stiffness in flow direction and corresponding increased stiffness in perpendicular to flow direction. Simulation workflow for plaque and tensile specimen from Moldflow, HyperMesh, Ultrasim® material mapping, and Abaqus for no weld-line, 90° weld-line and 45° weld-line.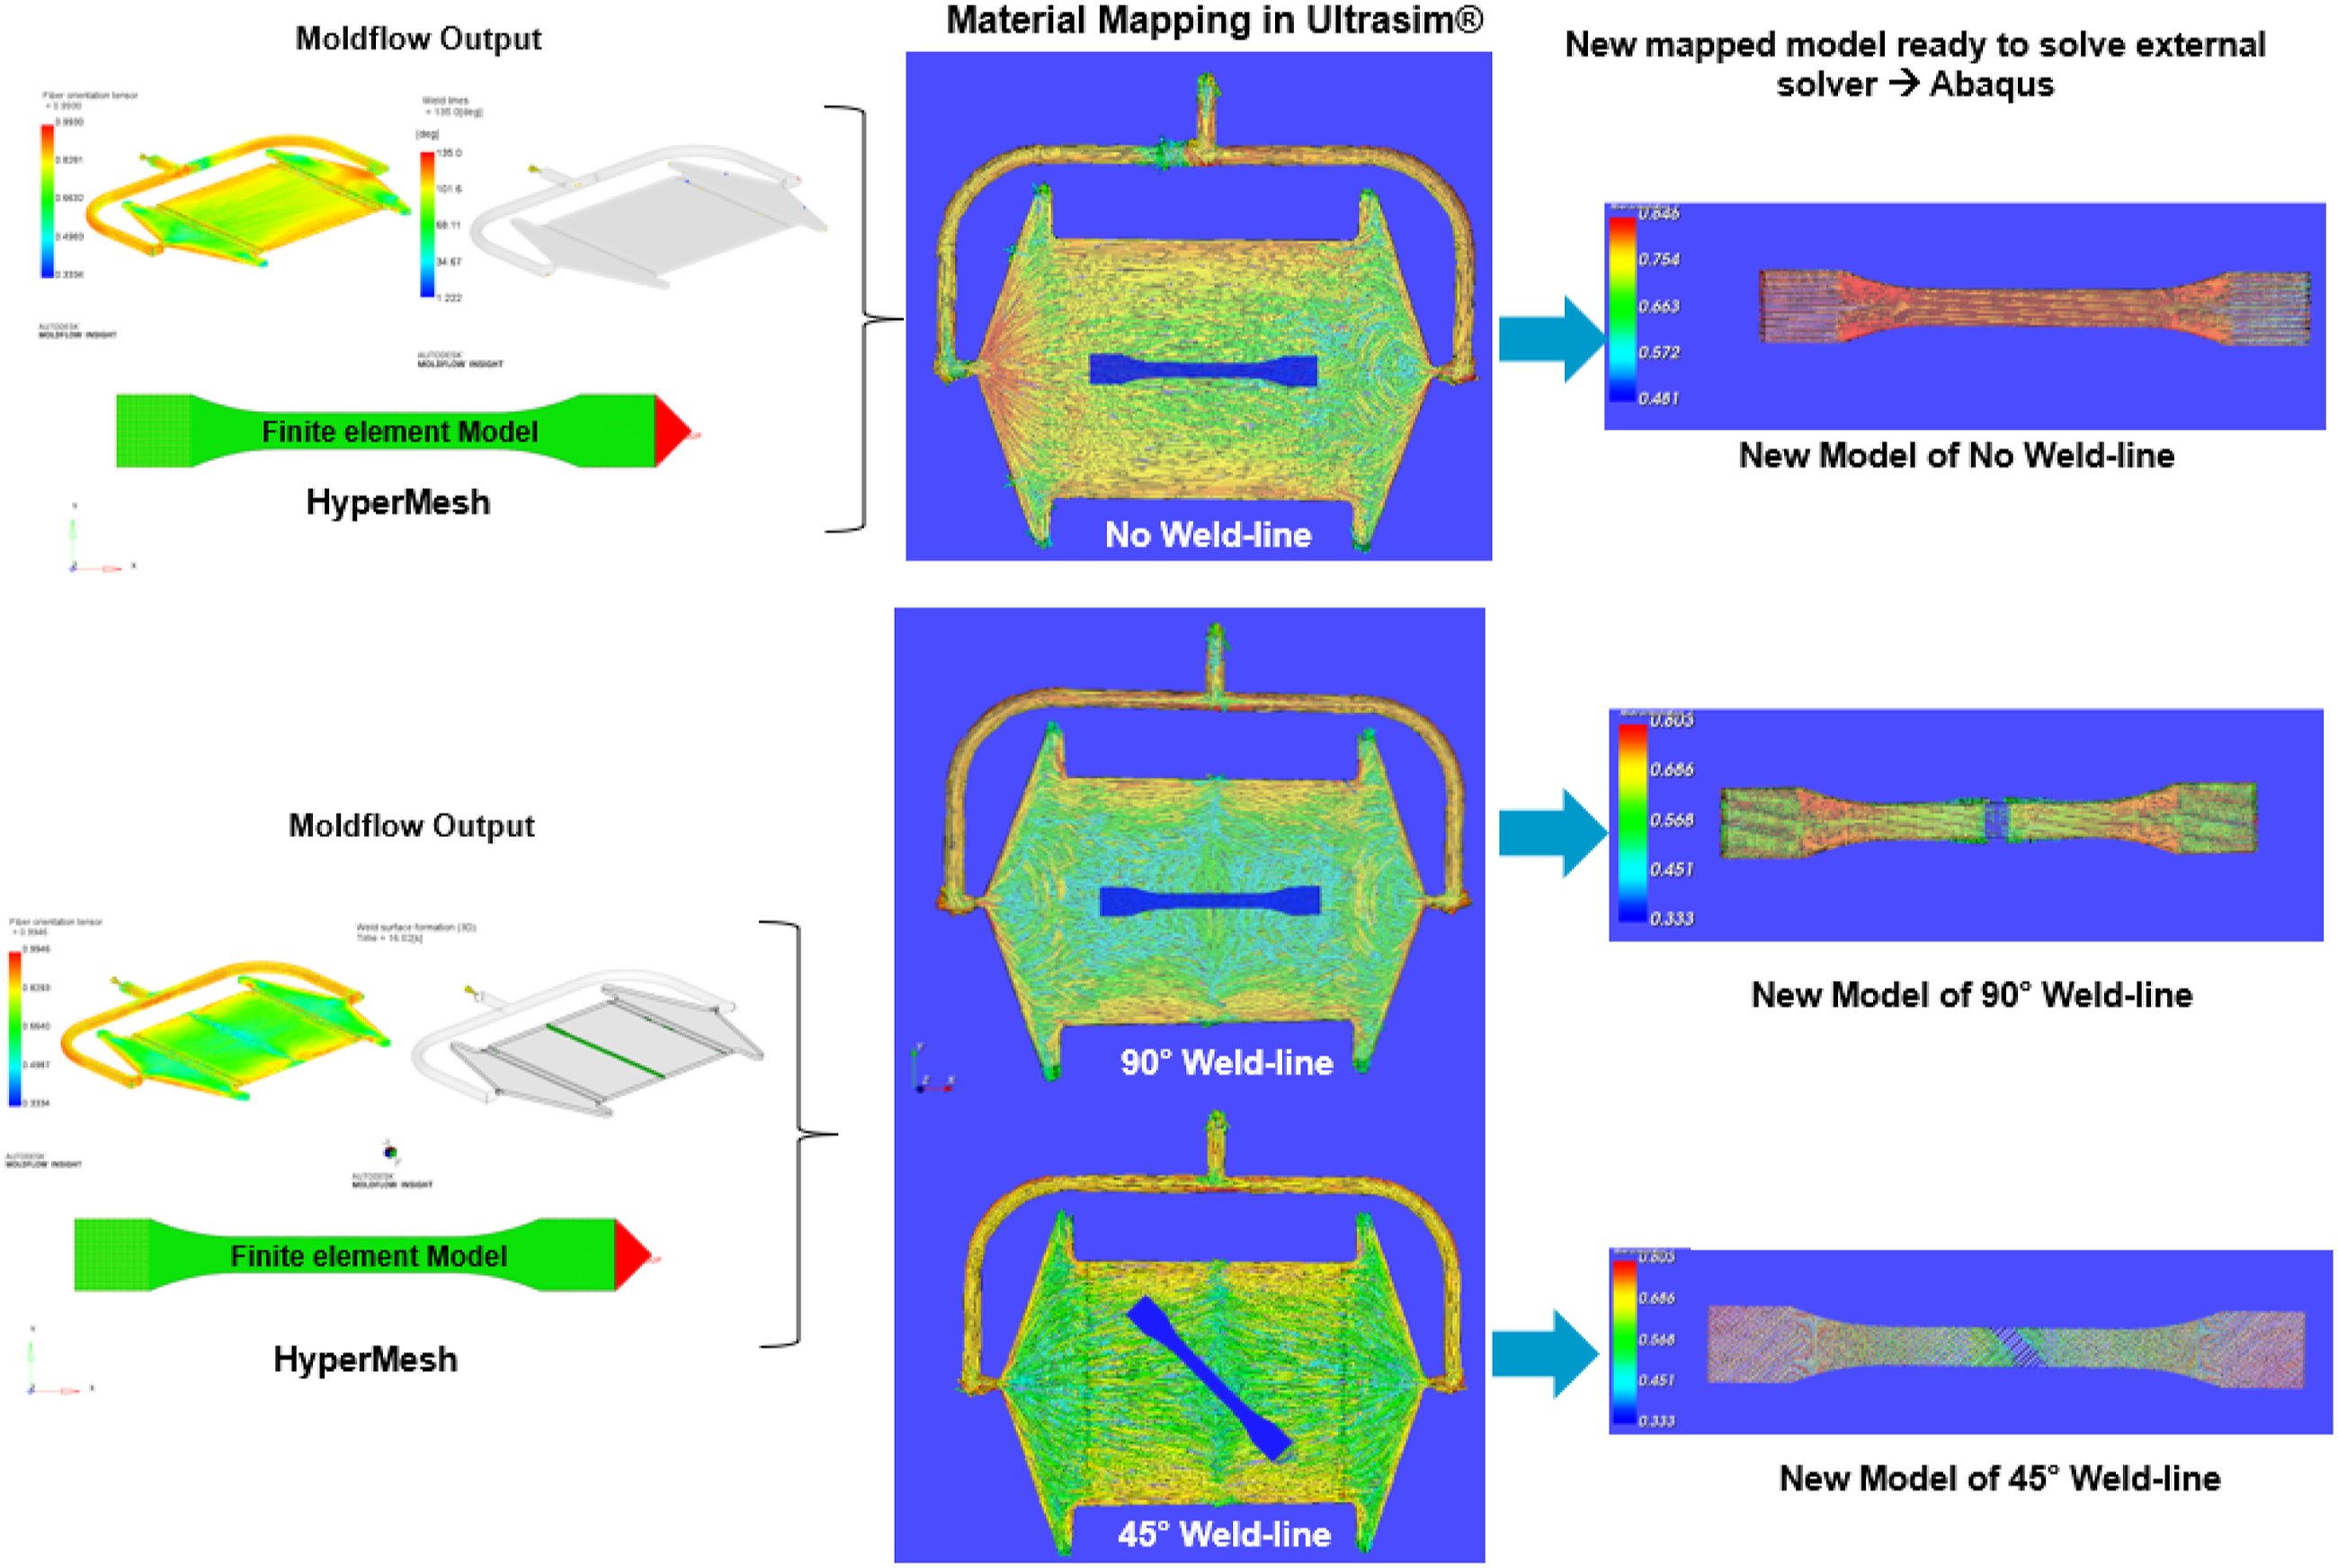
There are three simulations are performed for no weld-line, 90° weld-line angle, and 45° weld-line cases. Figure 9 shows the simulation workflow for integration of plaque and tensile specimens from Moldlfow, HyperMesh, Ultrasim® material mapping, and the new mapped model for Abaqus Solver.
The weld-line tool (mold) was designed and fabricated for manufacturing the plaques with an injection molding process. The tensile bar specimens are prepared by cutting specimen size on the plaque. The specimens are conditioned before an experimental test to avoid moisture effects. After-conditioned experimental testing was conducted on the universal testing machine with the standard procedure as per ISO 527-2. The fractured surfaces of the test specimens are analyzed with scanning electron microscopy (SEM). The observations of the SEM are discussed in the next part of the paper. The detailed steps and procedures which were followed for mold design, mold fabrication, specimen preparation, experimental testing and scanning electron microscopy (SEM) were detailed explained in previous work.16–18
Results and discussion
In this section results from simulation and experimental testing are discussed. An isotropic simulations solver considers properties in all directions to be the same and does not consider the effect of fiber alignment. Therefore, it becomes difficult to predict the presence of weld-line.3,5 Due to this, the results with the isotropic material model are not accurate and for critical function applications and judgment based on this simulation may lead to serious damage under the load. Figure 10 shows a load-displacement graph with an isotropic elastic-plastic material model and failure pattern observed with Abaqus Software as a solver. The load-displacement graph shows elastic-plastic behavior, when the load reaches maximum then plastic yielding is observed, however in actual practice for selected material (PA-6 30% glass filled) no yielding occurs, and material directly breaks once it reaches to maximum strain limit.16,18 The software results show an unrealistic curve after the maximum stress point and failure location because the algorithm does not know where the weld-line is and from where failure should start. Because of such limitations of the isotropic material models, an integrative anisotropic simulation approach is helpful where parameters from manufacturing simulations are integrated into structural analysis to predict the correct weld-line location and its strength.19,20 Isotropic elastic-plastic simulation load-displacement curve and failure pattern.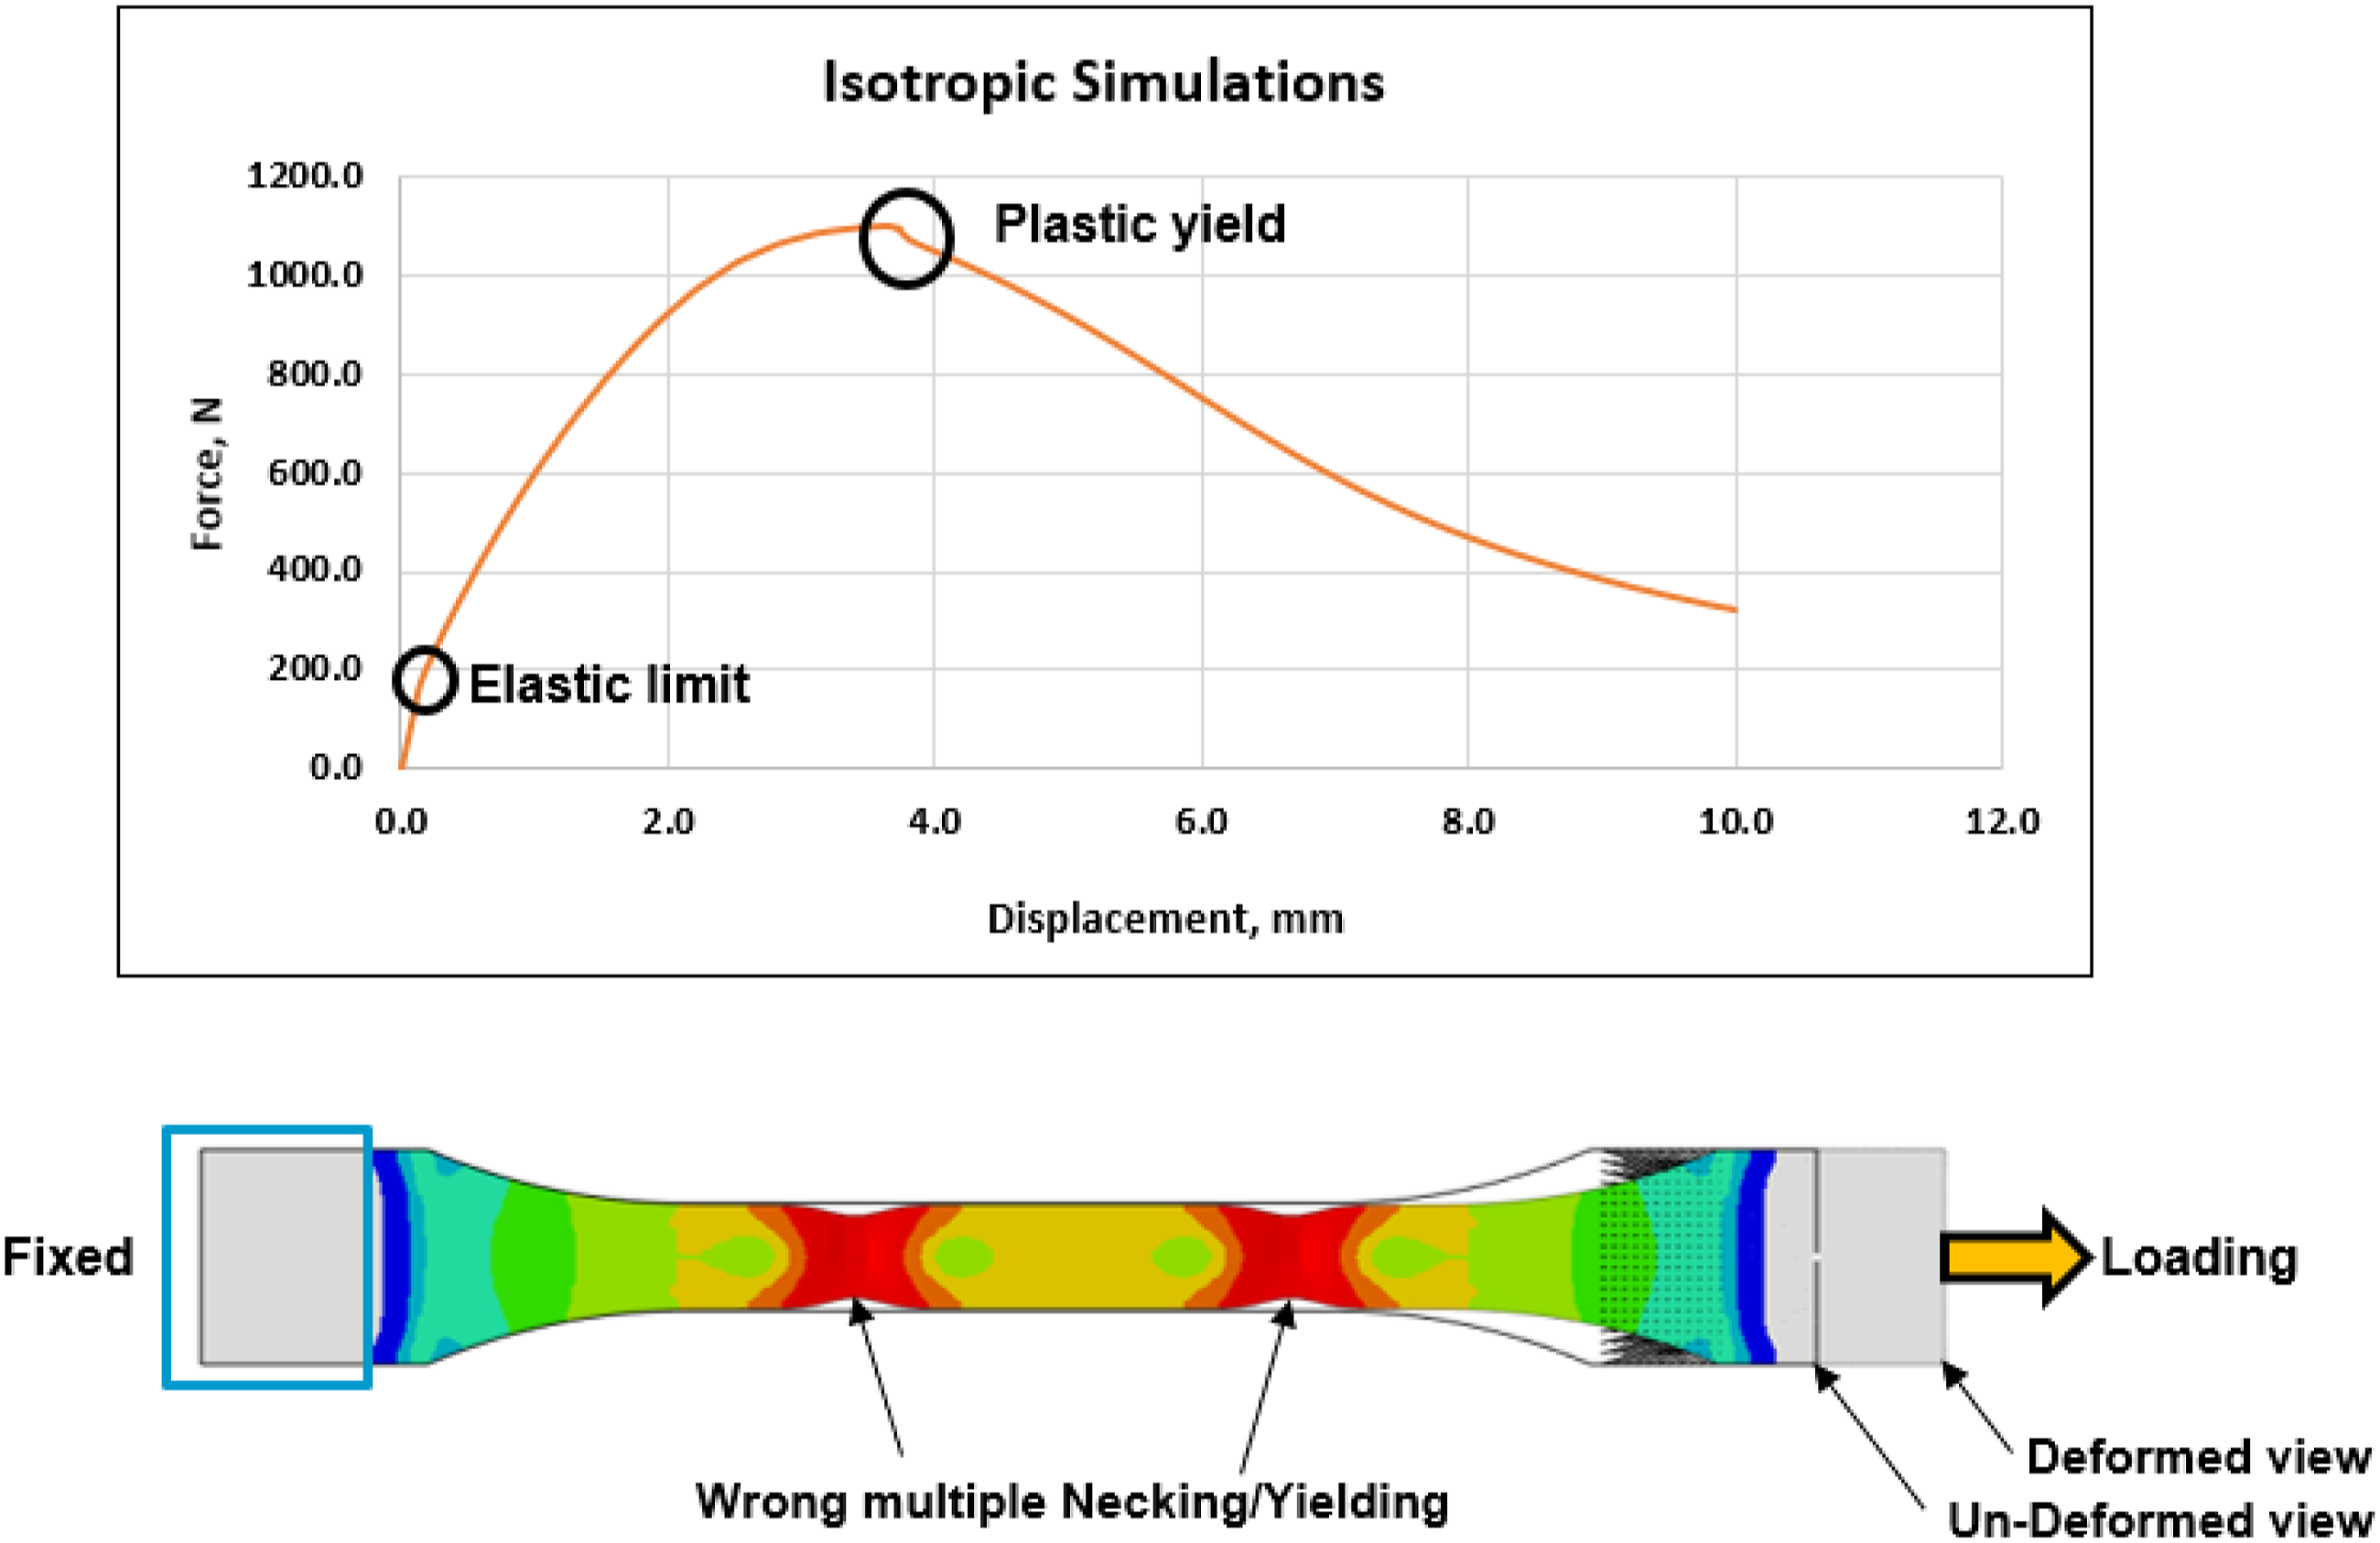
For unfilled material the effect of weld-line is mainly from V-notch however for glass fiber reinforced material, the major effect due to fiber orientation at weld-line interface.
21
The contribution from fibers and base matrix for external loads is depended on alignment of the fiber inside the matrix. During transient filling process the short glass fibers which are homogeneously distributed in the molten thermoplastic material, are constantly rotated in the flow field of the mold cavity. The rotation depends on the local velocity field in the vicinity of the fibers. In this process, the fibers are constantly transported from a middle layer to the outer layers and takes orientation as that of flow direction at outer layers and random at middle layers bases. The thickness of outer and middle layer is depending on velocity and pressure of melt-front. In case of weld-line, two or more flow-front are striking each other, and fountain flow changes its direction perpendicular to initial flow, therefore fibers are also changing its direction as that of flow which reduces stiffness in flow direction drastically.22,23 In an integrative simulation, the tensile specimen of structural model is mapped on plaque having fiber orientation and weld-line details. The material characteristics are modified in material file which includes the stiffness of the fiber as per their concentration and alignment across the length and cross-section of the tensile bar specimen. Therefore, material behavior under the loading is exactly observed as that of actual experimental testing. Figure 11 shows an experimental tested fractured specimens and integrative simulation analyses test specimens failure pattern for no weld-line, 90° weld-line, and 45° weld-line. The integrative simulated failure pattern and location of the crack are in-line with the test results. Experimental test and integrative simulation failure pattern for no weld-line, 90° weld-line, and 45° weld-line.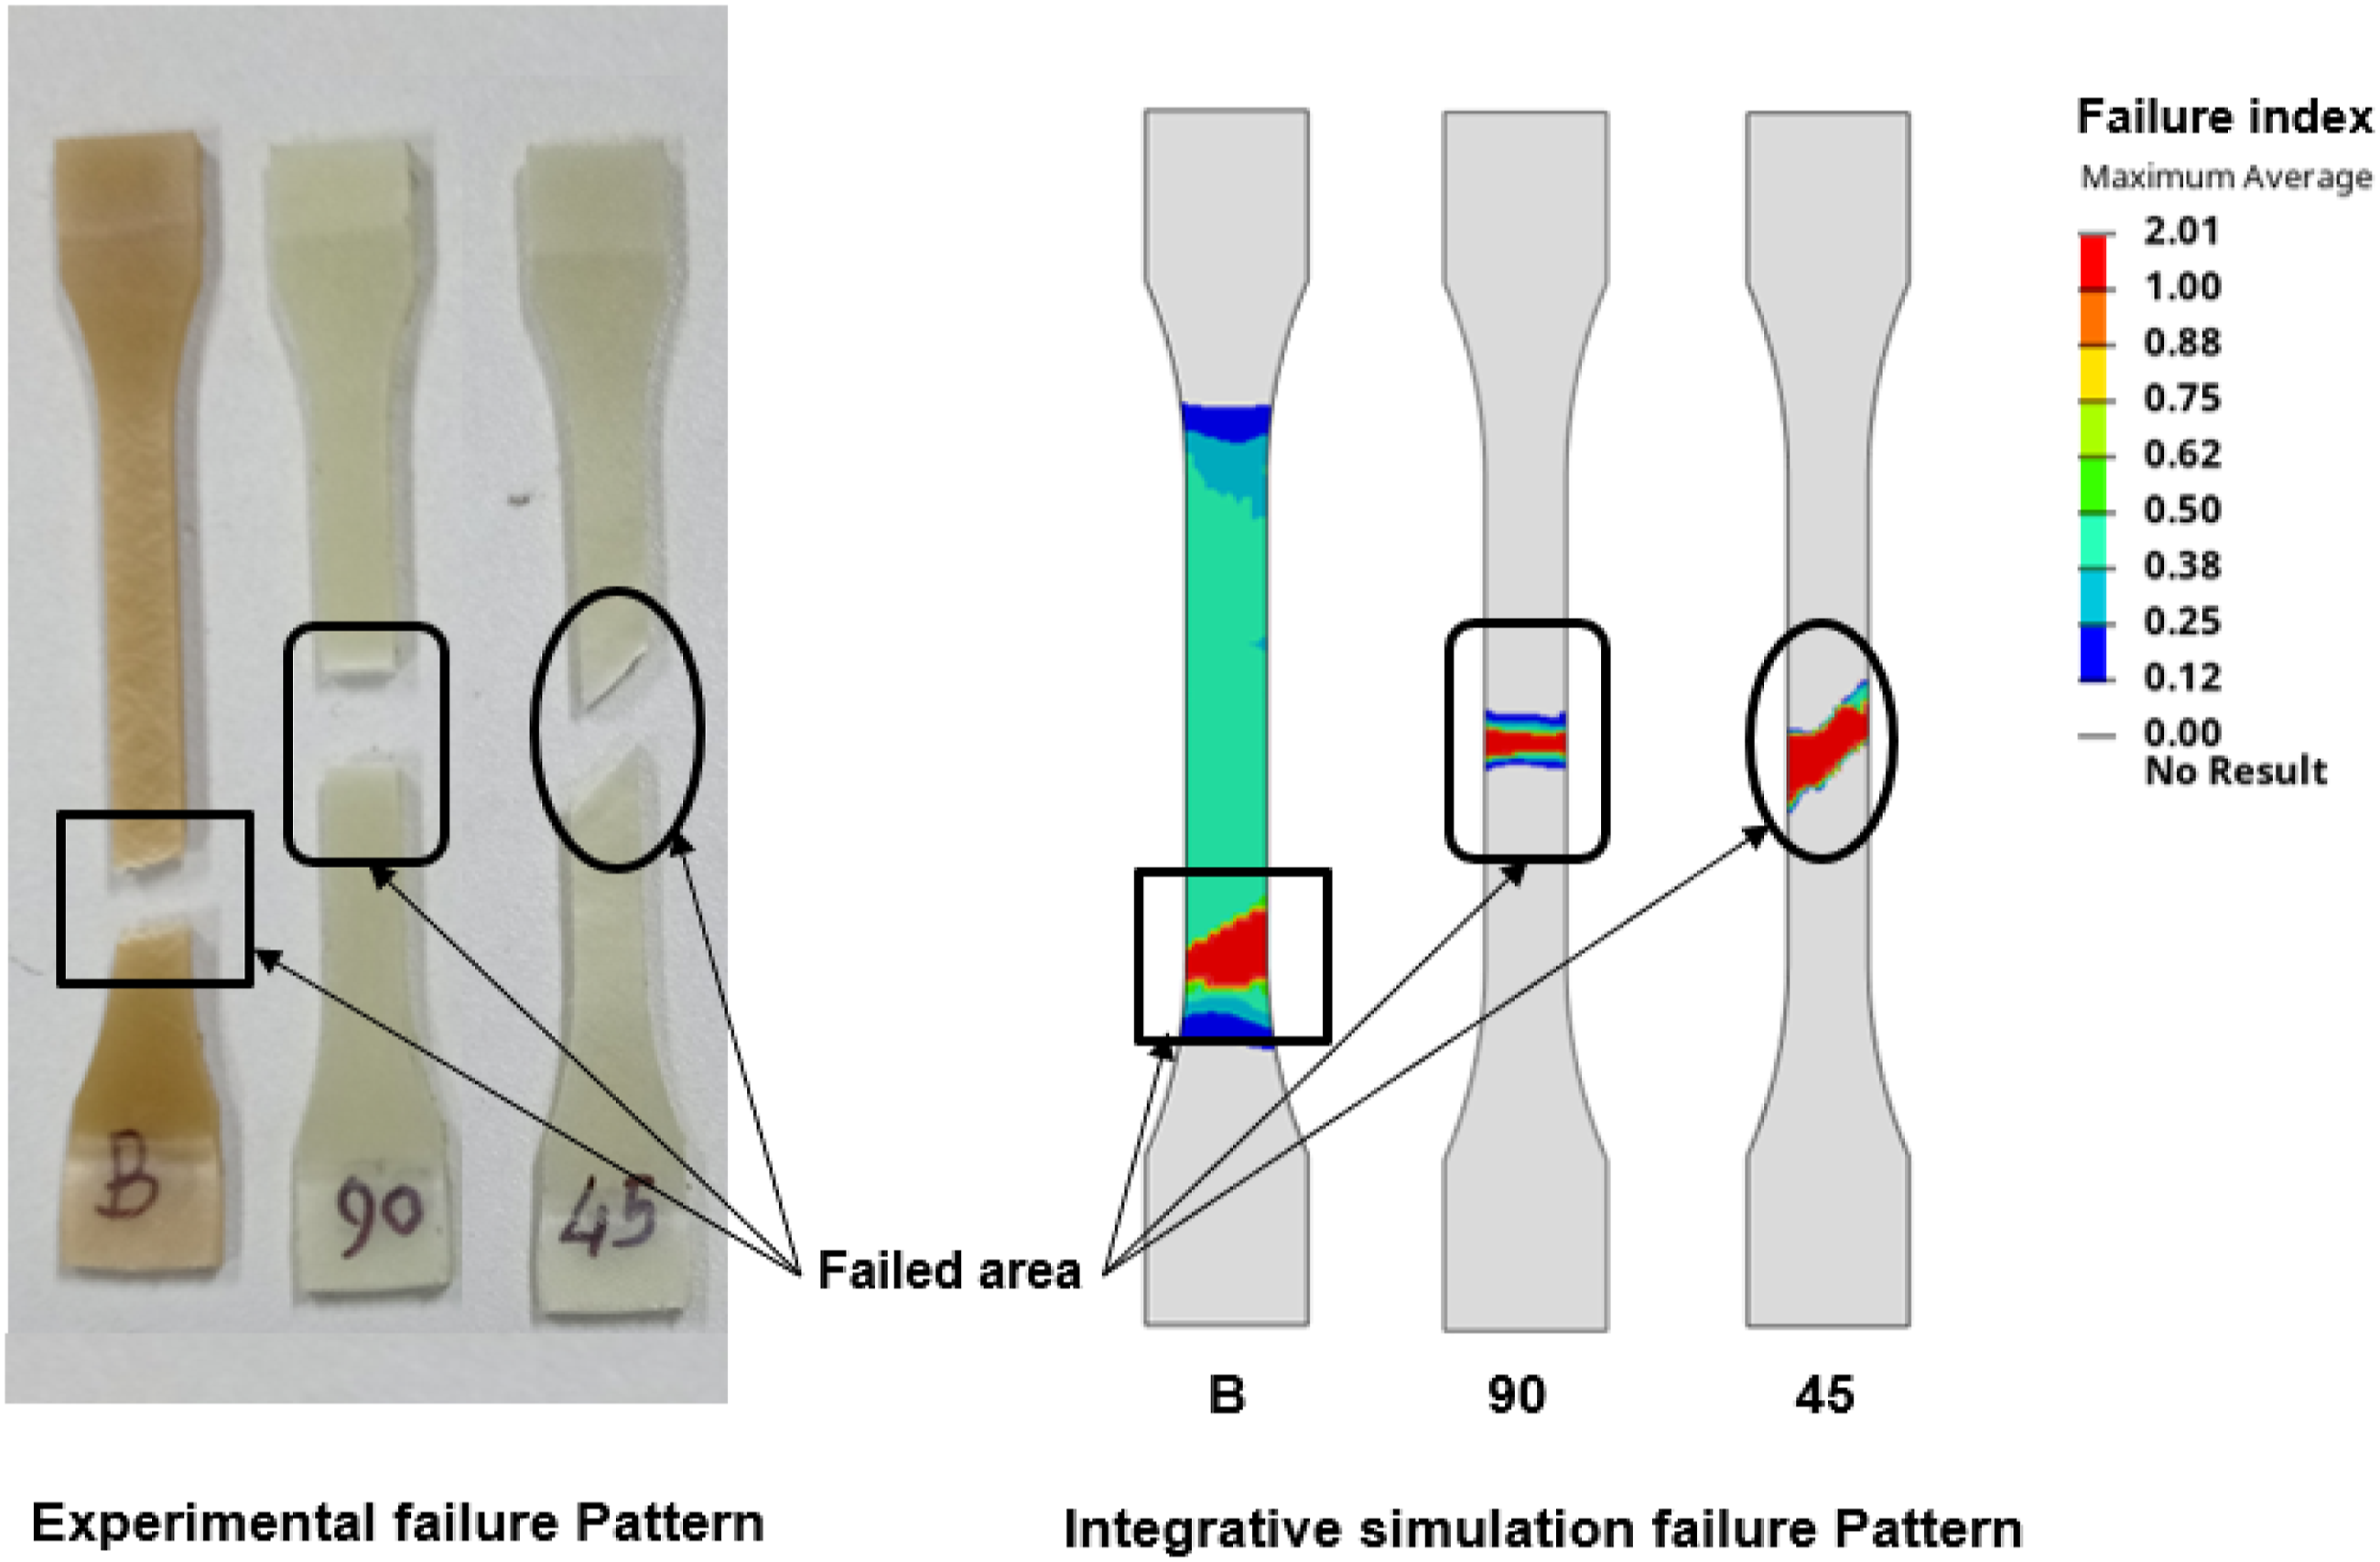
Figure 12 shows scanning electron microscopy (SEM), it is observed that fibers are broken across the cross-section for no weld-line specimen, therefore, strength and stiffness are on the higher side as fiber has more strength compared to base matrix. In case of 90° weld-line specimens’ majority the fibers are seen parallel to the fracture surface, therefore resistance to load comes more from base matrix having less strength and hence overall strength is lower in magnitude.
24
For 45° weld-line specimens, the fibers are seen mixed orientated both parallel as well as inclined direction, which helps increase in overall part ductility which is higher strain at break value and lower stiffness. Scanning electron microscopy analysis for no weld-line, 90° weld-line, and 45° weld-line specimen.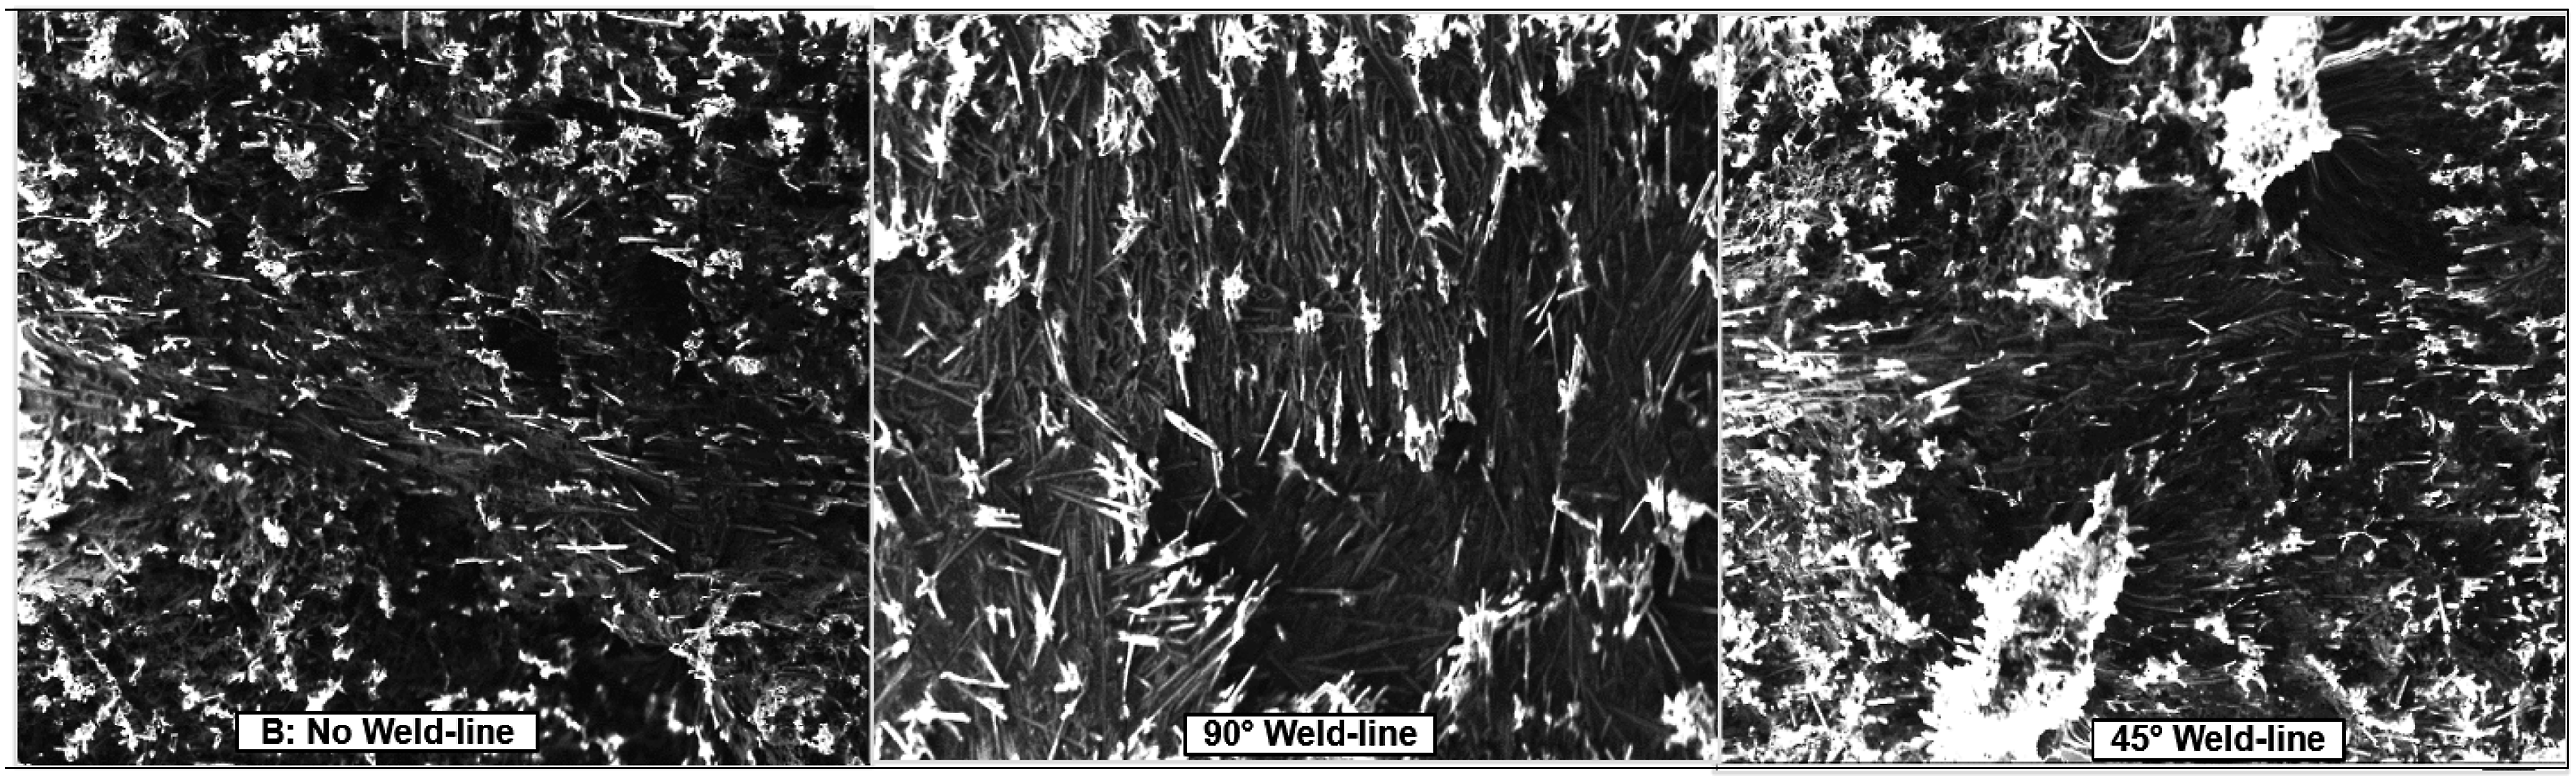
At the weld-line area, the material's overall strength in the loading direction was reduced mainly because of fiber orientation anisotropy.1,16,18 In case of no weld-line specimen, the glass fibers are observed to be aligned in flow direction, which is also loading direction, therefore crack starts at the end of the fillet and there is no weak point in the gage length area, similar behavior is observed in the integrative simulation. For 90° weld-line and 45° fibers are aligned perpendicular to the flow direction which is captured nicely by the integrative approach hence location and failure pattern exactly corresponds to the test results.
The load-displacement curves are plotted for experimental test results, integrative simulation results, and isotropic elastic-plastic simulation results and are shown in Figure 13. It is observed that integrative simulation results for all three cases are quite closer to test results compared with isotropic simulation results. Therefore, the use of the isotropic elastic-plastic material model for glass fiber-reinforced material will lead to wrong prediction hence an integrative anisotropic approach is suitable for glass fiber-reinforced injection molded materials. Load-displacement cusrves for experimental test, integrative simulation and isotropic simulation for no weld-line, 90° weld-line, and 45° weld-line.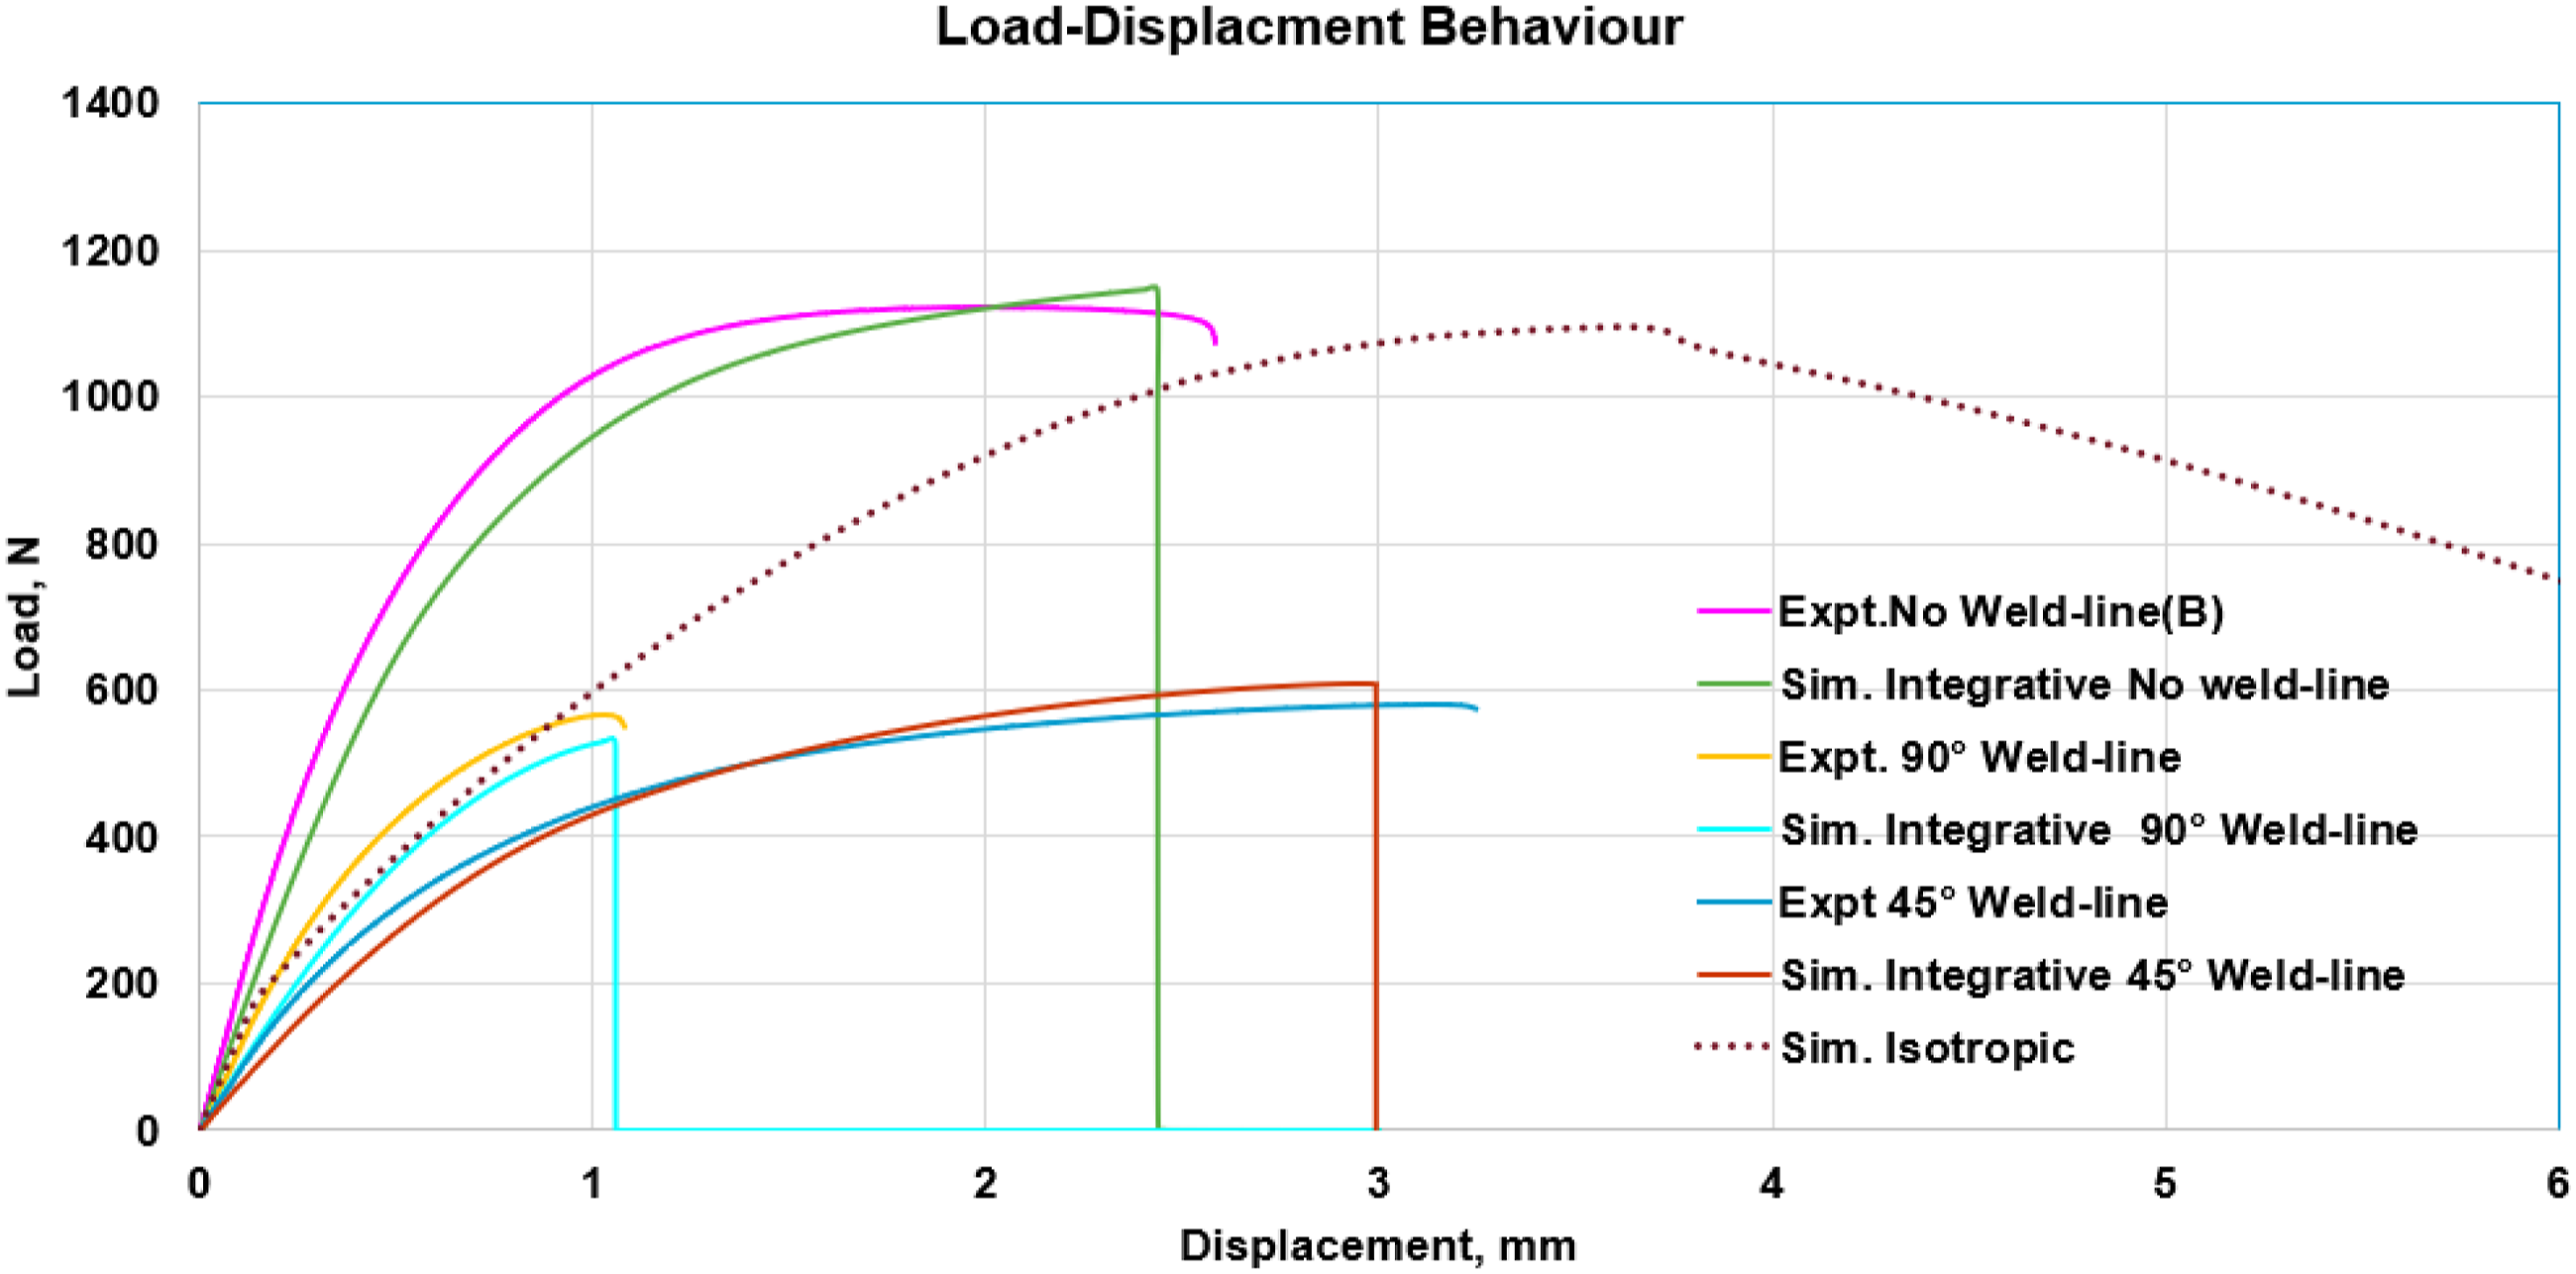
Load and elongation at break comparison of experimental test, integrative simulation, and isotropic simulation.
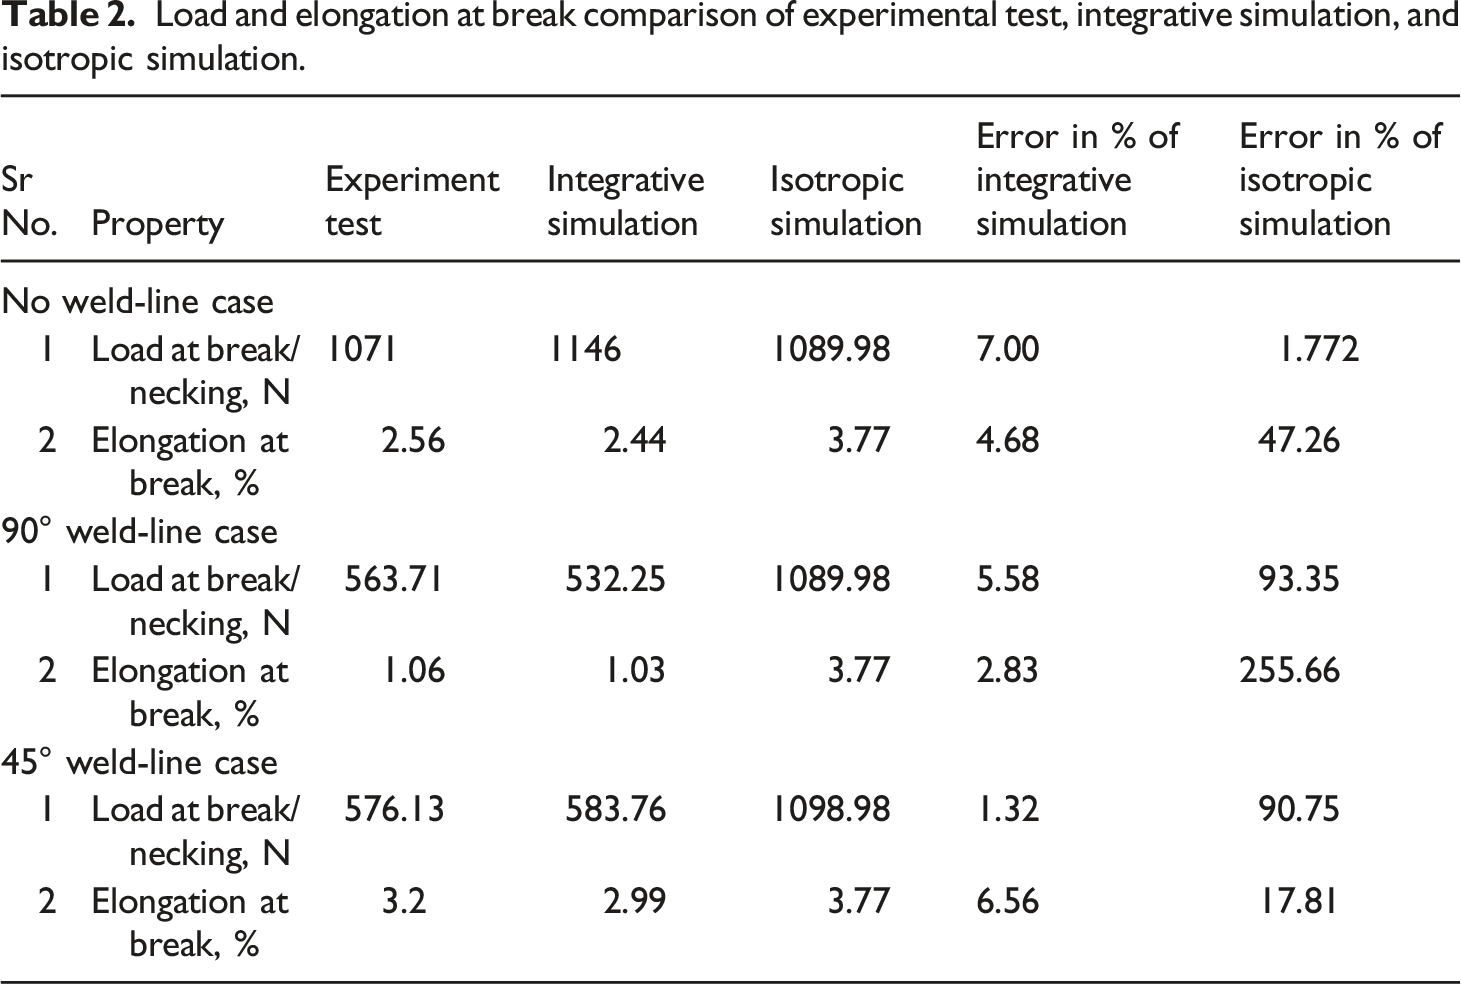
It is observed that for no weld-line specimen, the error in load at break and elongation at break with integrative simulation is 7.0% and 4.68% respectively and with isotropic simulation it is 1.77% and 47.26% respectively. For the 90° weld-lines specimen, the error with isotropic simulation is highest which is 93.55% in load at break and 255.66% in elongation at break, however; in the case of integrative simulation, the error is small which is 5.88% in load at break and 2.83% elongation at break which is fairly accurate. Similarly, for the 45° weld-line case with integrative simulation, the error in load at break is 1.32% and the error in elongation at break is 6.56% and with isotropic simulation, it is 90.75% and 17.81% respectively. Therefore, an integrative simulation approach is quite accurate to evaluate the weld line strength of the component as compared with isotropic simulations.
Summary and conclusion
The effect of the weld-line for 30% glass-reinforced polyamide-6 is evaluated by performing integrative and isotropic simulations. The fiber orientation anisotropy and weld-line details are captured from manufacturing moldflow simulation and integrated into structural analysis by mapping Moldflow output results in BASF’s Ultrasim® material mapping tool and then solved in Abaqus structural solver. The integrative and traditional isotropic simulation results and failure patterns are compared with experimental test results.
The results correlation analysis is performed by evaluating the failure pattern and plotting the load-displacement behavior of tensile test specimens. It is observed that the integrative simulation failure pattern and load-displacement curve are close and in line with experimental results and much better than isotropic results. It is also observed that for weld-line cases, error with isotropic simulation is very high which is 90% in load at break and 255% in elongation at break. However, weld-line defect is well captured with integrative simulation with a maximum error of 5.58% in load at break and 6.56% in elongation at break.
The methodology used in this study is unique and can be applied to larger applications to predict weld-line strength by capturing material characteristics for specific areas from Moldflow simulation into structural simulation. The work can be further extended by conducting studies on different engineering plastic materials with varying reinforcement from zero fiber content to maximum possible fiber content and validating with experimental tests at the specimen level and component level.
Footnotes
Declaration of conflicting interests
The author(s) declared no potential conflicts of interest with respect to the research, authorship, and/or publication of this article.
Funding
The author(s) received no financial support for the research, authorship, and/or publication of this article.