
Abstract
In an injection molding process, a weld-line forms when two flow fronts meet each other. Weld-line is a weak area which reduces the strength of the part locally. For multiple gate and complex part, molding weld-lines are unavoidable, therefore mechanical behavior of the weld-line needs to be predicted. This paper presents the effect of weld-lines on tensile properties of glass fibers reinforced polyamide-6 composite. An injection molding plaque tool has been designed and manufactured with the inputs from mold flow simulation software. The gating system is designed in such a way that the angle between two flow fronts is as minimum as possible, which theoretically gives the lowest strength at weld locations. The plaques are manufactured with BASF material Ultramid B3WG6 grade (glass filled 30%) which is a widely used engineering plastic material. Test specimens have been cut on a plaque for various angular positions. Experimental evaluation for tensile testing, tensile modulus, and stressstrain behavior for specimens with and without weld-line at different angular positions was evaluated as per ISO 527-2 standards. It has been established that the weld line significantly influences the tensile properties of the part. The presence of a weld line results in a significant decrease in the tensile strength of the part. Experimental results show approximately 58% reduction in tensile modulus and 49% reduction in stress at break values in specimen with weld-lines as compared to specimen without weld-lines.
Introduction
A weld-line (also called a knit line) is a defect of an injection molding manufacturing process. Weld-line is not only an aesthetic defect but also a mechanical defect. 1 When a molten polymeric material is injected from the nozzles to the cavity via sprue, runner, and gates into the cavity, multiple flows are formed based on the geometry of the part. These flow fronts meet each other while filling the cavity and form the weld-line.2,3 Generally, the tool maker or molder tries to minimize weld-lines by employing a suitable gate location. However, in the case of complex geometry and large parts, it is difficult to avoid weld-lines.2,4 In general, there are two types of weld-lines, first is stagnation weld-lines which are formed when two melt front meets directly, usually occur in circular geometry or multiple gate locations and the angle between melt fronts is generally lower in magnitude. The second type is flowing weld-lines which form when two flow fronts meet during flowing and usually occur when an obstacle is coming in-between flow.5,6
When two melt fronts meet each other, the mechanical properties of the mating region are not as that of the parent material, this is because of molecular diffusion of the material, fiber orientation distortion, surface tension effect, etc.1,7 Most of the time molecular diffusion and fiber orientation distortion reduces the strength of the part. The surface tension effect creates a V shape notch and aesthetic defect as well as an obvious source of stress concentration that initiates a crack at the mating area.2,3 An insufficient melt temperature and packing pressure also reduce the strength of the weld-line because of inadequate bonding.4,6
When an injection molded application is subjected to mechanical loading, and the load transfer path is going from weld-line plane, then there are maximum chances of failure at weld-line regions. Sometimes strength in the weld-line area is significantly lower and hence considering traditional allowable limits i.e. stress at break or strain at break will not be the right approach.1,5,8,9 This may lead to the wrong design and subsequent failure of the part. To avoid this, it becomes necessary while designing a plastic injection molded part to identify the weld-line areas and strength of part near weld-line areas.
The reduction of the strength at the weld-line area varies based on the type of polymer, type of reinforcement, injection molding parameters, type of weld-line, direction of loading, etc. For un-reinforced amorphous and semicrystalline materials, the effect of weld-line is small and the reduction in strength is approximately ranging from up to 7%–15%.5,8,10 With adding reinforcement, the values are further reduced by 20–50% depending on the amount and type of reinforcement.5,6,11 The process parameters play an important role in weld-line quality. It was reported that an increase in melt temperature and packing pressure gives better weld strength.4,7,12 The weld-line strength reduction is depending on the formation of the weld-line, when flowing weld-line forms then weld-line strength reduction is up to 25% however for stagnation weld-line strength reduction is more than 50%.5,6 The angle between loading direction with weld-line plane is also affecting strength of the weld-line, 8 in this work it is referred as weld-line angle. Hence semicrystalline reinforced material, stagnation weld-lines and loading direction are critical from a mechanical performance point of view, therefore in this work, these aspects are taken into consideration.
Worldwide intensive efforts are being performed by the research community to predict weld-line strength as there is no commercial package or method available to find out strength in the weld-line location. Many researchers have tried different ways to address this effect in their work, Sarah Mosey et al. 13 have employed Taguchi parametric array and microscopic technique and reported that the melt temperature is the most significant parameter affecting the weld-line strength. Jakob Onken et al.1,5,8 have developed a healing model of weld-line for amorphous thermoplastic polystyrene material, an integrative simulation method for amorphous material for flowing hot weld-lines and studied molecular interdiffusion to predict the weld-line strength. Maria C Quintana and Patricia Frontini 6 studied the residual strength of a fiber-reinforced injection molded part containing a flowing weld-line by using fracture mechanics experiments. They found total fracture energy, and strain at break for the weld-line specimen is more however tensile modulus is lower compared with no weld-line specimen. With the aim of evaluation of weld-line factor, polarized light microscopy has been employed by Xian Jun Sun et al. 10 who have reported a 50% reduction in weld line strength with talc-filled polypropylene. Azieatul et al. 7 studied the weld-lines formation of polypropylene and glass fiber filled polypropylene material considering different melt temperatures and mold designs. They compared experimental results of weld-line length, angle, and location with simulation results and found good results correlation at a melt temperature of 240oC for both unfilled and glass-fiber filled polypropylene however correlation results were not matching at a melt temperature of 250oC and 260oC. Yusuf Kagitci and Necmettin Tarakcioglu 4 investigated the effect of injection pressure, injection time, and packing pressure on weld-line and arrived at appropriate values of injection pressure, injection time, and packing pressure based on weld-line tensile load. Katsuyuki et al. 2 have reported research on the characterization of the microstructure using polarized laser Raman spectroscopy, micro-cutting analysis, and fracture testing and found significant reduction by weld-line attributed to increasing molecular weight or broadening molecular weight distribution. Chung-Ching Huang et al. 9 developed a hot runner system, sequential valve gates aimed to achieve cost effective methods for the prediction of weld-line properties. The authors have predicted the strength of the weld-line using the temperature of the melt front as suggested by mold flow simulation software. They have arrived at a certain value of the sum of heat degrees below which there is inadequate bonding at melt fronts interface thereby reducing mechanical properties drastically. B. Fisa and M. Rahmani 14 studied weld-line strength as a function of the cavity shapes and depths and found mold shape is not contributing to the strength of weld-line and strength mainly depends on fiber orientation at the weld region. Lei Xie et al. 15 introduced the ultrasonic oscillation method to reinforce the strength of micro injection molded weld-line. They found that oscillation induced from injecting moment to packing procedure with lower power (400 W) has better weld-line strength performance than oscillation induced from injecting moment to ejection moment for higher oscillation power (600, 800 W). Lih-sheng Turng and Hrishikesh Kharbas 12 reveal that changes in melt temperature and injection speed had a direct bearing on weld-line microstructure and strength of weld-line area for polycarbonate material. Kilwon Cho et al. 3 conducted an experimental compact tension test to evaluate weld-line strength for brittle and ductile polymers by evaluating the stress intensity factor and comparing it with the standard tensile test. They found that for brittle polymer weld-line factor with the compact test method was higher and for ductile material, there was no difference for both compact and normal test methods. They also found that the compact tensile test was more relevant for measuring interfacial adhesion strength across the weld-line without a notch effect. Sang-Gook Kim and Nam P. Suh 16 developed a theoretical model for the strength of weld-lines which gives weld-line location and causes of weld-line weakness pertaining to amorphous polystyrene material. T. Nguyen-Chung et al. 17 used the micro-hardness technique to characterize the quality of the weld-line formed by a cylindrical obstacle. They found that the weld-line near the obstacle shows a decrease in hardness value only up to the distance equal to the diameter of the obstacle however for larger distance there was no reduction in hardness value. They also concluded that the micro-hardness method is an accurate method to get information about the local degree of interdiffusion within the weld boundary. M. Narkis and A. Vaxman, 11 did a study on quantitative measurement of fiber orientation and failure at weld-line for short fiber reinforced thermoplastic PPO/PS compound. They analyzed fiber orientation distribution by photomicrographs of polished sections at the weld-line area and found that fiber alignment normal to flow direction shows 50% loss in tensile strength for 20% filled material however for un-filled material only a small loss in strength but elongation at break is noticeably reduced. R. Boukhili, et al. 18 conducted a study to determine weld-line static and fatigue strength with reinforced and unreinforced polycarbonate. They investigated that for non-reinforced materials effect of weld-line is mainly from V-notch however for glass fiber reinforced material there is an effect due to fiber orientation at the weld-line interface. They also reported the effect of the weld-line on fatigue behavior is very complex and unpredictable to establish the mechanical concept.
Moreover, it has also been noticed that no study has been reported to date related to developing and understanding about the role of stagnation weld-line and weld-line angle for thermoplastic semi-crystalline material. Considering the emerging importance of glass filled PA-6 in engineering applications, a need arises to understand the effect of stagnation weld-lines in terms of final product performance. Therefore, the objective of the present paper is to experimentally investigate the effect of weld-line on tensile properties of the material with weld-line, without weld-line, and weld-line at various angles for thermoplastic PA6 with 30% glass content. The methodology adopted in this research work has not been reported by any other researcher.
Methodology
Material selection and material properties
Industries like automobiles and consumers, largely use various engineering plastics materials for new application development and metal-to-plastic conversion activities. The grades from the family of polyamide-6 (PA6) and polyamide-66 (PA66) are majorly used because of their excellent mechanical properties. In this work, the 30% glass filled PA6 material has been chosen from the BASF material portfolio. i.e. Ultramid®B3WG6. This grade is widely used as it has a good balance of stiffness and ductility.
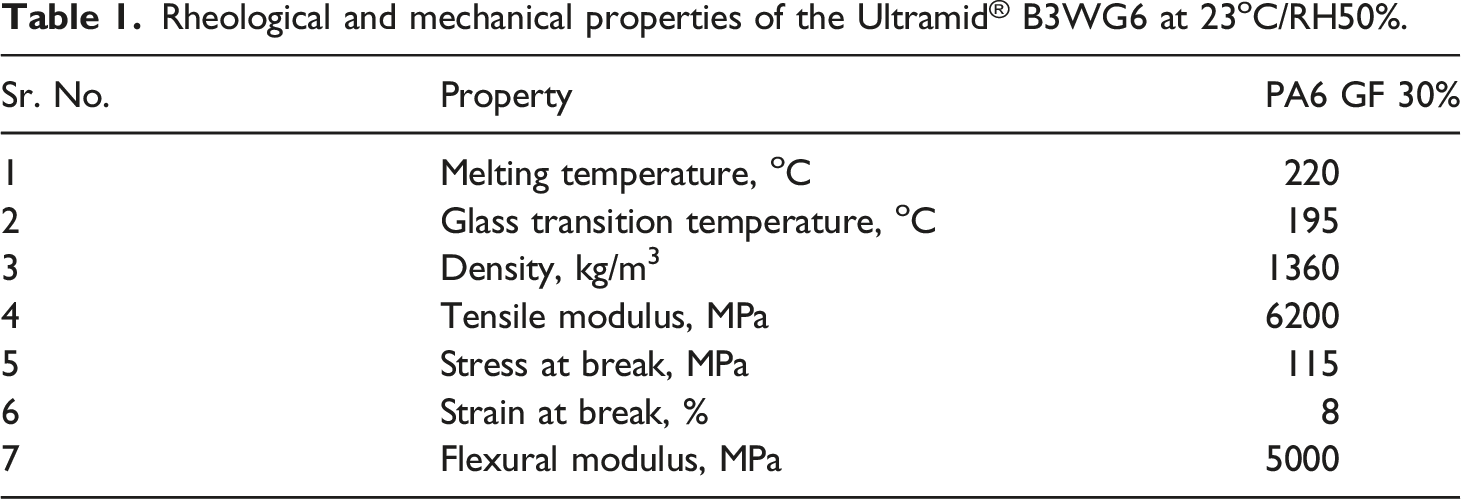
Rheological and mechanical properties of the Ultramid® B3WG6 at 23oC/RH50%.
Weld-line mold design and simulations
The weld-line plaque mold has been designed, considering the gating system in such a way that two mating melt-fronts are making minimum weld angle and maximum weld-line length. The dimensions of plaque are selected in such a way that at least one tensile bar as per ISO 527–2 type 1BA can be cut for any angular position. Moldflow simulations are carried out to select the appropriate gate location, type of gate, runner system, tonnage requirement, etc.
Tensile bar as per ISO 527–2 type 1BA has a maximum length of 75 mm, so plaque dimensions 85 mm x 85 mm x 2.0 mm have been considered keeping 5.0 mm additional dimensions on both sides. Multiple mold flow simulation iterations with different gate locations are performed to identify the best gate location to get a stagnation weld-line.
Figure 1 shows iterations where the weld-line is forming using obstacles however its length and mating angle of flow front is reduced when flow-front moves forward. Weld-line overlay with fill pattern considering obstacle in the flow.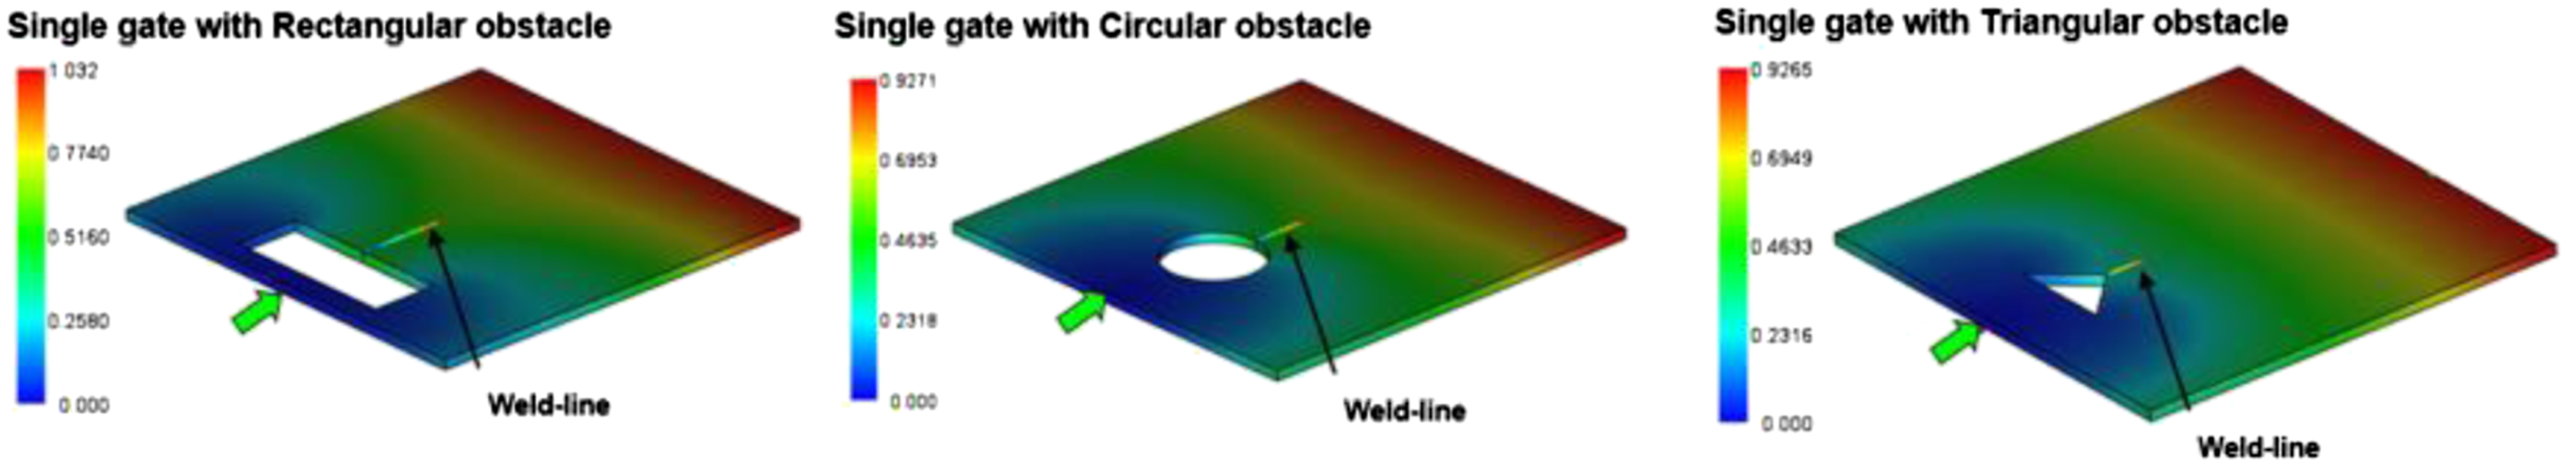
Figure 2 shows various gate locations with direct drop and fan gates. Simulation results show that any direct drop is not suitable because of the shorter weld line and higher mating angle between two flow fronts. However longer weld lines and minimum mating angle between two flow fronts were obtained using a fan gate. Therefore, a fan gate was used to prepare plaques. Weld-line overlay with fill pattern for various gate locations to arrive at full stagnation weld-line.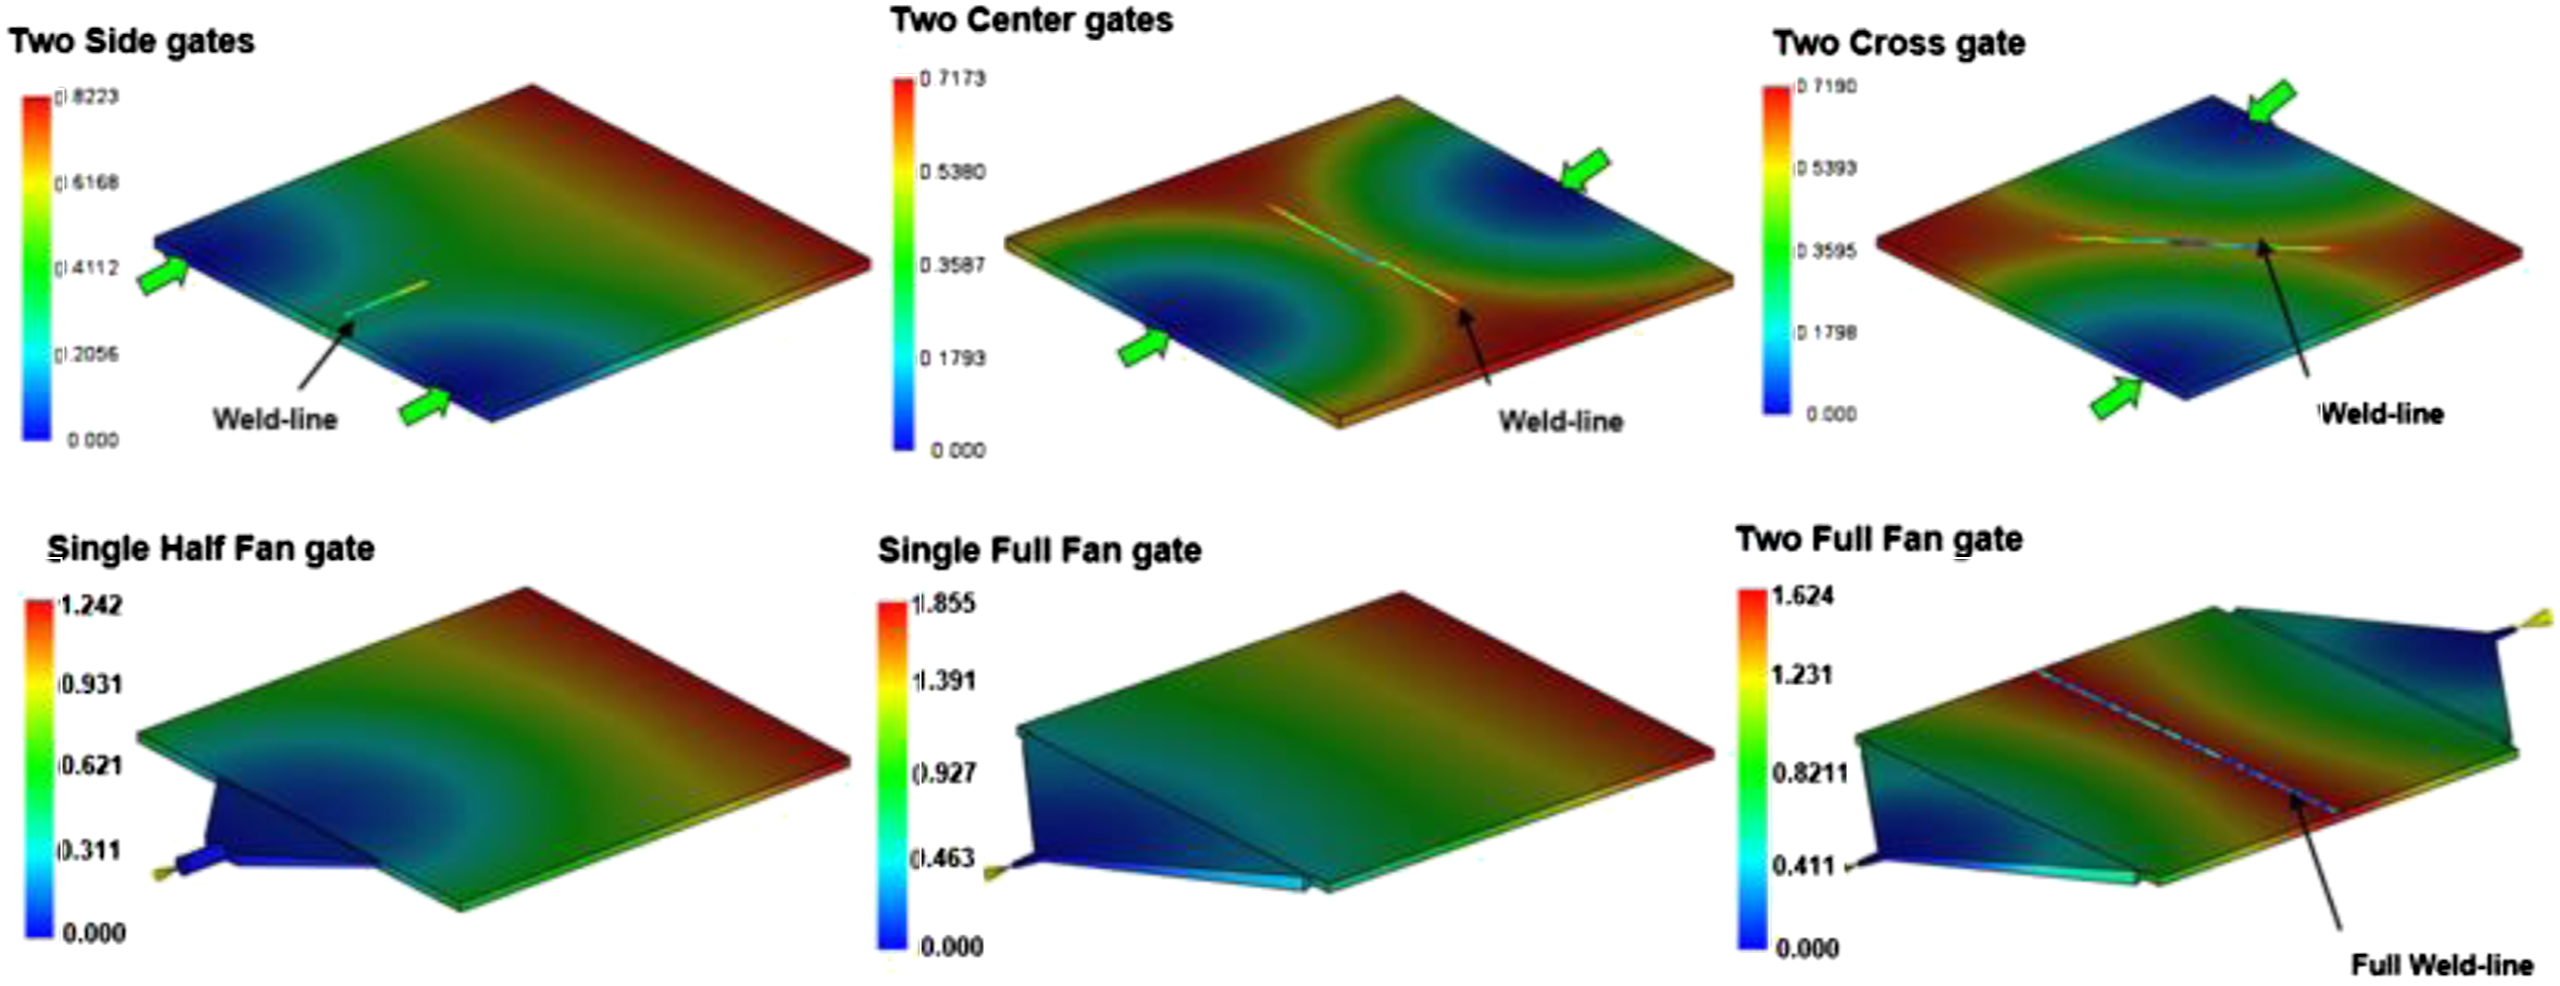
Mold design for plaque
Few researchers have reported work related to flowing weld-line such as weld-line formed because of obstacles in the path of melt-flow1,8 and weld-line on a tensile bar of injection molded specimen.
16
However, in this work plaque tool is designed in such a way that a full-length stagnation weld-line is obtained at the center of plaque and fiber orientation and flow direction are perpendicular to the weld-line. Figure 3 shows the final CAD model of the plaque and Autodesk Moldflow discretized model. Two fan gates on both sides of the plate are designed in such a way that, the thickness of the gate is 1.0 mm, and the width of the gate is equal to the width of the plate to get a parallel flow throughout the plate width. Final CAD model of the plaque with complete gating system and Autodesk Moldflow model.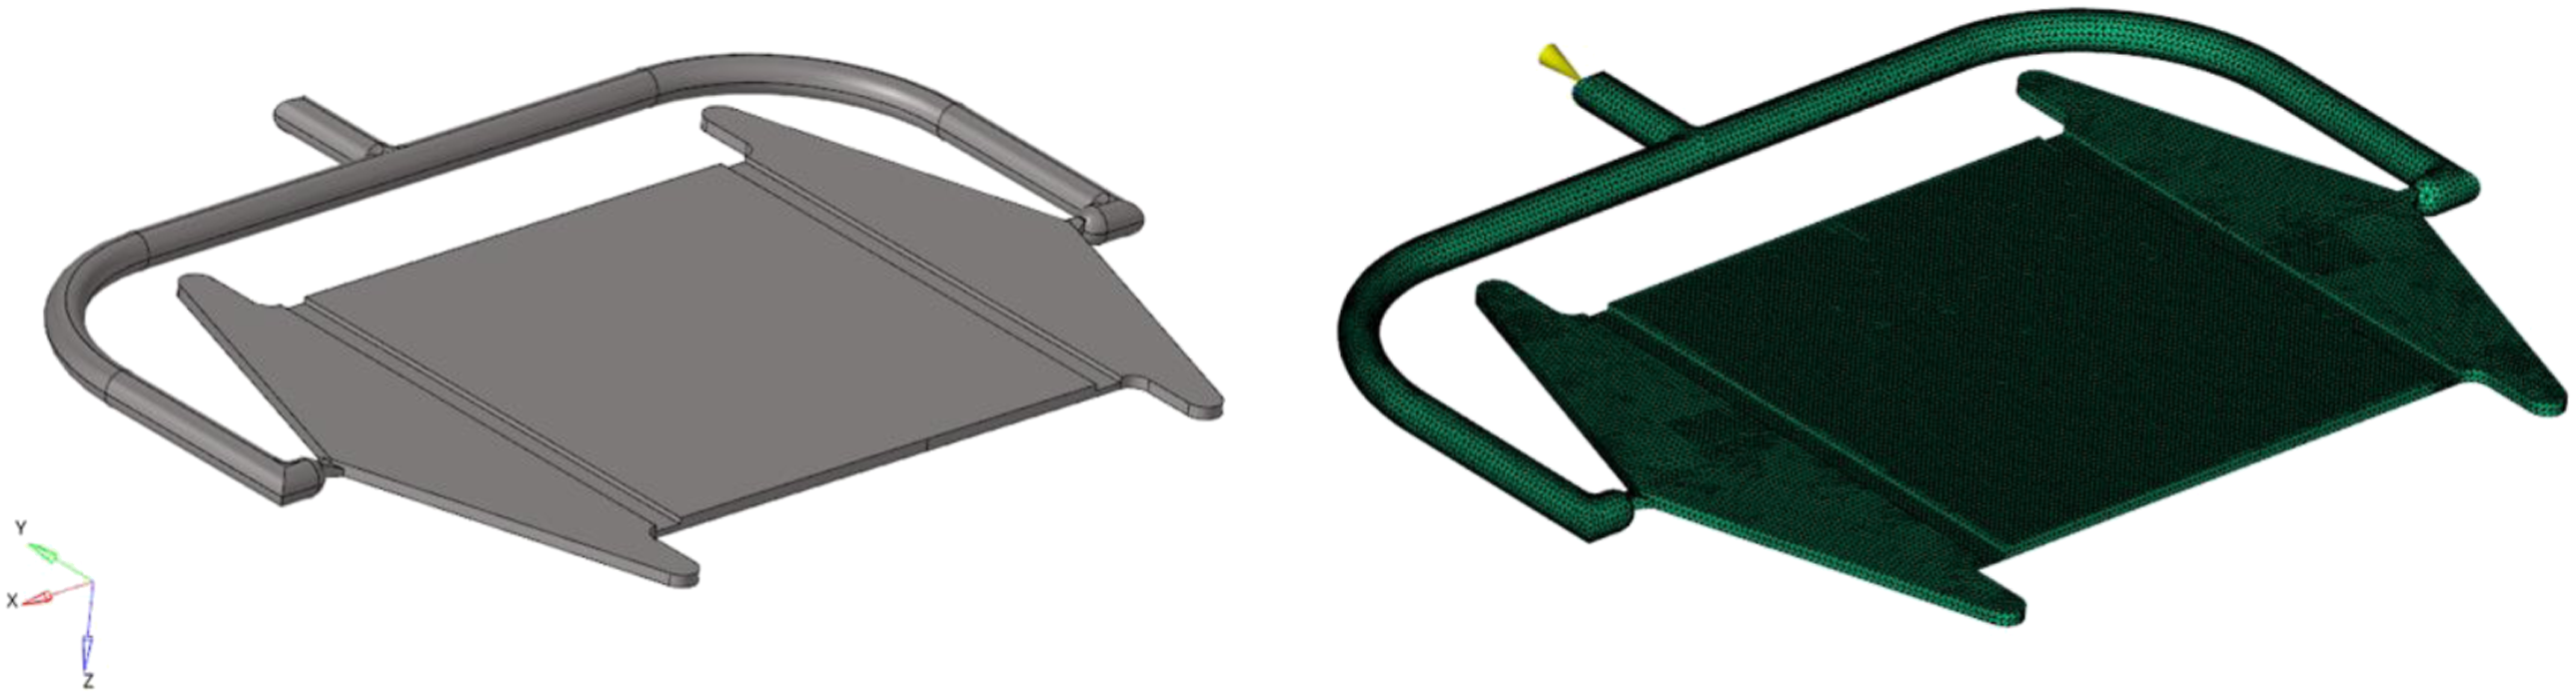
An injection molding simulation is performed on the plaque with standard process parameters and results of weld-line and fill pattern are evaluated. Figure 4 shows melt flow fronts just before mating and after the complete filling of the cavity. The result shows the angle between the flow front is very small and the formation of a complete weld-line throughout the width. Filling pattern/Flow front just before mating each other and after complete filling of the cavity.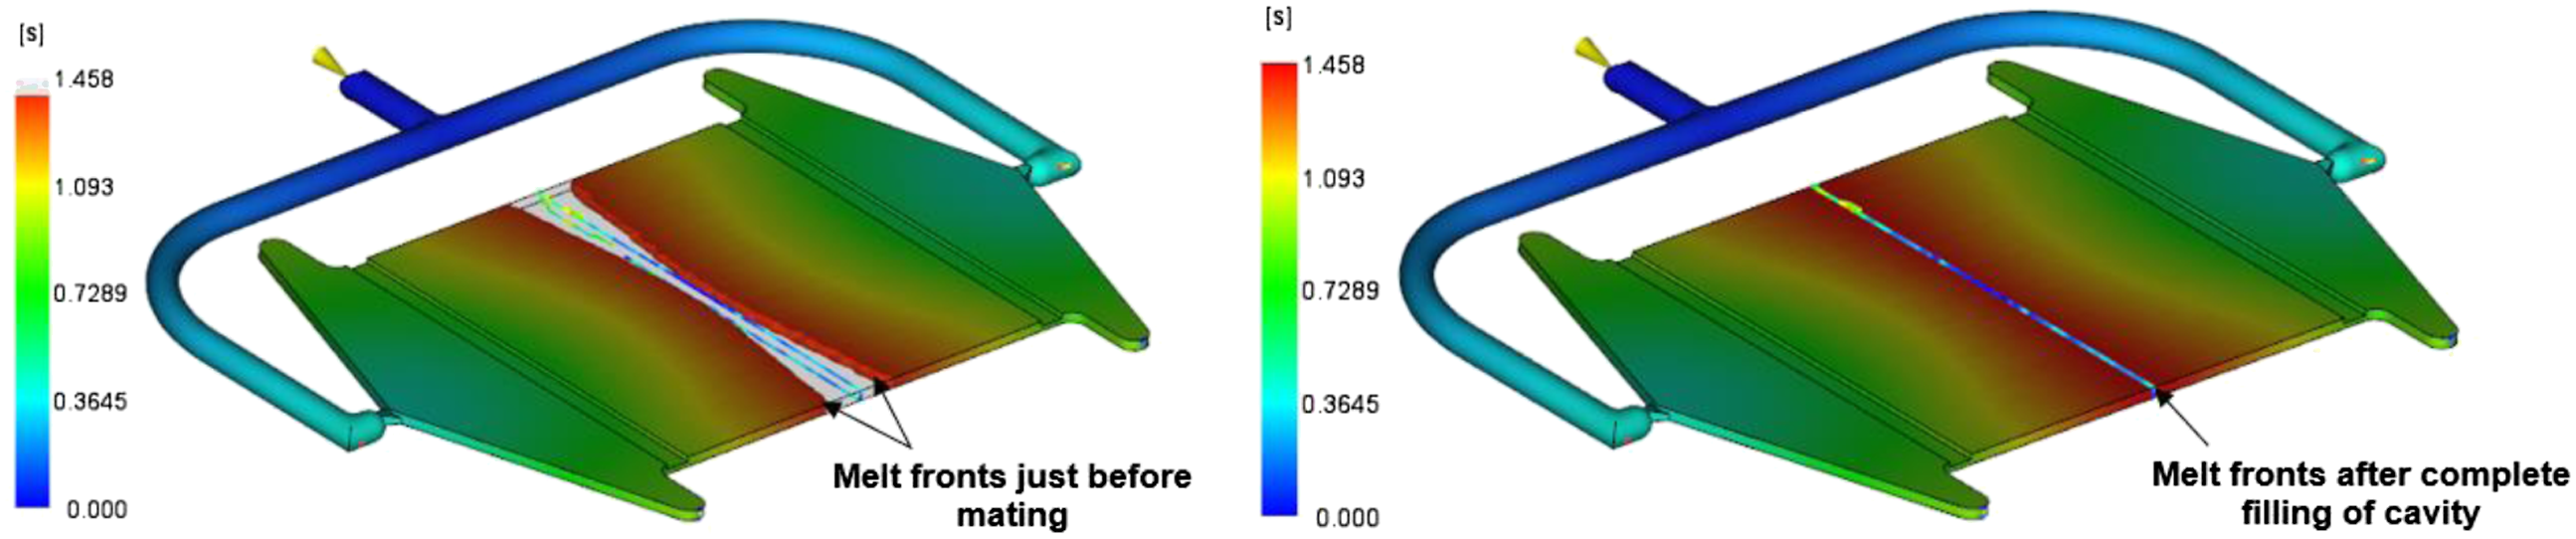
To set a benchmark for without weld-line scenario, the runner system has been modified to get plaque without weld-line. Figure 5 shows the blocking of one runner to stop the flow from one side so that the plaque produced will have no weld-line. Modified gate model and Moldflow filling results for No weld-line plaque.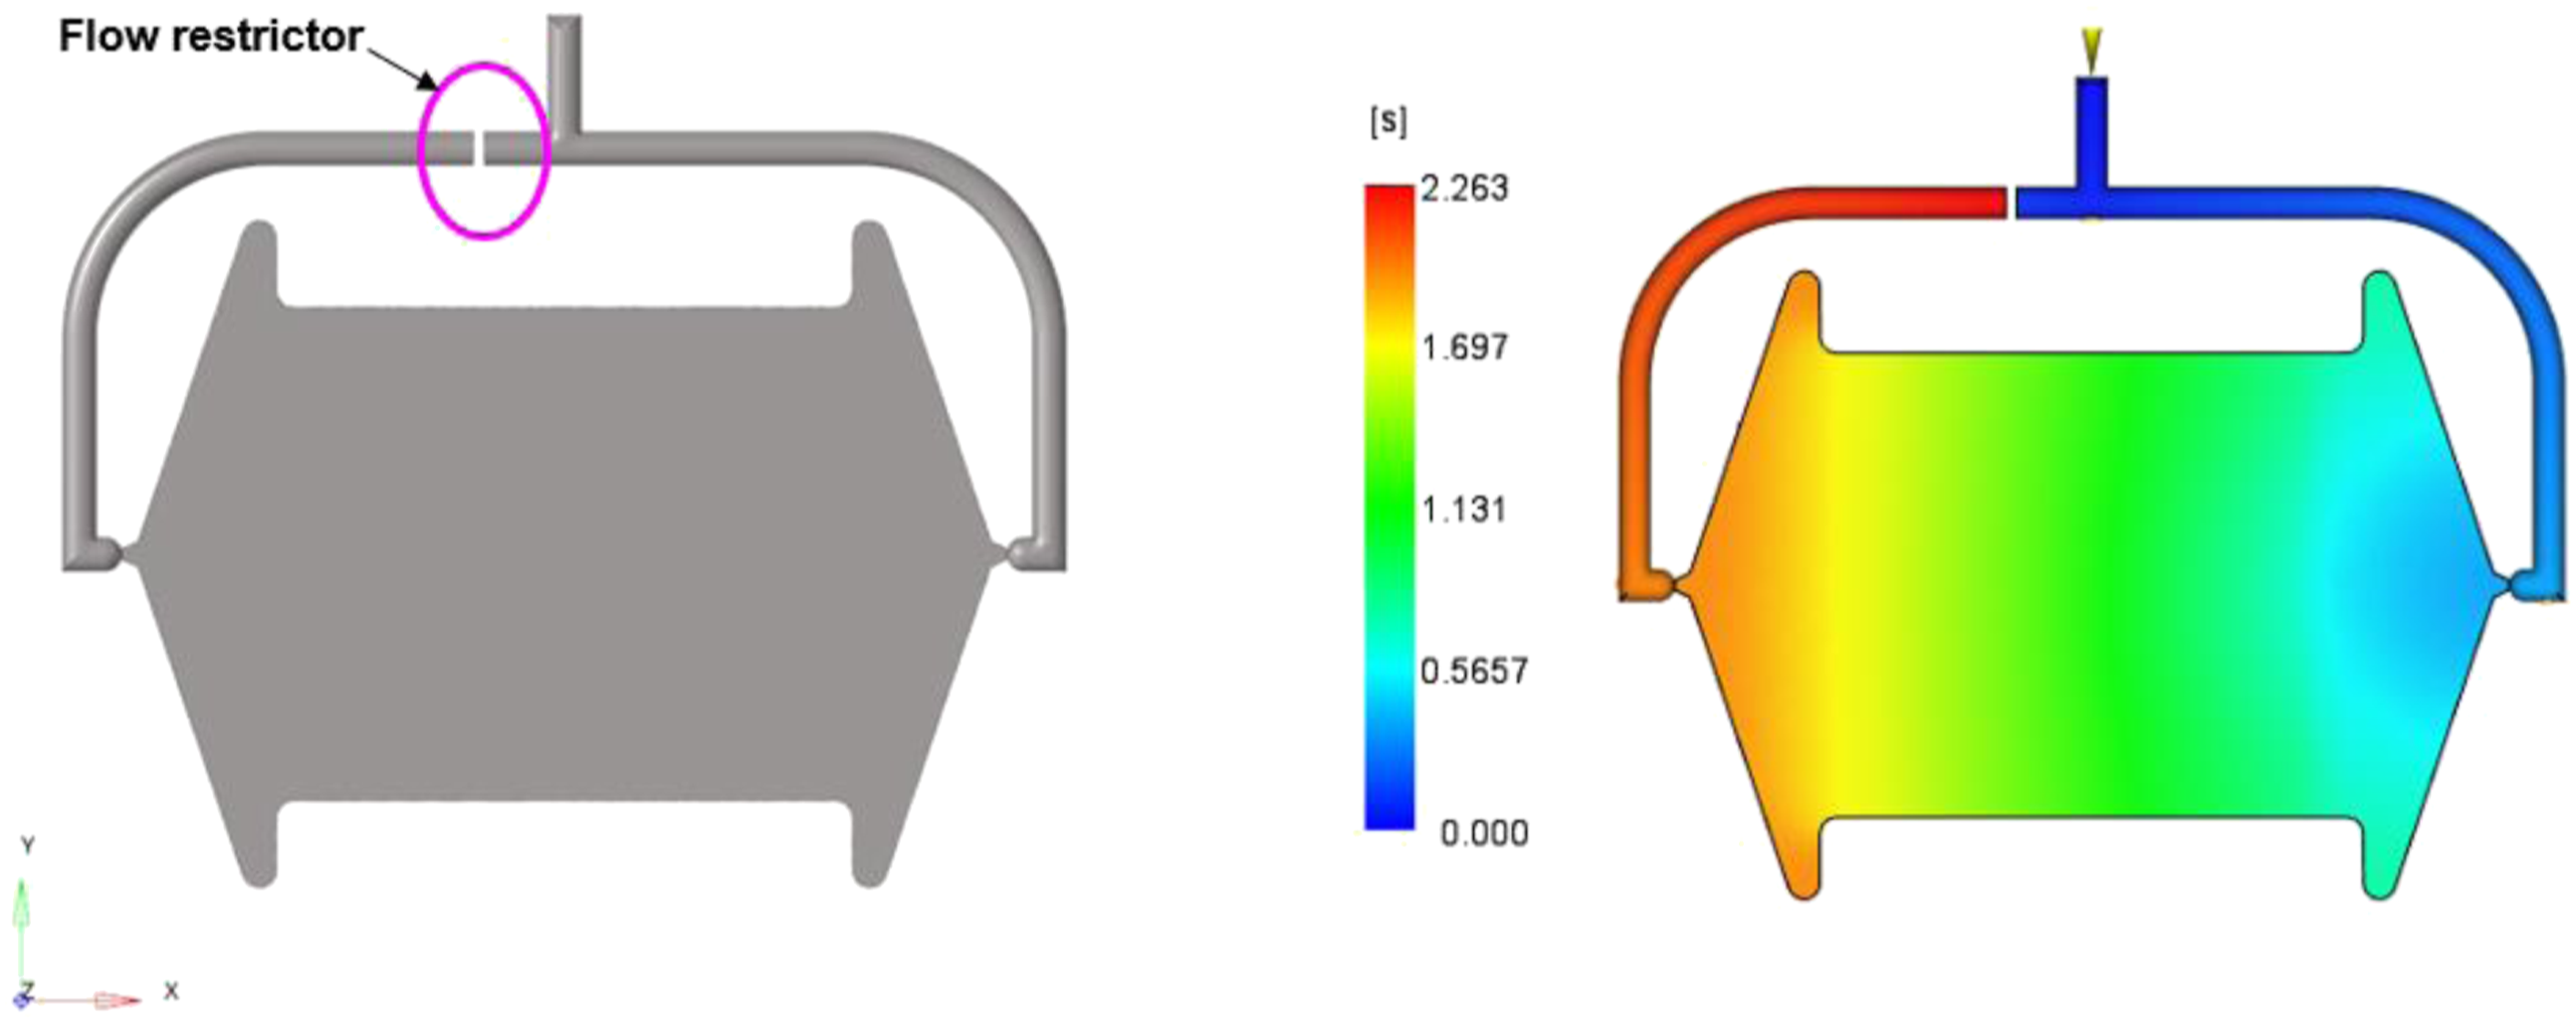
Mold manufacturing
The rectangular shape mold is selected having a size of 150 mm × 160 mm. Four ejector pins are used to eject the part. The mold material used is P-20 Steel, which is used for processing general-purpose plastic material. The mold is manufactured with a CNC milling machine followed by surface finishing with a fine surface finish tool. For No weld-line plaque tool, one runner is blocked with gas welding operation. Figure 6 shows the mold cavity for weld-line plaque and modified runner for No weld-line plaque. Mold cavity of weld-line plaque and runner modification for No weld-line plaque.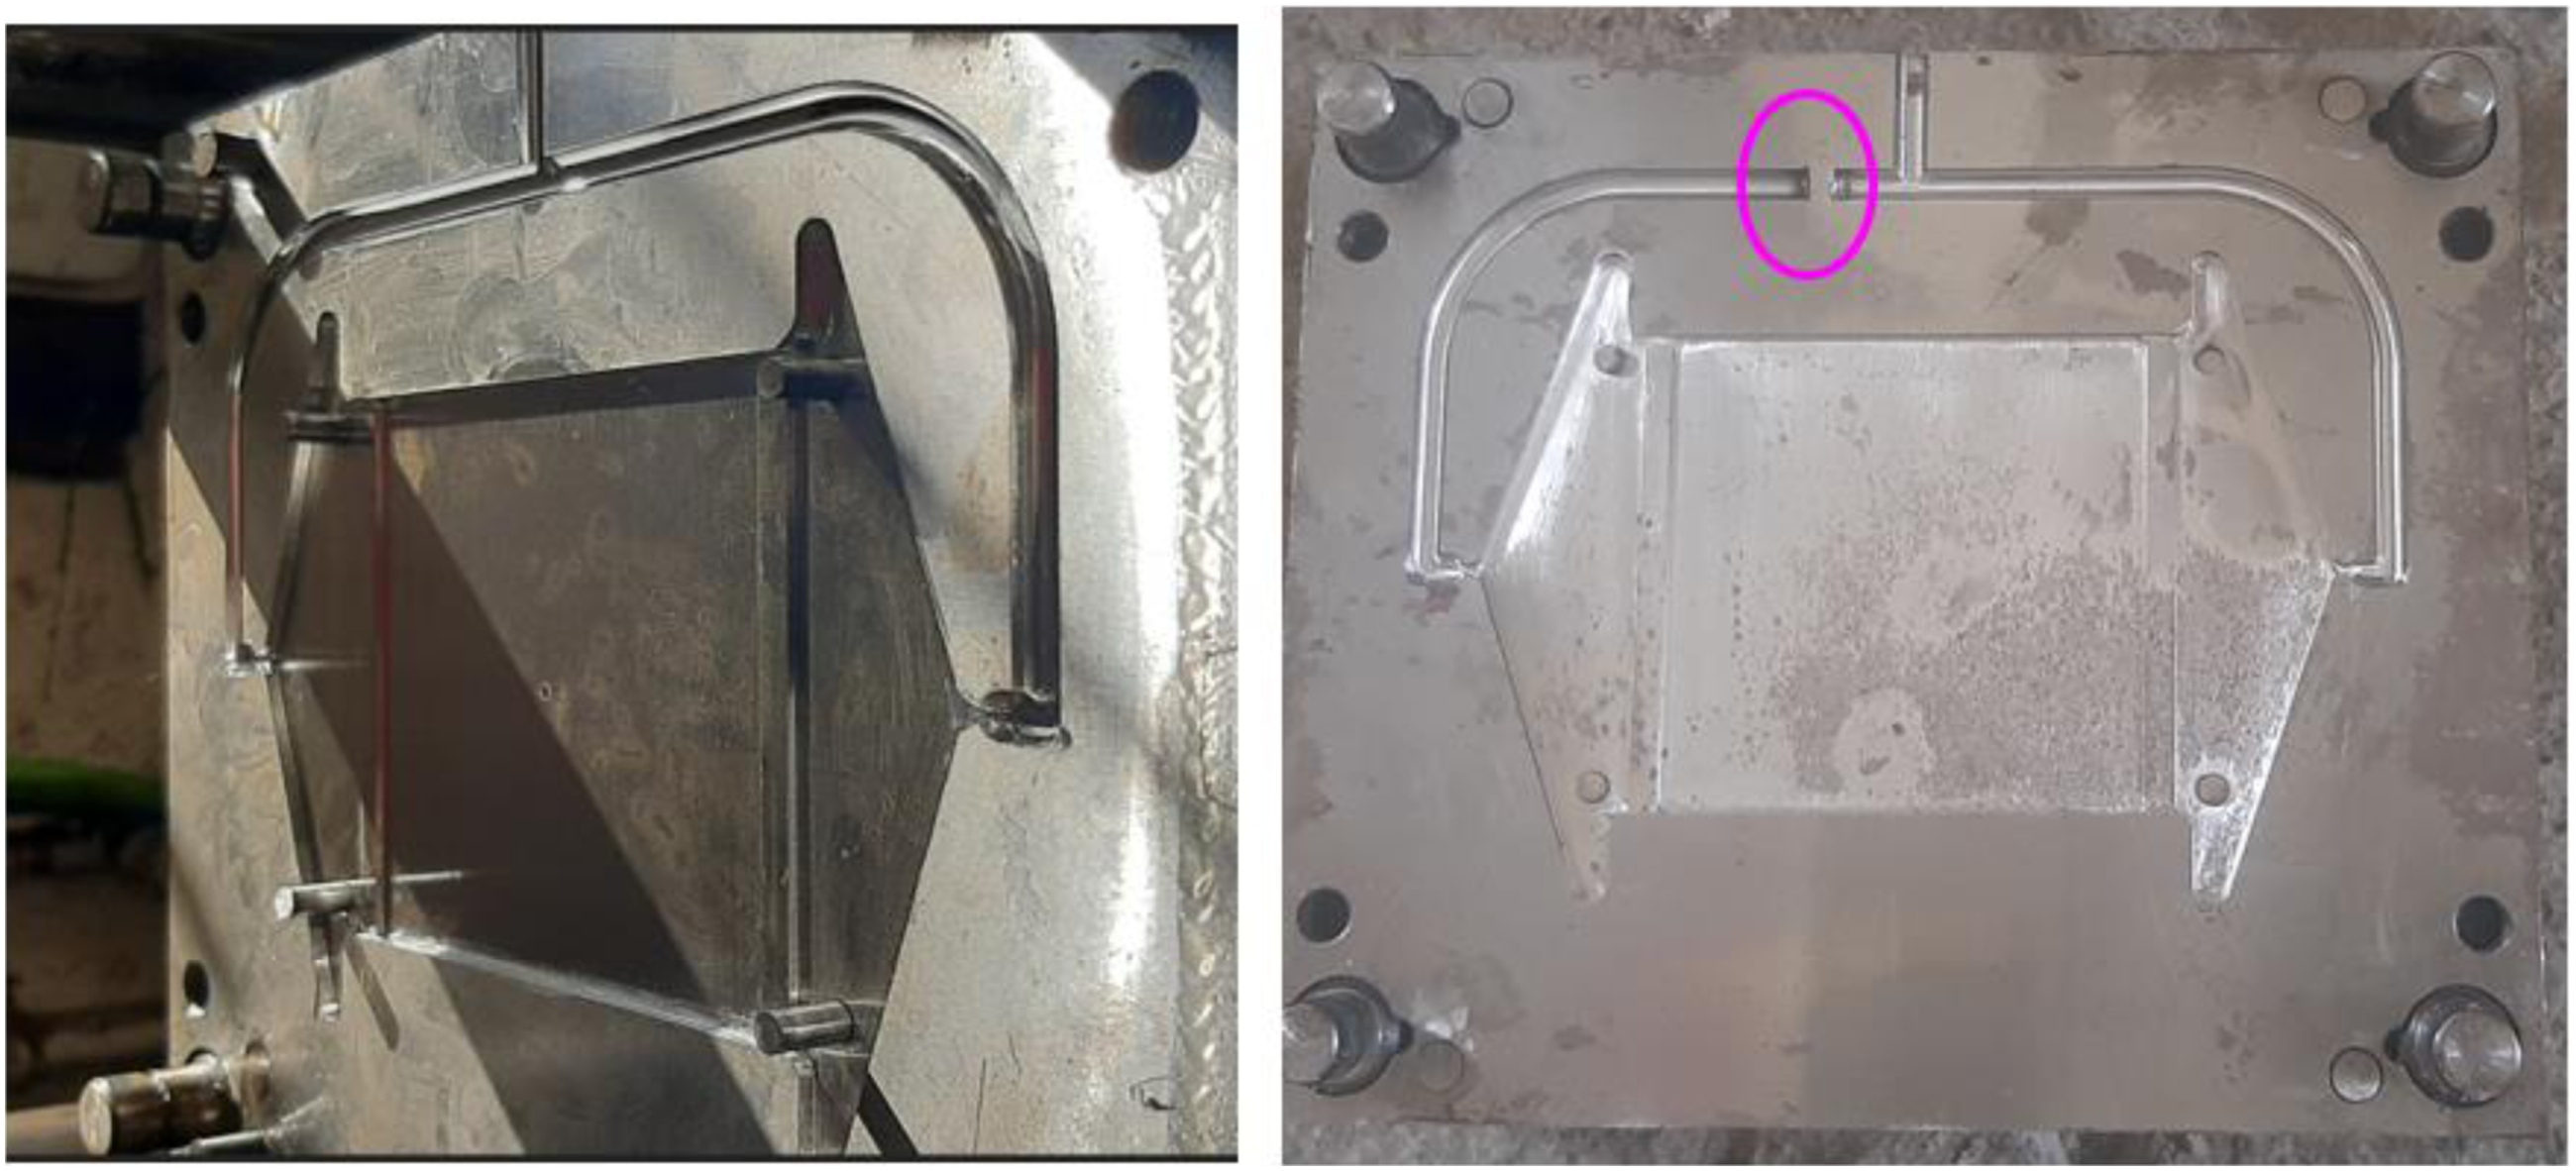
Plaque manufacturing
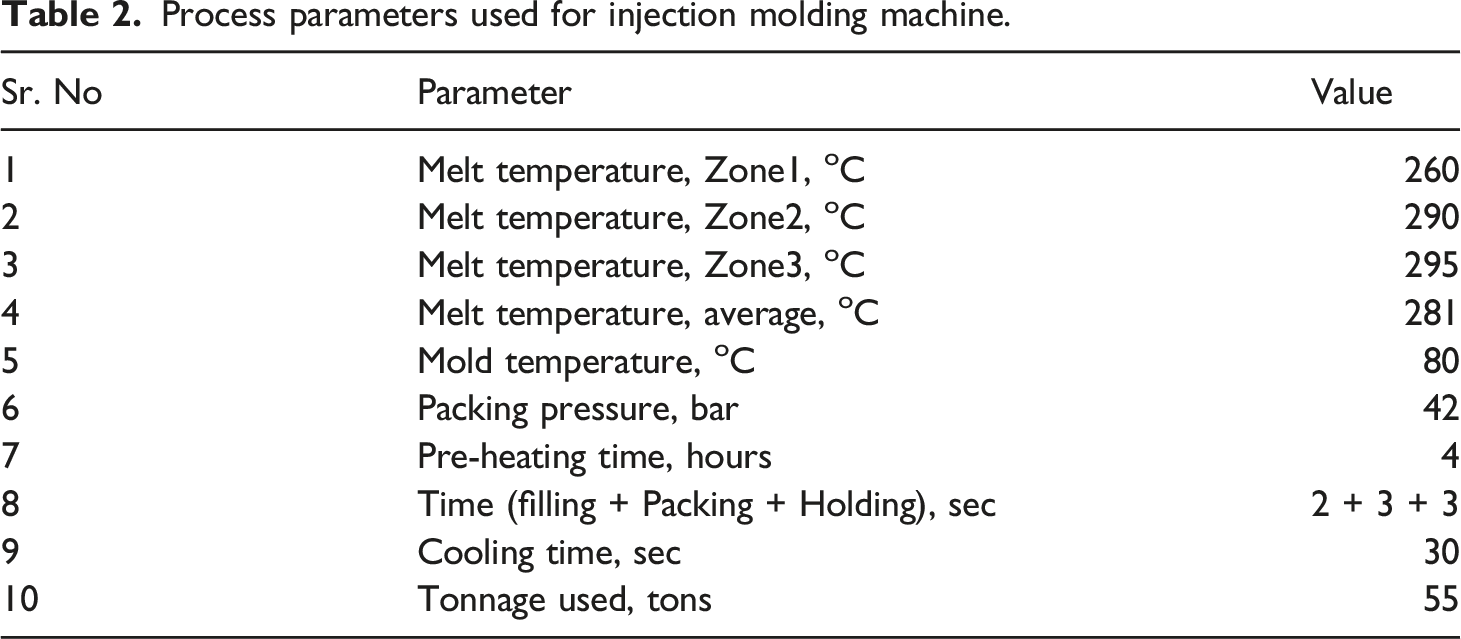
Process parameters used for injection molding machine.
Before actual molding, the material is dried in a hot air oven for 4 hours at 100oC as recommended by the material data sheet to evaporate the moisture in contact or absorbed, if any. This is done to get quality plaques with a good surface finish. Figure 7 shows the injection molding machine used for manufacturing the plaques and actual plaque. The actual plaque shows a straight weld-line and filling pattern at the center which exactly matches Moldflow simulation results. Injection molding machine and actual image of molded plaque.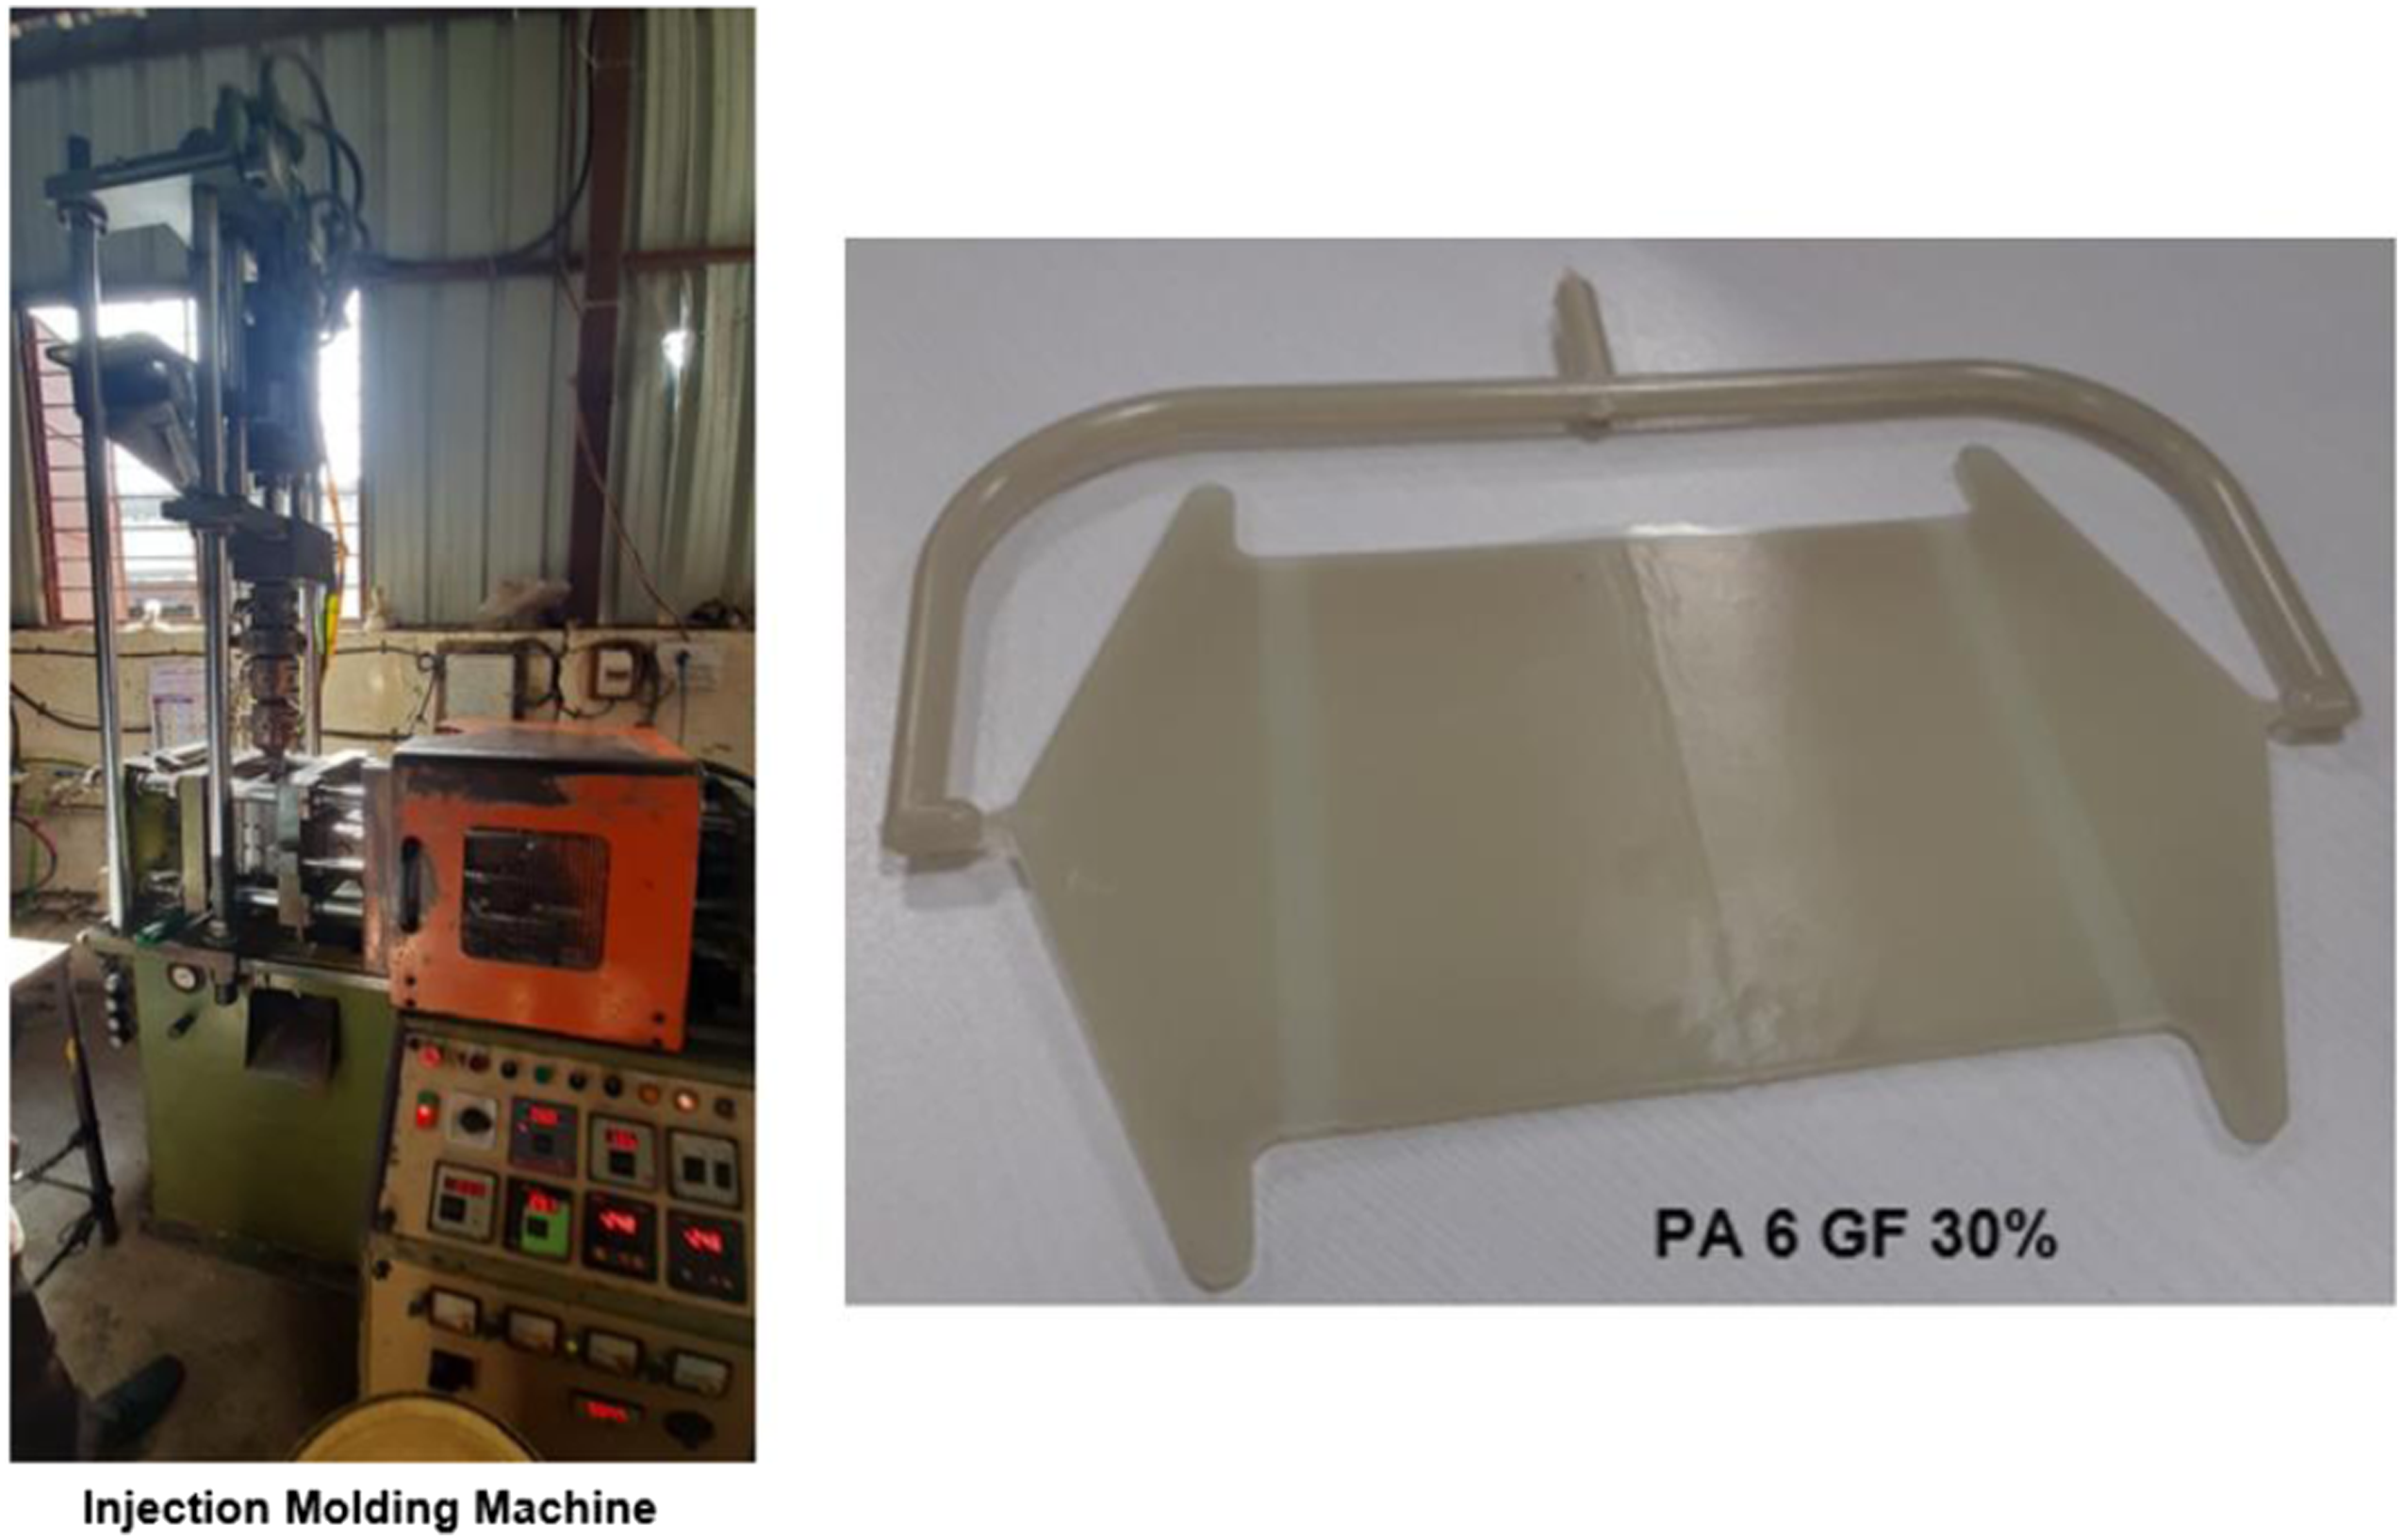
Tensile bar preparation by machining on VMC
The tensile test specimens are prepared by machining on molded plaques. The dimensions of the tensile bar as per ISO 527.2, type 1BA are as shown in Figure 8. ISO 527.2 Type 1BA specimen (Dimensional details in mm).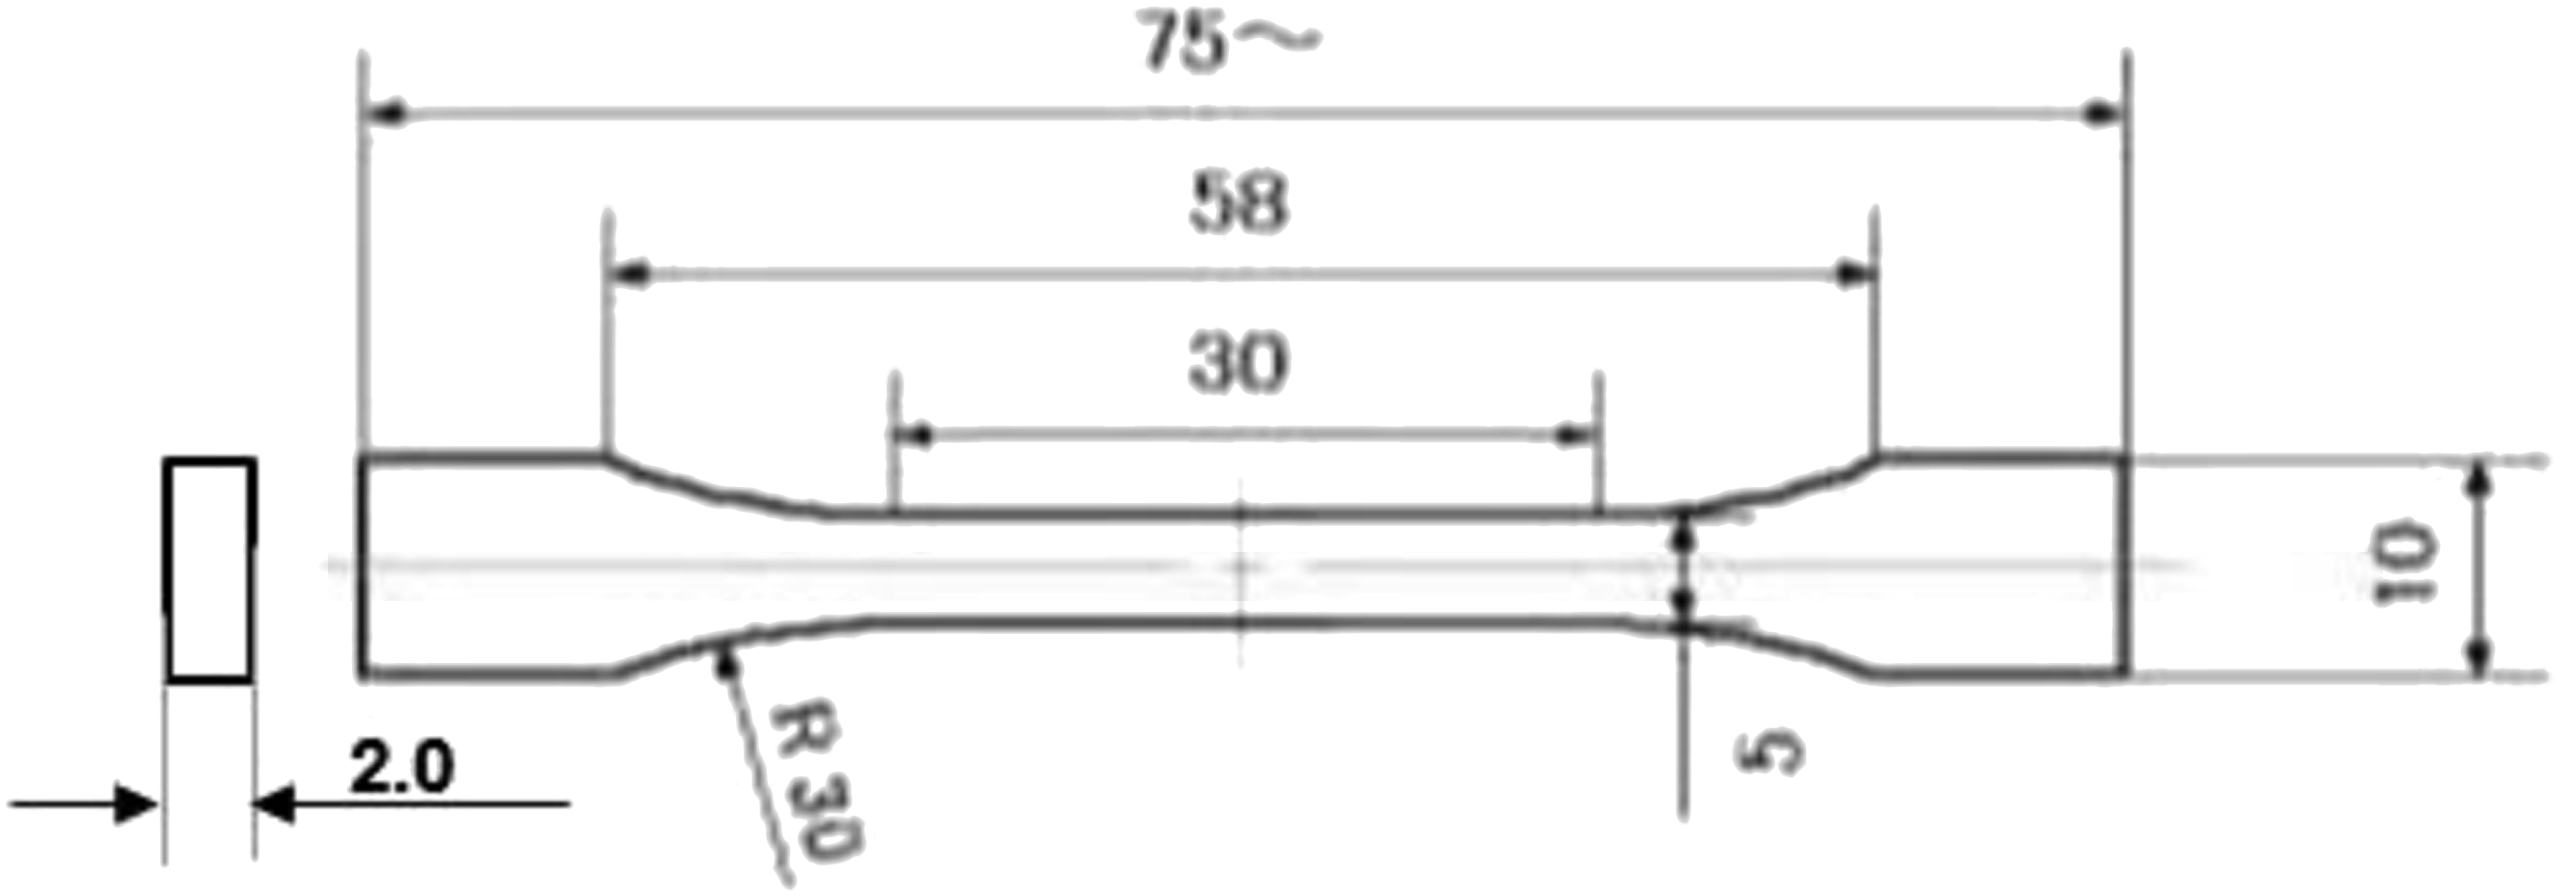
To investigate the effect of weld-line at an angle to the direction of loading on the tensile properties the specimens are cut at different angular orientations. Figure 9 shows various cutting positions of the specimen on the molded plaque. Various angular cutting positions of tensile bar on a plaque.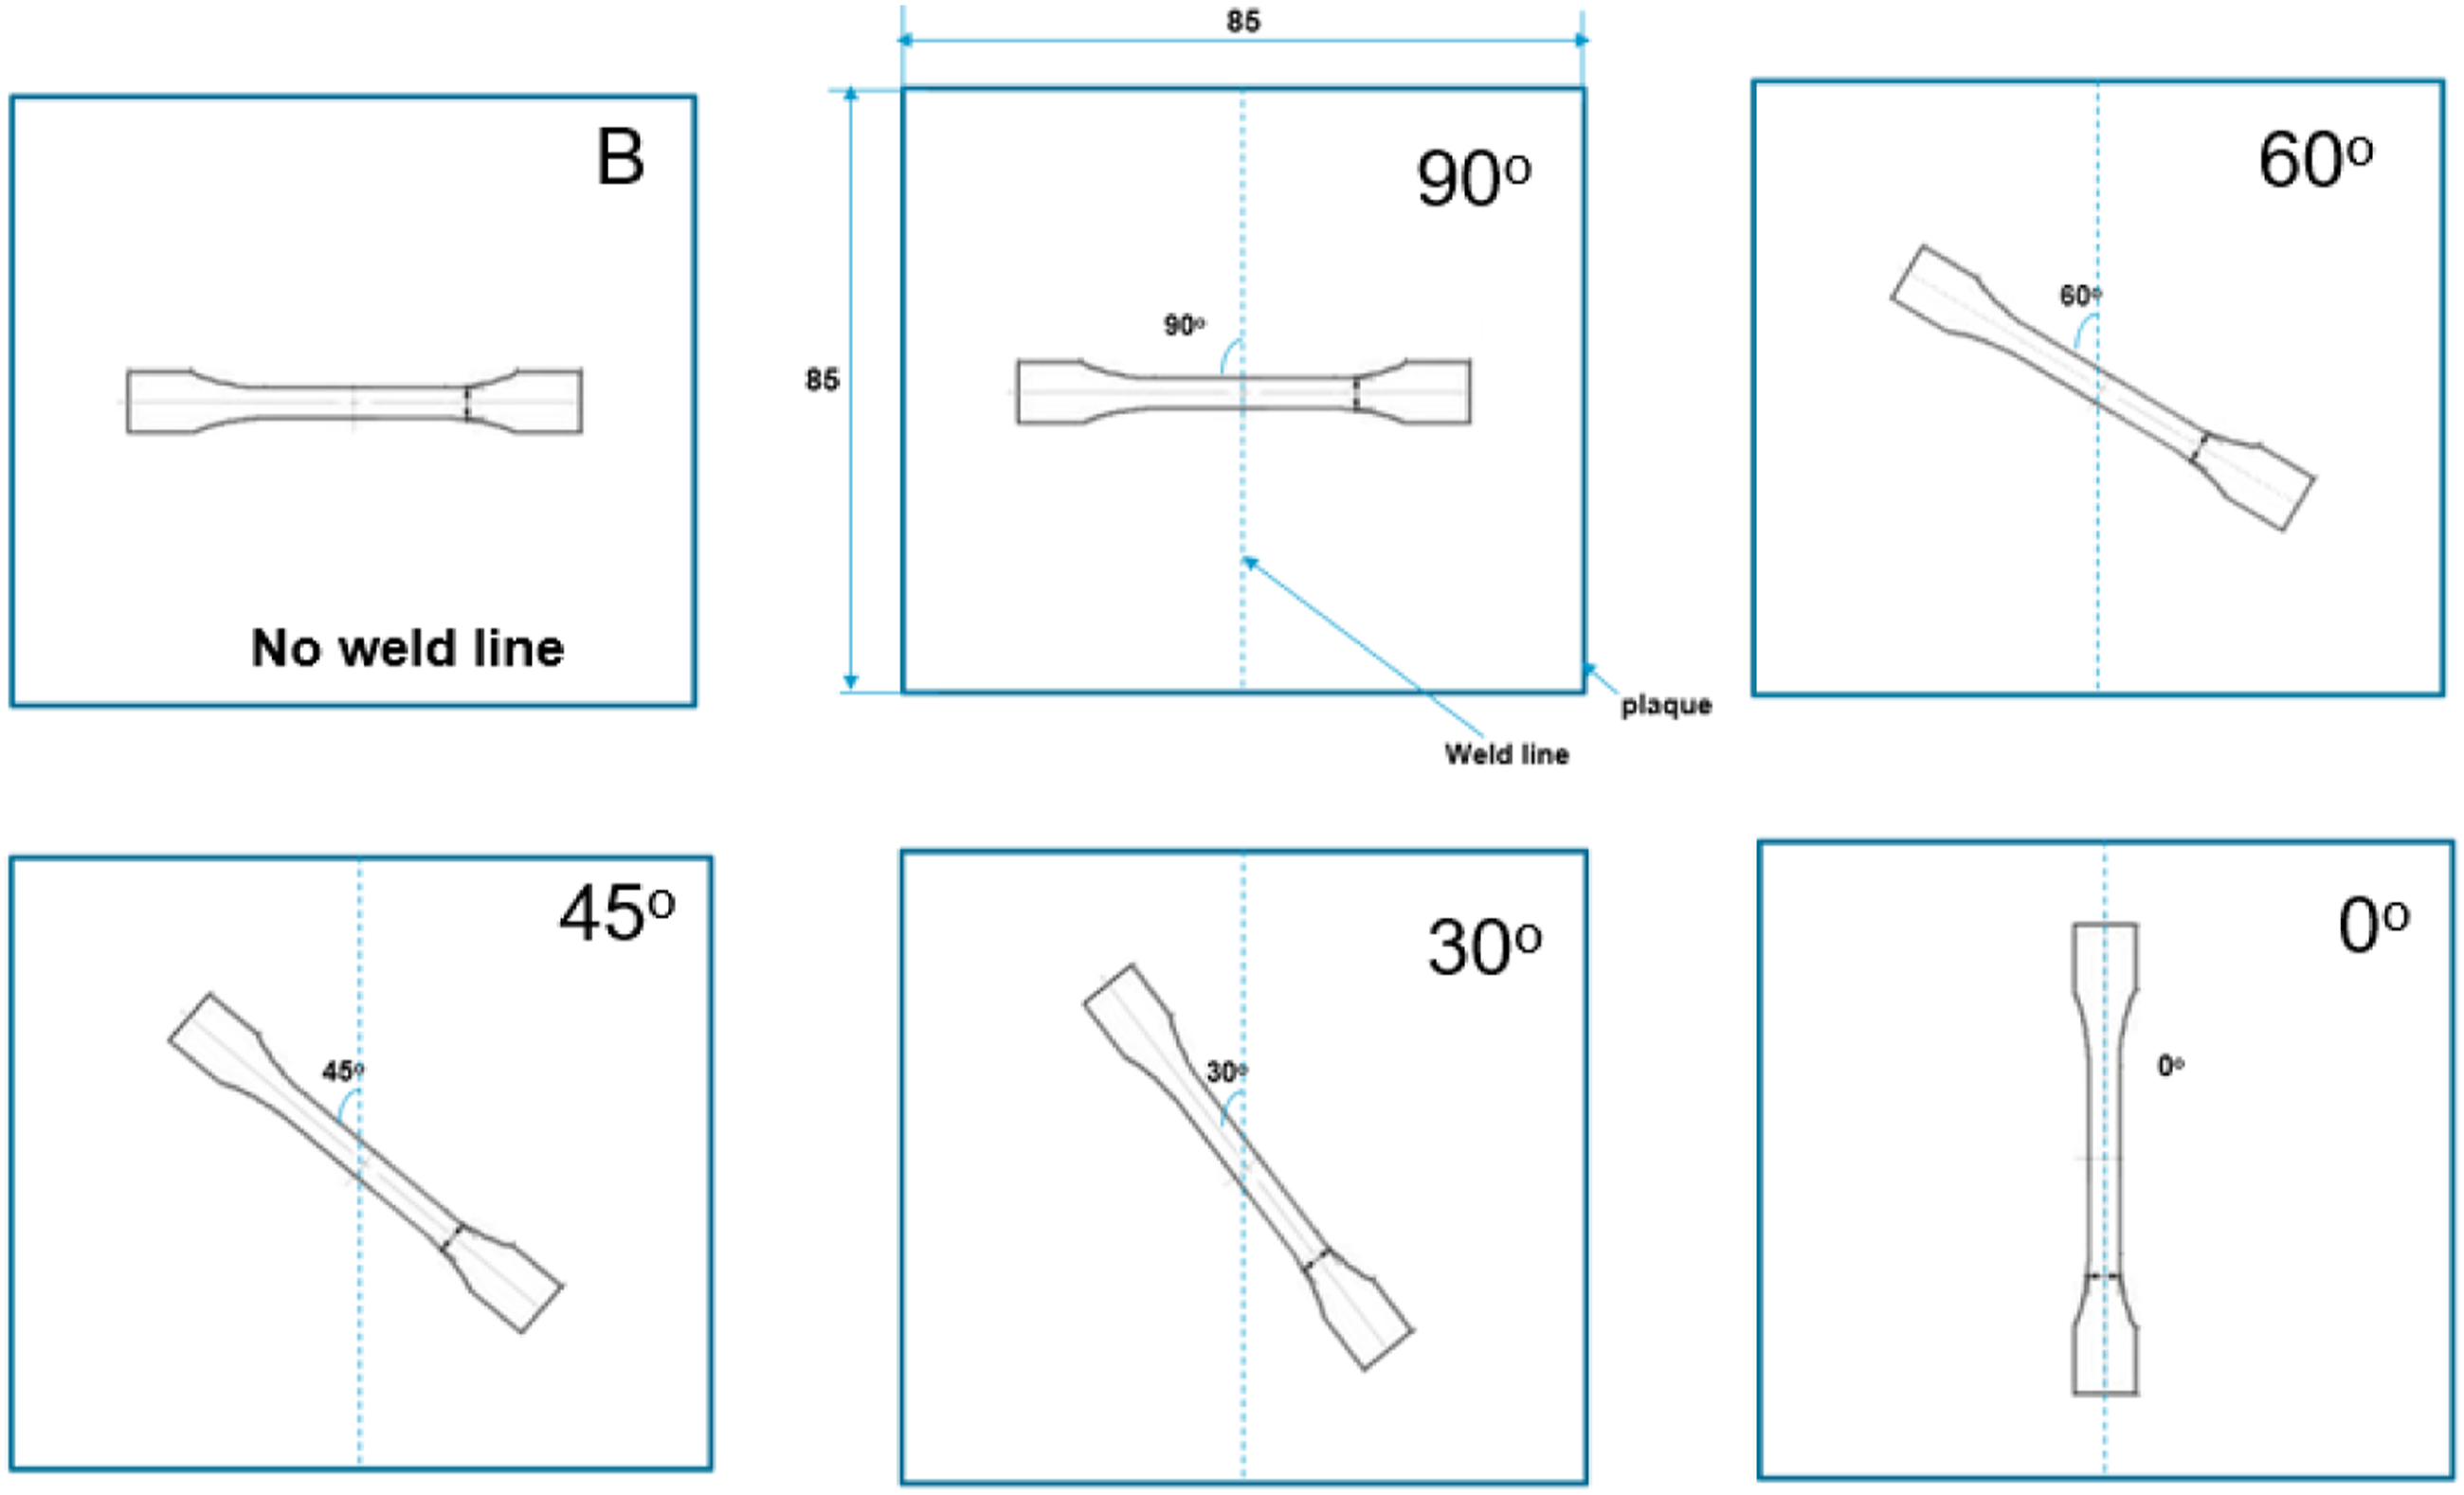
The specimens are cut on a vertical milling machine with a 3.0 mm diameter milling cutter at 15,000 r/min which is controlled by the CNC program. To begin, the initial cut is made of 0.2 mm larger in size with 1.0 mm vertical depth. After the initial cut, a finishing cut of 0.2 mm as per actual size with full depth is performed. The horizontal speed of the milling cutter is maintained at 5 mm/s. Figure 10 shows the vertical milling machine used in preparing specimens. Specimens preparation on computer controlled vertical milling machine.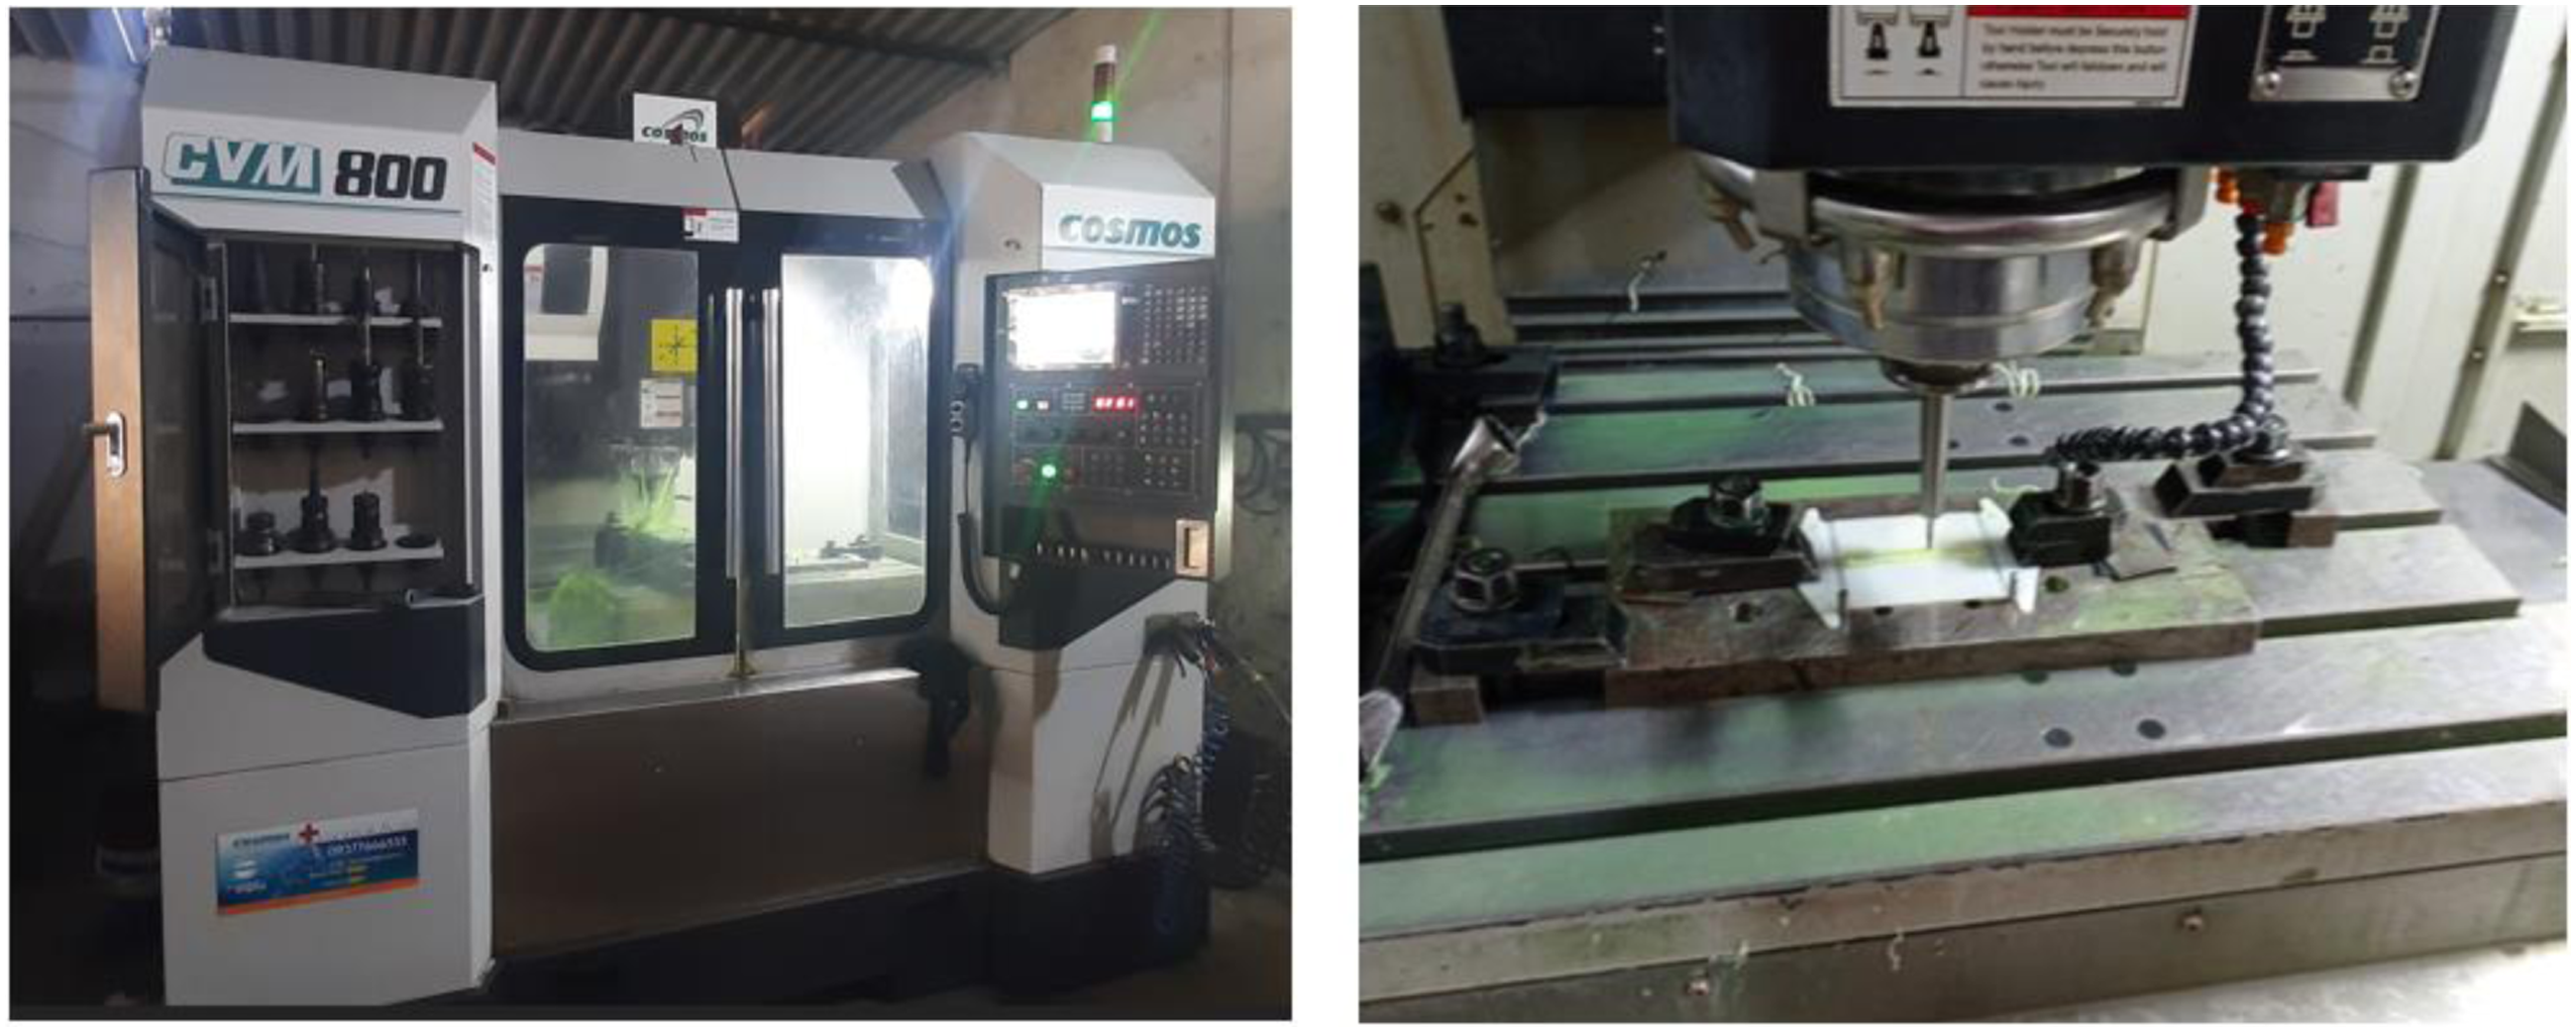
Figure 11 shows tensile bar specimens which are cut at different angular positions. The nomenclature is done based on angular position i.e. B, 90o,60o,45o,30o, and 0o. The specimen “B” is cut on a plaque with a single gate i.e. without weld-line. It is titled as a benchmark specimen. ISO 527–2 type 1BA specimens cut for different angular positions.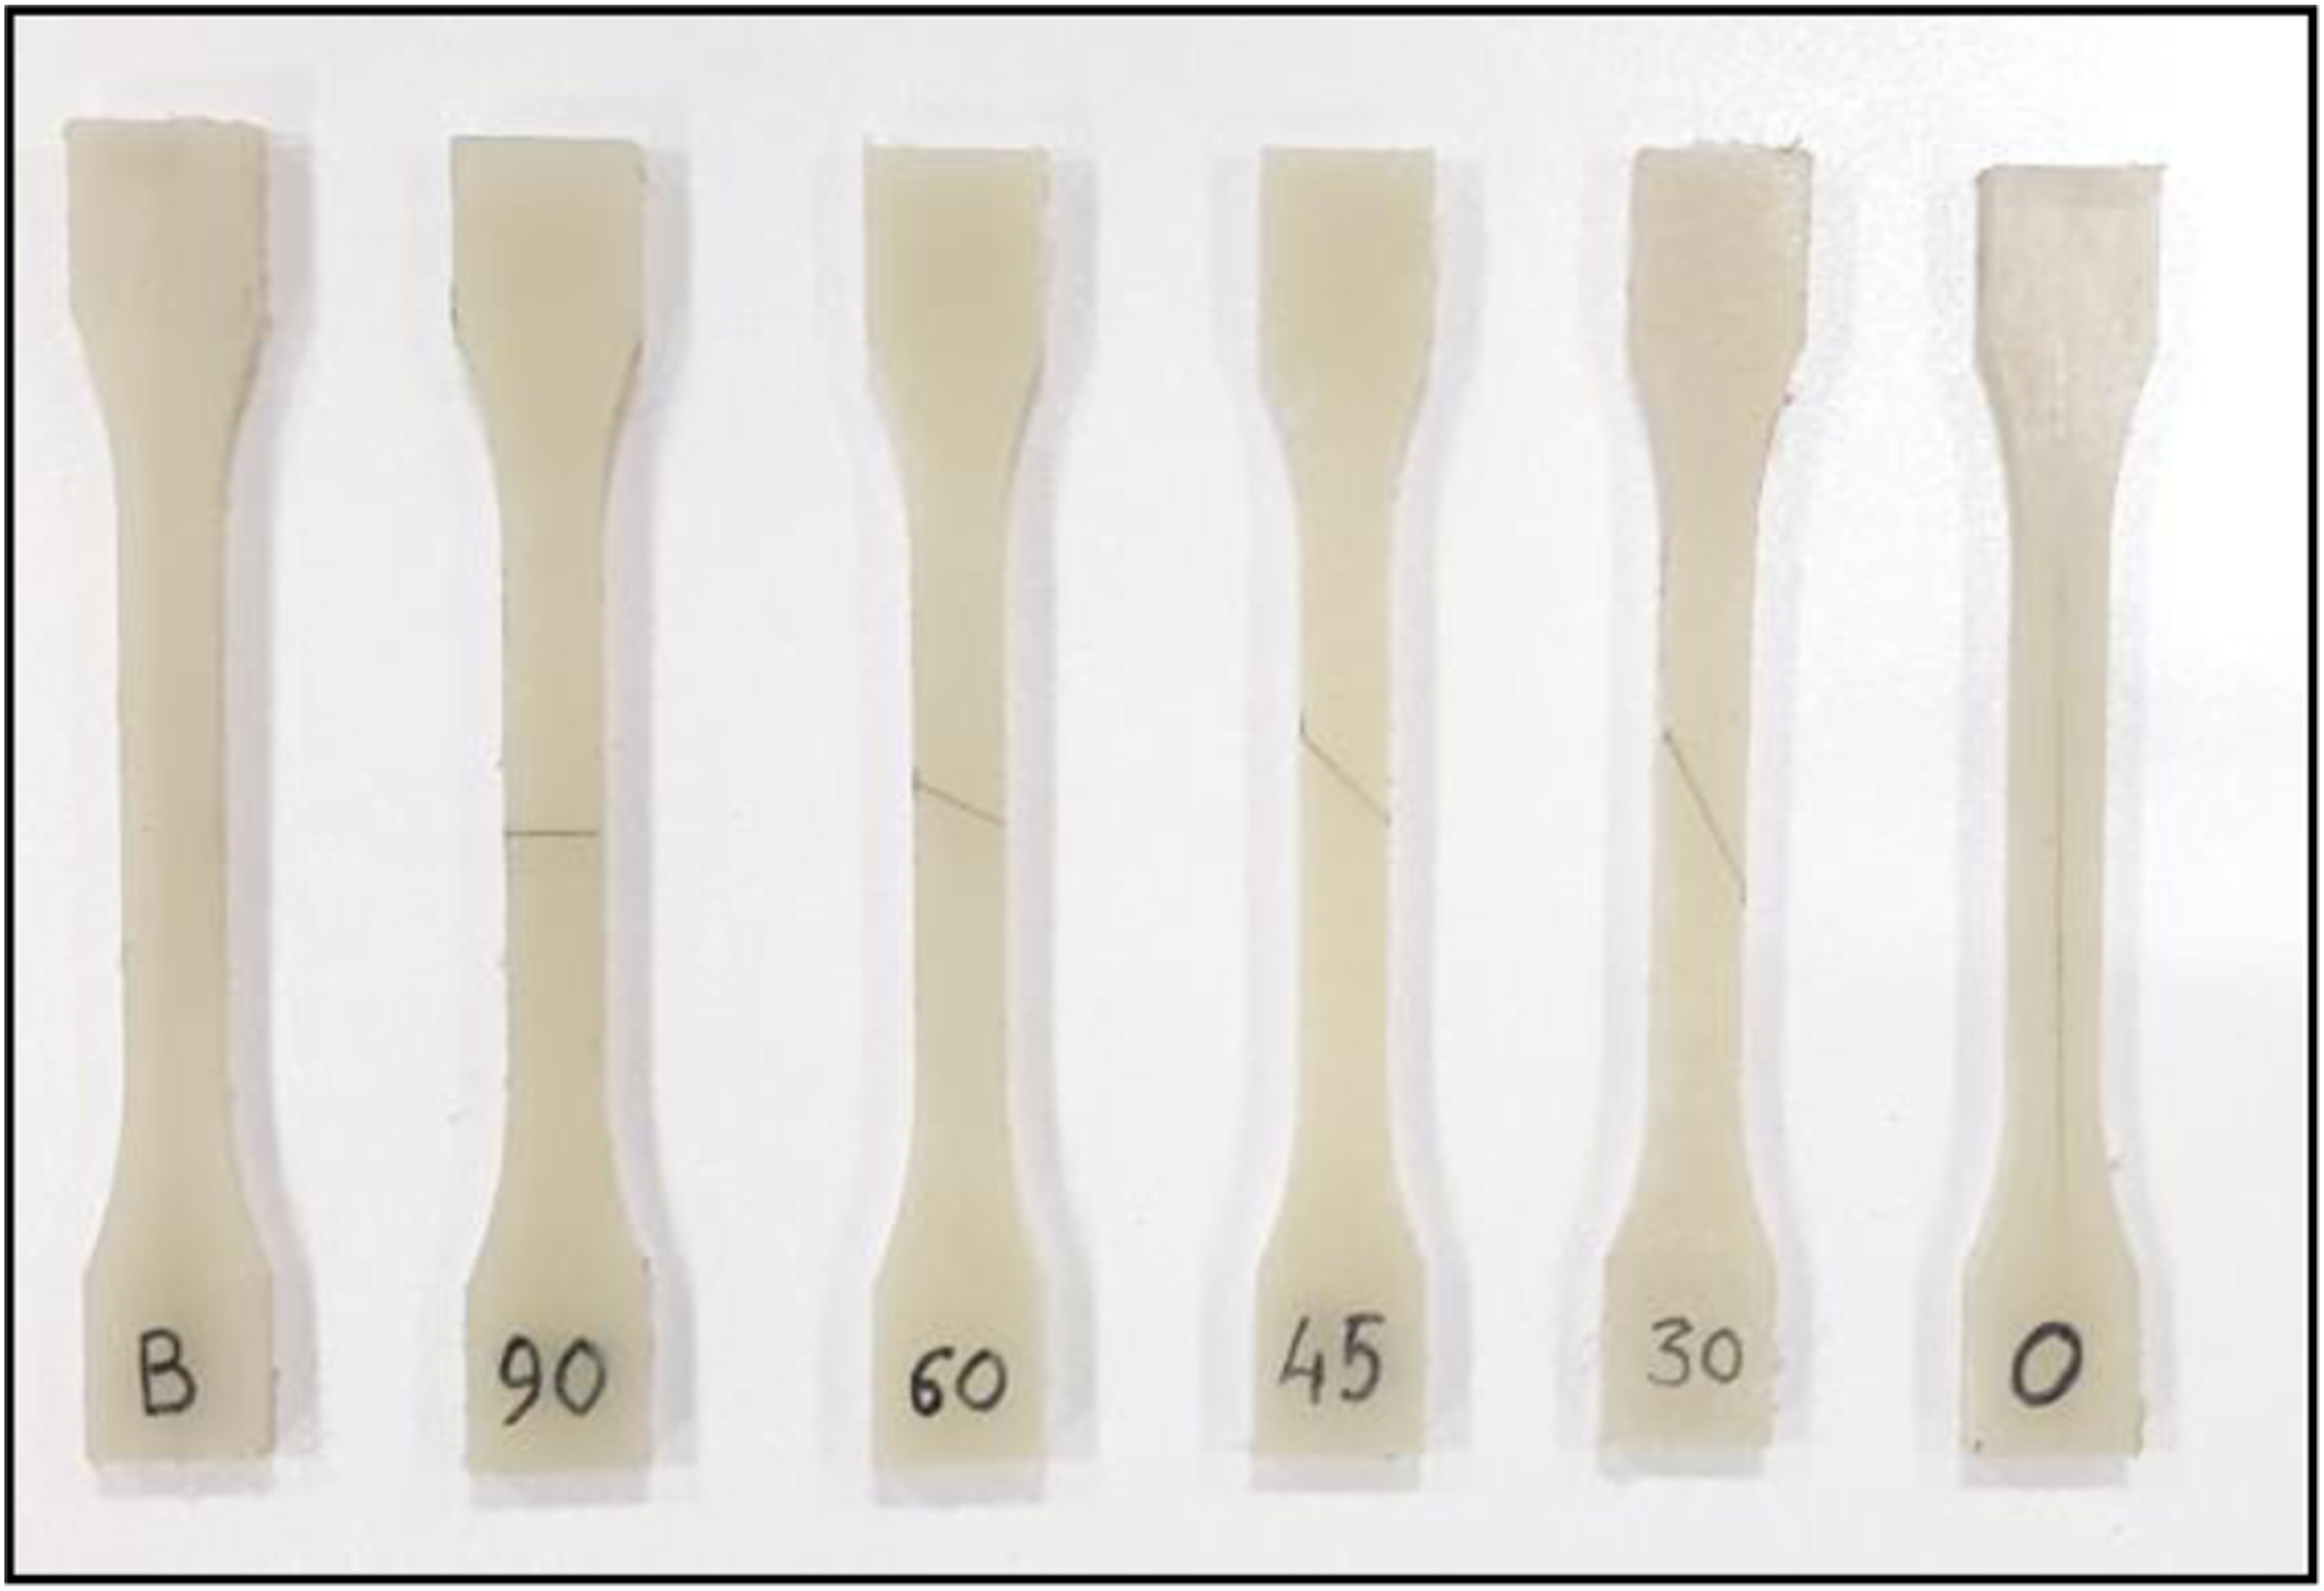
The polyamide material tends to absorb the moisture even after processing of the part when moisture is absorbed by the part then its stiffness gets reduced however ductility increases. During the preparation of the specimen, the material absorbs moisture from humid air and cooling fluid during the cutting process, which may affect test performance. Therefore, to nullify the effect of moisture, all specimens are conditioned at 23oC and relative humidity of 50% as per ISO527–1:2009 for 16 hours in the conditioning chamber. Once conditioning is done, experimental testing is performed immediately.
Experimental testing
The tensile tests are conducted in BASF Advance laboratories on a UTM machine from ZwickRoell as shown in Figure 12. The machine capacity is 30 kN and calibrated for engineering plastic grades. The testing is performed as per ISO 527–2, which is recommended for plastic materials. ISO 527-2 Type 1BA testing arrangement on UTM machine (OEM: ZwickRoell).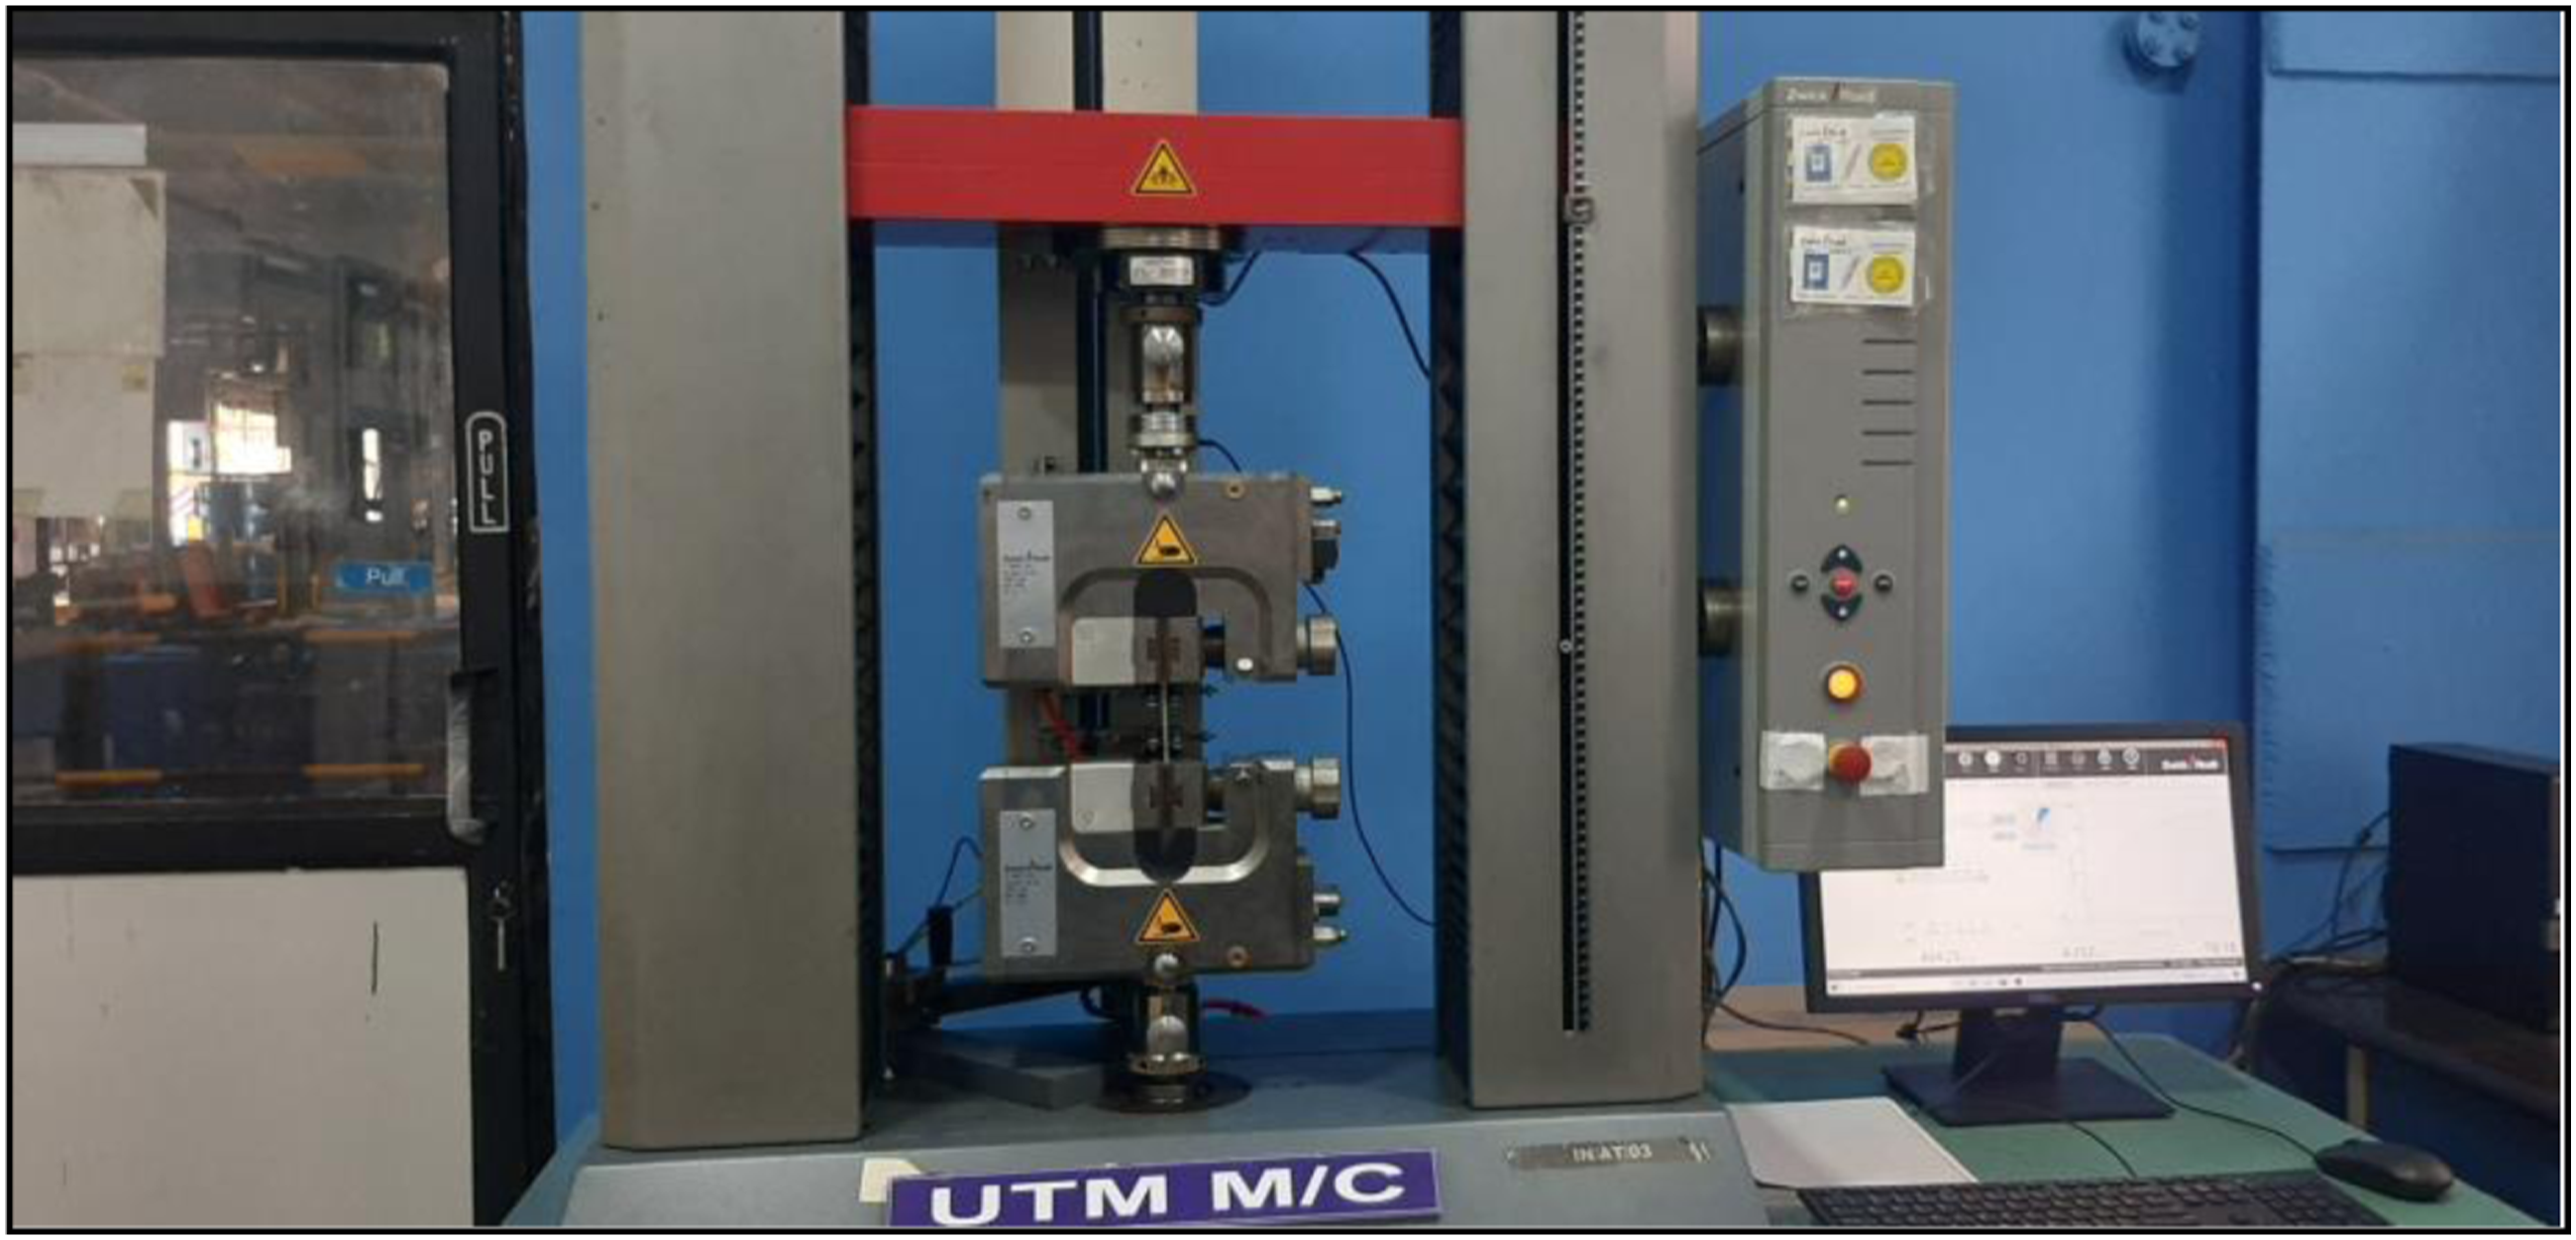
The gauge length of the measuring probe is kept at 30.0 mm as per the requirement of specimen type. Clamping jaws are adjusted such that there is no misalignment between the grips. Clamping force is applied with a pneumatic parallel grip as specified by UTM standard, such that no slippage and no manual error occurs during the test. The speed for modulus and stress-curve determination is set as 6 mm/min. For each case, three specimens are tested and an average of three readings is used for results discussion. The test results like stress at break, strain at break, tensile modulus, and complete stress-strain curve are plotted as outcomes of experimental testing.
Results and discussion
To discuss the effect of weld-line on tensile properties, failure patterns and experimental test results are elaborated in detail. The failure on test specimens is observed along the weld-line which is shown in Figure 13. From the failure pattern, it is observed that the weld-line area is a weak area and brittle separation has occurred along the weld-line. Generally, fiber orientation anisotropy results increase in tensile strength in the direction of fiber orientation parallel to the loading direction and a decrease in perpendicular or any other direction to the loading direction.
14
The brittle failure fracture occurs when dissimilar microstructure and random fiber alignment are present at the weld-line area of the specimen.
10
Failure pattern of test specimens.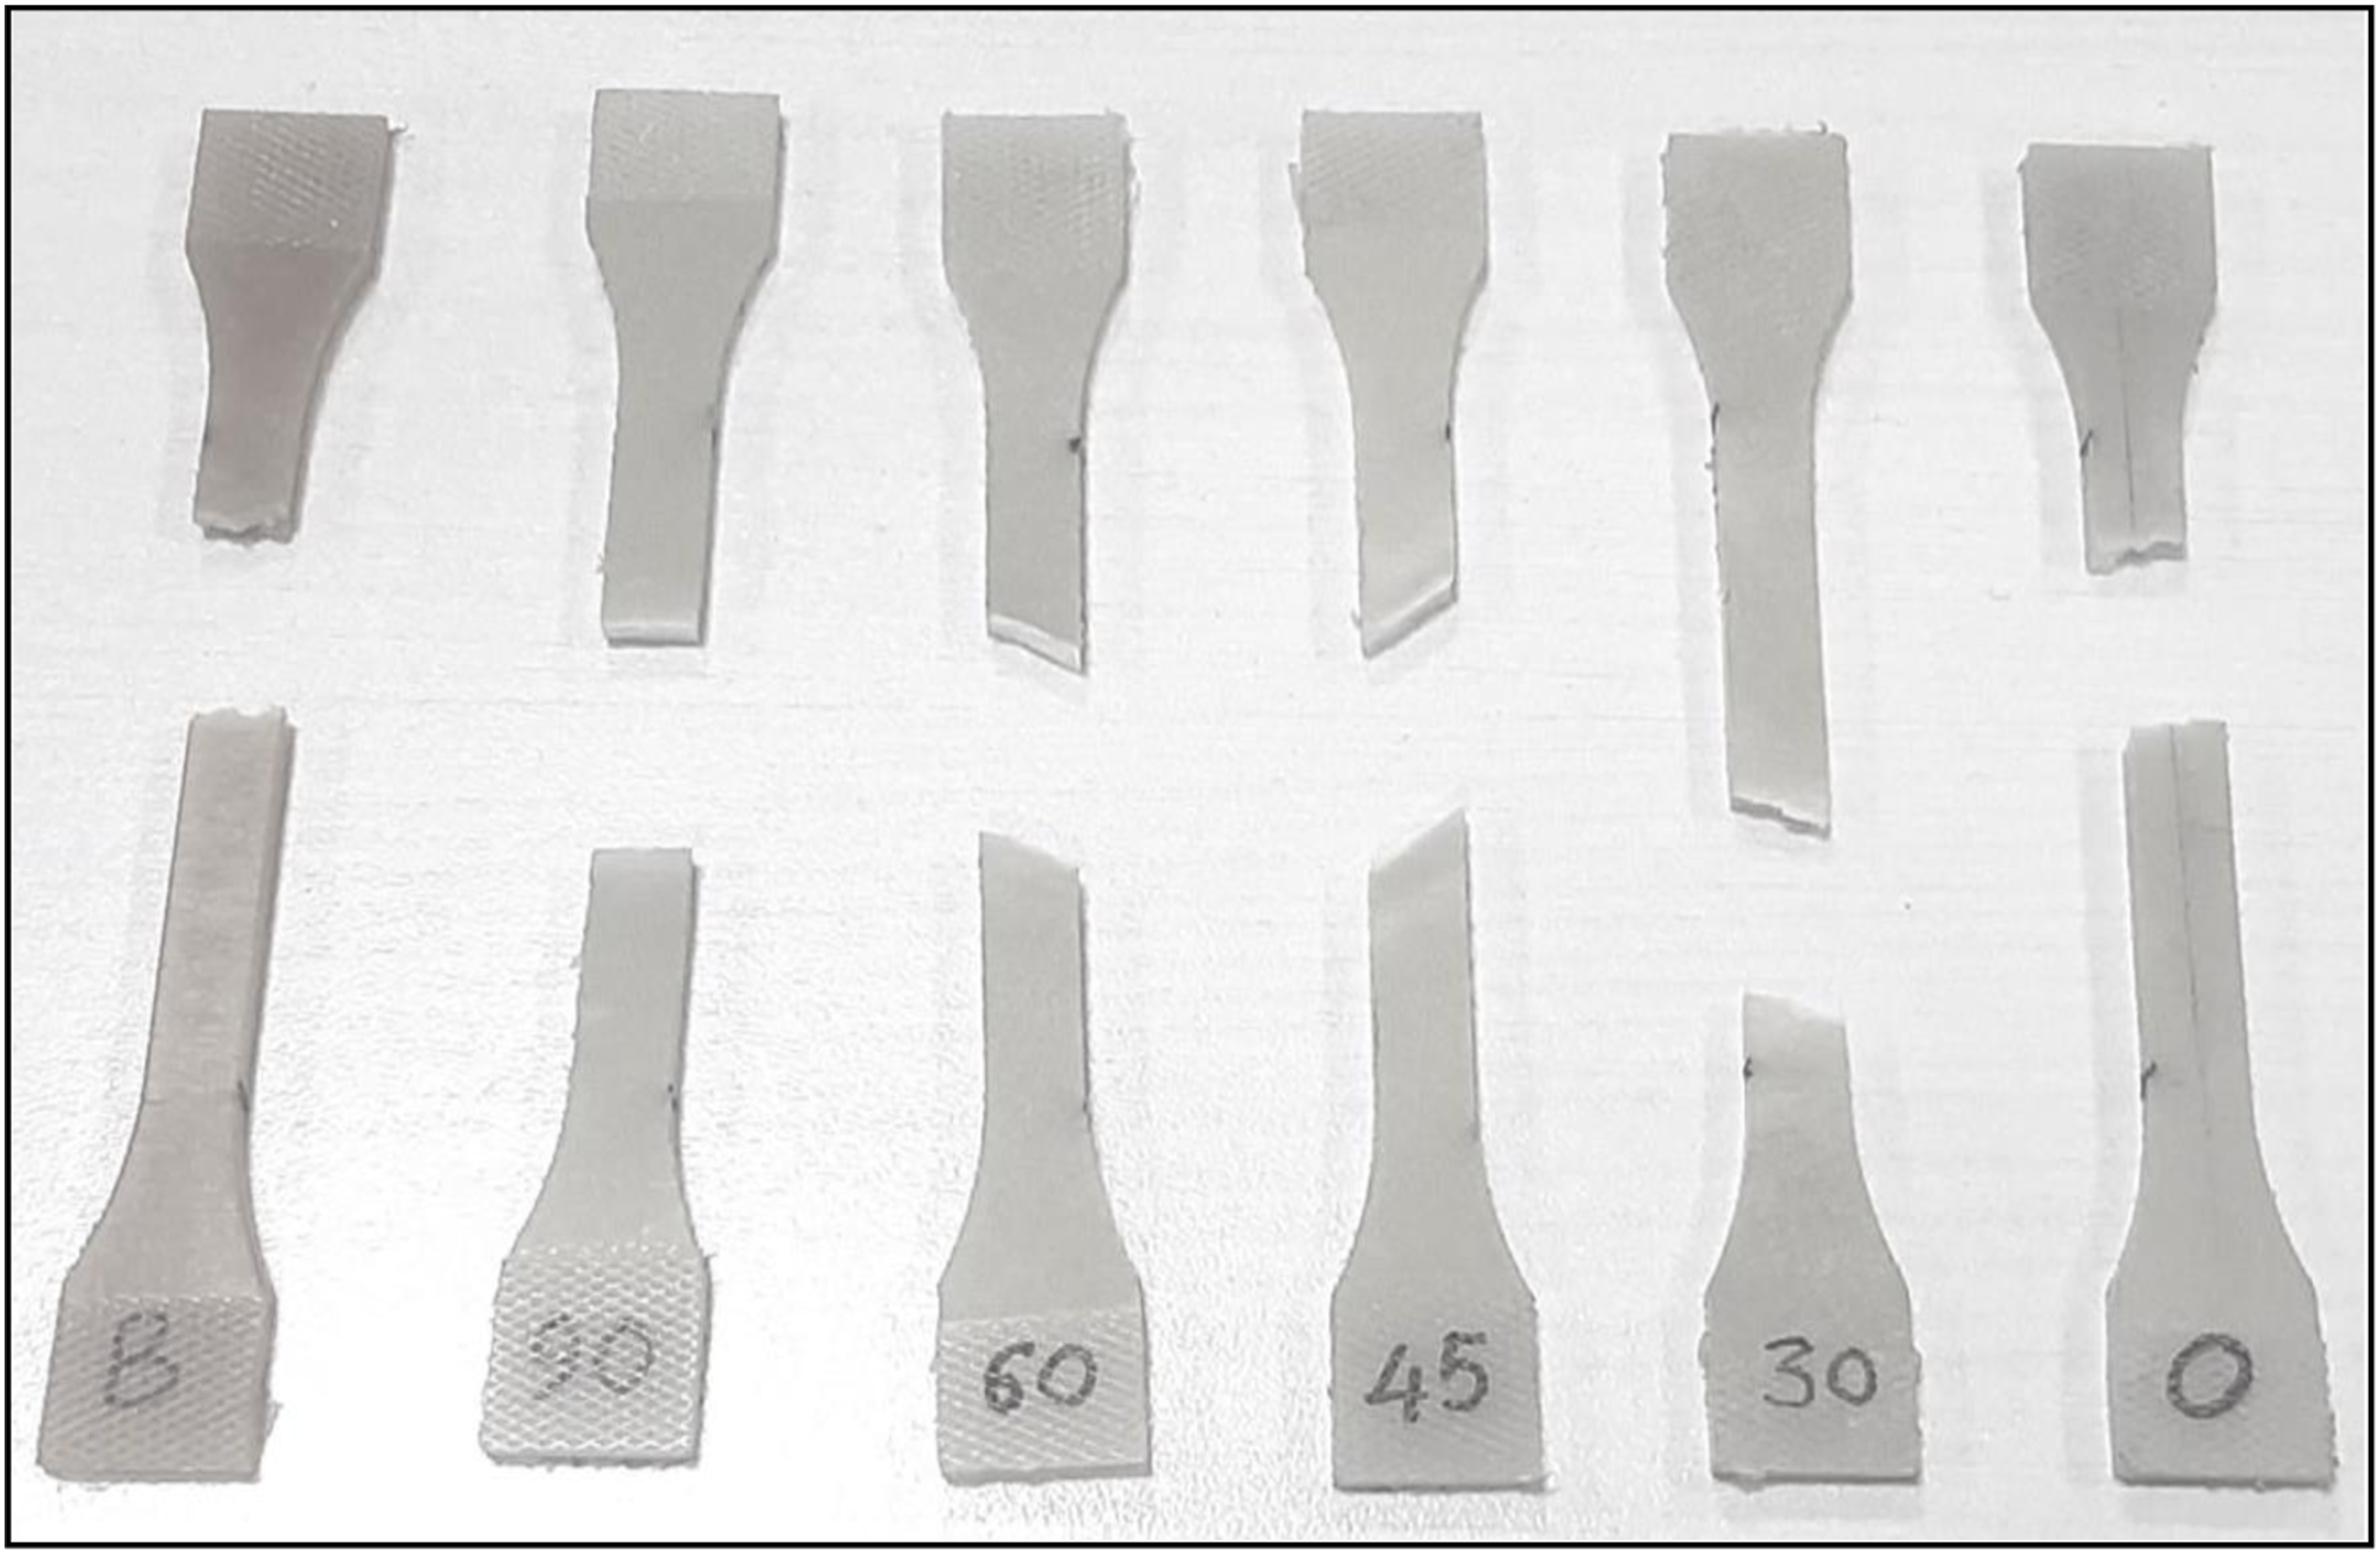
Fiber orientation tensor components for No weld-line and with weld-line plaque.
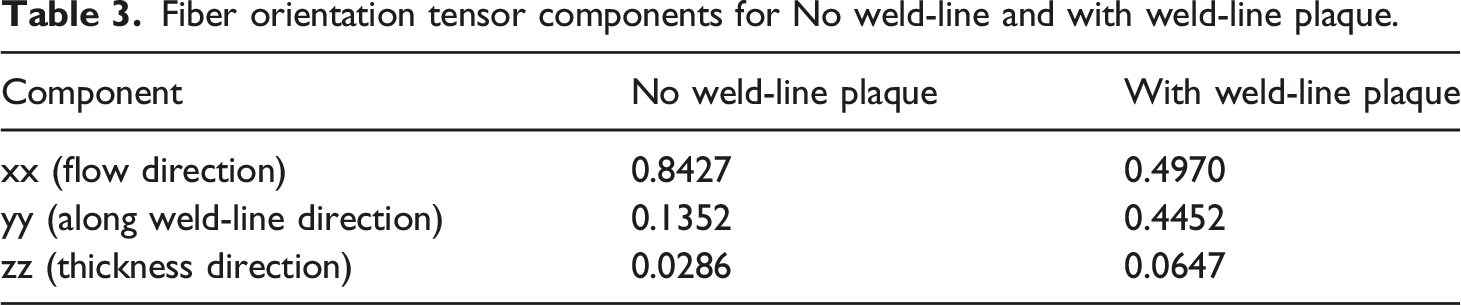
The value xx indicates the fraction of fiber oriented in flow direction and for this study also coincides with loading direction, yy indicates the fraction of fiber oriented in perpendicular direction i.e. along weld-line and zz indicates the fraction of fiber oriented in the thickness direction. From computed tensor principal components, it is observed that No weld-line plaque fibers are significantly aligned in loading direction, however, for weld-line plaque case, a considerable number of fibers are also along perpendicular/weld-line direction. Hence tensile modulus, stress at break, and strain break values are varying as per fiber alignment contribution during loading of the specimen which is evident in the stress-strain curve for different weld-line angle specimens shown in Figure 14 and this is in good agreement with the study done in reference.
6
From stress-strain graphs, it is observed that without weld-line specimen has a maximum slope and 45o weld-line has the lowest slope and other specimen curves drift in-between. Stress-strain curve for different weld-line angle specimens.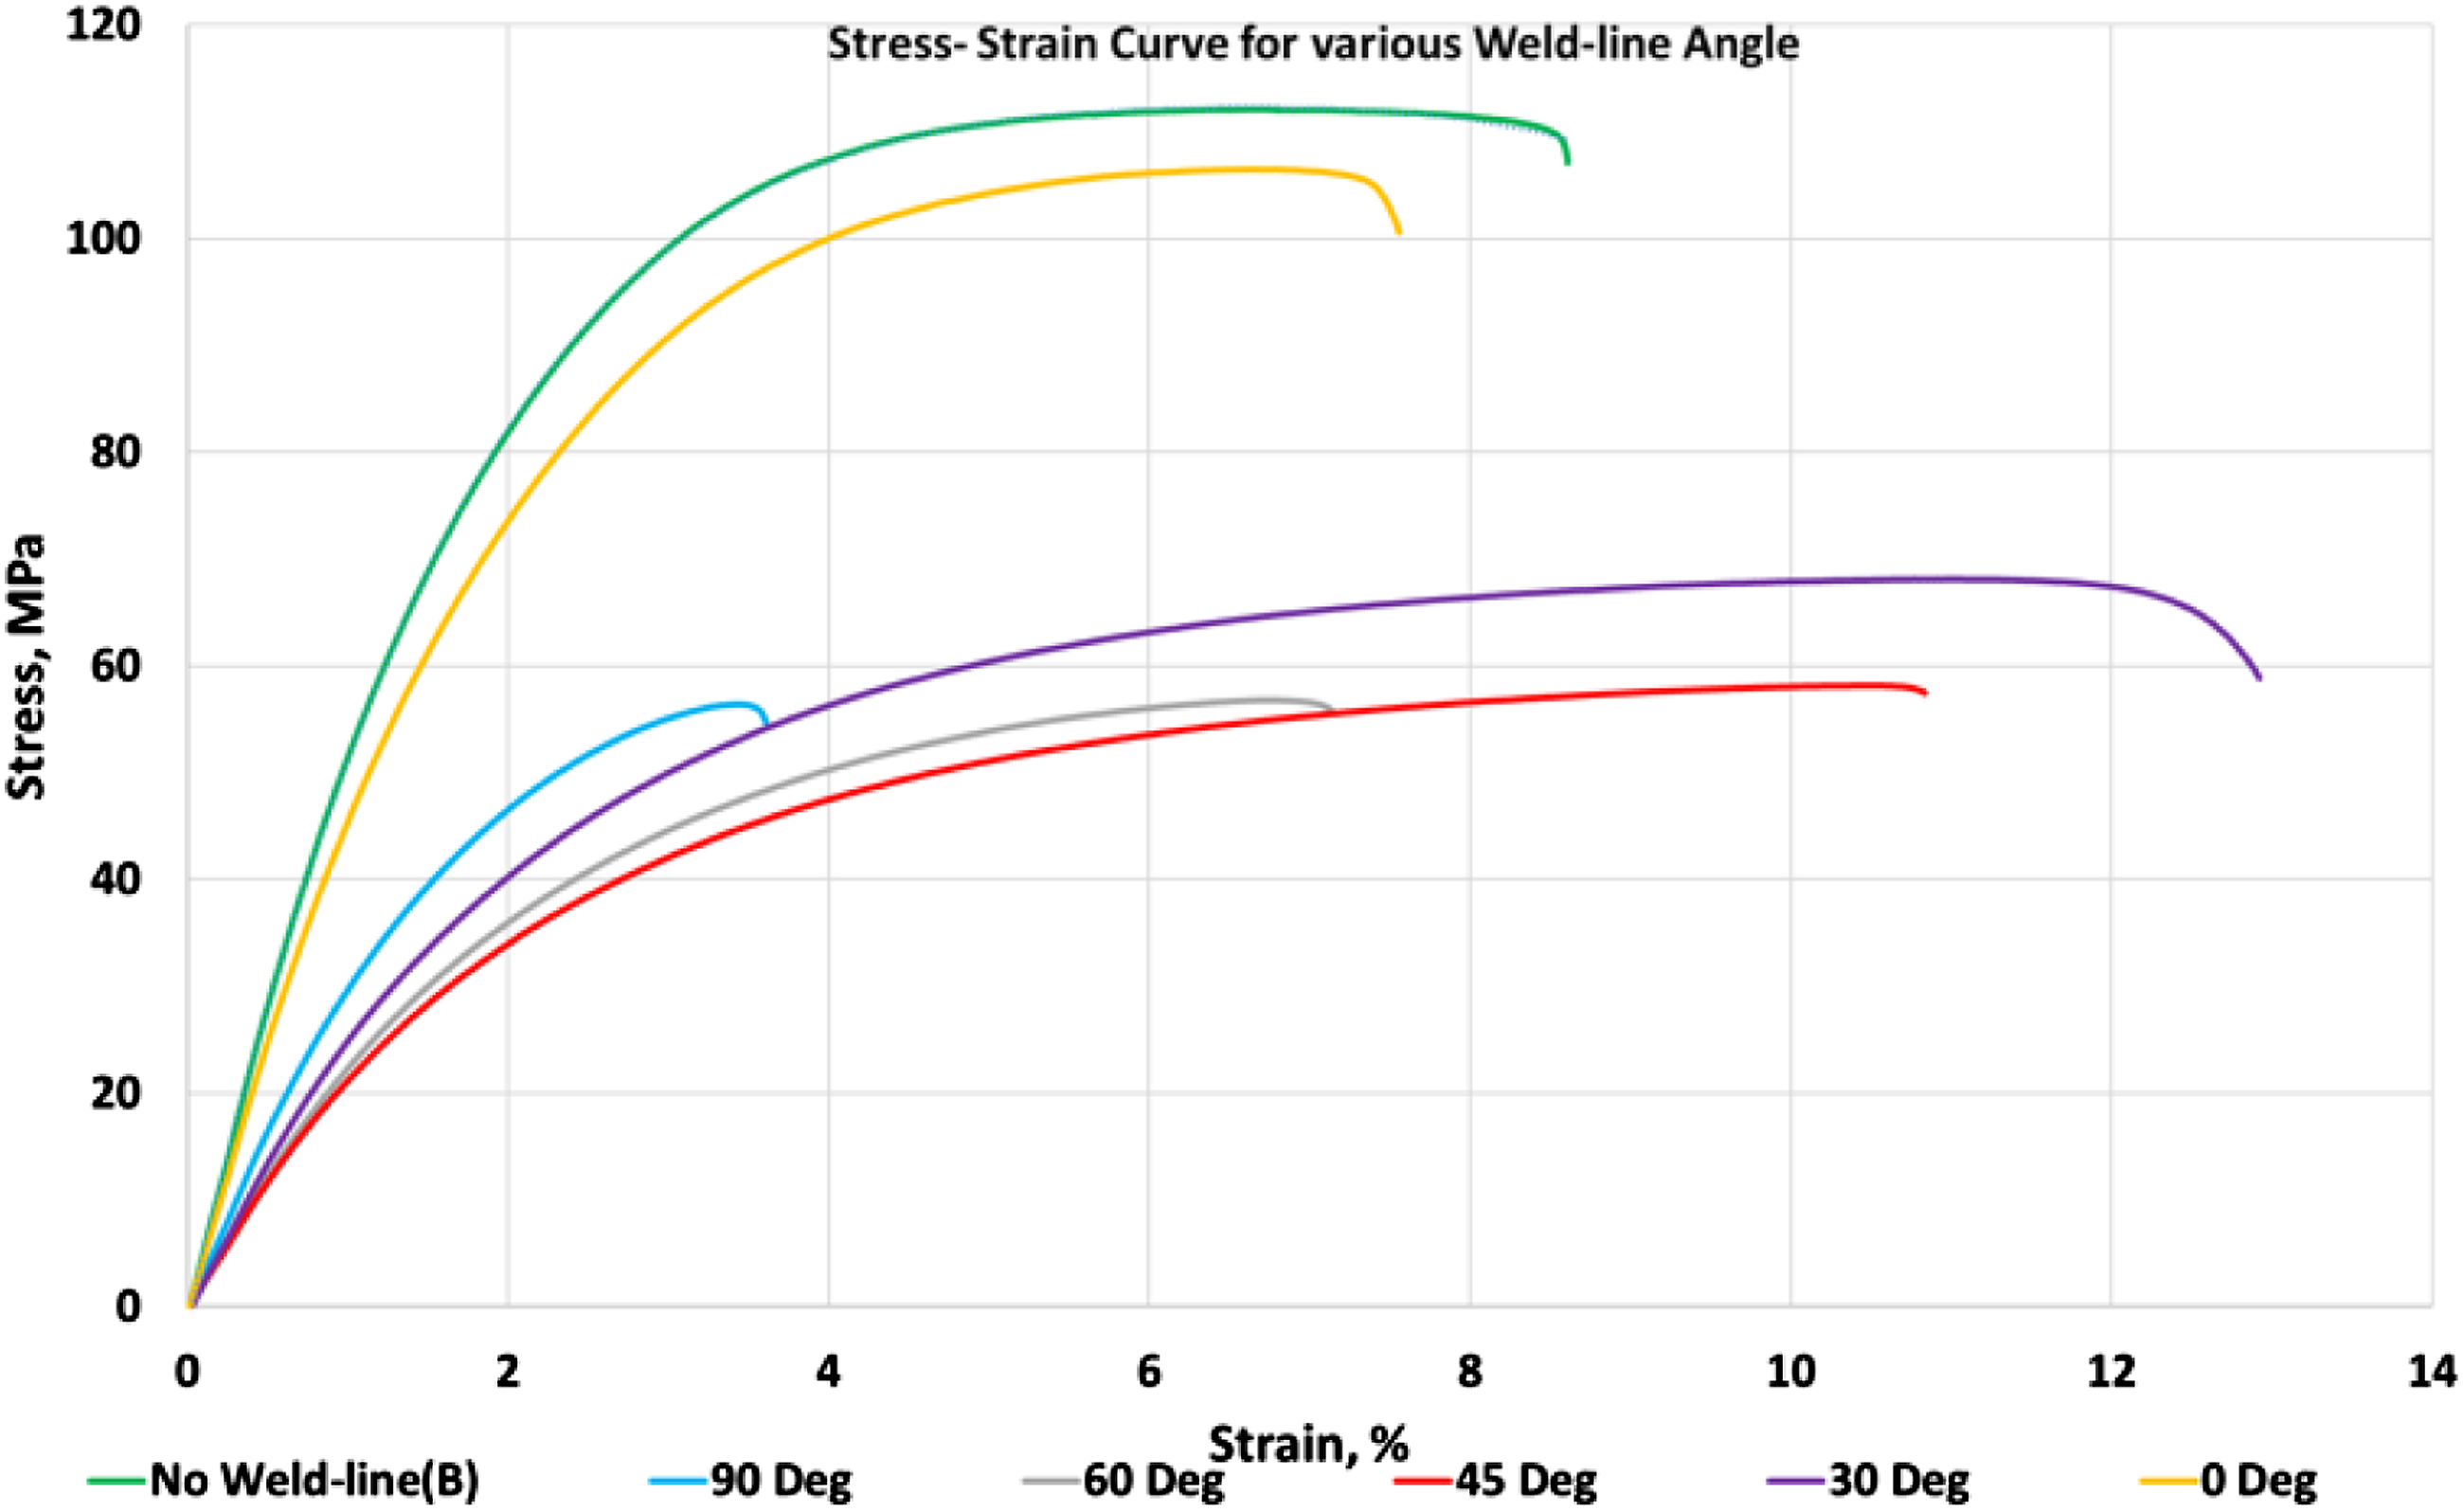
The short glass fibers have axial direction structural strength and during melt filling of cavity, they tend to be in parallel to fountain flow in melt flow-front.
10
Therefore, at the time of the final filling of weld-line plaque, the fibers are changing their direction as that of fountain flow, which is nearly perpendicular to the flow direction. A similar flow pattern is evaluated through Moldflow simulation results as shown in Figure 15. The Moldflow simulation result shows melt-flow changing its direction perpendicular to the initial flow and the same is followed by random fiber orientation at the weld-line area. Fiber orientation and melt velocity at weld-line area.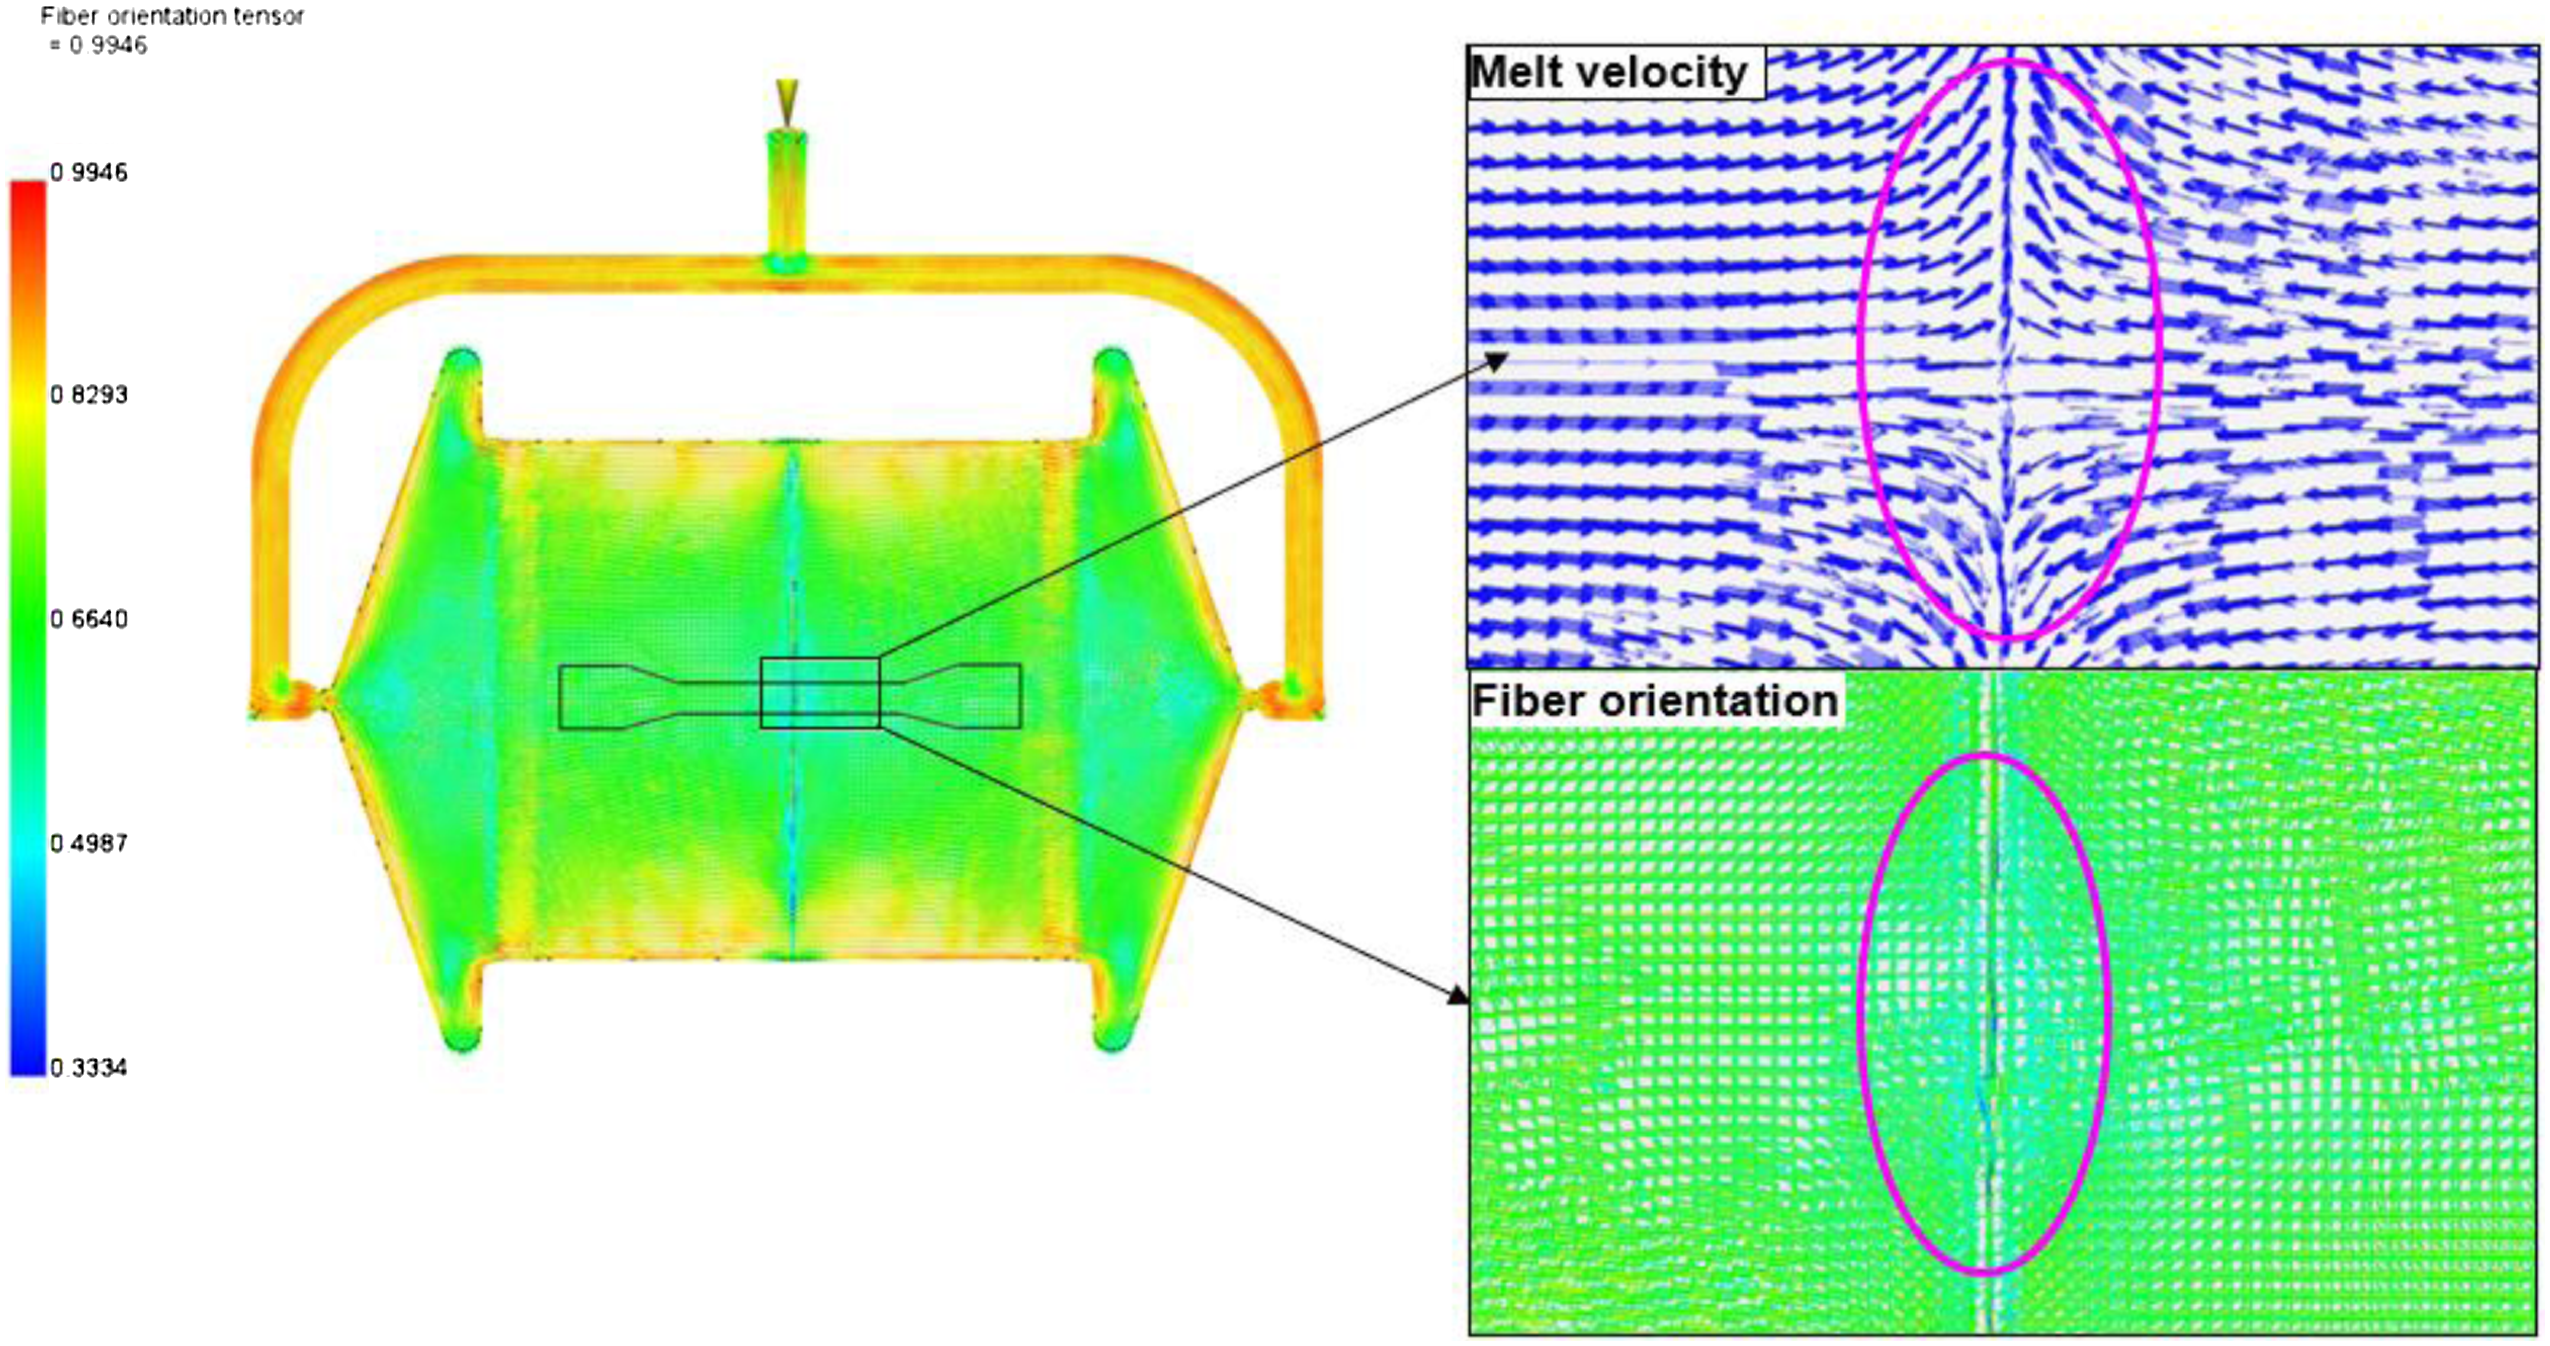
Figure 16 shows results of tensile modulus for specimens with and without weld-line. The result plots are the average of three experimental tests. The standard deviation is calculated, and error bars are included on each specimen’s bar chart. The results demonstrate that weld-line angle has a significant effect on tensile modulus. The without weld-line specimen shows the highest tensile strength as fiber orientation is along the loading direction. At 90o weld-line the normal stress is maximum and shear stress is zero however for 45o weld-line angle normal and shear stress are equally distributed this may be one of the reasons for minimum tensile modulus at 45o weld-line angle.
8
Tensile modulus with respect to weld-line angle.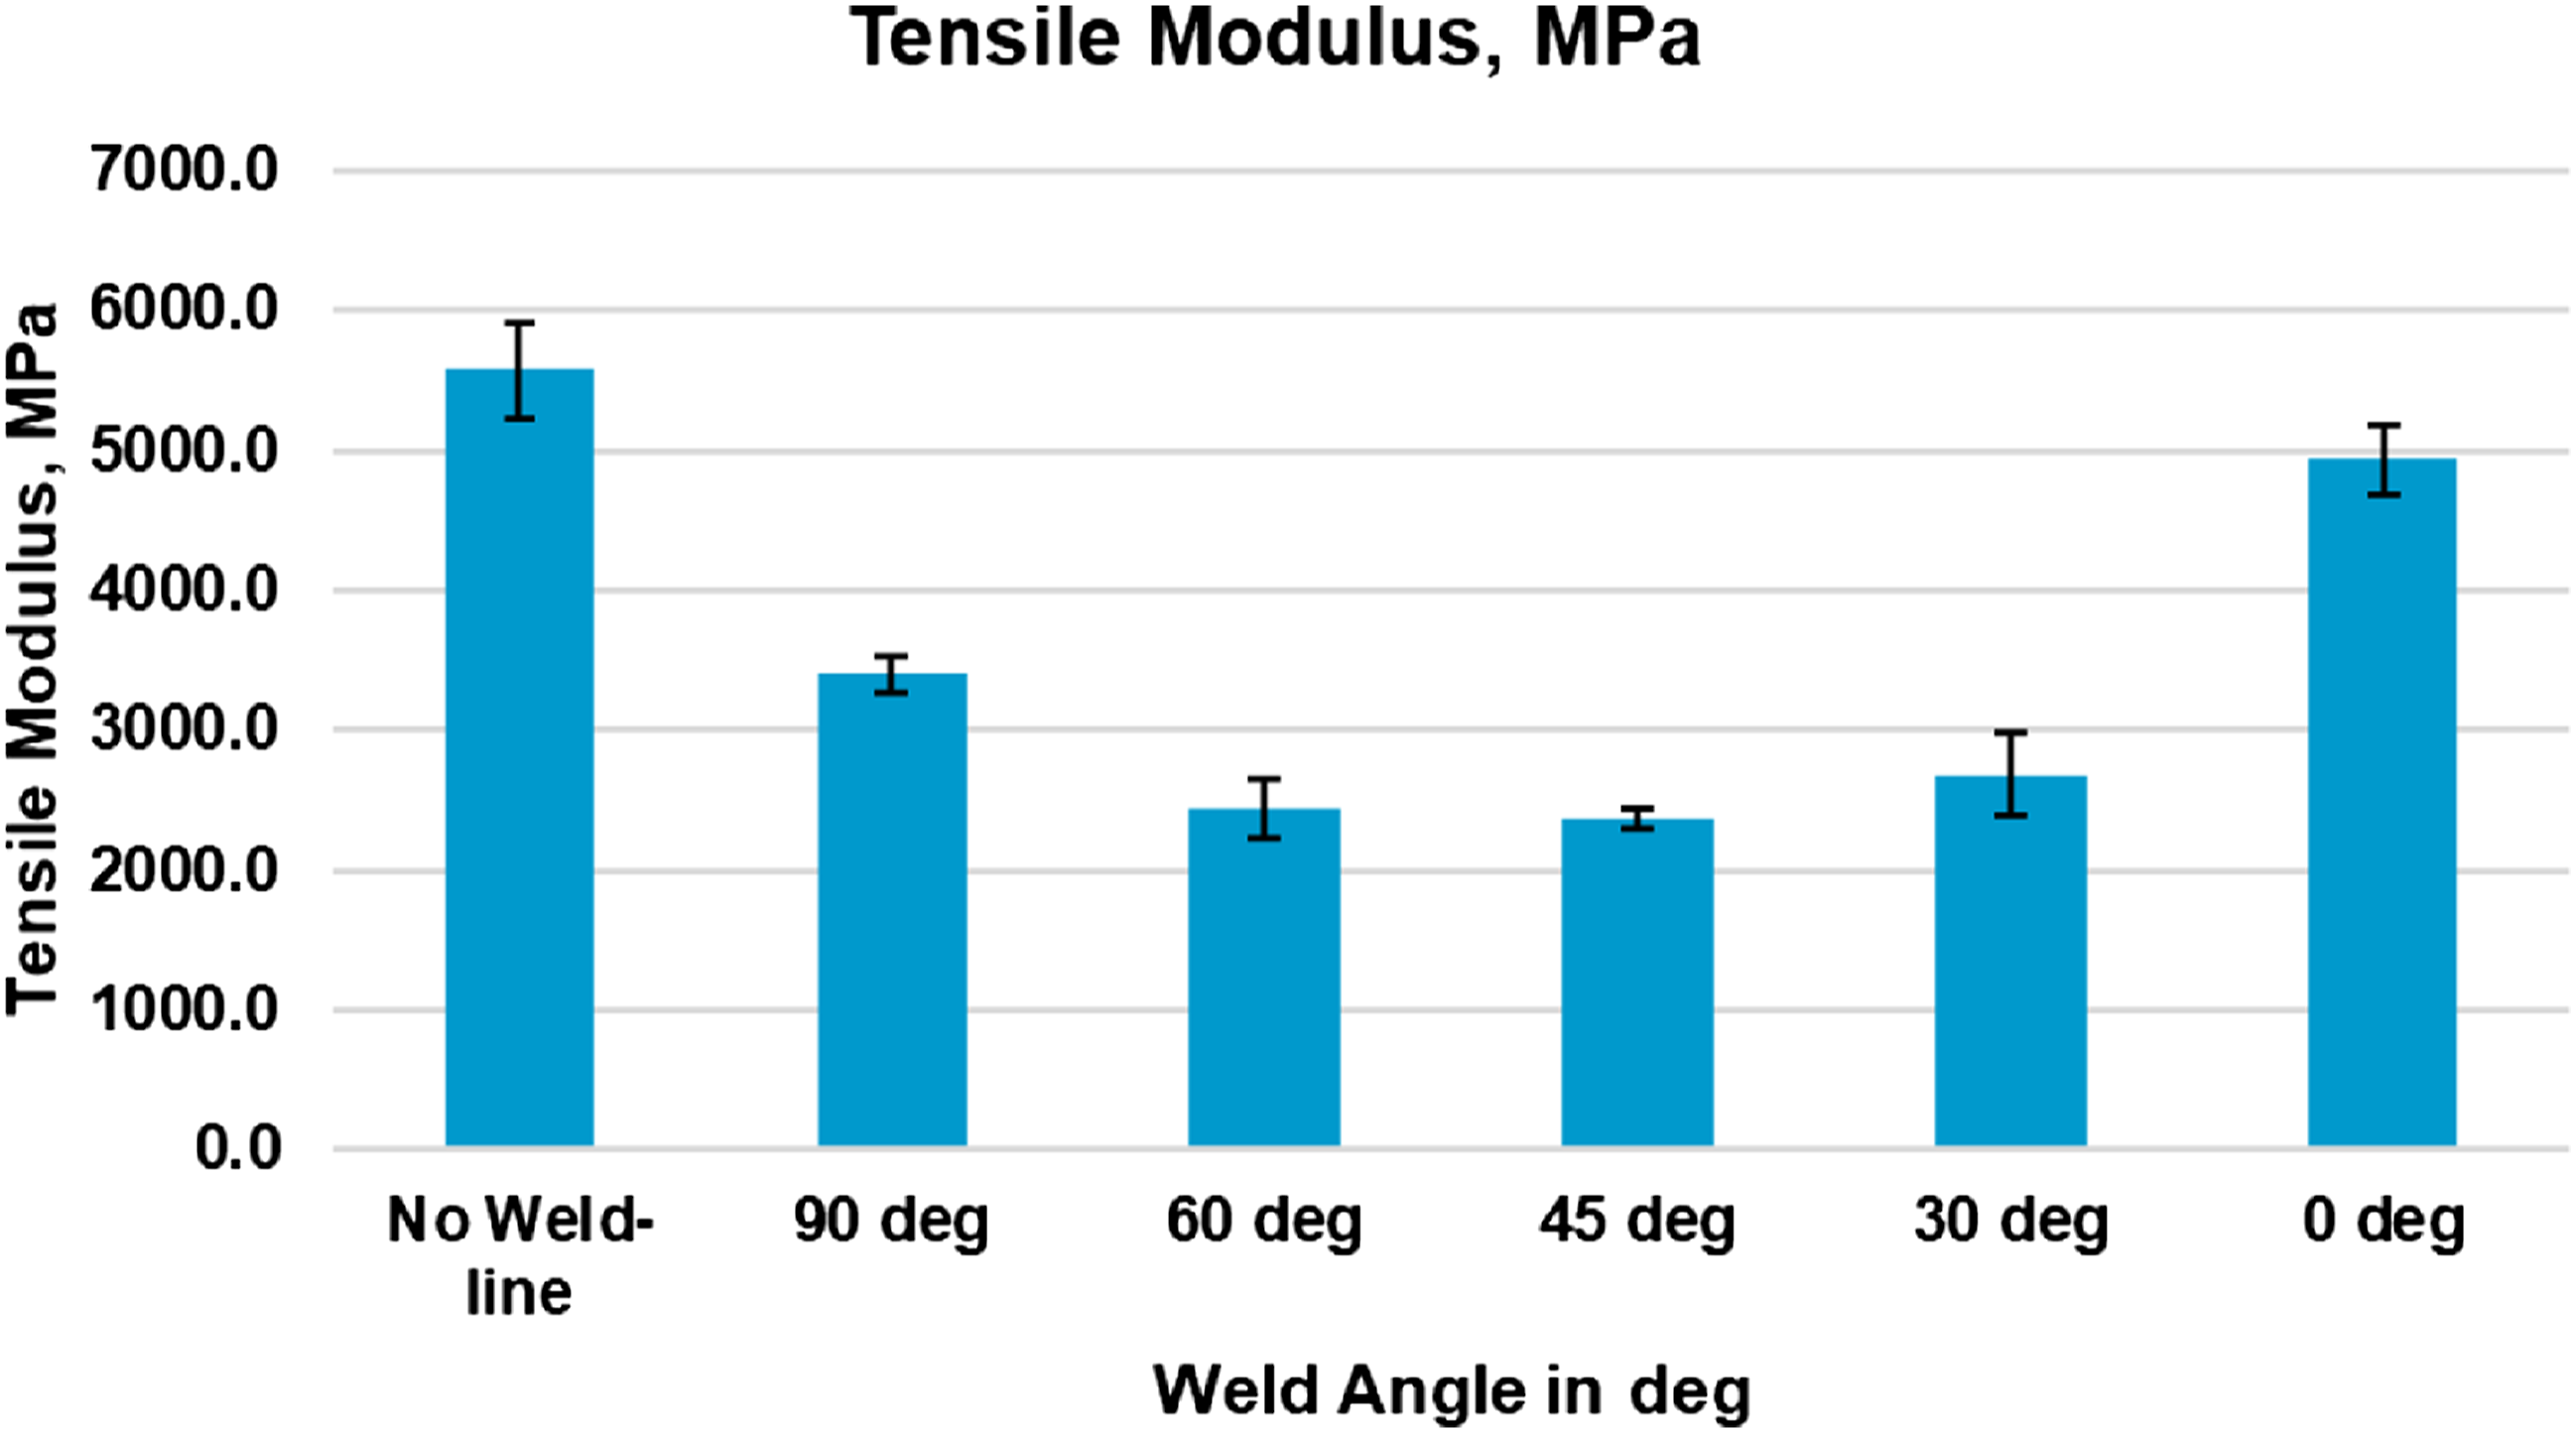
When the specimen is under tensile loading, the percentage of load shared by parent material matrix and fibers depends on alignments of fiber with respect to loading direction and adhesion between fiber and matrix. Higher is the fiber alignment corresponding to the loading direction, more will tensile strength however it reduces strain at break.
Figure 17 shows stress at break and strain at the break at different weld-line angle specimens. For 90o weld-line specimens, the stress and strain at break values are the lowest among all specimens. This may be attributed to the perpendicular direction of glass fiber with respect to loading direction and therefore maximum resistance to external load is offered by matrix intermolecular bonding and less from glass fiber strength. Similarly, for other weld-line angle specimens, glass fibers and base matrix are adding corresponding resistance to load as per the degree of orientation. Stress at break and strain at the break with respect to weld-line angles.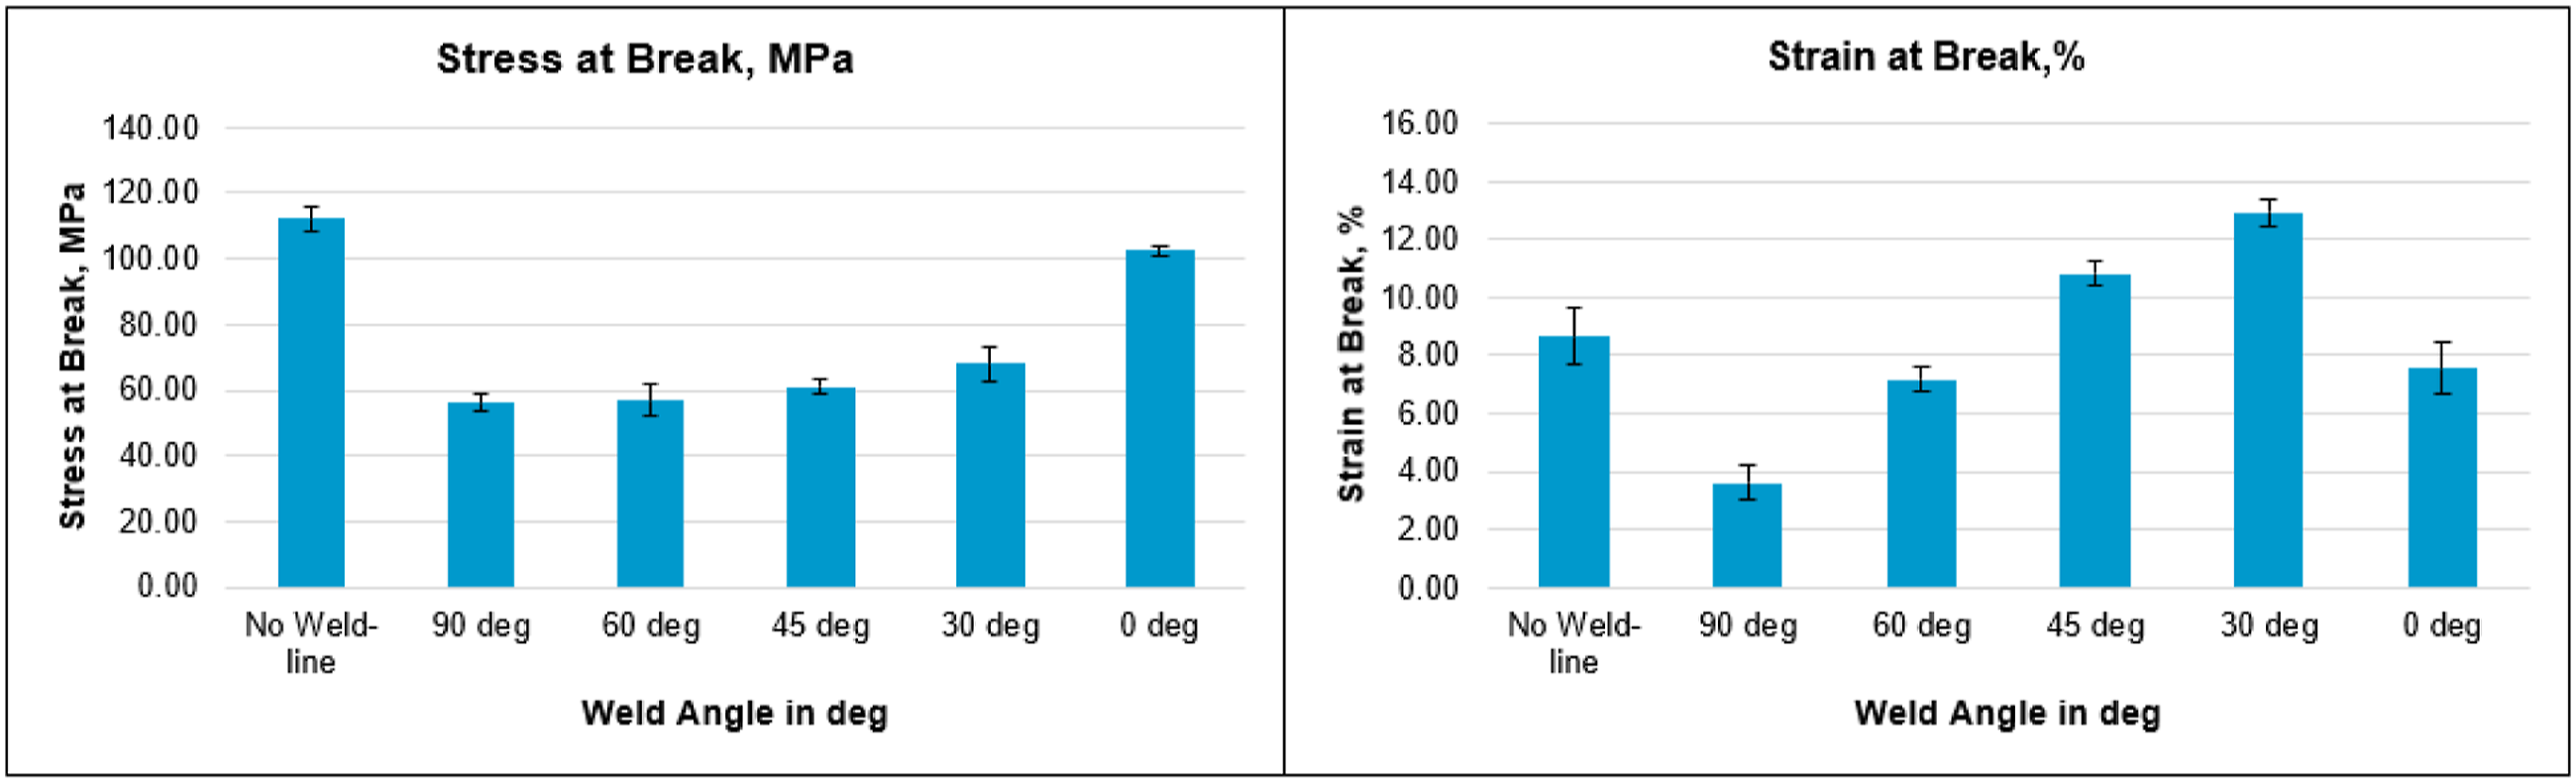
From the result bar chart trend, it is observed that both stress and strain at break values are increasing when the weld-line angle is reduced from 90o to 0o. It is mainly because of the deformation mechanism of matrix molecules and glass fiber alignment. 16 The minimum contribution of fiber is at 90o weld-line, and it is increasing when the weld-line angle is reduced towards 0o. However, in this work for 0o weld-line specimen orientation pattern is quite complicated as the weld-line is throughout the length of the specimen and is parallel to loading direction therefore it is not following any trend for strain at break, therefore for 30o specimen strain at break is seen as maximum.
Weld-line strength factor is nothing but retention in the strength and it is calculated as the ratio of strength with the weld-line specimen to strength without the weld-line specimen.
10
Figure 18 shows weld-line strength factors in percentage based on stress at the break for different weld-line angle specimens. Weld-line strength factor has a minimum value of 50.54% for 90o specimen and maximum value of 91.46% for 0o specimen and 60o,45o, and 30o weld-line specimens it is 51.43%, 54.46%, and 61.20% respectively compared to without weld-line specimen. Overall, all the experimental results show that the weld line has a significant effect on the tensile properties of the part. Weld strength factor (Strength retention and Strength Reduction) based on stress at the break for different weld-line angle specimens.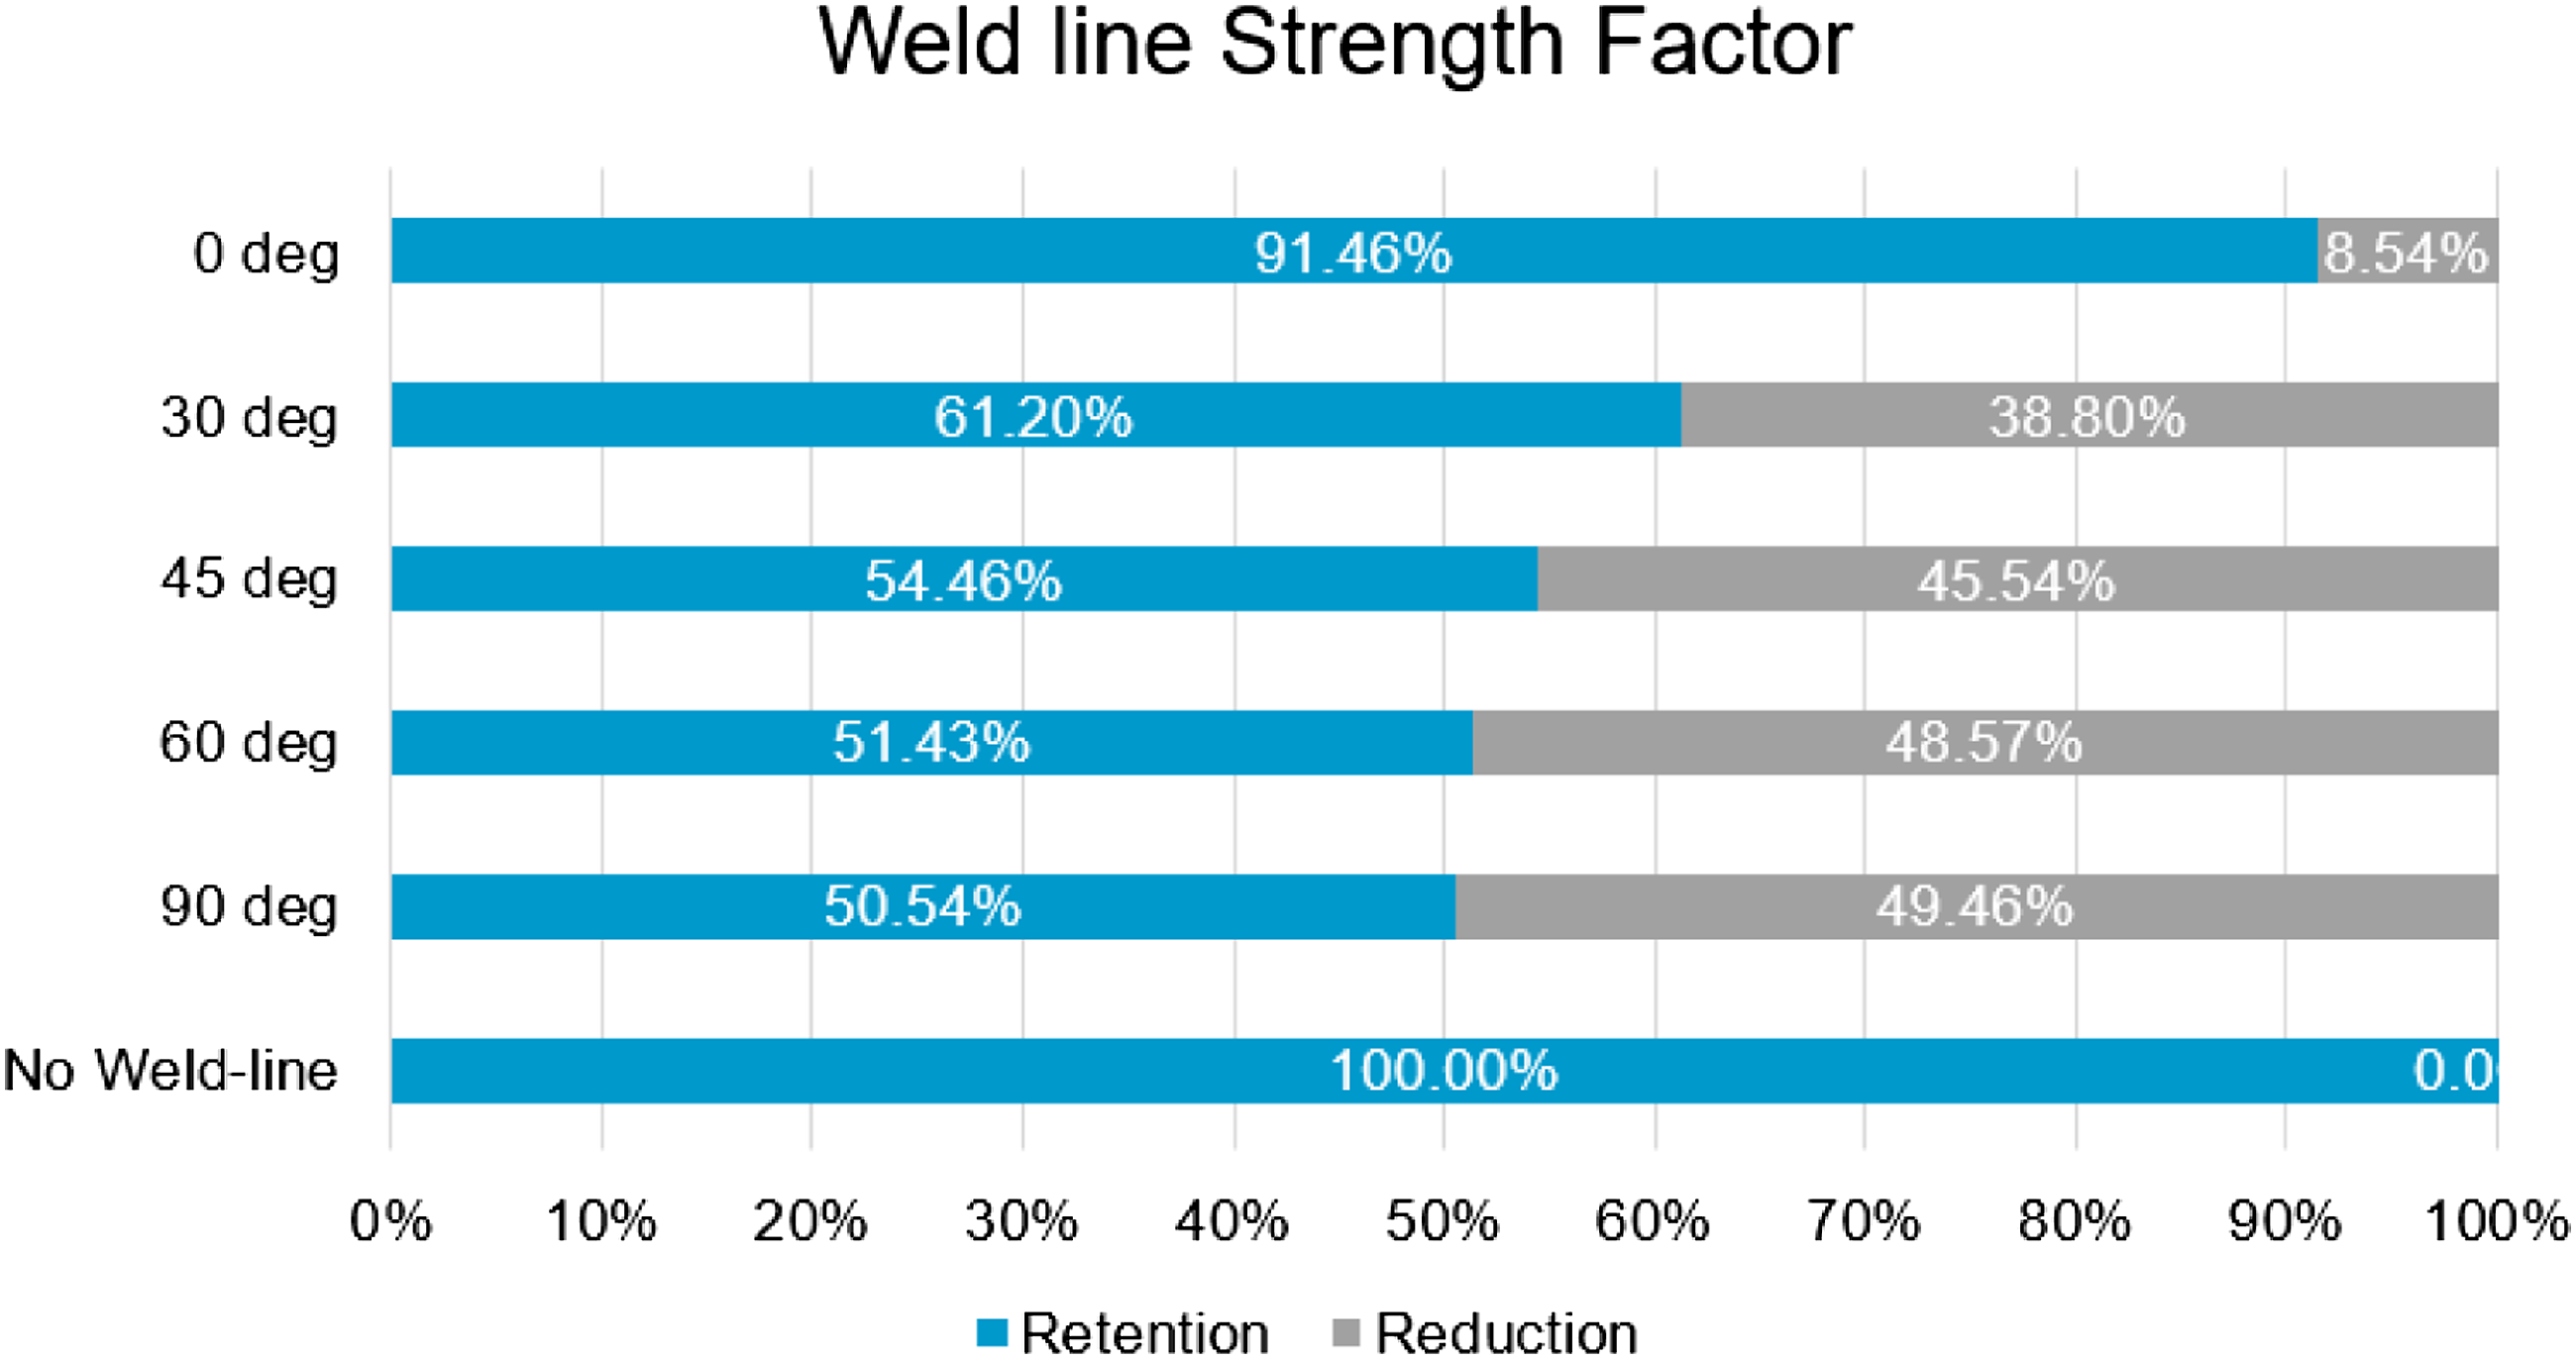
Conclusion
The effect of the weld-line on tensile properties for thermoplastic glass filled material is evaluated with a new methodology. An injection molding plaque tool is designed and manufactured with the inputs from mold flow simulation software.
From the experimental work, it is concluded that the weld-line affects the tensile properties of the part significantly. However, the values of tensile modulus, stress at break, and strain at break are varying as per the angular orientation of the weld-line.
Experimental results reveal that maximum and minimum reduction in tensile modulus of 58% and 11% are observed for 45o and 0o weld-line specimens respectively. For 30o, 60o, and 90o weld-line specimens, reductions of 52%, 56%, and 39% respectively are observed compared to specimens without weld-line.
The stress at break is found minimum at 90o weld-line specimen with a reduction of 49% compared to without weld-line specimen. Similarly, for 60o,45o,30o, and 0o weld line specimens a reduction of 48%,46%, 39%, and 9% respectively are observed compared to without weld-line specimen.
Maximum strain at break is observed at 30o weld-line specimen which is 50% higher compared to without weld-line specimen, similarly, 45o weld-line specimen breaks at 26% higher strain. Minimum strain at break is observed at 90o weld-line specimen which is 58% lower compared to without weld-line specimen, similarly, 60o and 0o weld-line specimens break at 17% and 12% lower strain values respectively.
From the result trend of stress and strain at break, it can be said that both the results values are increasing if the weld-line angle is reduced from 90o towards 0o, however, for 0o weld-line specimen orientation pattern is quite complicated therefore it is not following the trend for strain at break.
The weld line strength factor values for various positions of weld-line with respect to the direction of loading would be useful to the designer to decide about the factor of safety in the parts where weld-lines are inevitable. This work can be extended further for various engineering thermoplastic materials and the effect of weld-line on other mechanical properties such as impact and flexure can be studied.
Footnotes
Declaration of conflicting interests
The author(s) declared no potential conflicts of interest with respect to the research, authorship, and/or publication of this article.
Funding
The author(s) received no financial support for the research, authorship, and/or publication of this article.