
Abstract
Due to the increasing demands on automotive components, manufacturers are relying on injection moulding components from fibre-reinforced polymers in an attempt to increase strength to weight ratio. The use of reinforcing fibres in injection moulded components has led to component failures whereby the material strength is hampered through the formation of weldlines which are also a problem for unreinforced plastics. In this study, an industrial demonstrator component has the injection locations verified through a combination of fibre orientation tensor simulation and optical microscopy analysis of key locations on the component. Furthermore, the automotive component manufactured from 30% glass fibre–reinforced polyamide 6-6 is simulated and optimized through a Taguchi parametric study. A comparison is made between the component, as it is currently manufactured, and the optimum processing parameters determined by the study. It was found that the component can be manufactured with roughly 7.5% fewer weldlines and with a mould fill time 132 ms quicker than the current manufacturing process.
Introduction
With a drive to constantly lower carbon emissions, automotive manufacturers have sought to make vehicles lighter by replacing parts that traditionally would have been metallic with parts made from polymers. Manufacturing these components from polymers offers several benefits to the manufacturer; the parts can be manufactured quicker, cheaper and more repeatable. 1,2 Polymers fall into two categories, thermosetting and thermoplastic. Once moulded, thermosetting polymers cannot be reheated and remoulded. Thermoplastic polymers can be heated and reheated to allow the material to be moulded. Thermoplastic polymers thus have the benefit that they can be processed easily by manufacturers, using processes such as injection moulding. Thermosets can also be moulded by injection moulding process. Differences are that the mould is heated and the material cures, which causes longer cycle times.
Glass fibre–reinforced polyamide 6/6
Polyamide 6/6 is a polymer that is produced from a dibasic acid containing six carbon atoms and a diamine also containing six carbon atoms. It was first discovered in the DuPont research facility in Delaware. 3 Polyamide 6/6 is tough, easily processed and offers good chemical resistance at reasonably elevated temperatures. Due to these desirable properties, this material is chosen frequently by automotive manufacturers for engine bay components. Similar to metallic alloys, certain properties of polymers can be controlled by the addition of other materials. These additives fall into several categories: fillers, rubber modifiers, plasticizers, vulcanizers and pigments – these additives modify the properties of the material after processing. Lubricants, release agents and blowing agents can also be added to the raw material to improve the processing of the material.
One such filler additive commonly used are short strands of glass fibre; this addition increases the yield strength and the ultimate tensile strength of the polymer. Glass fibre–reinforced thermoplastic polymers are more attractive to automotive manufacturers for their ease of processing and superior mechanical properties. Filler materials, such as glass fibre, provide the material with properties that cannot be achieved, by either the fibre or the polymer when they are acting alone. The mechanical properties of a fibre-reinforced composite material are contingent on the mechanical properties of the fibres themselves, the mechanical properties of the matrix that surrounds them and the interface bonding between them allowing stresses to transfer between them. 4
Injection moulding
Injection moulding is a manufacturing process whereby molten material is injected into a mould and allowed to freeze, taking the shape of the cavity of the mould. Injection moulding machines generally consist of a hopper to hold the material ready to be injected into the mould, an injection ram to force the material into the mould and a heater to melt the material. The mould is designed in two or more parts to allow the finished component to be extracted. The mould will usually include one or more gate, through which the material is injected into the part; one or more sprues or runners to connect the gates to the cavities within the mould. Material is fed from the hopper into the heating chamber where it is melted, and then, it is forced into the mould by the injection ram where it solidifies and takes the shape of the cavity in the mould. While this can be a very simple manufacturing operation, for larger parts, the process is more complex.
If the injection moulding parameters are incorrect, then there are several types of defect that could be present in the finished part. These include weld lines, flow lines, vacuum voids, warpage and gassing. 5 These factors can all be optimized through careful positioning of gates, the number of gates used to fill the mould, controlling the temperature of the melt and the mould wall and the rate at which the mould is filled and cooled.
When larger moulds are used, the material can sometimes start to freeze too early creating weld lines within the finished component, usually near features in the part such as holes or nozzles or wall thickness cavity, where the molten material has had to take two paths and rejoin itself, as shown in Figure 1. 6 This type of manufacturing defect is called weld lines. The angle and temperature at which the two flow fronts converge dictate the resulting strength of the weldline region: A low angle indicates a poor join, while a higher angle indicates a stronger join. During convergence at higher angles, the fibres within the flow fronts have a higher probability that a complete knit will form behind the moving flow front.
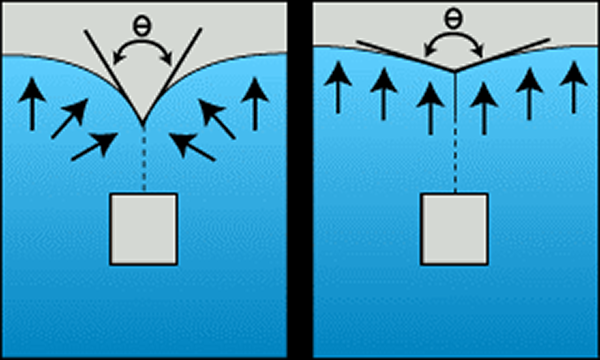
Weldline formation. 6
While the addition of short glass fibres to polyamide 6-6 greatly improves the mechanical properties of the material, when the fibres are aligned parallelly to a weld line and normal to the flow direction, the material suffers a drastic loss of tensile strength in that area. 7 –10 This combined with larger end-fed moulds could potentially increase the likelihood of failures.
Several studies 9 –14 have noted the presence of voids or pores in the regions near weldlines. This is due to gas entrapment at the time when the two flow fronts meet and recombine after flowing around an obstacle. This has been attributed to be one of the causes of weakness at weldlines, along with v-notches which can be present at the surface as well as melt from temperature or generally weak secondary bonds across interface. To avoid these moulding defects and others, careful mould design is essential. The injected polymer should not be allowed to cool before the mould is completely filled, and this ensures that when two melt fronts join they are of a sufficiently high temperature that an acceptable weld is formed. This is a complex process and requires experience.
Moldflow
Fibre orientation during moulding is very important when designing a part as it can constitute the microstructure and therefore the mechanical properties of a component. Moldflow can be used to simulate the process of injection moulding and evaluate the distribution and orientation of the fibres. It can also be used to try out different variables such as melt viscosity, fluid flow rate, solidification rate, temperature of the melt and the mould and whether the filling gates are in the correct position to achieve complete filling. Simulating the injection moulding process can aid a company in creating an optimal final part at a reduced cost. It will also determine any weaknesses in the weld lines and defects that will occur such as porosity and shrinkage. This project addresses the problem of weld lines in 30% short glass fibre–reinforced polyamide 6-6 injection moulded radiator tanks through the use of simulation techniques validated by optical microscopy of a physical component to make recommendations with a view to optimizing the current manufacturing process.
Narkis et al. 8 state that when fibres are oriented parallel to the weld-line and normal to the flow direction, a dramatic loss of tensile strength can be observed. They determine the fibre orientation at the weld-lines using reflected light microscopy of polished sections. They also discuss the effects of filler material and shape, voids and weldlines on the resulting strength of injection moulded components. They conclude that while fibres can strengthen the bulk of the component, the orientation of them is critical in regions containing weldlines.
Oumer and Mamut 15 discuss the parameters that can influence the fibre orientation within the component. They conclude that for thin-walled components of 2 mm thickness, the fibres are nearly always aligned with the flow direction; and for thicker components, the fibres orient with the flow direction near the mould walls and perpendicular to the flow direction in the middle of the component. They also reported in their review that for thicker components the lower inlet flow rates increase fibre orientation in the flow direction while orientation decreases at higher inlet flow rates.
Boukhili et al. 16 discuss the effects of weld-lines in short glass fibre–reinforced polycarbonate components. Weld-lines were created in the components through using two gates. They show that parts created with a weld-line have significantly lower tensile strength compared with parts with no weld line. They discuss the weld-line as being a surface type defect which acts like a stress raiser when loaded.
Sanschagrin et al. 17 discuss the use of various fillers and reinforcing elements in injection moulded polypropylene and the impact they have on weldline strength. They conclude that the reduction of strength at weldlines is due to the orientation of reinforcing fibres at the weld line.
Liu and Yang 18 study the tensile strength of weld lines produced under varying conditions. They perform a Taguchi reduced parametric study varying melt and mould temperatures, melt filling speed and pressure, packing pressure and size of obstacle causing the weld line. They conclude that the size of obstacle and melt temperature have the greatest effect on the strength of the weld line produced.
In a similar study performed by Chien et al., 19 it was found that higher melt and mould temperatures and faster injection speeds would increase weld line strength, whereas higher packing pressure would decrease weld line strength.
Patcharaphun et al., 20 investigate the use of push–pull processing for modifying the fibre orientation of injection moulded fibre–reinforced polycarbonate parts with a view to increasing the strength of the weld lines within the component. They state that the strength of the component at a weld line is related to the orientation of the fibres in that location.
Wu and Liang 21 discuss the effects of processing parameters on weldline strength in polypropylene and high-density polyethylene micro injection moulded components. Through a Taguchi designed experiment, they determine that the factors most affecting the strength of the weldline are melt temperature, mould temperature, injection speed and packing pressure.
Modelling procedure
Using a CAD file of the component geometry supplied by the component manufacturer, a simulation was performed using mean process parameters currently being used by the manufacturer to identify regions within the part that show problematic weld lines. An estimated direction of fibre orientation on the surface of the component was also generated using this simulation. A parametric study was conducted using Moldflow Insight to determine the optimum gate position, number of gates and processing parameters such as the mould temperature and the temperature of the meld.
Simulation
The simulations performed in this investigation are all carried out using Autodesk Simulation Moldflow Insight 2014 Release 2. As the actual gate location used during manufacture is unknown and has been determined as either being at either locations A or B as shown in Figure 2, both gate locations have been used in this study.
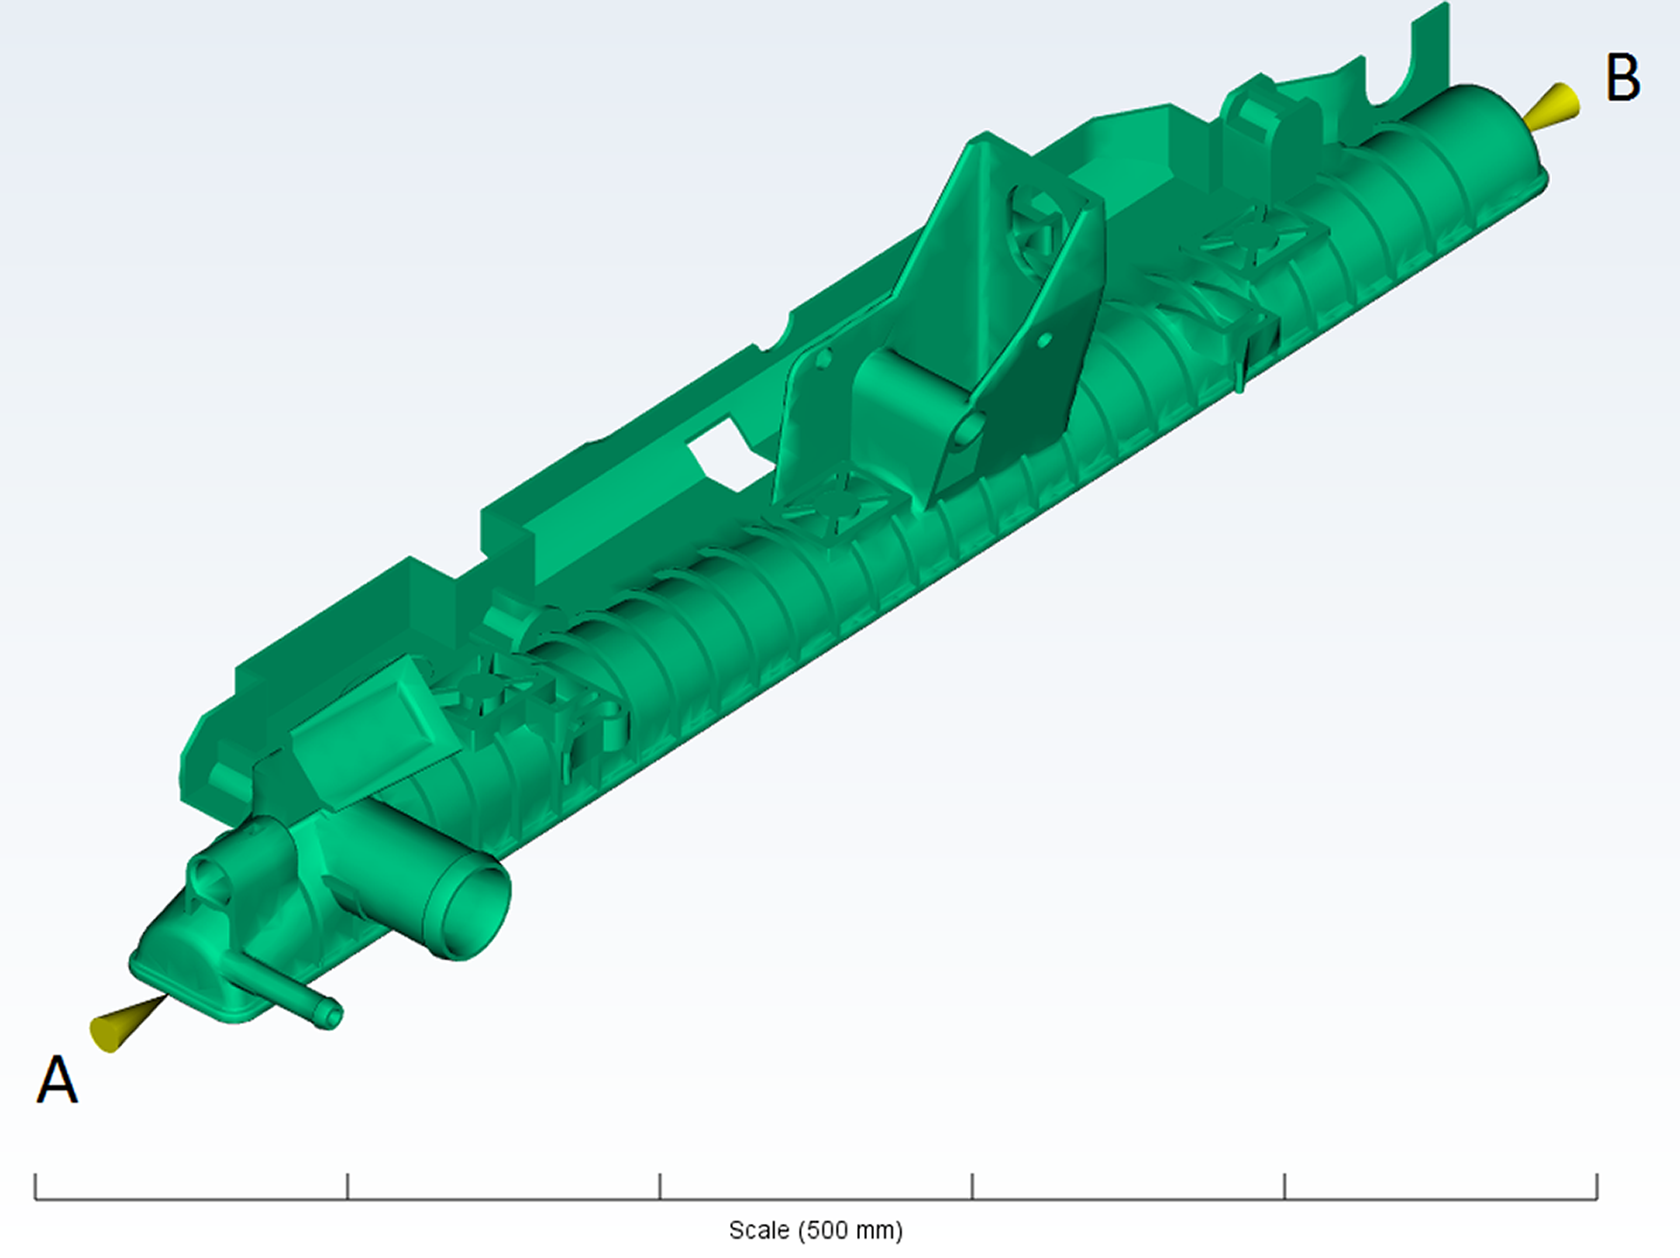
Gate locations used in simulations.
Mesh
As the simulations run in this model are full 3D simulations, the mesh used in all the simulations is a tetrahedral mesh with 900,976 elements. A full 3D mesh was chosen over a dual domain mesh with 2D triangular elements as a full 3D mesh gives a better representation of the component compared to the dual domain mesh, which is more suited to components with very small variations in wall thickness.
As the purpose of the simulations is to determine the optimum parameters to minimize weld lines, weld lines need to be measured. For weld lines to be measured, they must be present in the simulation results. For a weld line to be displayed in the results, the location of the weld line must be covered by a mesh element edge. To maximize the likelihood of a mesh edge being coincident on a weld line location, a high mesh density must be used. As mesh density increases, so does computational run time. As mesh density increases, the accuracy of the results also increases to a point where the results become independent of mesh density.
The total weldline length is to be extracted from the simulation results using a command line tool included in Autodesk Moldflow Insight, studyrlt.exe. 22 The tool allows selected results to be automatically extracted from results files following simulation. The total weldline length is reported by the tool in arbitrary units and is used to allow a direct comparison between simulations using different processing parameters.
Processing parameters
Moldflow Adviser can perform gate position suitability simulations in which each location on the surface of the component is tested for its suitability as a gate location, regardless of the intended component material. The software essentially finds the location closest to the centre of the component so as to balance the fill patterns of the plastic as it is injected, Figure 3 (left). An optimum gate position analysis was performed and from this it is recommended that the gate location has to be in the centre of the component, locations 3 or 4 in Figure 3 (right).
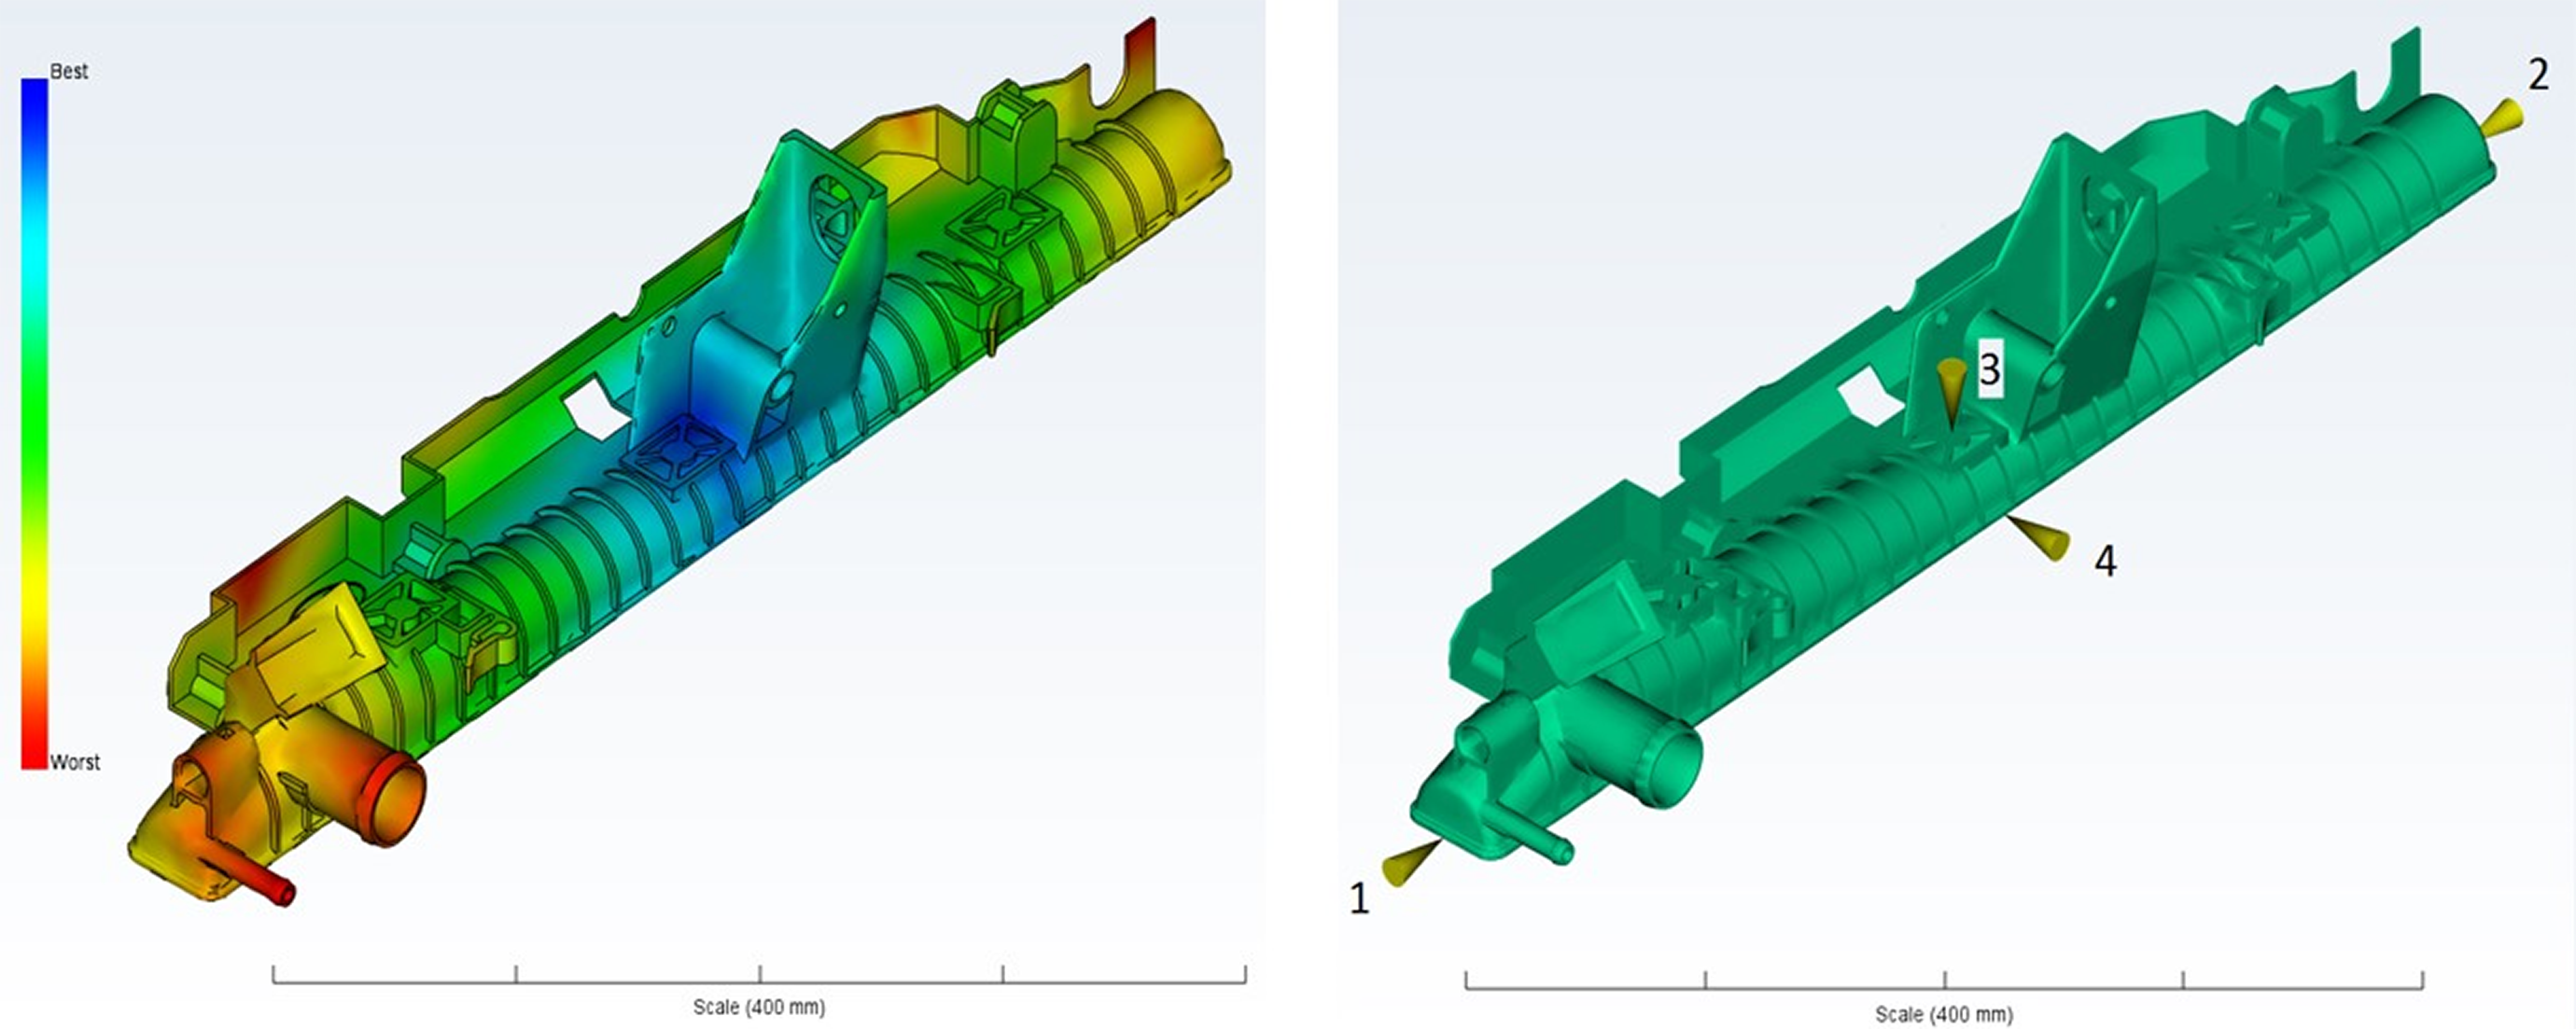
Gate position analysis results. Blue signifies the most suitable locations for the gate, while red signifies the least suitable locations (left). Gate locations from gate location study (right).
As these locations would result in a highly divergent fibre orientation, this will lead to a reduction in component strength. From this, it was decided that gate locations 1 and 2 shown in Figure 3 would be used during the simulations as these were the most likely locations used by the manufacturer and they would be the most likely locations to produce a unidirectional flow of fibres within the component.
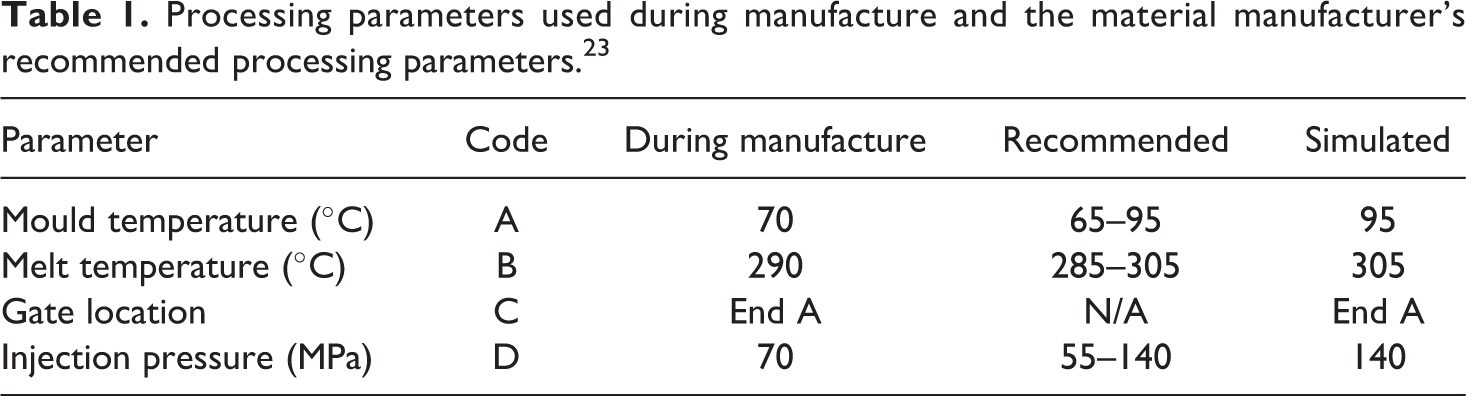
As the process parameters currently used during production differ from the material manufacturer’s recommended processing parameters, 23 these parameters have also been used and are shown in Table 1.
Processing parameters used during manufacture and the material manufacturer’s recommended processing parameters. 23
The results of these experiments are shown here as they were used to determine the processing parameters used in the parametric study (Table 2).
Weldline length and fill time results for initial experiment.
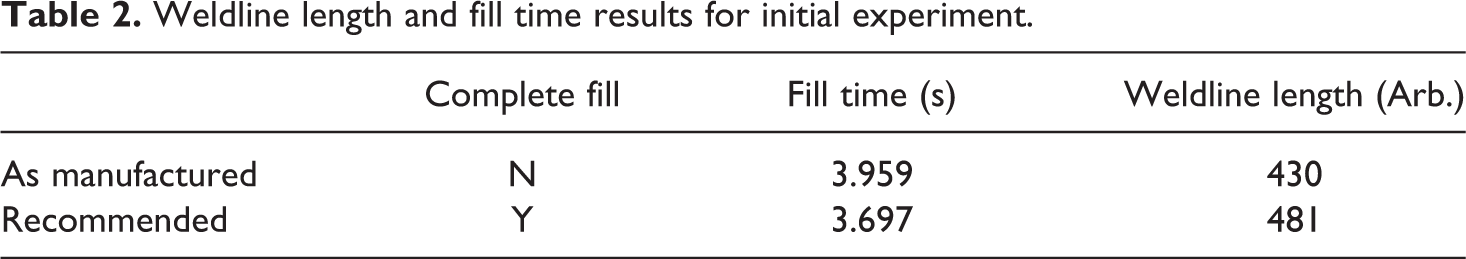
From the initial results given by these two simulations, the processing parameters to be used during the parametric study were chosen to be those shown in Table 3.
Processing parameters used in simulations.
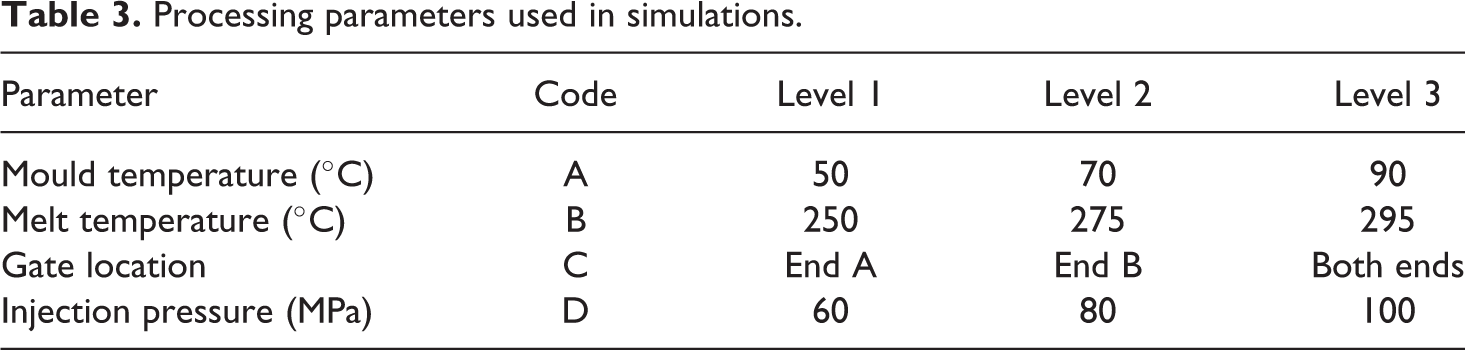
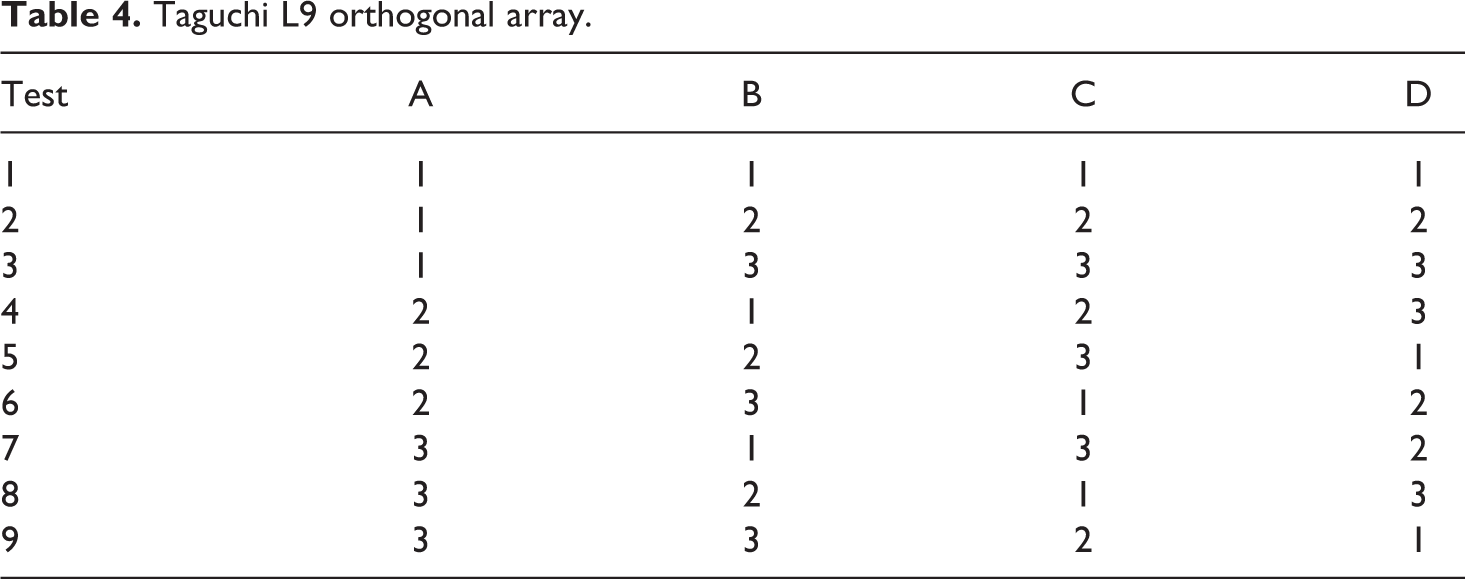
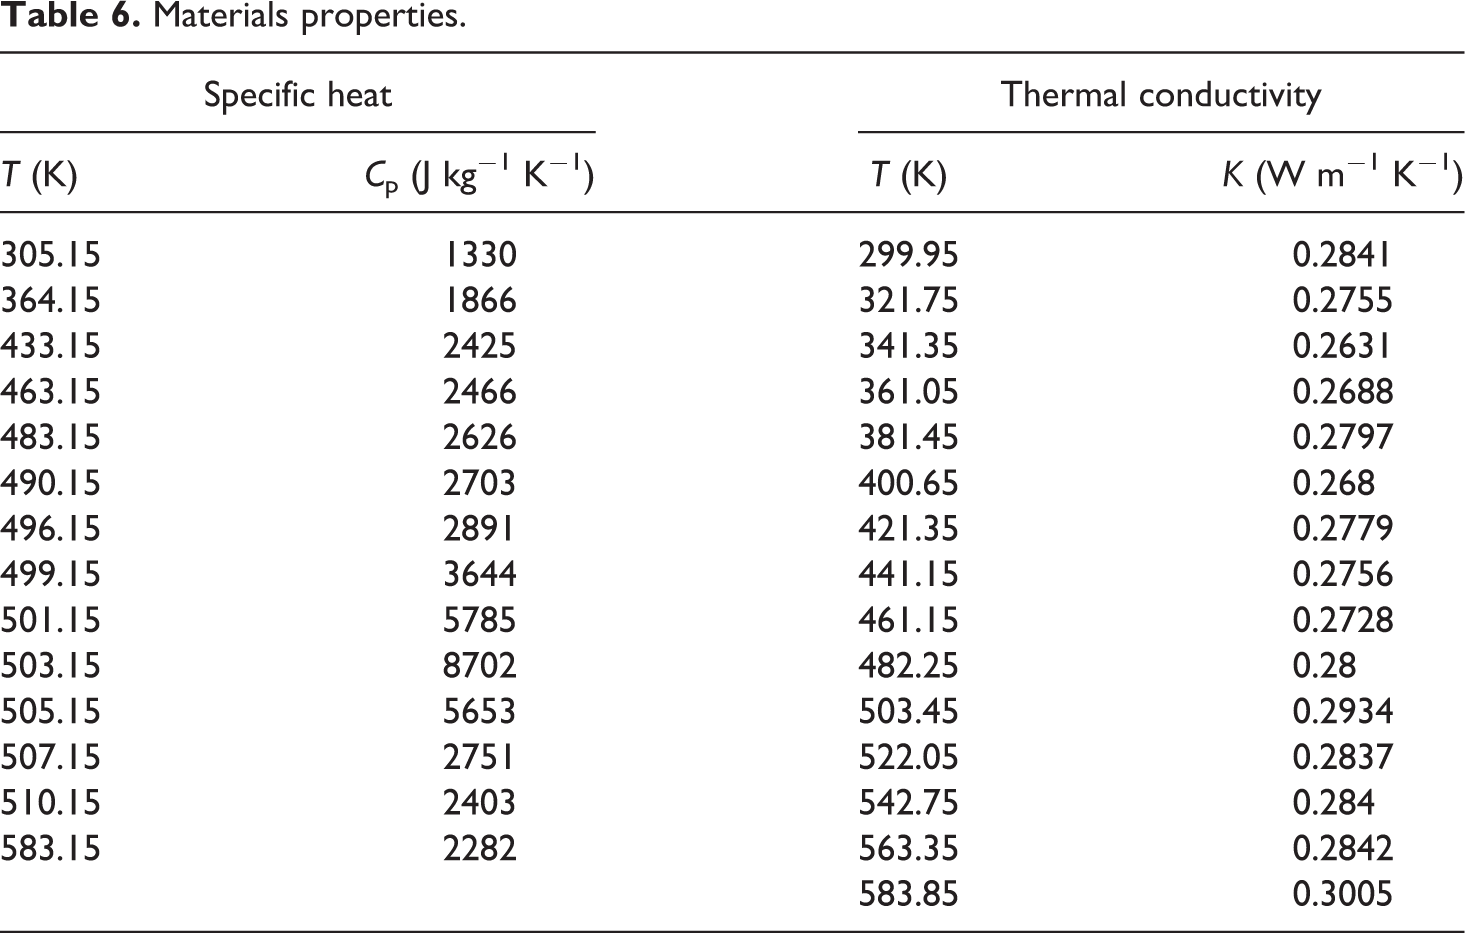
As there are four variables to be explored, each with three different states, this would lead to 34 different variable state combinations. This would lead to unrealistic number of simulations and data to process; therefore, an orthogonal array based on the Taguchi L9 orthogonal array was utilized. Table 4 represents the number of simulations to be performed. The fibre prediction model is a Folgar–Tucker with Ci = 1.1011E−14 and α = 5%. Transition temperature is 233°C, and Pressure, Volume and Temperature (PVT) Model is two-domain modified Tait. Mould-melt heat transfer coefficients are the following: filling = 5000 W m−2 °C−1, packing = 2500 W m−2 °C−1 and detached = 1250 W m−2 °C−1. Tables 5 and 6 give all the material properties, models and parameters used in this study.
Taguchi L9 orthogonal array.
Materials properties and models.
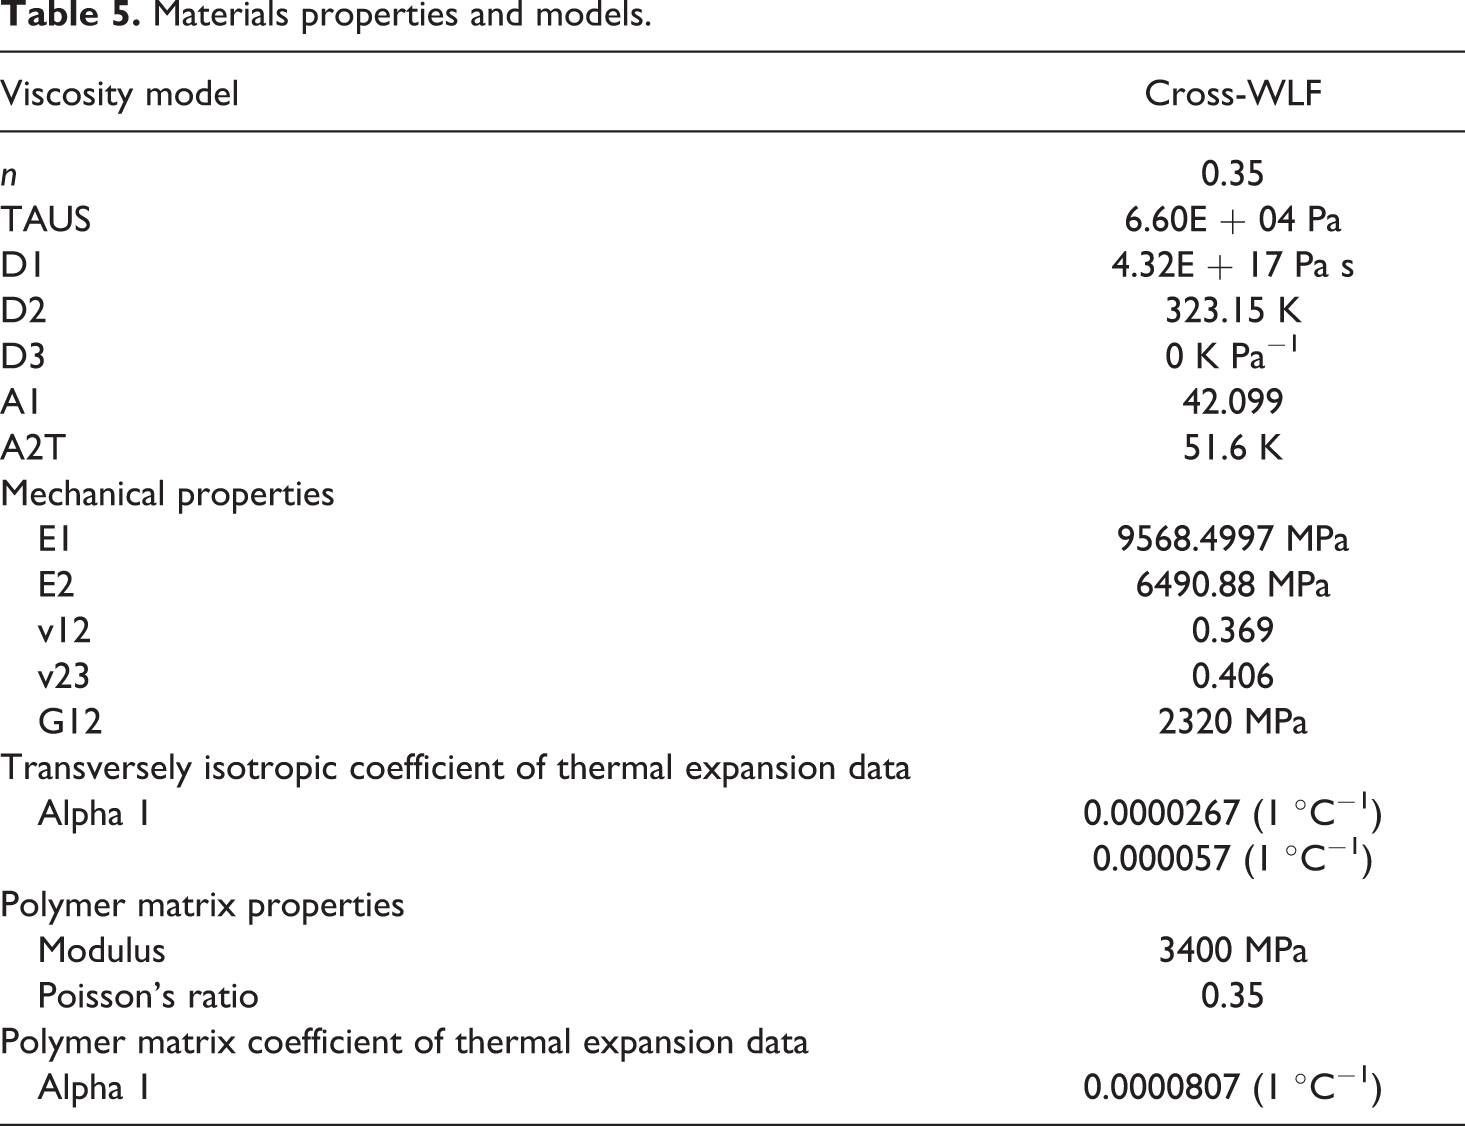
Materials properties.
Results
The simulations yielded results for mould fill time, weldlines and fibre orientation tensor.
Fill time and weldlines
The mould fill time is the time taken for the material to solidify in the mould, which depends on the computation models and materials parameters. The time at which it solidifies may or may not be before the mould is completely full. If the material solidifies before the mould is full, this results in an incomplete fill or short shot. The mould fill results for the nine experiments of the parametric study can be seen in Figure 4. The fill time results for each of the nine experiments of the study can be seen in Table 7.
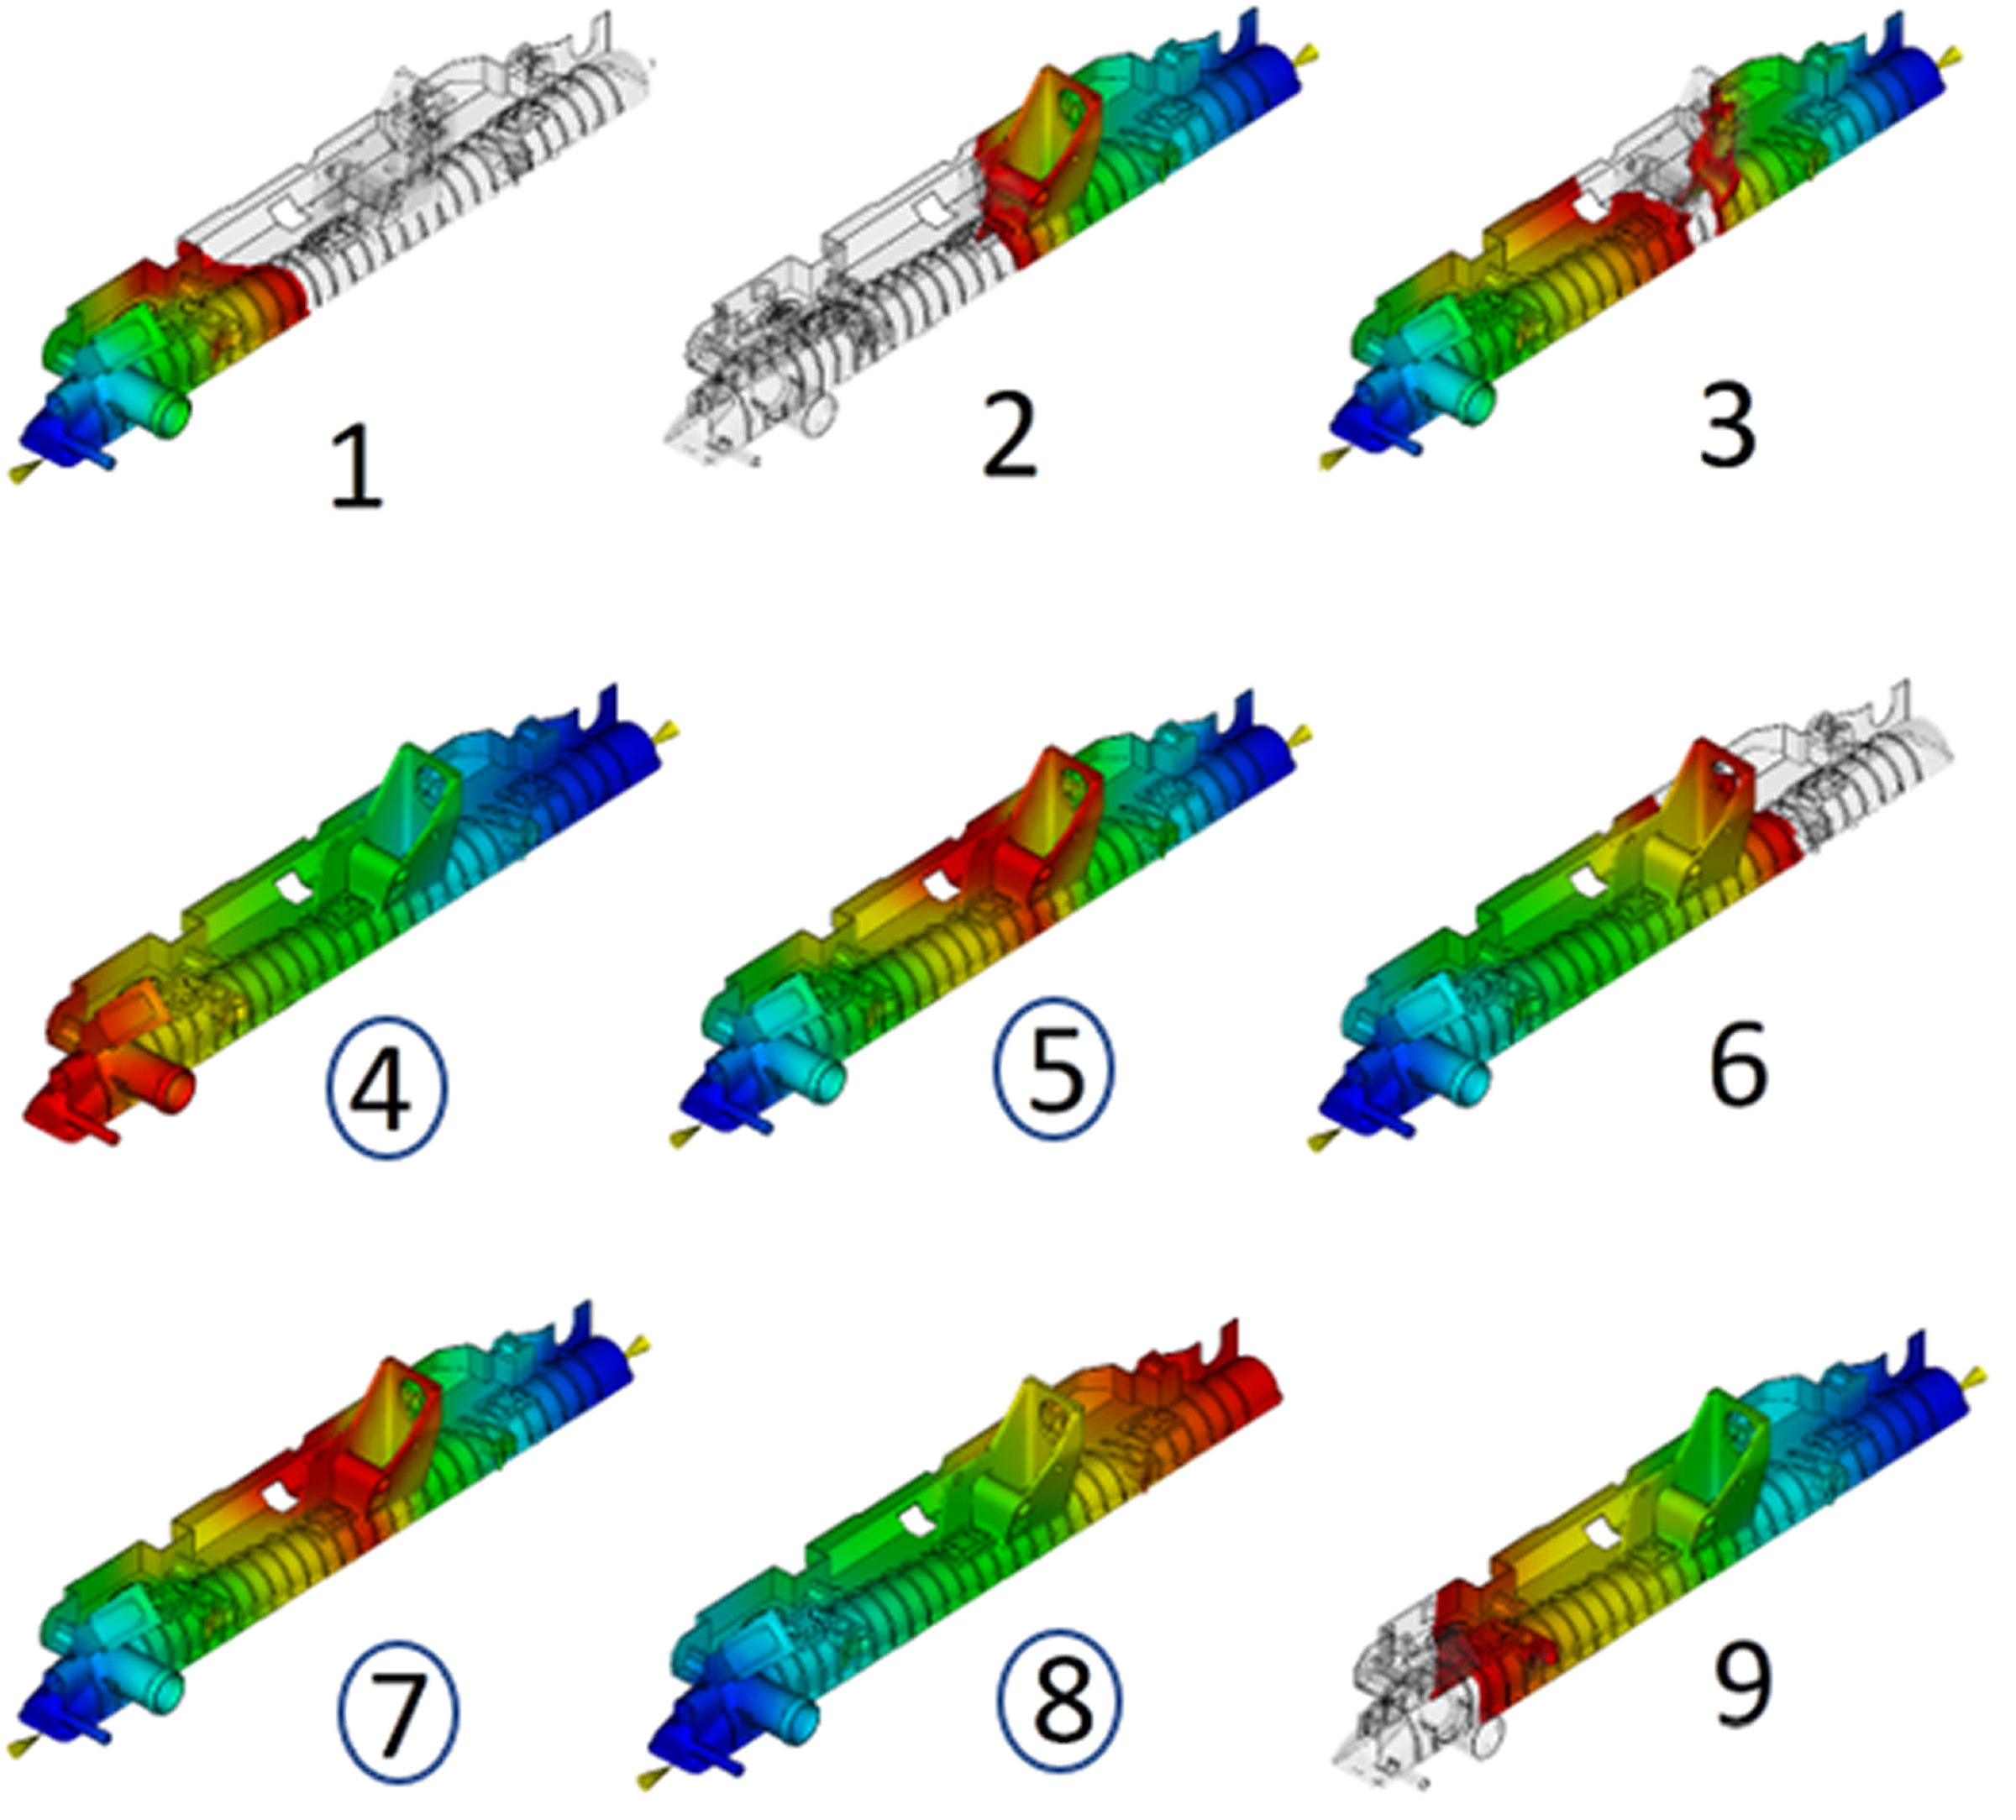
End of mould fill. Blue represents areas of the mould filled first, while red represents areas of the mould filled last. Circled numbers refer to the completed filled runs.
Fill time measurements.
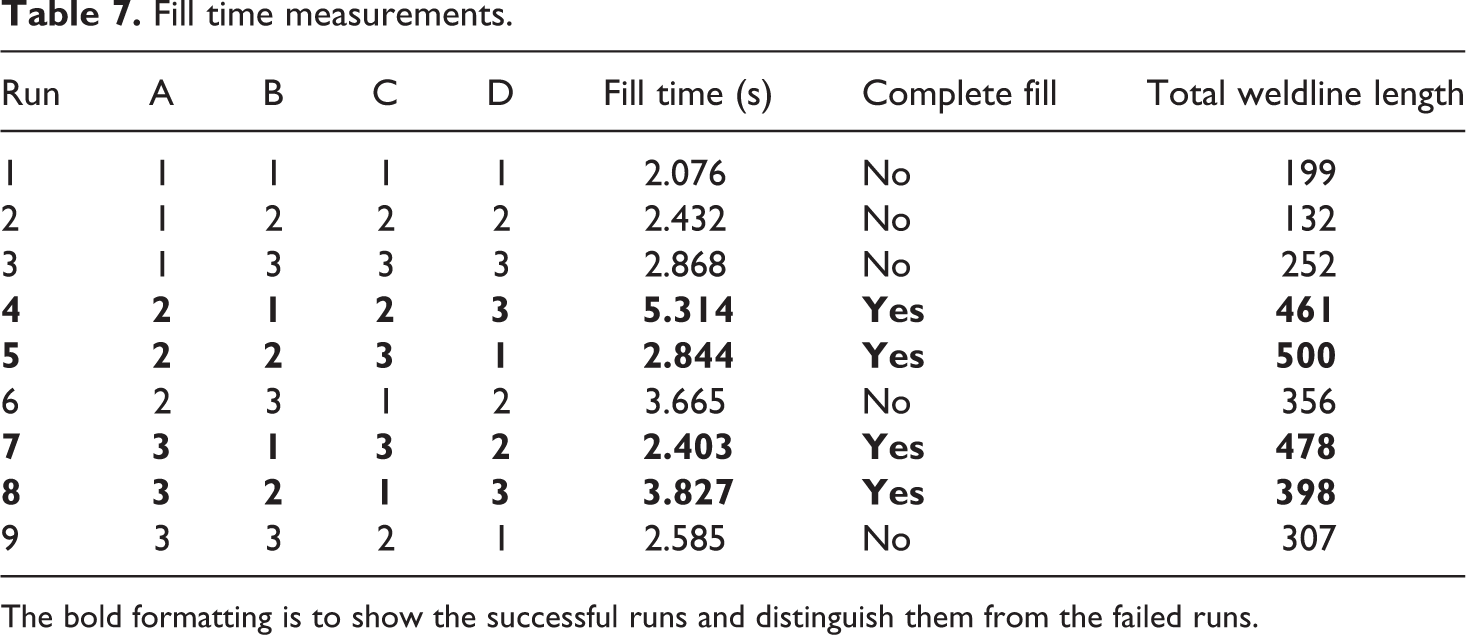
The bold formatting is to show the successful runs and distinguish them from the failed runs.
As the standard weldline result produced by Moldflow Insight consists of an image containing the locations of the weldlines within the component, and the angle at which the weldline formed overlaid on the CAD geometry of the component, it becomes difficult to extract quantifiable data from this. A typical weldline result is shown in Figure 5, where the locations of the weldlines are shown as lines on the surface of the component geometry where the colour of the line indicates the angle at which the weldline formed. In the result shown in Figure 5, the dark blue lines represent the worst areas of weldlines, formed at convergence angles of approximately 3.45°, while the red indicates convergence angles of 135°. To draw direct comparisons between the simulation results, some metric is required. As mentioned previously, Autodesk includes a command line tool called studyrlt.exe which can automatically extract numeric results from the simulation data. In the case of the weldlines result, the tool is able to extract the total number of mesh element edges on which a weldline is present. As the mesh used does not change between simulations and the aspect ratio of the mesh elements is approximately equal to 1, this will provide a suitable metric for comparison. The weldline length from Moldflow is only intended to be an indicator and not an absolute measurement. The weldline results for each of the nine experiments of the study can be seen in Table 7.
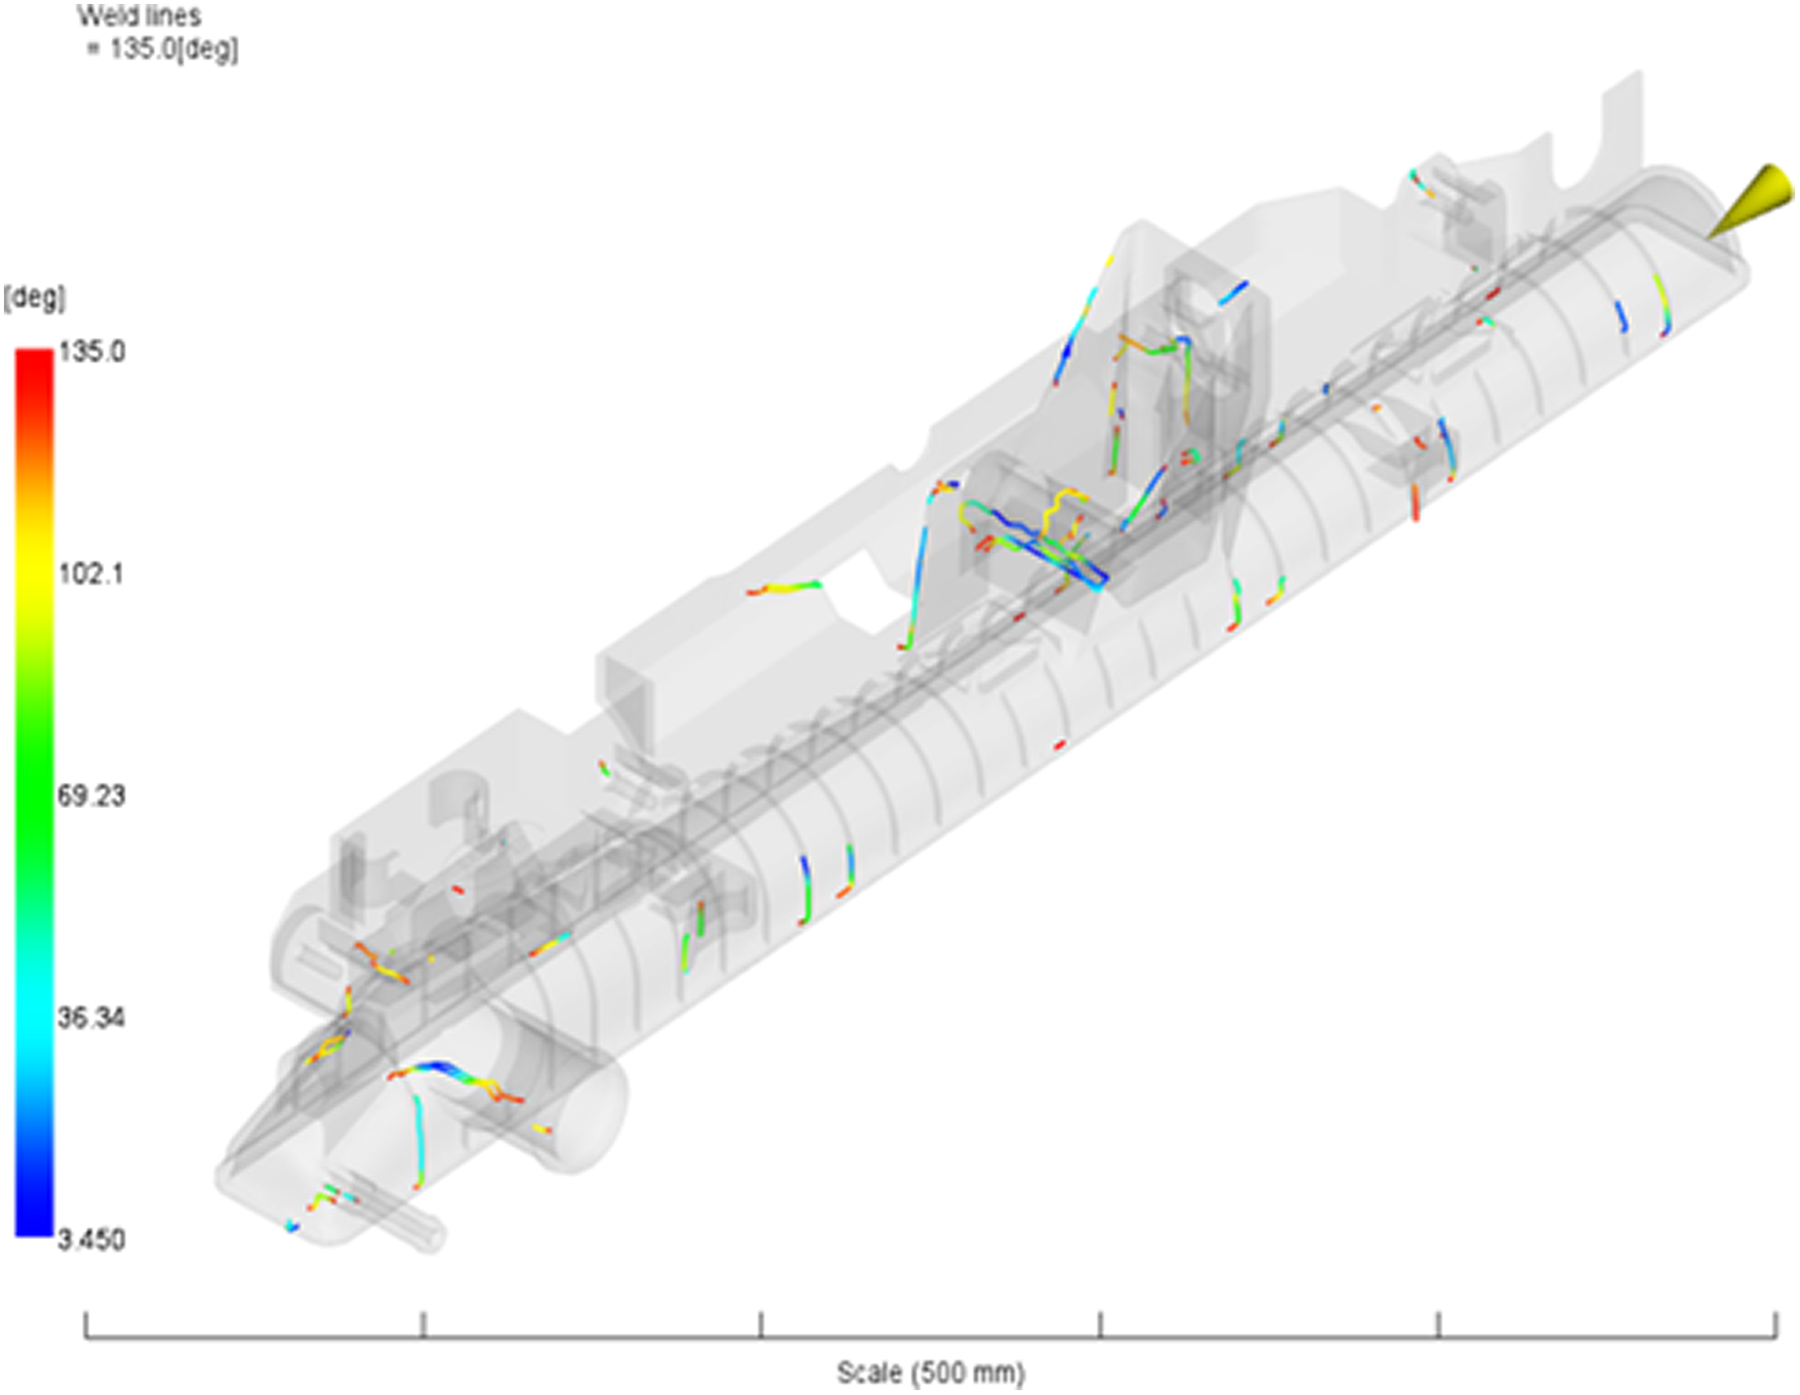
Typical weldline result image.
There are only four results (runs 4, 5, 7 and 8) to analyse due to the number of incomplete fill. Due to several experiments within the study where the mould did not fill completely, the mean fill times and weld line lengths for these cannot be considered valid results. Therefore, the incomplete fill results have been excluded from the results and are shown in Figures 6 and 7.
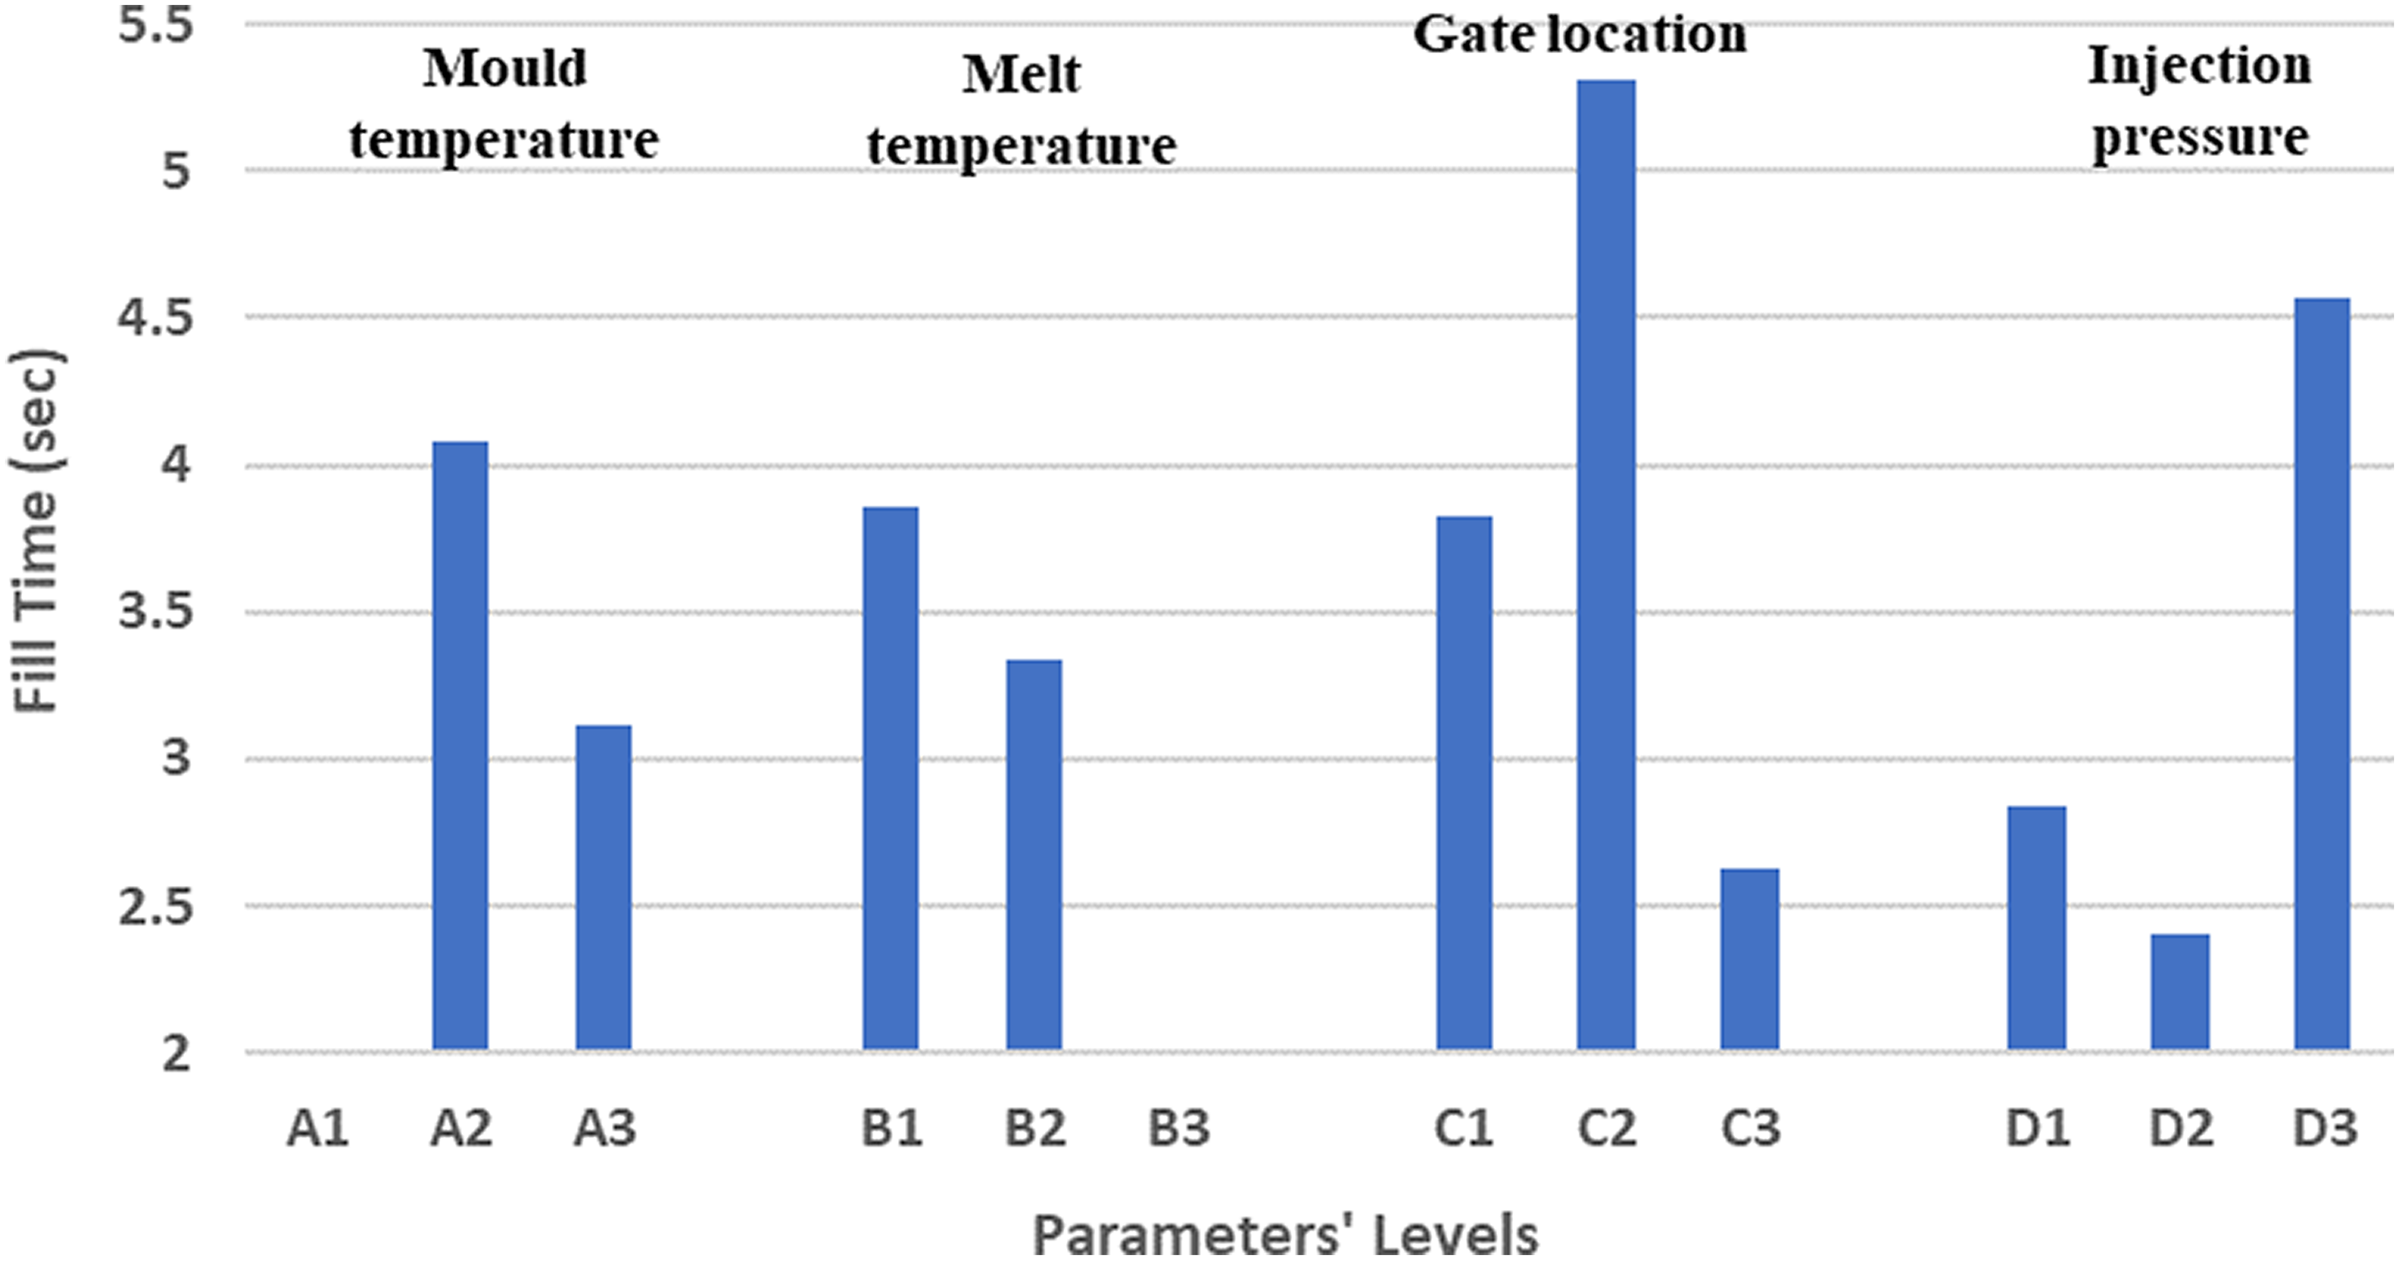
Graph showing main effects on fill time accounting for incomplete fill.
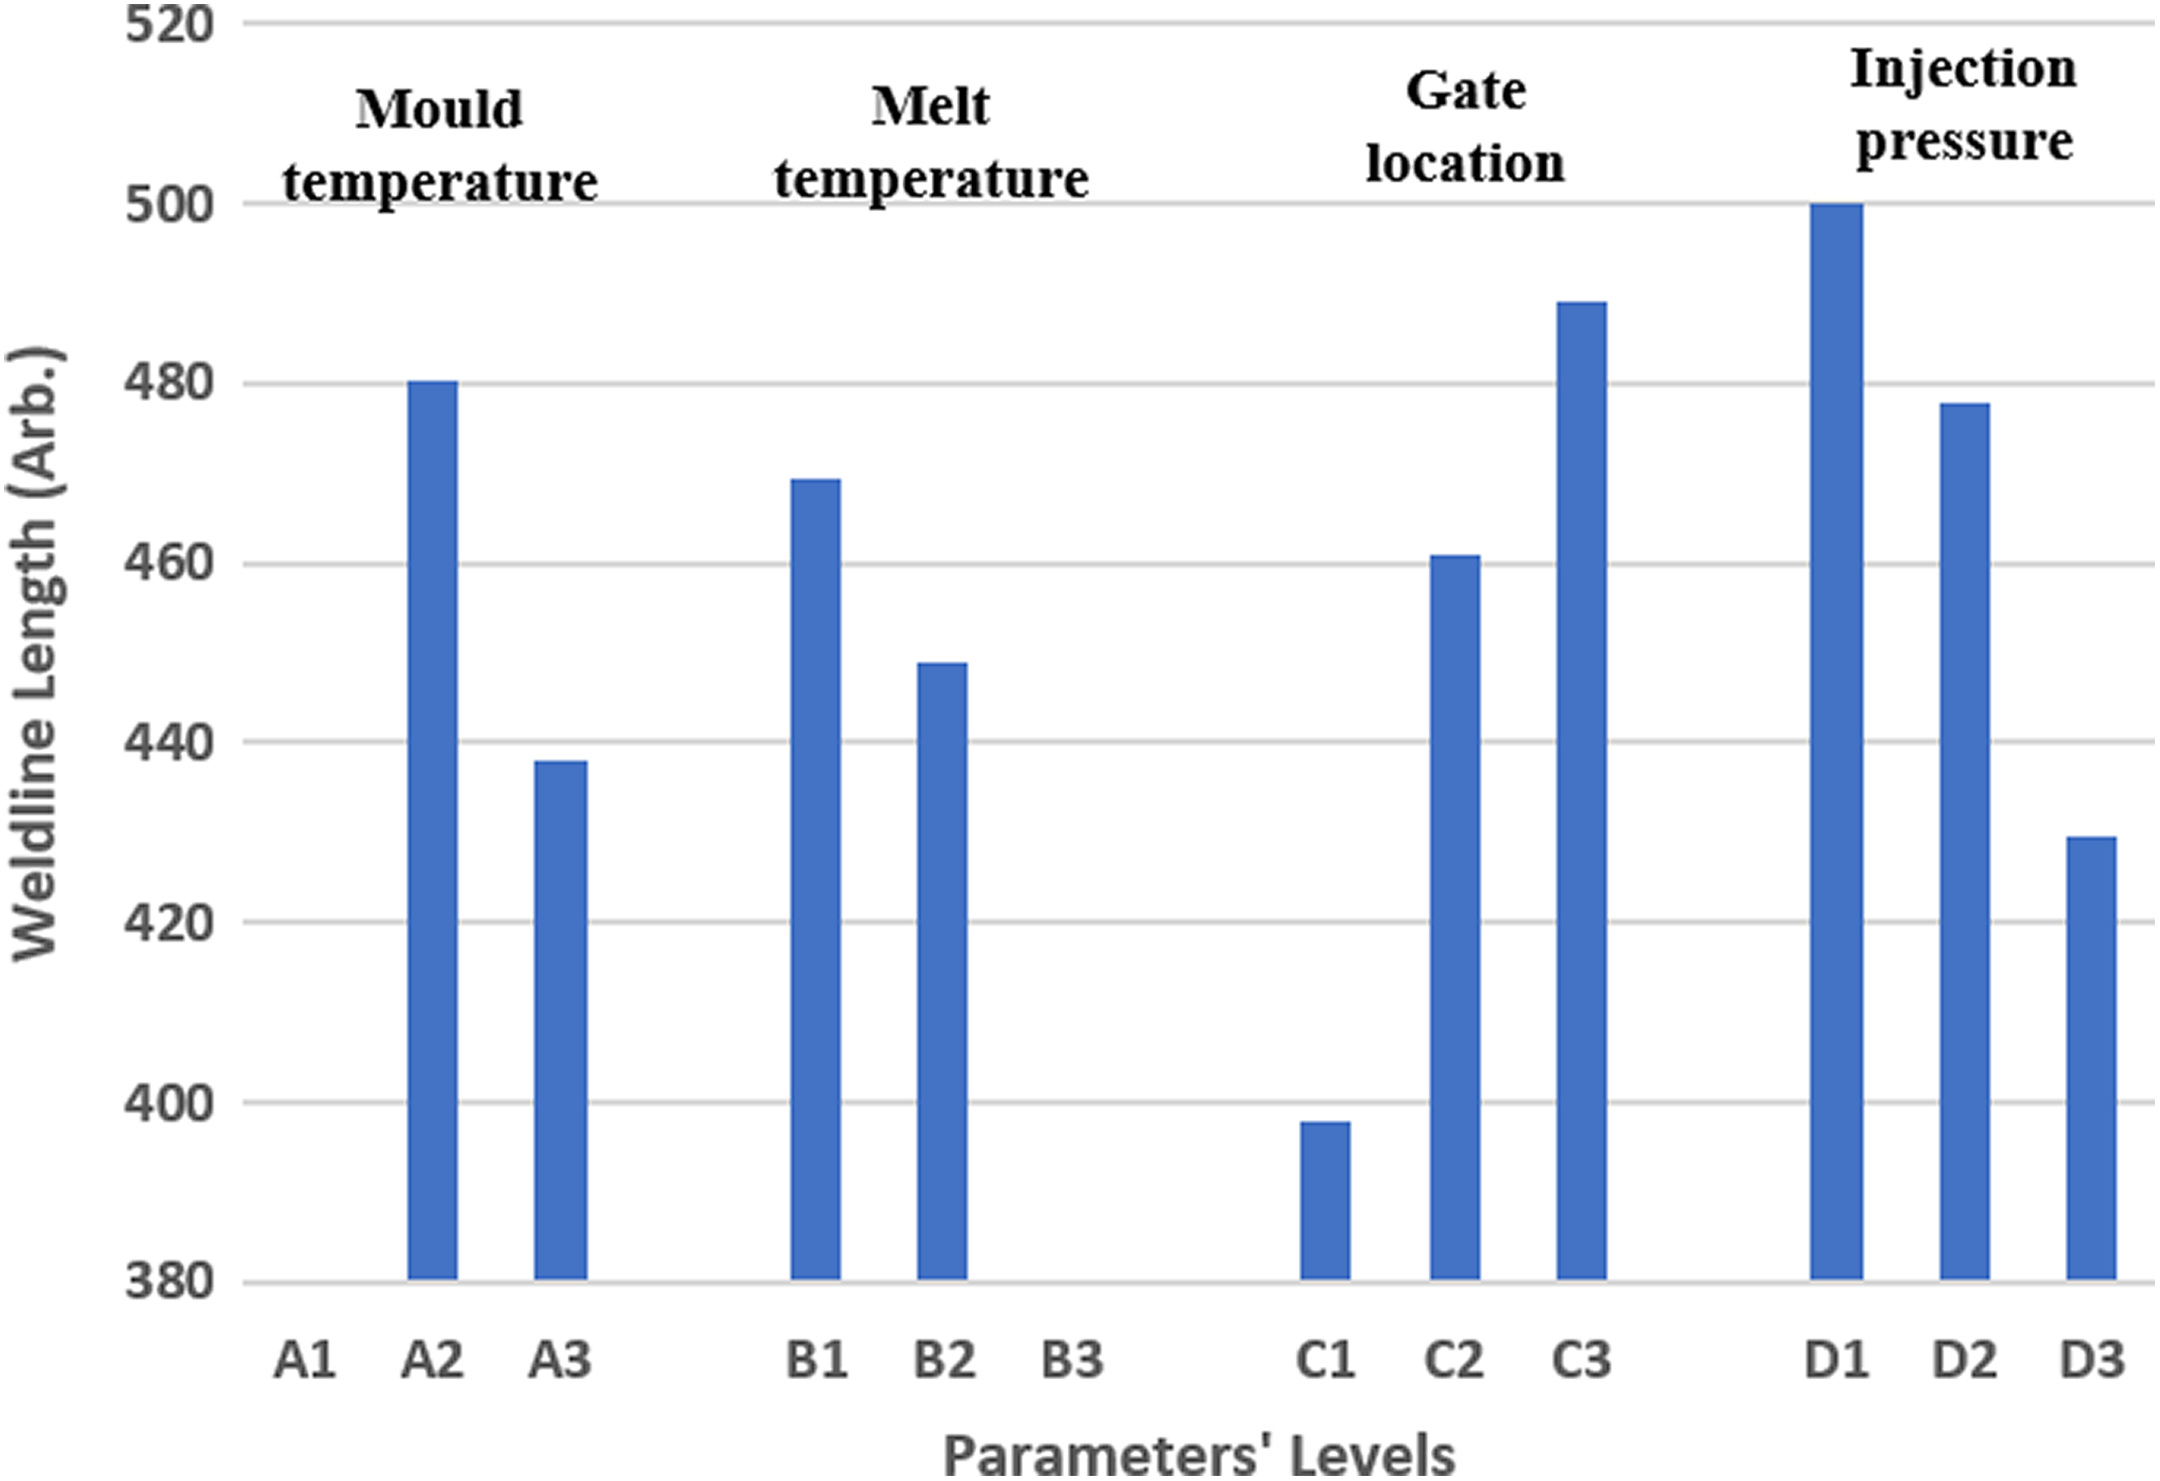
Graph showing main effects on weldline length accounting for incomplete fill.
Fibre orientation tensor
The fibre orientation tensor result from Moldflow indicates the principal direction of the fibres within the material at each location on the surface of the component, along with a value indicating the probability the fibres lie in this direction. The probability value can be thought of as confidence level (p-value). p Values are used for the confidence of fill, this is where moldflow takes the nodal system from the mesh, then calculates the probability of that fibre being orientated from the direction of the flow (principal direction). If it believes this to be true, then 1 is used. If not, or the probability is low, then it uses a value closer to 0. The direction of the fibres is indicated by a coloured line on the geometry of the component, while the colour of the line indicates the probability value of the fibre actually lying in that direction. A typical fibre orientation tensor result can be seen in Figure 8, a red colour indicates a high level of confidence (p = 1), while the blue colours indicate a lower level of confidence (p = 0).
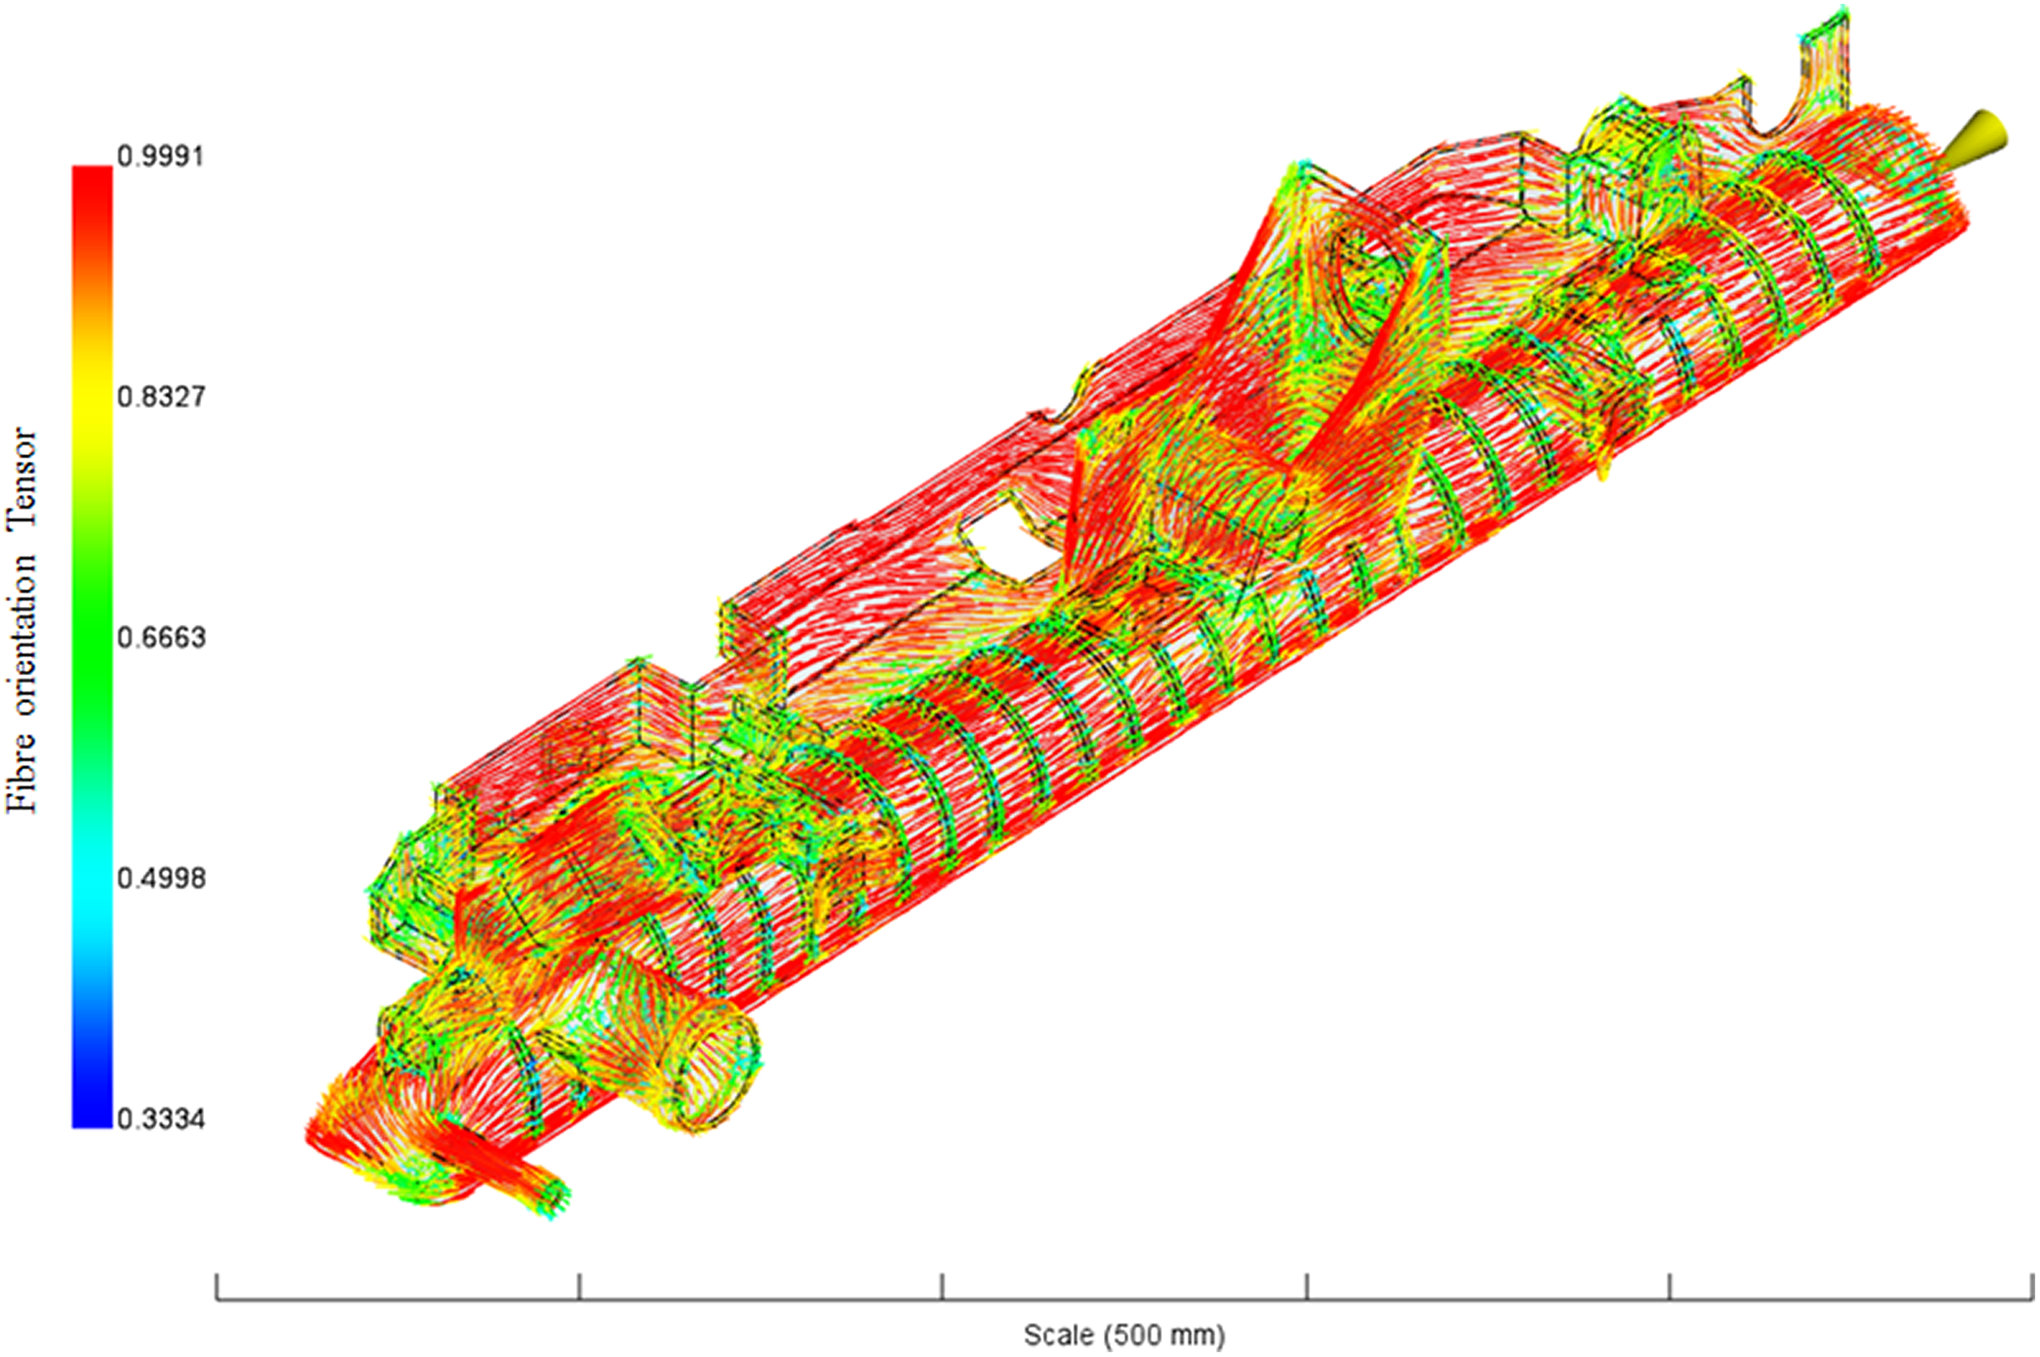
Typical fibre orientation tensor result.
Moreover, the fibre orientation tensor result from MoldFlow displays fibre orientation along every element in every layer of the mesh. The fibre orientation tensor result is for each element on each layer of the 3-D mesh (recommended for thick parts) so it shows internal fibre orientations as well as on the skin. Therefore, the fibre orientation tensor along the thickness is averaged and then shown at the surface.
Optical microscopy
To obtain detailed images of the fibre orientation, a Keyance (UK) VHX optical microscope was used. Significant representative in the component was sectioned and mounted for optical microscopy to allow a comparison of fibre orientation and weldline location to be made to determine the actual location of the injection points on the component. The location shown in Figure 9 (top) was chosen as a significant difference in the fibre orientation and weldline locations was identified through the simulations, as shown in Figure 9 (middle) and (bottom), respectively. From this location, three samples were cut along the length of the hole, these were samples I, J and K, with sample I being nearest the outside of the component and sample K being nearest the centre.
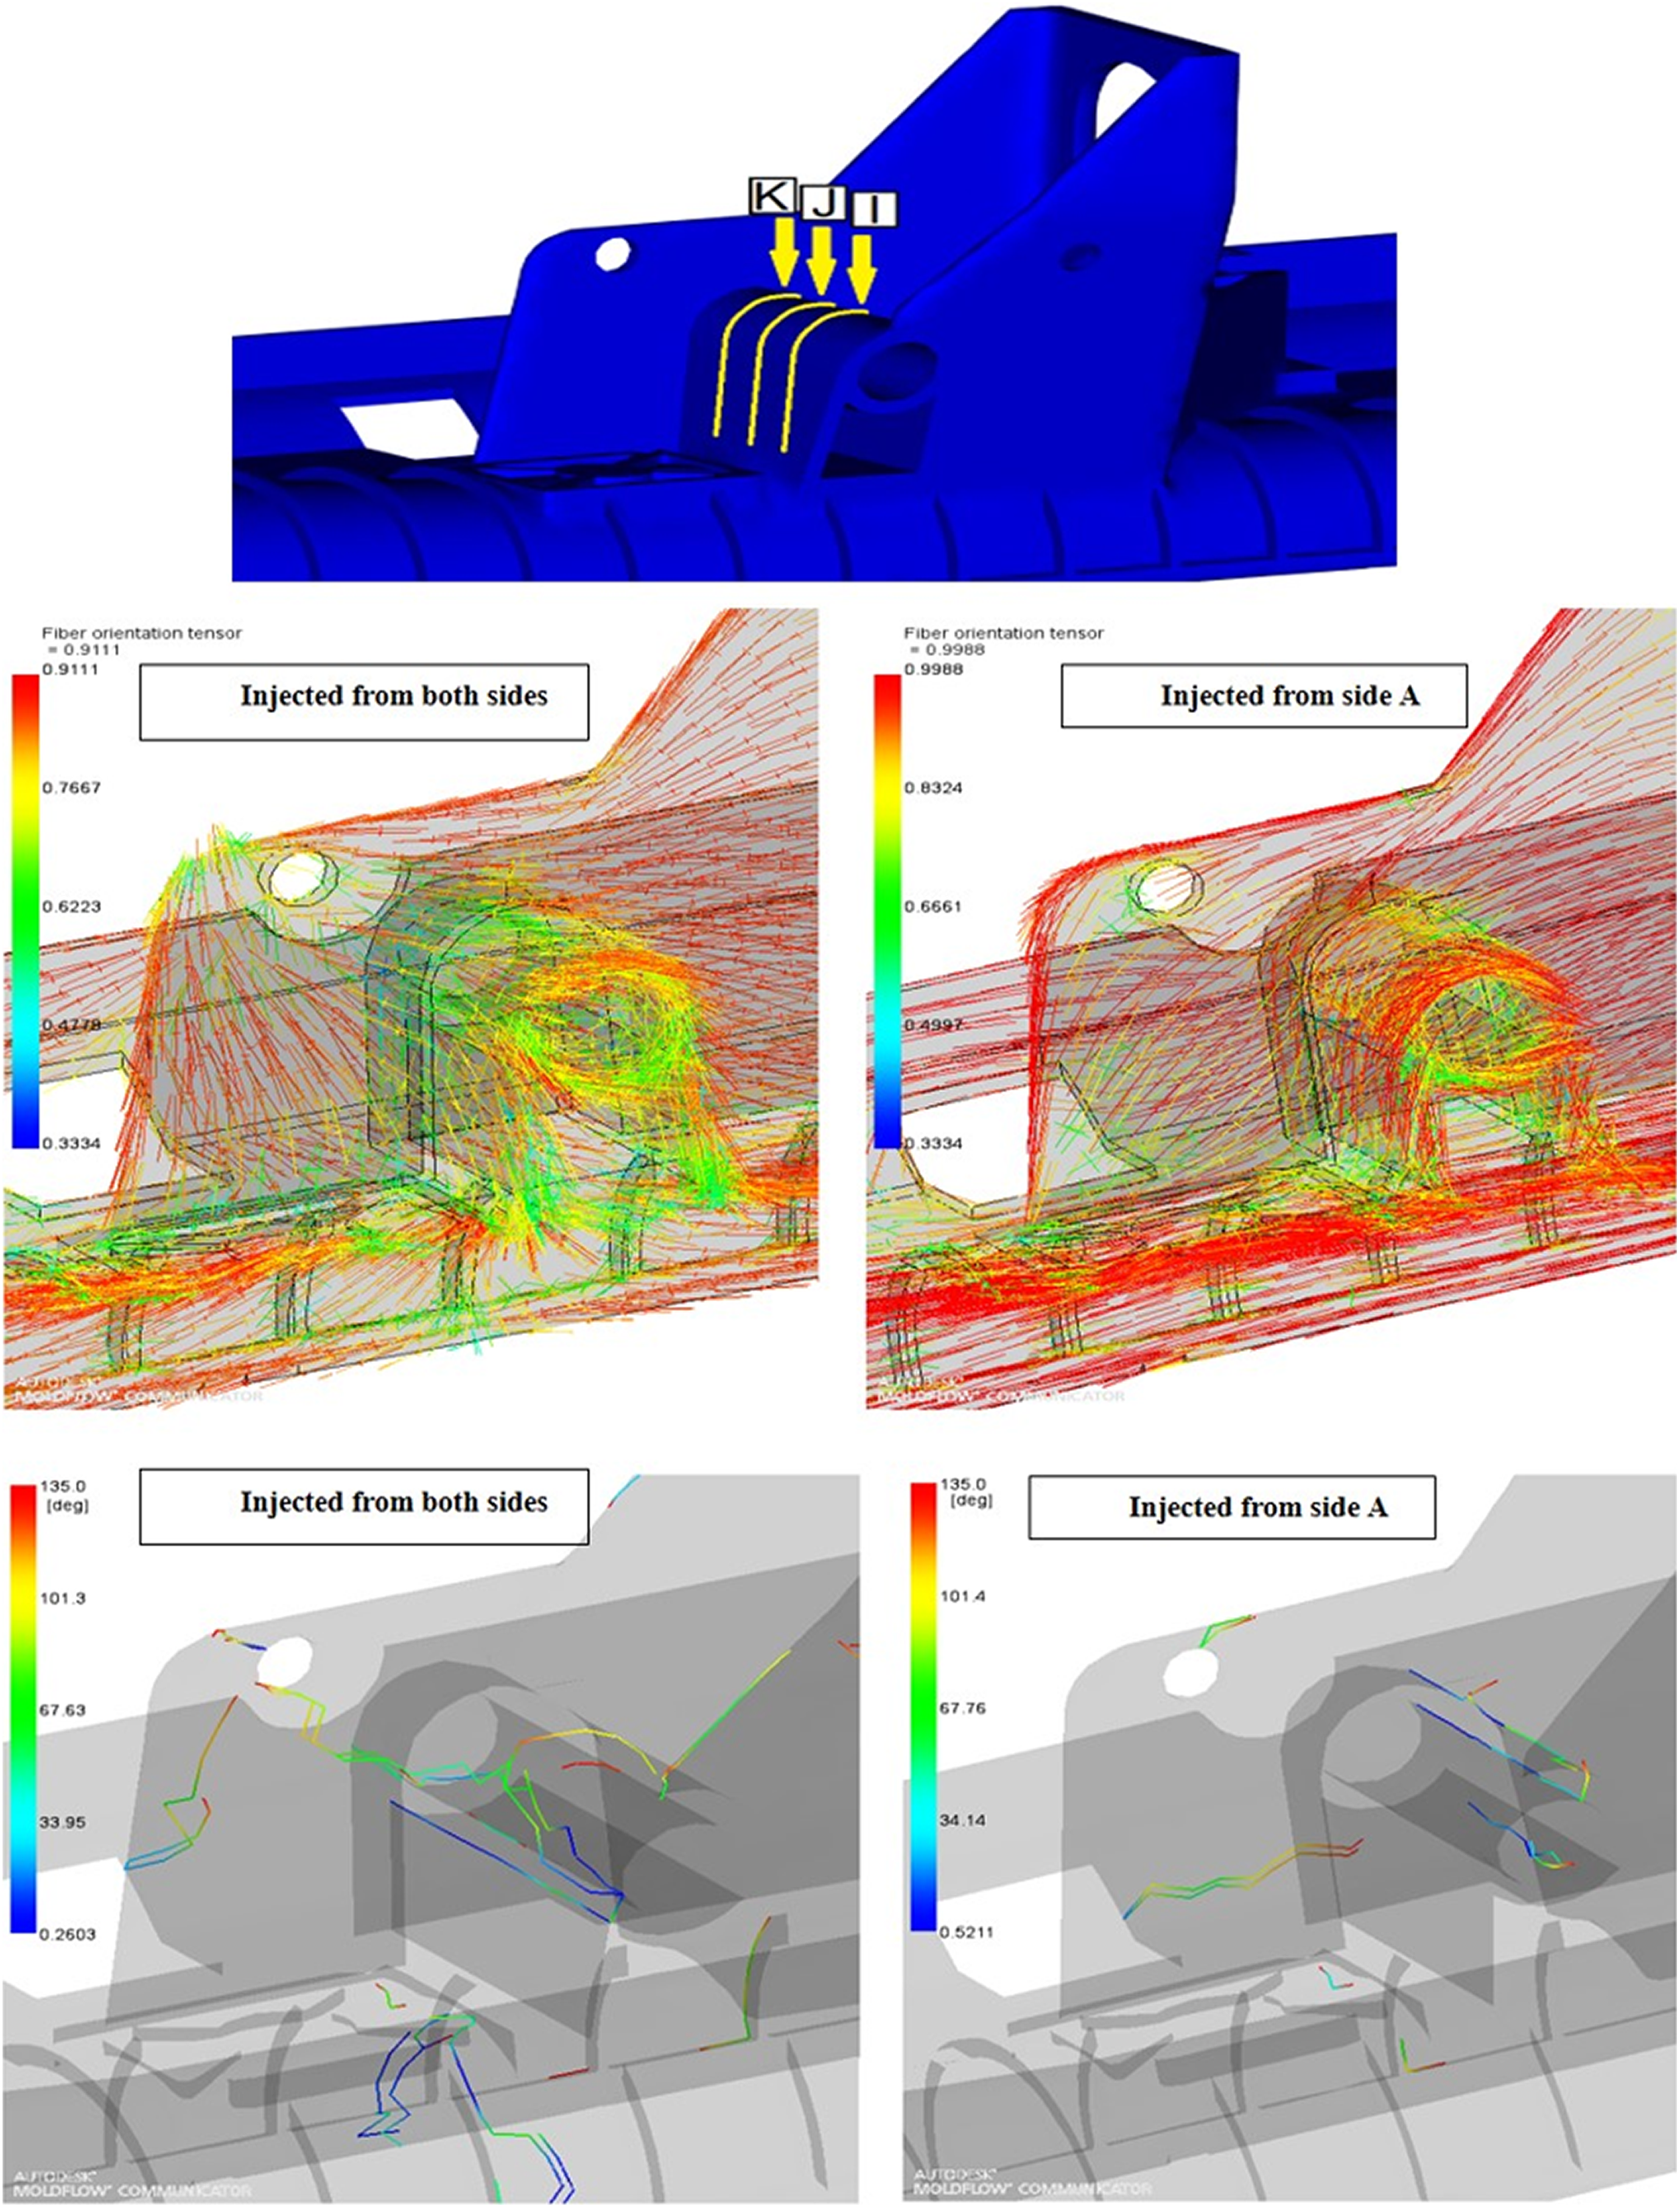
Location of samples I, J and K (top), fibre orientation tensor around samples I, J and K (middle) and weldlines around samples I, J and K (bottom).
From the images shown in Figure 10, it can be seen that the samples taken from the location shown in Figure 9 (top) contain pores in both the corner locations and approximately half way up one side, Figure 10 (top). The depth of the indications in the micrographs were measured to confirm them to be pores. This was achieved using the depth measurement function of the Keyance VHX-1000 digital optical microscope, Figure 10 (middle). As stated by several studies, 9 –14 pores occur in the vicinity of weldlines due to gas entrapment. The locations of these pores correlate well with the locations of the weldlines in the simulation where the component was injected from both sides. Similar structures were observed in the same location on all the components inspected. Since the fibre orientation tensor along the thickness is averaged and then shown at the surface, so using this as a comparison between simulation and micrographs is valid. From the micrograph in Figure 10 (bottom), the direction of the two flow fronts is indicated by the arrows. The fibre orientation in this location can be seen to correlate with the simulation where the component was injected from both sides. From this, it can be inferred that the mould is filled from two injection points, one at each end of the component. Due to the thickness of the material in this location, it is easier to observe and quantify the pores when the component is cut and viewed from the X-direction, along the length of the component, as the samples can be cut thicker and ground and polished deeper into the sample; whereas due to the thickness of the component, viewing in the Y- or Z-direction will only show features near to the surface of the part.
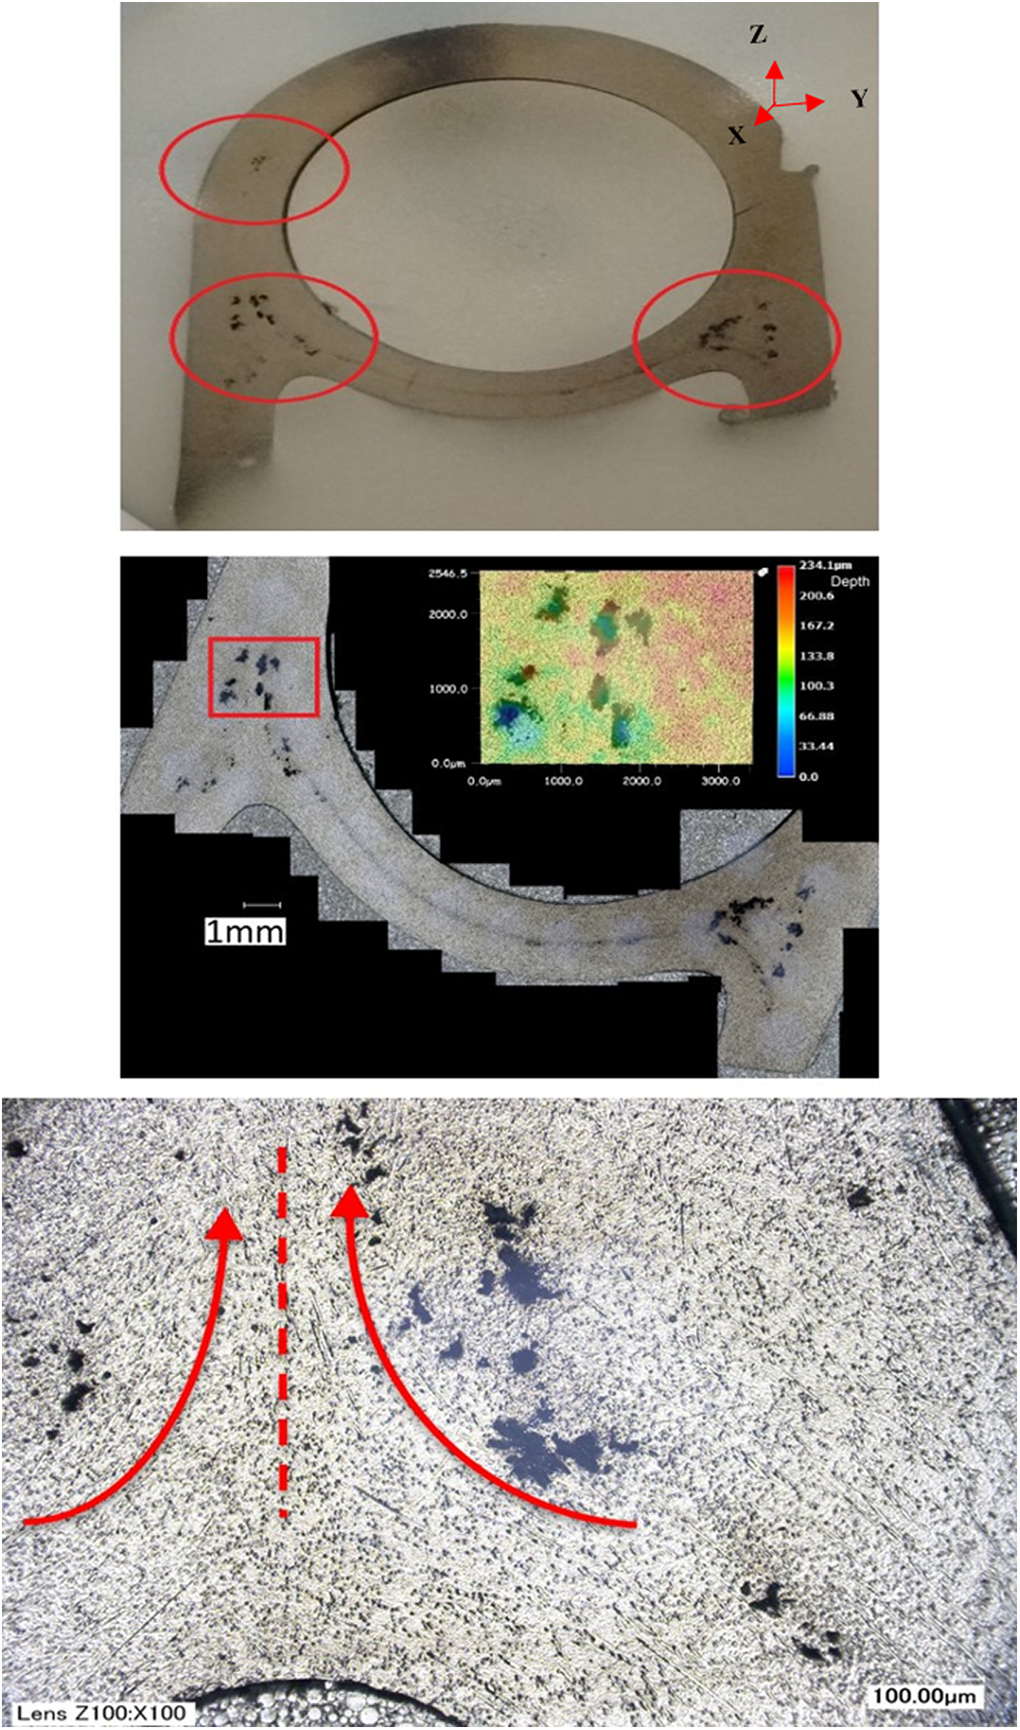
Sample K showing locations of pores (top), stitched optical microscopic image showing pores in sample K with false colour image showing depth of pores (middle) and weldline formation in sample K with the two flow fronts inferred from the fibre directions (bottom).
A second sample location was chosen on the tab near samples I, J and K; this sample location, HZ, is shown in Figure 11 (top). A micrograph showing the fibre orientations in this location can be seen in Figure 11 (bottom). The weldline and fibre orientation tensor simulation results for this location can be seen in Figure 12. Comparing the fibre orientations in the micrograph with the fibre orientation tensor simulation results, it can be seen that the micrograph correlates well with the simulation injected from the nozzle end only. Unlike the sample taken from location K, where there were pores clearly visible, sample HZ does not have any visible weldlines. It is believed that this may be due to the thickness of the material in this location not being conducive to the formation of pores, but this needs more investigation. Third and fourth sample locations were chosen on the large nozzle as shown in Figure 13.
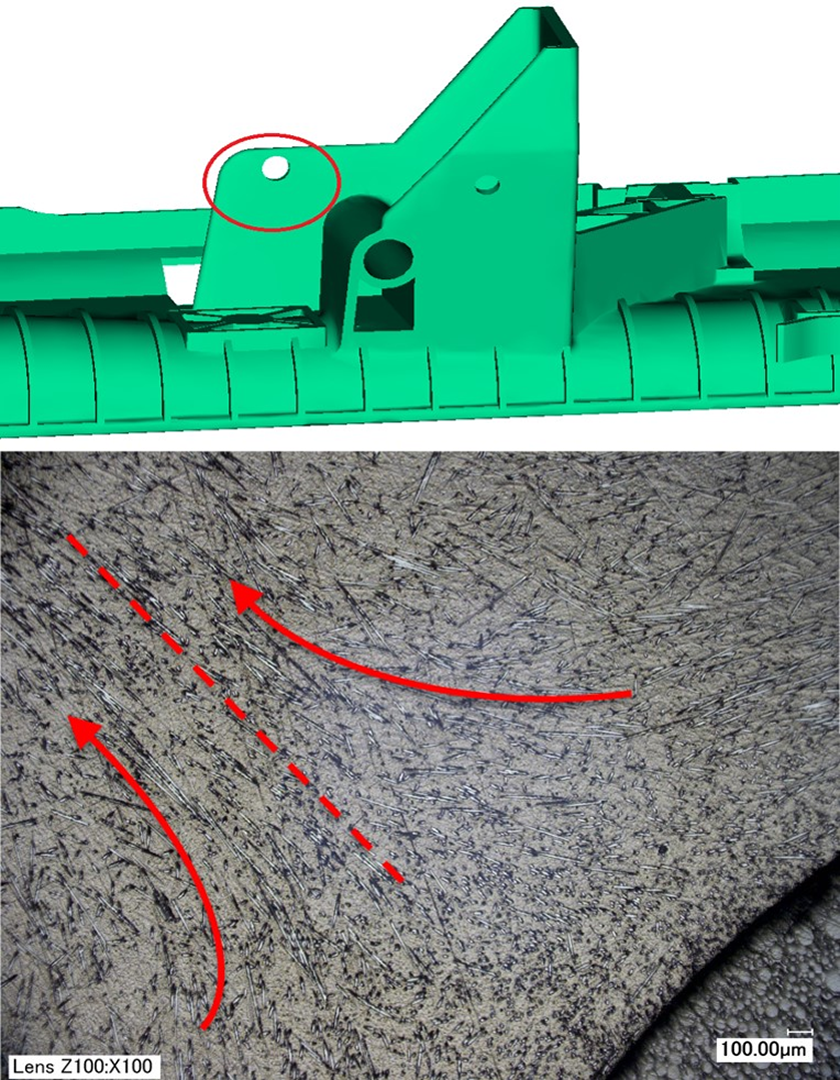
Location of sample HZ (top), and micrograph taken from sample HZ near the hole (bottom).
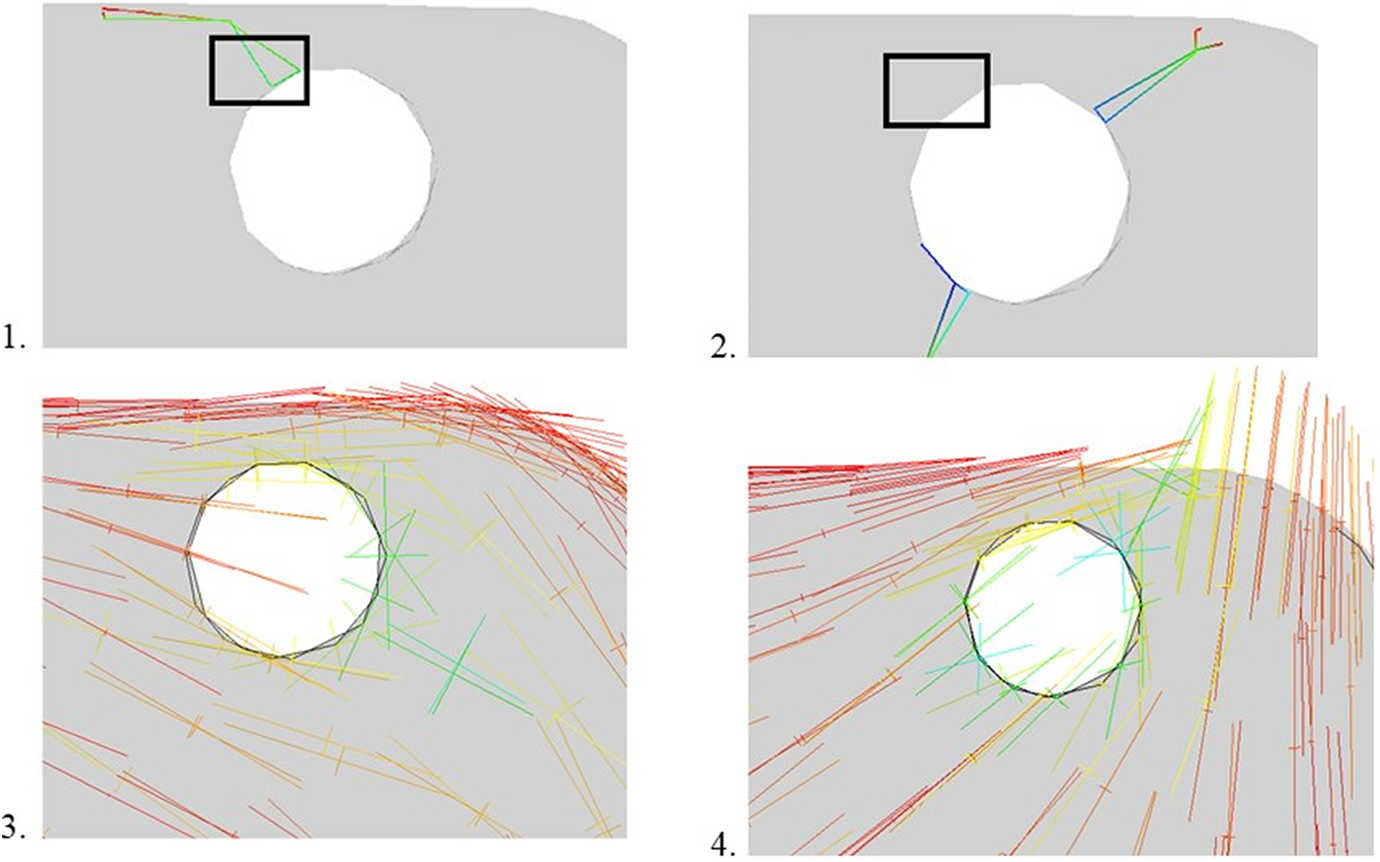
Sample HZ: 1. Weldline simulation results with the mould injected from the nozzle end only; 2. Weldline simulation results with the mould injected from both sides; 3. Fibre orientation tensor simulation results with the mould injected from the nozzle end only; and 4. Fibre orientation tensor results with the mould injected from both sides.
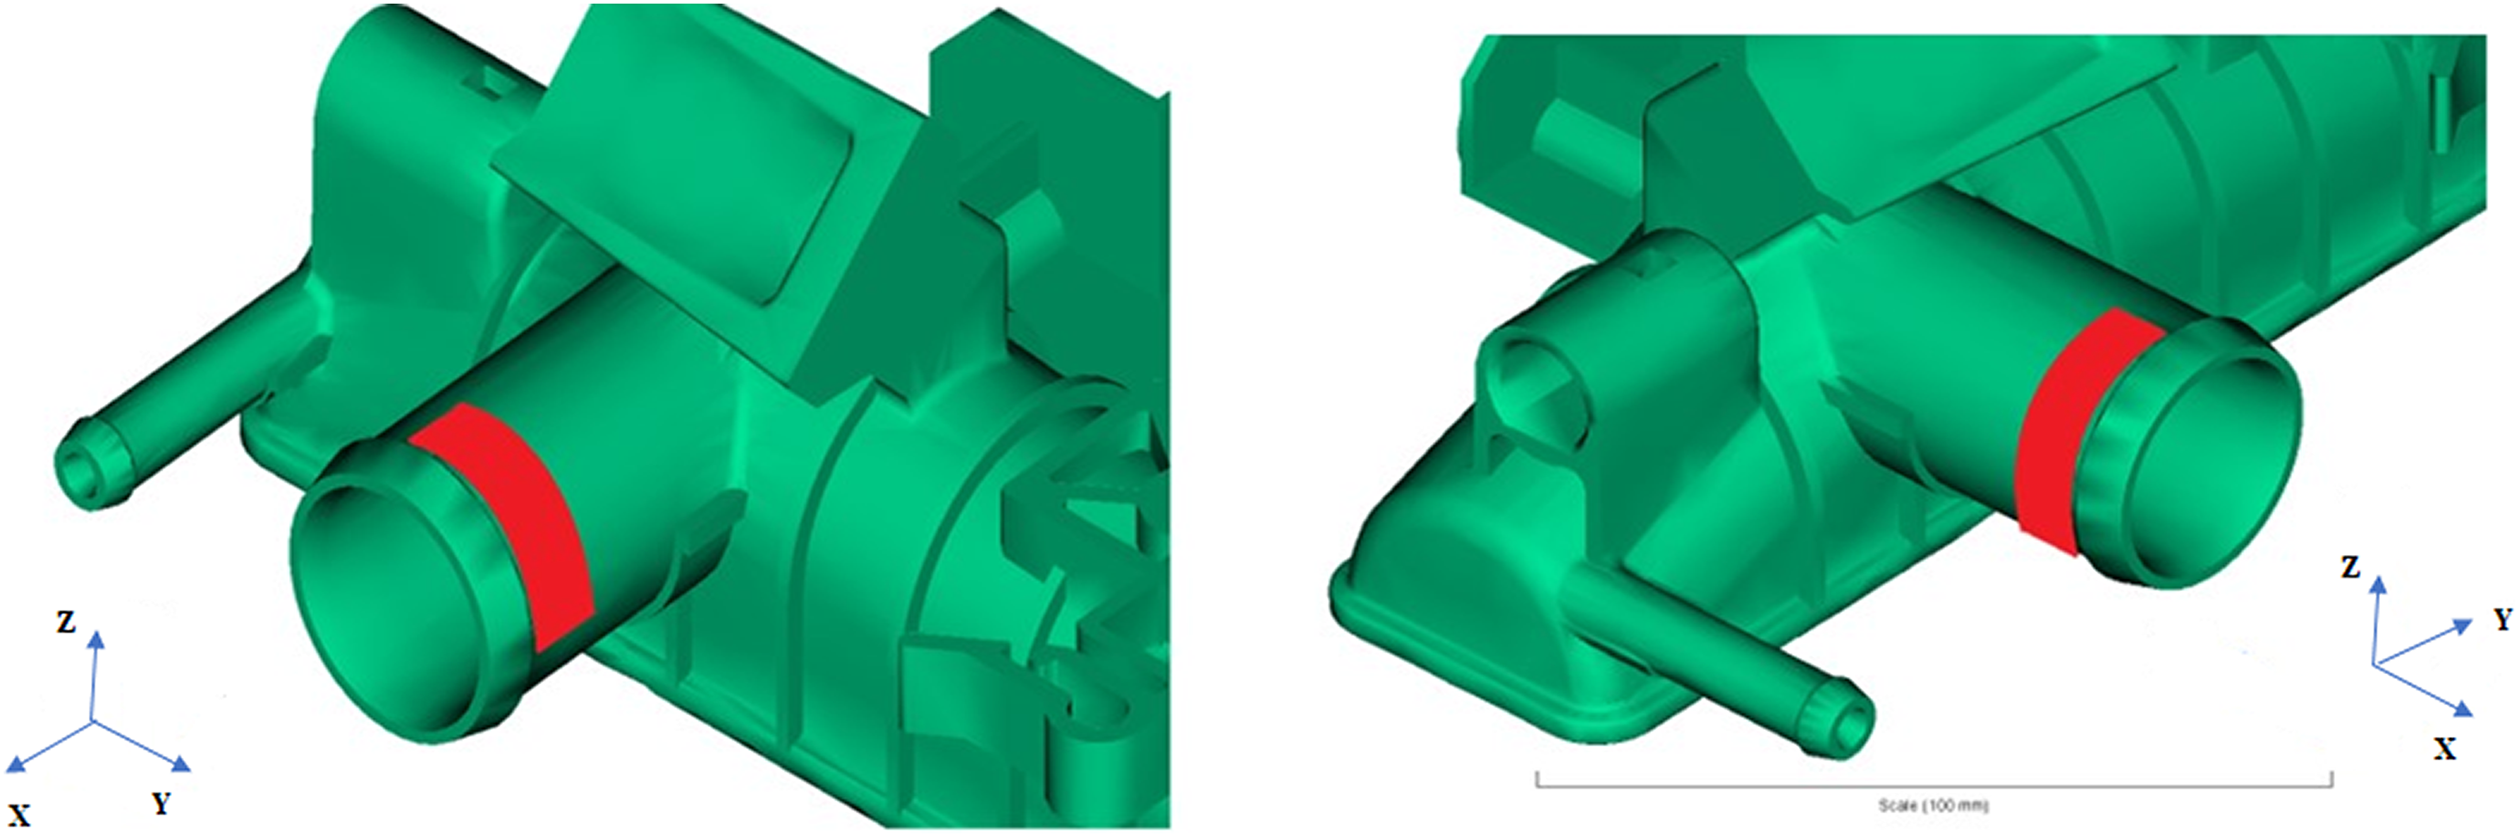
Sample A location (left) and sample B location (right).
From the micrograph shown in Figure 14 (top), it can be seen that the vast majority of the fibres in this location are oriented longitudinally along the nozzle as only circular cross sections of the fibres are visible in the micrographs. Similarly, for sample BX, the micrograph in Figure 14 (bottom) shows mainly the circular cross sections of the fibres, but approximately half way along the sample the fibres change in direction and it can be seen in between the red lines of Figure 14. This can also be seen in the fibre orientation tensor simulation results where a good correlation between the optical microscopy and the simulation results is evident. The line is where the edge of the sample meets the resin of the sample mount.
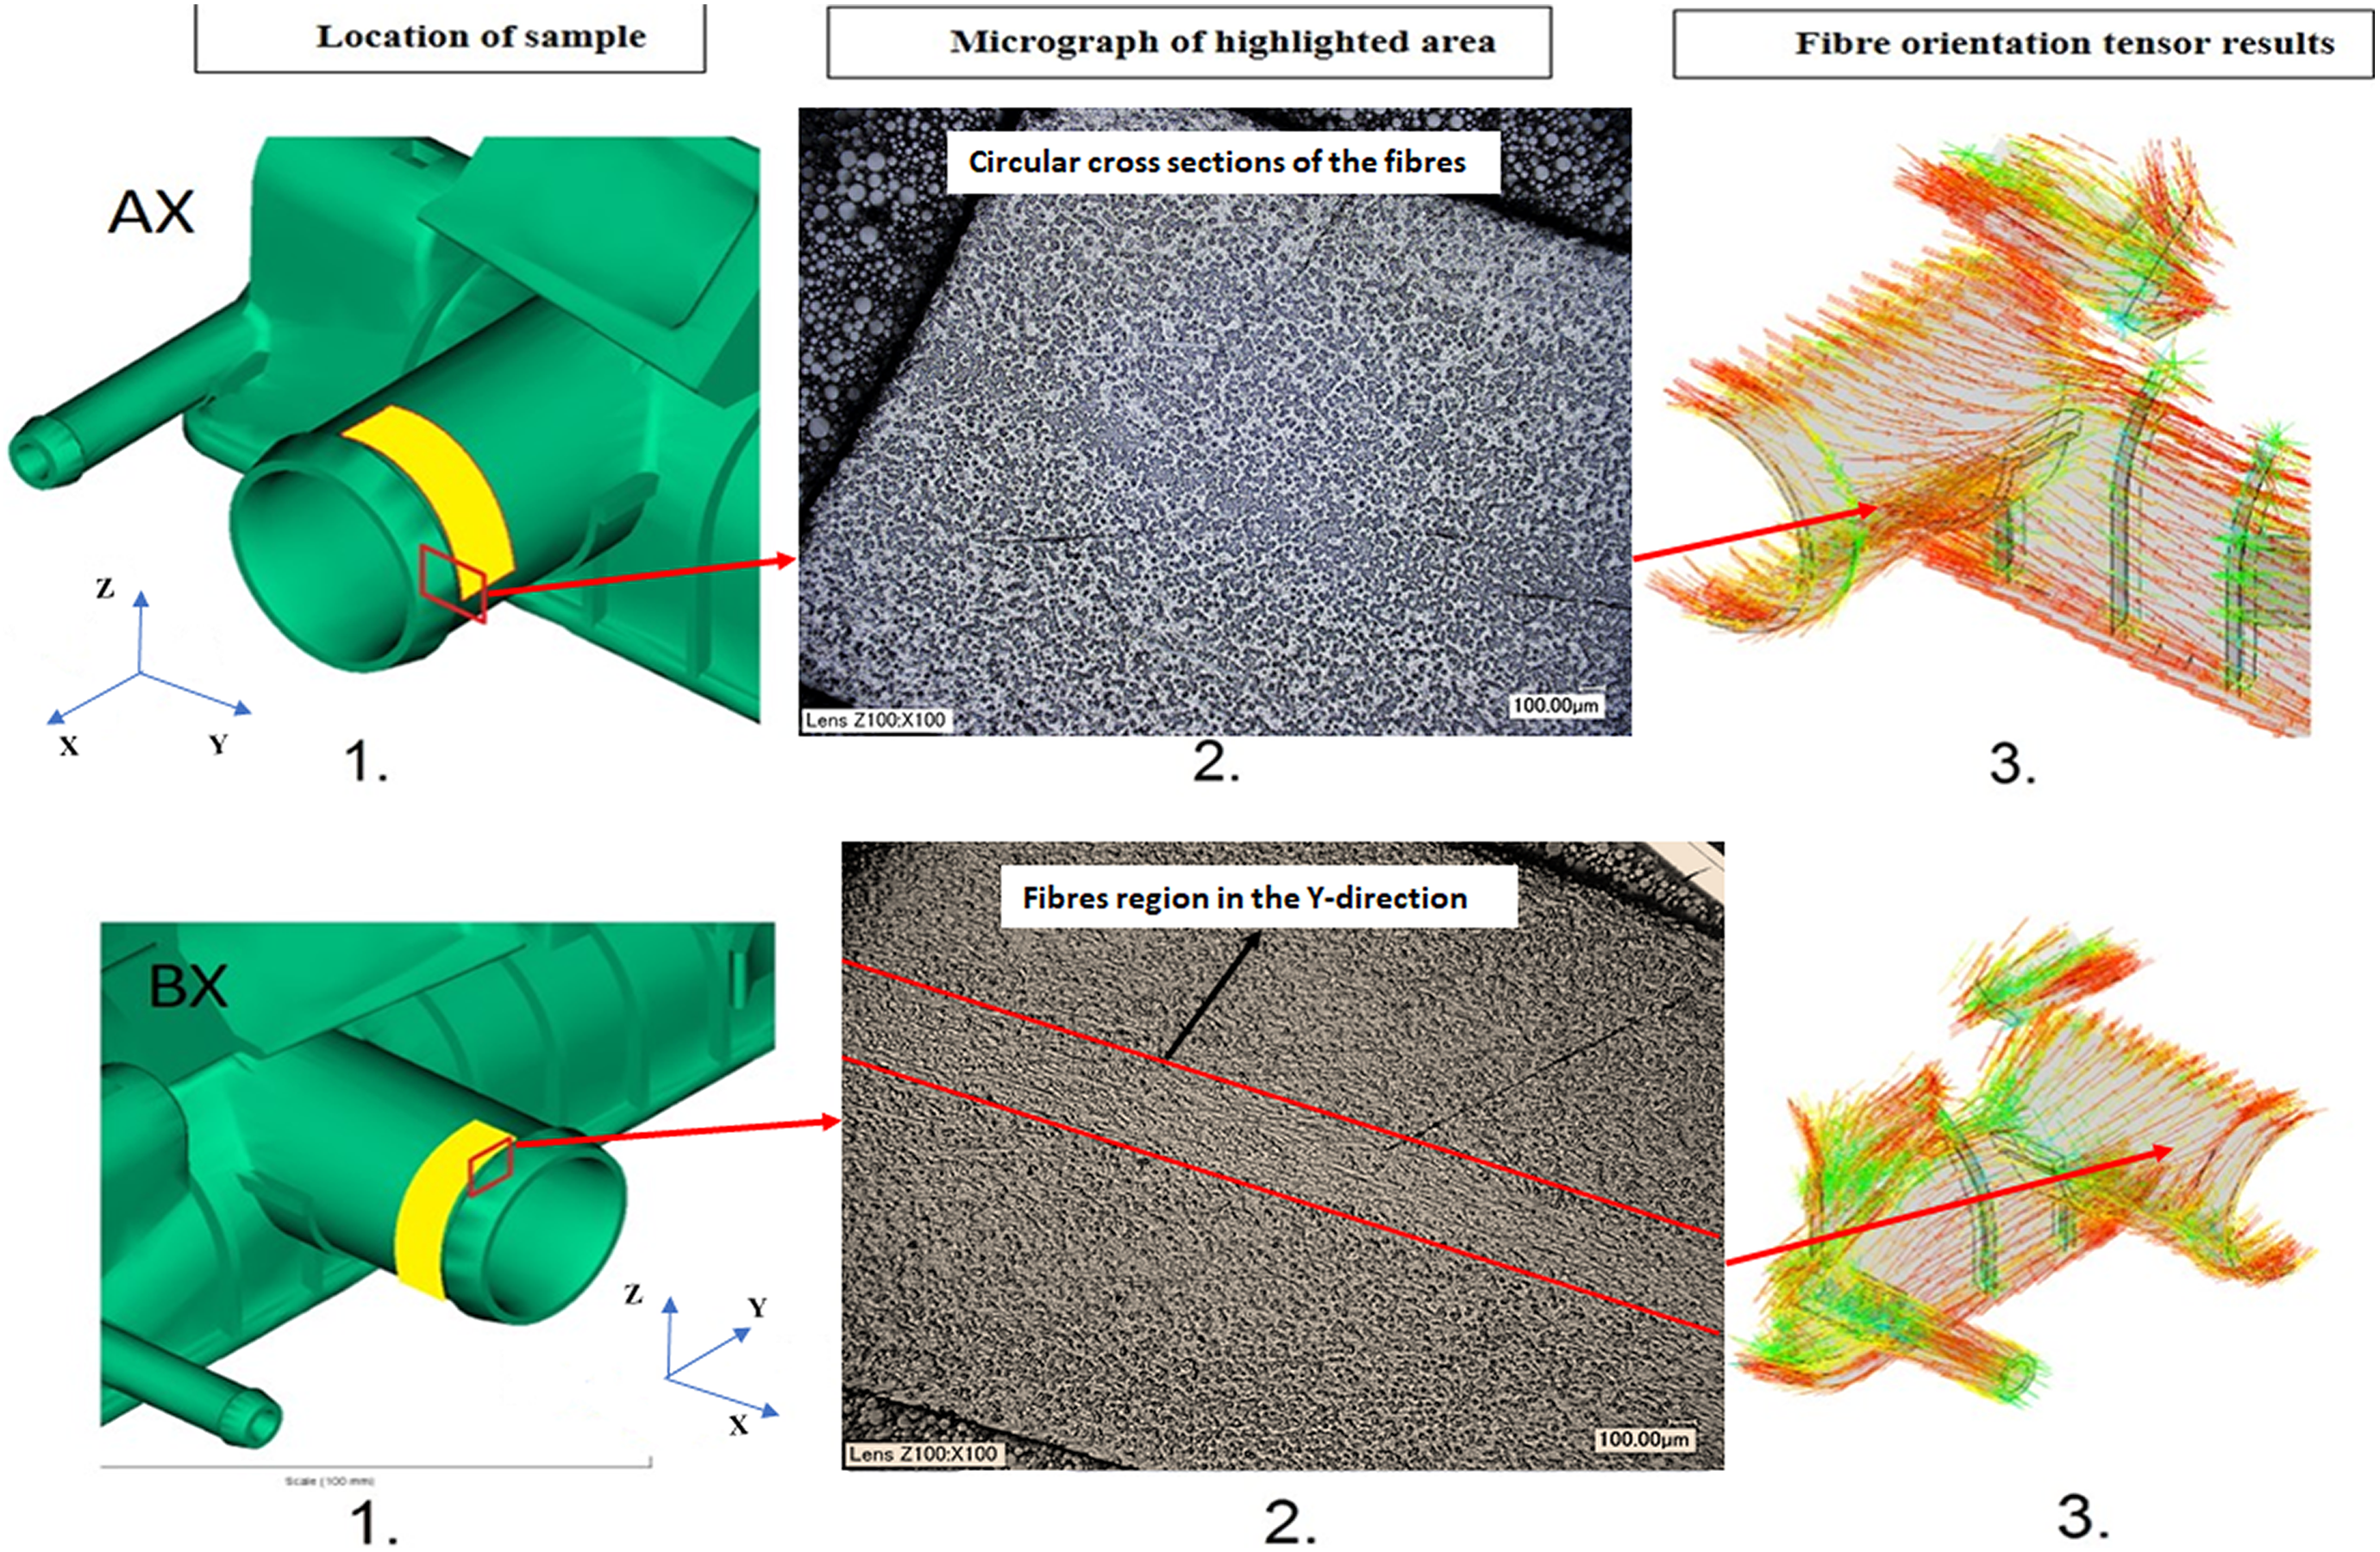
Location of sample, micrograph of highlighted area and fibre orientation tensor results for AX (top) and BX (bottom).
Optimization
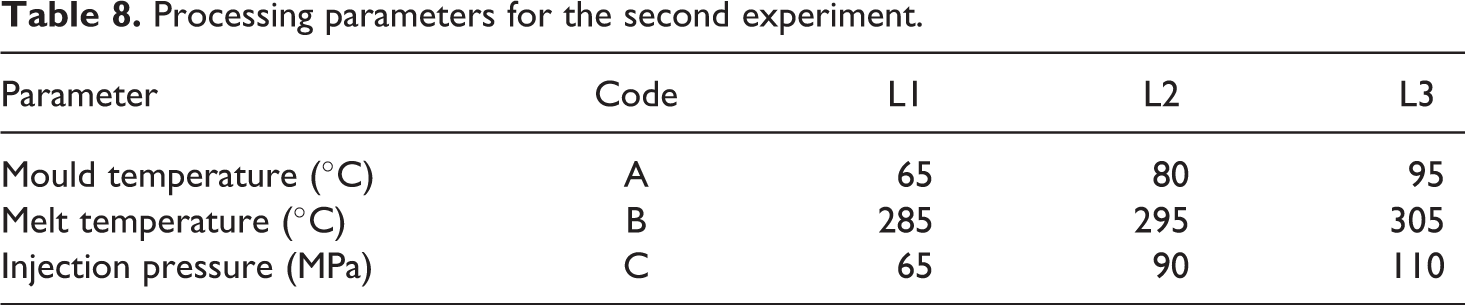
As it has been deduced the component was injected from both ends, a second Taguchi designed parametric study was conducted to optimize the manufacturing process in respect of the total weldline length within the component and the time to fill the mould. The chosen processing parameters are given in Table 8. As before, the simulations were run using MoldFlow Insight with a full 3D mesh containing 900,976 tetrahedrons to describe the geometry of the component.
Processing parameters for the second experiment.
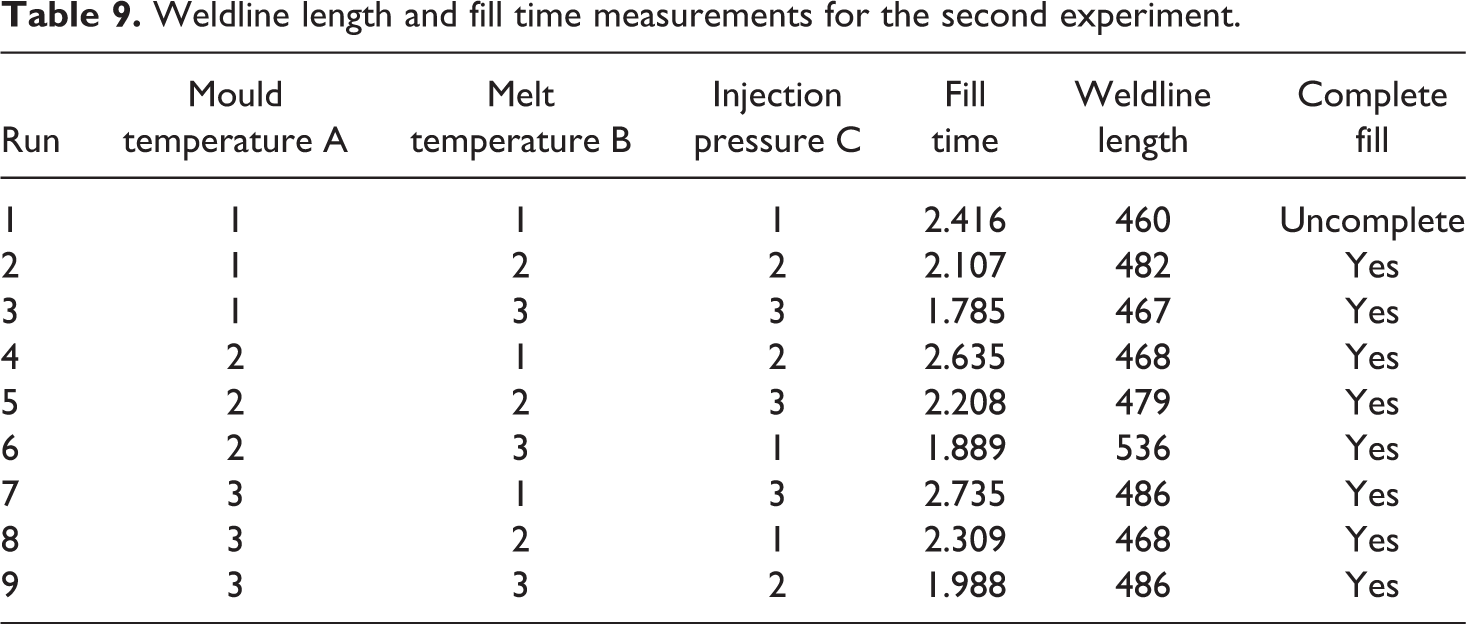
The orthogonal array used for the study is the same L9 array used previously but without changing the gate location. The weldline length and the fill time results from these simulations can be seen in Table 9. The main effects plots can be seen in the graphs shown in Figure 15 (top) and (bottom), respectively. Table 10 gives the optimum parameters for minimum weldline length and minimum fill time. In addition, an analysis of variance utilizing a general linear model (Table 11) was conducted to determine the statistical significance of each processing parameter on the resulting weldline length and fill time.
Weldline length and fill time measurements for the second experiment.
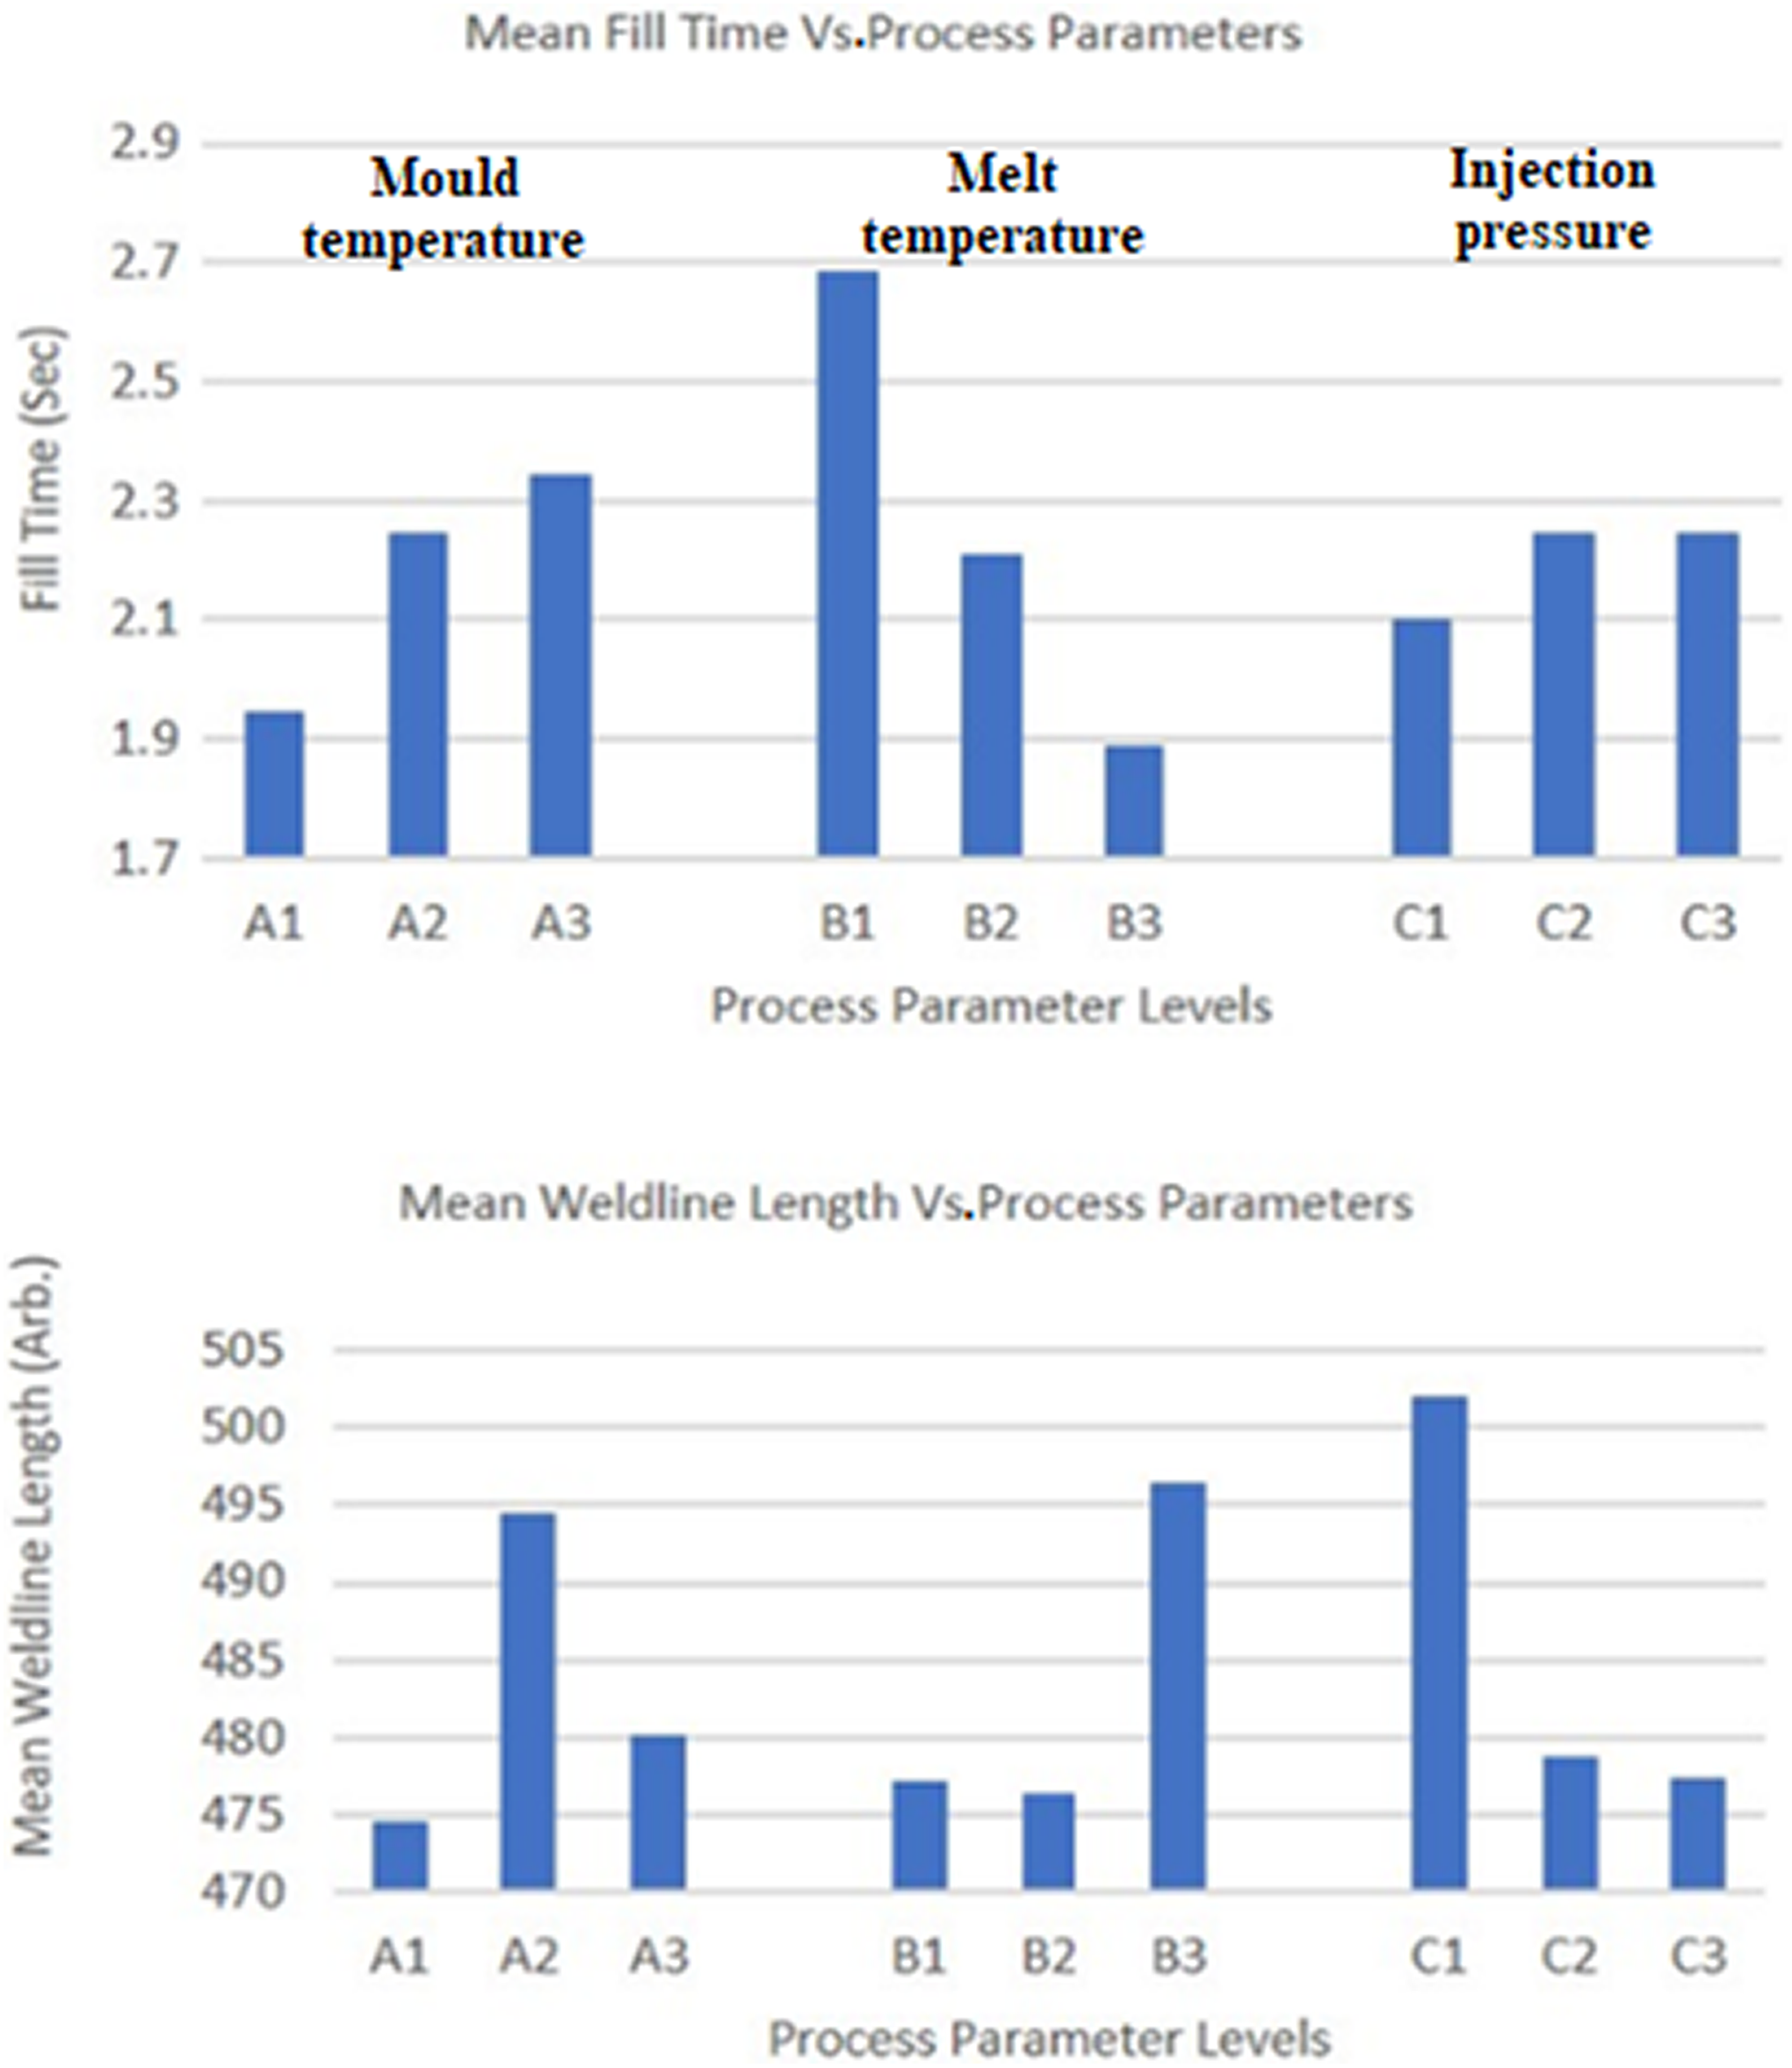
Graphs showing main effects on fill time (top), and main effects on weldline length (bottom).
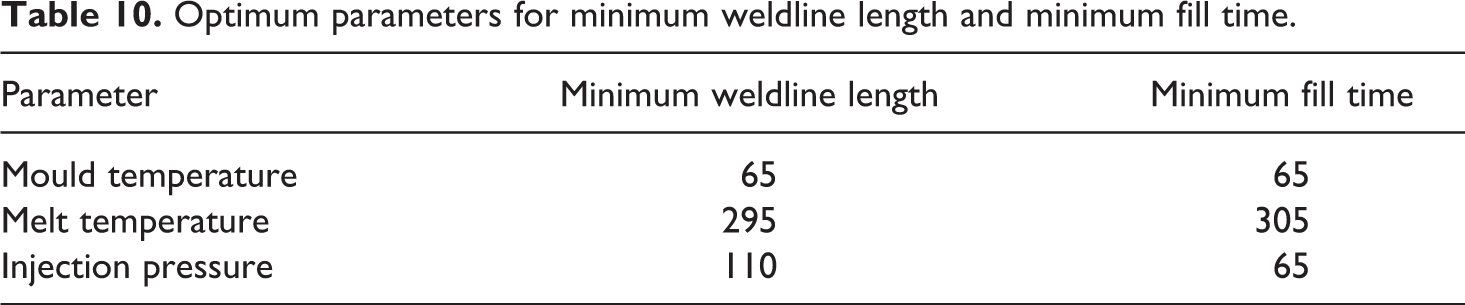
Optimum parameters for minimum weldline length and minimum fill time.
Analysis of variance.
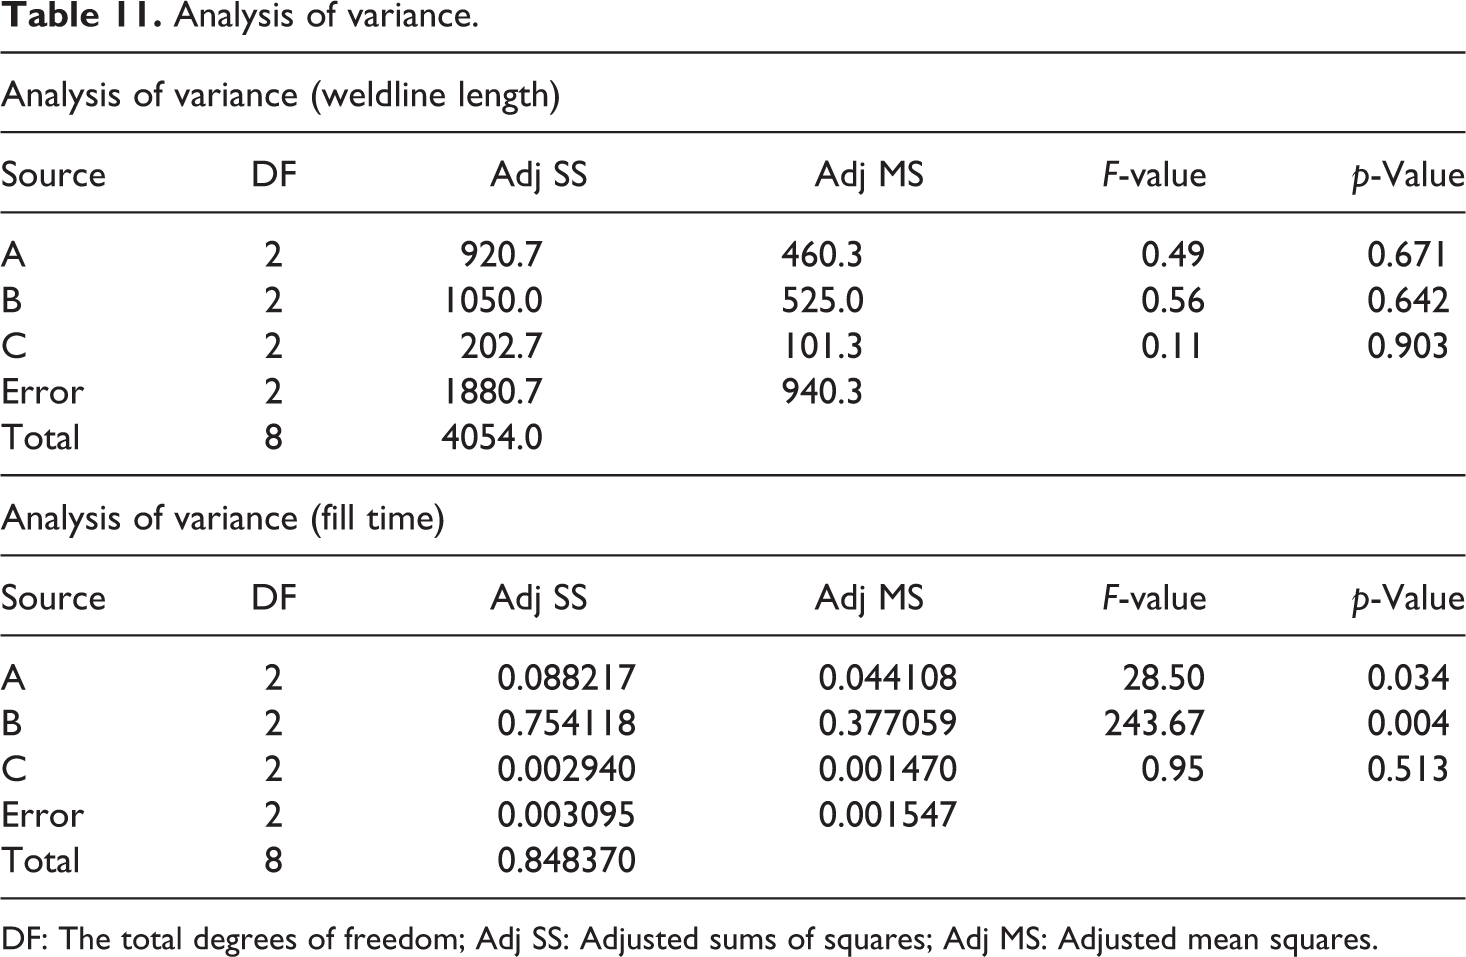
DF: The total degrees of freedom; Adj SS: Adjusted sums of squares; Adj MS: Adjusted mean squares.
Discussion
From the results of the first parametric study, it can be seen that the optimum parameters for a minimum weldline length and the optimum parameters for a minimum fill time are not going to be the same for each variable. Using the data in Figure 7, for a minimized weldline length, the parameters should be A3 – Mould temperature = 90°C. B2 – Melt temperature = 275°C. C1 – Gate location = End A. D3 – Injection pressure = 100 MPa.
This assumes that parameters B3 and A1 are equally responsible for causing the incomplete fill. As the parameter A1 corresponds to a mould temperature of 50°C and all experiments using this parameter resulted in an incomplete fill, it is feasible that the low mould temperature is responsible for the premature solidification of the material during the injection process. The parameter B3 corresponds to a melt temperature of 295°C; and in isolation, this should reduce the viscosity of the melt and needed injection pressure. It is a possibility that this parameter, tested in conjunction with the parameters D1 or D2, resulted in an incomplete filled mould due to the low injection pressures of parameters D1 and D2.
From the analysis of variance study (Table 11), it can be concluded that when optimizing the process to reduce both the weldline length and fill time, melt temperature statistically has the highest influence when compared to mould temperature and injection pressure.
As the large nozzle near end A of the component where the hose connection to the engine is clamped on, extra forces are exerted on this region and as a result the strength of this area is of importance. Therefore, this area was examined in more detail.
From the weldline images shown in Figure 16, it can be seen that the weldline length along the large nozzle is similar between the two experiments, but the two flow fronts meet at a much lower angle in experiment 4. This is most likely due to the location of the gate in relation to the nozzle, combined with the reduced temperature of the flow front following the 4.23 s of extra time in the mould during experiment 4, due to reduced melt and mould temperature. The cooler plastic in experiment 4 will not meld as well as the hotter melt in experiment 8 yielding to a weaker weldline. From the fibre orientation tensor images in Figure 16, it can be seen that the fibres in the region of the weldline are more uniformly oriented in experiment 8 than they are in experiment 4, this will also improve the strength of the weldline in experiment 8, compared to experiment 4.
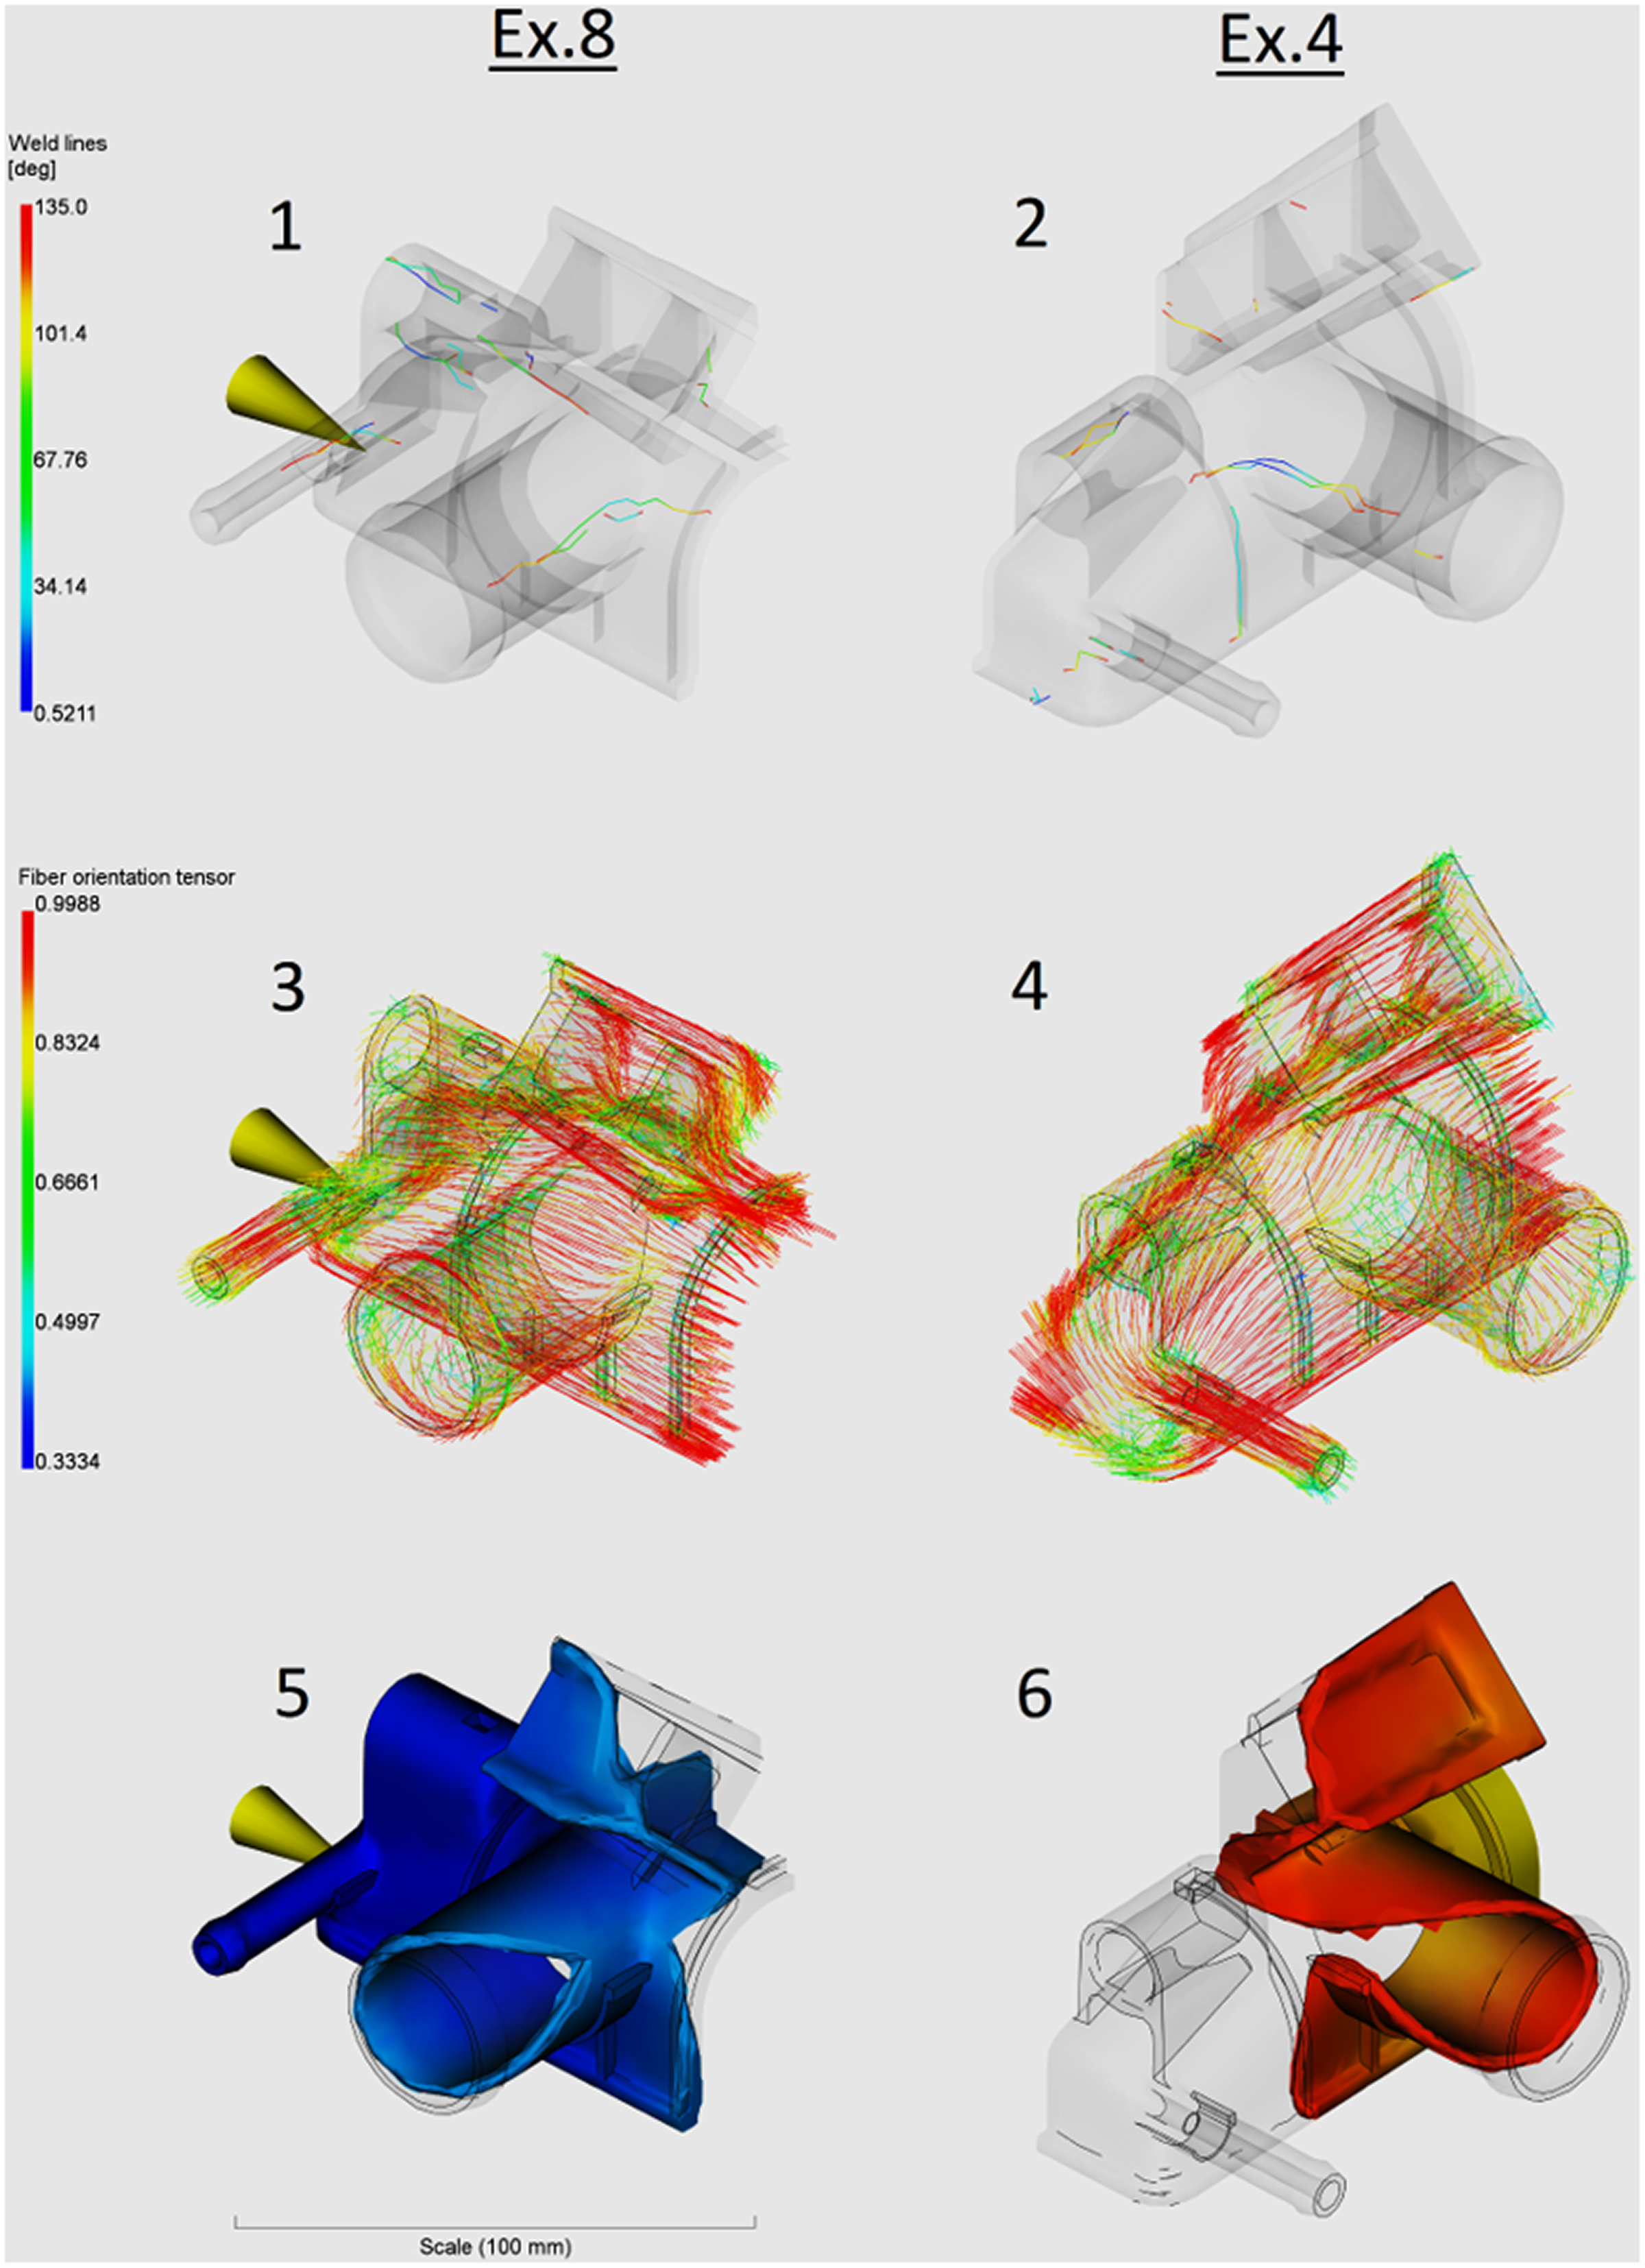
Nozzle area from experiment numbers 4 and 8: 1. Weldline locations from experiment number 8; 2. Weldline locations from experiment number 4; 3. Fibre orientation tensor from experiment number 8; 4. Fibre orientation tensor from experiment number 4; 5. Plastic flow after 0.6378 s for experiment number 8; and 6. Plastic flow after 4.871 s for experiment number 4.
When focusing on the same region of the component using the process parameters as manufactured and the material manufacturer’s recommended parameters, as shown in Figure 17, it can be seen that only subtle differences between the two are visible. From this, it can be deduced that the as manufactured component will have similar physical properties to the component if it was manufactured using the material manufacturer’s recommended parameters. This is because they show a similar filling pattern.
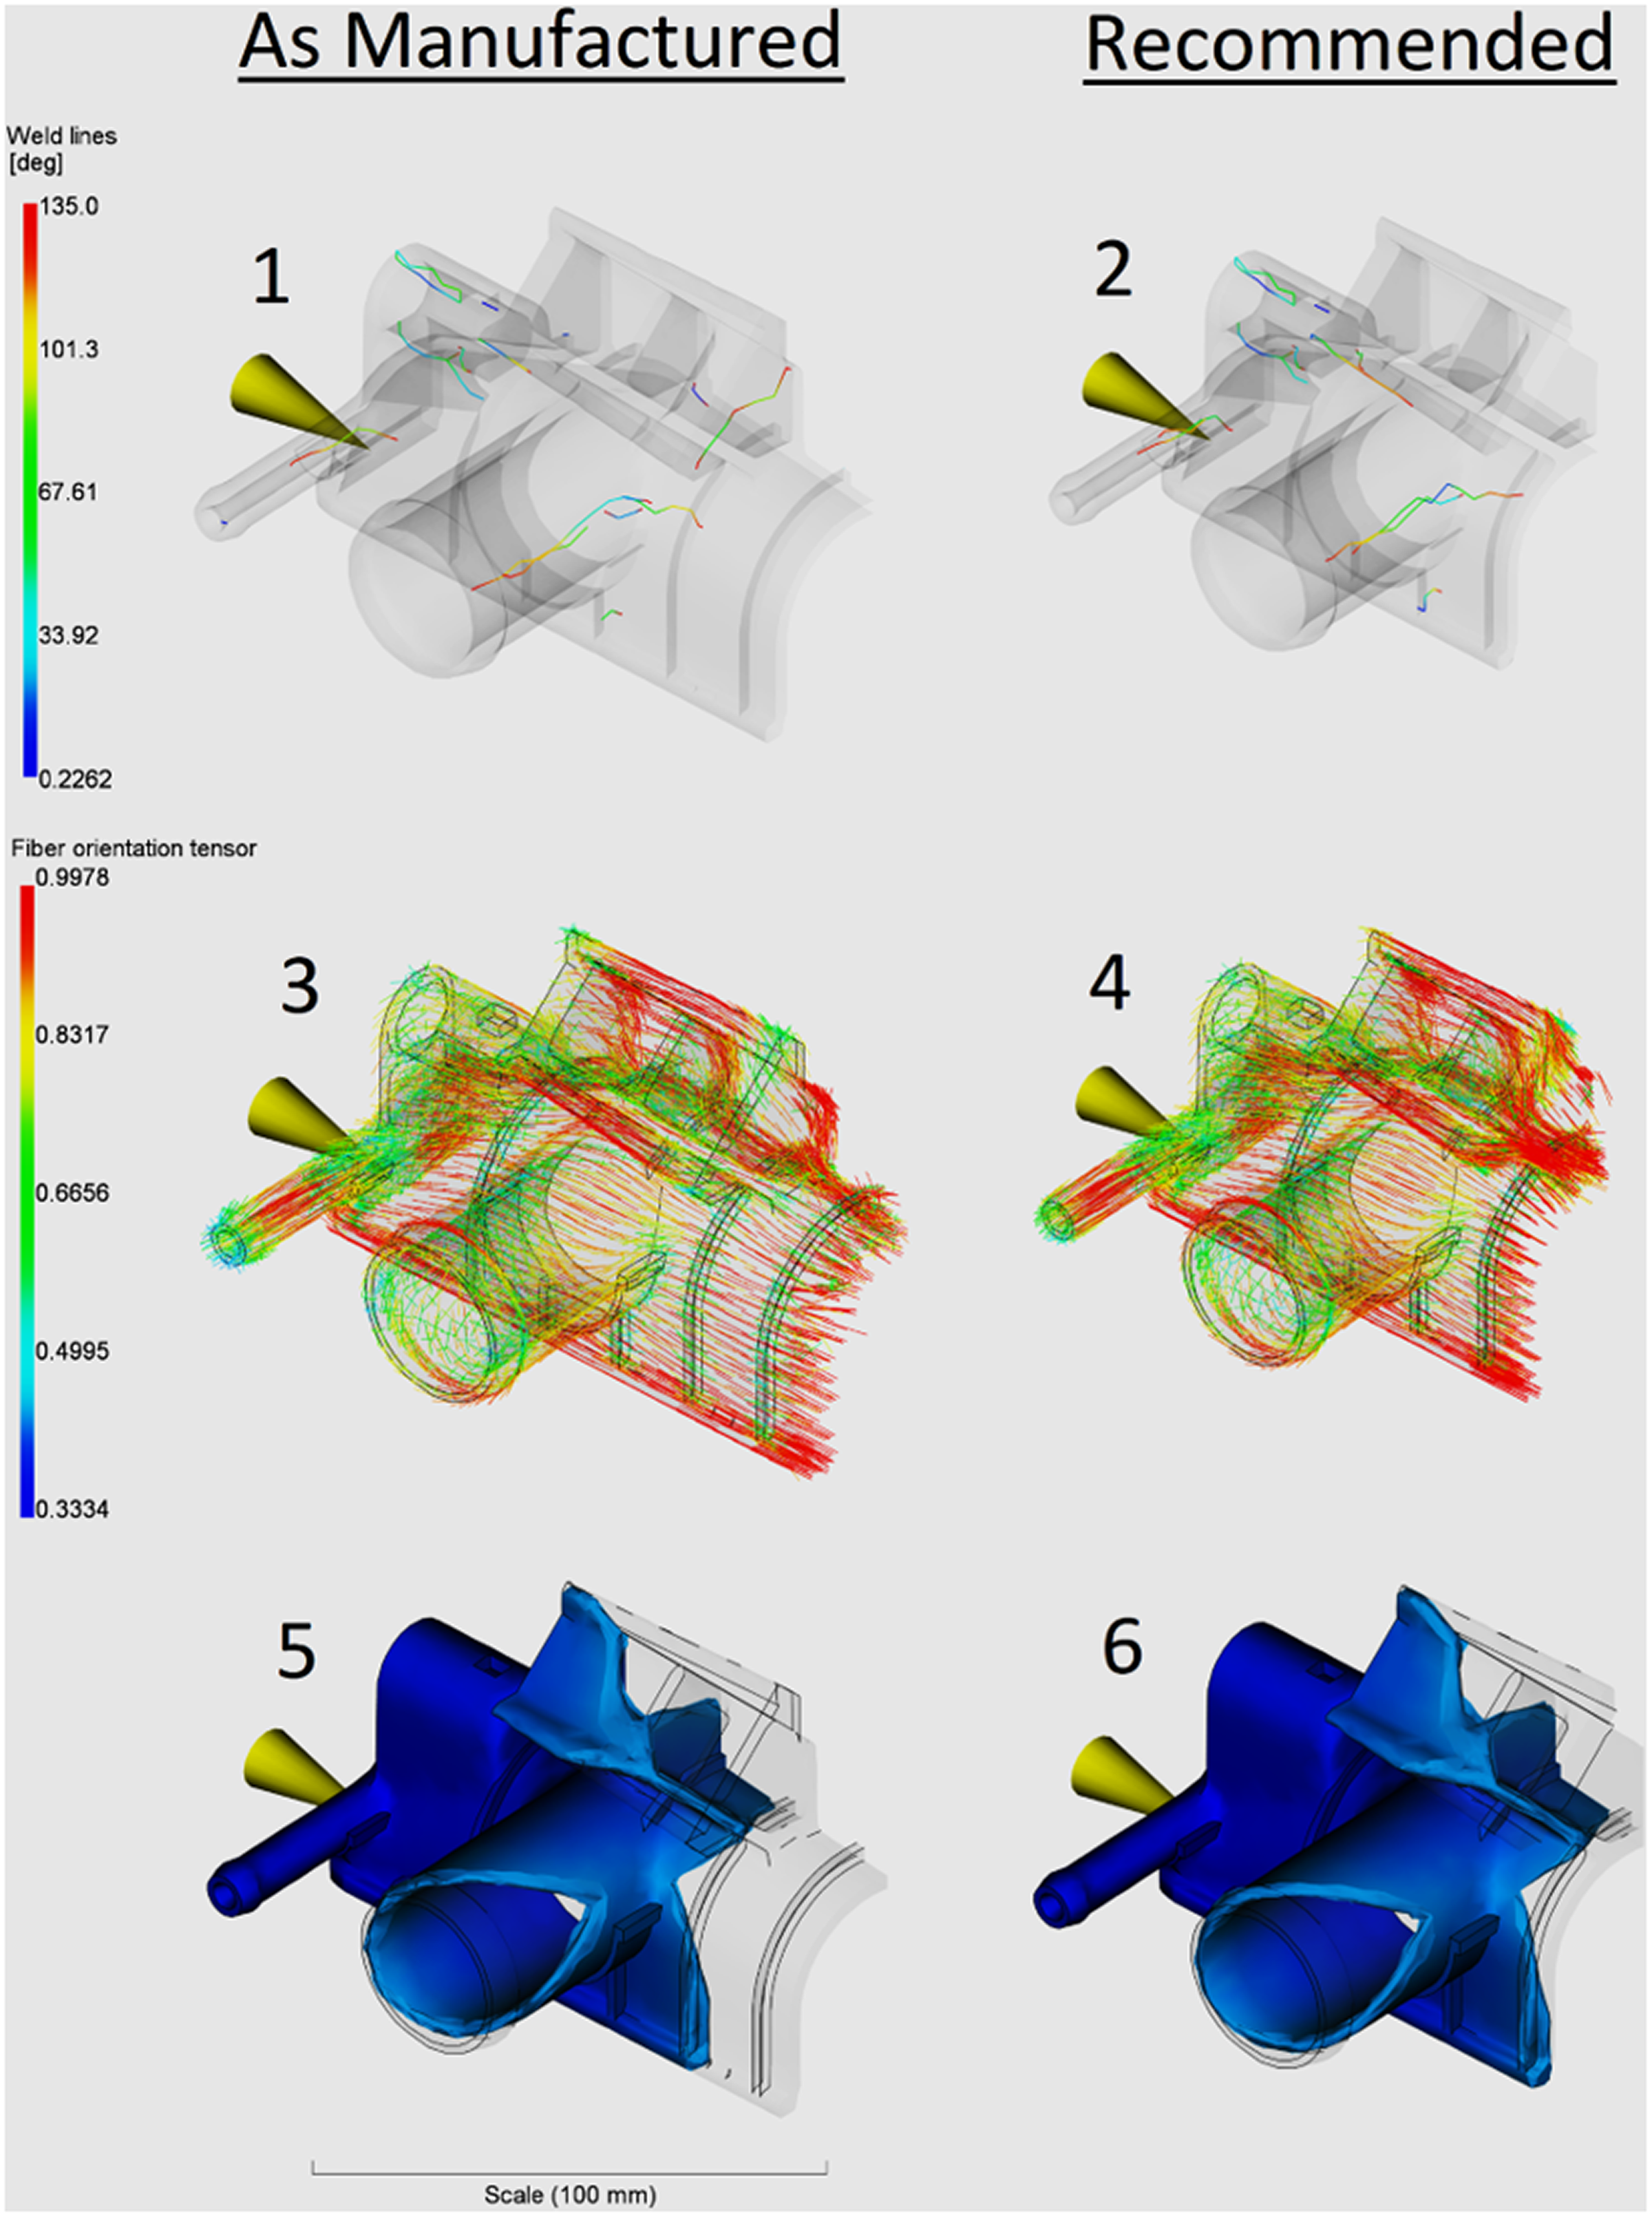
Nozzle area from as manufactured experiment and from material manufacturer’s recommended parameters experiment. 1. Weldline locations from as manufactured experiment; 2. Weldline locations from material manufacturer’s recommended parameters experiment; 3. Fibre orientation tensor from as manufactured experiment; 4. Fibre orientation tensor from material manufacturer’s recommended parameters experiment; 5. Plastic flow after 0.6598 s for as manufactured experiment; and 6. Plastic flow after 0.6162 s for material manufacturer’s recommended parameters experiment.
By comparing the fill time for the optimum process parameters, as determined by the parametric study, with the fill times for the component as currently manufactured, and manufactured using the material manufacturer’s recommended processing parameters, as shown in Figure 18, it can be seen that the material manufacturer’s recommended parameters have produced a marginally quicker fill compared to as manufactured and experiment 1 runs 4 and 8, but the quickest time to fill was from experiment 2 run 3. Experiment 1 (run 8) yielded a fill time only 130 ms slower than the material manufacturer’s recommended parameters while requiring an injection pressure 28.6% lower. To fill the mould as quick as possible, it is necessary to fill from more than one location. This can be seen in the results from experiment 2 run 3, which filled the mould 1.912 s faster than it would take using the material manufacturer’s recommended parameters with a single gate.
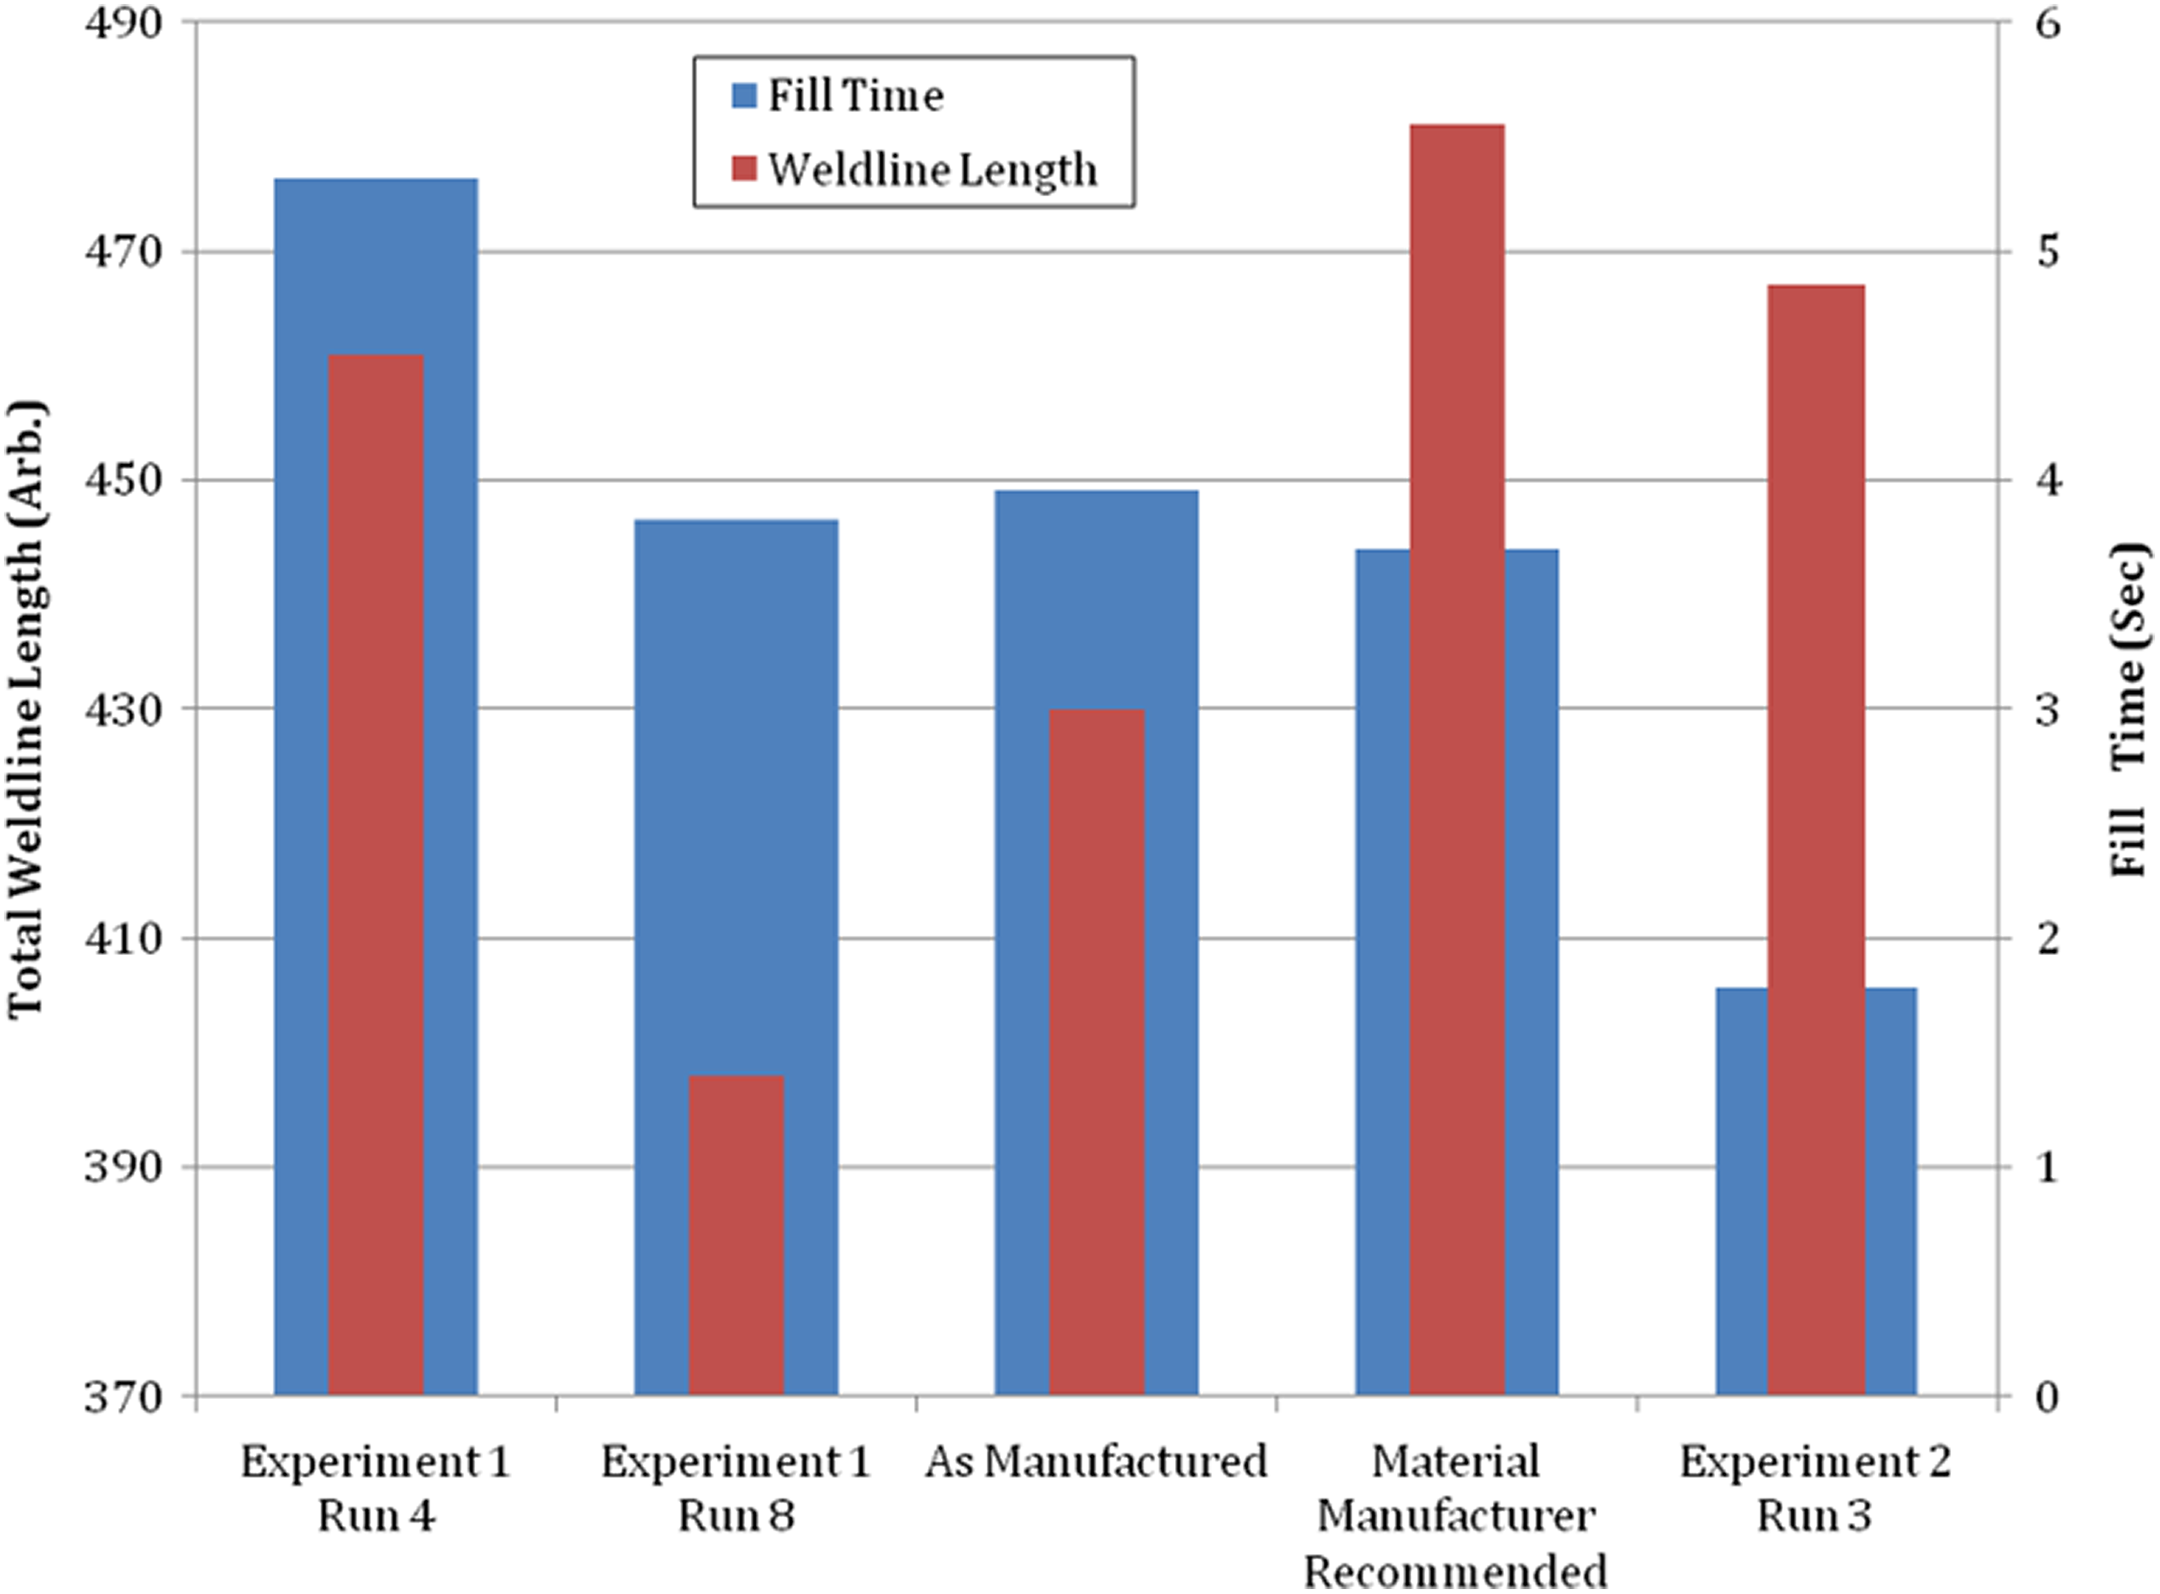
Graph of weldline length and fill time in seconds for experiment 1 runs 4, 8, as manufactured, and the material manufacturer’s recommended parameters, and experiment 2 run 3.
While the material manufacturer’s recommended parameters and experiment 2 run 3 produced the shortest fill times, they also produced the highest total weldline length, as shown in Figure 18. The optimized experiment, experiment 1 run 8, produced the shortest total weldline length, which was 7.5% lesser than the component as it is currently manufactured.
Although the presence of weldlines is not immediately apparent from the microscopy of the samples as none of the weldline locations have ‘v notches’ or distinct visible lines, the optical microscopy clearly indicates the presence of voids within the component at some locations highlighted by the simulations to have weldlines, and equally fibres oriented with the flow front and changing direction at the location of a weldline, as seen in Figure 10 (bottom). These results, in conjunction with the simulation results from the first parametric study, have confirmed the injection location to be from both sides of the component. From the second parametric study, it can be seen that, as with the first, the parameters that allow for the quickest fill time are not the parameters which reduce total weldline length.
Conclusions
From the simulations carried out in the first parametric study, several locations within the component were identified to contain moulding defects which were only present when the mould was filled from a particular location. These areas with defects were then sectioned from the physical component and mounted for optical microscopy. The presence of defects within the micrographs correlating with the simulation results has confirmed the injection location to be from both sides. Following this, a second parametric study was carried out to optimize the processing parameters to reduce the formation of weldlines and to decrease cycle time. Using the parameters from experiment 2 run 8, the component can be manufactured with 7.5% fewer weldlines and with a mould fill time 132 ms quicker when compared with the component as it is currently manufactured. This could provide the company with increased productivity and fewer defective components produced.
Using low mould temperatures, it is more likely that the mould will not fill completely due to the material solidifying prior to the packing phase of the injection, as seen in experiments 1, 2 and 3. Similarly, there are also combinations of parameters that will also result in an incomplete fill such as those of experiments 6 and 9. Experiment 6 used a mould temperature of 70°C and an injection pressure of 80 MPa, whereas experiment 9 used a mould temperature of 90°C and an injection pressure of 60 MPa.
The fibre orientation in the region of the weldlines can be seen to be oriented at various angles rather than parallel to the main flow. This is due to the flow passing around an obstacle and having to change direction to fill the space directly behind, but fibres behind an obstacle are aligned in flow direction into the shear layers. This can cause a reduction in strength in the region of the weldline due to the fibres not knitting together in the preferred alignment. Weldline locations in thicker sections of the component have been shown to have pores due to the entrapment of gas when the two flow fronts meet.
Optimization of the process parameters can only produce a compromise between the total weldline length and the time to fill the mould. As seen and concluded from this study, to fill the mould quicker, it is necessary to use more than one injection location but conversely, this induces more weldlines where the flow fronts from each injection location meet. Also, melt temperature has found to have the highest statistical significance when reducing both weldline length and fill time.
Footnotes
Acknowledgements
The authors would like to thank the Welsh European Funding Office (WEFO) and the Engineering and Physical Science Research Council (EPSRC) funded operation Materials and Manufacturing Academy (M2A) for the support to conduct the research.
Funding
The author(s) received no financial support for the research, authorship, and/or publication of this article.