
Abstract
Weld-Line in an injection molded part develops when two or more melt fronts are converged together. The weld-line is unavoidable when the design is complex where two melt flow fronts are mating each other head-to-head, this mating area is mechanically weak compared to other portions of the modeled part. The decrease in strength in the weld-line area can be attributed to several factors like molecular diffusion, fiber orientation effect, unoptimized process conditions, surface tension effect, internal residual stresses, etc. The strength of the weld-line area can be increased by optimizing injection molding process parameters like melt temperature, injection speed, packing pressure, changing gate type and location, etc. The present work focuses on studying the effect of packing pressure on strength of stagnation weld-line. This has been examined with experimental testing and scanning electron micrographs of the fractured surface on the weld-line and without weld-line specimens. The special injection mold is designed and fabricated to produce plaques having stagnation weld-line. The plaques are prepared out of 30% glass-filled Polyamide 6 material. The four sets of plaques are produced by changing the magnitude of packing pressure equal to 60% of filling pressure, with increment of 20% up to 120% of filling pressure. The tensile test specimens are machined on these plaques for two different angular orientations and testing is conducted as per ISO 527-2. The results demonstrated that, without weld-line specimens, the tensile modulus, stress at break marginally increases with an increase in packing pressure, and strain at break decreases with an increase in packing pressure. However, for specimens with stagnation weld-lines, both the tensile modulus and stress at break are observed to be 42% of without weld-lines samples for minimum packing pressure. The results obtained are evident from stress-strain graphs and scanning electron micrographs.
Introduction
The injection molding manufacturing process is now one of the vital production methods used in the plastic industry, because of the high demand for complex design, aesthetics, and light in weight products. 1 Weld-line in injection molded products is formed when two or more flow fronts meet 2 and it is visible on the surface of the final product as a small hair size line. The general thumb rule says, when the angle between two mating flow fronts is below 135°, the mating line is called a weld-line else it is a meld-line.
Stagnation weld-lines are formed when two melt front meets directly head-to-head, generally occurring in circular geometry or multiple gate locations. This type of weld-line significantly reduces mechanical strength.2,3 The reduction of the strength at the weld-line area is because of incomplete intermolecular diffusion of the matrix, random fiber orientation, air voids, V-notch because of the surface tension effect, and un-optimized process parameters.1,2 The process variables in injection molding, such as melt temperature, injection speed, packing pressure, mold temperature, etc. influence the mechanical properties of the weld-line. 4 Another type of weld-line is a hot weld-line or also called flowing lines; these weld lines are formed when two approximately parallel flow fronts meet during melt flowing, generally occurring when an obstacle comes in between the flow of the melt.5,6
In general, when melt temperature and packing pressure increase, the tensile strength of the overall part also increases. However, fiber orientation at the weld-line area cannot be changed by increasing mold and melt temperature.2,3 The glass fiber anisotropy is high at lower hold pressure, and it is reducing with an increase in hold pressure. With higher packing pressure reinforced fibers are aligned more in the flow direction at the core of the weld-line which increases the tensile strength of the weld-line.1,2 With increasing packing pressure, more polymers enter the cavity thus reducing the gap between molecules. This results in good filling quality with an increase in the density of the part. 7 The effect of packing pressure on amorphous and unreinforced material is not significant however packing pressure impact is seen for semicrystalline and reinforced glass-filled materials.8,9
Many researchers are working on the optimization of injection molding process parameters so as to improve the quality of the weld-line. Zhou and Mallick 1 investigated the effect of melt temperature and holding pressure on tensile and fatigue properties for an injection molded Polyamide 66 material part and concluded that the weld line strength increases with an increase in melt temperature and packing pressure. Baradi et al.2,5 studied the effect of fiber orientation, polymer matrix diffusion, voids, the shape of obstacles, and v notch considering polybutylene-terephthalate as material for flowing weld-lines. Their work revealed a reduction of 50% stress at the break and 40% strain at the break with the presence of a weld-line. Scantamburlo et al. 3 studied the position and shape of the weld-line during the mold filling phase and found that both can be modified by generating pressure imbalance between flow fronts during the packing phase, and with their method load carrying capacity and tensile modulus of weld-line increase by 19% and 15% respectively for fiber-reinforced polypropylene. Onken and Hopmann,4,10 developed a calculation routine based on a physical model of molecular interdiffusion for the prediction of the weld-line strength for unreinforced thermoplastic material parts and found a good correlation between simulation and experiment results. Selden 6 conducted an experimental design to measure weld-line strength for five different engineering thermoplastics and found that weld-line factor varied between 0.25 and 0.98 depending on material and parameter settings. Weng et al., 7 carried out a series of injection molding experiments and constructed a simulation model to evaluate the filling quality of micropillars by varying packing pressure and melt temperature and concluded that the filling quality of microstructures of the micropillars can be improved with increasing melt temperature and packing pressure. Jadhav et al. 11 conducted an experimental investigation to find the effect of weld-line and weld-line angle on tensile properties for thermoplastic glass-filled material and found a 49% strength reduction in weld-line specimens compared with those without weld-line specimens. Gao et al. 12 developed a new simulation method based on healing theory and the interdiffusion model for the prediction of product strength considering weld-line and fiber orientation and concluded that their approach is effective as far as design aspects are concerned. Koponen et al., 13 developed an advanced injection molding tool to measure the mechanical strength of weld-line and anisotropy for liquid crystal polymer and concluded that increasing flow rate results in a decrease of tensile strength at weld line in flow and perpendicular to flow direction. Shokri and Bhatnagar 14 conducted an experimental and simulation study on the effect of pressure distribution and viscosity melt on fiber orientation. They found that fibers are rotating even after the mold cavity is completely filled. However, packing pressure at the end of the filling tried to reduce the degree of alignment in the flow direction. Quintana and Frontini 15 worked on residual strength for flowing weld-line by using the fracture mechanics technique and found that strain at break and fracture energy for the weld-line specimen is more and tensile modulus is comparatively lower. Kagitci and Tarakcioglu 16 worked on the effect of injection molding parameters on strength of the weld line and found that the melt temperature is showing the maximum influence on strength of the weld-line. Turng and Kharbas 17 performed designs of experiments and reveal that changes in injection speed and melt temperature are significant factors as far as the microstructure of weld line and weld line strength are concerned. Dzulkiplia and Azuddina 18 studied the formation of weld lines for unfilled and glass-filled polypropylene under different processing parameters and found that the formation of weld lines dependent on melt temperature, injection pressure, and type of injection molding method. Kim and Suh 19 developed a theoretical model to find out the location of the weld-line and the reason for the reduction of strength at the weld-line area. Mosey et al., 20 had employed Taguchi parametric method and concluded that the melt temperature is significantly responsible for weld-line strength. Narkis and Vaxman, 21 studied the effect of fiber orientation and failure of weld-line for 20% short glass fiber reinforced thermoplastic compounds and found 50% degradation in tensile strength for weld-line specimens.
The effect of weld-line can be minimized with changing gate locations, appropriate mold designs, sequential gates, and local heating at weld-line areas however for large plastic parts, complex structural designs, and circular components still it is very difficult to avoid weld-line completely.
In the current technological world, industries are looking for reliable and comprehensive predictions of weld-line strength and optimized process parameters to improve the weld-line strength. Numerous studies were conducted on amorphous and un-reinforced material with flowing weld-line in which melt temperature is a prominent factor to improve weld line strength. However, limited literature is available pertaining to stagnation weld-lines for the semicrystalline reinforced thermoplastic material. Since packing pressure also plays an important role to improve the fiber orientation and weld-line strength and therefore, there is a need to investigate the effect of packing pressure independently on weld-line strength. So, in the present work effect of packing pressure on stagnation weld-line strength for reinforced semicrystalline thermoplastic PA6 material has been investigated. The study is carried out with the manufacturing of plaques for four different packing pressures.
Experimental
Material selection
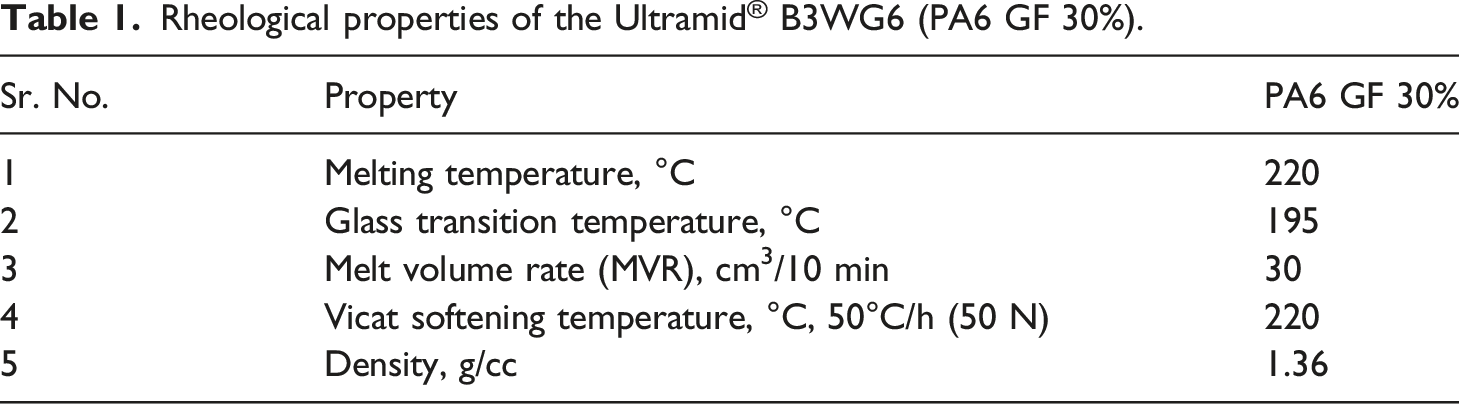
Rheological properties of the Ultramid® B3WG6 (PA6 GF 30%).
Manufacturing of the plaques and sample preparation
The special purpose plaque mold and runner system are designed to arrive at stagnation weld-line with the help of the Autodesk Moldflow 2021 simulations tool. The two full-length fan gates are used in the runner system of the mold such that an optimized fiber alignment in the flow direction can be achieved. The plaque dimensions 85 mm × 85 mm × 2.0 mm are considered such that tensile specimens as per ISO 527-2 type 1BA can be cut at any angular rotation. Figure 1 shows a special plaque cavity three-dimensional model with a runner system and filling pattern and mold tool for the plaque. The rectangular shape mold is selected having a size of 150 mm × 160 mm. The mold material used is P-20 Steel, which is used for the processing of general-purpose plastic materials. (a) Weld-line plaque 3D model, (b) Moldflow filling pattern overlay weld-line, and (c) mold tool of plaque.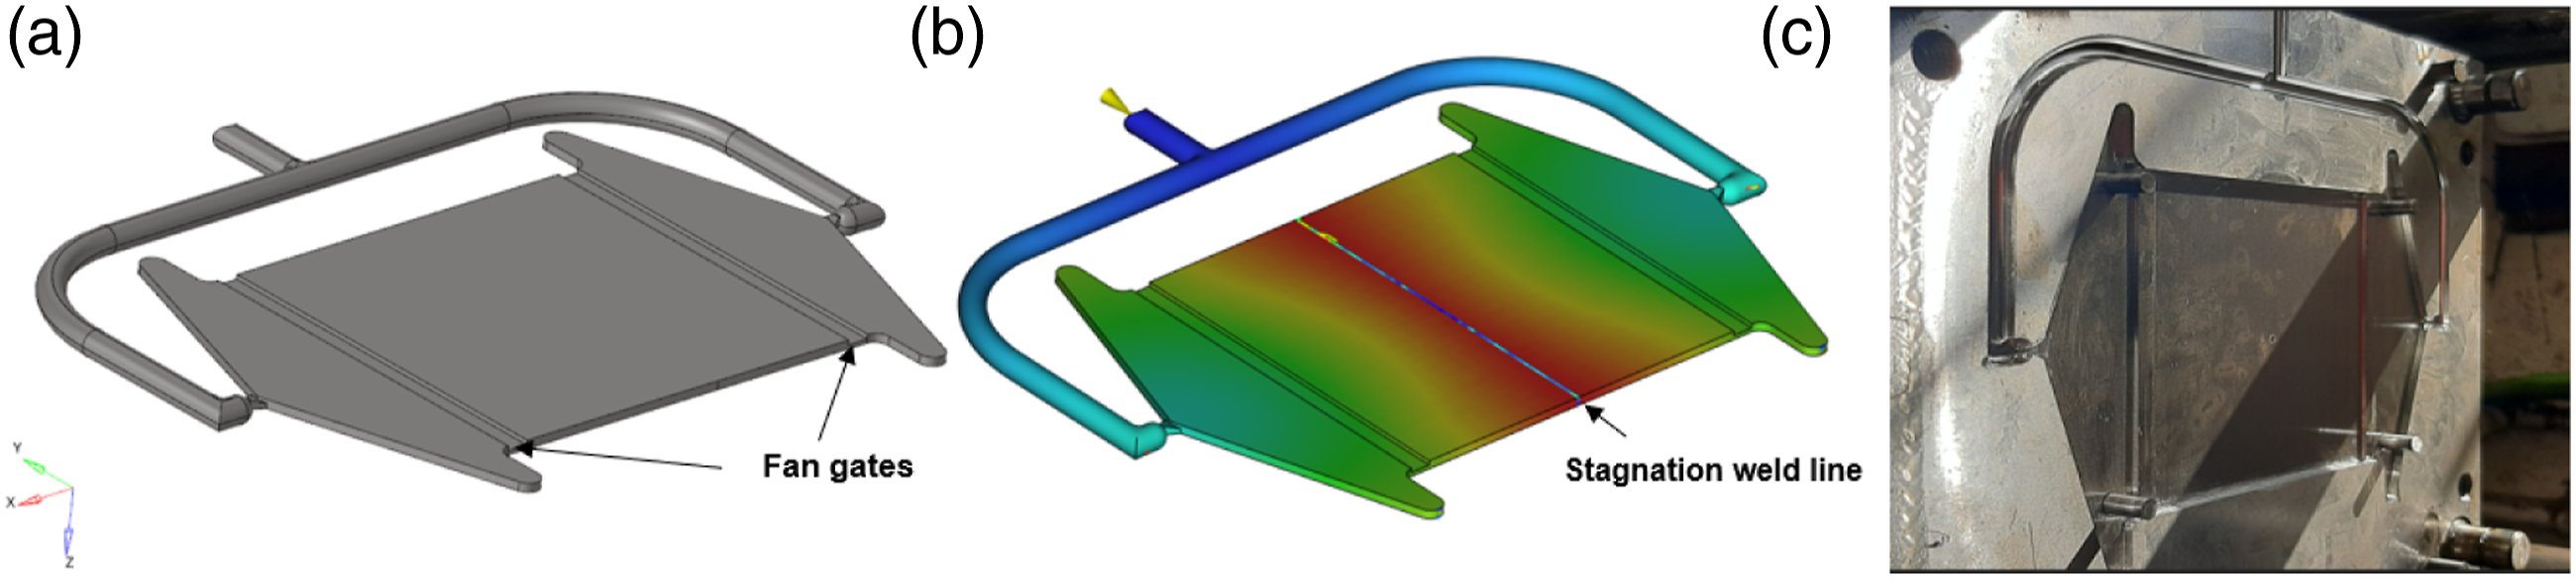
To manufacture without weld-line plaque, one runner has been blocked with gas welding to prevent melt flow from the blocked side so as to produce plaque without weld-line as shown in Figure 2. (a) No weld-line plaque 3D model, (b) Moldflow filling pattern (c) modified mold tool for no weld-line plaque.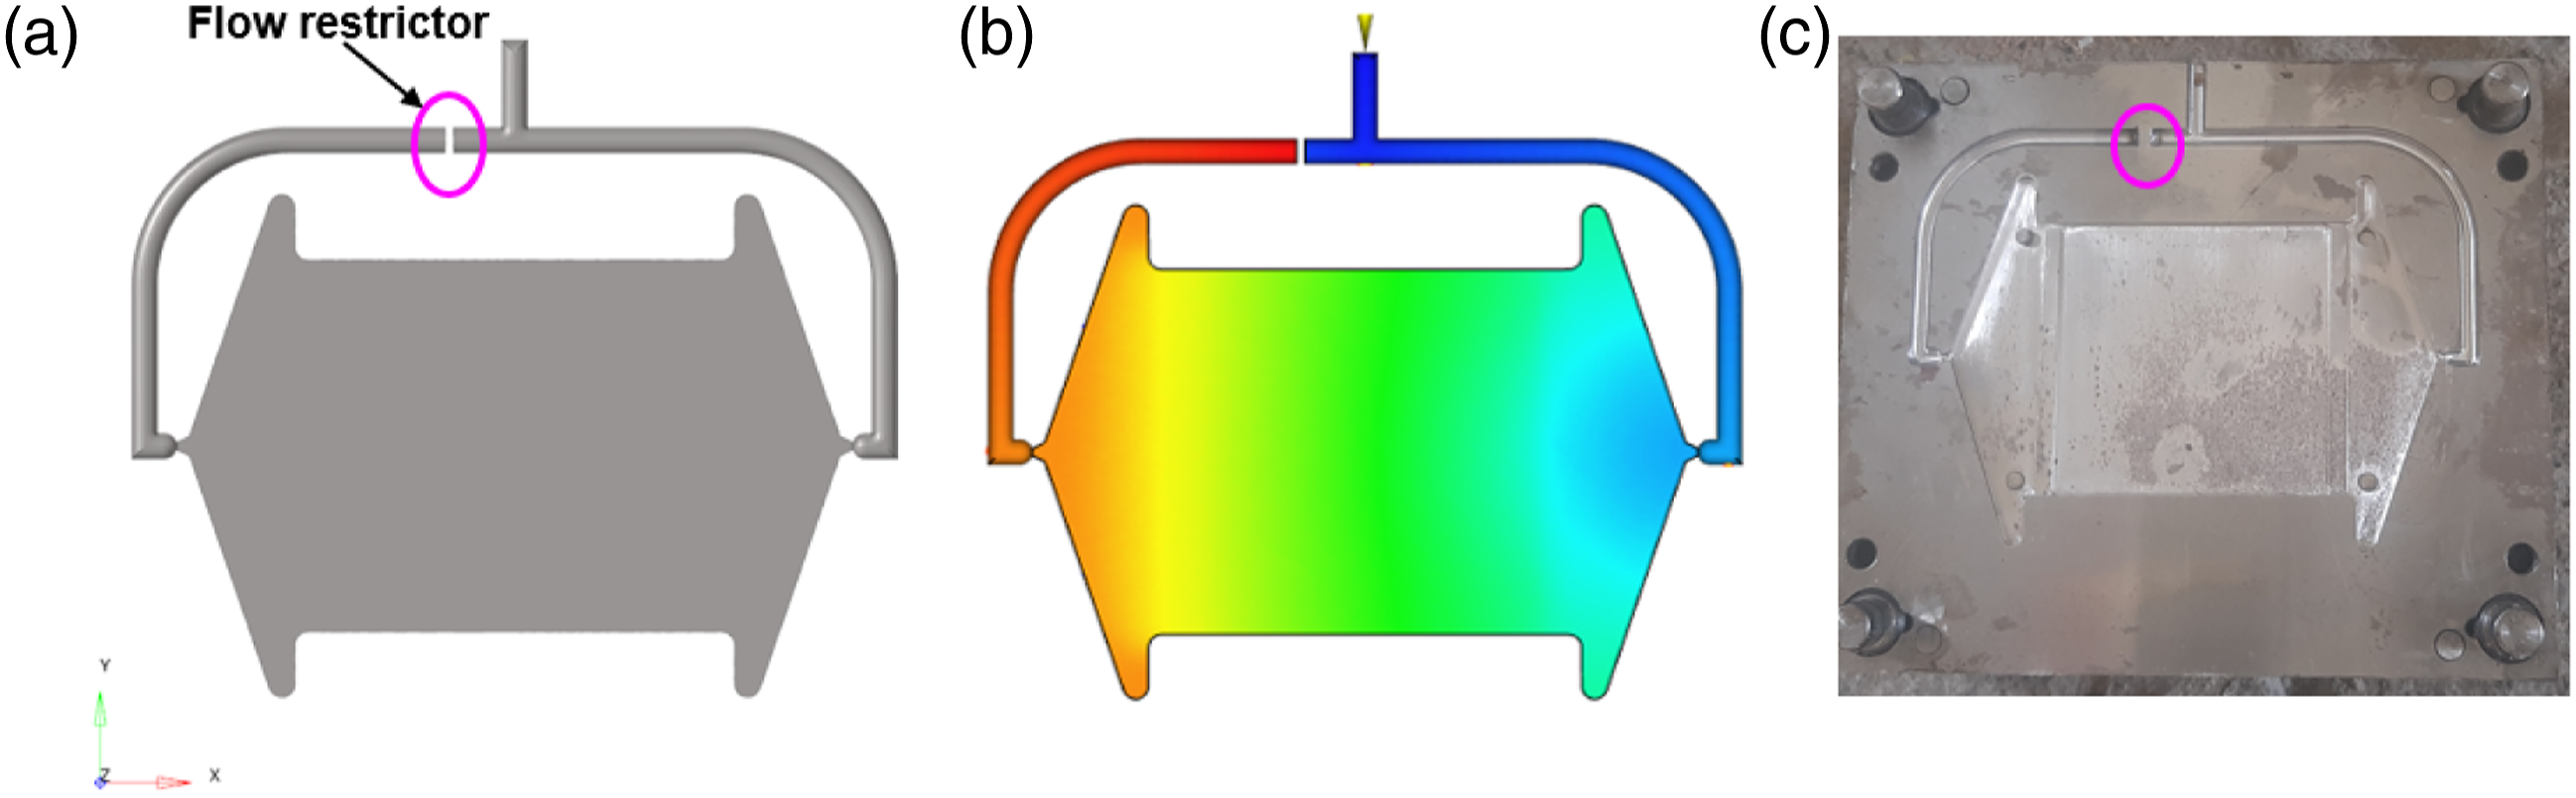
The plaques are manufactured by a semi-automatic vertical type of injection molding machine having an 80 ton capacity and a maximum hydraulic pressure capacity of 280 bar. The machine has a horizontal clamping mechanism.
Before manufacturing, the Moldflow analysis for four different cases is performed by varying the packing pressure with a magnitude equal to (case-a) 60%, (case-b) 80%, (case-c) 100% and (case-d) 120% of filling pressure with an increment of 20% in each case. The pressure at the injection location XY plot overlaid with the hold pressure counter-plot for the weld-line plaque is shown in Figure 3. The packing pressure is denoted as p and is marked on a plot with blue color. It is observed that the filling pressure is 58 MPa and the minimum packing pressure acting at the stagnation weld-line area (at the center of plaque) is for case-a 28 MPa, case-b 40 MPa, case-c 52 MPa, and case-d 64 MPa. For weld-line plaques, the packing pressure increment for each case is around 12 MPa. Injection pressure XY plot overlay with hold pressure for a weld-line plaque for packing pressure equal to (a) 60%, (b) 80%, (c) 100%, and (d) 120% of filling pressure.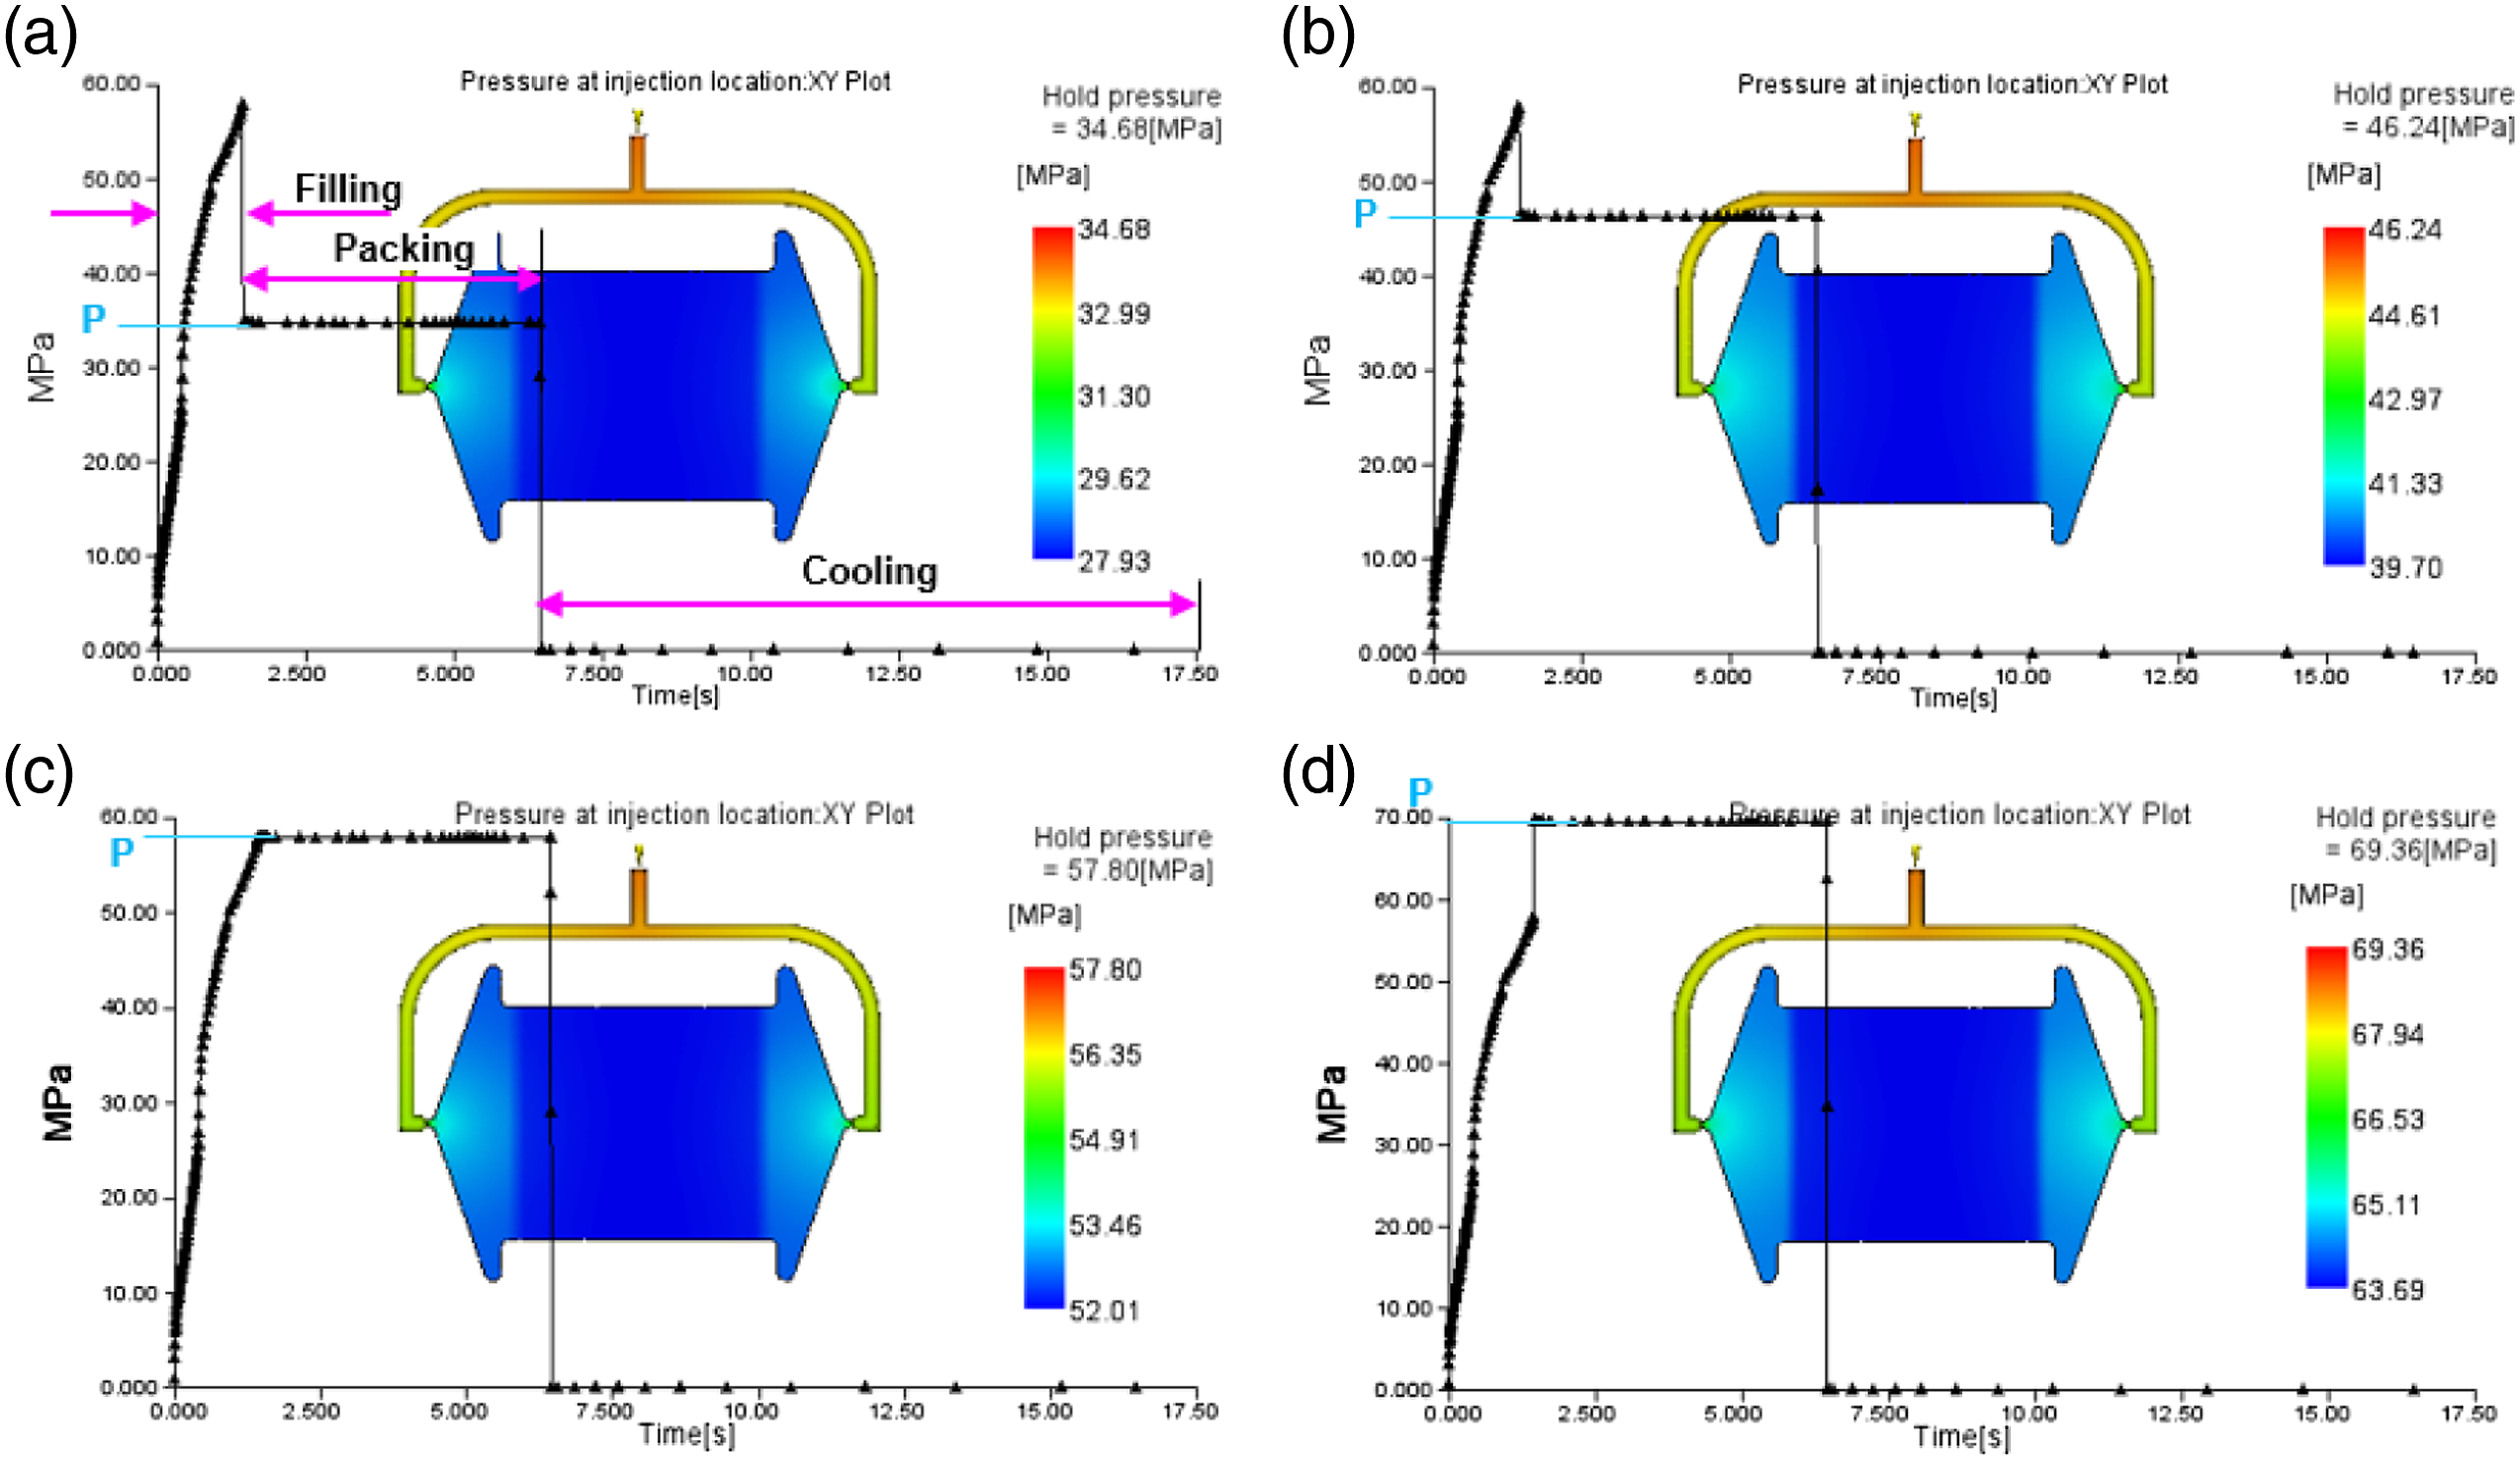
Similarly, Moldflow simulation is performed for No weld-line cases. Figure 4 shows injection pressure plots overlaid with hold pressure for No weld-line plaque, as one runner is blocked, the injection pressure has almost doubled, and it is observed as 111.4 MPa. For No weld-line plaques, the packing pressure increment for each case is around 24 MPa. Injection pressure XY plot overlay with hold pressure for no weld-line plaque for packing pressure equal to (a) 60%, (b) 80%, (c) 100%, and (d) 120% of filling pressure.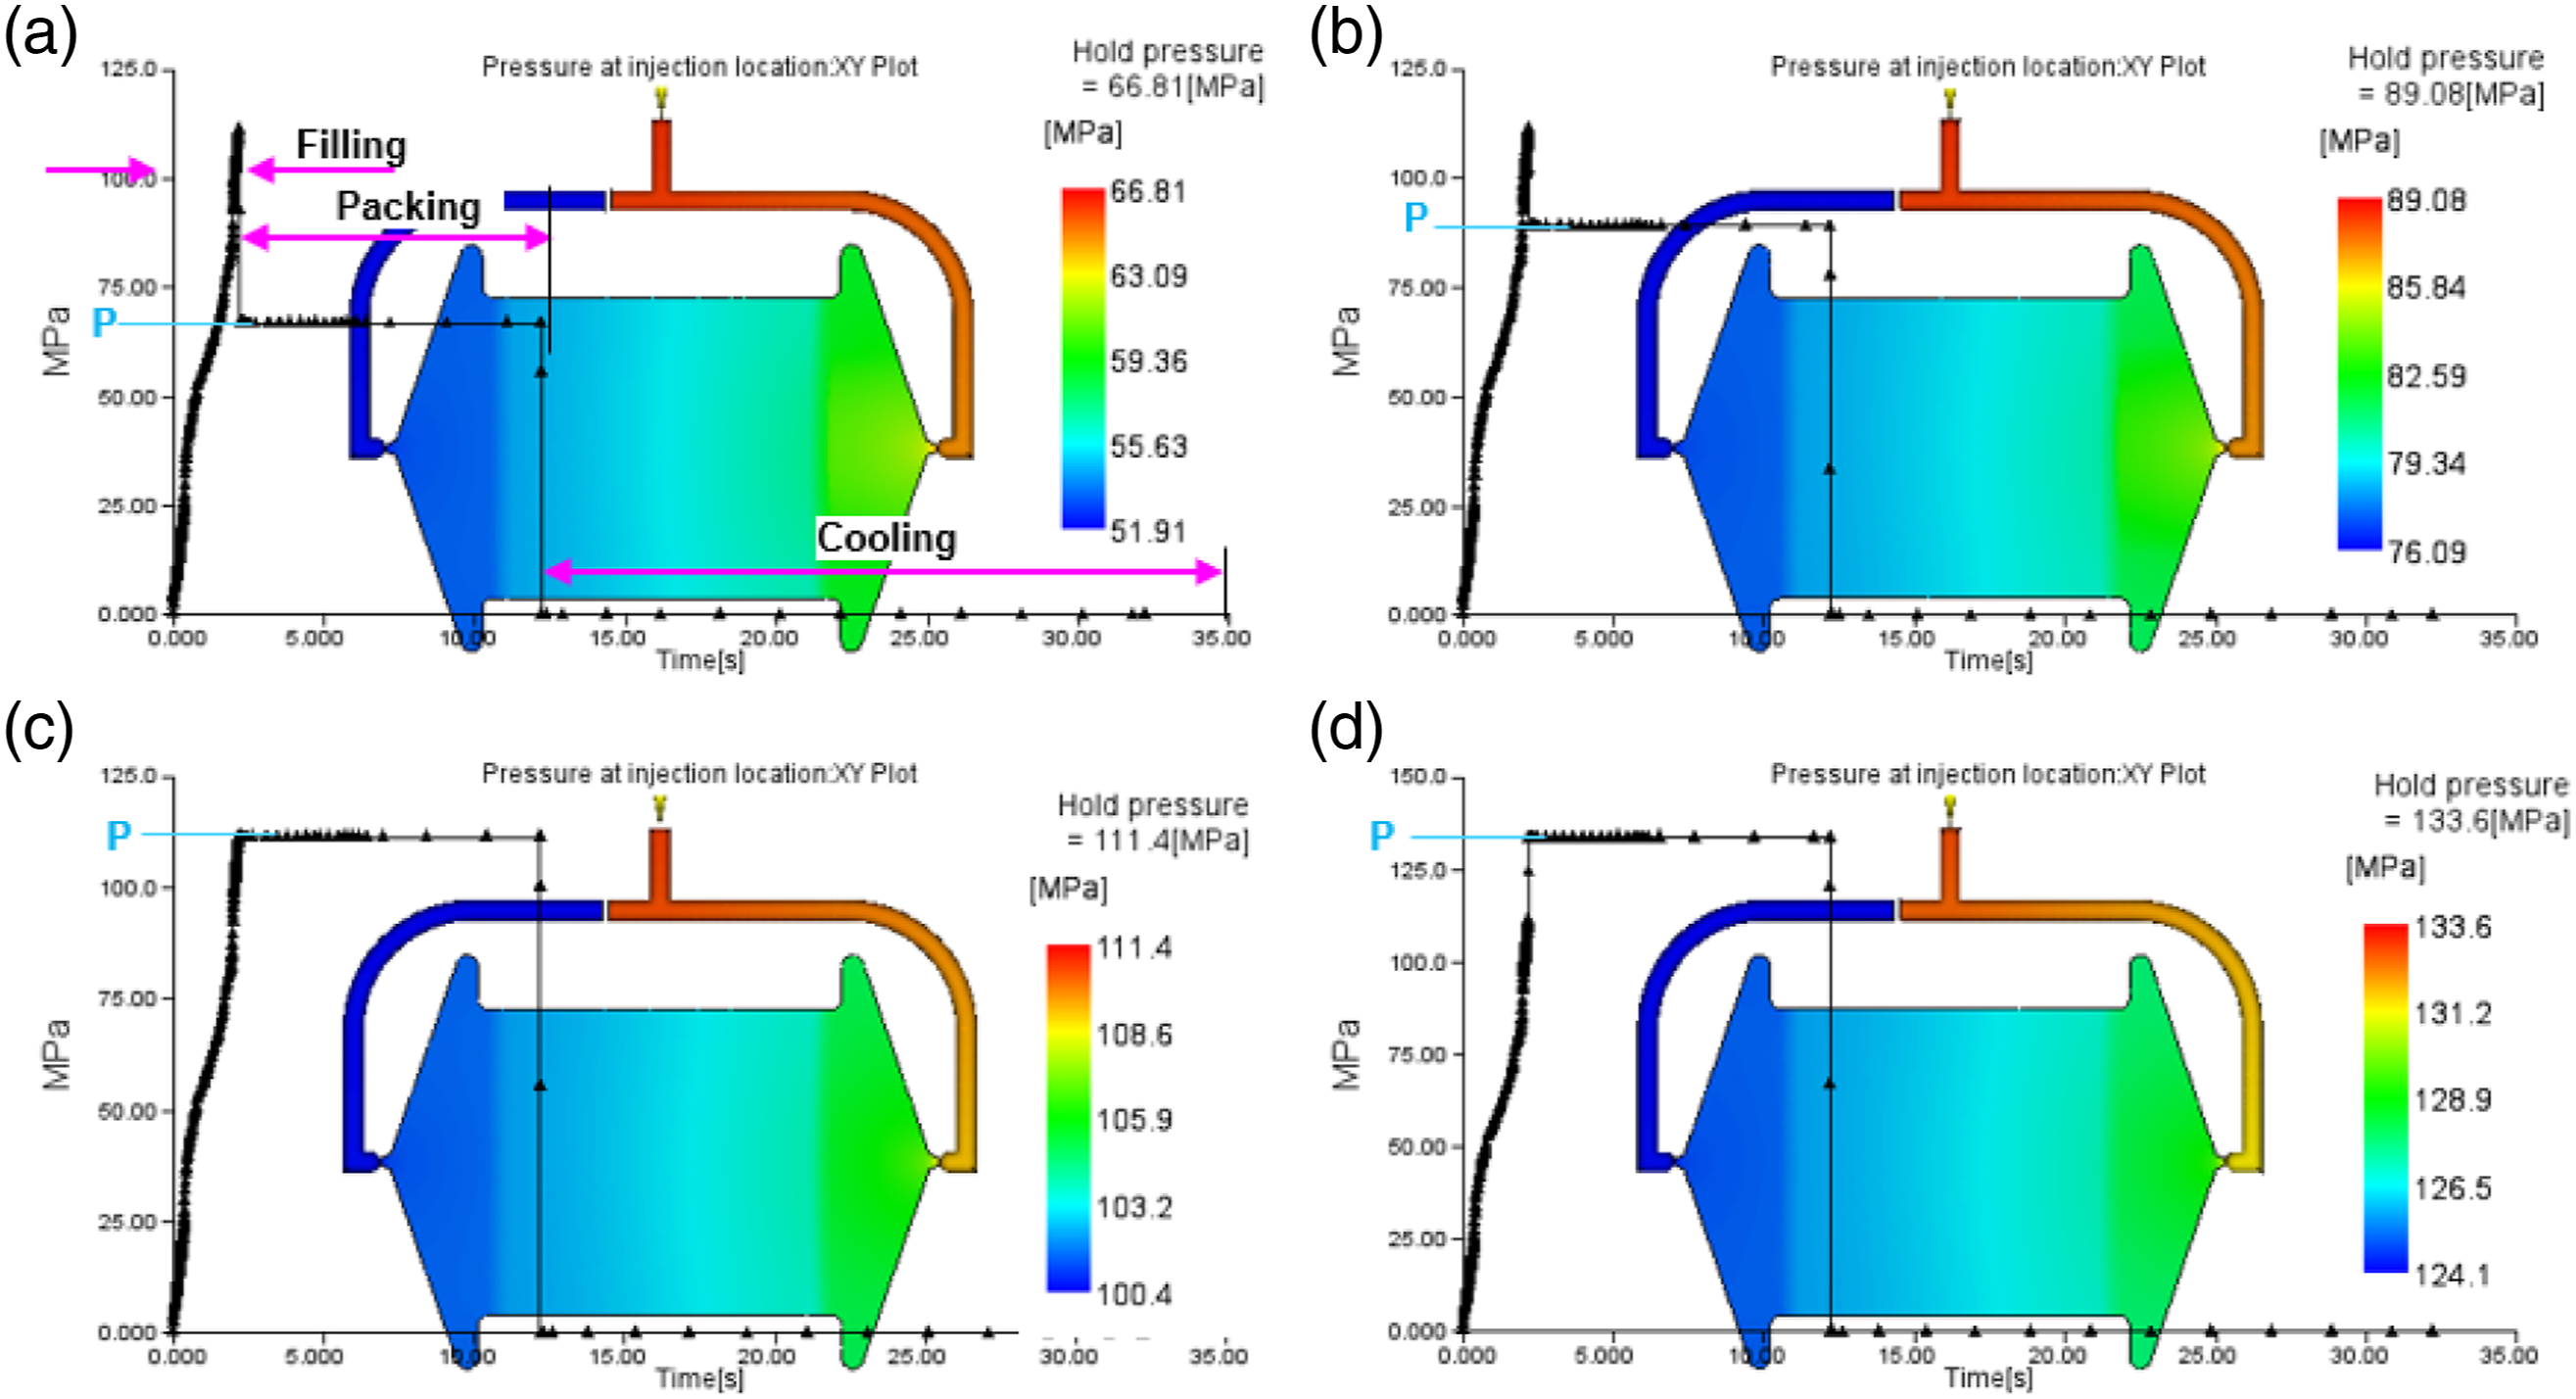
During manufacturing on an injection molding machine, the process parameters are set as per the process data sheet as recommended by the material supplier, and a simulated pressure profile is used for setting the packing pressures. Initially, plaque is manufactured considering packing pressure as 80% of filling pressure (case-b). The first few shots are inspected such that the stable quality and weight of the part are consistent and the next ten shots are collected for experimental purposes. In a similar way other plaques, are processed by changing packing pressure keeping all other parameters constant.
Process parameters used for injection molding machine for processing of plaques.
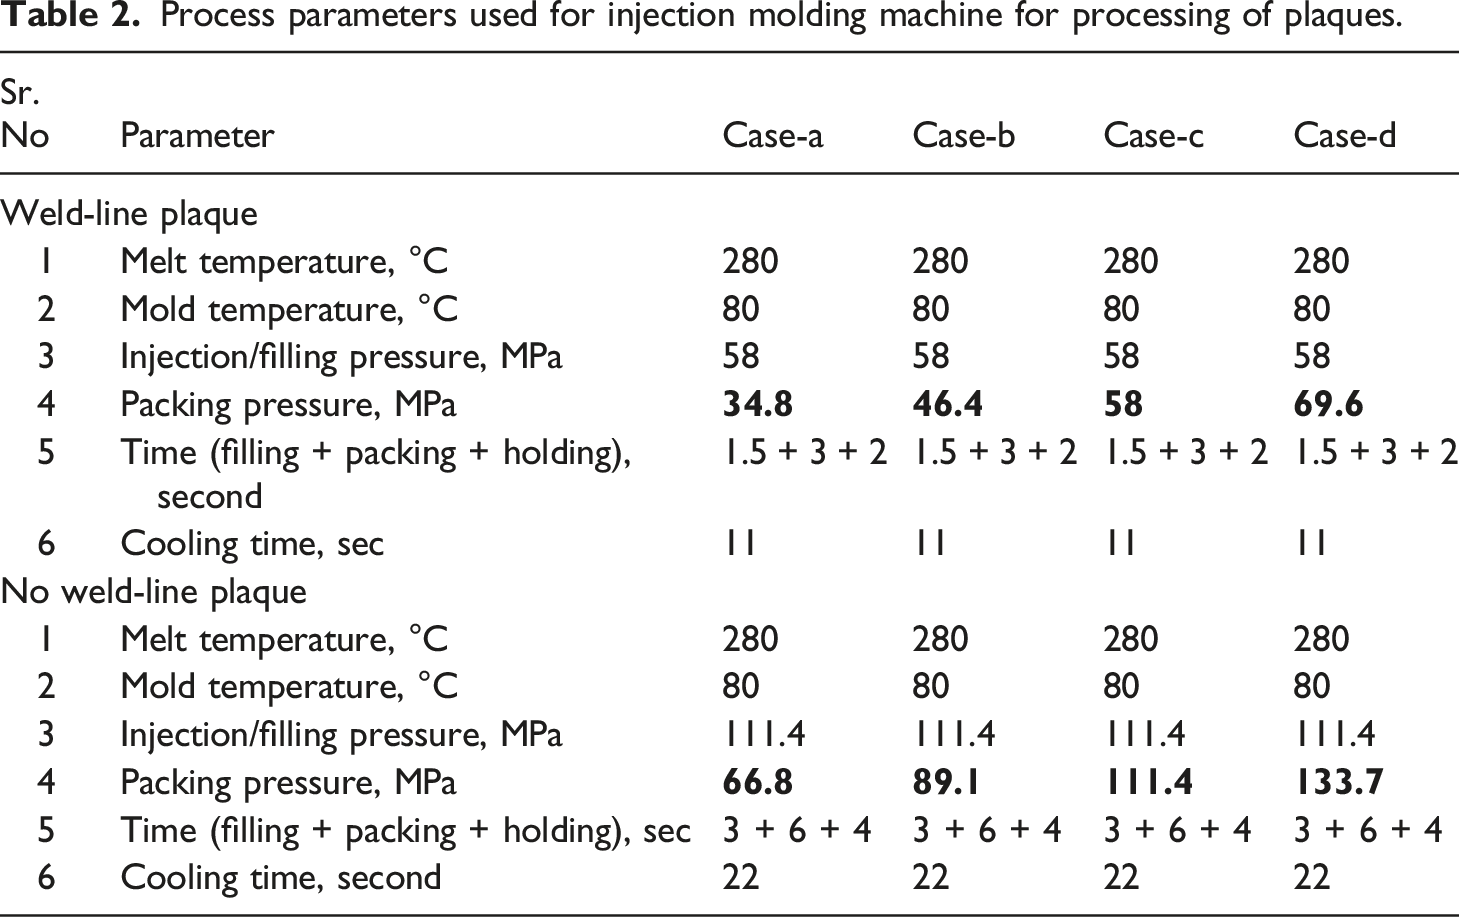
Figure 5 shows real processed plaques for different packing pressure. The mass of each case plaque is recorded, and it is observed that the mass of the plaque increased with an increase in packing pressure. For case-a, case-b, case-c, and case-d the plaque mass with the runner system is recorded as 44.5 g, 49.28 g, 53.03 g, and 56.25 g respectively. Actual injection molded weld-line plaque processed at different packing pressure.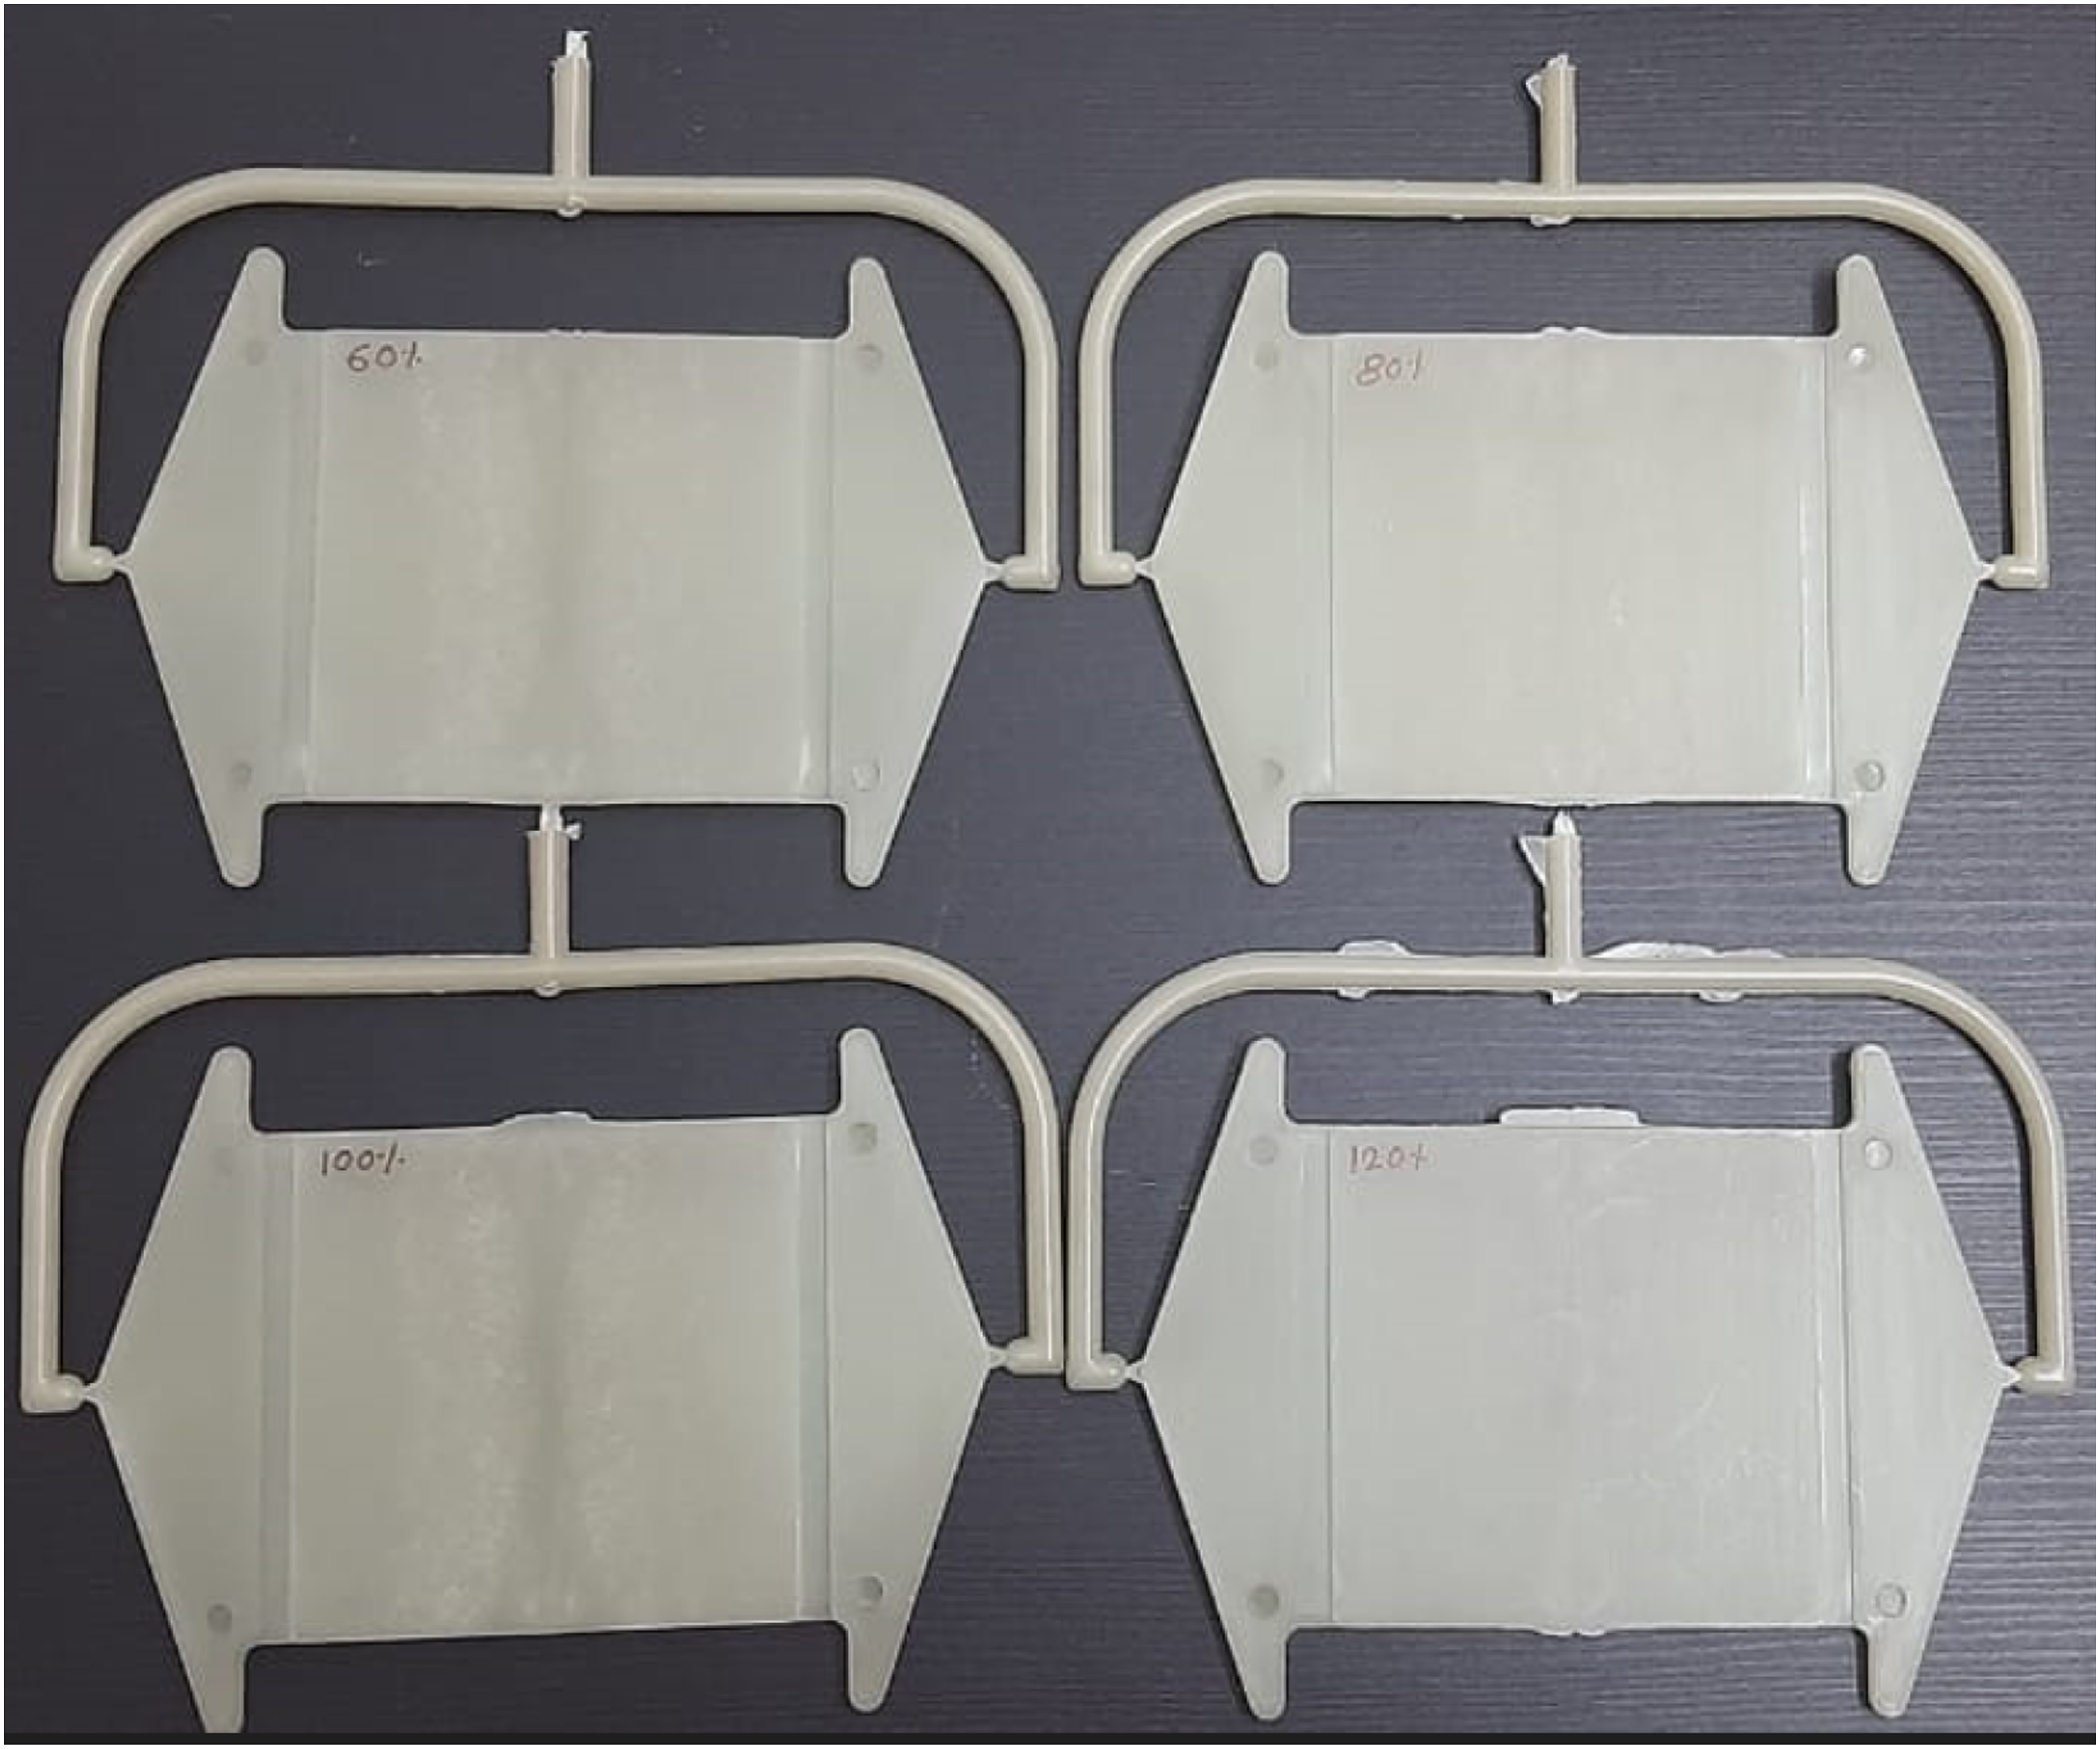
Specimen preparation and experimental testing
The specimens are prepared on a vertical milling machine by cutting on a plaque parallel to the flow direction and 45° to the flow direction. That is weld-line makes an angle (α) equal to 90° and 45° to the length of the specimen as well as the loading direction of the specimen. The dimensions of the specimens are as per ISO 527-2 Type 1BA. The width and the gage length of the specimen are 5 mm and 30 mm respectively and the maximum length is 75 mm with a fillet radius between the gage area and the grip area is 30 mm. Similarly, specimens of no weld-line are prepared. Figure 6 shows the specimen is cut on No weld-line plaque denoted as a benchmark a sample “B” and specimen cut at 90° and 45° angles on weld-line plaques. Specimen cut on no weld-line plaque(B) and specimen cut at 90° and 45° angles on a weld-line plaque.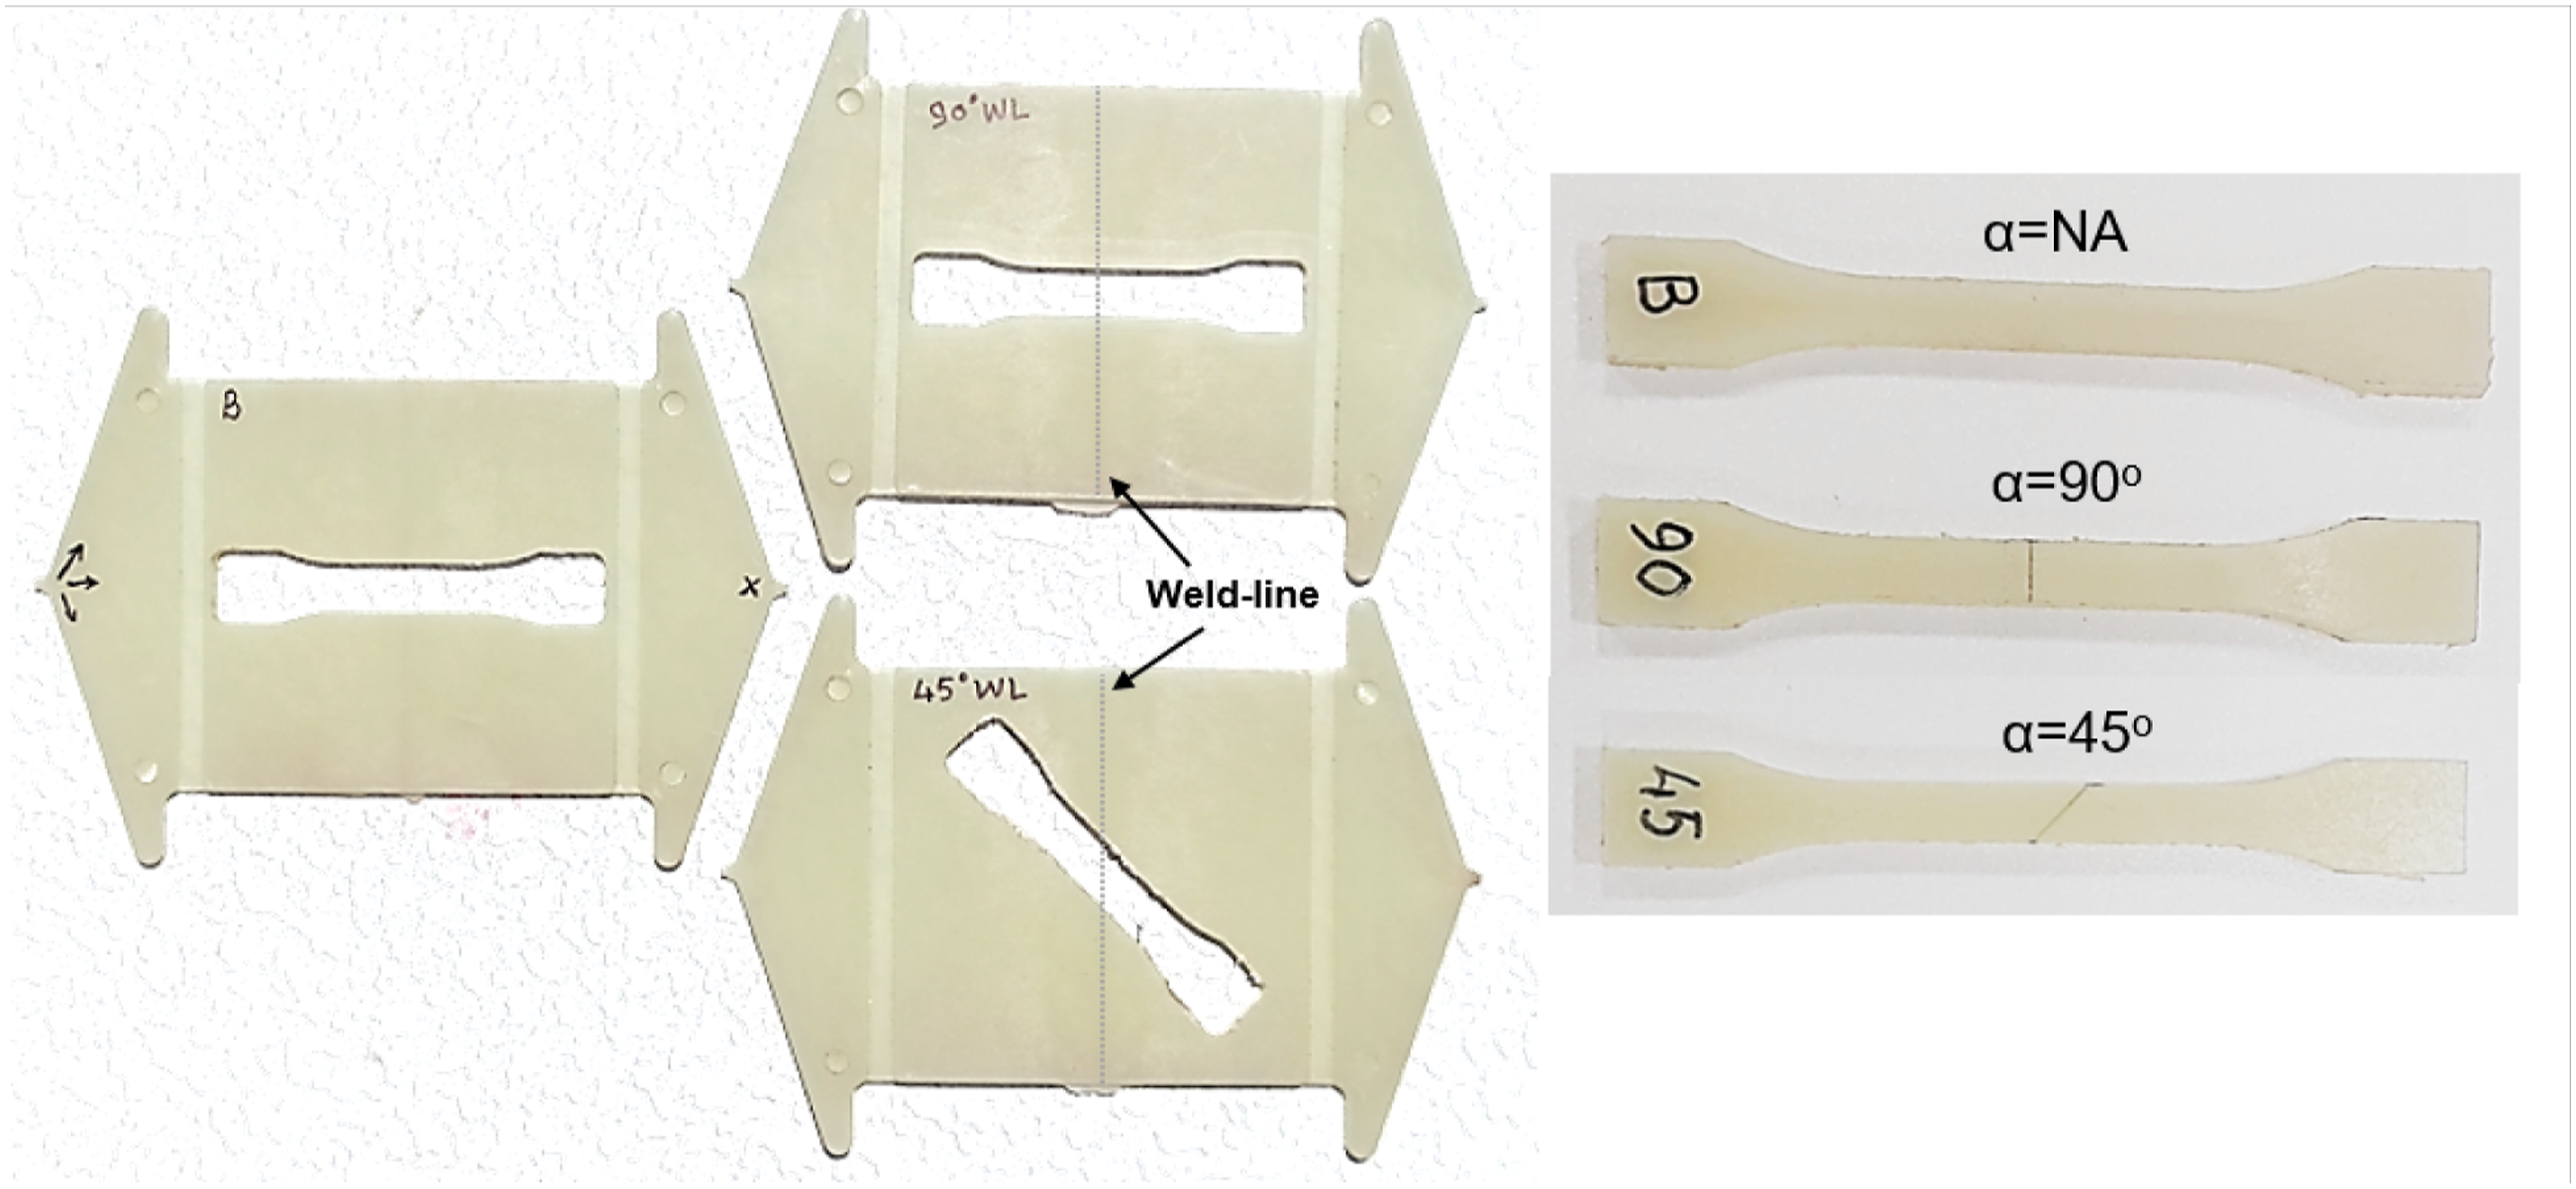
As a prerequisite of ISO 527-2 testing for polyamide materials, the specimens are conditioned for sixteen hours at 23°C and a relative humidity of 50% as per ISO527-1:2009. This is required such that all specimens have the same mechanical properties and there will not be any effect of moisture on it.
Tensile tests are conducted as per ISO 527-2 on a uniaxial tensile test machine from ZwickRoell at room temperature. The loading speed/strain rate is maintained at 6 mm/min (0.1/s). Three specimens are tested for each case. The mean and the standard deviation are reported for result discussion. Three outputs are determined by tensile testing viz tensile modulus, stress at a break, and strain at a break.
Microscopy analysis
After experimental testing, the failed surfaces of specimens are analyzed with a scanning electron microscope (SEM) technology in GeminiSEM 300 microscope from Zeiss (OEM), which has a high-resolution capacity at low voltage. The small pieces of the fractured specimens are cut and located on a scanning sample holder in angular positions. The scanning camber system vacuum is maintained at 5E-5 millibar as per the requirement of scanning. The magnification of 300X is set and 12 kV acceleration voltage is set to achieve a good surface image. The microscopy analysis is done for eight samples for 90° weld-line (1–4 number) and No weld-line (5–8 number) for different packing pressures. Figure 7 shows the scanning electron microscope (SEM) and a piece of the fracture surface of specimens located on the specimen holder. The scanning observations and images are discussed in the next part of the paper. Scanning Electron Microscope (SEM OEM: Zeiss) and piece of the fracture surface of specimens.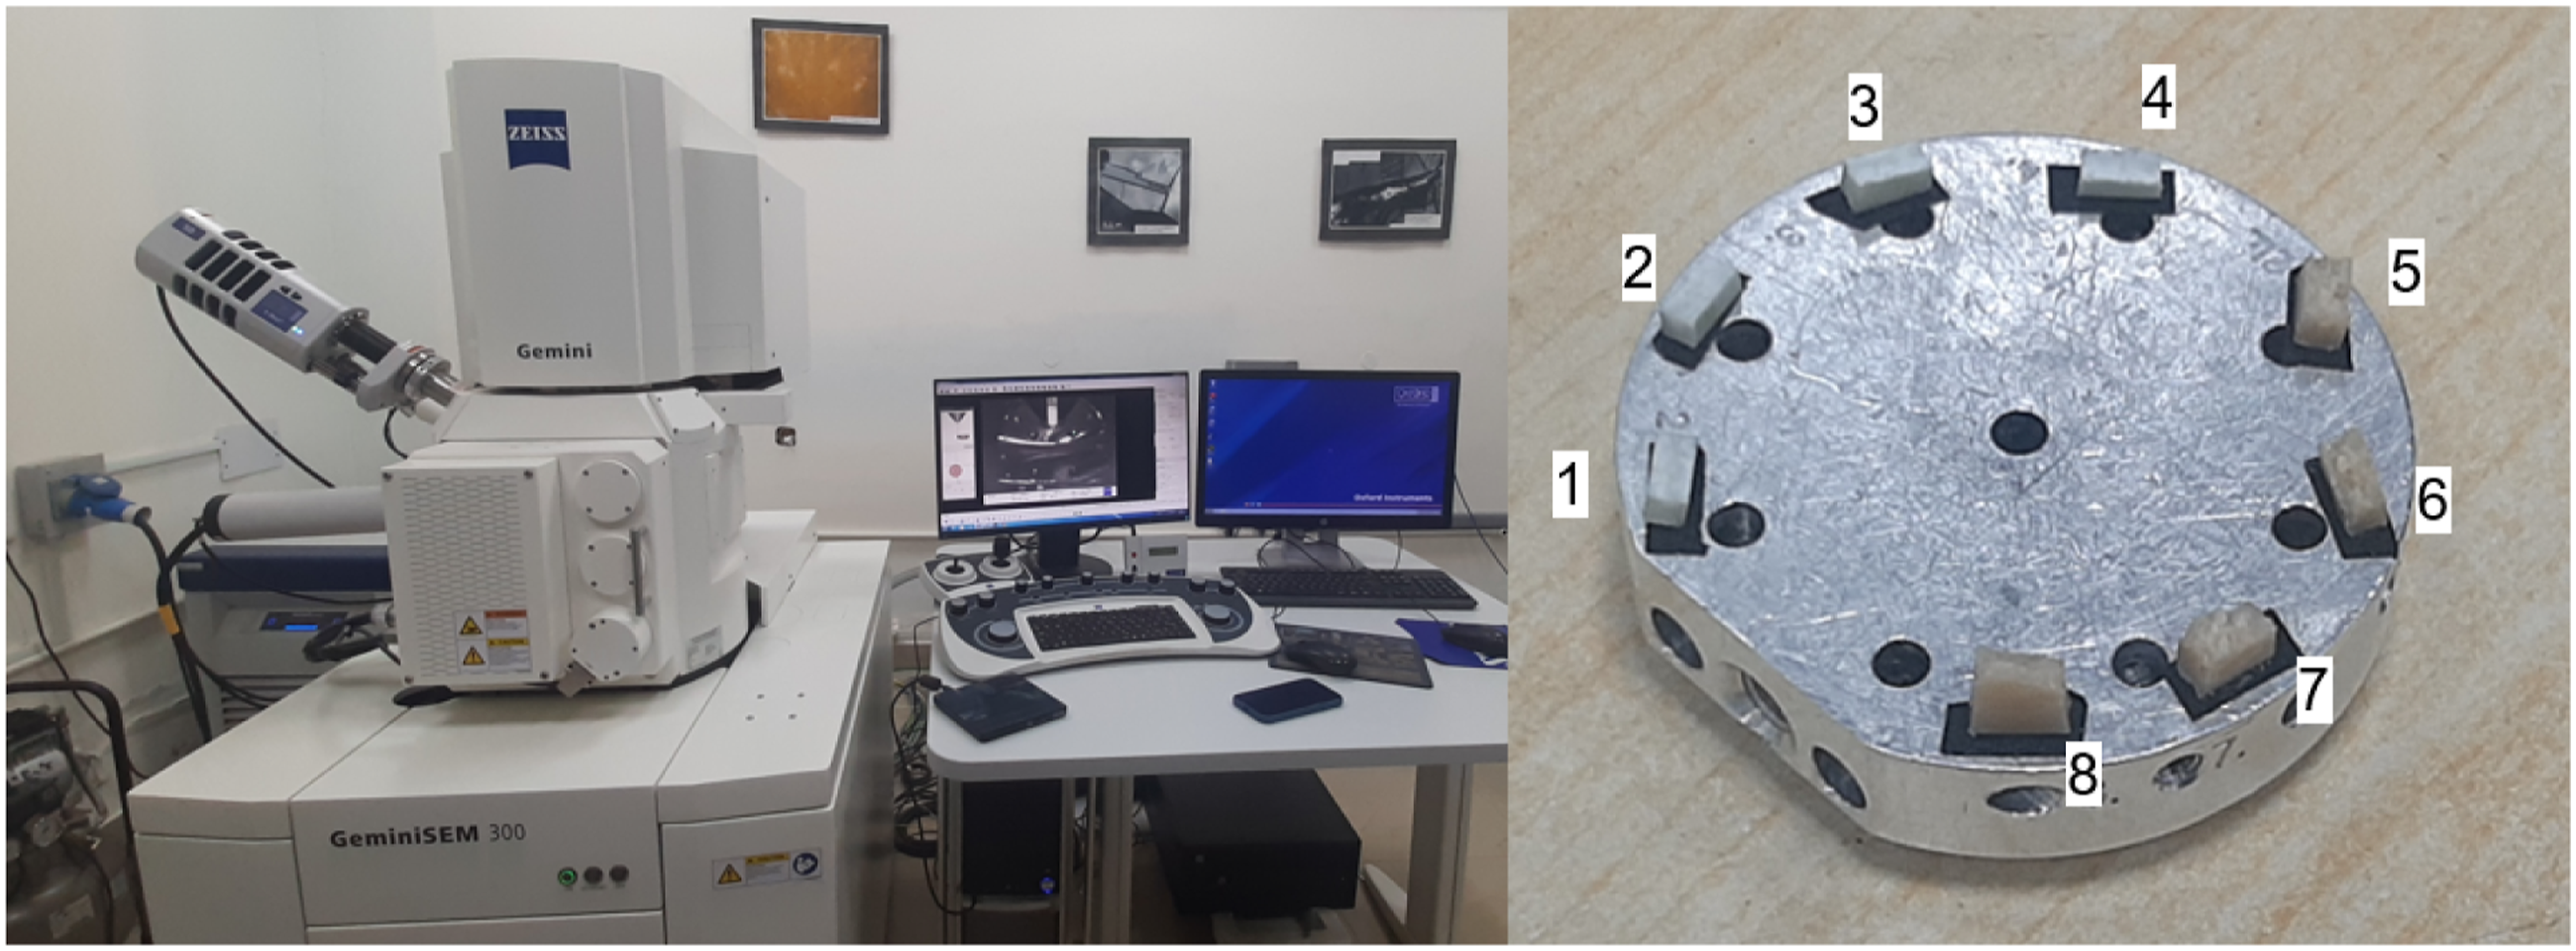
Results and discussion
For semicrystalline fiber-reinforced material, the strength of the component is mainly dependent on how fibers are aligned inside the component.
14
Therefore, for No weld-line plaques, the flow of the melt is from one direction to another through the full-width fan gate which gives highly aligned fibers along the flow, hence the strength in the flow direction is higher in magnitude. When packing pressure increases at the core region of the cavity, matrix molecules as well as fibers are coming close to each other, which improves the overall filling quality and strength of the component.
7
The amount of compactness of the molecules and fibers is dependent on the magnitude of packing pressure before the solidification of the gate. An increasing filling density with increased packing pressure reveals the compactness of matrix molecules and glass fibers which has resulted in an increased mass of plaques. Figure 8 shows the stress-strain behavior of the no weld-line specimens, 90° weld-line specimens, and 45° weld-line specimens. From the results of no weld-line specimens, it is observed that the tensile strength of the specimens increases with packing pressure, however for specimens with weld line it is found to be increasing with packing pressure till the packing pressure is equal to filling pressure and thereafter reduces with further increase in packing pressure. Stress-strain curves for no weld-line, 90° weld-line, and 45° weld-line for packing pressure equal to (a) 60%, (b) 80%, (c) 100%, and (d) 120% of filling pressure.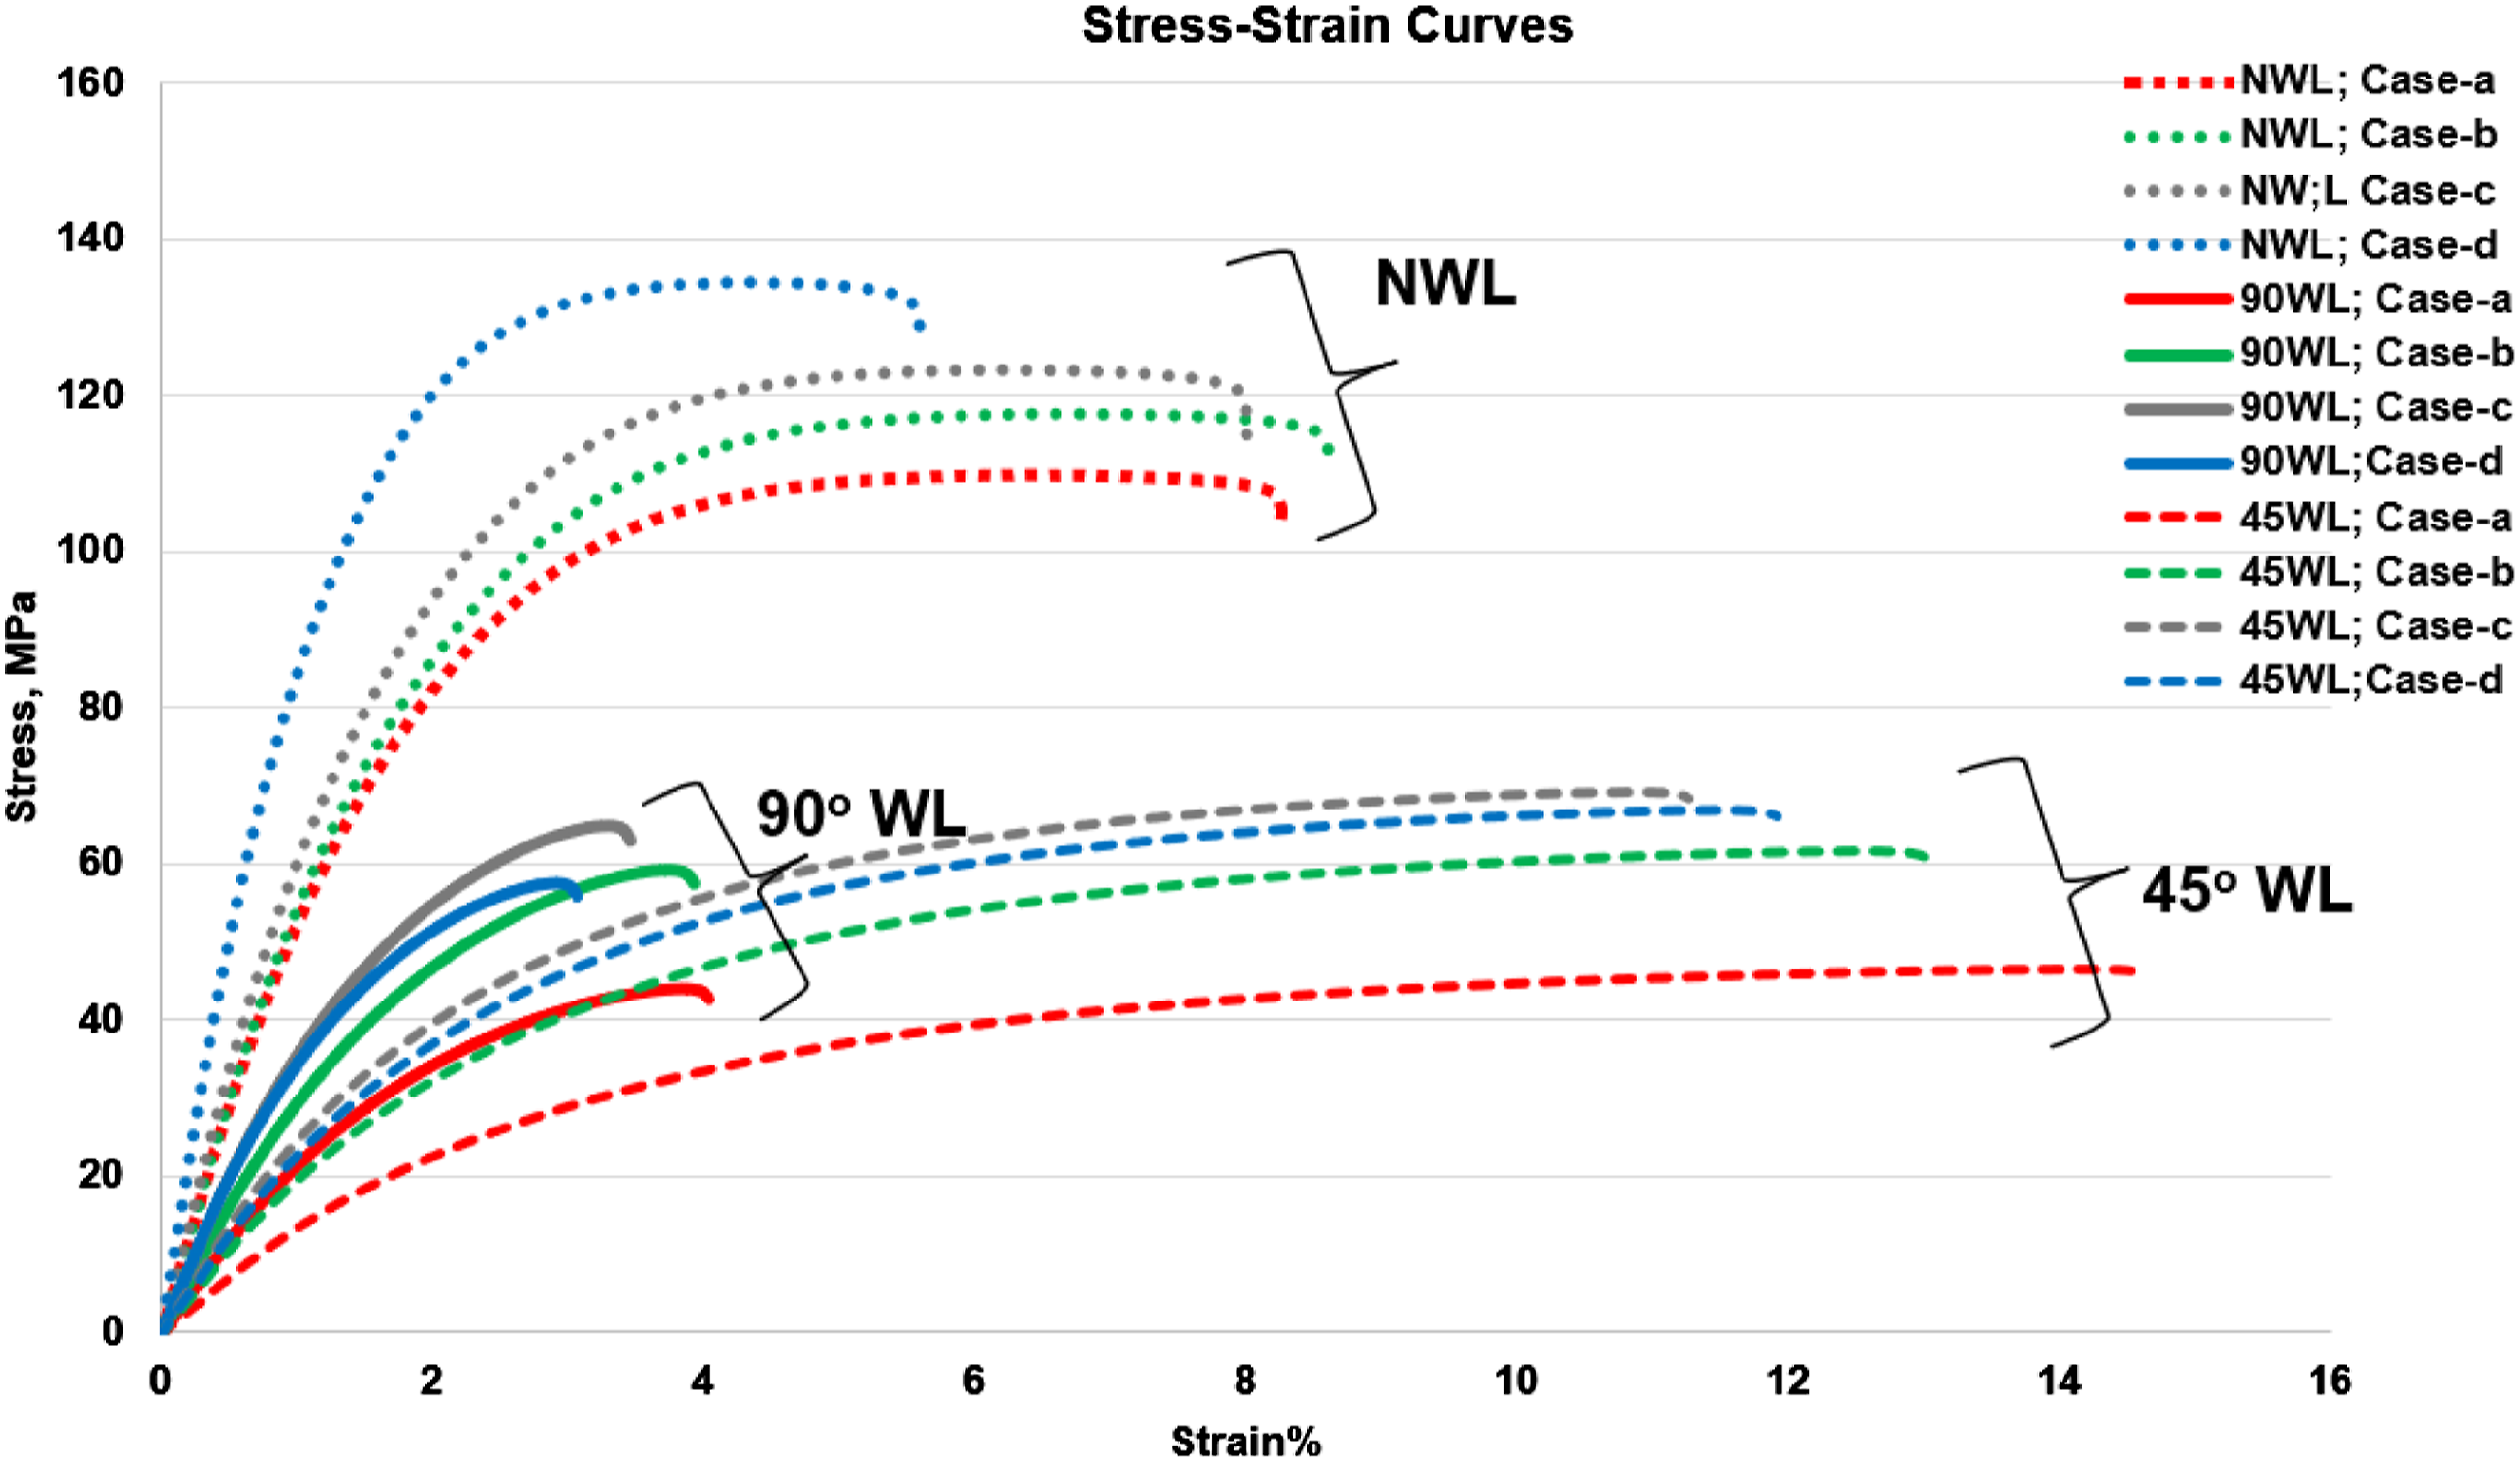
Fiber orientation distribution at the weld-line area is one of the main reasons for the reduction in strength of the specimens with weld-line. When two melt fronts meet with each other, the fibers in the core area are adjusted as per fountain flow which is nearly perpendicular to the initial flow direction.
15
Hence weld-line specimens break along the weld-line plane where resistance to load is minimum from the glass fiber. Figure 9 shows the failure pattern of test specimens during tensile testing of the specimens. It clearly reveals the failure of the specimens occurred at the weld-line plane. Tensile test break specimens with no weld-line(B), 90° weld-line, and 45° weld-line for packing pressure equal to (a) 60%, (b) 80%, (c) 100%, and (d) 120% of filling pressure.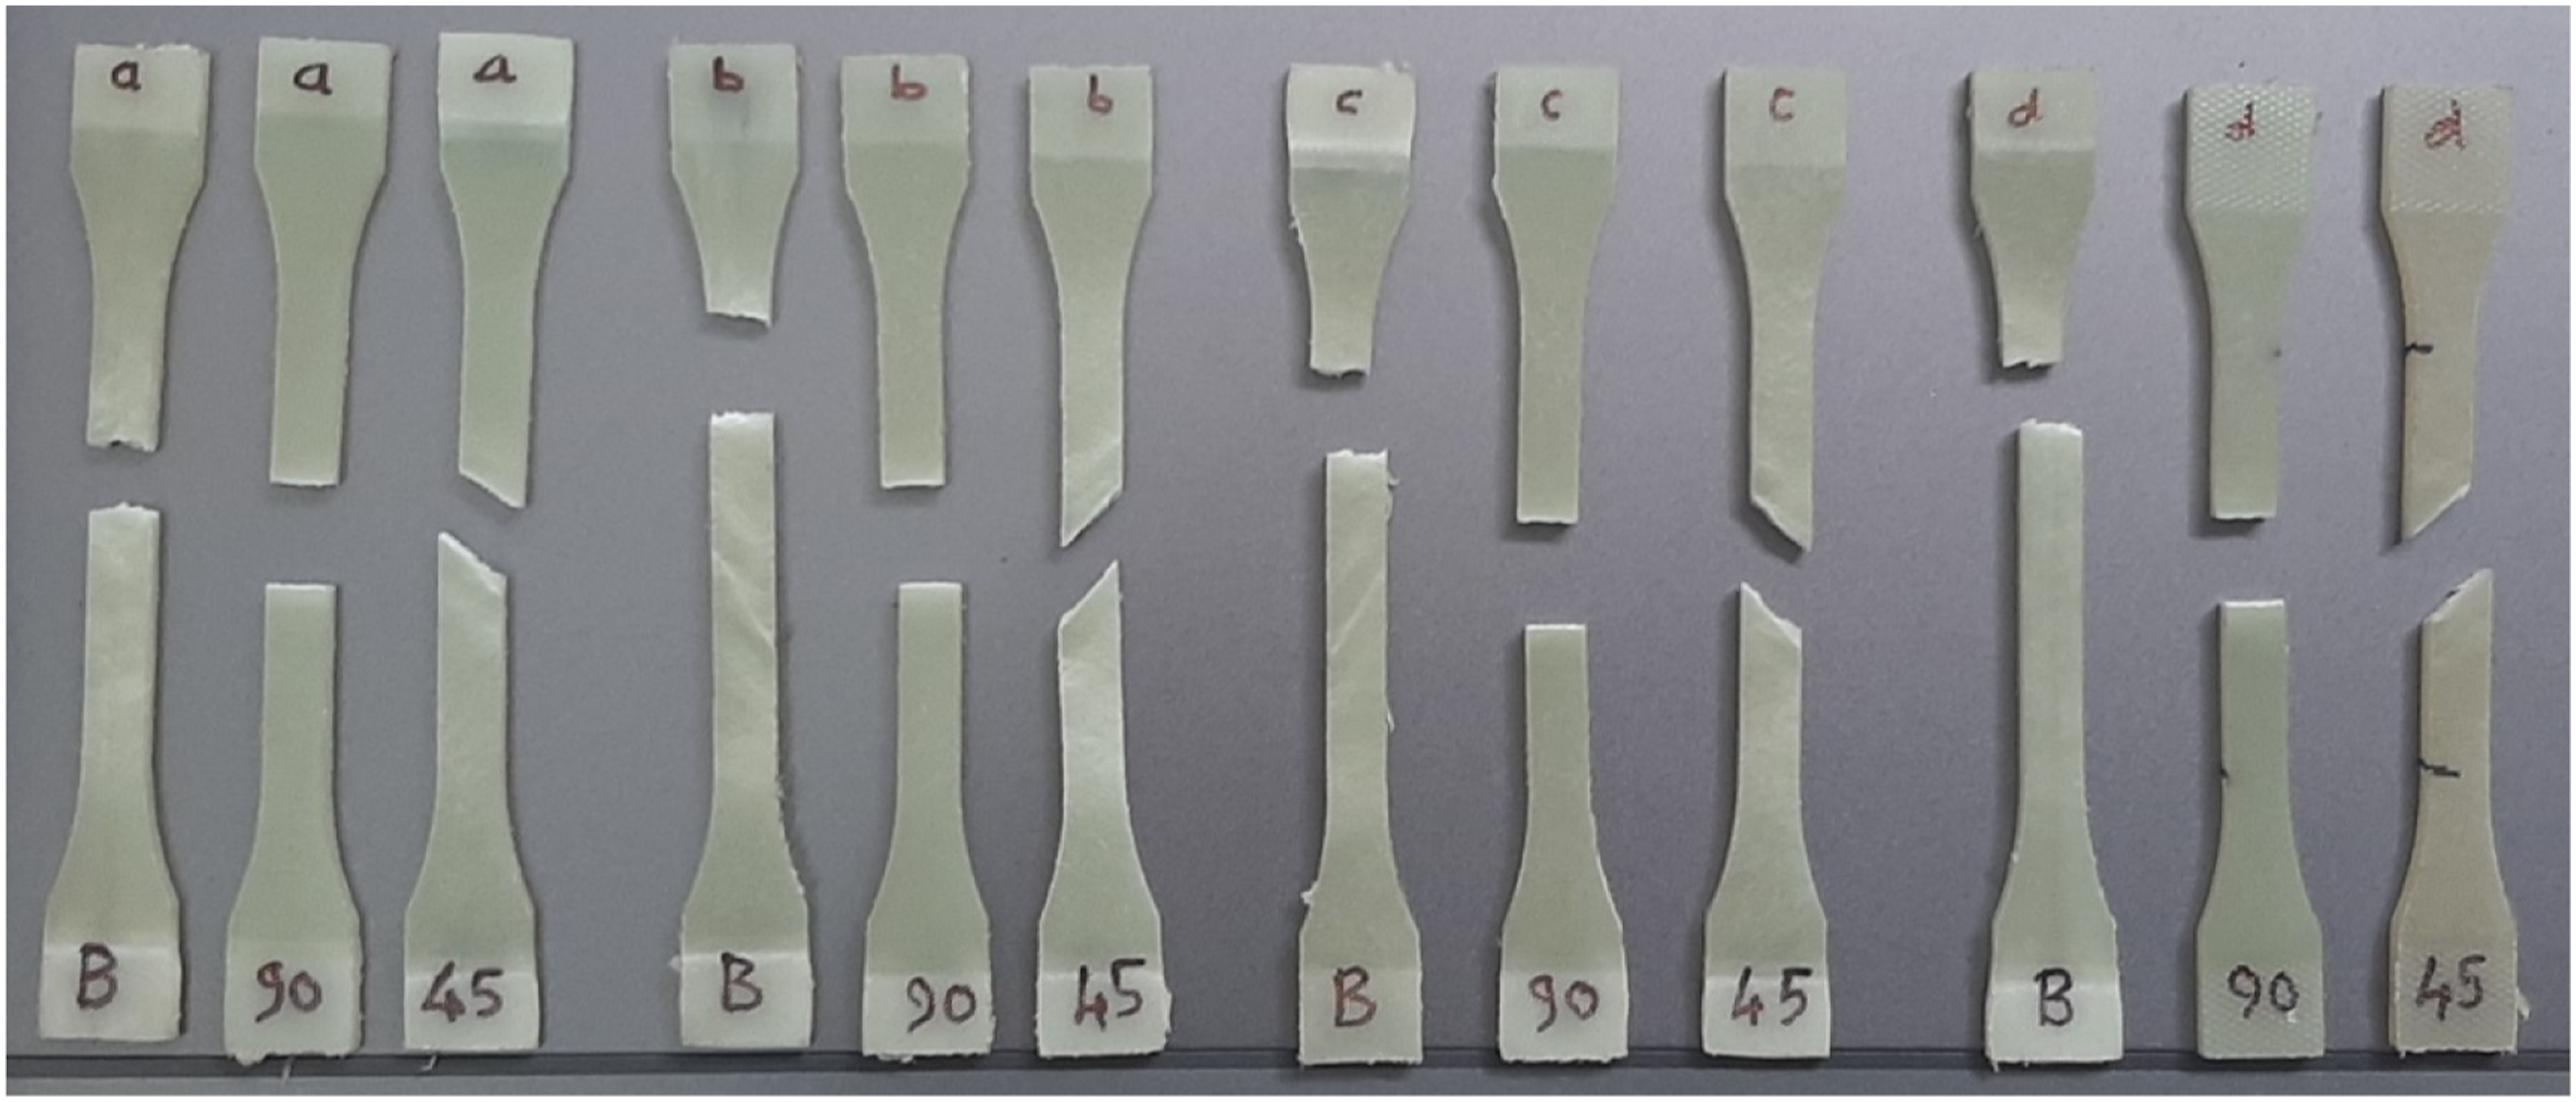
Figure 10 shows the microscopic view of the fractured surface of No weld-line specimens for different packing pressures. It is observed that most of the fibers are broken perpendicular to the axis of the fiber that is perpendicular to the flow direction. This reveals that maximum numbers of fibers are aligned parallel to the flow direction and contribute maximum resistance to the externally applied load before failure. Hence tensile modulus and stress at break values are higher for No weld-line specimens. It is also observed that when packing pressure increases the density of the fibers and matrix is improved which results in an increase in stiffness and a reduction in ductility. This is evident in the stress-strain curve of No weld-line specimens as shown in Figure 8 and corresponding results are shown in bar charts in Figure 12 and Figure 13. Microscopic view of a fractured surface of no weld-line specimens for packing pressure equal to (a) 60%, (b) 80%, (c) 100%, and (d) 120% of filling pressure.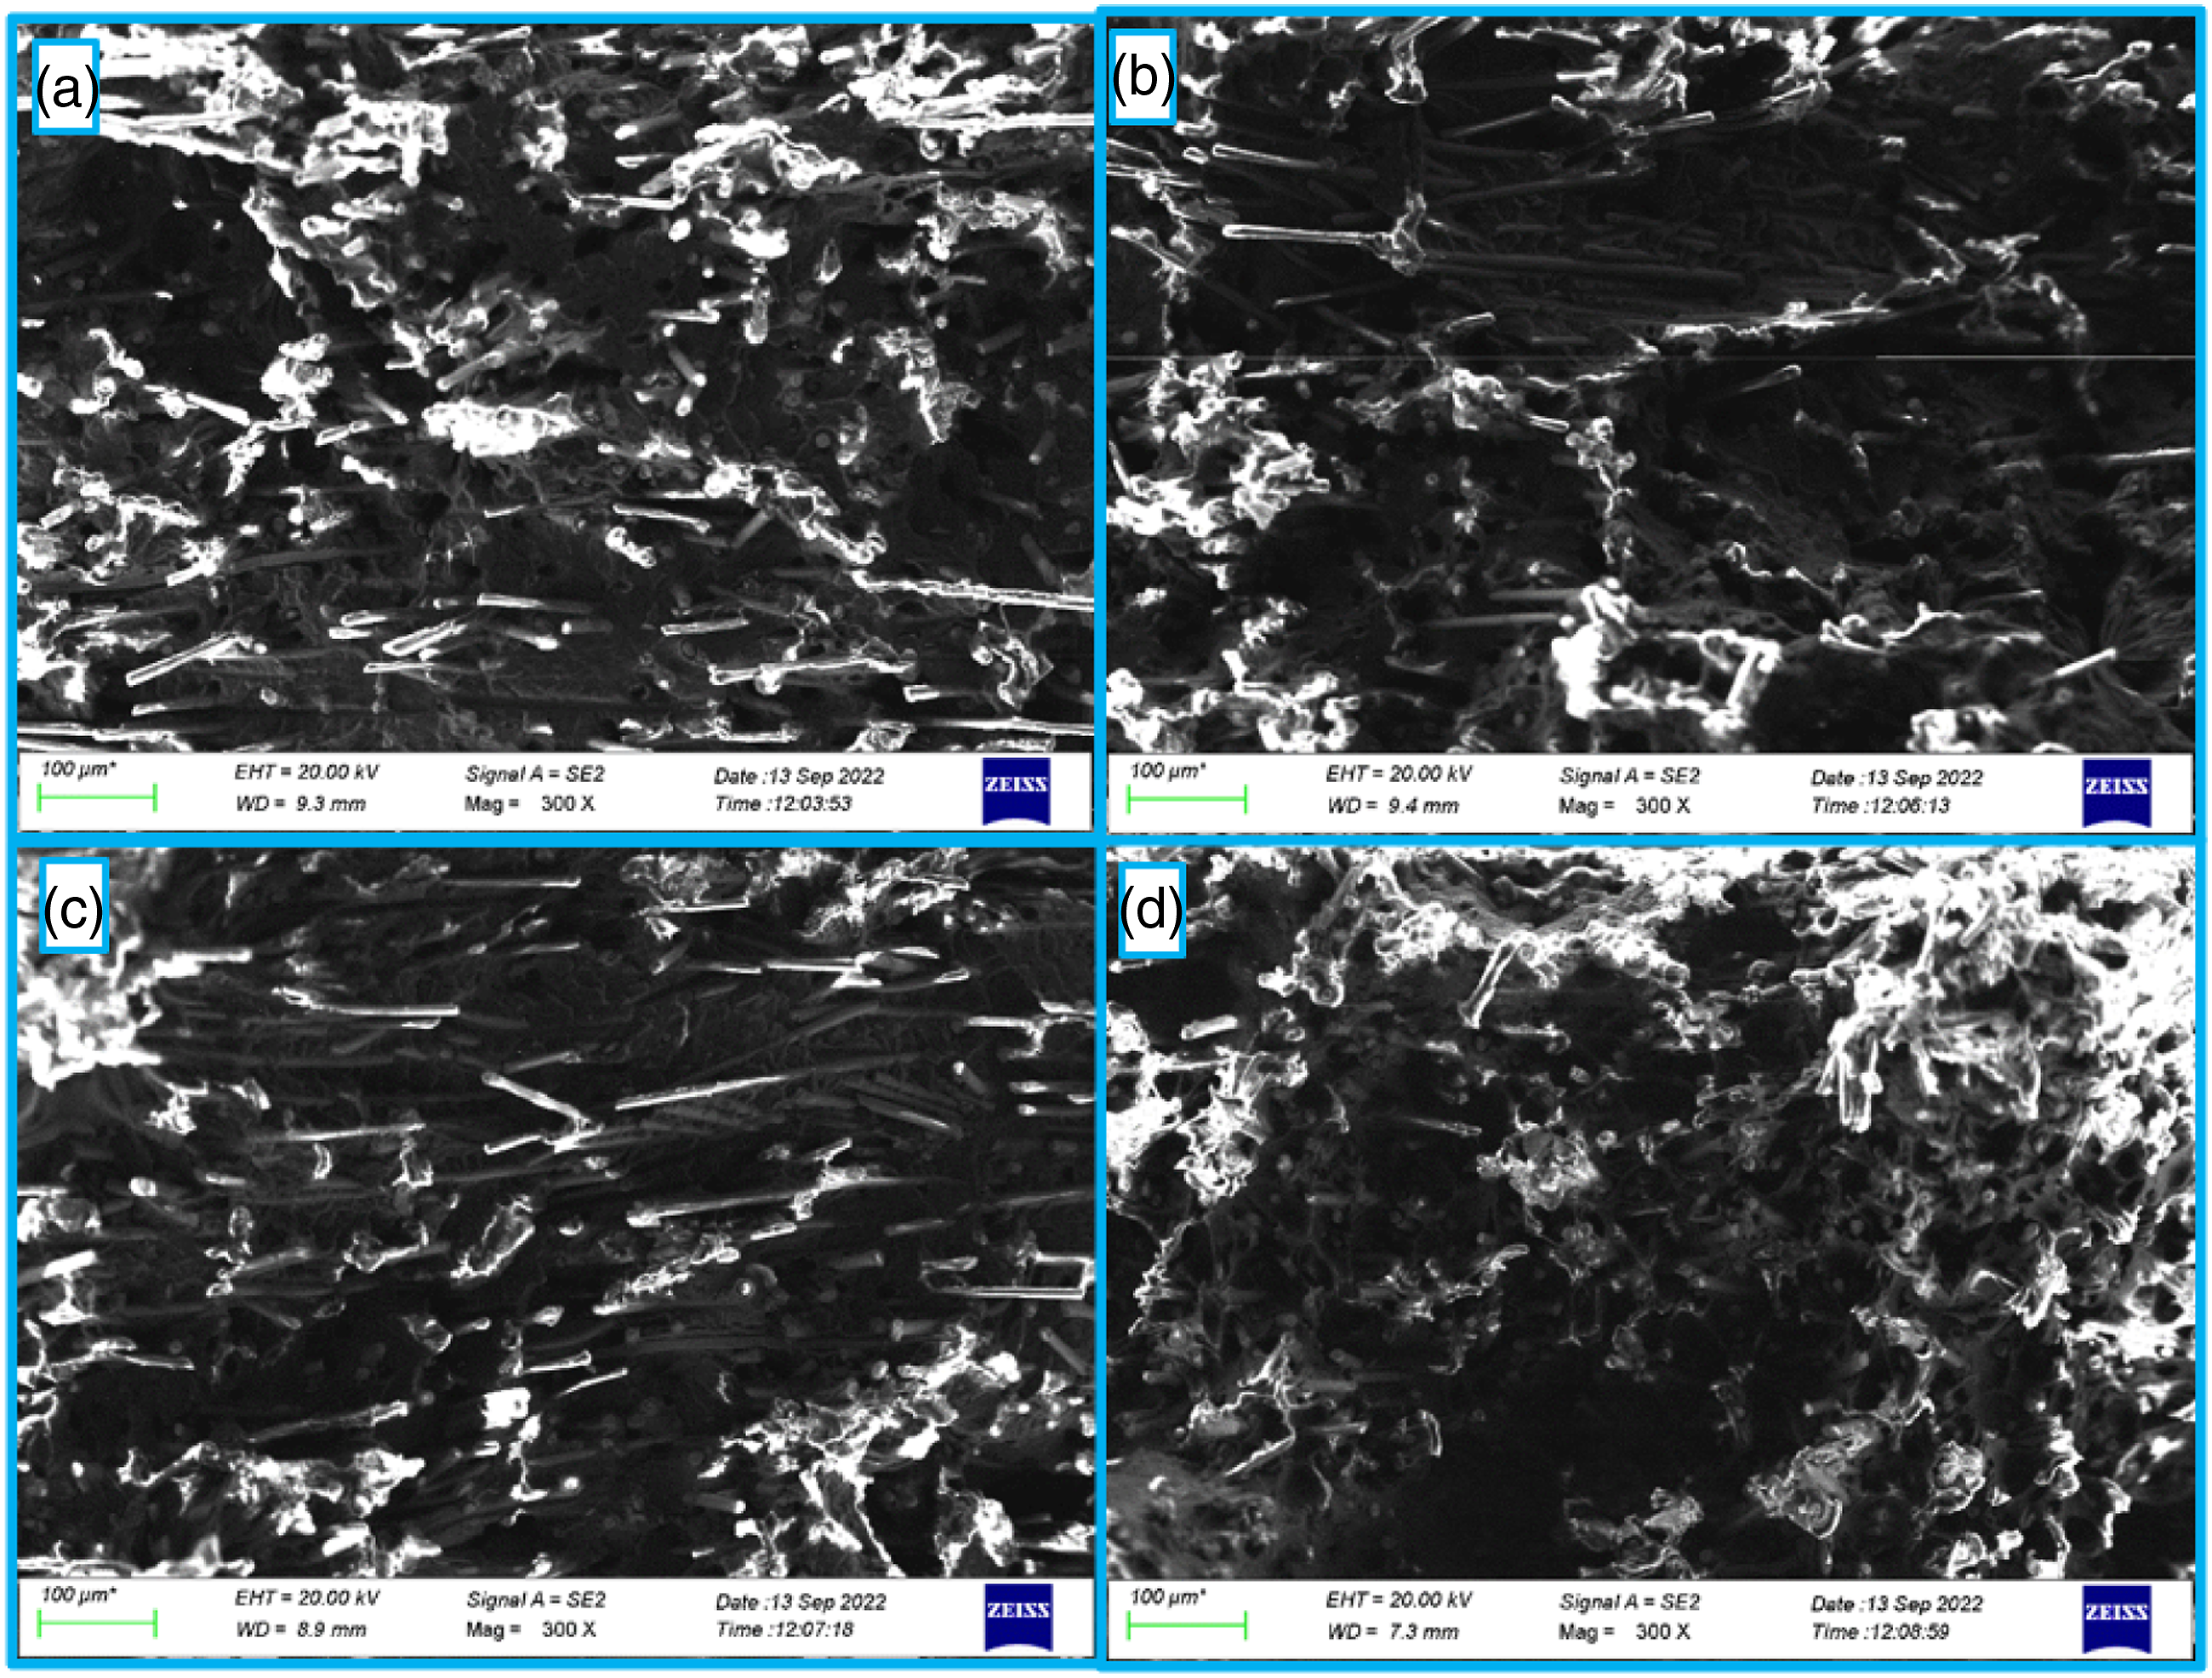
Figure 11 shows a microscopic view of the fractured surface for 90° weld-line specimens for different packing pressure. The scanning electron micrographs depict that many fibers are parallel to a fractured surface/plane. Thus, the fibers in the weld-line region changed their direction and maximum numbers of fibers are oriented perpendicular to the flow direction. This may be the reason for a significant drop in stress at the break at the weld line location as compared to the specimen with No weld line. This is also evident from stress-strain curves of 90° and 45° weld-line specimens as shown in Figure 8. The results pertaining to the tensile modulus of the specimen with and without weld lines are shown using bar charts in Figure 12 and Figure 13. Microscopic view of a fractured surface of 90° weld-line specimens, for packing pressure equal to (a) 60%, (b) 80%, (c) 100%, and (d) 120% of filling pressure. Tensile modulus for no weld-line, 90° weld-line, and 45° weld-line for packing pressure equal to (a) 60%, (b) 80%, (c) 100%, and (d) 120% of filling pressure. Stress at break and strain at break for no weld-line, 90° weld-line, and 45° weld-line for packing pressure equal to (a) 60%, (b) 80%, (c) 100%, and (d) 120% of filling pressure.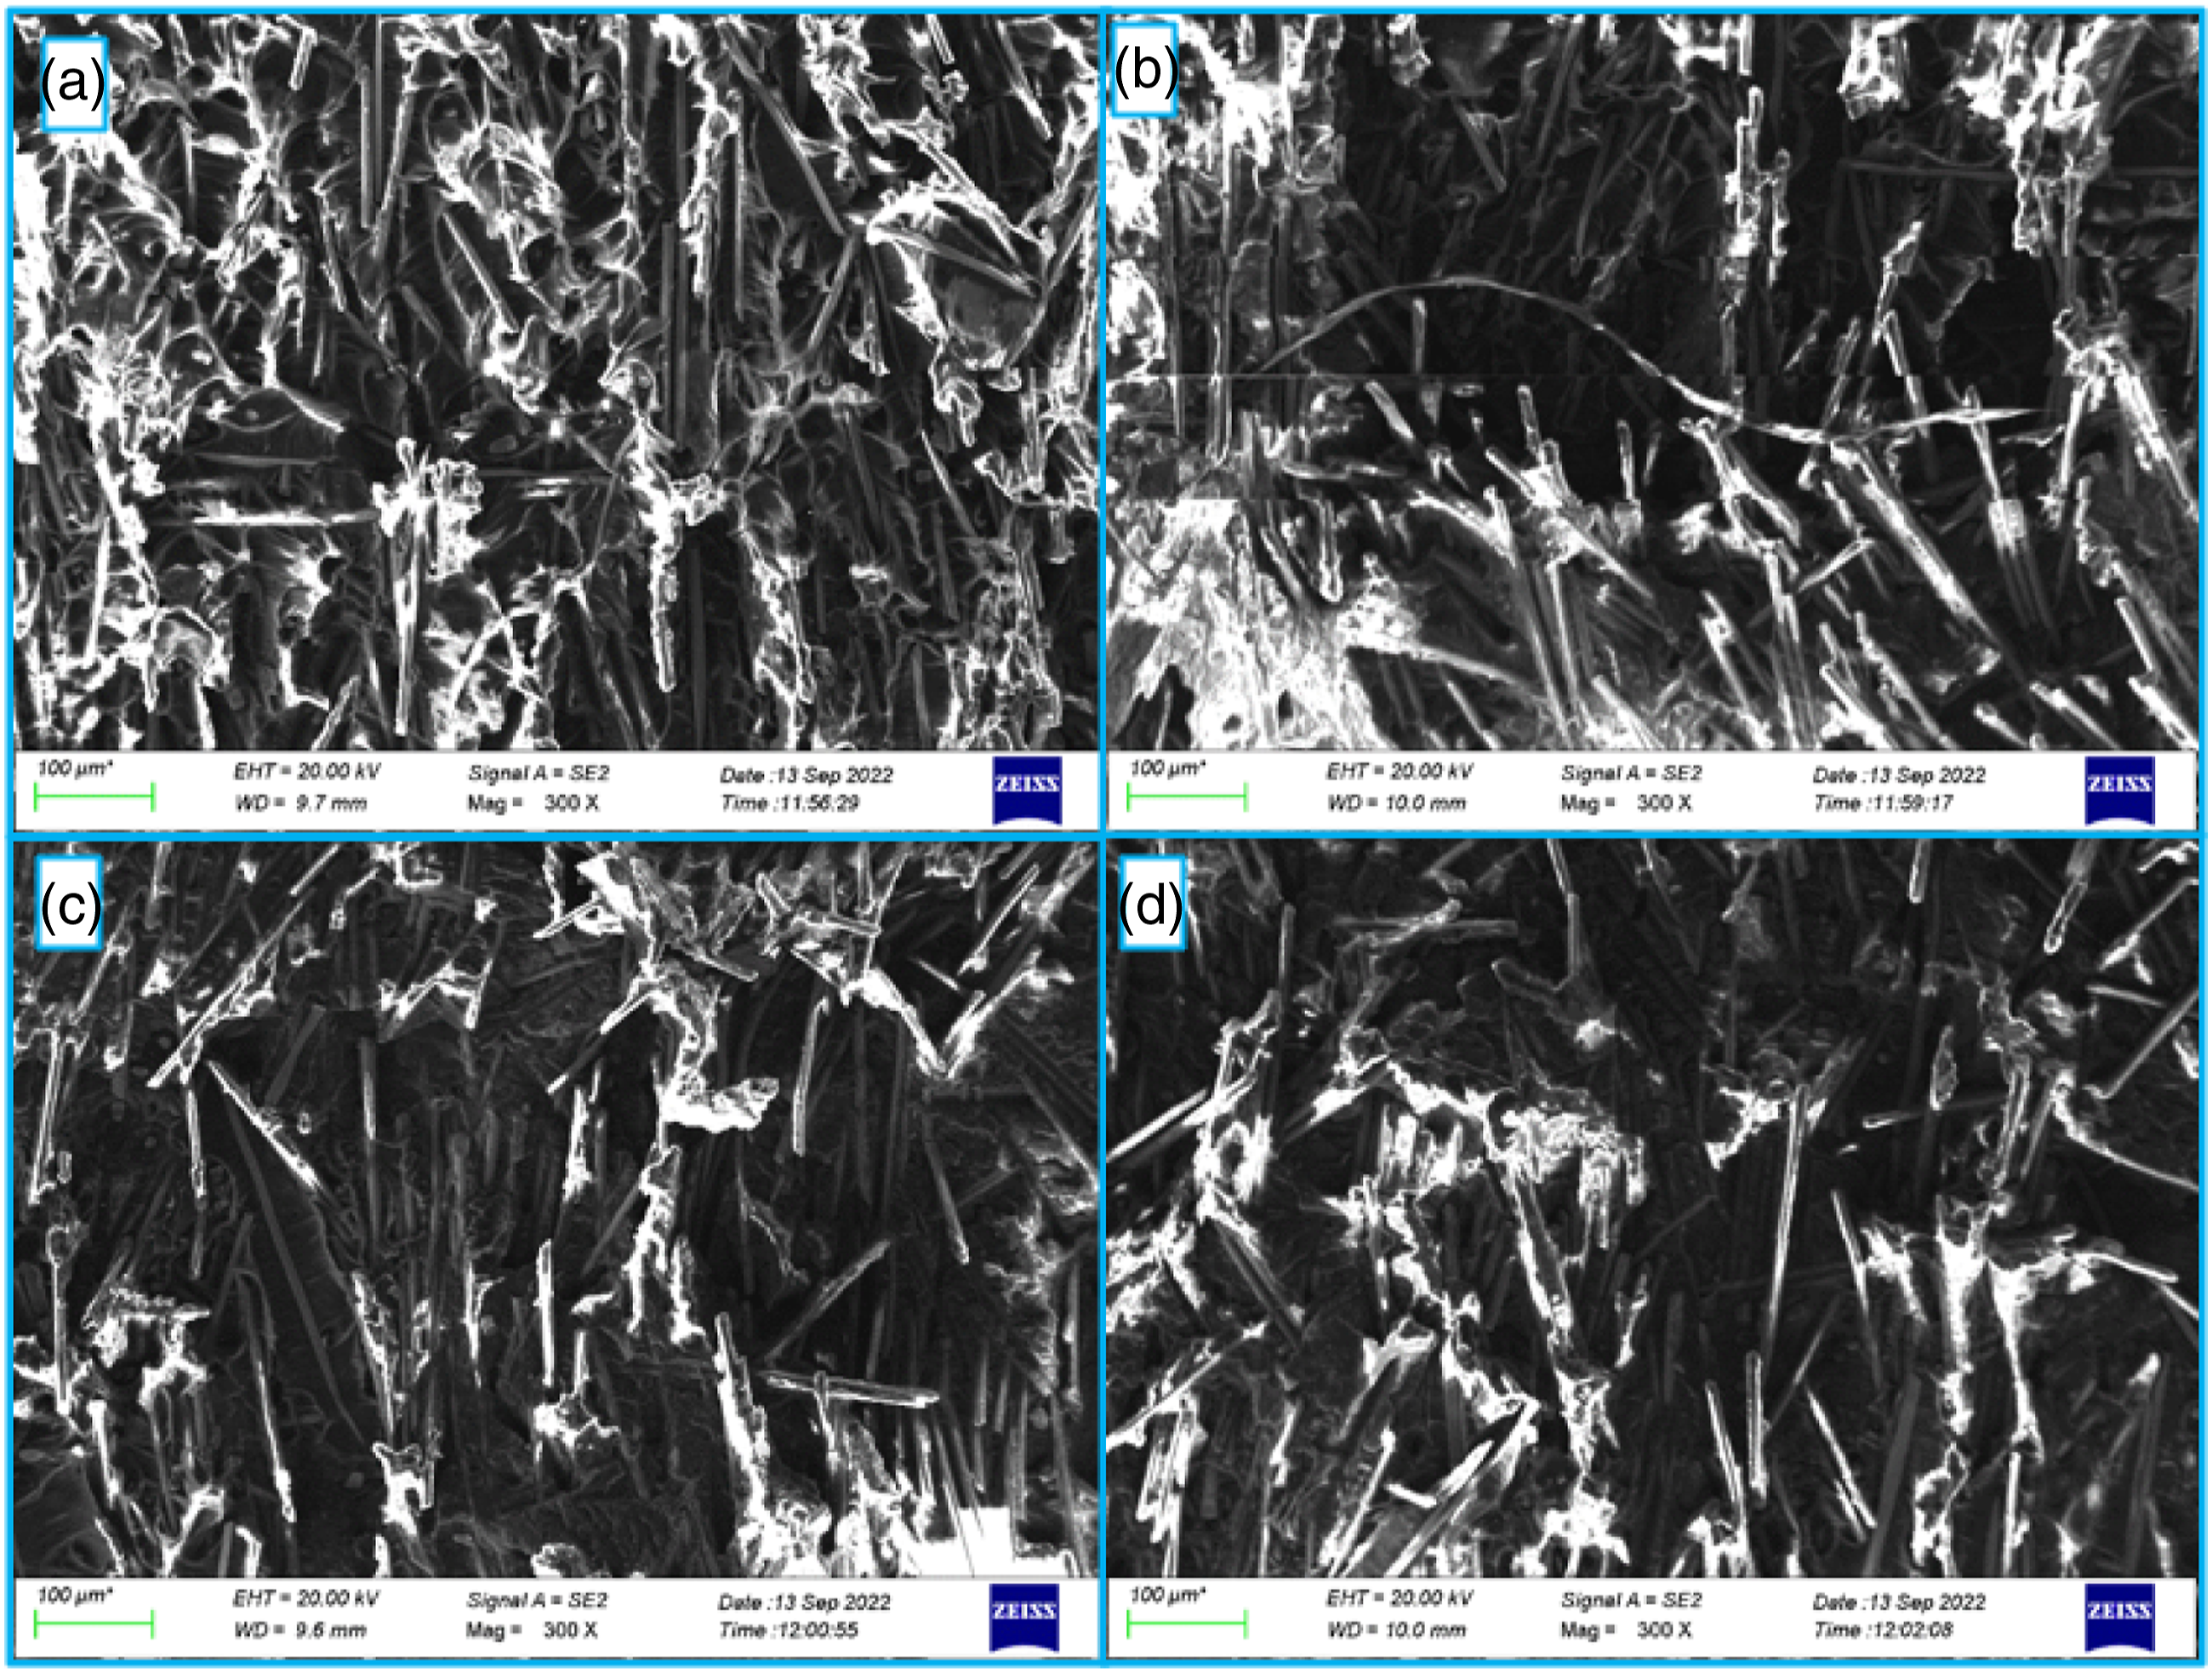
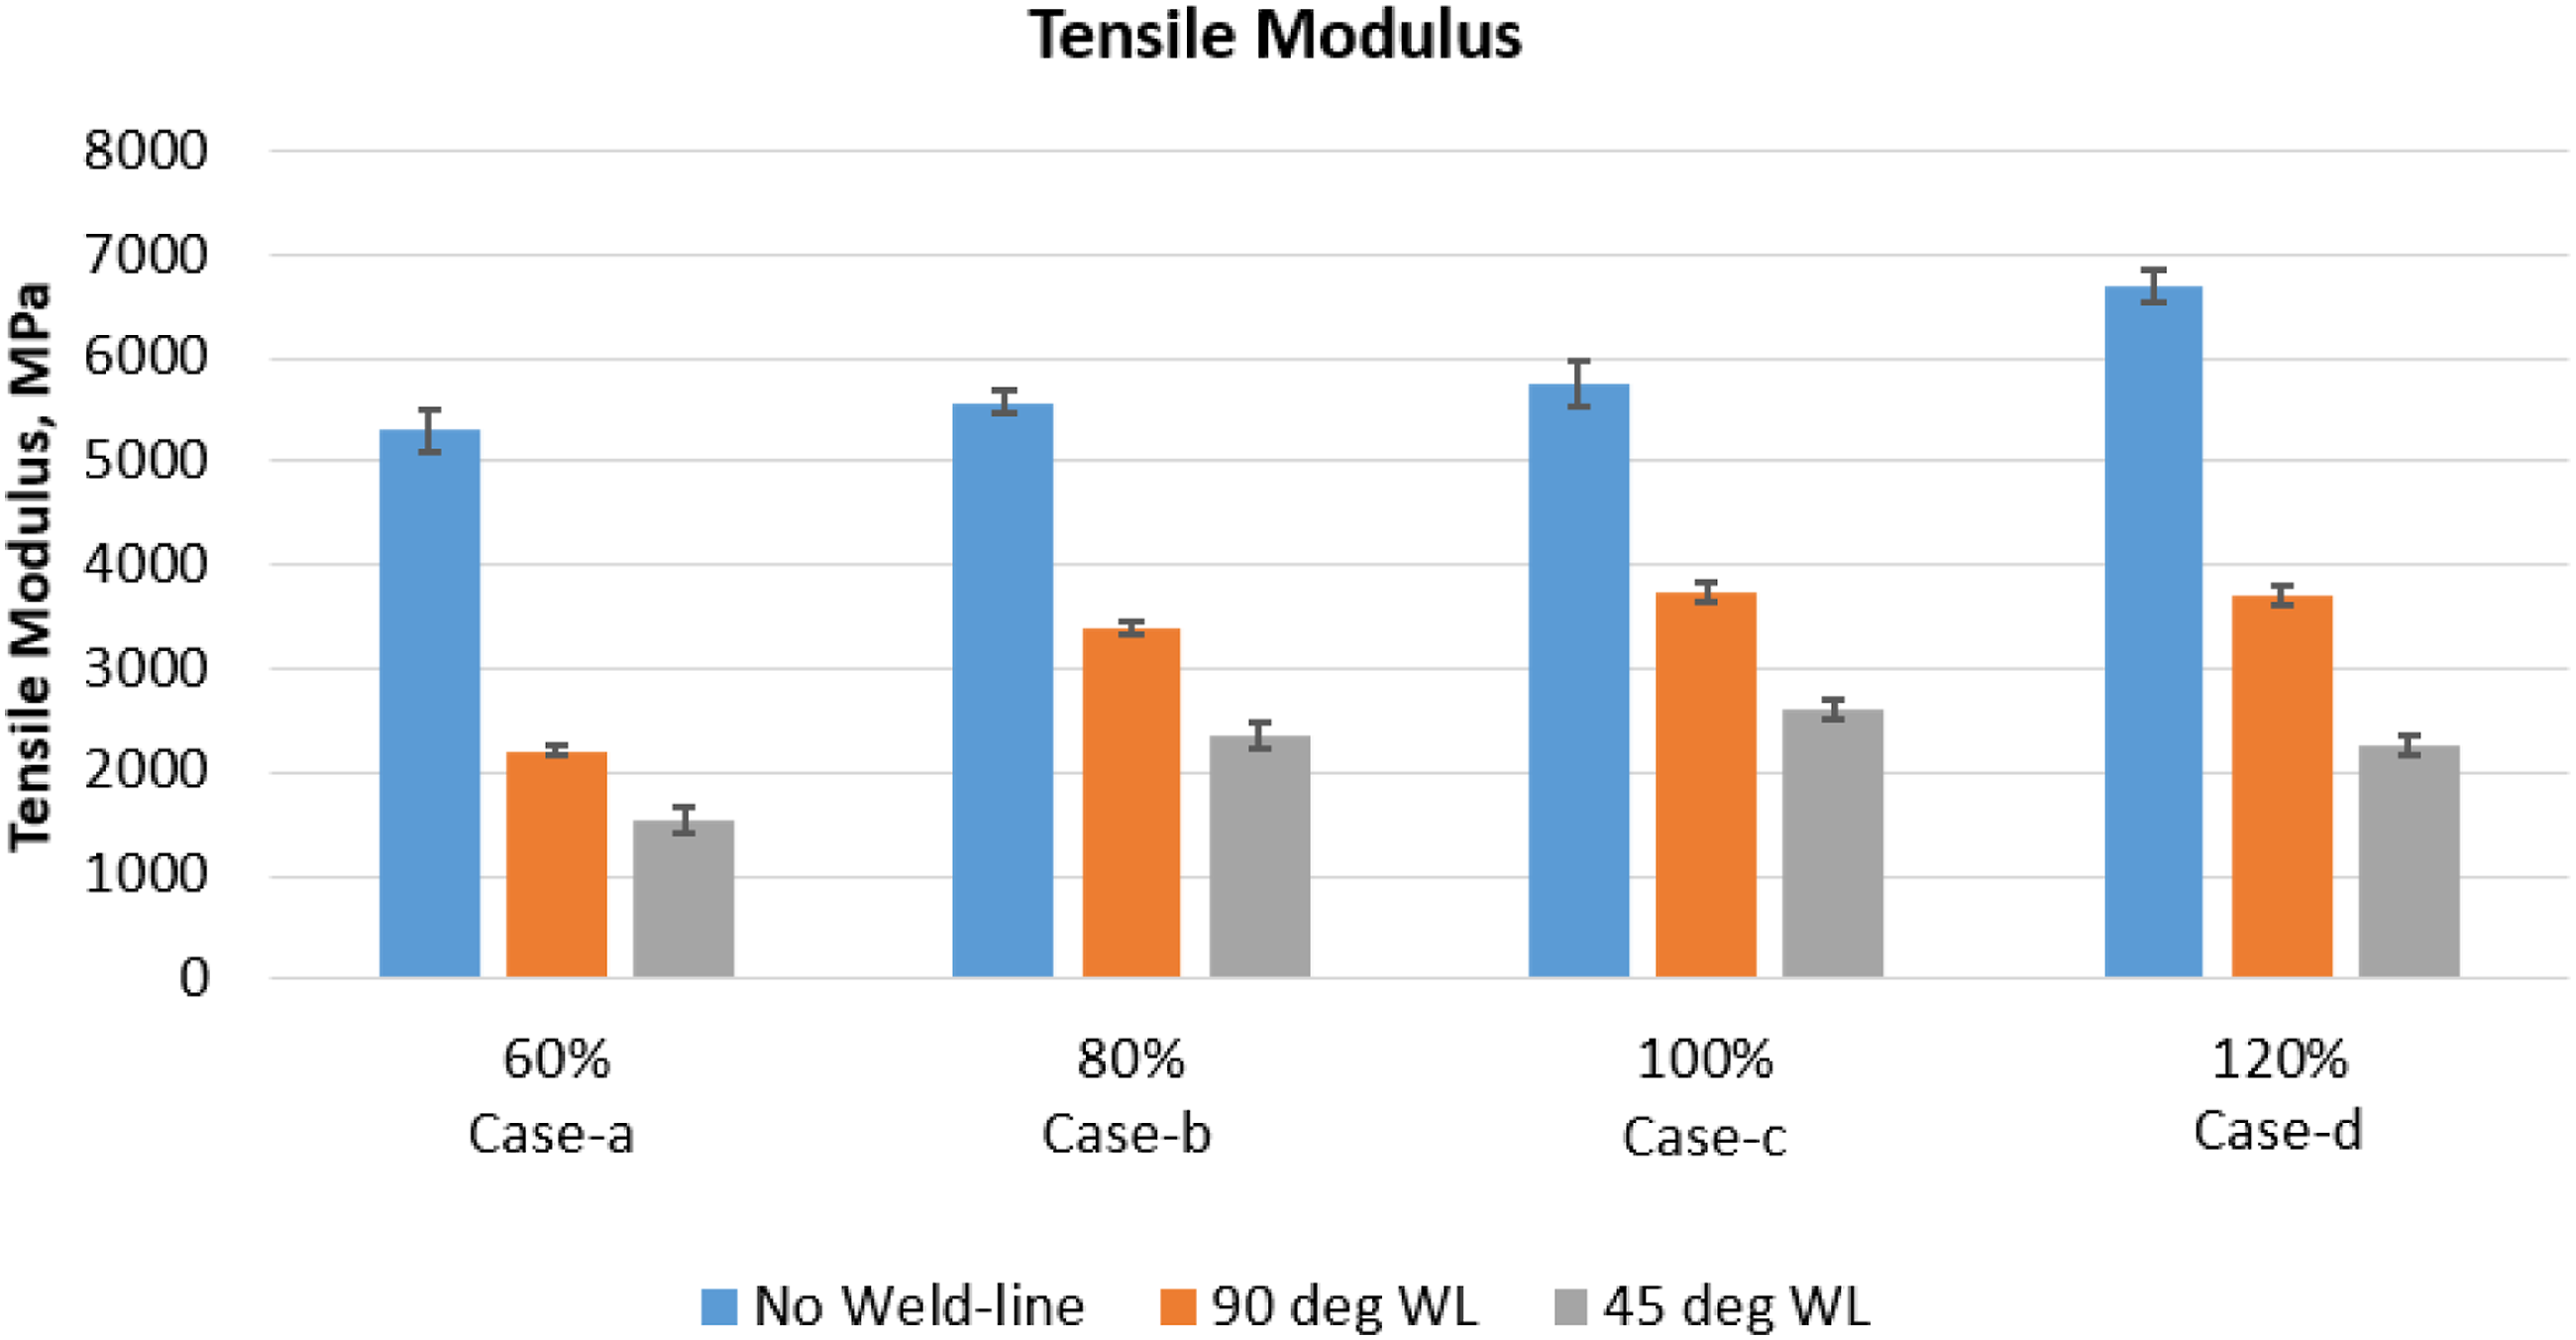
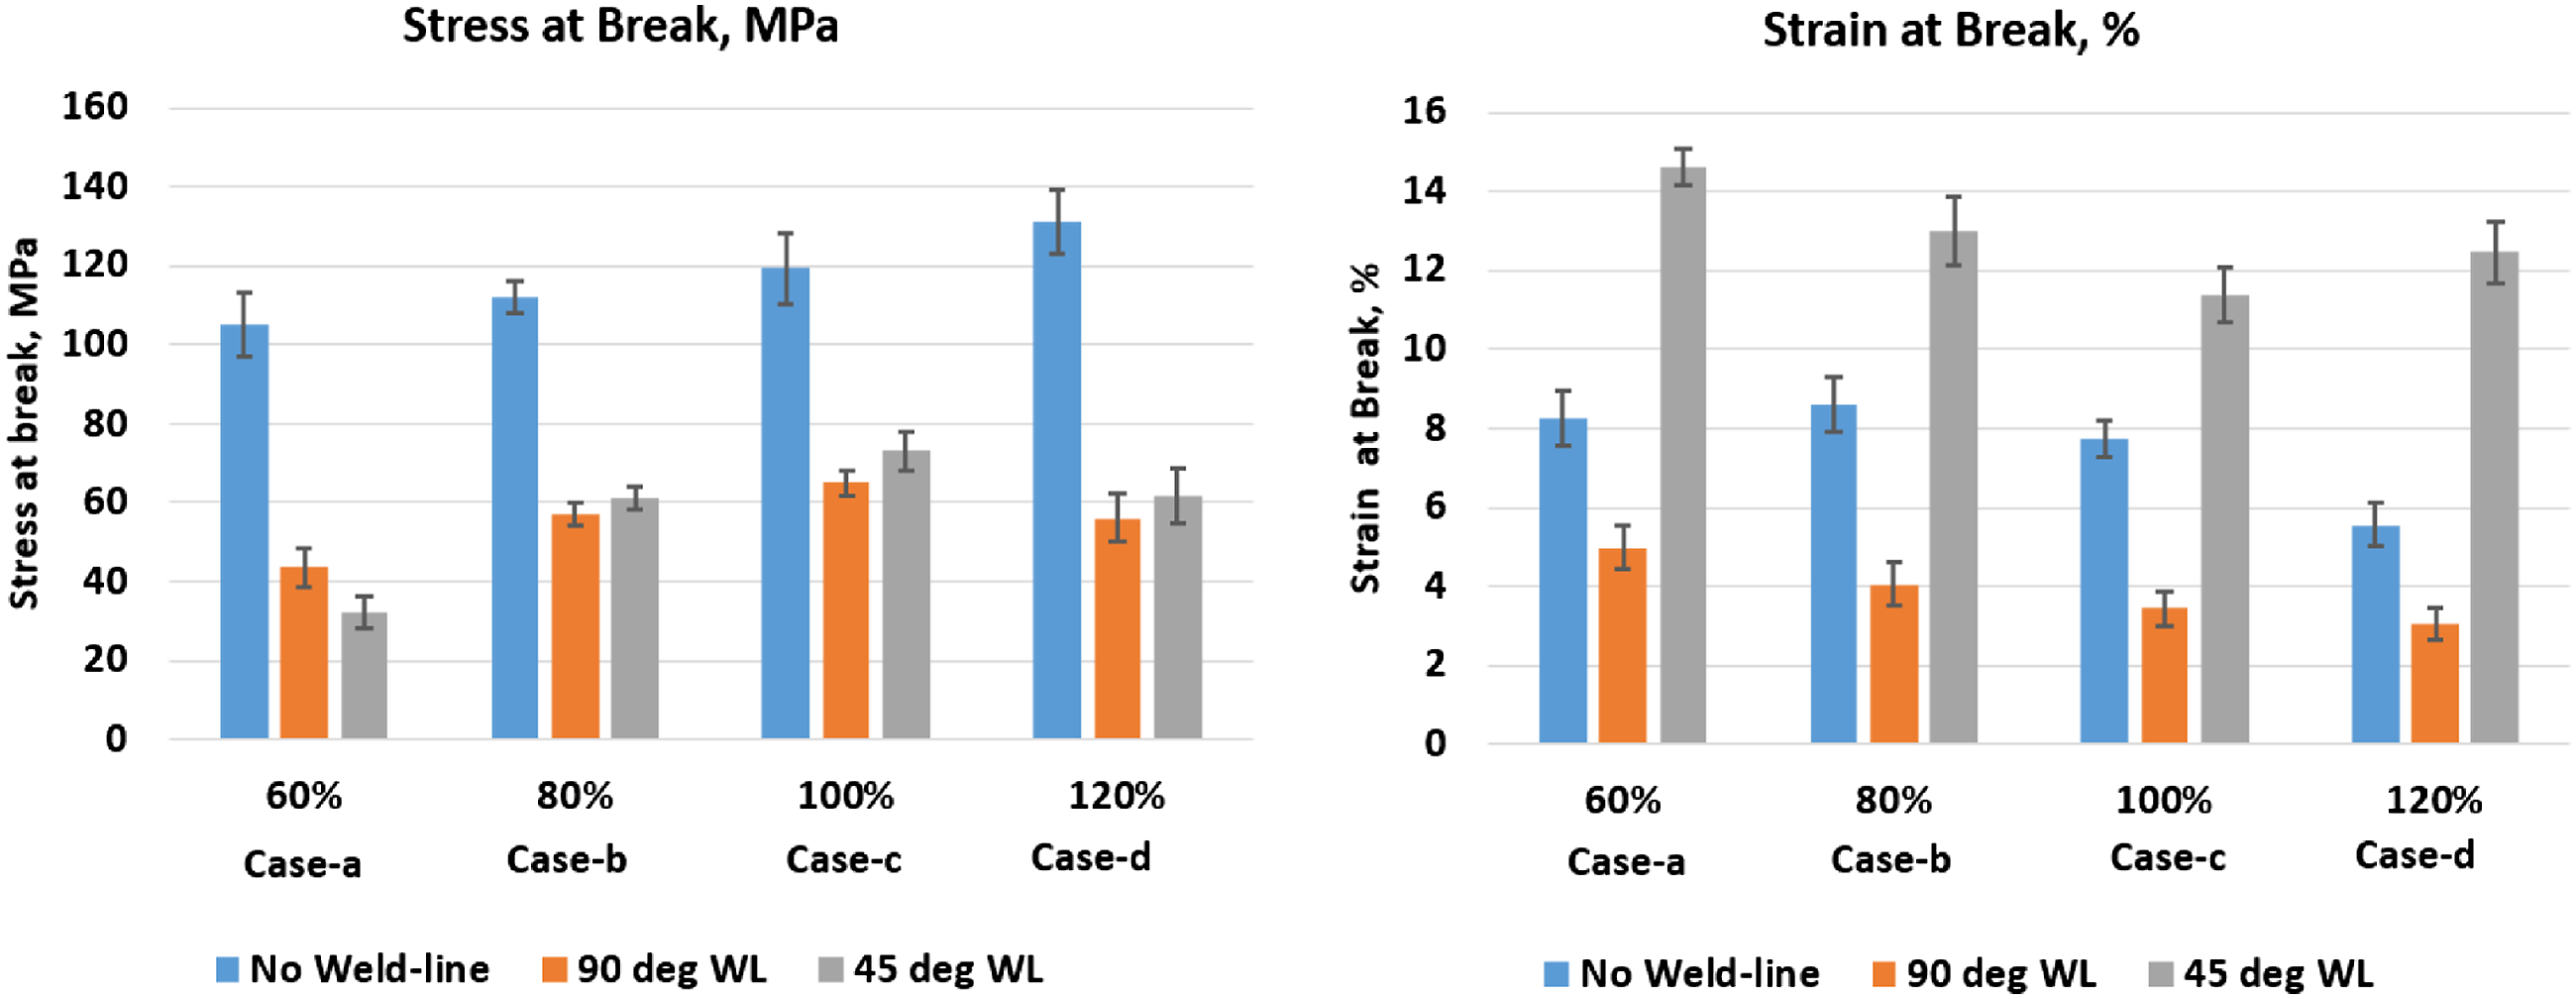
Figure 12 shows the tensile modulus for No weld-line, 90° and 45° weld-line specimens for different packing pressure. At the lower packing pressure (case-a), the tensile modulus of 90° and 45° weld-line specimens is 42% and 29% respectively compared to the tensile modulus of No weld line specimens. For intermediate packing pressure (case-b), the tensile modulus is found to be increased to 61% and 42% for the 90° and 45° weld-line respectively. There is a marginal increase in tensile modulus when packing pressure is equal to filling pressure (case-c). However, the tensile modulus shows decreasing trend when packing pressure is 120% of filling pressure (case-d). For No weld-line specimen tensile modulus increases with increasing packing pressure which is in good agreement with the study done in reference [1]. In short, with increasing packing pressure from 60% of filling pressure (case-a) to 100% filling pressure (case-c), the tensile modulus is increased by around 23% and 16% for 90° and 45° weld-line specimens respectively. However, for packing pressure equal to 120% of filling pressure (case-d) the tensile modulus is reduced by 14% and 5% for 90° and 45° weld-line specimens respectively. This reduction in tensile modulus and stress at the break may be attributed to material degradation because of excess pressure, which is difficult to analyze from microscopic evaluation in this study. However, in general, high pressure increases the specific volume which develops residual stresses 22 and this may be one of the reasons for the drop in tensile strength and the increase in elongation of the specimen.
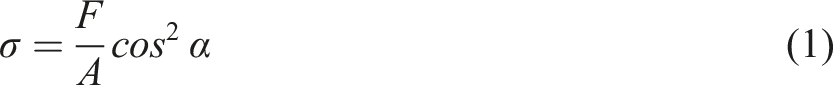
Figure 13 shows stress at break and strain at break for No weld-line, 90° weld-line, and 45° weld-line specimens for different packing pressures. The stress at break values follows a similar trend as the tensile modulus. However, the stress the at the break for the 45° weld line specimen is found to be higher as compared to the 90° weld-line specimen at all packing pressures except the minimum one (case-a). This may be because of the distribution of normal stress and shear stress on the weld-line plane.10,15 The influence of weld-line angle can be also explained with help of equations (1) and (2).
10

For No weld-line specimens, stress at break values increases with an increase in packing pressure. For packing pressure equal to 60% of filling pressure(case-a) the stress at the break for 90° and 45° weld-line specimens is about 42% and 30% respectively compared with No weld-line specimens for respective packing pressures. However, the stress at break values is found to be increasing till the packing pressure is equal to the filling pressure (case-c) and it is 54% and 61% for 90° and 45° weld-line specimens respectively. For packing pressure equal to 80% of filling pressure (case-b) the stress at break is observed 51% and 54% at 90° and 45° weld-line specimens respectively. For packing pressure equal to 120% filling pressure (case-d) the stress at break is reduced to 43% and 47% for 90° and 45° weld-line specimens respectively.
The strain at break for the No weld-line specimen is found to be decreasing with an increase in packing pressure. The strain at break values for 90° weld-line specimens follows a similar trend but is lower in magnitude compared with No weld-line specimens. However, for the 45° weld-line specimens, the strain at break is found to be maximum as compared to the No weld-line and 90° weld-line specimens. This is due to the shear stress component helping to the specimen to take a load for higher strain values.4,15 Scanning electron micrographs for 90° weld-line specimens clearly show accumulation of fibers near the weld-line location thus leading to rupture of fibers and lower strain values as compared to No weld-line specimen. Overall, from the experimental investigation, it is observed that stagnation weld-line and packing pressure have a significant impact on the tensile properties of the injection molded part.
Summary and conclusion
The effect of packing pressure on stagnation weld-line strength for 30% glass-reinforced polyamide-6 material has been investigated. The new methodology is adapted for the formation of stagnation weld-line with the help of a specially designed plaque tool and runner system.
Weld-line tensile modulus and stress at the break for 30% glass-reinforced polyamide-6 material increase with increasing packing pressure. The effect of packing pressure is described in terms of its influence on the amount of glass fibers at the weld-line location as evident from scanning electron micrographs. More fiber accumulation is observed near the weld-line location as compared to the specimen with No weld-line. The changes in tensile properties with regards to changes in packing pressure are also explained with the help of stress-strain graphs for both different orientation weld-line specimens. The effect of packing pressure is observed to be more prominent in weld line specimens as compared to specimens without weld-line.
This research work would be helpful to designers and process engineers in predicting weld-line strength and optimizing packing pressure so as to get better weld-line strength for glass-reinforced polyamide-6 material. Further studies can be carried out for various glass-reinforced thermoplastic materials involving all mechanical properties.